Attached files
UNITED STATES
SECURITIES AND EXCHANGE COMMISSION
Washington, D.C. 20549
FORM 10-K
(Mark One)
x | ANNUAL REPORT PURSUANT TO SECTION 13 OR 15(d) OF THE SECURITIES EXCHANGE ACT OF 1934 |
For the fiscal year ended October 31, 2015
OR
¨ | TRANSITION REPORT PURSUANT TO SECTION 13 OR 15(d) OF THE SECURITIES EXCHANGE ACT OF 1934 |
For the transition period from to
Commission file number: 000-25601

Brocade Communications Systems, Inc.
(Exact name of registrant as specified in its charter)
Delaware | 77-0409517 | |
(State or other jurisdiction of incorporation or organization) | (I.R.S. Employer Identification No.) | |
130 Holger Way, San Jose, CA | 95134-1376 | |
(Address of registrant’s principal executive offices) | (Zip code) | |
Registrant’s telephone number, including area code: (408) 333-8000
Securities registered pursuant to Section 12(b) of the Act:
Title of each class | Name of each exchange on which registered | |
Common stock, $0.001 par value | The NASDAQ Stock Market LLC | |
Securities registered pursuant to Section 12(g) of the Act: None
Indicate by check mark if the registrant is a well-known seasoned issuer, as defined in Rule 405 of the Securities Act. Yes x No ¨
Indicate by check mark if the registrant is not required to file reports pursuant to Section 13 or Section 15(d) of the Act. Yes ¨ No x
Indicate by check mark whether the registrant (1) has filed all reports required to be filed by Section 13 or 15(d) of the Securities Exchange Act of 1934 during the preceding 12 months (or for such shorter period that the registrant was required to file such reports), and (2) has been subject to such filing requirements for the past 90 days. Yes x No ¨
Indicate by check mark whether the registrant has submitted electronically and posted on its corporate website, if any, every Interactive Data File required to be submitted and posted pursuant to Rule 405 of Regulation S-T (§232.405 of this chapter) during the preceding 12 months (or for such shorter period that the registrant was required to submit and post such files). Yes x No ¨
Indicate by check mark if disclosure of delinquent filers pursuant to Item 405 of Regulation S-K (§229.405 of this chapter) is not contained herein, and will not be contained, to the best of registrant’s knowledge, in definitive proxy or information statements incorporated by reference in Part III of this Form 10-K or any amendment to this Form 10-K. x
Indicate by check mark whether the registrant is a large accelerated filer, an accelerated filer, a non-accelerated filer, or a smaller reporting company. See the definitions of “large accelerated filer,” “accelerated filer” and “smaller reporting company” in Rule 12b-2 of the Exchange Act.
Large accelerated filer ý | Accelerated filer o | Non-accelerated filer o | Smaller reporting company o | |||
(Do not check if a smaller reporting company) | ||||||
Indicate by check mark whether the registrant is a shell company (as defined in Rule 12b-2 of the Exchange Act). Yes ¨ No x
The aggregate market value of the voting and non-voting common equity held by non-affiliates of the registrant, based upon the closing price of a share of the registrant’s common stock on May 1, 2015, as reported by the NASDAQ Global Select Market on that date, was approximately $3,724,624,296. This calculation does not reflect a determination that certain persons are affiliates of the registrant for any other purpose.
The number of shares outstanding of the registrant’s common stock as of December 15, 2015, was 409,605,948 shares.
DOCUMENTS INCORPORATED BY REFERENCE
Portions of the registrant’s Proxy Statement for its 2016 Annual Meeting of Stockholders (the “Proxy Statement”), to be filed with the Securities and Exchange Commission, are incorporated by reference into Part III of this Annual Report on Form 10-K where indicated.
1
BROCADE COMMUNICATIONS SYSTEMS, INC.
FORM 10-K
For the Fiscal Year Ended October 31, 2015
INDEX
Page | ||
PART I | ||
Item 1. | ||
Item 1A. | ||
Item 1B. | ||
Item 2. | ||
Item 3. | ||
Item 4. | ||
PART II | ||
Item 5. | ||
Item 6. | ||
Item 7. | ||
Item 7A. | ||
Item 8. | ||
Item 9. | ||
Item 9A. | ||
Item 9B. | ||
PART III | ||
Item 10. | ||
Item 11. | ||
Item 12. | ||
Item 13. | ||
Item 14. | ||
PART IV | ||
Item 15. | ||
2
Forward-Looking Statements
This Annual Report on Form 10-K contains forward-looking statements regarding future events and future results. All statements other than statements of historical fact are statements that could be deemed forward-looking statements, including, but not limited to, statements regarding future revenue, margins, expenses, tax provisions, tax treatment, earnings, cash flows, benefit obligations, debt repayments, share repurchases, or other financial items; any statements of the plans, strategies, and objectives of management for future operations, including planned investments or acquisitions; any statements concerning expected development, performance, success, or market share relating to products or services; any statements regarding future economic conditions or market performance; any statements regarding pending litigation, including claims or disputes; any statements of expectation or belief; and any statements of assumptions underlying any of the foregoing. Words such as “expects,” “anticipates,” “assumes,” “targets,” “projects,” “intends,” “plans,” “believes,” “seeks,” “estimates,” “continues,” “may,” and variations of such words and similar expressions are intended to identify such forward-looking statements. These statements are based on current expectations, estimates, forecasts, and projections about the industries in which Brocade operates, and the beliefs and assumptions of management. Readers are cautioned that these forward-looking statements are only predictions and are subject to risks, uncertainties, and assumptions that are difficult to predict, including those identified below, under “Part I, Item 1A. Risk Factors” and elsewhere herein. Therefore, actual results may differ materially and adversely from those expressed in any forward-looking statements. Furthermore, Brocade undertakes no obligation to revise or update any forward-looking statements for any reason.
Additional Information
ADX, Brocade, the B-wing symbol, DCX, Fabric Vision, ICX, MLX, VCS, VDX, and Vyatta are registered trademarks of Brocade Communications Systems, Inc., in the United States and/or in other countries. Other brands, products, or service names mentioned may be trademarks of Brocade or others.
3
PART I
Item 1. | Business |
General
Brocade Communications Systems, Inc. (“Brocade” or the “Company”) is a leading supplier of networking hardware, software, and services, including Storage Area Networking (“SAN”) solutions and Internet Protocol (“IP”) Networking solutions for businesses and organizations of various types and sizes. Brocade’s end customers include global enterprises and other organizations that use the Company’s products and services as part of their communications infrastructure and service providers, such as telecommunication firms, cable operators, and mobile carriers, that use the Company’s products and services as part of their commercial operations. Brocade offers a comprehensive line of high-performance networking hardware and software products and services that enable businesses and organizations to make their data centers and networks more efficient, reliable, and adaptable to the changing demands of new network traffic patterns and volumes. Brocade’s products and services are focused on meeting the stringent requirements necessary for data center infrastructure and applications. Many of the Company’s products have been designed to enable customers to deploy next-generation data center architectures and technologies, which the networking industry refers to as the New IP, including virtualization, cloud computing, software-defined networking (“SDN”), network functions virtualization (“NFV”), and network visibility and analytics (“NVA”).
Brocade products and services are marketed, sold, and supported worldwide to end-user customers through distribution partners, including original equipment manufacturers (“OEMs”), distributors, systems integrators, and value-added resellers (“VARs”), as well as directly to end users by Brocade’s sales force.
For revenue and other information regarding Brocade’s operating segments, see Note 16, “Segment Information,” of the Notes to Consolidated Financial Statements in Part II, Item 8 of this Form 10-K, which is incorporated herein by reference.
Products and Services
Brocade is focused on helping large enterprises, data centers, and global service providers fundamentally change their businesses and make them more agile, innovative, and profitable. Brocade products enable networks to become a platform for rapid and cost-effective business innovation. Both cloud computing and a proliferation of mobile services are transforming how these customers design their networks and deliver information technology (“IT”) services to their end users. Brocade has a leadership position in delivering a variety of purpose-built innovations for this New IP era.
Mission Critical Storage Networking Solutions
Customers use Brocade’s Fibre Channel (“FC”) protocol-based networking products to build storage area networks within their data center environments. Brocade’s storage networking products and services are designed to help customers reduce the cost and complexity of managing business information within a shared data storage environment, while enabling high levels of availability of mission-critical applications. In addition, Brocade’s products and services help customers develop and deploy storage and server consolidation, disaster recovery, and data security, as well as meet compliance requirements regarding data management. Brocade’s products are generally used in conjunction with servers and storage subsystems, SAN interconnection components, and server and storage management software applications and tools. By utilizing shared storage, or networked storage solutions, organizations of all types and sizes can more easily share and consolidate server and storage resources; centralize and simplify data management; scale and provision storage resources more effectively; and improve application efficiency, performance, and availability. As a result, these organizations are able to better utilize IT assets; improve productivity of IT personnel; reduce capital and operational expenditures; and more reliably and securely store, manage, and administer information.
Brocade’s family of FC SAN backbones, directors, and fabric/embedded switches provide interconnection, bandwidth, and high-speed switching between servers and storage devices. Product models range from entry-level 8-port fixed-configuration fabric switches to 512-port modular directors in a single chassis. Switches and directors support key applications such as data backup, remote mirroring, and high-availability clustering, as well as high-volume transaction processing applications such as enterprise resource planning and data warehousing. Brocade’s storage networking products have been designed to meet the storage networking needs of data center end users in environments ranging from small- and medium-sized businesses to large enterprises with storage network fabrics that scale to thousands of ports and spread across multiple locations around the world. These products also enable storage networks to accommodate highly virtualized servers in enterprise, service provider, and cloud service provider data centers due to their high-performance, ultra-high reliability, and low-latency capabilities.
4
Brocade offers a variety of FC fabric extension, switching, and routing solutions that are designed to connect two or more data centers over long distances to enhance business continuity and disaster recovery. Brocade’s FC fabric extension solutions support both point-to-point and multi-site FC SAN environments, mainframe extension (Fibre Connectivity), and other multiprotocol switching and routing technologies, including optical, asynchronous transfer mode, and IP Networks.
Brocade offers high-speed, highly reliable extension, switching, and routing devices, in both modular and fixed form factors, that provide fabric-based encryption and compression services. Brocade works with industry-leading security vendors to offer a wide choice of enterprise-class key management system options. These solutions provide high-performance disk encryption processing to meet the needs of the most demanding enterprise environments with flexible, on-demand performance, and industry-leading encryption-based security.
Brocade delivers reliable and simplified management of these SAN products through its software-based management tools, including Brocade Fabric Vision and Analytics Monitoring Platform, a collection of technologies that maximizes uptime, dramatically simplifies SAN deployment and management, and provides high levels of visibility and insight into the storage network.
Brocade software management tools are a key element of the Company’s fifth generation (“Gen 5”) industry-standard FC products, which offer 64 gigabits per second (“Gbps”) interchassis bandwidth, 16 Gbps port level performance, and deliver higher levels of scalability and advanced capabilities in network management and diagnostics. Brocade’s Gen 5 (16 Gbps) FC portfolio builds upon its market leadership in FC storage networking solutions, which include the flagship Brocade DCX Backbone family along with a wide range of fixed configuration SAN switches. Brocade has been an industry leader in every FC technology cycle, including the evolution from 1, 2, 4, 8, and most recently, 16 Gbps technologies. Brocade is committed to deliver products and solutions based on the sixth generation (“Gen 6”) of FC technology that will offer 32 Gbps performance at the port level and 128 Gbps interchassis bandwidth.
IP Networking Products—A portfolio of related software and hardware-based data networking offerings
Brocade’s IP Networking products are designed to connect users over private and public networks, including local area, metro, and within and across global data centers. Brocade offers a variety of platforms to allow customers to design a network to meet their needs, including the Brocade ICX, VDX, and MLX product families, as well as a wide range of virtualized SDN and NFV products. Brocade’s Layer 2 and Layer 3 Ethernet switches and routers provide cost-effective delivery of the intelligence, speed, and manageability required to support virtualized and cloud-based applications.
The Brocade ICX family of IP Networking switches is designed for campus networks and small data centers and provides task automation, reduces operational costs, and enables scalable growth for new applications and services. The Brocade ICX family offers a broad spectrum of access, aggregation, and high-performance core switches to build a complete end-to-end solution for both medium and large enterprises.
Brocade’s VDX Data Center Switches are designed to simplify the physical infrastructure of the network through the deployment of “Ethernet Fabrics.” These switches and software provide high levels of network automation, scalability, performance and operational simplicity. These products provide essential building blocks to help IT organizations move to highly virtualized and cloud environments. The Brocade VDX family of switches, with Brocade Virtual Cluster Switching (“VCS”) or Brocade VCS Fabric technology, provides enterprise agility through automated, zero-touch Virtual Machine (“VM”) discovery, configuration, and mobility. Brocade offers a series of Brocade VDX fixed-port switches, as well as a modular switch that deliver scalable performance, high port density, and functionality that can be combined and configured to address each customer’s needs.
Brocade also offers a comprehensive set of IP routing products through its Brocade MLX, MLXe, CES, and CER families that are designed to handle network traffic within and across service provider networks, as well as data center and large enterprise networks. These IP routing products also provide network packet broker functionality to help service providers extract key insights from their networks, and data privacy features to help customers protect data transiting their networks.
Brocade has developed a leadership role in NFV design and engineering by focusing on an area that has become critical to telcos, mobile operators, and cloud service providers. Brocade’s vRouters provide advanced routing, firewall, and virtual private network (“VPN”) functionality, all in a virtualized form factor. The vRouter is designed for multi-tenant public or private cloud environments or for deployment as a virtual edge solution. In delivering network functionality in a software form factor, Brocade enables its customers to reduce both capital and operational expenses, as well as achieve better levels of agility and scalability to improve service delivery to the end user.
5
Brocade’s Layer 4-7 platforms, including hardware- and software-based Brocade ADX and vADC products, are designed for application traffic management and server load balancing, allowing customers to improve the performance of specific applications or improve the performance of a server farm. By combining the Brocade vADC with the Brocade vRouter family, Brocade is the only company to deliver Layer 3 through Layer 7 functionality in an integrated virtualized, software form factor. These high-performance data center traffic management systems with network intelligence capabilities allow enterprises and service providers to replace traditional hardware with more cost-effective and agile software to build reliable network infrastructures that efficiently manage the flow of traffic over extended distances, known as metro area networks and wide area networks.
The Brocade Controller provides an open platform for the scalable management of end-to-end services across a wide range of underlying physical and virtual network infrastructure, such as switches, routers, firewalls, VPNs, and load balancers. Based on the open source and industry-backed OpenDaylight Project, it provides a fully tested and commercially supported open source platform that allows users to gradually migrate workloads running on their current equipment into an SDN environment.
Global Services
Brocade offers a wide range of consulting and post-contract customer support (“PCS”) services that help customers in designing, implementing, deploying, and managing advanced networking solutions, as well as support services. Consulting services include resident service arrangements where highly trained Brocade consultants optimize customer networks and perform consolidations, migrations, and advanced implementations. In addition to PCS arrangements, Brocade offers Premier Support, a high-touch, proactive level of support focused on problem avoidance, account management, and accelerated responsiveness. These services address a number of customer priorities that must be managed during the life cycle of a storage network or data center network and are meaningful to customers because Brocade brings valuable experience and expertise in the New IP challenge. Brocade’s services may be delivered to end-user customers directly or through partners as a component of a broader service and support offering.
Industry Initiatives and Standards Development
Brocade believes that, as the need for networking solutions continues to evolve, organizations will look to further simplify the tasks of storing, managing, and administering data. At the same time, organizations will also look to optimize or improve the efficiency of their IT investments and reduce both capital and operational expenditures. In addition, Brocade believes organizations will continue to expand the size and scope of their networks, as well as the number and types of applications that these networks support.
Brocade believes that the future evolution of networking and data center markets will be led by the providers of products and services that simplify the management of increasingly virtualized server and storage environments and improve returns on end users’ IT investments. Brocade also believes that New IP networking and data center infrastructure solutions will evolve to provide increased capabilities that enable new types of data management applications that simplify the management of data, increase operational efficiencies, and reduce operating expense. As a result, many of Brocade’s initiatives and investments are aimed at creating a secure, open, and automated network that provides a platform for rapid business innovation.
Brocade works with industry-leading organizations to facilitate the development of standards, technologies, products, and services that focus on simplifying data center infrastructure management and implementing and managing data networking environments. Brocade has a partner-centric approach to building solutions and works with nearly every leading provider of server, storage, hypervisor, network security, and related management applications and technologies.
Brocade has a long history of being a major contributor to the evolution of industry standards ranging from FC communication technology to storage network interoperability and storage network management. Brocade contributes to related industry standards committees and has authored or co-authored many of the FC protocol standards used today. As Brocade continues to expand its leadership presence in new technologies, Brocade’s participation in associated standards groups continues to grow. In fiscal year 2015, Brocade was a member of the Ethernet Alliance, Metro Ethernet Forum, IETF, IEEE, FCIA Board, SNIA Technical Council, NVM Express, DMTF Technical Council, and other FC-related industry associations and standards bodies. An engineering director at Brocade currently chairs the INCITS T11 Committee, the lead governing body for all FC-related standards, and Brocade senior technologists serve as the president of the Ethernet Alliance and chair of the OpenDaylight Project. Brocade has also been an active participant with key leadership positions in next-generation data center initiatives promoting use of open technologies, including Open Networking Foundation, Next Generation Mobile Networks Alliance, OpenStack Foundation, and Open Platform for NFV.
6
Education and Technical Certification Services
Brocade’s education and training organization delivers technical education and training to partners and their customers on Brocade technology that includes design, implementation, and management solutions. This education and training curriculum is delivered worldwide using a variety of methods, including instructor-led classes, online web-based training, and “live” virtual classrooms. Brocade University also offers certification on Brocade solutions for IT professionals who have completed certain tests administered by an independent testing organization. The certification program is designed to measure the knowledge and proficiency of IT professionals in Brocade data center and data management solutions and technologies, and to help ensure that Brocade’s customers receive superior customer service and support. Approximately 51,334 certification tests have been delivered and 38,249 IT professionals have received Brocade credentials since inception of the program in October 2000. Brocade’s education and training services are made available through its own education facilities and through its worldwide training provider network.
Distribution Channels
Brocade’s products and services are marketed, sold, and supported worldwide to end-user customers through distribution partners, including OEMs, distributors, systems integrators, and VARs, as well as directly to end users by the Brocade sales force.
Brocade’s OEM partners are leading server, storage, and systems providers who offer Brocade’s products under their own private label or as Brocade-branded solutions. Sales of products through OEM partners comprise the majority of Brocade’s business. Brocade’s other distribution partners include a global network of authorized distributors, systems integrators, and VARs. Brocade authorizes these partners to market, sell, and support its products and services. Some of these partners also sell training and other value-added services.
Brocade has OEM or distribution agreements with many of the major companies that sell enterprise servers and storage systems. In addition, Brocade employs a worldwide sales force to assist its distribution partners in marketing Brocade solutions, assessing customer requirements, and designing, implementing, and maintaining Brocade-based solutions.
Customers
For the fiscal year ended October 31, 2015, Brocade’s largest OEM customers, EMC Corporation (“EMC”), International Business Machines Corporation (“IBM”), and Hewlett Packard Enterprise Company (“HPE”), each represented 10% or more of Brocade’s total net revenues, accounting for a combined total of 41% (EMC with 17%, IBM with 12%, and HPE with 12%) of Brocade’s total net revenues. For the fiscal year ended November 1, 2014, the same OEM customers accounted for a combined total of 46% (EMC with 18%, IBM with 16%, and HPE with 12%) of Brocade’s total net revenues. For the fiscal year ended October 26, 2013, the same OEM customers accounted for a combined total of 46% (EMC with 18%, IBM with 16%, and HPE with 12%) of Brocade’s total net revenues. Sales to any OEM customer may vary from quarter to quarter. While Brocade’s OEM partners are the principal route-to-market for the Company’s SAN products, Brocade’s SAN routes-to-market also include distributors, direct sales to end users, global systems integrators, and VARs.
In the IP networking market, Brocade cultivates business through its distributors in a number of key customer markets such as the data center, service provider, and enterprise segments, including the public sector. Customers in these market segments represented a significant part of Brocade’s IP Networking business. Brocade offers its IP Networking products through a multipath distribution strategy, including distributors, resellers, Brocade’s direct sales force, and OEMs that also offer Brocade SAN products. Brocade’s strategy to expand its sales of IP Networking products globally includes leveraging current investments in direct sales, two-tier distribution and channel partnerships and expanding in international markets, as well as selling into existing data center customer accounts, including Global 1000 companies and other targeted end users.
Geographic Information
For the fiscal year ended October 31, 2015, domestic and international revenues were approximately 56% and 44% of total net revenues, respectively. For the fiscal year ended November 1, 2014, domestic and international revenues were approximately 58% and 42% of total net revenues, respectively. For the fiscal year ended October 26, 2013, domestic and international revenues were approximately 61% and 39% of total net revenues, respectively. International revenues primarily consist of sales to customers in Western Europe and the greater Asia Pacific region.
7
Revenues are attributed to geographic areas based on where Brocade’s products are shipped. However, certain OEM partners take possession of Brocade’s products domestically and then may distribute these products to their international customers. Because Brocade accounts for all of those OEM revenues as domestic revenues, Brocade cannot be certain of the extent to which its domestic and international revenue mix is impacted by the logistics practices of its OEM partners, but the end-user location data that is available does indicate that international revenues may comprise a larger percentage of Brocade’s total net revenues than the attributed revenues in Part II, Item 7 of this Form 10-K indicate.
The majority of Brocade’s assets as of October 31, 2015, were attributable to its United States (“U.S.”) operations. For additional geographic information on Brocade’s revenues and long-lived assets, see Note 16, “Segment Information,” of the Notes to Consolidated Financial Statements in Part II, Item 8 of this Form 10-K, which is incorporated herein by reference. Also, for a discussion of the risks related to Brocade’s international operations, see Part I, Item 1A. Risk Factors of this Form 10-K, which is incorporated herein by reference.
Acquisitions and Investments
Brocade’s acquisition and investment strategy is focused on facilitating the evolution and expansion of shared storage, IP networking, network-based analytics, security, and data management.
On March 3, 2015, Brocade completed its acquisition of the assets of Riverbed Technology, Inc.’s SteelAppTM product line (“SteelApp”). SteelApp is a virtual application delivery controller (“vADC”) for enterprise, cloud, and e-commerce. The acquired vADC software expands Brocade’s NFV portfolio and addresses the needs of service providers and enterprise accounts.
On March 24, 2015, Brocade completed its acquisition of Connectem, a privately-held company in the long-term evolution (“LTE”) virtual evolved packet core market. The acquired virtual evolved packet core software primarily addresses emerging mobile applications and services, including advanced mobile virtual network operators and enterprise mobile services, like mobile virtual private networks.
On September 11, 2014, Brocade completed its acquisition of the assets of Vistapointe, Inc. (“Vistapointe”), an early-stage start-up focused on developing software-based, carrier-grade network visibility and analytics solutions for mobile network operators who are embracing NFV and SDN architectures. This acquisition enhances Brocade’s leadership in NFV technology, as well as gives Brocade a new market to address with visibility and analytics solutions for mobile operators.
From time to time, Brocade has made equity investments in companies that develop technology or provide services that are complementary to, or broaden the markets for, its products or services and further its business objectives.
Research and Development
The industry in which Brocade competes is impacted by rapid technological developments, evolving industry standards, changes in customer requirements, new product introductions, and consolidation. As a result, Brocade’s success depends, in part, on its ability to continue to enhance its existing solutions and to develop and introduce new solutions that improve performance, simplify management, and reduce the total cost of ownership for networking solutions. Brocade has invested significantly in research and development to enhance and extend its portfolio of software products while increasing the speed, performance, and port-density of its hardware platforms. Brocade also continues to enhance its operating system and management tools to further simplify storage management and to enable more functionality for end-user customers, OEM partners, and application partners.
Brocade’s products are designed to support current industry standards as well as emerging standards that are consistent with its corporate strategy. Brocade designs its products around a common platform architecture, which facilitates the product design and development and testing cycle, improves quality, and reduces the time to market for new products and features. Where possible, products acquired through acquisitions are mapped to Brocade’s existing design roadmaps that leverage common platform designs and know-how. Brocade intends to continue to leverage this common architecture to develop and introduce additional hardware and software products and enhancements in the future.
Brocade’s product development process includes the certification of certain products by its OEM partners, as well as additional certifications to comply with international, U.S. federal government, and local regulations. During this process, Brocade supports its OEM partners and U.S. federal customers in the testing of its new products to ensure that they meet quality, functionality, security, and interoperability requirements. The OEM partner certification process is completed once the OEM partner has certified the product and announced general availability of that product to its customers. The U.S. federal certification process is completed once the product is certified and/or added to an officially approved products list.
8
For the fiscal years ended October 31, 2015, November 1, 2014, and October 26, 2013, Brocade’s research and development expenses totaled $356.7 million, $345.5 million, and $378.5 million, respectively. All expenditures for research and development costs have been expensed as incurred.
Competition
The market for networking solutions is intensely competitive. Brocade believes the competitive factors in this market include product performance and features, product reliability, price, size, power consumption, extent of installed base, ability to meet delivery schedules, customer service, technical support, and distribution channels. In particular, Cisco Systems, Inc. (“Cisco”) holds a large market share in the IP networking market, and a number of its products compete directly with Brocade’s products. Brocade also competes with other IP networking companies, such as Alcatel-Lucent, Arista Networks, Inc., Avaya Inc., Dell Inc., Extreme Networks, Inc., F5 Networks, Inc. (“F5 Networks”), HPE, Huawei Technologies Co. Ltd., Juniper Networks, Inc., and Lenovo Group Limited. Many of Brocade’s current and potential competitors have longer operating histories; greater financial, technical, sales, marketing, and other resources; more name recognition; and larger customer installed bases than Brocade.
Despite Brocade’s strong market position, the Company faces significant competition in the market for SAN products and services from Cisco and QLogic Corporation. Brocade also faces competitors in other markets in which it participates, such as A10 Networks, Inc., Citrix Systems, Inc., and F5 Networks in the application delivery market. New competition is emerging as a result of technology developments such as SDN and NFV. These existing and new competitors may use emerging technologies and various routes-to-market to compete with Brocade. In addition, Brocade’s OEM partners and manufacturing partners, who also have relationships with some of Brocade’s current competitors, could become new competitors by developing, acquiring, or introducing products and solutions that compete with Brocade’s product offerings. Competitive pressure will also likely intensify as new technology and industry consolidation impact long-standing alliances, partnerships, and go-to-market routes.
As the networking solutions market evolves, additional technologies may become available for interconnecting servers and storage. To the extent that products based upon these new technologies provide the ability to connect network servers and storage and support high-performance storage applications, they may compete with Brocade’s FC products. These storage networking technologies include, but are not limited to, IP storage products such as Internet Small Computer System Interface (“iSCSI”), Network Attached Storage (“NAS”), InfiniBand, and Direct Attached Storage. In addition, networking companies, manufacturers of networking equipment, and other companies may develop competitive products and technologies. For example, new technologies that store data in the server with flash memory or solid-state drives (“SSD”) could create competition for Brocade’s FC SAN products. Nutanix, Inc., Pure Storage, Inc., and Violin Memory, Inc. are examples of vendors that offer solutions based on these new flash memory-based technologies. These emerging competitive technologies, however, can present new business opportunities for Brocade’s networking and storage products and services. Brocade is working actively with IP storage and SSD vendors to create solutions and reference architectures that integrate Brocade IP and FC SAN products.
Manufacturing
Brocade has manufacturing arrangements with Hon Hai Precision Industry Co., Ltd. (“Foxconn”) and Accton Technology Corporation (“Accton”) (collectively, the contract manufacturers or “CMs”) and a service repair arrangement with Flextronics International Ltd. (“Flextronics”). Under Brocade’s manufacturing arrangements with its CMs, Brocade provides product forecasts and places purchase orders in advance of the scheduled delivery of products to Brocade’s customers. The required lead time for placing orders with the CMs depends on the specific product. The CMs invoice Brocade based on prices and payment terms mutually agreed upon and set forth in purchase orders issued to them by Brocade. Although the purchase orders Brocade places with its CMs are cancellable, the terms of the agreements require Brocade to purchase all inventory components not returnable, usable by, or sold to other customers of the CMs. In addition, Brocade has an arrangement with one of its CMs regarding factory capacity that can be used by Brocade. Under this arrangement, Brocade receives a credit for exceeding the planned utilization of factory capacity and, conversely, is required to pay additional fees for not utilizing the planned capacity.
Brocade uses the CMs for final turnkey product assembly; however, Brocade also maintains key component selection and qualification expertise internally. Brocade designs and develops the key components of its products, including application-specific integrated circuits (“ASICs”), operating system and other software, as well as certain details in the fabrication of enclosures for its products. In addition, Brocade determines the components that are incorporated into its products and selects appropriate suppliers of those components.
9
Although Brocade uses standard parts and components for its products where possible, Brocade’s CMs currently purchase, on Brocade’s behalf, several components used in the manufacture of its products from single or limited sources. Brocade’s principal single-source components include ASICs, built by third parties based on Brocade’s designs, and Brocade’s limited source components include certain memory, oscillators, microprocessors, connectors, logic chips, power supplies, enclosures, programmable logic devices, printed circuit boards, optical components, packet processors, and switching fabrics.
Section 1502 of the Dodd-Frank Wall Street Reform and Consumer Protection Act requires certain public companies to disclose whether certain minerals, commonly known as “conflict minerals,” are necessary to the functionality or production of a product manufactured by those companies and if those minerals originated in the Democratic Republic of the Congo (DRC) or an adjoining country. The ongoing implementation of these disclosure requirements by Brocade, Brocade’s partners, and/or customers could adversely affect (i) Brocade’s revenues, if its partners or customers are dissatisfied with Brocade’s use or efforts to reduce the use of conflict minerals, and (ii) the sourcing, availability, and pricing of minerals used in the manufacture of certain components used in Brocade’s products.
In addition, Brocade licenses certain software from third parties that is incorporated into its fabric operating system and other software. See Part I, Item 1A. Risk Factors of this Form 10-K, which is incorporated herein by reference.
Environmental Matters
Brocade is subject to various environmental and other regulations governing product safety, materials usage, packaging, and other environmental impacts in the various countries where Brocade products are sold. For example, many Brocade products are subject to laws and regulations that restrict the use of certain substances such as lead, mercury, hexavalent chromium, and cadmium, and that require Brocade to assume responsibility for collecting, treating, recycling, and disposing of products when they have reached the end of their useful life. In Europe, environmental restrictions apply to products sold in that region, and certain Brocade partners require compliance with these or other more stringent requirements. In addition, recycling, labeling, and related requirements apply to Brocade products sold in Europe and China. Brocade may be required to redesign its products to ensure that they comply with any new requirements as well as related requirements imposed by its OEM customers. Brocade also continues to work with its suppliers to ensure they provide Brocade with compliant materials, parts, and components. Various other jurisdictions have issued, or are in the process of issuing, other environmental regulations that may impose additional restrictions or obligations and require further changes to Brocade’s products, and that may require Brocade to incur additional costs in order to comply with such restrictions or obligations.
Patents, Intellectual Property, and Licensing
Brocade relies on a combination of patent, copyright, trademark, and trade secret laws, and contractual restrictions on disclosure to protect its intellectual property rights.
Brocade maintains a program to identify and obtain patent protection for its selected inventions. As of October 31, 2015, Brocade had 620 patents in the United States and 28 patents in various foreign countries (based on certain U.S. patents or patent applications) that are currently in force, and had approximately 291 patent applications pending in the United States and approximately 71 patent applications pending in various foreign countries (based on certain U.S. patents or patent applications). The normal expiration dates of Brocade’s issued patents in the United States range from 2015 to approximately 2031. Although Brocade has patent applications pending, there can be no assurance that patents will be issued from pending applications or that claims allowed on any future patents will be sufficiently broad to protect its technology. Despite these precautions, the measures Brocade undertakes may not prevent misappropriation or infringement of its proprietary technology. These measures also may not preclude competitors from independently developing products with functionality or features similar to Brocade’s products.
Many of Brocade’s products are designed to include software or other intellectual property licensed from third parties. Accordingly, it may be necessary in the future to seek or renew licenses relating to various aspects of its products. While Brocade generally believes that such licenses could be obtained on commercially reasonable terms, it is possible that Brocade may not be able to obtain such licenses on commercially reasonable terms.
From time to time, third parties have asserted patent, copyright, and trade secret rights to technologies and standards that are important to Brocade. Third parties have asserted in the past, and may assert in the future, patent infringement claims against Brocade from time to time. In addition, from time to time, Brocade receives notification from customers claiming that they are entitled to indemnification or other obligations from Brocade related to infringement claims made against them by third parties. Litigation, even if Brocade is ultimately successful, can be costly and divert management’s attention away from the day-to-day operations of Brocade. See Note 9, “Commitments and Contingencies,” of the Notes to Consolidated Financial Statements in Part II, Item 8 of this Form 10-K and Part I, Item 1A. Risk Factors of this Form 10-K.
10
Seasonality
Historically, Brocade’s SAN product revenue in the first and fourth fiscal quarters is stronger than revenue in the second and third fiscal quarters. Historically, Brocade’s IP Networking product revenue is strongest in the third and fourth fiscal quarters while revenue in the first fiscal quarter is weakest, driven primarily by the seasonality of Brocade’s U.S. federal business revenue.
The historical seasonal patterns may materially differ in any given year due to factors such as quarterly changes in SAN inventory levels at OEMs, higher or lower demand for products and services due to new product releases, macroeconomic impacts, and U.S. federal government budget changes, as well as other factors, including Brocade’s fiscal reporting calendar that contains 52 or 53 weeks.
Backlog
Brocade’s business is characterized by short lead-time orders and fast delivery schedules. Sales of its products are generally made pursuant to contracts and purchase orders that are cancellable without significant penalties. These commitments are subject to price negotiations and to changes in quantities of products and delivery schedules that reflect changes in customers’ requirements and product availability. In addition, actual shipments depend on the manufacturing capacity of Brocade’s suppliers and the availability of products from such suppliers. As a result of the foregoing factors, Brocade does not believe that backlog at any given time is a meaningful indicator of its ability to achieve any particular level of overall revenue or financial performance.
Employees
As of October 31, 2015, Brocade had 4,640 employees. Brocade has not experienced any work stoppages and considers its relations with its employees to be good. Brocade’s employees are currently located at the U.S. headquarters in San Jose, California, as well as at facilities in Colorado; Virginia; Minnesota; India; Singapore; Switzerland; and other offices worldwide.
Other
Brocade was incorporated in California on August 24, 1995, and reincorporated in Delaware on May 14, 1999. Brocade’s mailing address and executive offices are located at 130 Holger Way, San Jose, California 95134-1376. Brocade’s telephone number is (408) 333-8000.
Brocade’s corporate website is www.brocade.com. Brocade’s Annual Report on Form 10-K, Quarterly Reports on Form 10-Q, Current Reports on Form 8-K, and amendments to those reports filed or furnished pursuant to Section 13(a) or 15(d) of the Securities Exchange Act of 1934, as amended, are available free of charge on Brocade’s website when such reports are available on the SEC website. The public may read and copy any materials filed by Brocade with the SEC at the SEC’s Public Reference Room at 100 F Street, NE, Washington, D.C. 20549. The public may obtain information on the operation of the Public Reference Room by calling the SEC at 1-800-SEC-0330. The SEC maintains a website at www.sec.gov, that contains reports, proxy and information statements, and other information regarding issuers that file electronically with the SEC. The content of any website referred to in this Form 10-K is not incorporated by reference into this filing. Further, Brocade’s references to the Uniform Resource Locators (“URLs”) for these websites are intended to be inactive textual references only.
11
Item 1A. | Risk Factors |
Failure to successfully compete in the networking market could prevent Brocade from increasing or maintaining revenue, profitability, and cash flows with respect to its networking solutions.
The networking market, particularly the data center market, is highly competitive and is undergoing significant transitions due to the adoption of new technologies, such as cloud computing, virtualization, software networking, and infrastructure-as-a-service. For example, both Cisco Systems, Inc. (“Cisco”) and Hewlett Packard Enterprise Company (“HPE”) recently began to offer cloud computing services for the enterprise market, which some customers may choose as an alternative means to procure networking as a service rather than by traditional purchasing methods. Cisco and Microsoft Corporation have also collaborated on data center and cloud computing initiatives involving sales, marketing, and research and development (“R&D”). Additionally, Dell Inc. (“Dell”) recently announced an agreement to acquire EMC Corporation (“EMC”), and if that acquisition is completed, the resulting company’s technology may compete directly with some of Brocade’s solutions. Also, Juniper Networks, Inc. (“Juniper”) and HPE have launched new offerings, including “whitebox” switches, which those companies have promoted as a low-cost option for networking equipment purchasers. Further commoditization of networking products could negatively impact Brocade’s business and financial results.
Other shifts in the networking market are also creating competitive challenges for Brocade. For example, data center buying patterns are shifting to converged infrastructures in which computer, network, and storage systems are sold as bundled solutions. If Brocade is unsuccessful in having its products included in those bundled solutions, Brocade’s market share could be adversely affected. In addition, some new storage technologies, such as solid-state drives and hyper-converged network solutions that use software-defined storage, reduce the overall port demand for networking products. Also, the market for campus networking products is increasingly based on the use of wireless campus technologies, which are not included in Brocade’s product portfolio. The success of Brocade’s wireline campus business is due in part to the partnering relationships it has developed with wireless campus vendors. Those partnering relationships have been adversely affected, and may continue to be adversely affected, by the fact that some of those vendors compete with Brocade in other market segments, some of those vendors have been acquired, or may in the future be acquired, by other companies with their own wireline products, and some of those vendors have limited market share and/or relationships with many other providers of wireline campus products.
Cisco maintains a dominant position in the networking market; however, customers also have many choices in both traditional and emerging networking technology and networking providers. These other competitors in the networking market include A10 Networks, Inc.; Alcatel-Lucent; Arista Networks, Inc.; Avaya Inc.; Extreme Networks, Inc.; F5 Networks, Inc.; Huawei Technologies Co. Ltd.; Juniper; and QLogic Corporation (“QLogic”). Many of Brocade’s competitors have longer operating histories; greater financial, technical, sales, marketing, and other resources; more name recognition; and larger customer installed bases than Brocade. These companies’ businesses may have better economies of scale, and therefore these companies could also adopt more aggressive pricing policies than Brocade. Some of these companies’ brands are better known by end users than Brocade’s brand, and channel partners often prefer to direct well-known brands to end user accounts. In addition, these companies have in the past, and could in the future, enhance their business models through divestitures and acquisitions, which could impact Brocade’s partner ecosystem and Brocade’s go-to-market model. Also, any one of these competitors could devote more resources to develop, promote, and sell their products, and, therefore, could respond more quickly to changes in customer or market requirements and adopt more aggressive pricing policies. Brocade’s failure to successfully compete in the networking market would harm its business and financial results.
Brocade’s failure to execute on its overall sales strategy or successfully leverage its channel and direct sales capabilities could significantly reduce its revenues and negatively affect its business, financial results, and growth prospects.
Brocade offers networking solutions through a multipath distribution strategy, including distributors, resellers, a direct sales force, and original equipment manufacturers (“OEMs”). However, Brocade’s efforts to increase sales through this multipath distribution strategy may not generate incremental revenue opportunities. Several of Brocade’s major OEM customers, including Dell, International Business Machines Corporation (“IBM”), HPE, and Oracle Corporation, have acquired companies that offer Internet Protocol (“IP”) Networking solutions that are competitive with Brocade offerings. A loss of, or significant reduction in, revenue through one of Brocade’s paths to market would negatively impact its business and financial results.
As the networking industry continues to evolve, partners with which Brocade does not have long-standing relationships, such as cloud service providers that provide routing and infrastructure-as-a-service and global systems integrators that provide complete solutions to end users interested in upgrading to more modern architectures, may become increasingly important. In addition, as more enterprises purchase infrastructure-as-a-service offerings from hyperscale cloud providers and large service providers, sales through some of Brocade’s existing paths to market could decline. If Brocade fails to build or grow successful relationships with these partners and service providers, Brocade’s business and financial results could be adversely affected.
12
Brocade’s failure to successfully develop new and/or maintain its current channel partner relationships, or the failure of these partners to sell Brocade’s products, could reduce Brocade’s growth prospects significantly. In addition, Brocade’s ability to respond to the needs of its distribution and reseller partners in the future may also depend on third parties producing complementary products and applications for Brocade products to enable these partners to be competitive in the market. In addition, Brocade may not successfully achieve its expanded go-to-market objectives, which include effectively maintaining or expanding sales through its distribution channels and successfully managing distribution and reseller partner relationships. If Brocade fails to respond successfully to the needs of these distribution and reseller partners and their customers, Brocade’s business and financial results could be adversely affected.
In fiscal years 2013 and 2014, Brocade made certain changes in its strategic direction and sales strategy by focusing on key technology segments for the data center, such as its Storage Area Networking (“SAN”) fabrics, Ethernet fabrics, and software networking solutions, and targeting larger IP customers with its direct sales force. This change in focus has resulted in a rebalancing of resources away from certain non-key areas of Brocade’s business, including changes to the related sales model and divestitures of certain assets, and has impacted, and may continue to impact, Brocade’s ability to generate revenue from certain products, markets, geographies, and customers. In addition, the targeting of larger IP customers may cause Brocade’s revenue to be more uneven in the future as timing and magnitude of individual customer orders may be difficult to predict.
In the second quarter of fiscal year 2014, Brocade made a strategic decision to reduce its investment in the hardware-based application delivery controller product line and to increase investment in the software-based application delivery controller product line. As a result of this change in strategy, hardware-based Brocade ADX and related support revenue decreased by approximately $20 million in fiscal year 2014 compared with fiscal year 2013. Hardware-based Brocade ADX and related support revenue further declined by approximately $2 million in fiscal year 2015 compared with fiscal year 2014. There can be no assurance that this new strategic direction and sales strategy will succeed in the long term, or that the return on Brocade’s investments will continue to develop in the manner and on the timeline expected. Failure to execute on Brocade’s strategy could adversely affect its business and financial results.
A limited number of major OEM partners comprise a significant portion of Brocade’s revenues; the loss of revenue from, or decreased inventory levels held by, any of these major OEM partners could significantly reduce Brocade’s revenues and adversely affect its financial results.
Brocade’s SAN business depends on recurring purchases from a limited number of large OEM partners for a substantial portion of its revenues, specifically EMC, HPE, and IBM. As a result, revenues from these large OEM partners have a significant impact on Brocade’s quarterly and annual financial results. For fiscal years 2015, 2014, and 2013, these three OEM partners each represented 10% or more of Brocade’s total net revenues, for a combined total of 41%, 46%, and 46% of total net revenues, respectively. Brocade’s agreements with its OEM partners are typically cancellable, nonexclusive, and have no minimum or specific timing requirements for purchases. Brocade’s OEM partners could increase the amount purchased from Brocade’s competitors, introduce their own technology, or experience lower demand for Brocade SAN products from their end customers. The SAN market contracted in 2015, and if the SAN market continues to contract, Brocade’s OEM partners could reduce the amount of SAN products they purchase from Brocade.
Also, one or more of Brocade’s OEM partners could elect to divest certain lines of business, split their business, or consolidate or enter into a strategic partnership with one of Brocade’s competitors, such as IBM’s sale of certain lines of business to Lenovo Group Limited, HPE’s recently completed separation into two public companies, or Dell’s announced agreement to acquire EMC, which could reduce or eliminate Brocade’s future revenue opportunities with that OEM partner. In addition, business execution or other operating performance issues experienced by our OEM partners may adversely affect Brocade’s revenue and financial results. Brocade anticipates that a significant portion of its revenues and operating results from its SAN business will continue to depend on sales to a relatively small number of OEM partners. Brocade’s business and financial results could be harmed by the loss of any one significant OEM partner, a decrease in the level of sales to any one such partner, a change in any one such partner’s go-to-market strategy, or an unsuccessful negotiation on key terms, conditions, or timing of purchase orders placed during a quarter.
13
Uncertainty about or a slowdown in the domestic and international economies has adversely affected, and may increasingly adversely affect, Brocade’s operating results and financial condition.
In recent years, there have been various slowdowns in, and uncertainty about, the domestic and international economies, including slowing economic growth in China. Such uncertainty and slowdowns have resulted in, and may again result in, lower growth of information technology (“IT”)-related spending, and, consequently, lead to lower growth or a decline in the networking market (including high-performance data networking solutions). Historically, IT spending has declined as general economic and market conditions have worsened due to geopolitical uncertainty. In addition, IT spending by international customers may decline as the value of the local currencies weaken against the U.S. dollar. Brocade is particularly susceptible to reductions in IT spending because the purchase of networking solutions is often discretionary and may involve a significant commitment of capital and other resources. The loss or delay of orders from any of Brocade’s more significant customers, such as individual branches or agencies within the U.S. federal government (including the Department of Defense or certain intelligence agencies where Brocade’s revenue is concentrated), or customers within the service provider, financial services, education (including the U.S. federal government program commonly known as the E-Rate program), and health sectors, could also cause Brocade’s revenue and profitability to suffer. For example, Brocade’s revenue and operating results could be negatively impacted if the U.S. federal government experiences delays in procurement due to longer decision-making time frames and/or a shift in IT procurement priorities. Economic uncertainty has caused—and may cause further—reductions in Brocade’s revenue, profitability, and cash flows, along with increased price competition, increased operating costs, and longer fulfillment cycles. Moreover, economic uncertainty may exacerbate many other risks noted elsewhere in this Form 10-K, which could adversely affect Brocade’s business operations and financial condition.
The prices of Brocade’s products have declined in the past and Brocade expects the prices of its products to decline in the future, which could reduce Brocade’s revenues, gross margins, and profitability.
The average selling price for Brocade products has typically declined in the past and will likely decline in the future as a result of competitive pricing pressures, broader macroeconomic factors, product mix, new product introductions by Brocade or competitors, the entrance of new competitors, and other factors. In particular, if economic conditions deteriorate and create a more cautious capital spending environment in the IT sector, Brocade and its competitors could pursue more aggressive pricing strategies in an effort to maintain or increase revenues. If Brocade is unable to offset a decline in the average selling price of Brocade products by increasing the volume of products shipped and/or reducing product manufacturing costs, including key components such as optics, Brocade’s revenues, gross margins, and profitability could be adversely affected.
Brocade’s future revenue growth depends on its ability to successfully introduce and achieve market acceptance of new products, services, and support offerings on a timely basis.
Developing new products, services (including software networking), and support offerings requires significant up-front investments that may not result in revenues for an extended period of time, if at all. Brocade must achieve market acceptance of its new product and support offerings on a timely basis in order to realize the benefits of its investments. However, the market for networking solutions, driven in part by the growth and evolution of the Internet and adoption of new technologies such as software-defined networking (“SDN”) and network functions virtualization (“NFV”), is characterized by rapidly changing technology, accelerated product introduction cycles, changes in customer requirements, and evolving industry standards. In addition, many of Brocade’s new products, services, and support offerings will be directed towards customers, including hyperscale cloud providers and large service providers, with which Brocade does not have strong existing sales relationships. Sales to these customers can be challenging because sales are often based on long-term relationships and network incumbency and the complex system environments maintained by these customers often require interoperation with a variety of other vendors and back office applications. Brocade’s future success depends largely upon its ability to address the rapidly changing needs of both new and existing customers by: allowing connectivity to other devices and partnering effectively; keeping pace with technological developments and emerging industry standards; and delivering high-quality, reliable, and cost-effective products, product enhancements, and services and support offerings on a timely basis.
Other factors that may affect Brocade’s successful introduction of new products, services, and support offerings include, but are not limited to, Brocade’s ability to:
• | Properly determine the market for new products, services, and support offerings, including features, cost-effectiveness, scalability, and pricing—all of which can be particularly challenging for initial product offerings in new markets; |
• | Differentiate Brocade’s new products, services, and support offerings from its competitors’ offerings; |
14
• | Address the interoperability complexities of Brocade’s products with its OEM partners’ server and storage products and Brocade’s competitors’ products; |
• | Determine which route(s) to market will be effective; and |
• | Manage product transitions, including forecasting demand, managing excess and obsolete inventories, addressing product cost structures, and managing different sales and support requirements. |
Failure to successfully introduce competitive products, services, and support offerings on a timely basis may harm Brocade’s business and adversely affect Brocade’s financial results.
If Brocade is unable to successfully transition from older products and corresponding support and service offerings to new products and corresponding support and service offerings on a timely basis, its business and financial results could be harmed.
As Brocade introduces new or enhanced products, it must successfully manage the transition from older products, such as certain SAN products, to minimize disruption in customers’ ordering patterns, avoid excessive levels of older product inventories, maintain existing support revenue streams, and provide sufficient supplies of new products to meet customer demands. The introduction of new or enhanced products may shorten the life cycle of Brocade’s existing products or replace the sales of some of Brocade’s current products, thereby offsetting the benefit of a successful product introduction. When Brocade introduces new or enhanced products, it faces numerous risks related to product transitions, including the inability to accurately forecast demand, manage excess and obsolete inventories, address new or higher product cost structures, and manage different sales and support requirements due to the type or complexity of the new or enhanced products. In addition, any customer uncertainty regarding the timeline for rolling out new products, or Brocade’s plans for future support of existing products, may cause customers to delay purchase decisions or to purchase competing products, which would adversely affect Brocade’s business and financial results.
Brocade may not realize the anticipated benefits of past or future acquisitions, divestitures, and strategic investments, and the integration of acquired companies or technologies or divestiture of businesses may negatively impact Brocade’s business and financial results.
Brocade has acquired—or made strategic investments in—other companies, products, or technologies, and Brocade expects to make additional acquisitions and strategic investments in the future. In the second quarter of fiscal year 2015, Brocade acquired Connectem Inc. and Riverbed Technology, Inc.’s SteelAppTM product line and related assets. In the fourth quarter of fiscal year 2014, Brocade acquired the Vistapointe business. The ability of Brocade to realize the anticipated benefits of its acquisitions and strategic investments involves numerous risks, including, but not limited to, the following:
• | Difficulties in successfully integrating the acquired businesses and realizing any expected synergies; |
• | Failure to communicate to customers the capabilities of the combined company; |
• | Unanticipated costs, litigation, and other contingent liabilities, including liabilities associated with acquired intellectual property; |
• | Diversion of management’s attention from Brocade’s daily operations and business; |
• | Adverse effects on existing business relationships with suppliers and customers, including delays or cancellations of customer purchases, as well as revenue attrition in excess of anticipated levels if existing customers alter or reduce their historical buying patterns; |
• | Risks associated with entering into markets in which Brocade has limited or no prior experience, including potentially less visibility into demand; |
• | Inability to attract and retain key employees; |
• | Inability to successfully develop new products and services on a timely basis to address the market opportunities of the combined company; |
• | Inability to compete effectively against companies already serving the broader market opportunities expected to be available to the combined company; |
• | Inability to qualify the combined company’s products with OEM partners on a timely basis, or at all; |
15
• | Inability to successfully integrate financial reporting and IT systems; |
• | Inability to develop software-oriented back office systems and processes necessary to sell and support a variety of software-based offerings; |
• | Failure to successfully manage additional business locations, including the infrastructure and resources necessary to support and integrate such locations; |
• | Assumption or incurrence of debt and contingent liabilities and related obligations to service such liabilities and potential limitations on Brocade’s operations in order to satisfy financial and other negative operating covenants; |
• | Additional costs, such as increased costs of manufacturing and service; costs associated with excess or obsolete inventory; costs of employee redeployment, relocation, and retention, including salary increases or bonuses; accelerated amortization of deferred equity compensation, severance payments, reorganization, or closure of facilities; taxes; advisor and professional fees; and termination of contracts that provide redundant or conflicting services; |
• | Incurrence of acquisition- and integration-related costs, goodwill or in-process research and development impairment charges, or amortization costs for acquired intangible assets, that could negatively impact Brocade’s operating results and financial condition; and |
• | The target market for the acquired products may not develop within the expected time frame or may evolve in a different technical direction. |
Brocade may also divest certain businesses or product lines from time to time. For example, Brocade sold its network adapter business to QLogic during the first quarter of fiscal year 2014. Such divestitures involve risks, such as difficulty separating out portions of or entire businesses, distracting employees, incurring potential loss of revenue, negatively impacting margins, and potentially disrupting customer relationships. Brocade may also incur significant costs associated with exit or disposal activities, related impairment charges, or both.
Cyberattacks and data security breaches could disrupt Brocade’s operations, negatively impact Brocade’s reputation, and erode customers’ trust.
Cyberattacks and other malicious attacks could lead to data breaches, computer break-ins, malware, viruses, and unauthorized tampering with Brocade’s computer systems, intellectual property, and confidential information of Brocade, its customers, and partners. These attacks could disrupt Brocade’s operations, negatively impact Brocade’s reputation, and erode customers’ trust. Brocade may not successfully limit attacks by malicious third parties if they attempt to undermine or disrupt Brocade’s cybersecurity, despite implementation of cybersecurity measures. Additionally, Brocade may suffer reputational harm as a result of a data security breach involving customers’ or employees’ information, either or both of which could negatively impact profitability and/or increase expenses. Customers have become increasingly sensitive to government-sponsored surveillance and may believe that, as a U.S.-based manufacturer, Brocade’s equipment contains “backdoor” code that would allow customer data to be compromised by either governmental bodies or other third parties. As a result, customers may choose not to deploy Brocade networking products, which could negatively impact Brocade’s business and financial results.
Brocade has a substantial amount of acquired intangible assets, goodwill, and deferred tax assets on its balance sheet, and if Brocade is required to record impairment charges for these assets, such impairment charges could adversely affect Brocade’s financial results.
Brocade has a substantial amount of acquired intangible assets, goodwill, and deferred tax assets on its balance sheet related to Brocade’s prior acquisitions. Brocade’s determination of the fair value of its long-lived assets relies on management’s assumptions of future revenues, operating costs, and other relevant factors. Brocade’s estimates with respect to the useful life or ultimate recoverability of Brocade’s carrying basis of assets, including acquired intangible assets, could change as a result of changes in management’s assumptions. If management’s estimates of future operating results change or if there are changes to other assumptions, such as the discount rate applied to future cash flows, then the estimated fair value of Brocade’s reporting units could change significantly, which could result in goodwill impairment charges. For example, based on the decrease in the hardware-based Brocade ADX revenue forecast, Brocade recognized an $83.4 million goodwill impairment charge during the second quarter of fiscal year 2014. For a sensitivity analysis that quantifies the impact of key assumptions used by Brocade on certain reporting units’ fair value estimates, see “Management’s Discussion and Analysis of Financial Condition and Results of Operations—Critical Accounting Estimates” in Part II, Item 7 of this Form 10-K. If future impairment tests should result in a charge to earnings, Brocade’s financial results would be adversely affected.
16
Brocade has determined that, more likely than not, it will realize its deferred tax assets based on positive evidence of its historical operations and projections of future income, except for the deferred tax assets related to California and remaining capital loss carryforwards for which a valuation allowance has been applied. In the event that future income by jurisdiction is less than what is currently projected, Brocade may be required to apply a valuation allowance to these deferred tax assets in jurisdictions where realization of such assets is no longer more likely than not, which could result in a charge to earnings that would adversely affect Brocade’s financial results.
If Brocade loses key employees or is unable to hire additional qualified employees, its business may be negatively impacted.
Brocade’s success depends, to a significant degree, upon the continued contributions of its employees, including executive officers, engineering, sales, and others, many of whom would be difficult to replace. Departures, appointments, and changes in roles and responsibilities of officers or other key members of management may disrupt Brocade’s business and adversely affect Brocade’s operating results.
Brocade believes its future success depends, in large part, upon its ability to attract highly skilled employees and operate effectively in geographically diverse locations. Brocade has relied on equity awards in the form of stock options and restricted stock units as one means for recruiting and retaining highly skilled employees. The number of shares available for issuance under Brocade’s 2009 Stock Plan is limited, and any increase in the number of shares available under that plan must be approved by Brocade’s stockholders. The extent to which Brocade is able to obtain such stockholder approval depends on a variety of factors, including assessments by stockholders and proxy advisory firms of Brocade’s historical equity award granting practices. The effectiveness of these equity awards in recruiting and retaining employees could be reduced if Brocade has to reduce the size of the equity awards granted to its employees or if there is a sustained decline in the trading price of Brocade’s shares. There is also limited qualified employees in each of Brocade’s markets, and competition for such employees is very aggressive. In particular, Brocade operates in various locations with highly competitive labor markets, including Bangalore, India, and San Jose, California. Brocade may experience difficulty in hiring key management and qualified employees with skills in nearly all areas of Brocade’s business and operations.
The loss of the services of any of Brocade’s key employees, the inability to attract or retain qualified employees in the future, or delays in hiring required employees—particularly sales and engineering employees—could delay the development and introduction of Brocade’s products or services and/or negatively affect its ability to sell products or services.
Failure to accurately forecast demand for Brocade’s products, or failure to successfully manage the production of its products, could increase Brocade’s product cost and adversely affect its margins and profitability.
Brocade provides product forecasts to its contract manufacturers (“CMs”) and places purchase orders with them in advance of the scheduled delivery of products to Brocade’s customers. In preparing sales and demand forecasts, Brocade relies largely on input from its sales force, partners, resellers, and end-user customers. If Brocade is unable to accurately forecast demand, or if Brocade fails to effectively communicate with its distribution partners about end-user demand or other time-sensitive information, Brocade’s ability to successfully manage production could be negatively impacted. Brocade’s ability to accurately forecast demand also may become increasingly limited as Brocade introduces new or enhanced products, begins phasing out certain products, or acquires other companies or businesses. If these forecasts are inaccurate, Brocade may be unable to obtain adequate manufacturing capacity from its CMs to meet customers’ delivery requirements, or Brocade may accumulate excess inventories or incur costs associated with excess manufacturing capacity. If excess inventories accumulate, Brocade’s gross margins may be negatively impacted by write-downs for excess and/or obsolete inventory. In addition, Brocade will experience higher fixed costs as it expands its CMs’ capabilities for forecasted demand, which could negatively affect Brocade’s margins if demand decreases suddenly and Brocade is unable to reduce these fixed costs.
Additionally, most of Brocade’s manufacturing overhead and expenses are fixed in the short term or incurred in advance of receipt of corresponding revenue, and Brocade may not be able to reduce such expenses sufficiently to offset declining product prices. As a result, Brocade’s gross margins may be adversely affected by fluctuations in manufacturing volumes, component costs, foreign currency exchange rates, the mix of product configurations sold, and the mix of distribution channels through which its products are sold. Brocade’s gross margins may also be adversely affected if product or related warranty costs associated with Brocade’s products are greater than previously experienced.
17
Brocade has extensive international operations, which expose its business and operations to additional risks.
Brocade has significant international operations, and a significant portion of Brocade’s sales occur in international jurisdictions. In addition, Brocade’s CMs have significant operations in China and other locations outside the U.S. Brocade’s international sales of its IP Networking solutions have primarily depended on its distributors and resellers. Maintenance or expansion of international sales or international operations involves inherent risks that Brocade may not be able to control, including, but not limited to, the following:
• | Difficulty in conducting due diligence with respect to business partners in certain emerging markets; |
• | Exposure to economic instability or fluctuations in international markets, such as China, that could cause reductions in IT spending; |
• | Exposure to inflationary risks and/or wage inflation in certain countries, such as India; |
• | Increased exposure to foreign currency exchange rate fluctuations, including currencies such as the British pound, the euro, the Indian rupee, the Chinese yuan, the Japanese yen, the Singapore dollar, and the Swiss franc; |
• | Exposure to sovereign debt risk and political and economic instability in certain regions of Europe, including Russia, and certain emerging countries, including China and Brazil; |
• | Multiple potentially conflicting and changing governmental laws, regulations, and practices, including differing environmental, data privacy, export, import, trade, manufacturing, tax, labor, and employment laws; |
• | Compliance with U.S. and other applicable government regulation of exports and imports, and associated licensing requirements, particularly in the area of encryption technology; |
• | Compliance with U.S. and other applicable government regulations prohibiting certain end-uses and restricting trade with embargoed or sanctioned countries, such as Russia, and with denied parties; |
• | Reduced or limited protection of intellectual property rights, particularly in jurisdictions that have less developed intellectual property regimes, such as China and India; |
• | Commercial laws and business practices that favor local competition; |
• | In certain international regions, particularly those with rapidly developing economies, it may be common to engage in business practices that are prohibited by anti-bribery laws, such as the U.S. Foreign Corrupt Practices Act and the U.K. Bribery Act; |
• | Increased complexity, time, and costs of managing international operations; |
• | Managing research and development and sales teams in geographically diverse locations, including teams divided between the United States, the United Kingdom, and India; |
• | Effective communications across multiple geographies, cultures, and languages; |
• | Recruiting sales and technical support personnel with the skills to design, manufacture, sell, and support Brocade’s products in international markets; |
• | Longer sales cycles and manufacturing lead times; |
• | Increased complexity and cost of providing customer support and maintenance for international customers; |
• | Difficulties in collecting accounts receivable; |
• | Increased complexity of logistics and distribution arrangements; and |
• | Increased complexity of accounting rules and financial reporting requirements. |
Any of these factors could negatively impact Brocade’s business, revenues, and profitability.
18
Brocade’s revenues, operating results, and cash flows may fluctuate from period to period due to a number of factors, which makes predicting financial results difficult.
IT spending is subject to cyclical and uneven fluctuations, which could cause Brocade’s financial results to fluctuate unevenly and unpredictably. For example, the U.S. federal budget for government IT spending can be highly seasonal and subject to delays, reductions, and uncertainty due to changes in the political and legislative environment. It can be difficult to predict the degree to which end-customer demand and the seasonality and uneven sales patterns of Brocade’s OEM partners or other customers will affect Brocade’s business in the future, particularly as Brocade releases new or enhanced products. While Brocade’s first and fourth fiscal quarters are typically stronger quarters for SAN products and Brocade’s third and fourth fiscal quarters are typically stronger quarters for IP Networking solutions, future buying patterns may differ from historical seasonality. If the mix of revenue changes, it may also cause results to differ from historical seasonality. Accordingly, Brocade’s quarterly and annual revenues, operating results, cash flows, and other financial and operating metrics may vary significantly in the future, and the results of any prior periods should not be relied upon as an indication of future performance.
If product orders are received late in a fiscal quarter, Brocade may be unable to recognize revenue for these orders in the same quarter, which could adversely affect quarterly financial results.
Brocade’s IP Networking business typically experiences significantly higher levels of customer orders toward the end of a fiscal period. Customer orders received toward the end of the period may not ship within the period due to a lack of available inventory and manufacturing lead times. The inability to ship within the quarter in which the customer orders are received could negatively impact Brocade’s financial results in a particular quarter.
Brocade is subject to—and will continue to be subject to—intellectual property infringement claims and litigation that are costly to defend and/or settle, which could result in significant damages and other costs to Brocade and limit Brocade’s ability to use certain technologies in the future.
Brocade competes in markets in which companies are frequently subject to claims and related litigation regarding patent and other intellectual property rights. Third parties have from time to time asserted patent, copyright, trade secret, and/or other intellectual property-related claims against Brocade and/or employees of Brocade. These claims may be, and have been in the past, made against Brocade’s products and services, subcomponents of its products, methods performed by its products or a combination of products, including third-party products, methods used in its operations, or uses of its products by its customers. The claimant may seek various remedies against Brocade, such as money damages, disgorgement of profits, injunctions barring sales of infringing goods, or exclusion orders barring imports of product into the U.S., among other possible remedies. Moreover, these claims may concern Brocade’s hiring of a former employee of the third-party claimant. Brocade and companies acquired by Brocade have in the past incurred, and will likely incur in the future, substantial expenses to defend against such third-party claims. Brocade’s suppliers and customers also may be subject to third-party intellectual property claims with respect to their own products, which could negatively impact the suppliers’ ability to supply Brocade with components or customers’ willingness to purchase products from Brocade. In addition, Brocade may be subject to claims, defenses, and indemnification obligations with respect to third-party intellectual property rights pursuant to Brocade’s agreements with suppliers, OEM and channel partners, or customers. If Brocade refuses to indemnify or defend such claims, for instance, even in situations where the allegations are meritless, then suppliers, partners, or customers may refuse to do business with Brocade. Parties that assert such intellectual property claims may be unreasonable in their demands, or may simply refuse to settle, which could lead to prolonged periods of litigation, additional burdens on employees or other resources, distraction from Brocade’s business operations, component supply stoppages, expensive settlement payments, and lost sales. Furthermore, there is little or no information publicly available concerning market or fair values for licenses and/or settlement fees, which can lead to overpayment of license or settlement fees. Any of the above scenarios could have an adverse effect on Brocade’s financial position, financial results, cash flows, and future business prospects.
19
Undetected software or hardware errors could increase Brocade’s costs, reduce its revenues, and delay market acceptance of its products.
Networking products frequently contain undetected software or hardware errors when first introduced or as new versions are released. As Brocade continues to expand its product portfolio to include software-centric products, which may include software licensed from third parties, errors may be found from time to time in these products. In addition, through its acquisitions, Brocade has assumed—and may in the future assume—products previously developed by an acquired company that have not been through the same level of product development, testing, and quality control processes used by Brocade, and may have known and/or undetected errors. Some types of errors may not be detected until the product is installed in a user environment. In addition, Brocade products are often combined with other products, including software from other vendors, and these products often need to interoperate. For IT products that have different specifications, utilize multiple protocol standards, or may be procured from other vendors, it may be difficult to identify the source of any problems. Identifying the source of and remediating these problems may cause Brocade to incur significant warranty and repair costs, divert the attention of engineering personnel from product development efforts, and cause significant customer relations problems, resulting in lower profitability from increased costs and/or decreased revenue. Moreover, the occurrence of hardware and software errors, whether caused by Brocade products or another vendor’s products, could delay market acceptance of new or enhanced Brocade products.
Brocade’s supply chain is dependent on sole-source and limited-source suppliers and a limited number of major CMs, either one or both of which may significantly impact Brocade’s financial results.
Although Brocade uses standard parts and components for its products where possible, Brocade’s CMs currently purchase, on Brocade’s behalf, several key components used in the manufacture of its products from single or limited supplier sources. Brocade’s single-source components include, but are not limited to, its application-specific integrated circuits (commonly referred to as “ASICs”). Brocade’s principal limited-source components include memory, certain oscillators, microprocessors, certain connectors, certain logic chips, power supplies, programmable logic devices, printed circuit boards, certain optical components, packet processors, and switch fabric components. Brocade generally acquires these components through purchase orders and has no long-term commitments regarding supply or pricing with such suppliers. If Brocade is unable to obtain these and other components when required, or if Brocade’s suppliers experience component defects, Brocade may not be able to deliver its products to customers in a timely manner and may be required to repair or retrofit products previously delivered to customers, at significant expense to Brocade. In addition, a challenging economic or industry environment could cause some of these sole-source or limited-source suppliers to delay or halt production, go out of business, or be acquired by third parties, which could result in a disruption in Brocade’s supply chain. Brocade’s supply chain could also be disrupted in a variety of other circumstances that may impact its suppliers and partners, including adverse results from intellectual property litigation or natural disasters. Any manufacturing disruption by these sole-source or limited-source suppliers could severely impair Brocade’s ability to fulfill orders and may significantly impact its financial results.
In addition, the loss of any of Brocade’s major CMs, or portions of their capacity, could significantly impact Brocade’s ability to produce its products for an indefinite period of time. Qualifying a new CM and commencing volume production is typically a lengthy and expensive process. A CM may move the production lines for Brocade’s products to new locations or factories, and this may result in delays or disruptions. If Brocade changes any of its CMs or if any of its CMs experience unplanned delays, disruptions, capacity constraints, component parts shortages, or quality control problems in their manufacturing operations, shipment of Brocade’s products to customers could be delayed and result in loss of revenues.
Brocade’s intellectual property rights may be infringed upon or misappropriated by others, and Brocade may not be able to protect or enforce its intellectual property rights.
Brocade’s intellectual property rights may be infringed upon or misappropriated by others, including by competitors, partners, former employees, foreign governments, or other third parties. In some cases, such infringement or misappropriation may be undetectable, or enforcement of Brocade’s intellectual property rights may be impractical. Brocade has filed, and may in the future file, lawsuits against third parties in an effort to enforce its intellectual property rights. Intellectual property litigation is expensive and unpredictable. There can be no assurance that Brocade will prevail in such assertions or enforcement efforts, either on the merits, or with respect to particular relief sought, such as damages or an injunction. Nor can there be any assurance that any awarded damages ultimately will be paid to Brocade. Furthermore, the opposing party may attempt to prove that the asserted intellectual property rights are invalid or unenforceable, and, if successful, may seek recompense for its attorneys’ fees and costs or countersue Brocade as part of its defense. Finally, there can be no assurance that any attempt by Brocade to enforce its intellectual property rights, even if successful in court, will improve Brocade’s sales, diminish the defendant’s sales, or stop the defendant’s allegedly unfair competition.
20
Brocade relies on a combination of patent, copyright, trademark, and trade secret laws, along with measures such as physical and operational security and contractual restrictions, to protect its intellectual property rights in its proprietary technologies, but none of these methods of protection may be entirely appropriate or adequate to address all risks that could result in a loss of intellectual property rights. Loss or violation of Brocade’s intellectual property rights could adversely affect Brocade’s business and operating results, through a loss of revenue or an increase in expenses.
Brocade relies on licenses from third parties, and the loss or inability to obtain any such license could adversely affect its business.
Many Brocade products are designed to include software or other intellectual property licensed from third parties. There can be no assurance that the necessary licenses will be available on acceptable terms, if at all. Brocade’s inability to obtain certain licenses or other rights on favorable terms could have an adverse effect on Brocade’s business, operating results, and financial condition, including its ability to continue to distribute or support affected products.
In addition, if Brocade has failed, or in the future fails to, adequately manage the use of commercial or “open source” software in Brocade’s products, or if companies acquired by Brocade fail in such regard, Brocade may be subject to copyright infringement litigation or other claims. Furthermore, Brocade may be required, for commercially licensed software, to pay penalties or undergo costly audits pursuant to the license agreement. In the case of open source software, Brocade may be required to license proprietary portions of its products on a royalty-free basis, disclose proprietary parts of source code, or commence costly product redesigns that could result in a loss of intellectual property rights, product performance degradation, or a delay in shipping products to customers and result in loss of revenue.
Business interruptions could adversely affect Brocade’s business operations.
Brocade’s business operations and the operations of its suppliers, CMs, and customers are vulnerable to interruptions caused by acts of terrorism, fires, earthquakes, tsunamis, nuclear reactor leaks, hurricanes, power losses, telecommunications failures, and other events beyond Brocade’s control. For example, a substantial portion of Brocade’s facilities, including its corporate headquarters, are located near major earthquake faults. Brocade does not have multiple-site capacity for all of its services in the event of a business disruption. In the event of a major earthquake, Brocade could experience business interruption resulting from destruction of facilities or other infrastructure and from loss of life. Brocade carries a limited amount of earthquake insurance, which may not be sufficient to cover earthquake-related losses, and has not set aside funds or reserves to cover other potential earthquake-related losses. Additionally, major public health issues, such as an outbreak of a pandemic or epidemic, may interrupt business operations of Brocade, its CMs, its customers, or its suppliers in those geographic regions affected by that particular health issue. In addition, one of Brocade’s CMs has a major facility located in an area that is subject to hurricanes, and Brocade’s suppliers could face other natural disasters, such as floods, earthquakes, extreme weather, and fires. In the event that a business interruption occurs that affects Brocade, its suppliers, CMs, or customers, shipments could be delayed and Brocade’s business and financial results could be harmed.
In addition, Brocade may suffer reputational harm and may not carry sufficient insurance to compensate for financial losses that may occur as a result of any of these events. Any such event could have an adverse effect on Brocade’s business, operating results, and financial condition, and could expose Brocade to significant third-party claims of liability and damages.
Any failure by Brocade to meet its current capital return objectives could have an adverse effect on its reputation and stock price.
Brocade has publicly stated its intent to return at least 60% of its annual adjusted free cash flow to stockholders in the form of share repurchases and dividends. Brocade’s ability to return at least 60% of its adjusted free cash flow to stockholders is limited by, among other things, Delaware law. If Brocade is unable to meet its intended capital return objective, or if the Board of Directors decides to alter the capital return objective, Brocade’s reputation and its stock price may be adversely affected.
21
Brocade’s business is subject to increasingly complex and changing legal and regulatory requirements that could adversely affect its business, financial results, and stock price.
Brocade is subject to the changing rules and regulations of federal and state governments as well as the stock exchange on which Brocade’s common stock is listed. These entities, including the Public Company Accounting Oversight Board, the Financial Accounting Standards Board, the U.S. Securities and Exchange Commission, the Internal Revenue Service (the “IRS”), the Financial Industry Regulatory Authority, Inc., and the NASDAQ Stock Market LLC (“NASDAQ”), have issued a significant number of new regulations over the last several years and continue to develop additional regulations and requirements. Further, Brocade is subject to various rules and regulations of certain foreign jurisdictions. Brocade’s efforts to comply with these requirements have resulted in, and are likely to continue to result in, an increase in expenses and a diversion of management’s time from other business activities.
For example, The Sarbanes-Oxley Act of 2002 requires Brocade to furnish a report by Brocade’s management on internal control over financial reporting. This report contains, among other matters, an assessment of the effectiveness of internal control over financial reporting as of the end of the fiscal year. This assessment includes disclosure of any material weaknesses in internal control over financial reporting identified by management. If the assessment does not assert that internal control over financial reporting is effective (or if Brocade’s independent registered public accounting firm is unable to express an opinion on the effectiveness of Brocade’s internal control over financial reporting), Brocade’s stockholders could lose confidence in the accuracy and completeness of Brocade’s financial reports, which could have an adverse effect on Brocade’s stock price.
Additionally, the Dodd-Frank Wall Street Reform and Consumer Protection Act requires that public companies disclose whether certain minerals, commonly known as “conflict minerals,” are necessary to the functionality or production of a product manufactured or contracted to be manufactured by those companies, and, if so, if those minerals originated in the Democratic Republic of the Congo or an adjoining country. These requirements could adversely affect the sourcing, availability, and pricing of minerals used in the manufacture of certain components that are incorporated in Brocade products. In addition, Brocade’s supply chain is complex, so Brocade may face reputational challenges with its partners, customers, stockholders, and other stakeholders if the origins of the conflict minerals used in its products cannot be verified sufficiently.
Similarly, Brocade is subject to environmental and other regulations governing product safety, materials usage, packaging, and other environmental impacts in the countries where Brocade products are sold. For example, many Brocade products are subject to laws and regulations that restrict the use of certain substances such as lead, mercury, hexavalent chromium, and cadmium, and that require Brocade to assume responsibility for collecting, treating, recycling, and disposing of products when they have reached the end of their useful life. For example, in Europe, environmental restrictions apply to products sold in that region, and certain Brocade partners require compliance with these or other more stringent requirements. In addition, recycling, labeling, and related requirements apply to Brocade products sold in Europe and China. If Brocade products do not comply with local environmental laws, Brocade could be subject to fines, civil and criminal sanctions, and contract damage claims. In addition, Brocade could be prohibited from shipping noncompliant products into certain jurisdictions and required to recall and replace any noncompliant products already shipped, which would disrupt the ability to ship products and result in reduced revenue, increased warranty expense, increased obsolete or excess inventories, and harm to Brocade’s business and customer relationships.
In addition, Brocade is subject to laws, rules, and regulations in the United States and other countries relating to the collection, use, and security of personal information and data. Brocade has incurred, and will continue to incur, expenses to comply with privacy and security standards, protocols, and obligations imposed by applicable laws, regulations, industry standards, and contracts. In addition, such data privacy laws, regulations, and other obligations may negatively impact Brocade’s ability to execute transactions and pursue business opportunities. The privacy and data protection-related laws, rules, and regulations applicable to Brocade are also subject to significant change. For example, in October 2015, the Court of Justice of the European Union invalidated a safe harbor framework that allowed Brocade and other U.S. companies to meet certain European legal requirements for transferring personal data from Europe to the United States. Brocade is in the process of evaluating and considering changes to its data handling practices as a result of this court decision. Any inability to comply with applicable privacy or data protection laws, regulations, or other obligations, could result in significant cost and liability, damage Brocade’s reputation, and adversely affect its business.
22
Changes to Brocade’s provision for income taxes or unfavorable outcomes of tax audits could adversely impact Brocade’s financial condition or results.
Brocade is subject to income and other taxes in the United States, including those required by both state and federal governmental agencies such as the IRS, and numerous foreign jurisdictions. Brocade’s provision for income taxes could be increased due to changes in tax laws in the jurisdictions in which Brocade does business, including an increase in tax rates or an adverse change in the treatment of an item of income or expense. In this regard, the United States, countries in the European Union, and other countries where Brocade operates are actively considering changes to relevant tax, accounting, and other laws, regulations, and interpretations, including fundamental changes to tax laws applicable to multinational corporations. In addition, future effective tax rates could be subject to volatility or adversely affected by changes in the geographic mix of earnings in countries with differing statutory rates, changes in the valuation of deferred tax assets and liabilities, lapses in the federal R&D tax credit, and tax effects of stock-based compensation. These potential changes could increase Brocade’s effective tax rate or result in other costs in the future.
Brocade is subject to periodic audits or other reviews by such governmental agencies, and is currently under examination by the IRS and several state and foreign tax jurisdictions for various years. Audits by the IRS and other governmental tax agencies are subject to inherent uncertainties and could result in unfavorable outcomes, including potential fines or penalties. While Brocade regularly assesses the likely outcomes of these audits in order to determine the appropriateness of its tax provision, the occurrence of an unfavorable outcome in any specific period could have an adverse effect on Brocade’s financial condition or results for that period or future periods. The expense of defending and resolving such an audit may be significant.
Brocade is exposed to various risks related to legal proceedings or claims that could adversely affect its financial condition or results.
Brocade is a party to lawsuits in the normal course of its business. Litigation in general can be expensive, lengthy, and disruptive to normal business operations. Moreover, the results of complex legal proceedings are difficult to predict. Responding to lawsuits brought against Brocade, or legal actions initiated by Brocade, can often be expensive and time-consuming. Unfavorable outcomes from these claims and/or lawsuits could adversely affect Brocade’s business, financial results, or financial condition, and Brocade could incur substantial monetary liability and/or be required to change its business practices. In view of the uncertainties, potential risks, and expenses of litigation, Brocade may, from time to time, settle such disputes, even where Brocade had meritorious claims or defenses, by agreeing to settlement agreements that, depending on their terms, may significantly impact Brocade’s financial condition or results.
Brocade’s stock price may fluctuate, which could cause the value of an investment in Brocade’s shares to decline.
Brocade’s stock price has fluctuated in the past and may be subject to wide fluctuations in the future in response to various factors. Brocade does not have the ability to influence or control many of these factors. In addition to the factors discussed elsewhere in this “Risk Factors” section, factors that could affect Brocade’s stock price include, among others:
• | Actual or anticipated changes in Brocade’s operating results; |
• | Whether Brocade’s operating results meet the expectations of securities analysts or investors; |
• | Actual or anticipated changes in the expectations of securities analysts or investors; |
• | Recommendations by securities analysts or changes in their earnings estimates; |
• | The announcement or timing of Brocade’s quarterly or annual operating results; |
• | Announcements of actual or anticipated operating results by Brocade’s competitors, Brocade’s OEM partners, and other companies in the IT industry; |
• | Speculation, coverage or sentiment in the media or the investment community about, or actual changes in, Brocade’s business, strategic position, competitive position, market share, operations, prospects, future stock price performance, or Brocade’s industry in general; |
• | The announcement of new, planned, or contemplated products; services; commercial relationships; technological innovations; acquisitions; divestitures; or other significant transactions by Brocade or its competitors; |
• | Adverse changes to Brocade’s relationships with any of its OEM partners; |
23
• | Changes in the business strategy or execution of any of Brocade’s OEM partners; |
• | Departures of key employees; |
• | Litigation or disputes involving Brocade, Brocade’s industry, or both; |
• | General economic conditions and trends; |
• | Sales of Brocade’s shares by Brocade’s officers, directors, or significant stockholders; and |
• | The timing and amount of dividends and share repurchases. |
In addition, the stock market in general, and the market for technology companies in particular, has experienced extreme price and volume fluctuations that have often been unrelated or disproportionate to the operating performance of those companies. Accordingly, broad market and industry factors may adversely affect Brocade’s stock price regardless of Brocade’s operating performance. In addition, Brocade’s stock price might also fluctuate in reaction to events that affect other companies in Brocade’s industry even if these events do not directly affect Brocade.
If Brocade’s stock price fluctuates widely, Brocade may become the target of securities litigation. Securities litigation could result in substantial costs and divert Brocade’s management’s attention and resources from Brocade’s business.
Brocade has incurred substantial indebtedness that may decrease its business flexibility, access to capital, and/or increase its borrowing costs, which may adversely affect Brocade’s operations and financial results.
As of October 31, 2015, Brocade had approximately $875 million in principal amount of outstanding indebtedness, including $575 million of indebtedness under the 1.375% convertible senior notes due 2020 (the “2020 Convertible Notes”) and $300 million of unsecured indebtedness under the 4.625% senior notes due 2023 (the “2023 Notes”) (see Note 8, “Borrowings,” of the Notes to Consolidated Financial Statements in Part II, Item 8 of this Form 10-K). The indenture governing the 2023 Notes contains several negative covenants that restrict the incurrence of debt by Brocade’s subsidiaries, restrict the incurrence of liens on principal properties, and restrict Brocade and its subsidiaries from engaging in certain sale-leaseback transactions. In addition, the indentures governing both the 2020 Convertible Notes and the 2023 Notes impose covenants that restrict Brocade’s ability to effect certain mergers, consolidations, or sales of assets and require Brocade to offer to repurchase the notes upon the occurrence of certain “fundamental changes” or “changes of control triggering events.” These covenants could have the effect, among other things, of reducing Brocade’s flexibility to respond to changing business and economic conditions and increasing borrowing costs, should further debt financing be desired, and may adversely affect Brocade’s operations and financial results. Brocade’s failure to comply with these covenants would result in a default under the applicable indenture, which could permit the holders to accelerate such debt or demand payment in exchange for a waiver of such default. A default under one of the indentures could also result in cross-defaults under Brocade’s other debt instruments, negatively impact the price and liquidity of Brocade’s debt and equity securities, negatively impact Brocade’s credit ratings, and impair Brocade’s ability to access sources of capital. If any of Brocade’s debt is accelerated, Brocade may not have sufficient funds available to repay such debt.
Agencies rating Brocade’s debt securities may lower Brocade’s credit rating. This could further negatively impact the price and liquidity of Brocade’s debt and equity securities. If Brocade’s credit rating is lowered, it could also negatively impact Brocade’s ability to access sources of capital.
Although interest rates have remained at low levels in recent years, they may increase for various reasons, including an increase in inflation, Federal Reserve Board actions, domestic or international fiscal policies, or domestic or international events impacting financial or capital markets. Higher interest rates or increase in credit spread for Brocade’s rating could negatively impact Brocade’s ability to raise additional debt or refinance existing debt.
24
The occurrence of a “Fundamental Change” with respect to the 2020 Convertible Notes or a “Change of Control Triggering Event” with respect to the 2023 Notes or a conversion of the 2020 Convertible Notes could negatively impact Brocade’s cash flows and financial position.
Holders of the 2020 Convertible Notes have the right to require Brocade to repurchase their convertible notes upon the occurrence of a “Fundamental Change” and holders of the 2023 Notes have the right to require Brocade to repurchase their senior notes upon the occurrence of a “Change of Control Triggering Event,” in each case at a repurchase price equal to 100% of the principal amount of the applicable notes to be repurchased, plus accrued and unpaid interest, if any. In addition, upon conversion of the 2020 Convertible Notes, Brocade will be required to make cash payments up to the full conversion value in respect of the convertible notes being converted, unless Brocade elects to only deliver shares of its common stock to settle such conversion (other than paying cash in lieu of delivering any fractional share). It is Brocade’s current intent and policy to settle conversions of the 2020 Convertible Notes through the delivery of cash up to the principal amount of converted convertible notes, together with shares of common stock to satisfy any conversion obligation in excess of such specified dollar amount. However, if Brocade elects to settle conversions of the 2020 Convertible Notes solely in shares of common stock, such settlement would result in additional dilution to Brocade’s stockholders and could result in more dilutive accounting treatment for the 2020 Convertible Notes. The 2020 Convertible Notes may be converted at the option of the holders during certain periods as a result of, among other things, fluctuations in Brocade’s stock price.
If Brocade is required to make repurchases of the 2020 Convertible Notes or the 2023 Notes or make cash payments in respect of conversions of the 2020 Convertible Notes, Brocade may not have enough available cash or be able to obtain financing on acceptable terms (or at all) at the time. Further, these obligations would negatively impact Brocade’s cash flows and could limit its ability to use its available cash and cash flow for other liquidity needs, including working capital, capital expenditures, acquisitions, investments, and other general corporate purposes. Brocade’s ability to repurchase the notes or to pay cash upon conversions of the 2020 Convertible Notes may also be limited by law, by regulatory authority, or by agreements governing its future indebtedness.
Provisions in Brocade’s charter documents, customer agreements, and Delaware law could discourage, delay, or prevent a change in control of Brocade, which could hinder stockholders’ ability to receive a premium for Brocade’s common stock and adversely affect the value of Brocade’s convertible notes.
Provisions of Brocade’s certificate of incorporation and bylaws may discourage, delay, or prevent a merger or mergers that a stockholder may consider favorable. These provisions include, but are not limited to:
• | Authorizing the issuance of preferred stock without stockholder approval; |
• | Prohibiting cumulative voting in the election of directors; |
• | Limitations on who may call special meetings of stockholders and when special meetings of stockholders may be called; and |
• | Prohibiting stockholder actions by written consent. |
Certain provisions of Delaware law also may discourage, delay, or prevent someone from acquiring or merging with Brocade, and Brocade’s agreements with certain Brocade customers require that Brocade give prior notice of a change of control and grant certain manufacturing rights following a change of control. Brocade’s various change of control provisions could prevent or delay a change in control of Brocade, which could hinder stockholders’ ability to receive a premium for Brocade’s common stock and could adversely affect the value of Brocade’s convertible notes.
25
Item 1B. | Unresolved Staff Comments |
None.
Item 2. | Properties |
Brocade’s principal administrative, sales, marketing, education, customer support, and research and development facilities include approximately 562,000 square feet owned by Brocade in San Jose, California. Additional administrative and research and development facilities are located in an aggregate of approximately 424,000 square feet in Broomfield, Colorado; Plymouth, Minnesota; and Bangalore, India. Approximately 256,000 square feet of such space is leased and 168,000 square feet is owned. Brocade believes that its existing properties, both owned and leased, are in good condition and are suitable for conducting its business. Brocade also productively utilizes the majority of the space in its facilities, making adjustments as necessary.
Brocade’s leased properties have expirations through October 2025. In addition to the noted facilities, Brocade leases approximately 506,000 square feet of administrative, sales, and marketing office space in various locations to serve its customers throughout the world.
Brocade has three operating segments. Due to the interrelation of these segments, these segments use substantially all of the properties at least in part, and Brocade retains the flexibility to use each of the properties in whole or in part for each of the segments.
Brocade’s properties are subject to a perfected first interest in and mortgages on its tangible and intangible assets as further described in Note 8, “Borrowings,” of the Notes to Consolidated Financial Statements in Part II, Item 8 of this Form 10-K.
Item 3. | Legal Proceedings |
The information set forth under the heading “Legal Proceedings” in Note 9, “Commitments and Contingencies,” of the Notes to Consolidated Financial Statements in Part II, Item 8 of this Form 10-K is incorporated herein by reference.
Item 4. | Mine Safety Disclosures |
None.
26
PART II
Item 5. | Market for Registrant’s Common Equity, Related Stockholder Matters and Issuer Purchases of Equity Securities |
Brocade’s common stock is listed on the NASDAQ Global Select Market under the symbol “BRCD.” Information regarding the high and low sale prices per share of Brocade’s common stock as reported on the NASDAQ Global Select Market for each full quarterly period for the last two fiscal years is set forth in “Quarterly Summary (Unaudited)” in Part II, Item 8 of this Form 10-K. According to the records of Brocade’s transfer agent, Brocade had 752 stockholders of record as of December 15, 2015, and Brocade believes there are a substantially greater number of beneficial holders. In the third quarter of fiscal year 2014, Brocade’s Board of Directors approved the initiation of a quarterly cash dividend on the Company’s common stock subject, in each quarter, to the approval of the Board of Directors, and declared the Company’s first ever dividend. Brocade paid a total of $67.5 million and $30.4 million in cash for dividends during fiscal years 2015 and 2014, respectively. Brocade also currently expects to retain any future earnings for use in the operation and expansion of its business, to manage its debt, and to return capital to stockholders in the form of stock repurchases and cash dividends. Information with respect to the impact of paying dividends on the conversion rate of the convertible senior unsecured notes is set forth in Note 8, “Borrowings,” of the Notes to Consolidated Financial Statements in Part II, Item 8 of this Form 10-K.
Unregistered Sales of Equity Securities and Use of Proceeds
There were no unregistered sales of equity securities in fiscal year 2015 that have not been previously reported on a current report on Form 8-K.
Issuer Purchases of Equity Securities
The following table summarizes share repurchase activity for the three months ended October 31, 2015 (in thousands, except per share amounts):
Period | Total Number of Shares Purchased | Average Price Paid per Share | Total Number of Shares Purchased as Part of Publicly Announced Program (1) | Approximate Dollar Value of Shares That May Yet Be Purchased Under the Program (1) | ||||||||||
August 2, 2015 to August 29, 2015 | 1,960 | $ | 10.05 | 1,960 | $ | 332,327 | ||||||||
August 30, 2015 to September 26, 2015 | 576 | $ | 10.37 | 576 | $ | 1,026,353 | ||||||||
September 27, 2015 to October 31, 2015 | 525 | $ | 10.32 | 525 | $ | 1,020,934 | ||||||||
Total | 3,061 | $ | 10.16 | 3,061 | ||||||||||
(1) | As of October 31, 2015, Brocade’s Board of Directors had authorized a stock repurchase program for an aggregate amount of up to approximately $2.7 billion (consisting of an original $100 million authorization on August 18, 2004, plus subsequent authorizations of an additional $200 million on January 16, 2007, $500 million on November 29, 2007, $500 million on May 16, 2012, $692 million on September 25, 2013, and $700 million on September 25, 2015), which was used for determining the amounts in these columns. The number of shares purchased and the timing of purchases are based on the level of the Company’s cash balances, the trading price of the Company’s common stock, general business and market conditions, and other factors, including alternative investment opportunities. |
27
Stock Performance Graph
The graph below shows a comparison for the period commencing on October 30, 2010, and ending on October 31, 2015, of the annual percentage change in the cumulative total stockholder return for Brocade common stock, assuming the investment of $100.00 on October 30, 2010, with the cumulative total stockholder returns for the NASDAQ Composite Index and the NASDAQ Telecommunications Index, respectively, assuming the investment of $100.00 on October 30, 2010. The stockholder returns for the NASDAQ Composite Index over the indicated periods below are weighted based on market capitalization of companies included in the index at the beginning of each measurement point. Both historical stockholder returns for Brocade common stock and the NASDAQ Composite Index are not indicative of, or intended to forecast, future performance. Data for Brocade common stock, the NASDAQ Composite Index, and the NASDAQ Telecommunications Index assume reinvestment of dividends and was prepared based on publicly available information.
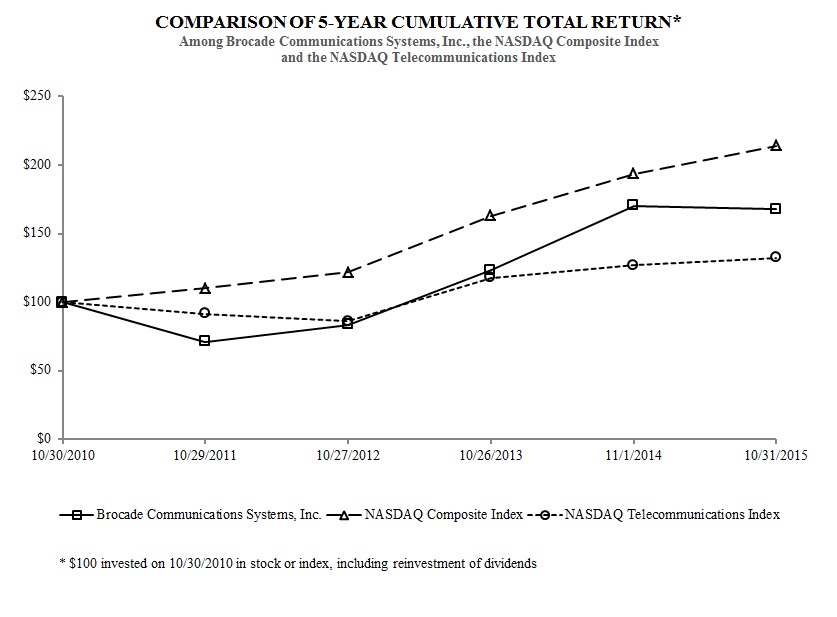
10/30/2010 | 10/29/2011 | 10/27/2012 | 10/26/2013 | 11/1/2014 | 10/31/2015 | ||||||||||||||||||
Brocade Communications Systems, Inc. | $ | 100 | $ | 71 | $ | 83 | $ | 123 | $ | 170 | $ | 168 | |||||||||||
NASDAQ Composite Index | $ | 100 | $ | 110 | $ | 122 | $ | 163 | $ | 194 | $ | 214 | |||||||||||
NASDAQ Telecommunications Index | $ | 100 | $ | 92 | $ | 86 | $ | 118 | $ | 127 | $ | 132 | |||||||||||
28
Item 6. | Selected Financial Data |
The following selected financial data should be read in conjunction with the Company’s Consolidated Financial Statements and related notes, “Management’s Discussion and Analysis of Financial Condition and Results of Operations,” and other financial information appearing elsewhere in this Annual Report on Form 10-K. The information set forth below is not necessarily indicative of Brocade’s future financial condition or results of operations.
Fiscal Year Ended | |||||||||||||||||||
October 31, 2015 | November 1, 2014 (1) | October 26, 2013 (2) | October 27, 2012 | October 29, 2011 | |||||||||||||||
(In thousands, except per share amounts) | |||||||||||||||||||
Selected Financial Data: | |||||||||||||||||||
Net revenues | $ | 2,263,460 | $ | 2,211,267 | $ | 2,222,864 | $ | 2,237,770 | $ | 2,147,442 | |||||||||
Net income | $ | 340,362 | $ | 237,971 | $ | 208,623 | $ | 195,181 | $ | 50,610 | |||||||||
Net income per share—basic | $ | 0.81 | $ | 0.55 | $ | 0.46 | $ | 0.43 | $ | 0.11 | |||||||||
Net income per share—diluted | $ | 0.79 | $ | 0.53 | $ | 0.45 | $ | 0.41 | $ | 0.10 | |||||||||
Shares used in per share calculation—basic | 420,331 | 435,258 | 450,516 | 456,629 | 474,259 | ||||||||||||||
Shares used in per share calculation—diluted | 430,556 | 446,859 | 463,705 | 472,343 | 497,030 | ||||||||||||||
Cash dividends declared per share | $ | 0.16 | $ | 0.07 | $ | — | $ | — | $ | — | |||||||||
Net cash provided by operating activities | $ | 447,499 | $ | 541,597 | $ | 451,029 | $ | 590,870 | $ | 449,232 | |||||||||
Cash, cash equivalents, and investments | $ | 1,440,882 | $ | 1,255,017 | $ | 986,997 | $ | 713,226 | $ | 414,976 | |||||||||
Total assets | $ | 4,038,178 | $ | 3,733,675 | $ | 3,621,391 | $ | 3,581,261 | $ | 3,474,308 | |||||||||
Convertible senior unsecured notes | $ | 498,689 | $ | — | $ | — | $ | — | $ | — | |||||||||
Senior unsecured notes | $ | 297,115 | $ | 296,788 | $ | 296,477 | $ | — | $ | — | |||||||||
Senior secured notes | $ | — | $ | 298,373 | $ | 298,127 | $ | 596,264 | $ | 595,803 | |||||||||
Term loan | $ | — | $ | — | $ | — | $ | — | $ | 186,858 | |||||||||
Capital lease obligations | $ | 298 | $ | 2,115 | $ | 4,600 | $ | 4,916 | $ | 6,782 | |||||||||
(1) | The fiscal year ended November 1, 2014, includes the impact of an $83.4 million impairment of goodwill in the Company’s Application Delivery Products reporting unit. |
(2) | The fiscal year ended October 26, 2013, includes the impact of the nonrecurring gain of $76.8 million resulting from the litigation settlement with A10 Networks, Inc., as well as a discrete charge of $78.2 million to reduce previously recognized California deferred tax assets due to changes in California law resulting from the passage of Proposition 39 during fiscal year 2013. |
29
Item 7. | Management’s Discussion and Analysis of Financial Condition and Results of Operations |
The following discussion and analysis should be read in conjunction with the Company’s Consolidated Financial Statements and the notes thereto included in Part II, Item 8 of this Annual Report on Form 10-K. This section and other parts of this Annual Report on Form 10-K contain forward-looking statements that involve risks and uncertainties. Forward-looking statements can also be identified by words such as “expects,” “anticipates,” “assumes,” “targets,” “projects,” “intends,” “plans,” “believes,” “seeks,” “estimates,” “continues,” “may,” and variations of such words and similar expressions. Forward-looking statements are not guarantees of future performance and our actual results may differ significantly from the results discussed in the forward-looking statements. Factors that might cause such differences include, but are not limited to, those discussed in the subsection entitled “Risk Factors” above.
Overview
We are a leading supplier of networking hardware, software, and services for businesses and organizations of various types and sizes. Our end customers include global enterprises and other organizations that use our products and services as part of their communications infrastructure and service providers, such as telecommunication firms, cable operators, and mobile carriers, that use our products and services as part of their commercial operations. Our business model is focused on two key markets: Storage Area Networking (“SAN”), where we offer our Fibre Channel (“FC”) SAN products, including directors, fixed-configuration and embedded switches, as well as network management and monitoring capabilities; and Internet Protocol (“IP”) Networking, where we offer IP routers, Ethernet switches, network security, analytics, and monitoring, as well as products used to manage application delivery. Our IP Networking products are available in modular and fixed hardware-based form factors and can be deployed in both traditional network designs and full-featured Ethernet fabrics. Our IP Networking products also include a range of virtualized network software offerings, including a virtual routing software suite and an application delivery controller and load balancer offering. In addition, for mobile service providers, our products include a virtual evolved packet core (“vEPC”) solution and a software analytics probe and application monitoring application.
We provide product-related customer support and services in both our SAN business and IP Networking business. Many of our products and services have been designed to enable customers to deploy next-generation data center architectures and technologies.
Key customer information technology (“IT”) initiatives, such as virtualization, enterprise mobility, data center consolidation, cloud computing initiatives, and migration to higher-performance technologies, such as solid state storage, continue to rely on our mission critical FC SAN based solutions. We are known as a storage networking innovator and have a leading FC SAN market share position. We continue to expand and diversify our partner base and introduce new, innovative solutions for both our large installed base and potential new customers. During fiscal year 2015, we added new FC SAN partners, expanded relationships with existing partners, and introduced new products, such as the Brocade Analytics Monitoring Platform. This new platform provides customers the ability to improve operational performance, stability, and security within their storage environment.
Our IP Networking business strategies are intended to increase new customer accounts and expand our current low market share through product innovations, such as our Ethernet fabric switches and virtualized software networking products (also known as software-defined networking (“SDN”), network functions virtualization (“NFV”), and network visibility and analytics (“NVA”)), and the development and expansion of our routes to market. The success of our Ethernet fabrics, in particular, will depend on customers recognizing the benefits of upgrading their data center networks to fabric-based networking architectures, and our future success in this area would be negatively impacted if this technological transition does not occur at the anticipated rate or at all. While our software networking product revenues have not been material to date, there is customer interest in software networking products, and we believe that customers prefer to buy networking products from suppliers that offer a portfolio of solutions that address their current and future needs. We plan to continue to support our growth strategy with continuous innovation, leveraging the strategic investments we have made in our core businesses, developing emerging technologies such as SDN, NFV, and NVA, new product introductions, acquisitions, and enhancing our existing partnerships and forming new ones through our various distribution channels.
In fiscal years 2013 and 2014, we made certain changes in our strategic direction by focusing on key technology segments for the data center, such as our SAN fabrics, Ethernet fabrics, and software networking solutions. As part of this change in focus, we reduced our cost of revenues and other operating expenses by focusing on the optimization of discretionary spending and rebalancing personnel resources.
In the second quarter of fiscal year 2014, we made a strategic decision to reduce our investment in our hardware-based application delivery controller product line and to increase investment in our software-based application delivery controller product line.
30
We continue to face multiple challenges, including aggressive price discounting from competitors, new product introductions from competitors, and rapid adoption of new technologies by customers, as our industry transitions at an uncertain rate from network architectures based solely on specialized networking hardware to new architectures based on software, servers, and a mix of proprietary and commodity networking hardware. We also continue to be affected by worldwide macroeconomic conditions, and face the possibility that these conditions could deteriorate and create a more cautious capital spending environment in the IT sector. In addition, U.S. federal customers are important to us, and spending by the U.S. government can be variable and difficult to predict. We are also cautious about the stability and health of certain international markets and current global and country-specific dynamics, such as the drop in the value of the euro and the Chinese yuan versus the U.S. dollar in fiscal year 2015, slowing economic growth in China, and Russia-related geopolitical uncertainty. These factors may impact our business and those of our partners. Our diversified portfolio of products helps mitigate the effect of some of these challenges, and we expect IT spending levels to generally rise in the long term. In addition, we are making investments in software offerings and people with software-oriented skill sets to adapt as the market transitions. However, it is difficult for us to offset the effects of short-term reductions in IT spending.
We expect our SAN and IP Networking revenues to fluctuate depending on the demand for our existing and future products and services and the quality of the sales support for our products and services from our distribution and resale partners, as well as the timing of product transitions by our original equipment manufacturer (“OEM”) partners. The average selling prices per port for our SAN and IP Networking products have typically declined over time, unless impacted favorably by a new product introduction or product mix, and will likely decline in the future.
We continue to expand our software networking capabilities through technology innovation and strategic acquisitions. In September 2014, we completed an acquisition that enhances our leadership in NFV technology and gives us a new market to address with visibility and analytics solutions for mobile operators. In March 2015, we completed two acquisitions, in which we acquired a virtual application delivery controller (“vADC”) software product line and a virtual evolved packet core software product line, respectively. The acquired vADC software expands our NFV portfolio and addresses the needs of service providers and enterprise accounts, while the virtual evolved packet core software primarily addresses emerging mobile applications and services, including advanced mobile virtual network operators and enterprise mobile services, like mobile virtual private networks. In addition to these acquisitions, in April 2015, we launched a portfolio of IP Networking products designed specifically to support IP storage deployments.
Fiscal year 2015 was a productive year in which we achieved many important milestones. We delivered annual revenue growth of 2%, with a year-over-year increase in each fiscal quarter. We expanded both our gross and operating margins over the prior year by 4% and 28%, respectively. We also generated strong operating cash flow, allowing us to increase our dividend and repurchase more than $340 million of our common stock.
In January 2015, we issued $575.0 million of 1.375% convertible senior unsecured notes due 2020 (the “2020 Convertible Notes”), allowing us to redeem the outstanding 6.875% senior secured notes due 2020 (the “2020 Notes”) in February 2015. These transactions are described further below in the section entitled “Liquidity and Capital Resources.”
Our plans for our operating cash flows are to provide liquidity for operations, capital investment, and other strategic initiatives, including investments and acquisitions to strengthen our networking portfolios, and to return capital to stockholders in the form of stock repurchases and cash dividends. In September 2015, we reconfirmed our intent to return at least 60% of our annual adjusted free cash flow to stockholders in the form of share repurchases or dividends. We define adjusted free cash flow as operating cash flow, adjusted for the impact of the excess tax benefits from stock-based compensation, less capital expenditures. In the third quarter of fiscal year 2015, our Board of Directors increased our quarterly cash dividend from $0.035 per share of our common stock to $0.045 per share of our common stock. In the fourth quarter of fiscal year 2015, our Board of Directors declared and paid a quarterly cash dividend of $0.045 per share of our common stock for a total of $18.7 million. On November 22, 2015, our Board of Directors declared a quarterly cash dividend of $0.045 per share of our common stock to be paid on January 4, 2016, to stockholders of record as of the close of market on December 10, 2015. Future dividend payments are subject to review and approval on a quarterly basis by our Board of Directors. On September 25, 2015, our Board of Directors authorized an additional $700 million for future share repurchases, increasing the total remaining amount authorized for future repurchases to $1.0 billion as of October 31, 2015.
31
Overview of Financial Results
The following table provides an overview of some of our financial results (in thousands, except percentages):
Fiscal Year Ended | |||||||||||
October 31, 2015 | November 1, 2014 | October 26, 2013 | |||||||||
Total net revenues | $ | 2,263,460 | $ | 2,211,267 | $ | 2,222,864 | |||||
Gross margin | $ | 1,528,073 | $ | 1,465,793 | $ | 1,408,879 | |||||
Gross margin, as a percentage of total net revenues | 67.5 | % | 66.3 | % | 63.4 | % | |||||
Income from operations | $ | 492,680 | $ | 386,112 | $ | 308,483 | |||||
Operating income, as a percentage of total net revenues | 21.8 | % | 17.5 | % | 13.9 | % | |||||
Net income | $ | 340,362 | $ | 237,971 | $ | 208,623 | |||||
Results of Operations
We report our fiscal year on a 52- or 53-week period ending on the last Saturday in October or the first Saturday in November, respectively. As is customary for companies that use the 52/53-week convention, every fifth year is a 53-week year. Fiscal year 2015 is a 52-week fiscal year, fiscal year 2014 was a 53-week fiscal year, and fiscal year 2013 was a 52-week fiscal year. Our next 53-week fiscal year will be fiscal year 2019 and our next 14-week quarter will be the second quarter of fiscal year 2019.
Our results of operations for the fiscal years ended October 31, 2015, November 1, 2014, and October 26, 2013, are reported in this discussion and analysis as a percentage of total net revenues, except for gross margin with respect to each reportable segment, which is indicated as a percentage of the respective reportable segment net revenues.
Revenues. Our revenues are derived primarily from sales of our SAN and IP Networking products and support and services related to these products, which we call Global Services.
Our total net revenues are summarized as follows (in thousands, except percentages):
Fiscal Year Ended | ||||||||||||||||||||
October 31, 2015 | November 1, 2014 | |||||||||||||||||||
Net Revenues | % of Net Revenues | Net Revenues | % of Net Revenues | Increase/(Decrease) | % Change | |||||||||||||||
SAN Products | $ | 1,301,231 | 57.5 | % | $ | 1,326,950 | 60.0 | % | $ | (25,719 | ) | (1.9 | )% | |||||||
IP Networking Products | 601,170 | 26.5 | % | 525,237 | 23.8 | % | 75,933 | 14.5 | % | |||||||||||
Global Services | 361,059 | 16.0 | % | 359,080 | 16.2 | % | 1,979 | 0.6 | % | |||||||||||
Total net revenues | $ | 2,263,460 | 100.0 | % | $ | 2,211,267 | 100.0 | % | $ | 52,193 | 2.4 | % | ||||||||
Fiscal Year Ended | ||||||||||||||||||||
November 1, 2014 | October 26, 2013 | |||||||||||||||||||
Net Revenues | % of Net Revenues | Net Revenues | % of Net Revenues | Increase/(Decrease) | % Change | |||||||||||||||
SAN Products | $ | 1,326,950 | 60.0 | % | $ | 1,318,509 | 59.3 | % | $ | 8,441 | 0.6 | % | ||||||||
IP Networking Products | 525,237 | 23.8 | % | 552,058 | 24.8 | % | (26,821 | ) | (4.9 | )% | ||||||||||
Global Services | 359,080 | 16.2 | % | 352,297 | 15.8 | % | 6,783 | 1.9 | % | |||||||||||
Total net revenues | $ | 2,211,267 | 100.0 | % | $ | 2,222,864 | 100.0 | % | $ | (11,597 | ) | (0.5 | )% | |||||||
32
The increase in total net revenues for the fiscal year ended October 31, 2015, compared with the fiscal year ended November 1, 2014, reflects higher sales for our IP Networking products and Global Services offerings, partially offset by lower sales for our SAN products, as further described below.
• | The decrease in SAN product revenues was caused by a decrease in embedded and fixed-configuration switch product revenues, primarily due to the increased throughput and efficiency of our latest generation of products, which allow customers to transmit significantly more data through the same number of ports, and operational issues at certain OEM partners, partially offset by an increase in director product revenues. The number of ports shipped decreased by 8.8% during the fiscal year ended October 31, 2015, due to the decrease in embedded and fixed-configuration switch sales, the effect of which was partially offset by a 7.5% increase in the average selling price per port during the same period due to a shift in product mix towards more feature-rich director products; |
• | The increase in IP Networking product revenues primarily reflects higher revenues from our data center routing and switching products, campus products, and software networking products, partially offset by a decrease in revenues as a result of the previously announced changes in our Brocade ADX and wireless business strategies and the divestiture of our network adapter business (converged network adapters) in January 2014. Data center routing product revenues increased primarily due to strong demand for our newest MLXe modules that we began shipping in the fourth quarter of fiscal year 2014. Data center switching product revenues increased as a result of strong fixed and modular Brocade VDX sales into data center deployments. Campus product revenues increased due to strong U.S. federal sales and the government program for funding schools and libraries, commonly known as E-Rate, generating increased revenue. Software networking revenues increased due to the vADC software product line acquired in March 2015 and increased usage of our virtual routers by cloud service providers. Data center revenues from IP Networking products accounted for an estimated 57.0% of total IP Networking product revenues for both the fiscal years ended October 31, 2015, and November 1, 2014; and |
• | The increase in Global Services revenues was primarily due to an increase in new and renewal support contracts for our IP Networking products, as well as an increase in support contracts related to our vADC software product line acquired in March 2015. This increase was partially offset by one less fiscal week of amortized support revenue in fiscal year 2015 compared with fiscal year 2014, which was a 53-week fiscal year, and a decrease in new and renewal support contracts with certain OEMs for our SAN products. |
The decrease in total net revenues for the fiscal year ended November 1, 2014, compared with the fiscal year ended October 26, 2013, reflects lower sales for our IP Networking products, partially offset by higher sales for our SAN products and Global Services offerings, as further described below.
• | The slight increase in SAN product revenues was due to continued customer migration to our Gen 5 Fibre Channel products which resulted in an increase in switch product revenue, partially offset by a decrease in server product revenue due to the divestiture of our network adapter business (host bus adapters) in January 2014. Our average selling price per port decreased slightly by 0.5% during the fiscal year ended November 1, 2014, which was partially offset by the 1.1% increase in the number of ports shipped during the same period; |
• | The decrease in IP Networking product revenues primarily reflects lower revenues from IP routing, lower U.S. federal sales, the divestiture of our network adapter business (converged network adapters) in January 2014, and changes in our Brocade ADX product line and wireless business strategies. IP routing product revenue decreased due to a loss in some orders from large network carrier customers as a result of the delayed fulfillment of the newest MLXe modules that were released in the fourth quarter of fiscal year 2014. The decrease was partially offset by an increase in our switch products for data center customers due to strong Brocade VDX sales; and |
• | The increase in Global Services revenues was primarily attributable to an additional week of amortized support revenue in fiscal year 2014, and an increase in the revenue recognized from sales of renewal support contracts for both our SAN and IP Networking products, partially offset by a decrease in professional services revenues. |
33
Our total net revenues by geographic area are summarized as follows (in thousands, except percentages):
Fiscal Year Ended | ||||||||||||||||||||
October 31, 2015 | November 1, 2014 | |||||||||||||||||||
Net Revenues | % of Net Revenues | Net Revenues | % of Net Revenues | Increase/(Decrease) | % Change | |||||||||||||||
United States | $ | 1,275,056 | 56.3 | % | $ | 1,286,650 | 58.2 | % | $ | (11,594 | ) | (0.9 | )% | |||||||
Europe, the Middle East and Africa (1) | 610,133 | 27.0 | % | 598,196 | 27.0 | % | 11,937 | 2.0 | % | |||||||||||
Asia Pacific | 229,903 | 10.2 | % | 183,035 | 8.3 | % | 46,868 | 25.6 | % | |||||||||||
Japan | 93,470 | 4.1 | % | 91,062 | 4.1 | % | 2,408 | 2.6 | % | |||||||||||
Canada, Central and South America | 54,898 | 2.4 | % | 52,324 | 2.4 | % | 2,574 | 4.9 | % | |||||||||||
Total net revenues | $ | 2,263,460 | 100.0 | % | $ | 2,211,267 | 100.0 | % | $ | 52,193 | 2.4 | % | ||||||||
Fiscal Year Ended | ||||||||||||||||||||
November 1, 2014 | October 26, 2013 | |||||||||||||||||||
Net Revenues | % of Net Revenues | Net Revenues | % of Net Revenues | Increase/(Decrease) | % Change | |||||||||||||||
United States | $ | 1,286,650 | 58.2 | % | $ | 1,351,242 | 60.8 | % | $ | (64,592 | ) | (4.8 | )% | |||||||
Europe, the Middle East and Africa (1) | 598,196 | 27.0 | % | 552,734 | 24.9 | % | 45,462 | 8.2 | % | |||||||||||
Asia Pacific | 183,035 | 8.3 | % | 181,461 | 8.2 | % | 1,574 | 0.9 | % | |||||||||||
Japan | 91,062 | 4.1 | % | 97,259 | 4.4 | % | (6,197 | ) | (6.4 | )% | ||||||||||
Canada, Central and South America | 52,324 | 2.4 | % | 40,168 | 1.8 | % | 12,156 | 30.3 | % | |||||||||||
Total net revenues | $ | 2,211,267 | 100.0 | % | $ | 2,222,864 | 100.0 | % | $ | (11,597 | ) | (0.5 | )% | |||||||
(1) | Includes net revenues of $400.0 million, $385.2 million, and $339.1 million for the fiscal years ended October 31, 2015, November 1, 2014, and October 26, 2013, respectively, relating to the Netherlands. |
Revenues are attributed to geographic areas based on where our products are shipped. However, certain OEM partners take possession of our products domestically and then distribute these products to their international customers. Because we account for all of those OEM revenues as domestic revenues, we cannot be certain of the extent to which our domestic and international revenue mix is impacted by the logistics practices of our OEM partners, but the end-user location data that is available does indicate that international revenues comprise a larger percentage of our total net revenues than the attributed revenues above indicate.
International revenues for the fiscal year ended October 31, 2015, increased to 43.7% as a percentage of total net revenues compared with the 41.8% for the prior year, primarily due to a shift in customer mix for our SAN and IP Networking products. International revenues for the fiscal year ended November 1, 2014, increased to 41.8% as a percentage of total net revenues compared with the 39.2% for the prior year, primarily due to lower revenue from SAN and IP Networking products sold into the U.S. federal market, as well as an increase in revenue from SAN products sold into the Europe, Middle East, and Africa regions.
A significant portion of our revenues are concentrated among a relatively small number of OEM customers. For the fiscal years ended October 31, 2015, November 1, 2014, and October 26, 2013, the same three customers individually accounted for 10% or more of our total net revenues for a combined total of 41% (EMC Corporation (“EMC”) with 17%, Hewlett Packard Enterprise Company (“HPE”) with 12%, and International Business Machines Corporation (“IBM”) with 12%), 46% (EMC with 18%, HPE with 12%, and IBM with 16%), and 46% (EMC with 18%, HPE with 12%, and IBM with 16%), respectively, of total net revenues. We expect that a significant portion of our future revenues will continue to come from sales of products to a relatively small number of OEM partners and to the U.S. federal government and its individual agencies through our distributors and resellers. Therefore, the loss of, or significant decrease in the level of sales to, or a change in the ordering pattern of any one of these customers could seriously harm our financial condition and results of operations.
34
Gross margin. Gross margin as stated below is indicated as a percentage of the respective reportable segment net revenues, except for total gross margin, which is stated as a percentage of total net revenues.
Gross margin is summarized as follows (in thousands, except percentages):
Fiscal Year Ended | ||||||||||||||||||||
October 31, 2015 | November 1, 2014 | |||||||||||||||||||
Gross Margin | % of Net Revenues | Gross Margin | % of Net Revenues | Increase | % Points Change | |||||||||||||||
SAN Products | $ | 989,350 | 76.0 | % | $ | 982,484 | 74.0 | % | $ | 6,866 | 2.0 | % | ||||||||
IP Networking Products | 325,536 | 54.2 | % | 277,262 | 52.8 | % | 48,274 | 1.4 | % | |||||||||||
Global Services | 213,187 | 59.0 | % | 206,047 | 57.4 | % | 7,140 | 1.6 | % | |||||||||||
Total gross margin | $ | 1,528,073 | 67.5 | % | $ | 1,465,793 | 66.3 | % | $ | 62,280 | 1.2 | % | ||||||||
Fiscal Year Ended | ||||||||||||||||||||
November 1, 2014 | October 26, 2013 | |||||||||||||||||||
Gross Margin | % of Net Revenues | Gross Margin | % of Net Revenues | Increase | % Points Change | |||||||||||||||
SAN Products | $ | 982,484 | 74.0 | % | $ | 963,121 | 73.0 | % | $ | 19,363 | 1.0 | % | ||||||||
IP Networking Products | 277,262 | 52.8 | % | 249,084 | 45.1 | % | 28,178 | 7.7 | % | |||||||||||
Global Services | 206,047 | 57.4 | % | 196,674 | 55.8 | % | 9,373 | 1.6 | % | |||||||||||
Total gross margin | $ | 1,465,793 | 66.3 | % | $ | 1,408,879 | 63.4 | % | $ | 56,914 | 2.9 | % | ||||||||
The gross margin percentage for each reportable segment increased for the fiscal year ended October 31, 2015, compared with the fiscal year ended November 1, 2014, primarily due to the following factors (the percentages below reflect the impact on gross margin):
• | SAN gross margins relative to net revenues increased 0.9% primarily from product cost reductions, as well as a more favorable mix of SAN products as the mix shifted towards director products, which, being more feature-rich, carry a higher product margin than embedded switch products. In addition, SAN gross margins increased 0.6% relative to net revenues due to lower manufacturing overhead spending, including one less fiscal week of payroll expense and lower variable incentive compensation, in fiscal year 2015. SAN gross margins also increased 0.1% relative to net revenues due to a one-time benefit resulting from the favorable use of manufacturing factory capacity, as well as lower excess and obsolete inventory charges during fiscal year 2015; |
• | IP Networking gross margins relative to net revenues increased 0.8% primarily due to lower excess and obsolete inventory charges and favorable supplier pricing. In addition, IP Networking gross margins increased 0.4% relative to net revenues due to lower manufacturing overhead spending, including one less fiscal week of payroll expense, lower variable incentive compensation, and lower factory set-up expenses, in fiscal year 2015. IP Networking gross margins also increased 0.3% relative to net revenues due to a decrease in amortization of IP Networking-related intangible assets, as most of these assets were acquired as part of the acquisition of Foundry Networks, LLC (“Foundry”) and were fully amortized during the first quarter of fiscal year 2014. The increases in IP Networking gross margins were partially offset by a 0.2% decrease relative to net revenues due to increased discounting on products sold in fiscal year 2015; and |
• | Global Services gross margins relative to net revenues increased primarily due to lower variable incentive compensation, partially offset by higher salaries and other compensation due to increased headcount to support our customer installed base. |
The gross margin percentage for each reportable segment increased for the fiscal year ended November 1, 2014, compared with the fiscal year ended October 26, 2013, primarily due to the following factors (the percentages below reflect the impact on gross margin):
• | SAN gross margins relative to net revenues increased by 1.0% due to a decrease in manufacturing overhead costs primarily due to lower headcount and lower outside services spending as part of the spending reduction plan that we implemented at the end of fiscal year 2013, partially offset by an increase in variable incentive compensation and an additional week of payroll expense in fiscal year 2014; |
35
• | IP Networking gross margins relative to net revenues increased by 5.5% due to a decrease in amortization of IP Networking-related intangible assets. These intangible assets were primarily acquired as part of the acquisition of Foundry and were fully amortized during the first quarter of fiscal year 2014. In addition, product costs decreased 0.9%, relative to net revenues, primarily as a result of a more favorable mix of IP Networking products. We also incurred costs associated with certain Foundry pre-acquisition litigation in fiscal year 2013, which caused a 0.6% decrease in costs in fiscal year 2014, relative to net revenues; and |
• | Global Services gross margins relative to net revenues increased primarily due to higher product sales volume, as well as the spending reduction plan that we implemented at the end of fiscal year 2013 which resulted in lower headcount, lower outside services spending, and reduced legal, IT, and facilities expenses allocated to Global Services. The decrease in outside services spending was also due to lower labor repair rates negotiated with our contract manufacturer. The increase was partially offset by an increase in variable incentive compensation. |
Research and development expenses. Research and development (“R&D”) expenses consist primarily of compensation and related expenses for personnel engaged in engineering and R&D activities, fees paid to consultants and outside service providers, engineering expenses, which primarily consist of nonrecurring engineering charges and prototyping expenses related to the design, development, testing, and enhancement of our products, depreciation related to engineering and test equipment, and allocated expenses related to legal, IT, facilities, and other shared functions.
R&D expenses are summarized as follows (in thousands, except percentages):
Fiscal Year Ended | ||||||||||||||||||||
October 31, 2015 | November 1, 2014 | |||||||||||||||||||
Expense | % of Net Revenues | Expense | % of Net Revenues | Increase | % Change | |||||||||||||||
R&D expenses | $ | 356,720 | 15.8 | % | $ | 345,549 | 15.6 | % | $ | 11,171 | 3.2 | % | ||||||||
Fiscal Year Ended | ||||||||||||||||||||
November 1, 2014 | October 26, 2013 | |||||||||||||||||||
Expense | % of Net Revenues | Expense | % of Net Revenues | Decrease | % Change | |||||||||||||||
R&D expenses | $ | 345,549 | 15.6 | % | $ | 378,521 | 17.0 | % | $ | (32,972 | ) | (8.7 | )% | |||||||
R&D expenses increased for the fiscal year ended October 31, 2015, compared with the fiscal year ended November 1, 2014, due to the following (in thousands):
Increase/(Decrease) | |||
Salaries and other compensation | $ | 7,907 | |
Outside services expense | 2,667 | ||
Facility expense | 2,631 | ||
Engineering expense | 1,485 | ||
Various individually insignificant items | 1,133 | ||
The increase in R&D expenses was partially offset by a decrease in: | |||
Depreciation and amortization expense | (4,652 | ) | |
Total change | $ | 11,171 | |
Salaries and other compensation increased primarily as a result of the growth in our engineering personnel due to the expanded focus on our software product lines, increases in salaries, and an increase in the cost of employment-related benefits, partially offset by lower variable incentive compensation and one less fiscal week of payroll expense in fiscal year 2015. Outside services expense increased primarily due to an increase in outside engineering services to support the development of our expanded software product lines. Facility expense increased primarily due to increased rent and relocation costs related to the headcount growth in the United Kingdom and the opening of our new development center in India in April 2015. Engineering expense increased primarily due to higher prototype costs as we near the release of our next generation of SAN products. Depreciation and amortization expense decreased primarily due to lower capital spending in fiscal years 2013 and 2014.
36
R&D expenses decreased for the fiscal year ended November 1, 2014, compared with the fiscal year ended October 26, 2013, due to the following (in thousands):
Decrease | |||
Engineering expense | $ | (9,378 | ) |
Salaries and other compensation | (8,019 | ) | |
Expenses related to legal, IT, facilities, and other shared functions | (5,860 | ) | |
Depreciation and amortization expense | (4,761 | ) | |
Outside services expense | (3,549 | ) | |
Various individually insignificant items | (1,405 | ) | |
Total change | $ | (32,972 | ) |
The decrease in R&D expenses was primarily driven by the spending reduction plan that we implemented at the end of fiscal year 2013. As a result, engineering expense decreased primarily due to lower nonrecurring engineering spending related to new product development and lower prototype costs. Salaries and other compensation decreased primarily due to lower engineering headcount, partially offset by an increase in variable incentive compensation and an additional week of payroll expense in fiscal year 2014. Expenses related to legal, IT, facilities, and other shared functions allocated to R&D activities decreased overall primarily due to decreased costs with respect to IT-related projects and IT personnel, and lower facilities costs, as well as due to lower overall legal expenses resulting from the settlement of litigation matters during fiscal year 2013. In addition, depreciation and amortization expense decreased primarily due to lower capital spending in fiscal years 2013 and 2014. Outside services expense decreased primarily due to a reduction in use of outside engineering services and decreased support expenses for our engineering laboratories.
Sales and marketing expenses. Sales and marketing expenses consist primarily of salaries, commissions, and related expenses for personnel engaged in sales and marketing functions, costs associated with promotional and marketing programs, travel and entertainment expenses, and allocated expenses related to legal, IT, facilities, and other shared functions.
Sales and marketing expenses are summarized as follows (in thousands, except percentages):
Fiscal Year Ended | ||||||||||||||||||||
October 31, 2015 | November 1, 2014 | |||||||||||||||||||
Expense | % of Net Revenues | Expense | % of Net Revenues | Increase | % Change | |||||||||||||||
Sales and marketing expenses | $ | 585,230 | 25.9 | % | $ | 554,515 | 25.1 | % | $ | 30,715 | 5.5 | % | ||||||||
Fiscal Year Ended | ||||||||||||||||||||
November 1, 2014 | October 26, 2013 | |||||||||||||||||||
Expense | % of Net Revenues | Expense | % of Net Revenues | Decrease | % Change | |||||||||||||||
Sales and marketing expenses | $ | 554,515 | 25.1 | % | $ | 567,637 | 25.5 | % | $ | (13,122 | ) | (2.3 | )% | |||||||
37
Sales and marketing expenses increased for the fiscal year ended October 31, 2015, compared with the fiscal year ended November 1, 2014, due to the following (in thousands):
Increase | |||
Salaries and other compensation | $ | 18,172 | |
Stock-based compensation expense | 6,689 | ||
Outside services and other marketing expense | 2,213 | ||
Depreciation and amortization expense | 2,146 | ||
Expenses related to legal, IT, facilities, and other shared functions | 1,387 | ||
Various individually insignificant items | 108 | ||
Total change | $ | 30,715 | |
Salaries and other compensation increased primarily as a result of increased headcount to support and grow our software networking revenue, including the acquired vADC software product line, increases in salaries, and an increase in the cost of employment-related benefits, partially offset by lower variable incentive compensation and one less fiscal week of payroll expense in fiscal year 2015. Stock-based compensation expense increased primarily due to higher grant date per-unit fair values of restricted stock units, including restricted stock units with market conditions (“MSUs”), granted to employees in recent quarters and an increase in employee stock purchase plan expense. Outside services and other marketing expense increased primarily due to expansion of partners’ sales incentives and marketing programs, including increased commitment to our annual sales and marketing “kick-off” meeting. Depreciation and amortization expense increased primarily due to an increase in expenses related to demonstration equipment used in our customer certification and proof of concept programs. Expenses related to legal, IT, facilities, and other shared functions allocated to sales and marketing activities increased primarily due to increased overall costs with respect to consulting and other outsourced services.
Sales and marketing expenses decreased for the fiscal year ended November 1, 2014, compared with the fiscal year ended October 26, 2013, due to the following (in thousands):
Increase/(Decrease) | |||
Expenses related to legal, IT, facilities, and other shared functions | $ | (20,587 | ) |
The decrease in sales and marketing expenses was partially offset by increases in: | |||
Salaries and other compensation | 3,687 | ||
Stock-based compensation expense | 2,225 | ||
Outside services and other marketing expense | 1,131 | ||
Various individually insignificant items | 422 | ||
Total change | $ | (13,122 | ) |
Expenses related to legal, IT, facilities, and other shared functions allocated to sales and marketing activities decreased overall primarily due to decreased costs with respect to IT-related projects and IT personnel, and lower facilities costs, as part of the spending reduction plan that we implemented at the end of fiscal year 2013, as well as lower overall legal expenses resulting from the settlement of litigation matters during fiscal year 2013. Salaries and other compensation increased primarily due to an increase in variable incentive compensation and an additional week of payroll expense in fiscal year 2014, partially offset by decreased headcount. In addition, stock-based compensation expense increased primarily due to an increase in the grant date per-unit fair values of restricted stock units granted to employees in recent quarters as a result of our higher stock price, as well as more MSU grants in fiscal year 2014 (see Note 12, “Stock-Based Compensation,” of the Notes to Consolidated Financial Statements). Outside services and other marketing expense also increased primarily due to the build out of our digital marketing platform and sales force training delivered during fiscal year 2014 and increased expenses for advertising, partially offset by lower spending on other marketing, conferences, and trade shows in fiscal year 2014.
38
General and administrative expenses. General and administrative (“G&A”) expenses consist primarily of compensation and related expenses for corporate management, finance and accounting, human resources, legal, IT, facilities, and investor relations, as well as recruiting expenses, professional fees, and other corporate expenses, less certain expenses allocated to cost of revenue, R&D, and sales and marketing.
G&A expenses are summarized as follows (in thousands, except percentages):
Fiscal Year Ended | ||||||||||||||||||||
October 31, 2015 | November 1, 2014 | |||||||||||||||||||
Expense | % of Net Revenues | Expense | % of Net Revenues | Increase | % Change | |||||||||||||||
G&A expenses | $ | 87,623 | 3.9 | % | $ | 84,941 | 3.8 | % | $ | 2,682 | 3.2 | % | ||||||||
Fiscal Year Ended | ||||||||||||||||||||
November 1, 2014 | October 26, 2013 | |||||||||||||||||||
Expense | % of Net Revenues | Expense | % of Net Revenues | Increase | % Change | |||||||||||||||
G&A expenses | $ | 84,941 | 3.8 | % | $ | 74,518 | 3.4 | % | $ | 10,423 | 14.0 | % | ||||||||
G&A expenses increased for the fiscal year ended October 31, 2015, compared with the fiscal year ended November 1, 2014, due to the following (in thousands):
Increase | |||
Outside services and other expense | $ | 1,934 | |
Various individually insignificant items | 748 | ||
Total change | $ | 2,682 | |
Outside services and other expense increased primarily due to increased spending to support our expanded software product lines and higher legal expenses primarily related to the two acquisitions completed in the second quarter of fiscal year 2015.
G&A expenses increased for the fiscal year ended November 1, 2014, compared with the fiscal year ended October 26, 2013, due to the following (in thousands):
Increase/(Decrease) | |||
Stock-based compensation expense | $ | 7,501 | |
Salaries and other compensation | 4,377 | ||
Various individually insignificant items | 438 | ||
The increase in G&A expenses was partially offset by a decrease in: | |||
Depreciation and amortization expense | (1,893 | ) | |
Total change | $ | 10,423 | |
Stock-based compensation expense increased primarily due to an increase in the grant date per-unit fair values of restricted stock units granted to employees in recent quarters as a result of our higher stock price, as well as more MSU grants made in fiscal year 2014 (see Note 12, “Stock-Based Compensation,” of the Notes to Consolidated Financial Statements). Salaries and other compensation increased primarily due to an increase in variable incentive compensation and an additional week of payroll expense in fiscal year 2014. Depreciation and amortization expense decreased primarily due to a decrease in capital spending as part of the spending reduction plan that we implemented at the end of fiscal year 2013.
39
Amortization of intangible assets. Amortization of intangible assets is summarized as follows (in thousands, except percentages):
Fiscal Year Ended | ||||||||||||||||||||
October 31, 2015 | November 1, 2014 | |||||||||||||||||||
Expense | % of Net Revenues | Expense | % of Net Revenues | Decrease | % Change | |||||||||||||||
Amortization of intangible assets | $ | 2,556 | 0.1 | % | $ | 10,280 | 0.5 | % | $ | (7,724 | ) | (75.1 | )% | |||||||
Fiscal Year Ended | ||||||||||||||||||||
November 1, 2014 | October 26, 2013 | |||||||||||||||||||
Expense | % of Net Revenues | Expense | % of Net Revenues | Decrease | % Change | |||||||||||||||
Amortization of intangible assets | $ | 10,280 | 0.5 | % | $ | 54,256 | 2.4 | % | $ | (43,976 | ) | (81.1 | )% | |||||||
The decrease in amortization of intangible assets for the fiscal year ended October 31, 2015, compared with the fiscal year ended November 1, 2014, as well as for the fiscal year ended November 1, 2014, compared with the fiscal year ended October 26, 2013, was primarily due to the completion of amortization of certain of our intangible assets in connection with our acquisitions of Foundry and McDATA Corporation (“McDATA”), partially offset by additional amortization of intangible assets in connection with our acquisitions completed in the fourth fiscal quarter of 2014 and in the second fiscal quarter of 2015 (see Note 4, “Goodwill and Intangible Assets,” of the Notes to Consolidated Financial Statements).
Acquisition and integration costs. During fiscal year 2015, we recorded $3.9 million in acquisition and integration costs primarily for consulting services and other professional fees in connection with our two acquisitions that we completed in the second fiscal quarter of 2015 (see Note 3, “Acquisitions and Divestitures,” of the Notes to Consolidated Financial Statements). We had no similar costs during fiscal years 2014 and 2013.
Restructuring, goodwill impairment, and other related costs (benefits). Restructuring, goodwill impairment, and other related costs (benefits) are summarized as follows (in thousands, except percentages):
Fiscal Year Ended | ||||||||||||||||||||
October 31, 2015 | November 1, 2014 | |||||||||||||||||||
Benefit | % of Net Revenues | Expense | % of Net Revenues | Decrease | % Change | |||||||||||||||
Restructuring, goodwill impairment, and other related costs (benefits) | $ | (678 | ) | 0.1 | % | $ | 89,280 | 4.0 | % | $ | (89,958 | ) | (100.8 | )% | ||||||
Fiscal Year Ended | ||||||||||||||||||||
November 1, 2014 | October 26, 2013 | |||||||||||||||||||
Expense | % of Net Revenues | Recovery | % of Net Revenues | Increase | % Change | |||||||||||||||
Restructuring, goodwill impairment, and other related costs | $ | 89,280 | 4.0 | % | $ | 25,464 | 1.1 | % | $ | 63,816 | 250.6 | % | ||||||||
In the second quarter of fiscal year 2014, we made a strategic decision to reduce our investment in our hardware-based application delivery controller product line and to increase investment in our software-based application delivery controller product line. As a result of this change in strategy, our hardware-based Brocade ADX revenue forecast decreased, which resulted in an $83.4 million goodwill impairment charge in the second quarter of fiscal year 2014. Our hardware-based Brocade ADX and related support revenue decreased by approximately $20 million in fiscal year 2014 compared with fiscal year 2013, and decreased by approximately $2 million in fiscal year 2015 compared with fiscal year 2014.
In May 2013, we announced that we were making certain changes in our strategic direction by focusing on certain key technology segments for the data center, such as our SAN fabrics, Ethernet fabrics, and software networking products. As a result, during the fiscal year ended October 26, 2013, we restructured certain business operations, reorganized certain business units, and reduced our operating expense structure. In connection with this restructuring plan, we incurred restructuring charges and other costs primarily related to severance and benefits charges and lease loss reserve and related costs beginning in the fourth quarter of fiscal year 2013. We substantially completed the restructuring plan by the end of the first quarter of fiscal year 2014.
40
Restructuring, goodwill impairment, and other related costs for the fiscal year ended November 1, 2014, were primarily due to the $83.4 million in goodwill impairment and $7.7 million in estimated lease loss reserve and related costs recorded during the fiscal year ended November 1, 2014, partially offset by a $1.8 million reduction in expense for severance and benefits due to actual cash payments made during the fiscal year ended November 1, 2014, being lower than originally estimated. Restructuring and other related costs for the fiscal year ended October 26, 2013, were primarily due to $20.4 million of severance and benefits related to a reduction in workforce, $4.0 million related to contract terminations and other charges, and $1.1 million related to estimated lease loss reserve and related costs recorded during the fiscal year ended October 26, 2013 (see Note 5, “Restructuring and Other Related Costs,” of the Notes to Consolidated Financial Statements).
We did not incur any restructuring costs for fiscal year 2015. In addition, benefits recorded in fiscal year 2015 were due to favorable changes in expected sublease terms and other related assumptions for estimated facilities lease losses.
Gain on sale of network adapter business. During fiscal year 2014, we recorded a gain of $4.9 million in connection with the sale of our network adapter business (see Note 3, “Acquisitions and Divestitures,” of the Notes to Consolidated Financial Statements). We had no similar divestitures during fiscal years 2015 or 2013.
Interest income. Interest income was immaterial for the fiscal years ended October 31, 2015, November 1, 2014, and October 26, 2013.
Other income, net. Other income, net, is summarized as follows (in thousands, except percentages):
Fiscal Year Ended | ||||||||||||||||||||
October 31, 2015 | November 1, 2014 | |||||||||||||||||||
Income | % of Net Revenues | Income | % of Net Revenues | Decrease | % Change | |||||||||||||||
Other income, net | $ | 95 | — | % | $ | 3,601 | 0.2 | % | $ | (3,506 | ) | (97.4 | )% | |||||||
Fiscal Year Ended | ||||||||||||||||||||
November 1, 2014 | October 26, 2013 | |||||||||||||||||||
Income | % of Net Revenues | Income | % of Net Revenues | Decrease | % Change | |||||||||||||||
Other income, net | $ | 3,601 | 0.2 | % | $ | 75,835 | 3.4 | % | $ | (72,234 | ) | (95.3 | )% | |||||||
Other income, net, for the fiscal year ended November 1, 2014, was primarily related to the gain of $5.3 million resulting from the sale of certain non-marketable equity investments, partially offset by the loss on the sale of certain property and equipment during fiscal year 2014. Other income, net, was not significant for the fiscal year ended October 31, 2015.
The decrease in other income, net, for the fiscal year ended November 1, 2014, compared with the fiscal year ended October 26, 2013, was primarily due to a nonrecurring gain of $76.8 million in the fiscal year ended October 26, 2013, resulting from the litigation settlement with A10 Networks, Inc. (“A10”) (additionally, see Note 14, “Other Income, Net” of the Notes to Consolidated Financial Statements).
Interest expense. Interest expense primarily represents the interest cost associated with our senior secured notes, senior unsecured notes, and convertible senior unsecured notes (see Note 8, “Borrowings,” of the Notes to Consolidated Financial Statements). Interest expense is summarized as follows (in thousands, except percentages):
Fiscal Year Ended | ||||||||||||||||||||
October 31, 2015 | November 1, 2014 | |||||||||||||||||||
Expense | % of Net Revenues | Expense | % of Net Revenues | Increase | % Change | |||||||||||||||
Interest expense | $ | (55,578 | ) | (2.5 | )% | $ | (36,757 | ) | (1.7 | )% | $ | (18,821 | ) | 51.2 | % | |||||
Fiscal Year Ended | ||||||||||||||||||||
November 1, 2014 | October 26, 2013 | |||||||||||||||||||
Expense | % of Net Revenues | Expense | % of Net Revenues | Decrease | % Change | |||||||||||||||
Interest expense | $ | (36,757 | ) | (1.7 | )% | $ | (55,261 | ) | (2.5 | )% | $ | 18,504 | (33.5 | )% | ||||||
41
In January 2015, we issued $575.0 million in aggregate principal amount of 1.375% convertible senior notes due 2020 in a private placement. The proceeds from this offering were used to redeem all of the outstanding 2020 Notes, which had a higher interest rate, and for general corporate purposes. We recorded an expense of $15.1 million in the first quarter of fiscal year 2015 for the call premium, debt issuance costs, and original issue discount relating to the redemption of our 2020 Notes, thereby resulting in an increase in interest expense for the fiscal year ended October 31, 2015, compared with the fiscal year ended November 1, 2014. Interest expense also increased for the fiscal year ended October 31, 2015, compared with the fiscal year ended November 1, 2014, due to the non-cash interest expense related to the debt discount recorded for the conversion feature of the 2020 Convertible Notes. This increase in interest expense for the fiscal year ended October 31, 2015, was partially offset by the lower interest rate of 1.375% for the 2020 Convertible Notes compared to 6.875% for the 2020 Notes.
Interest expense decreased for the fiscal year ended November 1, 2014, compared with the fiscal year ended October 26, 2013, primarily due to the $15.3 million expense that we recorded in the first quarter of fiscal year 2013, for the call premium, debt issuance costs, and original issue discount relating to the redemption of our 6.625% senior secured notes due 2018 (the “2018 Notes”). The decrease in interest expense was also due to the refinancing of the 2018 Notes at a lower interest rate in fiscal year 2013. In January 2013, we issued $300.0 million in aggregate principal amount of 4.625% Senior Notes due 2023 (the “2023 Notes”) in a private placement. The proceeds from this offering, together with cash on hand, were used on February 21, 2013, to redeem all of the outstanding 2018 Notes, which had a higher interest rate.
These transactions are described further below in “Liquidity and Capital Resources.”
Income tax expense. Income tax expense and the effective tax rates are summarized as follows (in thousands, except effective tax rates):
Fiscal Year Ended | |||||||||||
October 31, 2015 | November 1, 2014 | October 26, 2013 | |||||||||
Income tax expense | $ | 98,689 | $ | 115,650 | $ | 121,838 | |||||
Effective tax rate | 22.5 | % | 32.7 | % | 36.9 | % | |||||
In general, our provision for income taxes differs from the tax computed at the U.S. federal statutory tax rate due to state taxes, the effect of non-U.S. operations being taxed at rates lower than the U.S. federal statutory tax rate, nondeductible stock-based compensation expense, tax credits, and adjustments to unrecognized tax benefits. Earnings of our subsidiaries outside of the U.S. primarily relate to our European and Asia Pacific businesses.
The effective tax rate in fiscal year 2015 was lower than the U.S. federal statutory tax rate of 35% primarily due to the effects of earnings in foreign jurisdictions being taxed at rates lower than the U.S. federal statutory tax rate, a benefit from a qualified domestic manufacturing deduction, and a benefit from the federal research and development tax credit that was reinstated on December 19, 2014, and made retroactive for calendar year 2014.
The effective tax rate in fiscal year 2014 was lower than the U.S. federal statutory tax rate of 35% primarily due to the effects of earnings in foreign jurisdictions being taxed at rates lower than the U.S. federal statutory tax rate and a benefit from the release of tax reserves due to expired statutes of limitations. In addition, the effective tax rate for fiscal year 2014 was negatively impacted by a goodwill impairment charge of $83.4 million, which is nondeductible for tax purposes, and a lower benefit from the federal research and development tax credit which expired on December 31, 2013, and, therefore, was not applicable in calendar year 2014.
The effective tax rate in fiscal year 2013 was higher than the U.S. federal statutory tax rate of 35% primarily due to a detriment from reducing previously recognized California deferred tax assets as a result of a change in California tax law, partially offset by discrete benefits from reserve releases resulting from audit settlements and expiring statutes of limitations, and an increase in the federal research and development tax credit that was reinstated on January 2, 2013, for two years, and made retroactive to January 1, 2012.
Our effective tax rate for fiscal year 2015 is lower compared with fiscal years 2014 and 2013 primarily due to the goodwill impairment charge of $83.4 million recorded in fiscal year 2014, which is nondeductible for tax purposes, and a discrete charge of $78.2 million to reduce previously recognized California deferred tax assets due to changes in California law resulting from the passage of Proposition 39 during fiscal year 2013, respectively.
42
Our income tax provision could change as a result of many factors, including the effects of changing tax laws and regulations or changes to the mix of IP Networking versus SAN products, which have different gross margins, and changes to the mix of domestic versus international profits. Many of these factors are largely impacted by the buying behavior of our OEM and channel partners. As estimates and judgments are used to project such domestic and international earnings, the impact to our tax provision could vary if the current planning or assumptions change. In addition, we do not forecast discrete events, such as settlement of tax audits with governmental authorities, due to their inherent uncertainty. Such settlements have in the past, and could in the future, materially impact our tax expense. Given that the tax rate is affected by many different factors, it is not possible to estimate our future tax rate with a high degree of certainty.
The Internal Revenue Service (“IRS”) and other tax authorities regularly examine our income tax returns. In October 2014, the IRS issued a Revenue Agent’s Report related to its field examination of our federal income tax returns for fiscal years 2009 and 2010. The IRS is contesting our transfer pricing for the cost sharing and buy-in arrangements with our foreign subsidiaries. In November 2014, we filed a protest to challenge the proposed adjustment, and in March 2015, the issue was moved to the Office of Appeals. In addition, in October 2014, the Geneva Tax Administration issued its final assessments for fiscal years 2003 to 2012, disputing certain of our transfer pricing arrangements. In November 2014, we filed a protest to challenge the final assessments. We believe that our reserves for unrecognized tax benefits are adequate for all open tax years. The timing of income tax examinations, as well as the amounts and timing of related settlements, if any, are highly uncertain. We believe that, before the end of fiscal year 2016, it is reasonably possible that either certain audits will conclude or the statutes of limitations relating to certain income tax examination periods will expire, or both. After we reach settlement with the tax authorities, we expect to record a corresponding adjustment to our unrecognized tax benefits. Taking into consideration the inherent uncertainty as to settlement terms, the timing of payments, and the impact of such settlements on other uncertain tax positions, we estimate that the range of potential decreases in underlying uncertainty in income tax is between $0 and $4 million in the next 12 months.
We believe that sufficient positive evidence exists from historical operations and projections of taxable income in future years to conclude that it is more likely than not that we will realize our deferred tax assets, except for California deferred tax assets and our capital loss carryforwards. Accordingly, we apply a valuation allowance to the California deferred tax assets due to the change in California law that occurred in November 2012, and to capital loss carryforwards due to the limited carryforward periods of these tax assets.
For further discussion of our income tax provision, see Note 15, “Income Taxes,” of the Notes to Consolidated Financial Statements.
Liquidity and Capital Resources
October 31, 2015 | November 1, 2014 | Increase | |||||||||
(In thousands) | |||||||||||
Cash and cash equivalents | $ | 1,440,882 | $ | 1,255,017 | $ | 185,865 | |||||
Percentage of total assets | 36 | % | 34 | % | |||||||
We use cash generated by operations as our primary source of liquidity. We expect that cash provided by operating activities will fluctuate in future periods as a result of a number of factors, including fluctuations in our revenues, the timing of product shipments during the quarter, accounts receivable collections, inventory and supply chain management, the timing and amount of tax, and other payments or receipts. For additional discussion, see “Part I, Item 1A. Risk Factors” of this Annual Report on Form 10-K.
In January 2015, we issued $575.0 million in aggregate principal amount of 1.375% convertible senior unsecured notes due 2020 in a private placement. A portion of the net proceeds from this offering was used to redeem all of the outstanding 6.875% senior secured notes due 2020, including the payment of the applicable premium and expenses associated with the redemption, for a total of $322.2 million. In addition, we previously had access to a revolving credit facility under the Senior Secured Credit Facility for ongoing working capital and other general corporate purposes. On January 9, 2015, we terminated the Senior Secured Credit Facility and no longer have access to this additional capital resource (see Note 8, “Borrowings,” of the Notes to Consolidated Financial Statements).
In March 2015, we completed two acquisitions. The aggregate purchase price was $96.1 million, consisting of $95.5 million in cash consideration, which is net of $0.1 million of cash acquired as part of the acquisitions, and $0.5 million in non-cash consideration (see Note 3, “Acquisitions and Divestitures,” of the Notes to Consolidated Financial Statements).
43
Based on past performance and current expectations, we believe that internally generated cash flows and cash on hand will be generally sufficient to support business operations, capital expenditures, stock repurchases, cash dividends, contractual obligations, and other liquidity requirements, including our debt service requirements, associated with our operations for at least the next 12 months. We may also use our operating cash flows or access sources of capital, or a combination thereof, to strengthen our networking portfolios through acquisitions and strategic investments. There are no other transactions, arrangements, or other relationships with unconsolidated entities or other persons that are reasonably likely to materially affect liquidity of, availability of, or our requirements for, capital resources.
Financial Condition
In September 2015, we reconfirmed our intent to return at least 60% of our annual adjusted free cash flow to stockholders in the form of share repurchases or cash dividends. Adjusted free cash flow is operating cash flow, adjusted for the impact of the excess tax benefits from stock-based compensation, less capital expenditures. In the third quarter of fiscal year 2014, our Board of Directors initiated a quarterly cash dividend of $0.035 per share of our common stock. Dividends of $0.035 per share were declared and paid in the third and fourth quarters of fiscal year 2014 and in the first and second quarters of fiscal year 2015. In the third quarter of fiscal year 2015, our Board of Directors authorized an increase in our quarterly cash dividend and subsequently declared and paid dividends of $0.045 per share of our common stock in the third and fourth quarters of fiscal year 2015. On November 22, 2015, our Board of Directors declared a quarterly cash dividend of $0.045 per share of our common stock to be paid on January 4, 2016, to stockholders of record as of the close of market on December 10, 2015. Future dividends are subject to review and approval on a quarterly basis by our Board of Directors.
For the fiscal year ended October 31, 2015, we generated $447.5 million in cash from operating activities, which was due to our net income excluding non-cash items related to stock-based compensation expense and depreciation and amortization.
Net cash used in investing activities for the fiscal year ended October 31, 2015, totaled $172.4 million and was primarily the result of $95.5 million in cash paid for two acquisitions, $68.7 million in purchases of property and equipment, and $7.8 million in the purchase of a license to certain patents.
Net cash used in financing activities for the fiscal year ended October 31, 2015, totaled $83.7 million and was primarily the result of $343.7 million in stock repurchases, $300.0 million in payment of principal related to the redemption of the 2020 Notes, $86.1 million in purchase of convertible note hedge options in connection with the issuance of the 2020 Convertible Notes, and $67.5 million in cash dividend payments, partially offset by the $565.7 million and $51.2 million in proceeds from the issuance of the 2020 Convertible Notes and related warrants, respectively, $51.4 million in proceeds from the issuance of common stock from ESPP purchases and stock option exercises, and $48.9 million in excess tax benefits from stock-based compensation. For the fiscal year ended October 31, 2015, we repurchased approximately 29.6 million shares of our common stock.
Net proceeds from the issuance of common stock in connection with employee participation in our equity compensation plans have historically been a significant component of our liquidity. The extent to which we receive proceeds from these plans can increase or decrease based upon changes in the market price of our common stock, and from the amount and type of awards granted. For example, we have changed the mix of restricted stock unit and stock option awards granted towards granting fewer stock option awards in recent years, which reduces the net proceeds from the issuance of common stock in connection with participation in our equity compensation plans. As a result, our cash flow resulting from the issuance of common stock in connection with employee participation in our equity compensation plans has varied over time.
A majority of our accounts receivable balance is derived from sales to our OEM partners. As of October 31, 2015, one customer individually accounted for 17% of total accounts receivable and no other customers individually accounted for more than 10% of total accounts receivable. As of November 1, 2014, three customers individually accounted for 15%, 12%, and 11% of total accounts receivable, for a combined total of 38% of total accounts receivable. We perform ongoing credit evaluations of our customers and generally do not require collateral or security interests on accounts receivable balances. We have established reserves for credit losses and sales allowances. Allowances for doubtful accounts as of October 31, 2015, increased by $1.8 million over the balance as of November 1, 2014, primarily due to a collection issue with a specific customer. While we have not experienced material credit losses in any of the periods presented, there can be no assurance that we will not experience material credit losses in the future.
Accounts receivable days sales outstanding, which is a measure of the average number of days that a company takes to collect revenue after a sale has been made, for the fiscal year ended October 31, 2015, was 38 days, slightly up from 37 days for the fiscal year ended November 1, 2014, primarily due to better sales linearity in fiscal year 2014.
44
Summary of Cash Flows Data
Fiscal Year Ended | |||||||||||
October 31, 2015 | November 1, 2014 | October 26, 2013 | |||||||||
(In thousands) | |||||||||||
Net cash provided by operating activities | $ | 447,499 | $ | 541,597 | $ | 451,029 | |||||
Net cash used in investing activities | (172,356 | ) | (50,814 | ) | (27,000 | ) | |||||
Net cash used in financing activities | (83,677 | ) | (219,692 | ) | (149,409 | ) | |||||
Effect of exchange rate fluctuations on cash and cash equivalents | (5,601 | ) | (3,071 | ) | (849 | ) | |||||
Net increase in cash and cash equivalents | $ | 185,865 | $ | 268,020 | $ | 273,771 | |||||
Fiscal Year 2015 Compared to Fiscal Year 2014
Operating Activities. Cash provided by operating activities is net income adjusted for certain non-cash items and changes in certain assets and liabilities.
Net cash provided by operating activities decreased by $94.1 million primarily due to higher payments with respect to employee variable incentive compensation earned in fiscal year 2014 and paid in fiscal year 2015, changes in accounts receivable balances due to different collection patterns among fiscal years 2015, 2014, and 2013, and higher fiscal year 2015 tax payments related to fiscal year 2014 earnings.
Investing Activities. Net cash used in investing activities increased by $121.5 million. The increase was primarily due to $78.6 million more cash used for the acquisitions in fiscal year 2015 as compared to the cash used for the acquisition in fiscal year 2014, less cash received from the sale of non-marketable equity investments in fiscal year 2015 as compared to fiscal year 2014, an increase of $14.0 million of cash used to purchase property and equipment during fiscal year 2015, and $7.8 million of cash used in fiscal year 2015 for the purchase of a license to certain patents to strengthen our portfolio of defensive patents. We also sold our host bus adapter product line in fiscal year 2014.
Financing Activities. Net cash used in financing activities decreased by $136.0 million. The decrease was primarily due to the $300.0 million of cash used to redeem the 2020 Notes in February 2015, the $86.1 million of cash used for the purchase of convertible note hedge options in connection with the issuance of the 2020 Convertible Notes, a $37.1 million increase in payment of dividends to stockholders, and the $32.6 million decrease in proceeds from the issuance of common stock pursuant to our equity compensation plans, partially offset by the $565.7 million and $51.2 million in proceeds from the issuance of the 2020 Convertible Notes and related warrants, respectively.
Fiscal Year 2014 Compared to Fiscal Year 2013
Operating Activities. Cash provided by operating activities is net income adjusted for certain non-cash items and changes in certain assets and liabilities.
Net cash provided by operating activities increased by $90.6 million primarily due to increased accounts receivable collections.
Investing Activities. Net cash used in investing activities increased by $23.8 million. The increase from the prior fiscal year was primarily due to cash received from A10 for the one-time payment of the note receivable in fiscal year 2013. The increase was partially offset by $10.8 million of cash received from the sale of non-marketable equity investments during fiscal year 2014 and less cash used for the acquisition in fiscal year 2014 as compared to the cash used for the acquisition in fiscal year 2013.
Financing Activities. Net cash used in financing activities increased by $70.3 million. The increase from the prior fiscal year was primarily due to $95.4 million more in repurchases of our common stock and $30.4 million in payment of dividends to stockholders during fiscal year 2014, partially offset by an increase of $61.4 million in excess tax benefits from stock-based compensation.
Liquidity
Manufacturing and Purchase Commitments. We have manufacturing arrangements with contract manufacturers under which we provide 12-month product forecasts and place purchase orders in advance of the scheduled delivery of products to our customers. Our purchase commitments reserve reflects our estimate of purchase commitments we do not expect to utilize in normal operations in accordance with our policy (see Note 9, “Commitments and Contingencies,” of the Notes to Consolidated Financial Statements).
45
Income Taxes. We intend to indefinitely reinvest all current and accumulated earnings of our foreign subsidiaries for expansion of our business operations outside the United States. Therefore, we do not currently accrue U.S. income taxes on the earnings of our foreign subsidiaries.
Our existing cash and cash equivalents totaled $1,440.9 million as of October 31, 2015. Of this amount, approximately 61% was held by our foreign subsidiaries. We do not currently anticipate a need for these funds held by our foreign subsidiaries for our domestic operations, and our intent is to permanently reinvest such funds outside of the United States. Under current tax laws and regulations, if these funds are distributed to any of our United States entities in the form of dividends or otherwise, we may be subject to additional U.S. income taxes and foreign withholding taxes.
The IRS and other tax authorities regularly examine our income tax returns (see Note 15, “Income Taxes,” of the Notes to Consolidated Financial Statements). We believe we have adequate reserves for all open tax years.
Senior Secured Notes. In January 2010, we issued $300.0 million in aggregate principal amount of senior secured notes due 2018 and $300.0 million in aggregate principal amount of senior secured notes due 2020 (the “2020 Notes” and together with the 2018 Notes, the “Senior Secured Notes”). We used the proceeds to pay down a substantial portion of an outstanding term loan and to retire the convertible subordinated debt due on February 15, 2010, which had been assumed in connection with our acquisition of McDATA. The 2018 Notes and 2020 Notes were redeemed in the second quarter of fiscal year 2013 and in the second quarter of fiscal year 2015, respectively. See Note 8, “Borrowings,” of the Notes to Consolidated Financial Statements.
Senior Unsecured Notes. In January 2013, we issued $300.0 million in aggregate principal amount of the 2023 Notes. We used the proceeds and cash on hand to redeem all of the outstanding 2018 Notes in the second quarter of fiscal year 2013.
Convertible Senior Unsecured Notes. In January 2015, we issued $575.0 million in aggregate principal amount of the 2020 Convertible Notes. Net of an original issue discount, we received 565.7 million in proceeds from the offering of the 2020 Convertible Notes. We used the proceeds to irrevocably deposit $322.2 million with the trustee to discharge the 2020 Indenture and redeem all of the outstanding 2020 Notes, pay the cost of the convertible note hedge transactions for $35.0 million, net of the proceeds from the issuance of warrants, and to repurchase approximately 4.1 million shares of our common stock for $48.9 million at a purchase price of $11.80 per share, which was the closing price on January 8, 2015, the date of the pricing of the 2020 Convertible Notes. We intend to use the remaining proceeds of $159.6 million for general corporate purposes, including potential acquisitions and other business development activities. The 2020 Convertible Notes are unsecured and have a significantly lower interest rate of 1.375% compared to 6.875% for the 2020 Notes. Interest is payable on January 1 and July 1 of each year, beginning on July 1, 2015. See Note 8, “Borrowings,” of the Notes to Consolidated Financial Statements.
Trade Receivables Factoring Facility. As of November 1, 2014, we had an agreement with a financial institution to sell certain of our trade receivables from customers with limited, non-credit-related recourse provisions. That factoring facility terminated in August 2015. No trade receivables were sold under the factoring facility during the fiscal years ended October 31, 2015, and November 1, 2014. As of the filing date of this Annual Report on Form 10-K, no amounts were available under the factoring facility.
Covenant Compliance—Senior Unsecured Notes Covenants. The 2023 Notes were issued pursuant to an indenture, dated as of January 22, 2013, among the Company, the subsidiary guarantors named therein, and Wells Fargo Bank, National Association, as trustee (the “2023 Indenture”). The 2023 Indenture contains covenants that, among other things, restrict our ability and the ability of our subsidiaries to:
• | Incur certain liens and enter into certain sale-leaseback transactions; |
• | Create, assume, incur, or guarantee additional indebtedness of our subsidiaries without such subsidiary guaranteeing the 2023 Notes on a pari passu basis; and |
• | Enter into certain consolidation or merger transactions, or convey, transfer, or lease all, or substantially all of our or our subsidiaries’ assets. |
These covenants are subject to a number of other limitations and exceptions as set forth in the 2023 Indenture. We were in compliance with all applicable covenants of the 2023 Indenture as of October 31, 2015.
46
Contractual Obligations
The following table summarizes our contractual obligations, including interest expense, and commitments as of October 31, 2015 (in thousands):
Total | Less than 1 Year | 1–3 Years | 3–5 Years | More than 5 Years | |||||||||||||||
Contractual Obligations: | |||||||||||||||||||
Convertible senior unsecured notes due 2020 (1) | $ | 607,928 | $ | 7,906 | $ | 15,813 | $ | 584,209 | $ | — | |||||||||
Senior unsecured notes due 2023 (1) | 400,174 | 13,875 | 27,750 | 27,750 | 330,799 | ||||||||||||||
Non-cancellable operating leases (2) | 72,306 | 20,974 | 20,590 | 13,030 | 17,712 | ||||||||||||||
Non-cancellable capital leases (1) | 304 | 304 | — | — | — | ||||||||||||||
Purchase obligations (1) | 17,844 | 3,221 | 4,483 | 4,056 | 6,084 | ||||||||||||||
Purchase commitments, gross (3) | 177,444 | 177,444 | — | — | — | ||||||||||||||
Total contractual obligations | $ | 1,276,000 | $ | 223,724 | $ | 68,636 | $ | 629,045 | $ | 354,595 | |||||||||
Other Commitments: | |||||||||||||||||||
Standby letters of credit | $ | 139 | n/a | n/a | n/a | n/a | |||||||||||||
Unrecognized tax benefits and related accrued interest (4) | $ | 120,088 | n/a | n/a | n/a | n/a | |||||||||||||
(1) | Amount reflects total anticipated cash payments, including anticipated interest payments. |
(2) | Amount excludes contractual sublease income of $9.7 million, which consists of $7.8 million to be received in less than one year, $1.7 million to be received in one to three years, $0.1 million to be received in three to five years, and $3.4 thousand to be received in more than five years. |
(3) | Amount reflects total gross purchase commitments under our manufacturing arrangements with a third-party contract manufacturer. Of this amount, we have accrued reserves of $1.2 million for estimated purchase commitments that we do not expect to utilize in normal operations within the next 12 months, in accordance with our policy. |
(4) | As of October 31, 2015, we had a gross liability for unrecognized tax benefits of $117.6 million and an accrual for the payment of related interest and penalties of $2.5 million. |
Share Repurchase Program. As of October 31, 2015, our Board of Directors had authorized a total of approximately $2.7 billion for the repurchase of our common stock since the inception of the program in August 2004. The purchases may be made, from time to time, in the open market or by privately negotiated transactions, and are funded from available working capital. The number of shares to be purchased and the timing of purchases are based on the level of our cash balances, general business and market conditions, the trading price of our common stock, and other factors, including alternative investment opportunities. For the fiscal year ended October 31, 2015, we repurchased 29.6 million shares for an aggregate purchase price of $343.7 million. Approximately $1.0 billion remained authorized for future repurchases under this program as of October 31, 2015. Subsequently, between October 31, 2015, and the date of the filing of this Annual Report on Form 10-K, we repurchased 10.4 million shares of our common stock for an aggregate purchase price of $99.4 million.
Off-Balance Sheet Arrangements
As part of our ongoing business, we do not participate in transactions that generate material relationships with unconsolidated entities or financial partnerships, such as entities often referred to as “structured finance” or “special purpose entities,” which would have been established for the purpose of facilitating off-balance sheet arrangements or for other contractually narrow or limited purposes. As of October 31, 2015, we did not have any significant off-balance sheet arrangements, as defined in Item 303(a)(4)(ii) of Securities and Exchange Commission (“SEC”) Regulation S-K.
47
Critical Accounting Policies and Estimates
Our discussion and analysis of financial condition and results of operations are based upon our consolidated financial statements, which have been prepared in accordance with U.S. generally accepted accounting principles. The preparation of these Consolidated Financial Statements requires us to make estimates and judgments that affect the reported amounts of assets, liabilities, revenues, and expenses, and related disclosure of contingent assets and liabilities. We evaluate, on an ongoing basis, our estimates and judgments, including, but not limited to, those related to revenue recognition, sales allowances and programs, allowance for doubtful accounts, stock-based compensation, acquisition purchase price allocations, warranty obligations, inventory valuation and purchase commitments, restructuring costs, incentive compensation, facilities lease losses, impairment of goodwill and other indefinite-lived intangible assets, litigation, income taxes, and investments. We base our estimates on historical experience and assumptions that we believe to be reasonable under the circumstances, the results of which form the basis for making judgments about the carrying values of assets and liabilities that are not readily apparent from other sources. Actual results may differ from these estimates.
The methods, estimates, and judgments we use in applying our most critical accounting policies have a significant impact on the results that we report in our Consolidated Financial Statements. We believe the following critical accounting policies, among others, require significant estimates and judgments used in the preparation of our consolidated financial statements.
Revenue Recognition. Our multiple-element product offerings include networking hardware with embedded software products and support, which are considered separate units of accounting. For certain of our products, software and non-software components function together to deliver the tangible products’ essential functionality. We allocate revenue to each element in a multiple-element arrangement based upon their relative selling price. When applying the relative selling price method, we determine the selling price for each deliverable using vendor-specific objective evidence (“VSOE”) of selling price, if it exists, or third-party evidence (“TPE”) of selling price. If neither VSOE nor TPE of selling price exists for a deliverable, we use our best estimate of selling price for that deliverable. Revenue allocated to each element is then recognized when the basic revenue recognition criteria are met for each element.
We determine VSOE based on our normal pricing and discounting practices for the specific product or service when sold separately. In determining VSOE, we require that a substantial majority of the selling prices for a product or service fall within a reasonably narrow pricing range. For post-contract customer support, we consider stated renewal rates in determining VSOE.
In most instances, we are not able to establish VSOE for all deliverables in an arrangement with multiple elements. This may be due to infrequently selling each element separately, not pricing products within a narrow range, or only having a limited sales history. When VSOE cannot be established, we attempt to establish a selling price for each element based on TPE. TPE is determined based on competitor prices for similar deliverables when sold separately. Generally, our go-to-market strategy differs from that of our competitors, and our offerings contain a significant level of customization and differentiation such that the comparable pricing of products with similar functionality cannot be obtained. Furthermore, we are unable to reliably determine what similar competitor products’ selling prices are on a stand-alone basis. Therefore, we are typically not able to determine TPE.
When we are unable to establish selling price using VSOE or TPE, we use estimated selling price (“ESP”) in our allocation of the arrangement consideration. The objective of ESP is to determine the price at which we would transact a sale if the product or service were sold on a stand-alone basis. ESP is generally used for offerings that are not typically sold on a stand-alone basis or for new or highly-customized offerings.
We determine ESP for a product by considering multiple factors including, but not limited to, geographies, market conditions, competitive landscape, internal costs, gross margin objectives, and pricing practices. The determination of ESP is made through consultation with and formal approval by our management, taking into consideration the go-to-market strategy. If circumstances related to our estimates for revenue recognition change, our allocation of revenue to each element in a multiple-element arrangement may also change.
Stock-based Compensation. We grant stock options for shares in our common stock, restricted stock units (“RSUs”), including restricted stock units with market conditions, and other types of equity compensation awards to our employees and directors under various equity compensation plans.
The compensation expense for stock-based awards is adjusted for an estimated impact of forfeitures and is recognized over the vesting period of the award under a graded or straight-line vesting method. In addition, we record stock-based compensation expense in connection with shares issued under our employee stock purchase plan using the graded vesting method over the 24-month offering period.
48
We use the Black-Scholes option pricing model to determine the fair value of stock options granted when the measurement date is certain. We also use the Black-Scholes option pricing model to determine the fair value of the option component of employee stock purchase plan shares. The determination of the fair value of stock-based awards using the option pricing model is affected by our stock price, as well as assumptions regarding a number of complex and subjective variables. These variables include our expected stock price volatility over the expected term of the awards, projected and actual employee stock option exercise behaviors, risk-free interest rates, estimated forfeitures, and expected dividend yields.
We estimated the expected term of stock options granted prior to the second quarter of fiscal year 2014 by calculating the average term from our historical stock option exercise experience. For stock options granted on or subsequent to the first day of the second quarter of fiscal year 2014, we estimate the expected term using the simplified method as specified under Staff Accounting Bulletin Topic 14. We initiated a quarterly cash dividend in the third quarter of fiscal year 2014, and therefore we use an expected dividend yield in the option pricing model. We are required to estimate forfeitures at the time of the grant and revise those estimates in subsequent periods if actual forfeitures differ from those estimates. We use historical data to estimate pre-vesting option forfeitures and record stock-based compensation expense only for those awards that are expected to vest. We use implied volatilities from traded options of our common stock and historical volatilities of our common stock to estimate volatility over the expected term of the awards.
We measured the fair value of time-based RSUs prior to the initial declaration of a quarterly cash dividend on May 22, 2014, based on the grant-date share price because we had not historically paid cash dividends on our common stock. For time-based RSUs granted on or subsequent to May 22, 2014, we measure the fair value of RSUs based on the grant-date share price, less the present value of expected dividends during the vesting period, discounted at a risk-free interest rate.
We measured the fair value of MSUs using a lattice model that incorporates a Monte Carlo simulation, which involves a series of random trials that may take different future price paths over the award’s contractual life. Conditions are imposed on each Monte Carlo simulation to determine if the market condition would have been met for the particular stock price path. The MSUs’ grant date fair value is determined by taking the average of the grant date fair values under each of many Monte Carlo trials. The determination of the fair value of MSUs is affected by our stock price, as well as assumptions regarding a number of complex and subjective variables. These variables include our expected stock price volatility over the expected term of the awards, risk-free interest rates, estimated forfeitures, and expected dividend yields.
The assumptions used in calculating the fair value of stock-based awards represent management’s best estimates, but these estimates involve inherent uncertainties and the application of management judgment. As a result, if factors change and we use different assumptions, our stock-based compensation expense could be materially different in the future. For additional discussion, see Note 12, “Stock-Based Compensation,” of the Notes to Consolidated Financial Statements.
Acquisition—Purchase Price Allocations. We allocate the purchase price of an acquired business to the assets acquired and liabilities assumed, including identifiable intangible assets, based on their respective fair values at the acquisition date. The excess of the purchase price over the fair value of the underlying acquired net tangible and intangible assets, if any, is recorded as goodwill. We estimate the fair value of assets and liabilities based upon quoted market prices, the carrying value of the acquired assets, and using widely accepted valuation techniques. We adjust the preliminary purchase price allocation, as necessary, typically up to one year after the acquisition closing date as we obtain more information regarding assets acquired and liabilities assumed. For additional discussion, see Note 3, “Acquisitions and Divestitures,” of the Notes to Consolidated Financial Statements.
Inventory Valuation and Purchase Commitments. We write down inventory and record purchase commitment liabilities for estimated excess and obsolete inventory equal to the difference between the cost of inventory and the estimated market value based upon the forecast of future product demand, product transition cycles, and market conditions. Any significant unanticipated changes in demand or technological development could have a significant impact on the value of our inventory and purchase commitments and our reported results. If actual market conditions are less favorable than those projected, additional inventory write-downs, purchase commitment liabilities, and charges against earnings may be required.
49
Restructuring Costs. We monitor and regularly evaluate our organizational structure and associated operating expenses. Depending on events and circumstances, we may decide to take additional actions to reduce future operating costs as our business requirements evolve. In determining restructuring charges, we analyze our future operating requirements, including the required headcount by business functions and facility space requirements. Our restructuring costs and any resulting accruals involve significant estimates made by management using the best information available at the time the estimates are made. In recording severance accruals, we record a liability when all of the following conditions have been met: employees’ rights to receive compensation for future absences is attributable to employees’ services already rendered; the obligation relates to rights that vest or accumulate; payment of the compensation is probable; and the amount can be reasonably estimated. In recording facilities lease loss accruals, we make various assumptions, including the time period over which the facilities are expected to be vacant, expected sublease terms, expected sublease rates, expected future operating costs, and expected future use of the facilities. Our estimates involve a number of risks and uncertainties, some of which are beyond our control, including future real estate market conditions and our ability to successfully enter into subleases or lease termination agreements with terms as favorable as those assumed when arriving at our estimates. We regularly evaluate a number of factors to determine the appropriateness and reasonableness of our restructuring accruals, including the various assumptions noted above. If actual results differ significantly from our estimates, we may be required to adjust our restructuring accruals in the future.
Impairment of Goodwill and Other Indefinite-Lived Intangible Assets.
Goodwill and other indefinite-lived intangible assets are generated as a result of business combinations. Our indefinite-lived assets consist of acquired in-process research and development (“IPR&D”) and goodwill.
IPR&D Impairment Testing. IPR&D is an intangible asset accounted for as an indefinite-lived asset until the completion or abandonment of the associated research and development effort. During the development period, we conduct our IPR&D impairment test annually, as of the first day of the second fiscal quarter, and whenever events or changes in facts and circumstances indicate that it is more likely than not that the IPR&D is impaired. Events that might indicate impairment include, but are not limited to, adverse cost factors, deteriorating financial performance, strategic decisions made in response to economic and competitive conditions, the impact of the economic environment on us and our customer base, and/or other relevant events, such as changes in management, key personnel, litigation, or customers. Our ongoing consideration of factors such as these could result in IPR&D impairment charges in the future, which could adversely affect our net income.
Goodwill Impairment Testing. We conduct our goodwill impairment test annually, as of the first day of the second fiscal quarter, and whenever events occur or facts and circumstances change that would more likely than not reduce the fair value of a reporting unit below its carrying amount. Events that might indicate impairment include, but are not limited to, strategic decisions made in response to economic and competitive conditions, the impact of the economic environment on our customer base, material negative changes in relationships with significant customers, and/or a significant decline in our stock price for a sustained period. Our ongoing consideration of factors such as these could result in goodwill impairment charges in the future, which could adversely affect our net income.
We perform the two-step goodwill impairment test to identify potential goodwill impairment and measure the amount of a goodwill impairment loss to be recognized, if any. The first step tests for potential impairment by comparing the fair value of reporting units with reporting units’ net asset values. The reporting units are determined by the components of our operating segments that constitute a business for which both (i) discrete financial information is available and (ii) segment management regularly reviews the operating results of that component. If the fair value of the reporting unit exceeds the carrying value of the reporting unit’s net assets, then goodwill is not impaired, and no further testing is required. If the fair value of the reporting unit is below the carrying value of the reporting unit’s net assets, then the second step is required to measure the amount of potential impairment. The second step requires an assignment of the reporting unit’s fair value to the reporting unit’s assets and liabilities, using the relevant acquisition accounting guidance, to determine the implied fair value of the reporting unit’s goodwill. The implied fair value of the reporting unit’s goodwill is then compared with the carrying amount of the reporting unit’s goodwill to determine the goodwill impairment loss to be recognized, if any. If the carrying value of a reporting unit’s goodwill exceeds its implied fair value, we record an impairment loss equal to the difference.
To determine the reporting units’ fair values, we use the income approach, the market approach, or a combination thereof. The income approach provides an estimate of fair value based on discounted expected future cash flows. The market approach provides an estimate of the fair value by applying various observable market-based multiples to the reporting units’ operating results and then applying an appropriate control premium.
50
Determining the fair value of a reporting unit is judgmental in nature and involves the use of significant estimates and assumptions. We based our fair value estimates on assumptions we believe to be reasonable, but these estimates and assumptions are inherently uncertain. Estimates and assumptions with respect to the determination of the fair value of our reporting units using the income approach include, among other inputs:
• | Our operating forecasts; |
• | Our forecasted revenue growth rates; and |
• | Risk-commensurate discount rates and costs of capital. |
Our estimates of revenues and costs are based on historical data, various internal estimates, and a variety of external sources, and are developed as part of our regular long-range planning process. The control premium used in market or combined approaches is determined by considering control premiums offered as part of acquisitions that have occurred in a reporting unit’s comparable market segments.
Consistent with prior years, we performed our annual goodwill impairment test using measurement data as of the first day of the second fiscal quarter of 2015. At the time of the fiscal year 2015 annual goodwill impairment testing, our reporting units were: SAN Products; IP Networking Products; and Global Services.
During our fiscal year 2015 annual goodwill impairment test, we used a combination of the income approach and market approach, weighted equally, to estimate each reporting unit’s fair value.
During the first step of goodwill impairment testing, we determined that all our reporting units passed the first step of goodwill impairment testing and no further testing was required. However, changes in the underlying assumptions can adversely impact fair value because some of the inherent estimates and assumptions used in determining the fair value of these reportable segments are complex and subjective. Accordingly, for the IP Networking Products reporting unit, we performed the sensitivity analysis below to quantify the impact of key assumptions on that reporting unit’s fair value estimate. The key assumptions impacting our estimates were (i) discount rates and (ii) discounted cash flow (“DCF”) terminal value multipliers. As these assumptions ultimately reflect the risk of achieving reporting units’ revenue and cash flow projections, we determined that a separate sensitivity analysis for changes in revenue and cash flow projections was not meaningful.
The respective fair values of the SAN and Global Services reporting units were substantially in excess of these reporting units’ carrying values, and the fair values of those reporting units were, therefore, not subject to a sensitivity analysis.
As of the date of the fiscal year 2015 annual goodwill impairment testing, the carrying value of the IP Networking Products reporting unit’s goodwill was $1,236 million. Based on our fiscal year 2015 annual goodwill impairment test, the estimated fair value of the IP Networking Products reporting unit’s net assets, which include goodwill, exceeded the carrying value of these net assets by approximately $162 million. The following table summarizes the approximate impact that a change in key assumptions would have on the estimated fair value of the IP Networking Products reporting unit, leaving all other assumptions unchanged:
Change | Approximate Impact on Fair Value (In millions) | Excess of Fair Value over Carrying Value (In millions) | |||
Discount rate | ±1% | $(45) - 49 | $116 - 210 | ||
DCF terminal value multiplier | ±0.5x | $(39) - 39 | $123 - 200 | ||
51
Accounting for Income Taxes. The determination of our tax provision is subject to estimates and judgments due to operations in multiple tax jurisdictions inside and outside the United States. Sales to our international customers are principally taxed at rates that are lower than the United States statutory rates. The ability to maintain our current effective tax rate is contingent upon existing tax laws in both the United States and in the respective countries in which our international subsidiaries are located. Future changes in domestic or international tax laws could affect the continued realization of the tax benefits we are currently receiving and expect to receive from international sales. In addition, an increase in the percentage of our total revenue from international customers, or in the mix of international revenue among particular tax jurisdictions, could change our overall effective tax rate. We intend to indefinitely reinvest current and accumulated earnings of our foreign subsidiaries for expansion of our business operations outside the United States. These earnings could become subject to United States federal and state income taxes and foreign withholding taxes, as applicable, should they be either deemed or actually remitted from our international subsidiaries to the United States. In addition, we evaluate the expected realization of our deferred tax assets and assess the need for a valuation allowance on a quarterly basis. As of October 31, 2015, our net deferred tax asset balance was $55.5 million. We believe that sufficient positive evidence exists from historical operations and projections of U.S. taxable income in future years to conclude that it is more likely than not that we would realize our deferred tax assets, except for California deferred tax assets and capital loss carryforwards. Historical operations showed that we have cumulative profits for the prior twelve quarters ended October 31, 2015. We only apply a valuation allowance to the California deferred tax assets due to the change in California law that occurred in November 2012, and to capital loss carryforwards due to the limited carryforward periods and the character of such tax attributes. In the event future income by jurisdiction is less than what is currently projected, we may be required to apply a valuation allowance to these deferred tax assets in jurisdictions for which realization is no longer determined to be more likely than not.
Accounting for Uncertain Tax Benefits. The calculation of tax liabilities involves significant judgment in estimating the impact of uncertainties in the application of complex tax laws. We apply a recognition threshold and measurement attribute for financial statement disclosure of tax positions taken or expected to be taken on a tax return. Recognition of a tax position is determined when it is more likely than not that a tax position will be sustained upon examination, including resolution of any related appeals or litigation process. A tax position that meets the more-likely-than-not recognition threshold is measured at the largest amount of benefit that is greater than 50% likely of being realized upon ultimate settlement with a taxing authority. The threshold and measurement attribute requires significant judgment by management. Resolution of these uncertainties in a manner inconsistent with our expectations could have a material impact on our results of operations.
Recent Accounting Pronouncements
For a description of recent accounting pronouncements, including the expected dates of adoption and estimated effects, if any, on our consolidated financial statements, see Note 2, “Summary of Significant Accounting Policies,” of the Notes to Consolidated Financial Statements.
52
Item 7A. | Quantitative and Qualitative Disclosures About Market Risk |
In the normal course of business, we are exposed to market risks related to changes in interest rates, foreign currency exchange rates, and equity prices that could impact our financial position and results of operations. Our risk management strategy with respect to these three market risks may include the use of derivative financial instruments. We use derivative contracts only to manage our existing underlying exposures. Accordingly, we do not use derivative contracts for speculative purposes. Our risks and risk management strategy are outlined below. Actual gains and losses in the future may differ materially from the sensitivity analysis presented below based on changes in the timing and level of interest rates and our actual exposures and hedges.
Interest Rate Risk
Our exposure to market risk due to changes in the general level of U.S. interest rates relates primarily to our cash equivalents. Our cash and cash equivalents are primarily maintained at five major financial institutions. The primary objective of our investment activities is the preservation of principal while maximizing investment income and minimizing risk. We had $1,184.4 million invested in money market funds as of October 31, 2015, which were not materially sensitive to changes in interest rates due to the short duration of these investments.
Our material borrowings bear interest at fixed rates, and therefore, we did not have any material borrowings as of October 31, 2015, that were sensitive to changes in interest rates. We were not subject to material interest rate risk in geographical areas outside of the United States as a substantial portion of our cash and cash equivalents is invested in money market funds in U.S. dollars that have a fixed share price.
Foreign Currency Exchange Rate Risk
We are exposed to foreign currency exchange rate risk inherent in conducting business globally in numerous currencies. We are primarily exposed to foreign currency fluctuations related to operating expenses denominated in currencies other than the U.S. dollar, of which the most significant to our operations for fiscal year 2015 were the British pound, the euro, the Indian rupee, the Chinese yuan, the Singapore dollar, the Japanese yen, and the Swiss franc. Because we report in U.S. dollars and we have a net expense position in foreign currencies, we benefit from a stronger U.S. dollar and may be adversely affected by a weaker U.S. dollar relative to the foreign currency. We use foreign currency forward and option contracts designated as cash flow hedges to protect against the foreign currency exchange rate risks inherent in our forecasted operating expenses denominated in certain currencies other than the U.S. dollar. We recognize the gains and losses on foreign currency forward contracts in the same period as the remeasurement losses and gains of the related foreign currency denominated exposures.
We also may enter into other non-designated derivatives that consist primarily of forward contracts to minimize the risk associated with the foreign exchange effects of revaluing monetary assets and liabilities. Monetary assets and liabilities denominated in foreign currencies and any associated outstanding forward contracts are marked-to-market, with realized and unrealized gains and losses included in earnings.
Alternatively, we may choose not to hedge the foreign currency risk associated with our foreign currency exposures if we believe such exposure acts as a natural foreign currency hedge for other offsetting amounts denominated in the same currency or if the currency is difficult or too expensive to hedge. As of October 31, 2015, the gross notional amount of our cash flow derivative instruments was $169.9 million, and we had hedges in place through October 13, 2016.
We have performed a sensitivity analysis as of October 31, 2015, using a modeling technique that measures the change in the fair values arising from a hypothetical 10% adverse movement in the levels of foreign currency exchange rates relative to the U.S. dollar, with all other variables held constant. The analysis covers all of our foreign currency contracts offset by the underlying exposures. The foreign currency exchange rates we used were based on market rates in effect on October 31, 2015. The sensitivity analysis indicated that a hypothetical 10% adverse movement in foreign currency exchange rates would not result in a material foreign exchange loss as of October 31, 2015.
53
Equity Price Risk
From time to time, we have made equity investments in companies that develop technology or provide services that are complementary to, or broaden the markets for, our products or services and further our business objectives. We had no investments in publicly traded equity securities as of October 31, 2015. The aggregate cost of our equity investments in non-publicly traded companies was $2.5 million as of October 31, 2015. We monitor our equity investments for impairment on a periodic basis. In the event that the carrying value of the equity investment exceeds its fair value, and we determine the decline in value to be other than temporary, we reduce the carrying value to its current fair value. Generally, we do not attempt to reduce or eliminate our market exposure on these equity securities. We do not purchase our equity securities with the intent to use them for speculative purposes.
Our common stock is quoted on the NASDAQ Global Select Market under the symbol “BRCD.” On October 30, 2015, the last business day of our fourth fiscal quarter of 2015, the last reported sale price of our common stock on the NASDAQ Global Select Market was $10.42 per share.
54
Item 8. | Financial Statements and Supplementary Data |
BROCADE COMMUNICATIONS SYSTEMS, INC.
INDEX TO CONSOLIDATED FINANCIAL STATEMENTS AND SUPPLEMENTARY DATA
Page | |
Consolidated Statements of Income | |
Consolidated Statements of Comprehensive Income | |
55
Report of Independent Registered Public Accounting Firm
The Board of Directors and Stockholders
Brocade Communications Systems, Inc.:
We have audited the accompanying consolidated balance sheets of Brocade Communications Systems, Inc. and subsidiaries (the Company) as of October 31, 2015, and November 1, 2014, and the related consolidated statements of income, comprehensive income, cash flows, and stockholders’ equity for each of the years in the three-year period ended October 31, 2015. In connection with our audits of the consolidated financial statements, we also have audited the accompanying financial statement schedule. These consolidated financial statements and financial statement schedule are the responsibility of the Company’s management. Our responsibility is to express an opinion on these consolidated financial statements and financial statement schedule based on our audits.
We conducted our audits in accordance with the standards of the Public Company Accounting Oversight Board (United States). Those standards require that we plan and perform the audit to obtain reasonable assurance about whether the financial statements are free of material misstatement. An audit includes examining, on a test basis, evidence supporting the amounts and disclosures in the financial statements. An audit also includes assessing the accounting principles used and significant estimates made by management, as well as evaluating the overall financial statement presentation. We believe that our audits provide a reasonable basis for our opinion.
In our opinion, the consolidated financial statements referred to above present fairly, in all material respects, the financial position of Brocade Communications Systems, Inc. and subsidiaries as of October 31, 2015, and November 1, 2014, and the results of their operations and their cash flows for each of the years in the three-year period ended October 31, 2015, in conformity with U.S. generally accepted accounting principles. Also, in our opinion, the related financial statement schedule, when considered in relation to the basic consolidated financial statements taken as a whole, presents fairly, in all material respects, the information set forth therein.
We also have audited, in accordance with the standards of the Public Company Accounting Oversight Board (United States), the Company’s internal control over financial reporting as of October 31, 2015, based on criteria established in Internal Control - Integrated Framework (2013) issued by the Committee of Sponsoring Organizations of the Treadway Commission (COSO), and our report dated December 22, 2015, expressed an unqualified opinion on the effectiveness of the Company’s internal control over financial reporting.
/s/ KPMG LLP
Santa Clara, California
December 22, 2015
56
BROCADE COMMUNICATIONS SYSTEMS, INC. CONSOLIDATED STATEMENTS OF INCOME | |||||||||||
Fiscal Year Ended | |||||||||||
October 31, 2015 | November 1, 2014 | October 26, 2013 | |||||||||
(In thousands, except per share amounts) | |||||||||||
Net revenues: | |||||||||||
Product | $ | 1,902,401 | $ | 1,852,187 | $ | 1,870,567 | |||||
Service | 361,059 | 359,080 | 352,297 | ||||||||
Total net revenues | 2,263,460 | 2,211,267 | 2,222,864 | ||||||||
Cost of revenues: | |||||||||||
Product | 587,515 | 592,441 | 658,362 | ||||||||
Service | 147,872 | 153,033 | 155,623 | ||||||||
Total cost of revenues | 735,387 | 745,474 | 813,985 | ||||||||
Gross margin | 1,528,073 | 1,465,793 | 1,408,879 | ||||||||
Operating expenses: | |||||||||||
Research and development | 356,720 | 345,549 | 378,521 | ||||||||
Sales and marketing | 585,230 | 554,515 | 567,637 | ||||||||
General and administrative | 87,623 | 84,941 | 74,518 | ||||||||
Amortization of intangible assets | 2,556 | 10,280 | 54,256 | ||||||||
Acquisition and integration costs | 3,942 | — | — | ||||||||
Restructuring, goodwill impairment, and other related costs (benefits) (Note 4, 5) | (678 | ) | 89,280 | 25,464 | |||||||
Gain on sale of network adapter business | — | (4,884 | ) | — | |||||||
Total operating expenses | 1,035,393 | 1,079,681 | 1,100,396 | ||||||||
Income from operations | 492,680 | 386,112 | 308,483 | ||||||||
Interest income | 1,854 | 665 | 1,404 | ||||||||
Other income, net (Note 14) | 95 | 3,601 | 75,835 | ||||||||
Interest expense | (55,578 | ) | (36,757 | ) | (55,261 | ) | |||||
Income before income tax | 439,051 | 353,621 | 330,461 | ||||||||
Income tax expense | 98,689 | 115,650 | 121,838 | ||||||||
Net income | $ | 340,362 | $ | 237,971 | $ | 208,623 | |||||
Net income per share—basic | $ | 0.81 | $ | 0.55 | $ | 0.46 | |||||
Net income per share—diluted | $ | 0.79 | $ | 0.53 | $ | 0.45 | |||||
Shares used in per share calculation—basic | 420,331 | 435,258 | 450,516 | ||||||||
Shares used in per share calculation—diluted | 430,556 | 446,859 | 463,705 | ||||||||
Cash dividends declared per share | $ | 0.16 | $ | 0.07 | $ | — | |||||
See accompanying Notes to Consolidated Financial Statements.
57
BROCADE COMMUNICATIONS SYSTEMS, INC.
CONSOLIDATED STATEMENTS OF COMPREHENSIVE INCOME
Fiscal Year Ended | |||||||||||
October 31, 2015 | November 1, 2014 | October 26, 2013 | |||||||||
(In thousands) | |||||||||||
Net income | $ | 340,362 | $ | 237,971 | $ | 208,623 | |||||
Other comprehensive income and loss, net of tax: | |||||||||||
Unrealized gains (losses) on cash flow hedges: | |||||||||||
Change in unrealized gains and losses | (3,387 | ) | (1,939 | ) | (1,748 | ) | |||||
Net gains and losses reclassified into earnings | 3,755 | (235 | ) | (376 | ) | ||||||
Net unrealized gains (losses) on cash flow hedges | 368 | (2,174 | ) | (2,124 | ) | ||||||
Foreign currency translation adjustments | (6,556 | ) | (3,196 | ) | (1,456 | ) | |||||
Total other comprehensive loss | (6,188 | ) | (5,370 | ) | (3,580 | ) | |||||
Total comprehensive income | $ | 334,174 | $ | 232,601 | $ | 205,043 | |||||
See accompanying Notes to Consolidated Financial Statements.
58
BROCADE COMMUNICATIONS SYSTEMS, INC. CONSOLIDATED BALANCE SHEETS | |||||||
October 31, 2015 | November 1, 2014 | ||||||
(In thousands, except par value) | |||||||
ASSETS | |||||||
Current assets: | |||||||
Cash and cash equivalents | $ | 1,440,882 | $ | 1,255,017 | |||
Accounts receivable, net of allowances for doubtful accounts of $1,838 and $80 as of October 31, 2015, and November 1, 2014, respectively | 235,883 | 224,913 | |||||
Inventories | 40,524 | 38,718 | |||||
Deferred tax assets | 78,675 | 92,692 | |||||
Prepaid expenses and other current assets | 56,235 | 46,665 | |||||
Total current assets | 1,852,199 | 1,658,005 | |||||
Property and equipment, net | 439,224 | 445,433 | |||||
Goodwill | 1,617,161 | 1,567,723 | |||||
Intangible assets, net | 75,623 | 26,658 | |||||
Other assets | 53,971 | 35,856 | |||||
Total assets | $ | 4,038,178 | $ | 3,733,675 | |||
LIABILITIES AND STOCKHOLDERS’ EQUITY | |||||||
Current liabilities: | |||||||
Accounts payable | $ | 98,143 | $ | 93,705 | |||
Accrued employee compensation | 142,075 | 169,018 | |||||
Deferred revenue | 244,622 | 239,993 | |||||
Other accrued liabilities | 77,524 | 84,592 | |||||
Total current liabilities | 562,364 | 587,308 | |||||
Long-term debt, net of current portion | 795,804 | 595,450 | |||||
Non-current deferred revenue | 72,065 | 71,746 | |||||
Non-current income tax liability | 47,010 | 39,647 | |||||
Non-current deferred tax liabilities | 24,024 | 27,153 | |||||
Other non-current liabilities | 3,376 | 4,310 | |||||
Total liabilities | 1,504,643 | 1,325,614 | |||||
Commitments and contingencies (Note 9) | |||||||
Stockholders’ equity: | |||||||
Preferred stock, $0.001 par value, 5,000 shares authorized, no shares issued and outstanding | — | — | |||||
Common stock, $0.001 par value, 800,000 shares authorized: | |||||||
Issued and outstanding: 413,923 and 431,470 shares as of October 31, 2015, and November 1, 2014, respectively | 414 | 431 | |||||
Additional paid-in capital | 1,632,984 | 1,774,197 | |||||
Accumulated other comprehensive loss | (25,002 | ) | (18,814 | ) | |||
Retained earnings | 925,139 | 652,247 | |||||
Total stockholders’ equity | 2,533,535 | 2,408,061 | |||||
Total liabilities and stockholders’ equity | $ | 4,038,178 | $ | 3,733,675 | |||
See accompanying Notes to Consolidated Financial Statements.
59
BROCADE COMMUNICATIONS SYSTEMS, INC. CONSOLIDATED STATEMENTS OF CASH FLOWS | |||||||||||
Fiscal Year Ended | |||||||||||
October 31, 2015 | November 1, 2014 | October 26, 2013 | |||||||||
(In thousands) | |||||||||||
Cash flows from operating activities: | |||||||||||
Net income | $ | 340,362 | $ | 237,971 | $ | 208,623 | |||||
Adjustments to reconcile net income to net cash provided by operating activities: | |||||||||||
Excess tax benefits from stock-based compensation | (48,943 | ) | (64,563 | ) | (3,189 | ) | |||||
Non-cash tax charges | — | — | 78,206 | ||||||||
Depreciation and amortization | 84,807 | 100,647 | 184,114 | ||||||||
Loss on disposal of property and equipment | 3,163 | 5,118 | 6,709 | ||||||||
Gain on sale of network adapter business | — | (4,884 | ) | — | |||||||
Amortization of debt issuance costs and debt discount | 13,715 | 1,151 | 1,214 | ||||||||
Write-off of debt discount and debt issuance costs related to lenders that did not participate in refinancing | 4,808 | — | 5,360 | ||||||||
Net gain on sale of investments | — | (5,292 | ) | — | |||||||
Provision for doubtful accounts receivable and sales allowances | 5,173 | 7,563 | 9,221 | ||||||||
Non-cash stock-based compensation expense | 88,528 | 84,914 | 73,618 | ||||||||
Goodwill impairment charge | — | 83,382 | — | ||||||||
Changes in assets and liabilities, net of acquisitions: | |||||||||||
Accounts receivable | (15,989 | ) | 17,121 | (25,509 | ) | ||||||
Inventories | (1,805 | ) | 6,626 | 24,173 | |||||||
Prepaid expenses and other assets | (15,844 | ) | (10,984 | ) | (66,001 | ) | |||||
Deferred tax assets | 234 | (887 | ) | 4,825 | |||||||
Accounts payable | 107 | 2,339 | (28,862 | ) | |||||||
Accrued employee compensation | (59,703 | ) | (11,382 | ) | (57,859 | ) | |||||
Deferred revenue | 1,345 | 8,652 | 8,599 | ||||||||
Other accrued liabilities | 50,366 | 96,376 | 12,944 | ||||||||
Restructuring liabilities | (2,825 | ) | (12,271 | ) | 14,843 | ||||||
Net cash provided by operating activities | 447,499 | 541,597 | 451,029 | ||||||||
60
BROCADE COMMUNICATIONS SYSTEMS, INC. CONSOLIDATED STATEMENTS OF CASH FLOWS—Continued | |||||||||||
Fiscal Year Ended | |||||||||||
October 31, 2015 | November 1, 2014 | October 26, 2013 | |||||||||
(In thousands) | |||||||||||
Cash flows from investing activities: | |||||||||||
Purchases of non-marketable equity and debt investments | (2,150 | ) | (223 | ) | — | ||||||
Proceeds from sale of non-marketable equity investments | 1,489 | 10,798 | — | ||||||||
Purchases of property and equipment | (68,743 | ) | (54,734 | ) | (52,371 | ) | |||||
Purchase of intangible assets | (7,750 | ) | — | — | |||||||
Net cash paid in connection with acquisitions | (95,452 | ) | (16,900 | ) | (44,629 | ) | |||||
Proceeds from collection of note receivable | 250 | 250 | 70,000 | ||||||||
Proceeds from sale of network adapter business | — | 9,995 | — | ||||||||
Net cash used in investing activities | (172,356 | ) | (50,814 | ) | (27,000 | ) | |||||
Cash flows from financing activities: | |||||||||||
Proceeds from senior unsecured notes | — | — | 296,250 | ||||||||
Payment of principal related to senior secured notes | (300,000 | ) | — | (300,000 | ) | ||||||
Payment of debt issuance costs | (1,718 | ) | — | (992 | ) | ||||||
Payment of principal related to capital leases | (1,818 | ) | (2,485 | ) | (1,627 | ) | |||||
Common stock repurchases | (343,686 | ) | (335,380 | ) | (240,000 | ) | |||||
Proceeds from issuance of common stock | 51,376 | 83,994 | 93,771 | ||||||||
Payment of cash dividends to stockholders | (67,470 | ) | (30,384 | ) | — | ||||||
Proceeds from convertible notes | 565,656 | — | — | ||||||||
Purchase of convertible note hedge | (86,135 | ) | — | — | |||||||
Proceeds from issuance of warrants | 51,175 | — | — | ||||||||
Excess tax benefits from stock-based compensation | 48,943 | 64,563 | 3,189 | ||||||||
Net cash used in financing activities | (83,677 | ) | (219,692 | ) | (149,409 | ) | |||||
Effect of exchange rate fluctuations on cash and cash equivalents | (5,601 | ) | (3,071 | ) | (849 | ) | |||||
Net increase in cash and cash equivalents | 185,865 | 268,020 | 273,771 | ||||||||
Cash and cash equivalents, beginning of year | 1,255,017 | 986,997 | 713,226 | ||||||||
Cash and cash equivalents, end of year | $ | 1,440,882 | $ | 1,255,017 | $ | 986,997 | |||||
Supplemental disclosures of cash flow information: | |||||||||||
Cash paid for interest | $ | 29,560 | $ | 34,737 | $ | 39,842 | |||||
Cash paid for income taxes | $ | 41,442 | $ | 22,207 | $ | 14,493 | |||||
Supplemental schedule of non-cash investing activities: | |||||||||||
Acquisition of property and equipment through capital leases | $ | — | $ | — | $ | 1,312 | |||||
Settlement of debt investment in relation to acquisition | $ | 150 | $ | — | $ | — | |||||
See accompanying Notes to Consolidated Financial Statements.
61
BROCADE COMMUNICATIONS SYSTEMS, INC. CONSOLIDATED STATEMENTS OF STOCKHOLDERS’ EQUITY | ||||||||||||||||||||||
Common Stock | Additional Paid-In Capital | Accumulated Other Comprehensive Loss | Retained Earnings | Total Stockholders’ Equity | ||||||||||||||||||
Number of Shares | Amount | |||||||||||||||||||||
(In thousands) | ||||||||||||||||||||||
Balance at October 27, 2012 | 456,913 | $ | 457 | $ | 2,009,190 | $ | (9,864 | ) | $ | 236,037 | $ | 2,235,820 | ||||||||||
Issuance of common stock | 29,556 | 29 | 73,778 | — | — | 73,807 | ||||||||||||||||
Common stock repurchases | (41,184 | ) | (41 | ) | (239,959 | ) | — | — | (240,000 | ) | ||||||||||||
Tax detriment from employee stock plans | — | — | (1,475 | ) | — | — | (1,475 | ) | ||||||||||||||
Stock-based compensation | — | — | 73,618 | — | — | 73,618 | ||||||||||||||||
Change in net unrealized losses on cash flow hedges | — | — | — | (2,124 | ) | — | (2,124 | ) | ||||||||||||||
Change in cumulative translation adjustments | — | — | — | (1,456 | ) | — | (1,456 | ) | ||||||||||||||
Net income | — | — | — | — | 208,623 | 208,623 | ||||||||||||||||
Balance at October 26, 2013 | 445,285 | $ | 445 | $ | 1,915,152 | $ | (13,444 | ) | $ | 444,660 | $ | 2,346,813 | ||||||||||
Issuance of common stock | 24,196 | 24 | 49,565 | — | — | 49,589 | ||||||||||||||||
Common stock repurchases | (38,011 | ) | (38 | ) | (335,342 | ) | — | — | (335,380 | ) | ||||||||||||
Tax benefit from employee stock plans | — | — | 59,908 | — | — | 59,908 | ||||||||||||||||
Stock-based compensation | — | — | 84,914 | — | — | 84,914 | ||||||||||||||||
Change in net unrealized losses on cash flow hedges | — | — | — | (2,174 | ) | — | (2,174 | ) | ||||||||||||||
Change in cumulative translation adjustments | — | — | — | (3,196 | ) | — | (3,196 | ) | ||||||||||||||
Cash dividends declared | — | — | — | — | (30,384 | ) | (30,384 | ) | ||||||||||||||
Net income | — | — | — | — | 237,971 | 237,971 | ||||||||||||||||
Balance at November 1, 2014 | 431,470 | $ | 431 | $ | 1,774,197 | $ | (18,814 | ) | $ | 652,247 | $ | 2,408,061 | ||||||||||
Issuance of common stock | 12,031 | 13 | 18,810 | — | — | 18,823 | ||||||||||||||||
Common stock repurchases | (29,578 | ) | (30 | ) | (343,656 | ) | — | — | (343,686 | ) | ||||||||||||
Tax benefit from employee stock plans | — | — | 47,999 | — | — | 47,999 | ||||||||||||||||
Stock-based compensation | — | — | 88,528 | — | — | 88,528 | ||||||||||||||||
Equity value of debt issuance | — | — | 47,106 | — | — | 47,106 | ||||||||||||||||
Change in net unrealized gains on cash flow hedges | — | — | — | 368 | — | 368 | ||||||||||||||||
Change in cumulative translation adjustments | — | — | — | (6,556 | ) | — | (6,556 | ) | ||||||||||||||
Cash dividends declared | — | — | — | — | (67,470 | ) | (67,470 | ) | ||||||||||||||
Net income | — | — | — | — | 340,362 | 340,362 | ||||||||||||||||
Balance at October 31, 2015 | 413,923 | $ | 414 | $ | 1,632,984 | $ | (25,002 | ) | $ | 925,139 | $ | 2,533,535 | ||||||||||
See accompanying Notes to Consolidated Financial Statements.
62
BROCADE COMMUNICATIONS SYSTEMS, INC.
NOTES TO CONSOLIDATED FINANCIAL STATEMENTS
1. Basis of Presentation
Brocade Communications Systems, Inc. (“Brocade” or the “Company”) is a leading supplier of networking hardware, software, and services, including Storage Area Networking (“SAN”) solutions and Internet Protocol (“IP”) Networking solutions for businesses and organizations of various types and sizes. Brocade’s end customers include global enterprises and other organizations and service providers, such as telecommunication firms, cable operators, and mobile carriers. Brocade’s products, services, and solutions simplify information technology (“IT”) infrastructure, increase resource utilization, ensure availability of mission critical applications, and support key IT services including Internet connectivity, enterprise mobility, virtualization, and cloud computing.
The Company’s fiscal year is a 52- or 53-week period ending on the last Saturday in October or the first Saturday in November, respectively. As is customary for companies that use the 52/53-week convention, every fifth year is a 53-week year. Fiscal year 2015 is a 52-week fiscal year, fiscal year 2014 was a 53-week fiscal year, and fiscal year 2013 was a 52-week fiscal year. The Company’s next 53-week fiscal year will be fiscal year 2019 and its next 14-week quarter will be the second quarter of fiscal year 2019.
The Company’s Consolidated Financial Statements include the accounts of Brocade and its wholly owned subsidiaries. All significant intercompany accounts and transactions have been eliminated.
Use of Estimates in Preparation of Consolidated Financial Statements
The preparation of consolidated financial statements and related disclosures in conformity with U.S. generally accepted accounting principles (“U.S. GAAP”) requires management to make estimates and judgments that affect the amounts reported in the consolidated financial statements and accompanying notes. Estimates are used for, but not limited to, revenue recognition, sales allowances and programs, allowance for doubtful accounts, stock-based compensation, acquisition purchase price allocations, warranty obligations, inventory valuation and purchase commitments, restructuring costs, incentive compensation, facilities lease losses, impairment of goodwill and other indefinite-lived intangible assets, litigation, income taxes, and investments. Actual results may differ materially from these estimates.
2. Summary of Significant Accounting Policies
Cash and Cash Equivalents
The Company considers all highly liquid investments with an original or remaining maturity of three months or less at the date of purchase to be cash equivalents.
Investments and Equity Securities
From time to time, the Company makes equity investments in non-publicly traded companies. These investments are included in “Other assets” on the accompanying Consolidated Balance Sheets and are generally accounted for under the cost method as the Company does not have the ability to exercise significant influence over the respective issuers’ operating and financial policies, nor does it have a liquidation preference that is substantive. The Company monitors its investments in non-publicly traded companies for impairment on a quarterly basis and makes appropriate reductions in carrying values when such impairments are determined to be other-than-temporary. Impairment charges are included in “Other income, net” on the Company’s Consolidated Statements of Income. Factors considered in determining an impairment include, but are not limited to, the current business environment including competition and uncertainty of financial condition, going concern considerations such as the rate at which the issuer company utilizes cash and the issuer company’s ability to obtain additional financing to fulfill its stated business plan, the need for changes to the issuer company’s existing business model due to changing business environments and its ability to successfully implement necessary changes, and comparable valuations. The carrying value of the Company’s equity investments in non-publicly traded companies at October 31, 2015, and November 1, 2014, was $2.5 million and $0.9 million, respectively.
Fair Value of Financial Instruments
The fair value of the Company’s financial instruments, including cash equivalents, accounts receivable, accounts payable, and accrued liabilities, approximate cost because of their short maturities.
63
Derivative Financial Instruments
In the normal course of business, the Company is exposed to fluctuations in interest rates and the exchange rates associated with foreign currencies. The derivatives entered into by the Company qualify for and are designated as foreign currency cash flow hedges.
The derivatives are recognized on the Company’s Consolidated Balance Sheets at their respective fair values. Changes in fair values of outstanding cash flow hedges that are highly effective are recorded in “Accumulated other comprehensive loss” until earnings are affected by cash flows from the underlying hedged transaction. In most cases, amounts recorded in “Accumulated other comprehensive loss” will be recorded in earnings at maturity of the related derivative. The recognition of effective hedge results offsets the gains or losses on the underlying exposure. Cash flows from derivative transactions are classified according to the nature of the risk being hedged by presenting the gain or loss on the matured derivatives and related impact from the underlying hedged transactions in the same line items on the Company’s Consolidated Statements of Income.
The Company formally documents all relationships between hedging instruments and hedged items, as well as the risk-management objective and strategy for undertaking hedge transactions. This documentation includes linking all derivatives either to specific assets and liabilities on the consolidated balance sheets or specific firm commitments or forecasted transactions. The Company also formally assesses, both at the hedge’s inception and on an ongoing basis, whether the derivatives used in hedging transactions have been highly effective in offsetting changes in the cash flows of hedged items and whether those derivatives may be expected to remain highly effective in future periods.
The Company discontinues hedge accounting prospectively when (i) the derivative is no longer highly effective in offsetting changes in the cash flows of a hedged item (including hedged items such as firm commitments or forecasted transactions); (ii) the derivative expires or is sold, terminated or exercised; (iii) it is no longer probable that the forecasted transaction will occur; or (iv) management determines that designating the derivative as a hedging instrument is no longer appropriate.
When the Company discontinues hedge accounting, but it continues to be probable that the forecasted transaction will occur in the originally expected period, the gain or loss on the derivative remains in accumulated other comprehensive loss and is reclassified into earnings when the forecasted transaction affects earnings. However, if it is no longer probable that a forecasted transaction will occur by the end of the originally specified time period or within an additional two-month period of time thereafter, the gain or loss that was in accumulated other comprehensive loss will be recognized immediately in earnings. In all situations in which hedge accounting is discontinued and the derivative remains outstanding, the Company will carry the derivative at its fair value on the Company’s Consolidated Balance Sheet until maturity and will recognize future changes in the fair value in current period earnings. Any hedge ineffectiveness is recorded in current period earnings within “Other income (loss), net.” Effectiveness is assessed based upon statistical regression analysis of changes in cash flows, as well as other relevant information.
Inventories
Inventories are stated at the lower of cost (first-in, first-out) or market. Inventory costs include material, labor, and overhead. The Company records inventory write-downs based on excess and obsolete inventory determined primarily by its forecast of future demand. A majority of the Company’s inventory is located off-site at customers’ hubs, third-party managed service depots and at contract manufacturers’ locations. Cash flows related to the sale of inventories are classified as cash flows from operating activities.
Property and Equipment
Property and equipment are stated at cost less accumulated depreciation and amortization. Depreciation is computed using the straight-line method over the estimated useful lives of the assets. An estimated useful life of three years is used for computer equipment and four to seven years is used for software based on the nature of the software purchased. Estimated useful lives of up to four years are used for engineering and other equipment, seven years is used for furniture and an estimated useful life of thirty-nine years is used for buildings. Leasehold improvements are amortized using the straight-line method over the shorter of ten years or the remaining term of the lease.
64
Brocade evaluates long-lived assets, such as property and equipment, for impairment whenever events or changes in circumstances indicate that the carrying value of an asset may not be recoverable in accordance with Accounting Standards Codification (“ASC”) 360-10 Property, Plant and Equipment. Brocade assesses the fair value of the assets based on the undiscounted future cash flow the assets are expected to generate and recognizes an impairment loss when the estimated undiscounted future cash flow expected to result from the use of the asset plus net proceeds expected to result from the disposition of the asset, if any, are less than the carrying value of the asset. When Brocade identifies an impairment, Brocade reduces the carrying amount of the asset to its estimated fair value based on a discounted cash flow approach or, when available and appropriate, to comparable market values.
Goodwill, Other Indefinite-lived Intangible Assets and Long-lived Intangible Assets
Goodwill and other indefinite-lived intangible assets are generated as a result of business combinations. Our indefinite-lived assets are comprised of acquired in-process research and development (“IPR&D”) and goodwill. IPR&D is an intangible asset accounted as an indefinite-lived asset until the completion or abandonment of the associated research and development effort.
During the development period, the Company conducts an IPR&D impairment test annually, as of the first day of the second fiscal quarter, and whenever events or changes in facts and circumstances indicate that it is more likely than not that the IPR&D is impaired. Events which might indicate impairment include, but are not limited to, adverse cost factors, deteriorating financial performance, strategic decisions made in response to economic and competitive conditions, the impact of the economic environment on us and our customer base, and/or other relevant events such as changes in management, key personnel, litigations, or customers.
The Company evaluates goodwill on an annual basis during its second fiscal quarter or whenever events occur or facts and circumstances change that would more likely than not reduce the fair value of a reporting unit below its carrying amount. An impairment loss is recognized to the extent that the carrying amount of goodwill exceeds the asset’s implied fair value. Events which might indicate impairment include, but are not limited to, strategic decisions made in response to economic and competitive conditions, the impact of the economic environment on the Company’s customer base, material negative changes in relationships with significant customers, and/or a significant decline in the Company’s stock price for a sustained period.
Long-lived intangible assets are carried at cost less accumulated amortization. Amortization is recognized on a straight-line basis over the estimated useful life of the respective asset. The Company evaluates intangible assets for impairment whenever events or changes in circumstances indicate that the carrying value of such assets may not be recoverable. Examples of such events or circumstances include, but are not limited to, significant underperformance relative to historical or projected future operating results, significant changes in the manner of use of acquired assets or the strategy for the Company’s business, significant negative industry or economic trends, and/or a significant decline in the Company’s stock price for a sustained period. Impairment is recognized based on the difference between the fair value of the asset and its carrying value. For additional discussion, see Note 4, “Goodwill and Intangible Assets,” of the Notes to Consolidated Financial Statements.
Litigation Costs
The Company is subject to the possibility of legal actions arising in the ordinary course of business. The Company regularly monitors the status of pending legal actions to evaluate both the magnitude and likelihood of any potential losses. An accrual for these potential losses is made when they are probable and the amount of loss, or possible range of loss, can be reasonably estimated. Legal costs related to such potential losses are expensed as incurred. In addition, recoveries are shown as a reduction in litigation costs in the period in which they are realized.
Concentrations
Financial instruments that potentially subject the Company to concentrations of credit risk consist primarily of cash, cash equivalents, and accounts receivable. Cash and cash equivalents are primarily maintained at five major financial institutions. Deposits held with banks may be redeemed upon demand and may exceed the amount of insurance provided on such deposits.
A majority of the Company’s accounts receivable balance is derived from sales to original equipment manufacturer (“OEM”) partners in the computer storage and server industry. As of October 31, 2015, one customer individually accounted for 17% of total accounts receivable. As of November 1, 2014, three customers individually accounted for 15%, 12%, and 11% of total accounts receivable, for a combined total of 38% of total accounts receivable. The Company performs ongoing credit evaluations of its customers and generally does not require collateral on accounts receivable balances. The Company has established reserves for credit losses and sales allowances.
65
For the fiscal years ended October 31, 2015, November 1, 2014, and October 26, 2013, the same three customers accounted for a combined total of 41% (EMC Corporation (“EMC”) with 17%, Hewlett Packard Enterprise Company (“HPE”) with 12%, and International Business Machines Corporation (“IBM”) with 12%), 46% (EMC with 18%, HPE with 12%, and IBM with 16%), and 46% (EMC with 18%, HPE with 12%, and IBM with 16%) of total net revenues, respectively.
The Company currently relies on single and limited sources for multiple key components used in the manufacture of its products. Additionally, the Company relies on multiple contract manufacturers (“CMs”) for the production of its products, including Hon Hai Precision Industry Co., Ltd. and Accton Technology Corporation. Although the Company uses standard parts and components for its products where possible, the Company’s CMs currently purchase, on their behalf, several key components used in the manufacture of products from single or limited supplier sources.
Revenue Recognition
Product revenue. Substantially all of the Company’s products are integrated with software that is essential to the functionality of the equipment. Additionally, the Company provides unspecified software upgrades and enhancements related to the equipment through its maintenance contracts for most of its products. Product revenue is generally recognized when all of the following criteria have been met:
• | Persuasive evidence of an arrangement exists; |
• | Delivery has occurred; |
• | The fee is fixed or determinable; and |
• | Collectibility is reasonably assured. |
For newly introduced products, many of the Company’s large OEM customers require a product qualification period during which the Company’s products are tested and approved by the OEM customers for sale to their customers. Revenue recognition and related cost are deferred for shipments to new OEM customers and for shipments of newly introduced products to existing OEM customers until satisfactory evidence of completion of the product qualification has been received from the OEM customer. In addition, revenue from sales to the Company’s distributor customers is recognized in the same period in which the product is actually sold by the distributor (sell-through).
The Company reduces revenue for estimated sales allowances at the time of shipment and sales programs at the later of revenue recognition or communication of the commitment for sales incentives. Sales allowances are estimated based on historical sales returns. Sales programs are estimated based on approved sales programs versus claims under such sales programs, current trends and the Company’s expectations regarding future activity. In addition, the Company maintains an allowance for doubtful accounts, which is also accounted for as a reduction in revenue. The Company establishes the allowance for doubtful accounts to ensure accounts receivable are not overstated due to uncollectibility. The Company maintains bad debt reserves based upon the analysis of accounts receivable, historical collection patterns, customer concentrations, customer creditworthiness, current economic trends, changes in customer payment terms and practices, and customer communication. The Company records a specific reserve for individual accounts when it becomes aware of a customer’s likely inability to meet its financial obligations, such as in the case of bankruptcy filings or deterioration in the customer’s operating results or financial position. If circumstances related to customers change, the Company would further adjust estimates of the recoverability of receivables.
Multiple-element arrangements. The Company’s multiple-element product offerings include networking hardware with embedded software products and support, which are considered separate units of accounting. For certain of the Company’s products, software and non-software components function together to deliver the tangible products’ essential functionality.
The Company allocates revenue to each element in a multiple-element arrangement based upon their relative selling price. When applying the relative selling price method, the Company determines the selling price for each deliverable using vendor-specific objective evidence (“VSOE”) of selling price, if it exists, or third-party evidence (“TPE”) of selling price. If neither VSOE nor TPE of selling price exist for a deliverable, the Company uses its best estimate of selling price for that deliverable. Revenue allocated to each element is then recognized when the basic revenue recognition criteria are met for each element.
The Company determines VSOE based on its normal pricing and discounting practices for the specific product or service when sold separately. In determining VSOE, the Company requires that a substantial majority of the selling prices for a product or service fall within a reasonably narrow pricing range. For post-contract customer support (“PCS”), the Company considers stated renewal rates in determining VSOE.
66
In most instances, the Company is not able to establish VSOE for all deliverables in an arrangement with multiple elements. This may be due to the Company infrequently selling each element separately, not pricing products within a narrow range, or only having a limited sales history. When VSOE cannot be established, the Company attempts to establish the selling price for each element based on TPE. TPE is determined based on competitor prices for similar deliverables when sold separately. Generally, the Company’s go-to-market strategy differs from that of its peers and its offerings contain a significant level of customization and differentiation such that the comparable pricing of products with similar functionality cannot be obtained. Furthermore, the Company is unable to reliably determine what similar competitor products’ selling prices are on a stand-alone basis. Therefore, the Company is typically unable to determine TPE.
When the Company is unable to establish selling price using VSOE or TPE, the Company uses estimated selling price (“ESP”) in its allocation of the arrangement consideration. The objective of ESP is to determine the price at which the Company would transact a sale if the product or service were sold on a stand-alone basis. ESP is generally used for offerings that are not typically sold on a stand-alone basis or for new or highly customized offerings.
The Company determines ESP for a product by considering multiple factors including, but not limited to, geographies, market conditions, competitive landscape, internal costs, gross margin objectives and pricing practices. The determination of ESP is made through consultation with and formal approval by the Company’s management, taking into consideration the go-to-market strategy.
The Company regularly reviews VSOE, TPE and ESP, as well as the establishment and updates of these estimates. There was no material impact on revenues during the fiscal year ended October 31, 2015, nor does the Company expect a material impact in the near term from changes in VSOE, TPE or ESP.
Services revenue. Services revenue consists of professional services and maintenance arrangements, including PCS and other professional services. PCS services are offered under renewable, annual fee-based contracts or as part of multiple-element arrangements, and typically include telephone support and upgrades and enhancements to the Company’s operating system software. Revenue related to PCS elements is deferred and recognized ratably over the contractual period. PCS contracts are typically one to three years in length.
Professional services are offered under hourly or fixed fee-based contracts. Professional services revenue is recognized as services are performed.
Warranty Expense
The Company provides standard warranties on its products ranging from one year to limited lifetime warranties. Estimated future warranty costs are accrued at the time of shipment and charged to cost of revenues based upon historical experience, current trends in warranty claims, and the Company’s expectations regarding future experience.
Foreign Currency
Assets and liabilities of the Company’s international subsidiaries in which the local currency is the functional currency are translated into U.S. dollars at period-end exchange rates. Income and expenses are translated into U.S. dollars at the average exchange rates during the period. The resulting translation adjustments are included in the Company’s Consolidated Balance Sheets in the stockholders’ equity section as a component of accumulated other comprehensive loss. Foreign exchange gains and losses for assets and liabilities of the Company’s international subsidiaries in which the functional currency is the U.S. dollar are recorded in the Company’s Consolidated Statement of Income.
Capitalized Software Development Costs
Eligible development costs for software to be sold are capitalized upon the establishment of technological feasibility, which is defined as being equivalent to completion of a beta-phase working prototype. Total eligible software development costs have not been material to date.
Eligible costs related to internal development or purchase of software for internal use are capitalized and included in “Property and equipment, net.” These costs are being depreciated over the estimated useful lives of four to seven years based on the nature of the software purchased.
Advertising Costs
The Company expenses all advertising costs as incurred. Advertising costs were $13.6 million, $17.6 million, and $15.3 million for the fiscal years ended October 31, 2015, November 1, 2014, and October 26, 2013, respectively.
67
During the fiscal year ended October 27, 2012, the Company entered into a multi-year arrangement which includes exchanging certain of the Company’s products and services, with the estimated overall fair value of $16.6 million, for advertising. The Company is accounting for this transaction based on fair values of products and services surrendered and recognized $1.1 million, $2.4 million, and $7.1 million of gross operating revenue for the fiscal years ended October 31, 2015, November 1, 2014, and October 26, 2013, respectively. In addition, $4.0 million of the advertising costs for the fiscal year ended October 31, 2015, were incurred in connection with this multi-year arrangement, and the remaining advertising prepayment is currently recorded within “Prepaid expenses and other current assets” and “Other assets.”
Income Taxes
The Company recognizes income tax expense for the amount of taxes payable or refundable for the current year. Deferred tax assets and liabilities are recognized for the expected tax consequences of temporary differences between the tax bases of assets and liabilities and their reported amounts, along with net operating loss carryforwards and credit carryforwards. A valuation allowance is recognized to the extent that it is more likely than not that the tax benefits will not be realized.
The Company accounts for uncertainty in income taxes using a two-step approach to recognizing and measuring uncertain tax positions. The first step is to evaluate the tax position for recognition by determining if the weight of available evidence indicates that it is more likely than not that the position will be sustained on audit, including resolution of related appeals or litigation processes, if any. The second step is to measure the tax benefit as the largest amount that is more than 50% likely of being realized upon settlement. The Company classifies the liability for unrecognized tax benefits as current to the extent that the Company anticipates payment (or receipt) of cash within one year. Interest and penalties related to uncertain tax positions are recognized in the provision for income taxes. For additional discussion, see Note 15, “Income Taxes,” of the Notes to Consolidated Financial Statements.
Computation of Net Income per Share
Basic net income per share is computed using the weighted-average number of common shares outstanding during the period, less shares subject to repurchase. Diluted net income per share is computed using the weighted-average number of common shares outstanding and potentially dilutive common shares outstanding during the period that have a dilutive effect on earnings per share. Potentially dilutive common shares result from the assumed exercise of outstanding stock options, assumed vesting of outstanding restricted stock units (“RSUs”), assumed issuance of stock under the employee stock purchase plan, and assumed conversion of outstanding convertible senior unsecured notes and exercise of related warrant transactions, all using the treasury stock method.
Stock-Based Compensation
The Company accounts for employee equity awards under the fair value method. Accordingly, the Company measures stock-based compensation at the grant date based on the fair value of the award. The fair values of stock options and the Employee Stock Purchase Plan (“ESPP”) are estimated using the Black-Scholes option pricing model. Estimated compensation cost relating to time-based RSUs granted prior to the initial declaration of a quarterly cash dividend on May 22, 2014, is based on the fair value of the Company’s common stock on the date of grant because Brocade did not historically pay cash dividends on its common stock. For time-based RSUs granted on or subsequent to May 22, 2014, the fair value of RSUs is measured based on the grant-date share price, less the present value of expected dividends during the vesting period, discounted at a risk-free interest rate. The fair value of restricted stock units with market conditions (“MSUs”) is estimated using a lattice model that incorporates a Monte Carlo simulation. The Company records stock-based compensation expense over the 24-month offering period in connection with shares issued under its ESPP. The compensation expense for stock-based awards is reduced by an estimate for forfeitures and is recognized over the vesting period of the award under a graded vesting method, except for RSUs granted by the Company, which is recognized over the expected term of the award under a straight-line vesting method. For additional discussion, see Note 12, “Stock-Based Compensation,” of the Notes to Consolidated Financial Statements.
The Company accounts for the tax effects of share-based payment awards using the alternative transition method, which includes simplified methods to establish the beginning balance of the additional paid-in capital pool (“APIC Pool”) related to the tax effects of employee stock-based compensation and to determine the subsequent impact on the APIC Pool and consolidated statement of cash flows of the tax effects of employee stock-based compensation awards.
68
New Accounting Pronouncements or Updates Recently Adopted
In March 2013, the Financial Accounting Standards Board (“FASB”) issued an update to Accounting Standards Codification (“ASC” or the “Codification”) 830, Foreign Currency Matters: Parent’s Accounting for the Cumulative Translation Adjustment upon Derecognition of Certain Subsidiaries or Groups of Assets within a Foreign Entity or of an Investment in a Foreign Entity. Under this update, an entity is required to release any cumulative translation adjustment into net income when the entity ceases to have a controlling financial interest resulting from the complete, or substantially complete, liquidation of a subsidiary or group of assets within a foreign entity. This update should be applied prospectively. The Company adopted this update in the first quarter of fiscal year 2015. There was no material impact on the Company’s financial position, results of operations, or cash flows.
In June 2015, the FASB issued an update to the Codification, Technical Corrections and Improvements. This update includes various amendments to clarify the Codification, correct unintended application of guidance, or make minor improvements to the Codification. This update is not intended to change U.S. GAAP. The Company adopted this update in the third quarter of fiscal year 2015. There was no material impact on the Company’s financial position, results of operations, or cash flows.
Recent Accounting Pronouncements or Updates That Are Not Yet Effective
In April 2014, the FASB issued an update to ASC 205 Presentation of Financial Statements (“ASC 205”) and ASC 360 Property, Plant, and Equipment (“ASC 360”): Reporting Discontinued Operations and Disclosures of Disposals of Components of an Entity. Under this update, a discontinued operation may include a component of an entity or a group of components of an entity, or a business or nonprofit activity. Only those disposals of components of an entity that represent a strategic shift that has, or will have, a major effect on an entity’s operations and financial results will be reported as discontinued operations in the financial statements. This update to ASC 205 and ASC 360 should be applied prospectively and will be adopted by the Company in the first quarter of fiscal year 2016. The Company does not expect the adoption of this update to have a material impact on its consolidated financial statements.
In May 2014, the FASB issued an update to ASC 606 Revenue from Contracts with Customers (“ASC 606”) that will supersede virtually all existing revenue guidance. Under this update, an entity is required to recognize revenue upon transfer of promised goods or services to customers, in an amount that reflects the expected consideration received in exchange for those goods or services. As such, an entity will need to use more judgment and make more estimates than under the current guidance. This update to ASC 606 should be applied retrospectively either to each prior reporting period presented in the financial statements, or only to the most current reporting period presented in the financial statements with a cumulative effect adjustment recorded in the retained earnings. In August 2015, the FASB issued an update to defer the effective date of this update by one year. This update becomes effective and will be adopted by the Company in the first quarter of fiscal year 2019. Early adoption is not permitted for reporting periods before the first quarter of fiscal year 2019. The Company is currently evaluating the impact of this update on its consolidated financial statements.
In April 2015, the FASB issued an update to ASC 835, Interest—Imputation of Interest: Simplifying the Presentation of Debt Issuance Costs. Under this update, debt issuance costs are required to be presented as a direct deduction from the carrying amount of the related debt liability, consistent with the presentation of debt discounts. The recognition and measurement guidance for debt issuance costs are not affected by this update. This update is effective for the Company in the first quarter of fiscal year 2017, with early adoption permitted. This update should be applied retrospectively to all prior periods presented in the financial statements and will be early adopted by the Company in the first quarter of fiscal year 2016. The Company does not expect the adoption of this update to have a material impact on its consolidated financial statements.
In April 2015, the FASB issued an update to ASC 350, Intangibles—Goodwill and Other—Internal-Use Software: Customer’s Accounting for Fees Paid in Cloud Computing Arrangement. This update provides guidance on the accounting for fees paid in a cloud computing arrangement if the arrangement was determined to include a software license. This update will not change U.S. GAAP for a customer’s accounting for service contracts. This update may be applied either prospectively or retrospectively and will be adopted by the Company in the first quarter of fiscal year 2017. Early adoption is permitted. The Company does not expect the adoption of this update to have a material impact on its consolidated financial statements.
In July 2015, the FASB issued an update to ASC 330, Inventory: Simplifying the Measurement of Inventory. Under this update, subsequent measurement of inventory is based on the lower of cost or net realizable value. Net realizable value is the estimated selling price in the ordinary course of business, less the estimated cost of completion and disposal. This update does not apply to inventory that is measured using last-in, first-out or the retail inventory method. This update should be applied prospectively and will be adopted by the Company in the first quarter of fiscal year 2018. Early adoption is permitted. The Company does not expect the adoption of this update to have a material impact on its consolidated financial statements.
69
In September 2015, the FASB issued an update to ASC 805, Business Combinations: Simplifying the Accounting Measurement-Period Adjustments. This update simplifies the accounting for adjustments made to provisional amounts recognized in a business combination by eliminating the requirement to retrospectively account for those adjustments. Under this update, the adjustments are recognized in the reporting period in which the adjustment amounts are determined. This update is effective for the Company in the first quarter of fiscal year 2017 and should be applied prospectively. Early adoption is permitted. The Company does not expect the adoption of this update to have a material impact on its consolidated financial statements.
In November 2015, the FASB issued an update to ASC 740, Income Taxes: Balance Sheet Classification of Deferred Taxes. This update simplifies the presentation of current and noncurrent deferred tax liabilities and assets. Under this update, the deferred tax liabilities and assets are classified as noncurrent on the balance sheet. The update does not impact the current requirement that deferred tax liabilities and assets be offset and presented as a single amount. This update is effective for the Company in the first quarter of fiscal year 2018 and may be applied either prospectively or retrospectively. Early adoption is permitted. The Company expects the adoption of this update will result in a reclassification of deferred tax amounts on the consolidated balance sheets.
3. Acquisitions and Divestitures
Acquisitions
In March 2015, the Company completed its acquisition of two businesses to strengthen its software networking portfolio. The total aggregate purchase price of the acquisitions was $96.1 million, consisting of $95.5 million in cash consideration, which is gross of $0.1 million of cash acquired as part of the acquisitions, and $0.5 million in non-cash consideration. For the fiscal year ended October 31, 2015, the Company recorded direct acquisition costs and integration costs of $1.4 million and $2.5 million, respectively. These costs were expensed as incurred and are presented in the Company’s Consolidated Statements of Income for the fiscal year ended October 31, 2015, as “Acquisition and integration costs.”
The results of operations for both acquisitions are included in the Company’s Consolidated Statements of Income from the respective dates of acquisition. The Company does not consider these acquisitions to be significant, individually or in the aggregate, to its results of operations or financial position. Therefore, the Company is not presenting pro-forma financial information of combined operations.
In connection with these acquisitions, the Company allocated the total purchase consideration to the net assets acquired and liabilities assumed, including identifiable intangible assets, based on their respective fair values at the acquisition dates. The Company determined the fair value of the intangible assets acquired primarily using the income approach and the market approach with the assistance of a valuation firm. Estimates and assumptions with respect to the determination of the fair value of the intangible assets acquired include, but are not limited to, forecasted revenues, discount rates, and comparable market transactions.
70
The following table summarizes the final allocation of the total aggregate purchase price based on the estimated fair values of the assets acquired and liabilities assumed at the acquisition dates (in thousands):
Assets acquired: | |||
Cash | $ | 161 | |
Accounts receivable | 154 | ||
Property and equipment, net | 1,432 | ||
Identifiable intangible assets: | |||
Core/developed technology | 28,450 | ||
Customer relationships | 22,030 | ||
Patents with broader applications | 1,040 | ||
Trade name | 500 | ||
Non-compete agreements | 240 | ||
Total identifiable intangible assets | 52,260 | ||
Goodwill (1) | 49,444 | ||
Other assets | 86 | ||
Total assets acquired | 103,537 | ||
Liabilities assumed: | |||
Deferred revenue | (3,603 | ) | |
Deferred tax liabilities | (3,049 | ) | |
Other accrued liabilities | (795 | ) | |
Total liabilities assumed | (7,447 | ) | |
Net assets acquired | $ | 96,090 | |
(1) | The goodwill recognized primarily represents potential synergies from combining operations of the acquired businesses and the Company, as well as intangible assets that do not qualify for separate recognition. The total amount of goodwill that is expected to be deductible for tax purposes is $38.1 million. |
In conjunction with the acquisitions, the Company granted RSU awards and cash awards to transferring or continuing employees of the acquired businesses. These awards require the employees to continue providing services to the Company for the duration of the vesting or payout periods.
For certain employees, the Company granted RSUs with an aggregate fair value of $6.4 million at the grant date, with RSUs vesting approximately every six months for a total vesting period of approximately two years. The RSUs are accounted for as stock-based compensation expense and reported, as applicable, within “Cost of revenues,” “Research and development,” “Sales and marketing,” and “General and administrative” on the Company’s Consolidated Statements of Income. For the fiscal year ended October 31, 2015, the Company recognized $1.6 million of stock-based compensation expense related to these RSU awards.
For certain other employees, the Company will pay a total aggregate amount of $10.3 million as cash awards for their services. The cash awards are paid out in annual installments over a total period of four years. The cash awards are accounted for as employee compensation expense and reported within “Research and development” on the Company’s Consolidated Statements of Income. For the fiscal year ended October 31, 2015, the Company recognized $4.8 million of compensation expense related to these cash awards.
For one of the acquisitions, the Company held an existing equity interest in the business at an acquisition-date fair value of $0.4 million. The Company used a market approach based on comparable recent investments in this acquired business to estimate the acquisition-date fair value of the existing equity interest. No gain or loss was recognized as a result of remeasuring the existing equity interest, as the cost of the existing equity interest approximated its fair value.
On September 11, 2014, the Company completed its acquisition of the assets of Vistapointe, Inc. (“Vistapointe”), a privately held developer of network visibility and analytics solutions with facilities located in San Ramon, California and Bangalore, India, and certain assets of its related entities. This acquisition has enhanced Brocade’s leadership role in developing software-based, carrier-grade network visibility and analytics (“NVA”) solutions for mobile network operators. This acquisition has also enhanced Brocade’s leadership in network functions virtualization (“NFV”) technology and gives Brocade a new market to address with visibility and analytics solutions for mobile operators.
71
The results of operations of Vistapointe are included in the Company’s Consolidated Statement of Income from the date of the acquisition. The Company does not consider the acquisition of the assets of Vistapointe to be material to its results of operations or financial position, and therefore, the Company is not presenting pro-forma financial information of combined operations.
The total purchase price was $16.9 million, consisting entirely of cash consideration. In addition, the Company paid direct acquisition costs of $0.4 million.
In connection with this acquisition, the Company allocated the total purchase consideration to the net assets and liabilities acquired, including identifiable intangible assets, based on their respective fair values at the acquisition date. The following table summarizes the final allocation of the purchase price to the fair value of the assets and liabilities acquired (in thousands):
Assets acquired: | |||
Identifiable intangible assets: | |||
In-process technology | $ | 2,850 | |
Developed technology | 1,710 | ||
Trade name | 130 | ||
Total identifiable intangible assets | 4,690 | ||
Goodwill | 11,475 | ||
Property and equipment, net | 735 | ||
Net assets acquired | $ | 16,900 | |
On November 9, 2012, the Company completed its acquisition of Vyatta, Inc. (“Vyatta”), a privately held developer of a software-based network operating system suite headquartered in Belmont, California. Vyatta became a wholly owned subsidiary of the Company as a result of the acquisition. The Vyatta operating system suite is deployed on conventional computer hardware platforms for multiple applications in network virtualization, software-defined networking (“SDN”), NFV, and other private/public cloud computing platforms. The software acquired as part of this acquisition complements Brocade’s investments in IP switches and router products and enables the Company to pursue new market opportunities in data center virtualization, including public cloud, virtual private cloud, and managed services.
The results of operations of Vyatta are included in the Company’s Consolidated Statement of Income from the date of the acquisition. The Company does not consider the acquisition of Vyatta to be material to its results of operations or financial position, and therefore, the Company is not presenting pro-forma financial information of combined operations.
The total purchase price was $44.8 million, consisting of $43.6 million cash consideration and $1.2 million related to prepaid license fees paid by the Company to Vyatta that was effectively settled at the recorded amount as a result of the acquisition. In addition, the Company paid direct acquisition costs of $0.4 million.
Divestitures
On January 17, 2014, the Company completed the sale of its network adapter business to QLogic Corporation as part of the Company’s business strategy to focus development on a portfolio of high-performance networking hardware and software-based products and services.
The net carrying amount of the network adapter business’ assets and liabilities at the time of the divestiture was $5.1 million, comprised primarily of associated goodwill of $4.1 million. The sale resulted in a gain of $4.9 million, which is presented in the Company’s Consolidated Statements of Income as “Gain on sale of network adapter business.”
72
4. Goodwill and Intangible Assets
The following table presents a summary of the net carrying value of the Company’s intangible assets (in thousands):
October 31, 2015 | November 1, 2014 | ||||||
Indefinite-lived intangible assets: | |||||||
Goodwill | $ | 1,617,161 | $ | 1,567,723 | |||
In-process research and development (1) | 15,110 | 15,110 | |||||
Finite-lived intangible assets: | |||||||
Total intangible assets subject to amortization (2), (3) | 60,513 | 11,548 | |||||
Total intangible assets | $ | 1,692,784 | $ | 1,594,381 | |||
(1) | Acquired IPR&D is an intangible asset accounted for as an indefinite-lived asset until the completion or abandonment of the associated research and development effort. If the research and development effort associated with the IPR&D is successfully completed, then the IPR&D intangible asset will be amortized over its estimated useful life to be determined at the date the effort is completed. The development effort on the remaining IPR&D intangible asset is expected to be completed by the first quarter of fiscal year 2016. |
(2) | During the fiscal year ended October 31, 2015, the Company purchased a perpetual, nonexclusive license to certain patents for $7.8 million. |
(3) | During the fiscal year ended October 31, 2015, the Company acquired $52.3 million of intangible assets related to the Company’s acquisition of two businesses. See Note 3, “Acquisitions and Divestitures,” of the Notes to Consolidated Financial Statements. |
The Company conducts the IPR&D impairment test annually, as of the first day of the second fiscal quarter, or when events occur or facts and circumstances indicate that it is more likely than not that the IPR&D is impaired. For the annual IPR&D impairment test for fiscal year 2015, the Company elects the option to first assess qualitative factors to determine whether the existence of events or circumstances leads to a determination that it is more likely than not that the fair value of the IPR&D assets is less than the carrying amount. If, after assessing the totality of events and circumstances, the Company determines that it is more likely than not that the fair value of the IPR&D assets is less than the carrying amount, then the Company conducts a quantitative analysis to determine the fair value of the IPR&D assets. If the carrying amount of the IPR&D assets exceeds the fair value, then the Company recognizes an impairment loss equal to the difference.
Based on the results of the annual IPR&D impairment analysis performed during the second fiscal quarter of 2015, the Company determined that no impairment needed to be recorded. As of October 31, 2015, no new events or circumstances had arisen since the annual IPR&D impairment analysis performed during the second quarter of fiscal year 2015 that indicated that the fair value of the IPR&D assets may be less than the current carrying amount.
73
The following table summarizes goodwill activity by reportable segment during the fiscal years ended October 31, 2015, and November 1, 2014 (in thousands):
SAN Products | IP Networking Products | Global Services | Total | ||||||||||||
Balance at October 26, 2013 | |||||||||||||||
Goodwill | $ | 176,878 | $ | 1,358,975 | $ | 155,416 | $ | 1,691,269 | |||||||
Accumulated impairment losses | — | (45,832 | ) | — | (45,832 | ) | |||||||||
176,878 | 1,313,143 | 155,416 | 1,645,437 | ||||||||||||
Impairment (1) | — | (83,382 | ) | — | (83,382 | ) | |||||||||
Divestitures (2) | (474 | ) | (3,657 | ) | — | (4,131 | ) | ||||||||
Acquisition | — | 11,475 | — | 11,475 | |||||||||||
Tax and other adjustments (3) | (58 | ) | (1,618 | ) | — | (1,676 | ) | ||||||||
Balance at November 1, 2014 | |||||||||||||||
Goodwill | 176,346 | 1,365,175 | 155,416 | 1,696,937 | |||||||||||
Accumulated impairment losses | — | (129,214 | ) | — | (129,214 | ) | |||||||||
176,346 | 1,235,961 | 155,416 | 1,567,723 | ||||||||||||
Acquisitions (4) | — | 49,458 | — | 49,458 | |||||||||||
Purchase accounting adjustments | — | (15 | ) | — | (15 | ) | |||||||||
Tax and other adjustments (3) | (21 | ) | — | — | (21 | ) | |||||||||
Translation adjustments | — | 16 | — | 16 | |||||||||||
Balance at October 31, 2015 | |||||||||||||||
Goodwill | 176,325 | 1,414,634 | 155,416 | 1,746,375 | |||||||||||
Accumulated impairment losses | — | (129,214 | ) | — | (129,214 | ) | |||||||||
$ | 176,325 | $ | 1,285,420 | $ | 155,416 | $ | 1,617,161 | ||||||||
(1) | In the second quarter of fiscal year 2014, the Company made a strategic change in the allocation of its engineering resources by reducing its investment in engineering and sales for the hardware-based Brocade ADX products and increasing engineering investment in the software-based Brocade ADX products for Layer 4-7 applications. As a result of this change in strategy, the Company expected hardware-based Brocade ADX and related support revenue to be negatively impacted. Based on these changes in estimates, the Company recognized an impairment charge during the second fiscal quarter of 2014 because the book value of its Application Delivery Products (“ADP”) reporting unit net assets, which includes the Brocade ADX products, exceeded the estimated fair value of these assets. The goodwill amount related to the Company’s other reporting units was not impacted. |
(2) | The goodwill disposed relates to the sale of the Company’s network adapter business. See Note 3, “Acquisitions and Divestitures,” of the Notes to Consolidated Financial Statements. |
(3) | The goodwill adjustments were primarily a result of tax benefits from the exercise of stock awards of acquired companies. |
(4) | The goodwill acquired relates to the Company’s acquisition of two businesses, which is gross of the adjustments recorded during the purchase price allocation period. See Note 3, “Acquisitions and Divestitures,” of the Notes to Consolidated Financial Statements. |
The Company conducts its goodwill impairment test annually, as of the first day of the second fiscal quarter, and whenever events occur or facts and circumstances change that would more likely than not reduce the fair value of a reporting unit below its carrying amount. For the annual goodwill impairment test, the Company uses the income approach, the market approach, or a combination thereof to determine each reporting unit’s fair value. The income approach provides an estimate of fair value based on discounted expected future cash flows (“DCF”). The market approach provides an estimate of fair value by applying various observable market-based multiples to the reporting unit’s operating results and then applying an appropriate control premium. For the fiscal year 2015 annual goodwill impairment test, the Company used a combination of approaches to estimate each reporting unit’s fair value. The Company believed that at the time of impairment testing performed in the second fiscal quarter of 2015, the income approach and the market approach were equally representative of a reporting unit’s fair value.
74
Determining the fair value of a reporting unit or an intangible asset requires judgment and involves the use of significant estimates and assumptions. The Company based its fair value estimates on assumptions it believes to be reasonable, but inherently uncertain. Estimates and assumptions with respect to the determination of the fair value of its reporting units using the income approach include, among other inputs:
• | The Company’s operating forecasts; |
• | The Company’s forecasted revenue growth rates; and |
• | Risk-commensurate discount rates and costs of capital. |
The Company’s estimates of revenues and costs are based on historical data, various internal estimates, and a variety of external sources, and are developed as part of our regular long-range planning process. The control premium used in market or combined approaches is determined by considering control premiums offered as part of the acquisitions that have occurred in market segments that are comparable with the Company’s reporting units.
Based on the results of the annual goodwill impairment analysis performed during the second fiscal quarter of 2015, the Company determined that no impairment needed to be recorded. As of October 31, 2015, no new events or circumstances had arisen since the annual goodwill impairment analysis performed during the second quarter of fiscal year 2015 that indicated that the fair values of the reporting units may be less than their current carrying amounts.
The Company acquired certain finite-lived intangible assets as part of its acquisitions during the fiscal years ended October 31, 2015, November 1, 2014, and October 26, 2013 (see Note 3, “Acquisitions and Divestitures,” of the Notes to Consolidated Financial Statements). The acquired finite-lived intangible assets are amortized on a straight-line basis over their estimated useful lives. The Company did not incur costs to renew or extend the term of any acquired finite-lived intangible assets during the fiscal years ended October 31, 2015, November 1, 2014, and October 26, 2013. The following table presents the fair values and weighted-average useful lives of the acquired finite-lived intangible assets (in thousands, except for weighted-average useful life):
Fiscal Year Ended | |||||||||||||||||||
October 31, 2015 | November 1, 2014 | October 26, 2013 | |||||||||||||||||
Fair Value | Weighted- Average Useful Life (in years) | Fair Value | Weighted- Average Useful Life (in years) | Fair Value | Weighted- Average Useful Life (in years) | ||||||||||||||
Trade names | $ | 500 | 6.00 | $ | 130 | 5.00 | $ | 460 | 4.00 | ||||||||||
Core/developed technology | 28,450 | 4.04 | 1,710 | 5.00 | 1,040 | 3.00 | |||||||||||||
Customer relationships | 22,030 | 7.93 | — | — | 1,080 | 5.00 | |||||||||||||
Non-compete agreements | 240 | 2.00 | — | — | 810 | 4.00 | |||||||||||||
Patents with broader applications (1) | 1,040 | 15.00 | — | — | — | — | |||||||||||||
Total intangible assets | $ | 52,260 | 5.91 | $ | 1,840 | 5.00 | $ | 3,390 | 4.01 | ||||||||||
(1) | These patents were acquired by the Company as part of an acquisition in fiscal year 2015. The potential use of these patents extends beyond their use in the core/developed technology acquired. |
75
Intangible assets other than goodwill are amortized on a straight-line basis over the following estimated remaining useful lives, unless the Company has determined these lives to be indefinite. The following tables present details of the Company’s finite-lived intangible assets (in thousands, except for weighted-average remaining useful life):
Gross Carrying Value | Accumulated Amortization | Net Carrying Value | Weighted- Average Remaining Useful Life (in years) | ||||||||||
October 31, 2015 | |||||||||||||
Trade names | $ | 1,090 | $ | 415 | $ | 675 | 4.36 | ||||||
Core/developed technology | 40,530 | 9,605 | 30,925 | 3.49 | |||||||||
Patent portfolio license (1) | 7,750 | 849 | 6,901 | 17.74 | |||||||||
Customer relationships | 23,110 | 2,484 | 20,626 | 7.18 | |||||||||
Non-compete agreements | 1,050 | 664 | 386 | 1.17 | |||||||||
Patents with broader applications | 1,040 | 40 | 1,000 | 14.38 | |||||||||
Total intangible assets | $ | 74,570 | $ | 14,057 | $ | 60,513 | 6.55 | ||||||
Gross Carrying Value | Accumulated Amortization | Net Carrying Value | Weighted- Average Remaining Useful Life (in years) | ||||||||||
November 1, 2014 | |||||||||||||
Trade names | $ | 590 | $ | 227 | $ | 363 | 3.00 | ||||||
Core/developed technology | 12,080 | 1,964 | 10,116 | 4.30 | |||||||||
Customer relationships | 1,080 | 427 | 653 | 3.01 | |||||||||
Non-compete agreements | 810 | 394 | 416 | 2.01 | |||||||||
Total intangible assets (2) | $ | 14,560 | $ | 3,012 | $ | 11,548 | 4.10 | ||||||
(1) | The patent portfolio license was assigned an estimated useful life that reflects the Company’s consumption of the expected defensive benefits related to this license to certain patents. The method of amortization for the patent portfolio license reflects the Company’s estimate of the pattern in which these expected defensive benefits will be used by the Company and is primarily based on the mix of expiration patterns of the individual patents included in the license. |
(2) | During the fiscal year ended November 1, 2014, $477.3 million of finite-lived intangible assets became fully amortized and, therefore, were removed from the balance sheet. |
The following table presents the amortization of finite-lived intangible assets included on the Company’s Consolidated Statements of Income (in thousands):
Fiscal Year Ended | |||||||||||
October 31, 2015 | November 1, 2014 | October 26, 2013 | |||||||||
Cost of revenues | $ | 7,640 | $ | 8,010 | $ | 39,731 | |||||
General and administrative (1) | 849 | — | — | ||||||||
Other operating expense | 2,556 | 10,280 | 54,256 | ||||||||
Total | $ | 11,045 | $ | 18,290 | $ | 93,987 | |||||
(1) | The amortization is related to the $7.8 million of perpetual, nonexclusive license to certain patents purchased during the fiscal year ended October 31, 2015. |
76
The following table presents the estimated future amortization of finite-lived intangible assets as of October 31, 2015 (in thousands):
Fiscal Year | Estimated Future Amortization | ||
2016 | $ | 14,774 | |
2017 | 14,305 | ||
2018 | 9,785 | ||
2019 | 6,259 | ||
2020 | 5,168 | ||
Thereafter | 10,222 | ||
Total | $ | 60,513 | |
5. Restructuring and Other Related Costs
The following table provides details of the Company’s restructuring and other related costs (in thousands):
Fiscal Year Ended | |||||||||||
October 31, 2015 | November 1, 2014 | October 26, 2013 | |||||||||
Goodwill impairment | $ | — | $ | 83,382 | $ | — | |||||
Severance and benefits | — | (1,788 | ) | 20,413 | |||||||
Contract terminations and other | — | — | 3,981 | ||||||||
Lease loss reserve and related costs (benefits) | (678 | ) | 7,686 | 1,070 | |||||||
Restructuring, goodwill impairment, and other related costs (benefits) | $ | (678 | ) | $ | 89,280 | $ | 25,464 | ||||
The following table provides a reconciliation of the Company’s beginning and ending restructuring liability balances (in thousands):
Fiscal 2013 Fourth Quarter Restructuring Plan | Other Restructuring Plans | ||||||||||||||||||
Severance and Benefits | Contract Terminations and Other | Lease Loss Reserve and Related Costs | Lease Loss Reserve and Related Costs | Total | |||||||||||||||
Restructuring liabilities at October 26, 2013 | $ | 15,216 | $ | 416 | $ | — | $ | 1,794 | $ | 17,426 | |||||||||
Restructuring and other charges | 18 | — | 7,686 | — | 7,704 | ||||||||||||||
Cash payments | (13,258 | ) | (374 | ) | (3,600 | ) | (800 | ) | (18,032 | ) | |||||||||
Other adjustments, net | (1,805 | ) | — | — | — | (1,805 | ) | ||||||||||||
Translation adjustment | — | — | (137 | ) | — | (137 | ) | ||||||||||||
Restructuring liabilities at November 1, 2014 | 171 | 42 | 3,949 | 994 | 5,156 | ||||||||||||||
Restructuring and other charges | — | — | (519 | ) | (159 | ) | (678 | ) | |||||||||||
Cash payments | — | (42 | ) | (1,411 | ) | (427 | ) | (1,880 | ) | ||||||||||
Other adjustments, net | (27 | ) | — | — | — | (27 | ) | ||||||||||||
Translation adjustment | (34 | ) | — | (208 | ) | — | (242 | ) | |||||||||||
Restructuring liabilities at October 31, 2015 | $ | 110 | $ | — | $ | 1,811 | $ | 408 | $ | 2,329 | |||||||||
Current restructuring liabilities at October 31, 2015 | $ | 110 | $ | — | $ | 644 | $ | 336 | $ | 1,090 | |||||||||
Non-current restructuring liabilities at October 31, 2015 | $ | — | $ | — | $ | 1,167 | $ | 72 | $ | 1,239 | |||||||||
77
Fiscal 2013 Fourth Quarter Restructuring Plan
During the fiscal year ended October 26, 2013, and the first quarter of fiscal year 2014, the Company restructured certain business operations and reduced the Company’s operating expense structure. The restructuring plan was approved by the Company’s management and communicated to the Company’s employees in September 2013. The restructuring plan included a workforce reduction of approximately 250 employees, primarily in the engineering, sales, and marketing organizations, as well as the cancellation of certain nonrecurring engineering agreements and exit from certain leased facilities. The Company substantially completed the restructuring plan by the end of the first quarter of fiscal year 2014.
Other Restructuring Plans
The Company also recorded charges related to estimated facilities lease losses, net of expected sublease income, due to consolidation of real estate space as a result of acquisitions.
Cash payments for facilities that are part of the Company’s lease loss reserve are expected to be paid over the respective lease terms through fiscal year 2021.
General
The Company reevaluates its estimates and assumptions on a quarterly basis and makes adjustments to the restructuring liabilities balance if necessary. During the fiscal year ended October 31, 2015, the Company reversed approximately $0.7 million of charges related to estimated facilities lease losses primarily due to favorable changes in expected sublease terms and other related assumptions.
The restructuring and other related charges are included in “Restructuring, goodwill impairment, and other related costs (benefits)” on the Company’s Consolidated Statements of Income.
6. Balance Sheet Details
The following tables provide details of selected balance sheet items (in thousands):
October 31, 2015 | November 1, 2014 | ||||||
Accounts receivable: | |||||||
Accounts receivable | $ | 247,376 | $ | 232,389 | |||
Allowance for doubtful accounts | (1,838 | ) | (80 | ) | |||
Sales allowances | (9,655 | ) | (7,396 | ) | |||
Accounts receivable, net | $ | 235,883 | $ | 224,913 | |||
October 31, 2015 | November 1, 2014 | ||||||
Inventories: | |||||||
Raw materials | $ | 18,788 | $ | 10,491 | |||
Finished goods | 21,736 | 28,227 | |||||
Inventories | $ | 40,524 | $ | 38,718 | |||
78
October 31, 2015 | November 1, 2014 | ||||||
Property and equipment, net: | |||||||
Gross property and equipment | |||||||
Computer equipment | $ | 14,820 | $ | 13,679 | |||
Software | 67,625 | 62,919 | |||||
Engineering and other equipment (1) | 407,342 | 383,412 | |||||
Furniture and fixtures (1) | 31,028 | 29,053 | |||||
Leasehold improvements | 33,986 | 23,607 | |||||
Land and building | 385,415 | 384,659 | |||||
Total gross property and equipment | 940,216 | 897,329 | |||||
Accumulated depreciation and amortization (1), (2) | (500,992 | ) | (451,896 | ) | |||
Property and equipment, net | $ | 439,224 | $ | 445,433 | |||
(1) | Engineering and other equipment, furniture and fixtures, and accumulated depreciation and amortization include the following amounts under capital leases as of October 31, 2015, and November 1, 2014 (in thousands): |
October 31, 2015 | November 1, 2014 | ||||||
Cost | $ | 1,312 | $ | 11,925 | |||
Accumulated depreciation | (857 | ) | (7,209 | ) | |||
Property and equipment, net, under capital leases | $ | 455 | $ | 4,716 | |||
(2) | The following table presents the depreciation of property and equipment included on the Company’s Consolidated Statements of Income (in thousands): |
Fiscal Year Ended | |||||||||||
October 31, 2015 | November 1, 2014 | October 26, 2013 | |||||||||
Depreciation expense | $ | 73,623 | $ | 82,357 | $ | 90,127 | |||||
October 31, 2015 | November 1, 2014 | ||||||
Other accrued liabilities: | |||||||
Income taxes payable | $ | 7,142 | $ | 5,632 | |||
Accrued warranty | 7,599 | 7,486 | |||||
Inventory purchase commitments | 1,237 | 2,541 | |||||
Accrued sales programs | 33,637 | 31,640 | |||||
Accrued interest | 6,523 | 9,922 | |||||
Others | 21,386 | 27,371 | |||||
Other accrued liabilities | $ | 77,524 | $ | 84,592 | |||
7. Fair Value Measurements
Fair value is the price that would be received from selling an asset or paid to transfer a liability in an orderly transaction between market participants at the measurement date. In determining fair value for assets and liabilities required or permitted to be recorded at fair value, the Company considers the principal or most advantageous market in which it would transact and also considers assumptions that market participants would use when pricing the asset or liability. The Company applies fair value measurements for both financial and non-financial assets and liabilities. The Company does not have any non-financial assets or liabilities that are required to be measured at fair value on a recurring basis as of October 31, 2015.
The fair value of the Company’s financial instruments, including cash and cash equivalents, accounts receivable, restricted cash, accounts payable and accrued liabilities, approximate cost because of their short maturities.
79
The fair value accounting guidance permits companies to elect fair value measurement for many financial instruments and certain other items that are not required to be accounted for at fair value. The Company did not elect fair value measurement for any eligible financial instruments or other assets.
Fair Value Hierarchy
The Company utilizes a fair value hierarchy that maximizes the use of observable inputs and minimizes the use of unobservable inputs when measuring fair value. A financial instrument’s categorization within the fair value hierarchy is based upon the lowest level of input that is significant to the fair value measurement. There are three levels of inputs that may be used to measure fair value:
Level 1
Observable inputs that reflect quoted prices in active markets for identical assets or liabilities. Brocade’s assets utilizing Level 1 inputs include money market funds.
Level 2
Inputs that reflect quoted prices for similar assets or liabilities in active markets, quoted prices for identical assets or liabilities in less-active markets, or model-derived valuations in which significant inputs are observable or can be derived principally from, or corroborated by, observable market data. Brocade’s assets and liabilities utilizing Level 2 inputs include derivative instruments. The Company uses observable market prices for comparable instruments to value its derivative instruments.
Level 3
Unobservable inputs that reflect the Company’s own assumptions incorporated in valuation techniques used to determine fair value. These assumptions are required to be consistent with market participant assumptions that are reasonably available. Brocade has no assets or liabilities utilizing Level 3 inputs.
During the fiscal year ended October 31, 2015, the Company had no transfers between levels of the fair value hierarchy of its assets and liabilities measured at fair value.
Assets and liabilities measured and recorded at fair value on a recurring basis as of October 31, 2015, were as follows (in thousands):
Fair Value Measurements Using | |||||||||||||||
Balance as of October 31, 2015 | Quoted Prices in Active Markets for Identical Instruments (Level 1) | Significant Other Observable Inputs (Level 2) | Significant Unobservable Inputs (Level 3) | ||||||||||||
Assets: | |||||||||||||||
Money market funds (1) | $ | 1,184,410 | $ | 1,184,410 | $ | — | $ | — | |||||||
Derivative assets | 709 | — | 709 | — | |||||||||||
Total assets measured at fair value | $ | 1,185,119 | $ | 1,184,410 | $ | 709 | $ | — | |||||||
Liabilities: | |||||||||||||||
Derivative liabilities | $ | 1,125 | $ | — | $ | 1,125 | $ | — | |||||||
Total liabilities measured at fair value | $ | 1,125 | $ | — | $ | 1,125 | $ | — | |||||||
(1) | Money market funds are reported within “Cash and cash equivalents” on the Company’s Consolidated Balance Sheets. |
80
Assets and liabilities measured and recorded at fair value on a recurring basis as of November 1, 2014, were as follows (in thousands):
Fair Value Measurements Using | |||||||||||||||
Balance as of November 1, 2014 | Quoted Prices in Active Markets for Identical Instruments (Level 1) | Significant Other Observable Inputs (Level 2) | Significant Unobservable Inputs (Level 3) | ||||||||||||
Assets: | |||||||||||||||
Money market funds (1) | $ | 1,009,283 | $ | 1,009,283 | $ | — | $ | — | |||||||
Derivative assets | 99 | — | 99 | — | |||||||||||
Total assets measured at fair value | $ | 1,009,382 | $ | 1,009,283 | $ | 99 | $ | — | |||||||
Liabilities: | |||||||||||||||
Derivative liabilities | $ | 1,937 | $ | — | $ | 1,937 | $ | — | |||||||
Total liabilities measured at fair value | $ | 1,937 | $ | — | $ | 1,937 | $ | — | |||||||
(1) | Money market funds are reported within “Cash and cash equivalents” on the Company’s Consolidated Balance Sheets. |
8. Borrowings
The following table provides details of the Company’s long-term debt (in thousands, except years and percentages):
October 31, 2015 | November 1, 2014 | ||||||||||||||||||
Maturity | Stated Annual Interest Rate | Amount | Effective Interest Rate | Amount | Effective Interest Rate | ||||||||||||||
Convertible Senior Unsecured Notes | |||||||||||||||||||
2020 Convertible Notes | 2020 | 1.375% | $ | 575,000 | 4.98 | % | $ | — | — | % | |||||||||
Senior Unsecured Notes | |||||||||||||||||||
2023 Notes | 2023 | 4.625% | 300,000 | 4.83 | % | 300,000 | 4.83 | % | |||||||||||
Senior Secured Notes | |||||||||||||||||||
2020 Notes | 2015 | 6.875% | — | 8.39 | % | 300,000 | 7.26 | % | |||||||||||
Capital lease obligations | 2016 | 4.630% | 298 | 4.63 | % | 2,115 | 5.37 | % | |||||||||||
Total gross long-term debt | 875,298 | 602,115 | |||||||||||||||||
Unamortized discount | (79,196 | ) | (4,839 | ) | |||||||||||||||
Current portion of long-term debt | (298 | ) | (1,826 | ) | |||||||||||||||
Long-term debt, net of current portion | $ | 795,804 | $ | 595,450 | |||||||||||||||
Convertible Senior Unsecured Notes
On January 14, 2015, the Company issued $575.0 million in aggregate principal amount of 1.375% convertible senior unsecured notes due 2020 (the “2020 Convertible Notes”) pursuant to an indenture, dated as of January 14, 2015, between the Company and Wells Fargo Bank, National Association, as the trustee (the “Offering”). Net of an original issue discount, the Company received $565.7 million in proceeds from the Offering. Concurrently with the closing of the Offering, the Company called for redemption its outstanding 6.875% senior secured notes due 2020 (the “2020 Notes”) and irrevocably deposited a portion of the net proceeds from the Offering with the trustee to discharge the 2020 Indenture as described below under “Senior Secured Notes.”
The 2020 Convertible Notes bear interest payable semiannually on January 1 and July 1 of each year, beginning on July 1, 2015. No payments were made toward the principal of the 2020 Convertible Notes during the fiscal year ended October 31, 2015.
The Company separately accounts for the liability and equity components of the 2020 Convertible Notes. The fair value of the liability component, used in the allocation between the liability and equity components as of the date of issuance, was based on the present value of cash flows using a discount rate of 4.57%, the Company’s borrowing rate for a similar debt instrument without the conversion feature. The carrying values of the liability and equity components of the 2020 Convertible Notes are as follows (in thousands):
81
October 31, 2015 | |||
Principal | $ | 575,000 | |
Unamortized discount of the liability component | (76,311 | ) | |
Net carrying amount of liability component | $ | 498,689 | |
Carrying amount of equity component | $ | 70,765 | |
As of October 31, 2015, the remaining period of amortization for the discount is 4.17 years. The amount of interest cost recognized for amortization of the discount and for the contractual interest coupon for the 2020 Convertible Notes was $12.9 million and $6.3 million, respectively, during the fiscal year ended October 31, 2015. No interest cost was recognized for the 2020 Convertible Notes during the fiscal years ended November 1, 2014, and October 26, 2013.
As of October 31, 2015, the fair value of the 2020 Convertible Notes was approximately $568.0 million, which was estimated based on broker trading prices.
The 2020 Convertible Notes mature on January 1, 2020, unless repurchased or converted in accordance with their terms prior to such date. The 2020 Convertible Notes are not callable prior to their maturity. The 2020 Convertible Notes are convertible into common shares of the Company under the circumstances described below. The initial conversion rate is 62.7746 shares of the Company’s common stock per $1,000 principal amount of the notes, which is equal to 36.1 million shares at an initial conversion price of approximately $15.93 per share.
The 2020 Convertible Notes contain provisions where the conversion rate is adjusted upon the occurrence of certain events, including if the Company pays a regular, quarterly cash dividend in an amount greater than $0.035 per share. During the fourth fiscal quarter of 2015, the Board of Directors of the Company declared and paid a cash dividend in the amount of $0.045 per share. Accordingly, as of September 8, 2015, the conversion rate was adjusted to a rate of 62.8879 shares of the Company’s common stock per $1,000 principal amount of the notes, which is equal to 36.2 million shares at a conversion price of approximately $15.90 per share. However, because the adjustment resulted in a change to the conversion rate of less than 1%, as is allowed by the terms of the indenture governing the 2020 Convertible Notes, the Company elected to defer the administration and noteholder notification of such adjustment until the occurrence of (i) a subsequent adjustment to the conversion rate that results in a cumulative adjustment of at least 1% of the current conversion rate, (ii) the conversion of any 2020 Convertible Note, or (iii) certain other events requiring the adjustment to be made under the indenture governing the 2020 Convertible Notes.
Holders of the 2020 Convertible Notes may convert all or a portion of their notes prior to the close of business on the business day immediately preceding September 1, 2019, in multiples of $1,000 principal amount, only under the following circumstances:
• | During any fiscal quarter commencing after the fiscal quarter ending on May 2, 2015 (and only during such fiscal quarter), if the last reported sale price of the Company’s common stock for at least 20 trading days (whether or not consecutive) during a period of 30 consecutive trading days ending on the last trading day of the immediately preceding fiscal quarter is greater than or equal to 130% of the conversion price of the notes on each applicable trading day; |
• | During the five-business-day period after any 10 consecutive trading day period in which the trading price per $1,000 principal amount of the notes for each trading day of that 10 consecutive trading day period was less than 98% of the product of the last reported sale price of the Company’s common stock and the conversion rate of the notes on each such trading day; or |
• | Upon the occurrence of certain corporate events as specified in the terms of the indenture governing the 2020 Convertible Notes. |
On or after September 1, 2019, to the close of business on the second scheduled trading day immediately preceding the maturity date, holders may convert all or any portion of their notes regardless of the foregoing conditions.
As of October 31, 2015, the circumstances for conversion had not been triggered, and the 2020 Convertible Notes were not convertible. The if-converted value of the 2020 Convertible Notes as of October 31, 2015, did not exceed the principal amount of the 2020 Convertible Notes.
If a fundamental change, as specified in the terms of the indenture governing the 2020 Convertible Notes, occurs prior to the maturity date, holders of the notes may require the Company to repurchase the 2020 Convertible Notes at a repurchase price equal to 100% of the principal amount of the 2020 Convertible Notes repurchased, plus accrued and unpaid interest, if any, up to the repurchase date. As of October 31, 2015, a fundamental change had not occurred and the 2020 Convertible Notes were not re-purchasable.
82
Convertible Note Hedge and Warrants Related to the Convertible Senior Unsecured Notes
In connection with the issuance of the 2020 Convertible Notes, the Company entered into convertible note hedge transactions with certain financial institutions (the “counterparties”) with respect to its common stock. Upon conversion of the 2020 Convertible Notes, the convertible note hedge transactions give the Company the right to acquire from the counterparties, subject to anti-dilution adjustments substantially similar to those in the 2020 Convertible Notes, initially approximately 36.1 million shares of the Company’s common stock at an initial strike price of $15.93 per share. Because a dividend in an amount greater than $0.035 per share was declared and paid effective beginning in the third fiscal quarter of 2015, the strike price under the convertible note hedge transactions was adjusted to approximately $15.90 per share. The convertible note hedge transactions are expected generally to reduce the potential common stock dilution, and/or offset potential cash payments in excess of the principal amount of converted notes, upon conversion of the notes in the event that the market price per share of the Company’s common stock, as measured under the terms of the convertible note hedge transactions, is greater than the strike price of the convertible note hedge transactions. The convertible note hedge transactions will be terminated on the maturity date of the 2020 Convertible Notes or earlier under certain circumstances. The $86.1 million cost of the convertible note hedge transactions has been accounted for as an equity transaction.
Separately from the convertible note hedge transactions, the Company entered into warrant transactions with the counterparties, pursuant to which the Company sold warrants to the counterparties to acquire, subject to customary anti-dilution adjustments, up to 36.1 million shares in the aggregate at an initial strike price of $20.65 per share. The primary reason the Company entered into these warrant transactions was to partially offset the cost of the convertible note hedge transactions. The warrants mature over 60 trading days, commencing on April 1, 2020, and are exercisable solely on the maturity dates. The warrants are subject to net share settlement; however, the Company may elect to cash settle the warrants. The Company received gross proceeds of $51.2 million from the warrant transactions, which have been accounted for as an equity transaction.
Under the terms of the warrants, the strike price and number of shares to be acquired by the holders of the warrants are adjusted if the Company pays a regular, quarterly cash dividend in an amount greater than $0.035 per share. Accordingly, the terms of the warrants were adjusted to reflect the payment of a cash dividend in the amount of $0.045 per share beginning in the third fiscal quarter of 2015, and, as of September 8, 2015, the holders of the warrants have the right to acquire up to approximately 36.2 million shares of the Company’s common stock at a strike price of approximately $20.61 per share.
See Note 17, “Net Income per Share,” of the Notes to Consolidated Financial Statements for further discussion of the dilutive impact of the 2020 Convertible Notes and the convertible note hedge and warrant transactions.
Senior Unsecured Notes
In January 2013, the Company issued 4.625% senior unsecured notes in the aggregate principal amount of $300.0 million due 2023 (the “2023 Notes”) pursuant to an indenture, dated as of January 22, 2013 (the “2023 Indenture”), between the Company, certain domestic subsidiaries of the Company that have guaranteed the Company’s obligations under the 2023 Notes, and Wells Fargo Bank, National Association, as the trustee. The guarantees of the 2023 Notes were released upon the termination of the Senior Secured Credit Facility and discharge of the 2020 Indenture, and, as a result, the Company ceased presenting condensed consolidated financial statements for the parent company, the former subsidiary guarantors, and non-guarantor subsidiaries effective in the first fiscal quarter of 2015. See Note 18, “Guarantor and Non-Guarantor Subsidiaries,” of the Notes to Consolidated Financial Statements.
The 2023 Notes bear interest payable semiannually on January 15 and July 15 of each year. No payments were made toward the principal of the 2023 Notes during the fiscal year ended October 31, 2015.
As of October 31, 2015, and November 1, 2014, the fair value of the 2023 Notes was approximately $293.9 million and $292.4 million, respectively, which was estimated based on broker trading prices.
On or after January 15, 2018, the Company may redeem all or part of the 2023 Notes at the redemption prices set forth in the 2023 Indenture, plus accrued and unpaid interest, if any, up to the redemption date. At any time prior to January 15, 2018, the Company may redeem all or a part of the 2023 Notes at a price equal to 100% of the principal amount of the 2023 Notes, plus an applicable premium and accrued and unpaid interest, if any, up to the redemption date. In addition, at any time prior to January 15, 2016, the Company may redeem up to 35% of the principal amount of the 2023 Notes, using the net cash proceeds of one or more sales of the Company’s capital stock, at a redemption price equal to 104.625% of the principal amount of the 2023 Notes redeemed, plus accrued and unpaid interest, if any, up to the redemption date.
If the Company experiences a specified change of control triggering event, it must offer to repurchase the 2023 Notes at a repurchase price equal to 101% of the principal amount of the 2023 Notes repurchased, plus accrued and unpaid interest, if any, up to the repurchase date.
83
The 2023 Indenture contains covenants that, among other things, restrict the ability of the Company and its subsidiaries to:
• | Incur certain liens and enter into certain sale-leaseback transactions; |
• | Create, assume, incur, or guarantee additional indebtedness of the Company’s subsidiaries without such subsidiary guaranteeing the 2023 Notes on a pari passu basis; and |
• | Enter into certain consolidation or merger transactions, or convey, transfer, or lease all or substantially all of the Company’s or its subsidiaries’ assets. |
These covenants are subject to a number of limitations and exceptions as set forth in the 2023 Indenture. The 2023 Indenture also includes customary events of default, including cross-defaults to other debt of the Company and its subsidiaries.
Senior Secured Notes
In January 2010, the Company issued $300.0 million in aggregate principal amount of the 2020 Notes pursuant to an indenture, dated as of January 20, 2010, between the Company, certain domestic subsidiaries of the Company that have guaranteed the Company’s obligations under the 2020 Notes, and Wells Fargo Bank, National Association, as the trustee (the “2020 Indenture”). Interest on the 2020 Notes was payable semiannually on January 15 and July 15 of each year. The Company’s obligations under the 2020 Notes were previously guaranteed by certain of the Company’s domestic subsidiaries and secured by a lien on substantially all of the Company’s and the subsidiary guarantors’ assets.
On January 14, 2015, the Company called the 2020 Notes for redemption at a redemption price equal to 103.438% of the principal amount of the 2020 Notes, and irrevocably deposited $322.2 million with the trustee for the 2020 Notes to discharge the 2020 Indenture. Due to the deposit and discharge, the guarantees provided by certain of the Company’s domestic subsidiaries, and the liens granted by the Company and the subsidiary guarantors to secure their obligations with respect to the 2020 Notes, were released as of the date of the deposit. As a result, the Company ceased presenting condensed consolidated financial statements for the parent company, the former subsidiary guarantors, and non-guarantor subsidiaries effective in the first fiscal quarter of 2015. See Note 18, “Guarantor and Non-Guarantor Subsidiaries,” of the Notes to Consolidated Financial Statements.
The amount deposited with the trustee included $300.0 million to repay the principal amount of the 2020 Notes, $10.3 million representing the difference between the redemption price and the principal amount of the 2020 Notes (“Call Premium”), $10.3 million for accrued interest through January 15, 2015, and $1.6 million of interest payable up to the redemption date of February 13, 2015. The trustee redeemed the 2020 Notes on February 13, 2015, using the deposited amount, extinguishing the Company’s $300.0 million liability for the principal amount of the 2020 Notes.
In accordance with the applicable accounting guidance for debt modification and extinguishment, and for interest costs accounting, the Company expensed the Call Premium, remaining debt issuance costs, and remaining original issue discount relating to the 2020 Notes in the first quarter of fiscal year 2015, which totaled $20.4 million. The Company reported this expense within “Interest expense” on the Company’s Consolidated Statements of Income for the fiscal year ended October 31, 2015.
As of November 1, 2014, the fair value of the 2020 Notes was approximately $312.5 million, which was estimated based on broker trading prices.
Senior Secured Credit Facility
In October 2008, the Company entered into a credit agreement for (i) a five-year, $1,100.0 million term loan facility and (ii) a five-year, $125.0 million revolving credit facility, which included a $25.0 million swing line loan sub-facility and a $25.0 million letter of credit sub-facility (“Senior Secured Credit Facility”). The credit agreement was subsequently amended in January 2010, June 2011, January 2013, October 2013, and April 2014, to, among other things, remove and update certain covenants, reduce interest rates on the term loan facility, reduce interest rates and fees on the revolving credit facility, and extend the maturity date of the revolving credit facility. There were no principal amounts or commitments outstanding under the term loan facility and the revolving credit facility as of either October 31, 2015, or November 1, 2014.
On January 9, 2015, the Company terminated the Senior Secured Credit Facility.
84
Debt Maturities
As of October 31, 2015, the Company’s aggregate debt maturities based on outstanding principal were as follows (in thousands):
Fiscal Year | Principal Balances | |||
2016 | $ | 298 | ||
2017 | — | |||
2018 | — | |||
2019 | — | |||
2020 | 575,000 | |||
Thereafter | 300,000 | |||
Total | $ | 875,298 | ||
9. Commitments and Contingencies
Operating Leases
The Company leases certain facilities and certain equipment under various operating agreements expiring through October 2025. In connection with its facilities lease agreements, the Company has signed unconditional, irrevocable letters of credit totaling $0.1 million as security for the leases.
The following table presents the composition of net rent expense included on the Company’s Consolidated Statements of Income (in thousands):
Fiscal Year Ended | |||||||||||
October 31, 2015 | November 1, 2014 | October 26, 2013 | |||||||||
Rent expense | $ | 22,929 | $ | 21,928 | $ | 26,199 | |||||
Sublease income | (7,673 | ) | (7,264 | ) | (6,834 | ) | |||||
Net rent expense | $ | 15,256 | $ | 14,664 | $ | 19,365 | |||||
Future minimum lease payments under all non-cancellable operating leases as of October 31, 2015, excluding the contractual sublease income of $9.7 million, are as follows (in thousands):
Fiscal Year | Operating Leases | |||
2016 | $ | 20,974 | ||
2017 | 12,125 | |||
2018 | 8,465 | |||
2019 | 6,717 | |||
2020 | 6,313 | |||
Thereafter | 17,712 | |||
Total minimum lease payments | $ | 72,306 | ||
Capital Leases
Future minimum lease payments under all non-cancellable capital leases as of October 31, 2015, are as follows (in thousands):
Fiscal Year | Capital Leases | |||
2016 - Total minimum lease payments | $ | 304 | ||
Amount representing interest | (6 | ) | ||
Present value of net minimum lease payments | $ | 298 | ||
85
Product Warranties
The Company’s accrued liability for estimated future warranty costs is included in “Other accrued liabilities” in the accompanying Consolidated Balance Sheets. The following table summarizes the activity related to the Company’s accrued liability for estimated future warranty costs during the fiscal years ended October 31, 2015, and November 1, 2014 (in thousands):
Accrued Warranty | |||||||
Fiscal Year Ended | |||||||
October 31, 2015 | November 1, 2014 | ||||||
Beginning balance | $ | 7,486 | $ | 8,632 | |||
Liabilities accrued for warranties issued during the period | 4,076 | 4,683 | |||||
Warranty claims paid and used during the period | (4,164 | ) | (4,978 | ) | |||
Changes in liability for pre-existing warranties during the period | 201 | (851 | ) | ||||
Ending balance | $ | 7,599 | $ | 7,486 | |||
In addition, the Company has defense and indemnification clauses contained within its various customer contracts. As such, the Company indemnifies the parties to whom it sells its products with respect to the Company’s products, both alone and in certain circumstances when in combination with other products and services, for infringement of any patents, trademarks, copyrights, or trade secrets, as well as against bodily injury or damage to real or tangible personal property caused by a defective Company product. As of October 31, 2015, there have been no known events or circumstances that have resulted in a material customer contract-related indemnification liability to the Company.
Manufacturing and Purchase Commitments
Brocade has manufacturing arrangements with its CMs under which Brocade provides product forecasts and places purchase orders in advance of the scheduled delivery of products to Brocade’s customers. The required lead time for placing orders with the CMs depends on the specific product. Brocade issues purchase orders, and the CMs then generate invoices based on prices and payment terms mutually agreed upon and set forth in those purchase orders. Although the purchase orders Brocade places with its CMs are cancellable, the terms of the agreements require Brocade to purchase all inventory components not returnable, usable by, or sold to other customers of the CMs. In addition, Brocade has an arrangement with one of its CMs regarding factory capacity that can be used by the Company. Under this arrangement, the Company receives a credit for exceeding the planned utilization of factory capacity and, conversely, is required to pay additional fees for not utilizing the planned capacity.
As of October 31, 2015, the Company’s aggregate commitment to its CMs for inventory components used in the manufacture of Brocade products was $176.2 million, which the Company expects to utilize during future normal ongoing operations, net of a purchase commitments reserve of $1.2 million, which is reported within “Other accrued liabilities” on the Company’s Consolidated Balance Sheet as of October 31, 2015. The Company’s purchase commitments reserve reflects the Company’s estimate of purchase commitments it does not expect to utilize in normal ongoing operations.
Income Taxes
The Company is subject to several ongoing income tax audits and has received notices of proposed adjustments or assessments from certain tax authorities. For additional discussion, see Note 15, “Income Taxes,” of the Notes to Consolidated Financial Statements. The Company believes it has adequate reserves for all open tax years.
Legal Proceedings
From time to time, the Company is subject to various legal proceedings and claims, either asserted or unasserted, which arise in the ordinary course of business, including claims of alleged infringement of patents and/or other intellectual property rights and commercial and employment contract disputes. While the outcome of these matters cannot be predicted with certainty, the Company does not believe that the outcome of any of these matters, individually or in the aggregate, will result in losses that are materially in excess of amounts already accrued by the Company.
86
10. Derivative Instruments and Hedging Activities
In the normal course of business, the Company is exposed to fluctuations in interest rates and the exchange rates associated with foreign currencies. The Company’s primary objective for holding derivative financial instruments is to manage foreign currency exchange rate risk. The Company currently does not manage its exposure to credit risk by entering into derivative instruments. However, the Company manages its exposure to credit risk through its investment policies. As part of these investment policies, the Company generally enters into transactions with high-credit quality counterparties and, by policy, limits the amount of credit exposure to any one counterparty based on its analysis of that counterparty’s relative credit standing.
The amounts subject to credit risk related to derivative instruments are generally limited to the amounts, if any, by which a counterparty’s obligations exceed the Company’s obligations with that counterparty.
Foreign Currency Exchange Rate Risk
A majority of the Company’s revenue, expense, and capital purchasing activities are transacted in U.S. dollars. However, the Company is exposed to foreign currency exchange rate risk inherent in conducting business globally in numerous currencies. The Company is primarily exposed to foreign currency fluctuations related to operating expenses denominated in currencies other than the U.S. dollar, of which the most significant to its operations for the fiscal year ended October 31, 2015, were the British pound, the euro, the Indian rupee, the Chinese yuan, the Singapore dollar, the Japanese yen, and the Swiss franc. The Company has established a foreign currency risk management program to protect against the volatility of future cash flows caused by changes in foreign currency exchange rates. This program reduces, but does not eliminate, the impact of foreign currency exchange rate movements.
The Company utilizes a rolling hedge strategy for the majority of its foreign currency derivative instruments to hedge exposures to the variability in the U.S. dollar equivalent of anticipated non-U.S.-dollar-denominated cash flows. All of the Company’s foreign currency forward contracts are single delivery, which are settled at maturity involving one cash payment. The Company’s foreign currency risk management program includes foreign currency derivatives with a cash flow hedge accounting designation that utilizes foreign currency forward and option contracts to hedge exposures to the variability in the U.S. dollar equivalent of anticipated non-U.S.-dollar-denominated cash flows. These instruments generally have a maturity of less than 15 months. For these derivatives, the Company initially reports the after-tax gain or loss from the effective portion of the hedge as a component of accumulated other comprehensive loss in stockholders’ equity and reclassifies it into earnings in the same period in which the hedged transaction affects earnings. The tax effect allocated to cash flow hedge-related components of other comprehensive loss was not significant for the fiscal years ended October 31, 2015, November 1, 2014, and October 26, 2013.
Ineffective cash flow hedges are included in the Company’s net income as part of “Other income, net.” The amount recorded on ineffective cash flow hedges was not significant for the fiscal years ended October 31, 2015, November 1, 2014, and October 26, 2013.
Net gains (losses) relating to the effective portion of foreign currency derivatives recorded in the Company’s Consolidated Statements of Income are as follows (in thousands):
Fiscal Year Ended | |||||||||||
October 31, 2015 | November 1, 2014 | October 26, 2013 | |||||||||
Cost of revenues | $ | (898 | ) | $ | 126 | $ | 98 | ||||
Research and development | (381 | ) | (451 | ) | (60 | ) | |||||
Sales and marketing | (2,772 | ) | 528 | 356 | |||||||
General and administrative | (199 | ) | 59 | 31 | |||||||
Total | $ | (4,250 | ) | $ | 262 | $ | 425 | ||||
Alternatively, the Company may choose not to hedge the foreign currency risk associated with its foreign currency exposures if the Company believes such exposure acts as a natural foreign currency hedge for other offsetting amounts denominated in the same currency or if the currency is difficult or too expensive to hedge.
The net foreign currency exchange gains and losses recorded as part of “Other income, net” were losses of $0.4 million and $0.3 million for the fiscal years ended October 31, 2015, and November 1, 2014, respectively, and gains of $0.1 million for the fiscal year ended October 26, 2013.
As of October 31, 2015, the Company had gross unrealized loss positions of $1.1 million and gross unrealized gain positions of $0.7 million included in “Other accrued liabilities” and “Prepaid expenses and other current assets,” respectively.
87
Volume of Derivative Activity
Total gross notional amounts, presented by currency, are as follows (in thousands):
Derivatives Designated as Hedging Instruments | Derivatives Not Designated as Hedging Instruments | ||||||||||||||
In U.S. dollars | October 31, 2015 | November 1, 2014 | October 31, 2015 | November 1, 2014 | |||||||||||
British pound | $ | 46,330 | $ | 11,168 | $ | — | $ | 14,891 | |||||||
Euro | 40,961 | 14,404 | — | 19,200 | |||||||||||
Indian rupee | 35,647 | 19,413 | — | — | |||||||||||
Chinese yuan | 15,129 | 10,406 | — | — | |||||||||||
Singapore dollar | 13,745 | 9,242 | — | — | |||||||||||
Swiss franc | 9,265 | 7,468 | — | — | |||||||||||
Japanese yen | 8,809 | 8,856 | — | — | |||||||||||
Total | $ | 169,886 | $ | 80,957 | $ | — | $ | 34,091 | |||||||
11. Employee Compensation Plans
In April 2009, the stockholders of Brocade approved the Company’s 2009 Stock Plan, 2009 Director Plan, and 2009 Employee Stock Purchase Plan (“2009 ESPP”), and such plans are now part of the Company’s equity compensation plans. The Company’s 1999 Stock Plan, 1999 Director Option Plan, and 1999 Employee Stock Purchase Plan (“1999 ESPP”) each expired in March 2009.
In April 2012, the stockholders of Brocade approved an amendment and restatement of the Company’s 2009 Stock Plan and 2009 ESPP to increase the plans’ share reserves by 35.0 million and 30.0 million shares, respectively.
In January 2013, the Compensation Committee (the “Committee”) of the Board of Directors of Brocade adopted the 2013 Inducement Award Plan. The objective of the plan is to provide incentives to attract, retain, and motivate eligible persons whose potential contributions are important to promote the success of the Company.
In April 2015, the stockholders of Brocade approved an amendment and restatement of the Company’s 2009 Stock Plan and 2009 Director Plan to increase the plans’ share reserves by 29.5 million and 1.0 million shares, respectively, as well as change the fungible ratio at which RSUs are deducted from and returned to the plans. The 2009 Director Plan was also amended and restated to eliminate the fixed share initial restricted stock unit award granted in connection with an election or appointment to our Board of Directors, change the formula for calculating a pro-rata annual grant for a new director who first becomes a director other than at an annual meeting, and revise the annual restricted stock unit award to cover a fixed value of shares.
88
2013 Inducement Award Plan
The 2013 Inducement Award Plan provides for the grant of stock options, restricted stock, RSUs, stock appreciation rights, performance units, performance shares, and other stock or cash awards to recipients as the Committee may determine. Per the terms of the plan, 2.4 million shares of the Company’s common stock are reserved for issuance under the plan, subject to adjustment for stock dividends, stock splits, or other changes in the Company’s common stock or the Company’s capital structure. In addition, the exercise price of stock options and stock appreciation rights granted under the plan must be at least equal to the fair market value of the Company’s common stock on the date of grant. The term, vesting schedule, and other conditions applicable to grants made under this plan are established by the Committee at the time of grant.
2009 Stock Plan
The 2009 Stock Plan provides for the grant of stock options, restricted stock, RSUs, including restricted stock units with market conditions, stock appreciation rights, performance units, performance shares, and other stock or cash awards to employees, directors, and consultants. Per the terms of the 2009 Stock Plan, as amended, 112.5 million shares of the Company’s common stock are reserved for issuance under the plan, plus any shares subject to stock options or similar awards granted under the Company’s 1999 Stock Plan, 1999 Nonstatutory Stock Option Plan (“1999 NSO Plan”), and 2001 McDATA Equity Incentive Plan that expire or otherwise terminate without having been exercised in full, and shares issued pursuant to awards granted under the Company’s 1999 Stock Plan, 1999 NSO Plan, and 2001 McDATA Equity Incentive Plan that are forfeited to or repurchased by the Company, with the maximum number of shares to be added to the 2009 Stock Plan pursuant to this clause equal to 40.3 million shares.
2009 Director Plan
The 2009 Director Plan provides for the grant of stock options and RSUs to non-employee directors of the Company. The Board of Directors has reserved 3.0 million shares of the Company’s common stock for issuance under the 2009 Director Plan, plus any shares subject to stock options or similar awards granted under the Company’s 1999 Director Option Plan that expire or otherwise terminate without having been exercised in full, and shares issued pursuant to awards granted under the Company’s 1999 Director Option Plan that are forfeited to or repurchased by the Company, with the maximum number of shares to be added to the 2009 Director Plan pursuant to this clause equal to 0.9 million shares.
2009 Employee Stock Purchase Plan
The 2009 ESPP permits eligible employees to purchase shares of the Company’s common stock through payroll deductions for up to 15% of qualified compensation during the offering period. The purchase price is 85% of the lesser of the fair market value of the Company’s common stock on (i) the first trading day of the offering period, or (ii) the last day of each purchase period; provided, however, that the purchase price for subsequent offering periods may be determined by the administrator, subject to compliance with the terms of the 2009 ESPP. A total of 65.0 million shares of the Company’s common stock are reserved for issuance under the 2009 ESPP, as amended. The 2009 ESPP is implemented through consecutive, overlapping offering periods. The offering periods generally start with the first trading day on or after June 1 and December 1 each year and end on the last trading day in the periods ending 24 months later, unless the fair market value of the Company’s common stock on the last day of a purchase period is lower than the fair market value of the Company’s common stock on the first trading day of the offering period, in which case the offering period will end early, immediately after the purchase period, and a new offering period will commence on or about such date. Each offering period is divided into four purchase periods of approximately six months in length. Eligible employees may purchase no more than 3,750 shares of the Company’s common stock during each purchase period. As of October 31, 2015, 10.5 million shares were available for issuance under the 2009 ESPP.
McDATA Equity Plans
On January 29, 2007, effective upon the consummation of the merger, Brocade assumed the McDATA equity plans. As of October 31, 2015, the number of outstanding options under former McDATA equity plans was immaterial.
89
Summary of Equity Compensation Plans
The Company may grant stock options, restricted stock awards, and RSUs, including restricted stock units with market conditions, for shares of the Company’s common stock and other types of equity compensation awards to its employees and directors under the various equity compensation plans described above. Effective in April 2015, in accordance with the terms of the 2009 Stock Plan and the 2009 Director Plan, as amended, each award granted other than stock options or stock appreciation rights will count against the applicable plan’s share reserve as 2.03 shares for every one share subject to such award. In addition, the exercise price of stock options and stock appreciation rights granted under the 2009 Stock Plan must be at least equal to the fair market value of the Company’s common stock on the date of grant and the exercise price of incentive stock options granted to any participant who owns more than 10% of the total voting power of all classes of the Company’s outstanding stock must be at least 110% of the fair market value of the Company’s common stock on the date of grant.
The term of a stock option and a stock appreciation right may not exceed seven years, except that, with respect to any participant who owns 10% of the voting power of all classes of the Company’s outstanding capital stock, the term of an incentive stock option may not exceed five years. The majority of the stock options, restricted stock awards, and RSUs granted under the Company’s equity compensation plans vest over a period of three to four years. Certain options and awards granted under the 2009 Stock Plan and the 2009 Director Plan vest over shorter or longer periods.
As of October 31, 2015, and November 1, 2014, approximately 63.4 million and 55.2 million shares, respectively, were authorized for future issuance under the Company’s equity compensation plans, which include stock options, shares to be issued pursuant to the 2009 ESPP, RSUs, and other awards. A total of 36.8 million shares and 30.0 million shares of common stock were available for grant under the Company’s equity compensation plans as of October 31, 2015, and November 1, 2014, respectively. Awards that expire, or are cancelled without delivery of shares, generally become available for issuance under the Company’s equity compensation plans.
Employee 401(k) Plan
The Company sponsors the Brocade Communications Systems, Inc. 401(k) Plan (“401(k) Plan”), which qualifies under Section 401(k) of the Internal Revenue Code and is designed to provide retirement benefits for its eligible employees through tax-deferred salary deductions.
Employees may elect to contribute up to 60% of their eligible compensation to the 401(k) Plan. Employee contributions are limited to a maximum annual amount as set periodically by the Internal Revenue Service (“IRS”). The Company matches employee contributions dollar for dollar up to a maximum of $3,000 per calendar year per person. All matching contributions vest immediately. The Company’s matching contributions to the 401(k) Plan totaled $8.7 million, $8.2 million, and $9.2 million for the fiscal years ended October 31, 2015, November 1, 2014, and October 26, 2013, respectively.
12. Stock-Based Compensation
Equity Compensation Plan Information
The following table summarizes information with respect to shares of the Company’s common stock that may be issued under the Company’s existing equity compensation plans as of October 31, 2015 (in thousands, except per share amounts):
Plan Category | A Number of Securities to Be Issued Upon Exercise of Outstanding Options, Warrants and Rights | B Weighted-Average Exercise Price of Outstanding Options, Warrants and Rights | C Number of Securities Remaining Available for Future Issuance Under Equity Compensation Plans (Excludes Securities Reflected in Column A) | ||||||||
Equity compensation plans approved by stockholders (1) | 4,291 | (3) | $ | 8.48 | 36,834 | (5) | |||||
Equity compensation plans not approved by stockholders (2) | 2,400 | (4) | $ | 5.66 | — | ||||||
Total | 6,691 | $ | 7.47 | 36,834 | |||||||
(1) | Primarily consist of the 2009 ESPP, the 2009 and 1999 Director Plans, and the 2009 and 1999 Stock Plans. |
(2) | Consist solely of the 2013 Inducement Award Plan described in Note 11, “Employee Compensation Plans,” of the Notes to Consolidated Financial Statements. |
90
(3) | Amount excludes purchase rights accrued under the 2009 ESPP. As of October 31, 2015, the 2009 ESPP had a stockholder-approved reserve of 65.0 million shares, of which 10.5 million shares were available for future issuance. |
(4) | All shares were granted in the first quarter of fiscal year 2013. Information relating to equity compensation plans is set forth in Note 11, “Employee Compensation Plans,” of the Notes to Consolidated Financial Statements. |
(5) | Amount consists of 10.5 million, 1.0 million, and 25.3 million shares available for future issuance under the 2009 ESPP, the 2009 Director Plan, and the 2009 Stock Plan, respectively. |
Stock-based compensation expense, net of estimated forfeitures, was included in the following line items of the Company’s Consolidated Statements of Income as follows (in thousands):
Fiscal Year Ended | |||||||||||
October 31, 2015 | November 1, 2014 | October 26, 2013 | |||||||||
Cost of revenues | $ | 12,946 | $ | 14,963 | $ | 14,519 | |||||
Research and development | 18,714 | 18,635 | 17,509 | ||||||||
Sales and marketing | 38,340 | 31,650 | 29,425 | ||||||||
General and administrative | 18,528 | 19,666 | 12,165 | ||||||||
Total stock-based compensation expense | $ | 88,528 | $ | 84,914 | $ | 73,618 | |||||
The following table presents stock-based compensation expense, net of estimated forfeitures, by grant type (in thousands):
Fiscal Year Ended | |||||||||||
October 31, 2015 | November 1, 2014 | October 26, 2013 | |||||||||
Stock options | $ | 3,675 | $ | 4,581 | $ | 2,581 | |||||
RSUs, including restricted stock units with market conditions | 67,735 | 62,906 | 50,522 | ||||||||
Employee stock purchase plan (“ESPP”) | 17,118 | 17,427 | 20,515 | ||||||||
Total stock-based compensation expense | $ | 88,528 | $ | 84,914 | $ | 73,618 | |||||
The following table presents the unrecognized compensation expense, net of estimated forfeitures, of the Company’s equity compensation plans as of October 31, 2015, which is expected to be recognized over the following weighted-average periods (in thousands, except for the weighted-average period):
Unrecognized Compensation Expense | Weighted- Average Period (In years) | ||||
Stock options | $ | 2,379 | 1.11 | ||
RSUs, including restricted stock units with market conditions | $ | 119,848 | 2.03 | ||
ESPP | $ | 6,663 | 0.87 | ||
In accordance with the applicable accounting guidance for stock-based compensation, the compensation expense for stock-based awards is reduced by an estimate for forfeitures and is recognized over the requisite service period of the respective awards. To the extent that the actual forfeitures differ from the estimated forfeitures, the Company records the difference in the period that the awards vest. The Company estimates the forward-looking forfeiture rate, using the Company’s historical forfeiture rates, annually during the second fiscal quarter, and whenever events occur or facts and circumstances indicate that the current forfeiture rate estimate is significantly different from historical forfeitures. Changes in the estimated forfeiture rates and differences between the estimated forfeiture rates and actual forfeiture rates may result in significant increases or decreases in stock-based compensation expense from period to period.
Based on the results of the annual forfeiture rate analysis performed during the second fiscal quarter of 2015, the Company increased its expected forfeiture rate, which resulted in the Company recording a cumulative adjustment to stock-based compensation expense of $5.6 million in fiscal year 2015.
There was no significant impact related to the change in the estimated forfeiture rates in fiscal year 2014.
91
Stock Options
The fair value of each option granted during the respective period is estimated on the date of grant using the Black-Scholes valuation model and the assumptions noted in the following table. The dividend yield reflects the cash dividends paid by Brocade starting in the third quarter of fiscal year 2014. The risk-free interest rate is based on the implied yield on a U.S. Treasury zero-coupon issue with a remaining term equal to the expected term of the option. The expected volatility is based on an equal weighted-average of implied volatilities from traded options of the Company’s common stock and historical volatility of the Company’s common stock. The expected term is based on historical exercise behavior.
Fiscal Year Ended | |||||||
October 31, 2015 | November 1, 2014 | October 26, 2013 | |||||
Expected dividend yield | 1.3 | % | 0.0% - 1.5% | 0.0 | % | ||
Risk-free interest rate | 1.1 - 1.8% | 0.7 - 2.3% | 0.6 - 1.7% | ||||
Expected volatility | 36.5 | % | 36.8 - 39.4% | 39.9 - 44.9% | |||
Expected term (in years) | 4.5 | 5.0 | 5.7 | ||||
Compensation expense computed under the fair value method for stock options issued is being amortized under a graded vesting method over the options’ vesting period. A summary of stock option activity under the equity compensation plans for the fiscal years ended October 31, 2015, November 1, 2014, and October 26, 2013, is presented as follows:
Shares (In thousands) | Weighted-Average Exercise Price | Weighted-Average Grant Date Fair Value | Weighted-Average Remaining Contractual Term (In years) | Aggregate Intrinsic Value (In thousands) | ||||||||||||
Outstanding as of October 27, 2012 | 29,497 | $ | 5.43 | 1.61 | $ | 26,077 | ||||||||||
Granted | 2,875 | $ | 5.64 | $ | 2.34 | |||||||||||
Exercised | (13,149 | ) | $ | 3.99 | $ | 32,324 | ||||||||||
Forfeited or expired | (6,662 | ) | $ | 6.90 | ||||||||||||
Outstanding as of October 26, 2013 | 12,561 | $ | 6.19 | 2.37 | $ | 24,784 | ||||||||||
Granted | 1,770 | $ | 9.03 | $ | 3.16 | |||||||||||
Exercised | (6,971 | ) | $ | 5.93 | $ | 24,240 | ||||||||||
Forfeited or expired | (1,161 | ) | $ | 8.93 | ||||||||||||
Outstanding as of November 1, 2014 | 6,199 | $ | 6.79 | 4.74 | $ | 24,452 | ||||||||||
Granted | 1,117 | $ | 10.89 | $ | 3.09 | |||||||||||
Exercised | (564 | ) | $ | 6.68 | $ | 2,980 | ||||||||||
Forfeited or expired | (61 | ) | $ | 8.20 | ||||||||||||
Outstanding as of October 31, 2015 | 6,691 | $ | 7.47 | 4.37 | $ | 20,252 | ||||||||||
Vested and expected to vest as of October 31, 2015 | 6,402 | $ | 7.39 | 4.32 | $ | 19,845 | ||||||||||
Exercisable and vested as of October 31, 2015 | 3,981 | $ | 6.79 | 3.81 | $ | 14,575 | ||||||||||
92
Restricted Stock Units, Including Restricted Stock Units with Market Conditions
Prior to the initial declaration of a quarterly cash dividend on May 22, 2014, the fair value of time-based RSUs was measured based on the grant-date share price because Brocade did not historically pay cash dividends on its common stock. For awards granted on or subsequent to May 22, 2014, the fair value of time-based RSUs is measured based on the grant-date share price, less the present value of expected dividends during the vesting period, discounted at a risk-free interest rate. The fair value of MSUs is estimated using a lattice model that incorporates a Monte Carlo simulation. A summary of the changes in nonvested RSUs, including MSUs, under Brocade’s equity compensation plans during the fiscal years ended October 31, 2015, November 1, 2014, and October 26, 2013, respectively, is presented as follows:
Shares (In thousands) | Weighted-Average Grant Date Fair Value | |||||
Nonvested as of October 27, 2012 | 21,996 | $ | 3.71 | |||
Granted | 11,518 | $ | 5.75 | |||
Vested | (7,401 | ) | $ | 5.69 | ||
Forfeited | (3,352 | ) | $ | 5.39 | ||
Nonvested as of October 26, 2013 | 22,761 | $ | 3.85 | |||
Granted | 11,582 | $ | 9.69 | |||
Vested | (11,750 | ) | $ | 5.59 | ||
Forfeited | (3,594 | ) | $ | 6.01 | ||
Nonvested as of November 1, 2014 | 18,999 | $ | 5.93 | |||
Granted | 10,777 | $ | 11.46 | |||
Vested | (8,317 | ) | $ | 7.81 | ||
Forfeited | (2,260 | ) | $ | 8.69 | ||
Nonvested as of October 31, 2015 | 19,199 | $ | 9.82 | |||
Vested and expected to vest as of October 31, 2015 | 16,243 | $ | 9.71 | |||
A summary of the changes in nonvested MSUs included in the above summary of changes in nonvested RSUs under Brocade’s equity compensation plans during the fiscal year ended October 31, 2015, is presented as follows:
Shares (In thousands) | Weighted-Average Grant Date Fair Value | |||||
Nonvested as of November 1, 2014 | 2,019 | $ | 11.62 | |||
Granted | 1,510 | $ | 10.39 | |||
Vested | (1,310 | ) | $ | 12.30 | ||
Forfeited | (283 | ) | $ | 11.25 | ||
Nonvested as of October 31, 2015 | 1,936 | $ | 9.65 | |||
Vested and expected to vest as of October 31, 2015 | 1,258 | $ | 9.25 | |||
Typically, vesting of RSUs occurs over one to four years and is subject to the employee’s continuing service to Brocade.
The aggregate intrinsic value of nonvested RSUs at October 31, 2015, November 1, 2014, and October 26, 2013, was $200.1 million, $203.9 million, and $178.8 million, respectively.
Employee Stock Purchase Plan
Under Brocade’s employee stock purchase plans, including the 2009 ESPP and the 1999 ESPP (together, the “Brocade ESPP”), eligible employees can participate and purchase shares semiannually at the lower of 85% of the fair market value of the Company’s common stock on (i) the first trading day of the offering period, or (ii) the last day of each six-month purchase period. The Brocade ESPP permits eligible employees to purchase common stock through payroll deductions for up to 15% of qualified compensation. The Company accounts for the Brocade ESPP as a compensatory plan and compensation expense is being amortized under a graded vesting method over the 24-month offering period. In addition, the Company accounts for changes in percentage contribution elected by employees, as well as decreases in the Company’s common stock price on the last day of each six-month purchase period as compared to the common stock price on the first trading day of the offering period, by applying modification accounting which results in an increase in compensation expense during the period of modification.
93
The fair value of the option component of Brocade ESPP shares was estimated using the Black-Scholes option pricing model and the weighted-average assumptions noted in the following table:
Fiscal Year Ended | ||||||||
October 31, 2015 | November 1, 2014 | October 26, 2013 | ||||||
Expected dividend yield | 1.4 | % | 1.4 | % | 0.0 | % | ||
Risk-free interest rate | 0.3 | % | 0.2 | % | 0.2 | % | ||
Expected volatility | 27.3 | % | 30.1 | % | 39.5 | % | ||
Expected term (in years) | 1.2 | 1.3 | 1.3 | |||||
13. Stockholders’ Equity
Dividends
During the fiscal year ended October 31, 2015, the Company’s Board of Directors declared the following dividends (in thousands, except per share amounts):
Declaration Date | Dividend per Share | Record Date | Total Amount Paid | Payment Date | ||||||||
November 23, 2014 | $ | 0.035 | December 10, 2014 | $ | 15,106 | January 2, 2015 | ||||||
February 16, 2015 | $ | 0.035 | March 10, 2015 | $ | 14,748 | April 2, 2015 | ||||||
May 20, 2015 | $ | 0.045 | June 10, 2015 | $ | 18,965 | July 2, 2015 | ||||||
August 18, 2015 | $ | 0.045 | September 10, 2015 | $ | 18,651 | October 2, 2015 | ||||||
Future dividends are subject to review and approval on a quarterly basis by the Company’s Board of Directors.
Convertible Note Hedge and Warrants Related to the Convertible Senior Unsecured Notes
In connection with the issuance of the 2020 Convertible Notes, the Company entered into convertible note hedge and warrant transactions with certain financial institutions with respect to its common stock. See Note 8, “Borrowings,” of the Notes to Consolidated Financial Statements for further discussion.
Accumulated Other Comprehensive Loss
The components of other comprehensive loss and related tax effects for the fiscal years ended October 31, 2015, and November 1, 2014, are as follows (in thousands):
Fiscal Year Ended | |||||||||||||||||||||||
October 31, 2015 | November 1, 2014 | ||||||||||||||||||||||
Before-Tax Amount | Tax (Expense) Benefit | Net-of-Tax Amount | Before-Tax Amount | Tax Benefit | Net-of-Tax Amount | ||||||||||||||||||
Unrealized gains (losses) on cash flow hedges: | |||||||||||||||||||||||
Change in unrealized gains and losses, foreign exchange contracts | $ | (3,570 | ) | $ | 183 | $ | (3,387 | ) | $ | (2,192 | ) | $ | 253 | $ | (1,939 | ) | |||||||
Net gains and losses reclassified into earnings, foreign exchange contracts (1) | 4,250 | (495 | ) | 3,755 | (262 | ) | 27 | (235 | ) | ||||||||||||||
Net unrealized gains (losses) on cash flow hedges | 680 | (312 | ) | 368 | (2,454 | ) | 280 | (2,174 | ) | ||||||||||||||
Foreign currency translation adjustments | (6,556 | ) | — | (6,556 | ) | (3,196 | ) | — | (3,196 | ) | |||||||||||||
Total other comprehensive loss | $ | (5,876 | ) | $ | (312 | ) | $ | (6,188 | ) | $ | (5,650 | ) | $ | 280 | $ | (5,370 | ) | ||||||
(1) | For Consolidated Statements of Income classification of amounts reclassified from accumulated other comprehensive loss, see Note 10, “Derivative Instruments and Hedging Activities,” of the Notes to Consolidated Financial Statements. |
94
The changes in accumulated other comprehensive loss by component, net of tax, for the fiscal years ended October 31, 2015, and November 1, 2014, are as follows (in thousands):
Fiscal Year Ended | |||||||||||||||||||||||
October 31, 2015 | November 1, 2014 | ||||||||||||||||||||||
Losses on Cash Flow Hedges | Foreign Currency Translation Adjustments | Total Accumulated Other Comprehensive Loss | Gains (Losses) on Cash Flow Hedges | Foreign Currency Translation Adjustments | Total Accumulated Other Comprehensive Loss | ||||||||||||||||||
Beginning balance | $ | (1,907 | ) | $ | (16,907 | ) | $ | (18,814 | ) | $ | 267 | $ | (13,711 | ) | $ | (13,444 | ) | ||||||
Change in unrealized gains and losses | (3,387 | ) | (6,556 | ) | (9,943 | ) | (1,939 | ) | (3,196 | ) | (5,135 | ) | |||||||||||
Net gains and losses reclassified into earnings | 3,755 | — | 3,755 | (235 | ) | — | (235 | ) | |||||||||||||||
Net current-period other comprehensive income (loss) | 368 | (6,556 | ) | (6,188 | ) | (2,174 | ) | (3,196 | ) | (5,370 | ) | ||||||||||||
Ending balance | $ | (1,539 | ) | $ | (23,463 | ) | $ | (25,002 | ) | $ | (1,907 | ) | $ | (16,907 | ) | $ | (18,814 | ) | |||||
14. Other Income, Net
On May 20, 2013, Brocade and A10 Networks, Inc. (“A10”) reached an agreement to settle both the lawsuit that Brocade filed against A10, A10’s founder, and other individuals in the United States District Court for the Northern District of California on August 4, 2010, and the lawsuit that A10 filed against Brocade on September 9, 2011, along with all related claims.
Among other agreed upon terms, A10 has granted the Company a broad patent license and agreed to pay the Company $5.0 million in cash and issued a $70.0 million unsecured convertible promissory note payable to the Company, which bore interest at 8% per annum. A10 fully paid the unsecured convertible promissory note in the fourth quarter of fiscal year 2013. A10 also has agreed not to use any of the versions of source code that were found to infringe any of Brocade’s copyrights, patents, or trade secrets, except as necessary to service prior versions of product already sold to and in the possession of A10’s customers. In addition, the settlement provides certain mutual covenants not to sue for various periods of time and certain general releases.
Based on the fair value of the consideration received as a result of this settlement, the Company recognized a gain of $76.8 million in the third quarter of fiscal year 2013, which is reported within “Other income, net” in the Company’s Consolidated Statements of Income for the fiscal year ended October 26, 2013.
95
15. Income Taxes
The domestic and international components of income before income tax for the fiscal years ended October 31, 2015, November 1, 2014, and October 26, 2013, are presented as follows (in thousands):
Fiscal Year Ended | |||||||||||
October 31, 2015 | November 1, 2014 | October 26, 2013 | |||||||||
United States | $ | 250,788 | $ | 192,730 | $ | 176,536 | |||||
International | 188,263 | 160,891 | 153,925 | ||||||||
Total | $ | 439,051 | $ | 353,621 | $ | 330,461 | |||||
The income tax expense (benefit) for the fiscal years ended October 31, 2015, November 1, 2014, and October 26, 2013, consisted of the following (in thousands):
Fiscal Year Ended | |||||||||||
October 31, 2015 | November 1, 2014 | October 26, 2013 | |||||||||
U.S. federal taxes: | |||||||||||
Current | $ | 64,042 | $ | 61,666 | $ | (13,666 | ) | ||||
Deferred | 14,775 | 33,065 | 46,313 | ||||||||
Total U.S. federal taxes | 78,817 | 94,731 | 32,647 | ||||||||
State taxes: | |||||||||||
Current | 9,790 | 16,597 | 8,091 | ||||||||
Deferred | 761 | (2,599 | ) | 78,106 | |||||||
Total state taxes | 10,551 | 13,998 | 86,197 | ||||||||
Non-U.S. taxes: | |||||||||||
Current | 9,713 | 6,655 | 2,837 | ||||||||
Deferred | (392 | ) | 266 | 157 | |||||||
Total non-U.S. taxes | 9,321 | 6,921 | 2,994 | ||||||||
Total | $ | 98,689 | $ | 115,650 | $ | 121,838 | |||||
The difference between the U.S. federal statutory tax rate and the Company’s effective tax rate for fiscal years ended October 31, 2015, November 1, 2014, and October 26, 2013, consisted of the following:
Fiscal Year Ended | ||||||||
October 31, 2015 | November 1, 2014 | October 26, 2013 | ||||||
U.S. federal statutory tax rate | 35.0 | % | 35.0 | % | 35.0 | % | ||
State taxes, net of federal tax benefit | 0.2 | 3.1 | 4.1 | |||||
Foreign income taxed at other than U.S. rates | (14.5 | ) | (16.9 | ) | (17.6 | ) | ||
Stock-based compensation expense | 1.9 | 2.3 | 1.9 | |||||
Research and development credit | (0.9 | ) | (3.1 | ) | (5.6 | ) | ||
Permanent items | 0.3 | 0.3 | 0.3 | |||||
Change in liabilities for uncertain tax positions | 0.5 | 0.5 | (5.1 | ) | ||||
Goodwill impairment charge | — | 8.3 | — | |||||
Audit settlement and reinstated tax credit | — | 0.1 | 1.3 | |||||
Change in valuation allowance | 1.3 | 1.6 | 23.7 | |||||
Other | (1.3 | ) | 1.5 | (1.1 | ) | |||
Effective tax rate | 22.5 | % | 32.7 | % | 36.9 | % | ||
96
In general, the Company’s provision for income taxes differs from the tax computed at the U.S. federal statutory tax rate due to state taxes, non-U.S. operations being taxed at rates lower than the U.S. federal statutory rate, non-deductible stock-based compensation expense, and adjustments to unrecognized tax benefits. The non-U.S. operations primarily relate to our European and Asia Pacific subsidiaries.
The effective tax rate in fiscal year 2015 was lower than the U.S. federal statutory tax rate of 35% primarily due to the effects of earnings in foreign jurisdictions being taxed at rates lower than the U.S. federal statutory tax rate, a benefit from a qualified domestic manufacturing deduction, and a benefit from the federal research and development tax credit that was reinstated on December 19, 2014, and made retroactive for calendar year 2014.
The effective tax rate in fiscal year 2014 was lower than the U.S. federal statutory tax rate of 35% primarily due to the effects of earnings in foreign jurisdictions being taxed at rates lower than the U.S. federal statutory tax rate and a benefit from the release of tax reserves due to expired statutes of limitations. In addition, the effective tax rate for fiscal year 2014 was negatively impacted by a goodwill impairment charge of $83.4 million, which is nondeductible for tax purposes, and a lower benefit from the federal research and development tax credit which expired on December 31, 2013, and, therefore, was not applicable in calendar year 2014.
The Company’s effective tax rate for fiscal year 2015 is lower compared with fiscal years 2014 and 2013 primarily due to the negative impact of a goodwill impairment charge of $83.4 million in fiscal year 2014, which is nondeductible for tax purposes, and a discrete charge of $78.2 million to reduce previously recognized California deferred tax assets due to changes in California law resulting from the passage of Proposition 39 in fiscal year 2013, respectively.
As of October 31, 2015, U.S. federal income taxes and foreign withholding taxes were not provided for on an estimated cumulative total of $873.8 million of undistributed earnings of the Company’s foreign subsidiaries. The Company intends to reinvest current and accumulated earnings of its foreign subsidiaries for expansion of its business operations outside the United States for an indefinite period of time. Our existing cash and cash equivalents totaled $1,440.9 million as of October 31, 2015. Of this amount, approximately 61% was held by our foreign subsidiaries. If these earnings were distributed to the United States in the form of dividends or otherwise, or if the shares of the relevant foreign subsidiaries were sold or otherwise transferred, the Company could be subject to additional U.S. income taxes, net of foreign tax credits, and foreign withholding taxes. Determination of the amount of unrecognized deferred income tax liability related to these earnings is not practicable.
The components of deferred tax assets and deferred tax liabilities for the fiscal years ended October 31, 2015, and November 1, 2014, are presented as follows (in thousands):
October 31, 2015 | November 1, 2014 | ||||||
Net operating loss carryforwards | $ | 7,871 | $ | 8,679 | |||
Stock-based compensation expense | 19,868 | 14,202 | |||||
Tax credit carryforwards | 87,830 | 84,930 | |||||
Reserves and accruals | 110,796 | 101,301 | |||||
Other | 140 | 553 | |||||
Gross deferred tax assets | 226,505 | 209,665 | |||||
Valuation allowance | (88,581 | ) | (83,489 | ) | |||
Total deferred tax assets | 137,924 | 126,176 | |||||
Acquired intangibles and goodwill | (18,155 | ) | (15,433 | ) | |||
Fixed assets | (28,370 | ) | (31,231 | ) | |||
Other | (35,935 | ) | (13,368 | ) | |||
Total deferred tax liabilities | (82,460 | ) | (60,032 | ) | |||
Total net deferred tax assets | $ | 55,464 | $ | 66,144 | |||
As of October 31, 2015, the Company believes that sufficient positive evidence exists from historical operations and projections of taxable income in future years to conclude that it is more likely than not that the Company will realize its deferred tax assets except for California deferred tax assets and capital loss carryforwards. Accordingly, the Company applies a valuation allowance to the California deferred tax assets due to the change in California law that occurred in November 2012, and to capital loss carryforwards due to the limited carryforward periods of these tax assets.
97
As of October 31, 2015, the Company had federal net operating loss carryforwards of $90.9 million, California state net operating loss carryforwards of $49.7 million and other significant state net operating loss carryforwards of approximately $135.3 million. Additionally, the Company had federal tax credit carryforwards of $119.4 million and state tax credit carryforwards of $178.7 million. The federal net operating loss and tax credit carryforwards expire on various dates between fiscal year 2017 through 2034. The state net operating loss and credit carryforwards expire on various dates between fiscal year 2015 through 2032. The federal net operating loss carryforwards and federal tax credit carryforwards include excess tax deductions related to stock-based compensation. Under the current tax law, net operating loss and credit carryforwards available to offset future income in any given year may be limited by statute or upon the occurrence of certain events, including significant changes in ownership interests. As a result of the McDATA, Foundry, and other acquisitions, all of the tax attributes from these companies are subject to an annual limitation. The Company expects some of these tax attributes to expire due to the annual limitation.
The Company applies a recognition threshold and measurement attribute for the financial statement recognition and measurement of an income tax position taken or expected to be taken on a tax return. Recognition of a tax position is determined when it is more likely than not that a tax position will be sustained upon examination, including resolution of any related appeals or litigation process. A tax position that meets the more-likely-than-not recognition threshold is measured at the largest amount of benefit that is greater than 50% likely of being realized upon ultimate settlement with a taxing authority.
A reconciliation of the beginning and ending amount of total gross unrecognized tax benefits, excluding accrued net interest and penalties, is as follows (in thousands):
October 31, 2015 | November 1, 2014 | ||||||
Unrecognized tax benefits, beginning balance | $ | 119,615 | $ | 112,479 | |||
Gross increases for tax positions taken in prior periods | 705 | 3,325 | |||||
Gross decreases for tax positions taken in prior periods | (6,843 | ) | (4,784 | ) | |||
Gross increases for tax positions taken in current period | 8,418 | 15,426 | |||||
Changes due to settlements with taxing authorities | — | — | |||||
Reductions resulting from lapses of statutes of limitations | (4,326 | ) | (6,831 | ) | |||
Unrecognized tax benefits, ending balance | $ | 117,569 | $ | 119,615 | |||
As of October 31, 2015, the Company had net unrecognized tax benefits of $79.0 million, all of which, if recognized, would result in a reduction of the Company’s effective tax rate.
The IRS and other tax authorities regularly examine the Company’s income tax returns. In October 2014, the IRS issued a Revenue Agent’s Report related to its field examination of the Company’s federal income tax returns for fiscal years 2009 and 2010. The IRS is contesting the Company’s transfer pricing with its foreign subsidiaries. In November 2014, the Company filed a protest to challenge the proposed adjustment, and in March 2015, the issue was moved to the Office of Appeals. In addition, in October 2014, the Geneva Tax Administration issued its final assessments for fiscal years 2003 to 2012, disputing certain of the Company’s transfer pricing arrangements. In November 2014, the Company filed a protest to challenge the final assessments. The Company believes that reserves for unrecognized tax benefits are adequate for all open tax years. The timing of income tax examinations, as well as the amounts and timing of related settlements, if any, are highly uncertain. Before the end of fiscal year 2016, it is reasonably possible that either certain audits will conclude or the statutes of limitations relating to certain income tax examination periods will expire, or both. After we reach settlement with the tax authorities, we expect to record a corresponding adjustment to our unrecognized tax benefits. Taking into consideration the inherent uncertainty as to settlement terms, the timing of payments, and the impact of such settlements on the uncertainty in income taxes, the Company estimates the range of potential decreases in underlying uncertainty in income tax is between $0 and $4.0 million in the next 12 months.
The Company classifies interest and penalties related to unrecognized tax benefits as a component of income tax expense. During the fiscal year ended October 31, 2015, the Company recognized $0.2 million of interest and penalties related to unrecognized tax benefits. There was no material change in interest and penalties during the fiscal year ended November 1, 2014. The total net accrued interest and penalties included in the Company’s liability related to unrecognized tax benefits as of October 31, 2015, and November 1, 2014, was $2.5 million and $2.3 million, respectively.
Of the total tax benefits (detriments) resulting from the exercise of employee stock options and employee participation in the Company’s equity compensation plans, the amounts recorded to stockholders’ equity were approximately $48.0 million in fiscal year 2015, $59.9 million in fiscal year 2014, and $(1.5) million in fiscal year 2013.
98
16. Segment Information
Operating segments are defined as components of an enterprise for which separate financial information is available that is evaluated regularly by the Chief Operating Decision Maker (“CODM”), or decision-making group, in deciding how to allocate resources and in assessing performance. Financial decisions and the allocation of resources are based on the information from the Company’s internal management reporting system. Currently, the Company’s CODM is its Chief Executive Officer.
Brocade is organized into three operating segments, each of which is an individually reportable segment: SAN Products, IP Networking Products, and Global Services. These reportable segments are organized principally by product category.
The types of products and services from which each reportable segment derives its revenues are as follows:
• | SAN Products include infrastructure products and solutions that help customers develop and deploy storage and server consolidation, disaster recovery, and data security, as well as meet compliance requirements regarding data management. These products are used to build storage area networks and are generally used in conjunction with servers and storage subsystems, SAN interconnection components, and server and storage management software applications and tools. Brocade’s family of Fibre Channel (“FC”) SAN backbones, directors, and fabric/embedded switches provide interconnection, bandwidth, and high-speed switching between servers and storage devices. Switches and directors support key applications such as data backup, remote mirroring, and high-availability clustering, as well as high-volume transaction processing applications such as enterprise resource planning and data warehousing. Additionally, Brocade offers a variety of FC fabric extension, switching, and routing solutions; |
• | IP Networking Products include Layer 2 and Layer 3 Ethernet switches and routers that are designed to connect users over private and public networks, including local area, metro, and within and across global data centers. Brocade also offers converged network products, and a portfolio of related software and hardware-based data networking offerings. Additionally, the Company offers Layer 4-7 platforms that are designed for application traffic management and server load balancing; and |
• | Global Services include break/fix maintenance, installation, consulting, network management and software maintenance, and post-contract customer support revenue. |
At this time, the Company does not track its operating expenses by operating segments because management does not consider this information in its measurement of the performance of the operating segments. The Company also does not track all of its assets by operating segments. The majority of the Company’s assets as of October 31, 2015, and November 1, 2014, were attributable to its U.S. operations.
Summarized financial information by reportable segment for the fiscal years ended October 31, 2015, November 1, 2014, and October 26, 2013, based on the internal management reporting system, is as follows (in thousands):
SAN Products | IP Networking Products | Global Services | Total | ||||||||||||
Fiscal year ended October 31, 2015 | |||||||||||||||
Net revenues | $ | 1,301,231 | $ | 601,170 | $ | 361,059 | $ | 2,263,460 | |||||||
Cost of revenues | 311,881 | 275,634 | 147,872 | 735,387 | |||||||||||
Gross margin | $ | 989,350 | $ | 325,536 | $ | 213,187 | $ | 1,528,073 | |||||||
Fiscal year ended November 1, 2014 | |||||||||||||||
Net revenues | $ | 1,326,950 | $ | 525,237 | $ | 359,080 | $ | 2,211,267 | |||||||
Cost of revenues | 344,466 | 247,975 | 153,033 | 745,474 | |||||||||||
Gross margin | $ | 982,484 | $ | 277,262 | $ | 206,047 | $ | 1,465,793 | |||||||
Fiscal year ended October 26, 2013 | |||||||||||||||
Net revenues | $ | 1,318,509 | $ | 552,058 | $ | 352,297 | $ | 2,222,864 | |||||||
Cost of revenues | 355,388 | 302,974 | 155,623 | 813,985 | |||||||||||
Gross margin | $ | 963,121 | $ | 249,084 | $ | 196,674 | $ | 1,408,879 | |||||||
99
Revenues are attributed to geographic areas based on where the Company’s products are shipped. Geographic revenue and property and equipment information for the fiscal years ended October 31, 2015, November 1, 2014, and October 26, 2013 is presented below (in thousands):
Fiscal Year Ended | |||||||||||
October 31, 2015 | November 1, 2014 | October 26, 2013 | |||||||||
Net revenues: | |||||||||||
United States | $ | 1,275,056 | $ | 1,286,650 | $ | 1,351,242 | |||||
International | |||||||||||
Europe, the Middle East and Africa (1) | 610,133 | 598,196 | 552,734 | ||||||||
Asia Pacific | 229,903 | 183,035 | 181,461 | ||||||||
Japan | 93,470 | 91,062 | 97,259 | ||||||||
Canada, Central and South America | 54,898 | 52,324 | 40,168 | ||||||||
Total international net revenues | 988,404 | 924,617 | 871,622 | ||||||||
Total net revenues | $ | 2,263,460 | $ | 2,211,267 | $ | 2,222,864 | |||||
(1) | Includes net revenues of $400.0 million, $385.2 million, and $339.1 million for the fiscal years ended October 31, 2015, November 1, 2014, and October 26, 2013, respectively, relating to the Netherlands. |
Fiscal Year Ended | |||||||||||
October 31, 2015 | November 1, 2014 | October 26, 2013 | |||||||||
Property and equipment, net: | |||||||||||
United States | $ | 409,404 | $ | 426,941 | $ | 457,622 | |||||
International | 29,820 | 18,492 | 15,318 | ||||||||
Property and equipment, net | $ | 439,224 | $ | 445,433 | $ | 472,940 | |||||
17. Net Income per Share
The following table presents the calculation of basic and diluted net income per share (in thousands, except per share amounts):
Fiscal Year Ended | |||||||||||
October 31, 2015 | November 1, 2014 | October 26, 2013 | |||||||||
Basic net income per share | |||||||||||
Net income | $ | 340,362 | $ | 237,971 | $ | 208,623 | |||||
Weighted-average shares used in computing basic net income per share | 420,331 | 435,258 | 450,516 | ||||||||
Basic net income per share | $ | 0.81 | $ | 0.55 | $ | 0.46 | |||||
Diluted net income per share | |||||||||||
Net income | $ | 340,362 | $ | 237,971 | $ | 208,623 | |||||
Weighted-average shares used in computing basic net income per share | 420,331 | 435,258 | 450,516 | ||||||||
Dilutive potential common shares in the form of stock options | 1,722 | 1,995 | 3,472 | ||||||||
Dilutive potential common shares in the form of other share-based awards | 8,503 | 9,606 | 9,717 | ||||||||
Weighted-average shares used in computing diluted net income per share | 430,556 | 446,859 | 463,705 | ||||||||
Diluted net income per share | $ | 0.79 | $ | 0.53 | $ | 0.45 | |||||
Antidilutive potential common shares in the form of: (1) | |||||||||||
Warrants issued in conjunction with the 2020 Convertible Notes (2) | 28,880 | — | — | ||||||||
Stock options | 977 | 1,725 | 11,868 | ||||||||
Other share-based awards | 142 | 893 | 167 | ||||||||
(1) | These amounts are excluded from the computation of diluted net income per share. |
100
(2) | In connection with the issuance of the 2020 Convertible Notes, the Company entered into convertible note hedge and warrant transactions as described in Note 8, “Borrowings.” The 2020 Convertible Notes have no impact on diluted earnings per share until the average quarterly price of the Company’s common stock exceeds the adjusted conversion price of $15.90 per share. If the common stock price exceeds this adjusted conversion price, prior to conversion, the Company will calculate the effect of the additional shares that may be issued using the treasury stock method. If the average price of the Company’s common stock exceeds $20.61 per share for a quarterly period, the Company’s weighted-average shares used in computing diluted net income per share will be impacted by the effect of the additional potential shares that may be issued related to the warrants using the treasury stock method. The convertible note hedge is not considered for purposes of the diluted earnings per share calculation, as its effect would be antidilutive. |
18. Guarantor and Non-Guarantor Subsidiaries
On January 20, 2010, the Company issued $300.0 million in aggregate principal amount of the 6.625% senior secured notes due 2018 (the “2018 Notes”) and $300.0 million in aggregate principal amount of the 2020 Notes (together with the 2018 Notes, the “Senior Secured Notes”) pursuant to separate indentures between the Company, certain domestic subsidiaries of the Company, and Wells Fargo Bank, National Association, as the trustee (the “2020 Indenture” and “2018 Indenture,” respectively). In addition, on January 22, 2013, the Company issued $300.0 million in aggregate principal amount of the 2023 Notes. The Company’s obligations under the Senior Secured Notes and the 2023 Notes were previously guaranteed by certain of the Company’s domestic subsidiaries (the “Subsidiary Guarantors”). Each of the Subsidiary Guarantors was 100% owned by the Company and all guarantees were joint and several. Neither the Senior Secured Notes nor the 2023 Notes were guaranteed by certain of the Company’s domestic subsidiaries or any of the Company’s foreign subsidiaries (the “Non-Guarantor Subsidiaries”).
The Company determined that the circumstances under which the subsidiary guarantees may be released were customary under applicable SEC guidance, and, as such, the Company previously provided consolidated financial statements in reliance on Item 3-10 of Regulation S-X.
The guarantees of the 2018 Notes and 2020 Notes were released on January 22, 2013, and January 14, 2015, respectively, upon the discharge of the 2018 Indenture and 2020 Indenture. The guarantees of the 2023 Notes were released on January 14, 2015, upon termination of the Senior Secured Credit Facility and discharge of the 2020 Indenture.
As a result, all guarantees were released prior to January 31, 2015, and the Company ceased presenting condensed consolidated financial statements for the parent company, the former Subsidiary Guarantors, and Non-Guarantor Subsidiaries effective in the first fiscal quarter of 2015.
101
BROCADE COMMUNICATIONS SYSTEMS, INC. QUARTERLY SUMMARY (Unaudited) | |||||||||||||||||||||||||||||||
Three Months Ended | |||||||||||||||||||||||||||||||
October 31, 2015 | August 1, 2015 | May 2, 2015 | January 31, 2015 | November 1, 2014 | August 2, 2014 | May 3, 2014 (1) | January 25, 2014 | ||||||||||||||||||||||||
(In thousands, except per share and stock price amounts) | |||||||||||||||||||||||||||||||
Quarterly Data: | |||||||||||||||||||||||||||||||
Net revenues | $ | 588,827 | $ | 551,819 | $ | 546,575 | $ | 576,239 | $ | 564,358 | $ | 545,464 | $ | 536,910 | $ | 564,535 | |||||||||||||||
Gross margin | $ | 394,277 | $ | 371,904 | $ | 372,209 | $ | 389,683 | $ | 377,118 | $ | 361,713 | $ | 354,292 | $ | 372,670 | |||||||||||||||
Income from operations | $ | 119,221 | $ | 119,849 | $ | 114,205 | $ | 139,405 | $ | 126,530 | $ | 117,897 | $ | 20,195 | $ | 121,490 | |||||||||||||||
Net income (loss) | $ | 84,388 | $ | 91,667 | $ | 77,040 | $ | 87,267 | $ | 83,419 | $ | 87,352 | $ | (13,684 | ) | $ | 80,884 | ||||||||||||||
Per share amounts: | |||||||||||||||||||||||||||||||
Basic | $ | 0.20 | $ | 0.22 | $ | 0.18 | $ | 0.20 | $ | 0.19 | $ | 0.20 | $ | (0.03 | ) | $ | 0.18 | ||||||||||||||
Diluted | $ | 0.20 | $ | 0.21 | $ | 0.18 | $ | 0.20 | $ | 0.19 | $ | 0.20 | $ | (0.03 | ) | $ | 0.18 | ||||||||||||||
Shares used in computing per share amounts: | |||||||||||||||||||||||||||||||
Basic | 414,769 | 417,299 | 420,718 | 428,536 | 431,843 | 432,448 | 436,167 | 440,573 | |||||||||||||||||||||||
Diluted | 422,315 | 427,518 | 433,234 | 439,156 | 441,649 | 441,789 | 436,167 | 453,549 | |||||||||||||||||||||||
Common stock sale prices: | |||||||||||||||||||||||||||||||
High | $ | 11.28 | $ | 12.88 | $ | 12.96 | $ | 12.43 | $ | 10.99 | $ | 9.75 | $ | 10.96 | $ | 9.70 | |||||||||||||||
Low | $ | 9.72 | $ | 9.67 | $ | 10.85 | $ | 10.66 | $ | 8.91 | $ | 7.95 | $ | 8.81 | $ | 7.77 | |||||||||||||||
(1) | The quarter ended May 3, 2014, includes the impact of an $83.4 million impairment of goodwill in the Company’s Application Delivery Products reporting unit. |
102
Item 9. | Changes in and Disagreements with Accountants on Accounting and Financial Disclosure |
None.
Item 9A. | Controls and Procedures |
Evaluation of Disclosure Controls and Procedures
Under the supervision and with the participation of our management, including our Chief Executive Officer and Chief Financial Officer, we conducted an evaluation of the effectiveness of our disclosure controls and procedures, as defined in Rules 13a-15(e) and 15d-15(e) under the Securities Exchange Act of 1934, as amended (the “Act”), as of the end of the period covered by this Annual Report on Form 10-K (the “Evaluation Date”).
The purpose of this evaluation is to determine if, as of the Evaluation Date, our disclosure controls and procedures are effective such that the information required to be disclosed in the reports we file or submit under the Act (i) is recorded, processed, summarized, and reported within the time periods specified in SEC rules and forms and (ii) is accumulated and communicated to our management, including our Chief Executive Officer and Chief Financial Officer, as appropriate, to allow timely decisions regarding required disclosure.
Based on this evaluation, our Chief Executive Officer and Chief Financial Officer concluded that, as of the Evaluation Date, our disclosure controls and procedures were effective.
Changes in Internal Control over Financial Reporting
There were no changes in our internal control over financial reporting, as defined in Rules 13a-15(f) and 15d-15(f) under the Act, that occurred during the quarter ended October 31, 2015, that have materially affected, or are reasonably likely to materially affect, our internal control over financial reporting.
Management’s Report on Internal Control over Financial Reporting
The management of Brocade Communications Systems, Inc. is responsible for establishing and maintaining adequate internal control over financial reporting as defined in Rule 13a-15(f) or 15d-15(f) of the Act, which has historically been based on the framework set forth in the Internal Control—Integrated Framework (1992) issued by the Committee of Sponsoring Organizations (“COSO”) of the Treadway Commission. In May 2013, COSO issued an updated framework (the “2013 COSO Framework”). We have integrated the changes prescribed by the 2013 COSO Framework into our internal controls over financial reporting during fiscal year 2015. The Company’s internal control over financial reporting is a process designed by, or under the supervision of, the Company’s principal executive and principal financial officers, and effected by the Company’s Board of Directors, management, and other personnel, to provide reasonable assurance regarding the reliability of financial reporting and the preparation of financial statements for external purposes in accordance with generally accepted accounting principles and includes those policies and procedures that:
• | pertain to the maintenance of records that in reasonable detail accurately and fairly reflect the transactions and dispositions of the assets of the Company; |
• | provide reasonable assurance that transactions are recorded as necessary to permit preparation of financial statements in accordance with generally accepted accounting principles, and that receipts and expenditures of the Company are being made only in accordance with authorizations of management and directors of the Company; and |
• | provide reasonable assurance regarding prevention or timely detection of unauthorized acquisition, use, or disposition of the Company’s assets that could have a material effect on the financial statements. |
Our management assessed the effectiveness of the Company’s internal control over financial reporting as of October 31, 2015, utilizing the criteria set forth by the COSO of the Treadway Commission in Internal Control—Integrated Framework (2013). Based on our management’s assessment, we believe that, as of October 31, 2015, our internal control over financial reporting was effective based on those criteria. The effectiveness of our internal control over financial reporting as of October 31, 2015, has been audited by KPMG LLP, Brocade’s independent registered public accounting firm, as stated in their report which is included elsewhere in this Annual Report on Form 10-K.
103
Our management, including our Chief Executive Officer and Chief Financial Officer, does not expect that our disclosure controls and procedures or internal control over financial reporting will prevent all errors and all fraud. A control system, no matter how well designed and implemented, can provide only reasonable, not absolute, assurance that the control system’s objectives will be met. Further, the design of a control system must reflect the fact that there are resource constraints and the benefits of controls must be considered relative to their costs. Because of the inherent limitations in all control systems, no evaluation of controls can provide absolute assurance that all control issues within a company are detected. The inherent limitations include the realities that judgments in decision-making can be faulty and that breakdowns can occur because of simple errors or mistakes. Controls can also be circumvented by the individual acts of some persons, by collusion of two or more people, or by management override of the controls. Because of the inherent limitations in a cost-effective control system, misstatements due to error or fraud may occur and may not be detected. Also, projections of any evaluation of effectiveness to future periods are subject to the risk that controls may become inadequate because of changes in conditions, or that the degree of compliance with the policies or procedures may deteriorate.
104
Report of Independent Registered Public Accounting Firm
The Board of Directors and Stockholders
Brocade Communications Systems, Inc.:
We have audited Brocade Communications Systems, Inc. and subsidiaries’ (the Company) internal control over financial reporting as of October 31, 2015, based on criteria established in Internal Control - Integrated Framework (2013) issued by the Committee of Sponsoring Organizations of the Treadway Commission (COSO). The Company’s management is responsible for maintaining effective internal control over financial reporting and for its assessment of the effectiveness of internal control over financial reporting included in the accompanying Management’s Report on Internal Control over Financial Reporting appearing in Item 9A. Our responsibility is to express an opinion on the Company’s internal control over financial reporting based on our audit.
We conducted our audit in accordance with the standards of the Public Company Accounting Oversight Board (United States). Those standards require that we plan and perform the audit to obtain reasonable assurance about whether effective internal control over financial reporting was maintained in all material respects. Our audit included obtaining an understanding of internal control over financial reporting, assessing the risk that a material weakness exists, and testing and evaluating the design and operating effectiveness of internal control, based on the assessed risk. Our audit also included performing such other procedures as we considered necessary in the circumstances. We believe that our audit provides a reasonable basis for our opinion.
A company’s internal control over financial reporting is a process designed to provide reasonable assurance regarding the reliability of financial reporting and the preparation of financial statements for external purposes in accordance with generally accepted accounting principles. A company’s internal control over financial reporting includes those policies and procedures that (1) pertain to the maintenance of records that, in reasonable detail, accurately and fairly reflect the transactions and dispositions of the assets of the company; (2) provide reasonable assurance that transactions are recorded as necessary to permit preparation of financial statements in accordance with generally accepted accounting principles, and that receipts and expenditures of the company are being made only in accordance with authorizations of management and directors of the company; and (3) provide reasonable assurance regarding prevention or timely detection of unauthorized acquisition, use, or disposition of the company’s assets that could have a material effect on the financial statements.
Because of its inherent limitations, internal control over financial reporting may not prevent or detect misstatements. Also, projections of any evaluation of effectiveness to future periods are subject to the risk that controls may become inadequate because of changes in conditions, or that the degree of compliance with the policies or procedures may deteriorate.
In our opinion, the Company maintained, in all material respects, effective internal control over financial reporting as of October 31, 2015, based on criteria established in Internal Control - Integrated Framework (2013) issued by COSO.
We also have audited, in accordance with the standards of the Public Company Accounting Oversight Board (United States), the consolidated balance sheets of Brocade Communications Systems, Inc. and subsidiaries as of October 31, 2015, and November 1, 2014, and the related consolidated statements of income, comprehensive income, cash flows, and stockholders’ equity for each of the years in the three-year period ended October 31, 2015, and the accompanying financial statement schedule. Our report, dated December 22, 2015, expressed an unqualified opinion on those consolidated financial statements and the related financial statement schedule.
/s/ | KPMG LLP |
Santa Clara, California
December 22, 2015
105
Item 9B. | Other Information |
None.
PART III
Certain information required by Part III is incorporated by reference from the Company’s definitive Proxy Statement to be filed with the Securities and Exchange Commission in connection with the solicitation of proxies for the Company’s 2016 Annual Meeting of Stockholders (the “Proxy Statement”).
Item 10. | Directors, Executive Officers and Corporate Governance |
The information required by this Item with respect to the Company’s directors is incorporated by reference from the Proxy Statement under the sections entitled “Election of Directors” and “Board of Directors.” The information required by this Item with respect to the Company’s executive officers is incorporated by reference from the Proxy Statement under the section entitled “Executive Officers.” The information required by this Item with respect to disclosure of any known late filing or failure by an insider to file a report required by Section 16 of the Exchange Act is incorporated by reference from the Proxy Statement under the section entitled “Section 16(a) Beneficial Ownership Reporting Compliance.” The information regarding the Company’s corporate governance is incorporated by reference from the Proxy Statement.
The Board of Directors has adopted a Code of Ethics for Principal Executive and Senior Financial Officers (the “Code of Ethics”), which applies to the Company’s Chief Executive Officer, Chief Financial Officer, and any other principal financial officer, controller and any other principal accounting officer, and any other person performing similar functions. The Code of Ethics is available on the Company’s website at www.brocade.com in the “Corporate Governance” section of its Investor Relations webpage. The Company will also provide a copy of the Code of Ethics upon request made by e-mail to ir@brocade.com or in writing to Brocade Communications Systems, Inc., Attention: Investor Relations, 130 Holger Way, San Jose, California 95134-1376. The Company will disclose any amendment to the Code of Ethics or waiver of a provision of the Code of Ethics that applies to the Company’s Chief Executive Officer, Chief Financial Officer, and any other principal financial officer, controller and any other principal accounting officer, and any other person performing similar functions, and relate to certain elements of the Code of Ethics, including the name of the officer to whom the waiver was granted, on its website at www.brocade.com on its Investor Relations webpage.
Item 11. | Executive Compensation |
The information required by this Item is incorporated by reference from the Proxy Statement under the section entitled “Compensation Discussion and Analysis.”
Item 12. | Security Ownership of Certain Beneficial Owners and Management and Related Stockholder Matters |
The information required by this Item is incorporated by reference from the Proxy Statement under the sections entitled “Security Ownership of Certain Beneficial Owners and Management” and “Board of Directors.” Information with respect to securities authorized for issuance under equity compensation plans is incorporated by reference from the Proxy Statement under the section entitled “Equity Compensation Plan Information.”
Item 13. | Certain Relationships and Related Transactions, and Director Independence |
The information required by this Item is incorporated by reference from the Proxy Statement under the section entitled “Certain Relationships and Related Transactions.”
Item 14. | Principal Accountant Fees and Services |
The information required by this Item is incorporated by reference from the Proxy Statement under the section entitled “Ratification of Selection of Independent Registered Public Accountants.”
106
PART IV
Item 15. | Exhibits and Financial Statement Schedules |
a. | The following documents are filed as a part of this Form 10-K: |
(1)Financial Statements and Supplementary Data:
The following financial statements and supplementary data of Brocade Communications Systems, Inc. are filed as a part of this Annual Report.
Page | |
Report of Independent Registered Public Accounting Firm | |
Consolidated Statements of Income | |
Consolidated Statements of Comprehensive Income | |
Consolidated Balance Sheets | |
Consolidated Statements of Cash Flows | |
Consolidated Statements of Stockholders’ Equity | |
Notes to Consolidated Financial Statements | |
Quarterly Summary (Unaudited) | |
(2)Financial Statement Schedules:
The following financial statement schedule of Brocade Communications Systems, Inc. for the fiscal years ended October 31, 2015, November 1, 2014, and October 26, 2013, is filed as part of this Annual Report, and should be read in conjunction with the Company’s Consolidated Financial Statements of Brocade Communications Systems, Inc.
All other schedules have been omitted, as the required information is inapplicable or the information is presented in the Company’s Consolidated Financial Statements and notes thereto under Item 8 in Part II of this Form 10-K.
(3)Exhibits:
EXHIBIT INDEX
Exhibit Number | Description of Document Number | |
1.1 | Purchase Agreement, dated January 8, 2015, by and among Brocade, Wells Fargo Securities, LLC and Merrill Lynch, Pierce, Fenner & Smith Incorporated (incorporated by reference to Exhibit 1.1 from Brocade’s current report on Form 8-K filed on January 14, 2015) | |
3.1 | Amended and Restated Certificate of Incorporation (incorporated by reference to Exhibit 3.1 from Brocade’s quarterly report on Form 10-Q for the fiscal quarter ended July 28, 2007) | |
3.2 | Certificates of Correction and Corrected Amended and Restated Certificate of Incorporation, effective as of June 1, 2009 (incorporated by reference to Exhibit 3.5 from Brocade’s quarterly report on Form 10-Q for the fiscal quarter ended May 2, 2009) | |
3.3 | Certificate of Amendment to Amended and Restated Certificate of Incorporation, effective as of April 13, 2010 (incorporated by reference to Exhibit 3.1 from Brocade’s current report on Form 8-K filed on April 13, 2010) | |
3.4 | Amended and Restated Bylaws of the Registrant, effective as of September 26, 2014 (incorporated by reference to Exhibit 3.1 from Brocade’s current report on Form 8-K filed on September 30, 2014) | |
3.5 | Certificate of Designation of Rights, Preferences and Privileges of Series A Participating Preferred Stock of Brocade (incorporated by reference to Exhibit 4.1 from Brocade’s Registration Statement on Form 8-A filed on February 11, 2002) | |
3.6 | Certificate of Elimination of Series A Participating Preferred Stock of Brocade (incorporated by reference to Exhibit 3.1 from Brocade’s current report on Form 8-K filed on February 16, 2007) | |
107
Exhibit Number | Description of Document Number | |
4.1 | Form of Registrant’s Common Stock certificate (incorporated by reference to Exhibit 4.1 from Brocade’s Registration Statement on Form S-1 (Reg. Number 333-74711), as amended) | |
4.2 | Indenture, dated as of January 22, 2013, by and among the Company, the Subsidiary Guarantors named therein and Wells Fargo Bank, National Association, as Trustee, governing the Notes (incorporated by reference to Exhibit 4.1 from Brocade’s Form 8-K filed on January 22, 2013) | |
4.3 | Indenture (including the Form of Notes) dated January 14, 2015, between Brocade and Wells Fargo Bank, National Association (incorporated by reference to Exhibit 4.1 from Brocade’s current report on Form 8-K filed on January 14, 2015) | |
4.4 | Form of 1.375% Convertible Senior Note due 2020 (included in Exhibit 4.4) (incorporated by reference to Exhibit 4.2 from Brocade’s current report on Form 8-K filed on January 14, 2015) | |
10.1 | Form of Indemnification Agreement entered into between Brocade and each of its directors and executive officers (incorporated by reference to Exhibit 10.1 from Brocade’s Registration Statement on Form S-1 (Reg. Number 333-74711), as amended) | |
10.2† | Goods Agreement between IBM and Brocade dated April 15, 1999 (incorporated by reference to Exhibit 10.24 from Brocade’s annual report on Form 10-K for the fiscal year ended October 27, 2001) | |
10.3 | Amendment Number 1 to the Goods Agreement between IBM and Brocade (incorporated by reference to Exhibit 10.25 from Brocade’s annual report on Form 10-K for the fiscal year ended October 27, 2001) | |
10.4† | Statement of Work Number 1 between IBM and Brocade (incorporated by reference to Exhibit 10.26 from Brocade’s annual report on Form 10-K for the fiscal year ended October 27, 2001) | |
10.5† | Amendment Number 4 to Statement of Work Number 1 between IBM and Brocade (incorporated by reference to Exhibit 10.28 from Brocade’s annual report on Form 10-K for the fiscal year ended October 27, 2001) | |
10.6 | Lease Agreement between MV Golden State San Jose, LLC and Brocade, dated December 1, 2000 (incorporated by reference to Exhibit 10.1 from Brocade’s quarterly report on Form 10-Q for the fiscal quarter ended January 27, 2001) | |
10.7† | Amendment Number 7 to Statement of Work Number 1 between IBM and Brocade (incorporated by reference to Exhibit 10.37 from Brocade’s quarterly report on Form 10-Q for the fiscal quarter ended July 27, 2002) | |
10.8† | OEM Purchase Agreement between Brocade and Hewlett-Packard Company, dated December 16, 2002 (incorporated by reference to Exhibit 10.48 from Brocade’s quarterly report on Form 10-Q for the fiscal quarter ended January 25, 2003) | |
10.9† | Manufacturing and Purchase Agreement between Brocade and Hon Hai Precision Industry Co., Ltd., dated April 5, 2003 (HHPI Manufacturing and Purchase Agreement) (incorporated by reference to Exhibit 10.49 from Brocade’s quarterly report on Form 10-Q for the fiscal quarter ended April 26, 2003) | |
10.10 | Amendment Number One to HHPI Manufacturing and Purchase Agreement between Brocade and Hon Hai Precision Industry Co., Ltd., dated April 5, 2003 (incorporated by reference to Exhibit 10.50 from Brocade’s quarterly report on Form 10-Q for the fiscal quarter ended April 26, 2003) | |
10.11† | Manufacturing and Purchase Agreement between Brocade Communications Switzerland SarL and Hon Hai Precision Industry Co., Ltd., dated May 1, 2003 (incorporated by reference to Exhibit 10.51 from Brocade’s quarterly report on Form 10-Q for the fiscal quarter ended April 26, 2003) | |
10.12† | Manufacturing and Purchase Agreement between Brocade and Solectron Corporation, dated February 21, 2003 (Solectron Manufacturing and Purchase Agreement) (incorporated by reference to Exhibit 10.52 from Brocade’s quarterly report on Form 10-Q for the fiscal quarter ended April 26, 2003) | |
10.13 | Amendment Number 1 to Solectron Manufacturing and Purchase Agreement between Brocade and Solectron Corporation, dated March 21, 2003 (incorporated by reference to Exhibit 10.53 from Brocade’s quarterly report on Form 10-Q for the fiscal quarter ended April 26, 2003) | |
10.14† | Manufacturing and Purchase Agreement between Brocade Communications Switzerland SarL and Solectron Corporation, dated March 21, 2003 (incorporated by reference to Exhibit 10.54 from Brocade’s quarterly report on Form 10-Q for the fiscal quarter ended April 26, 2003) | |
10.15† | Amendment Number 15, dated March 26, 2004, to Statement of Work Number 1 between IBM and Brocade (incorporated by reference to Exhibit 10.71 from Brocade’s quarterly report on Form 10-Q for the fiscal quarter ended May 1, 2004) | |
108
Exhibit Number | Description of Document Number | |
10.16† | Amendment Number 18, dated October 5, 2004, to Statement of Work Number 1 between IBM and Brocade (incorporated by reference to Exhibit 10.77 from Brocade’s annual report on Form 10-K for the fiscal year ended October 30, 2004) | |
10.17† | Amendment Number 1, dated November 2, 2004, to OEM Purchase Agreement between Brocade and Hewlett-Packard Company, dated December 16, 2002 (incorporated by reference to Exhibit 10.80 from Brocade’s annual report on Form 10-K for the fiscal year ended October 30, 2004) | |
10.18† | Amendment Number 2, dated October 27, 2004, to OEM Purchase Agreement between Brocade and Hewlett-Packard Company, dated December 16, 2002 (incorporated by reference to Exhibit 10.81 from Brocade’s annual report on Form 10-K for the fiscal year ended October 30, 2004) | |
10.19† | Amendment Number 3, dated November 22, 2004, to OEM Purchase Agreement between Brocade and Hewlett-Packard Company, dated December 16, 2002 (incorporated by reference to Exhibit 10.89 from Brocade’s quarterly report on Form 10-Q for the fiscal quarter ended January 29, 2005) | |
10.20* | Amended and Restated 1999 Employee Stock Purchase Plan and related forms of agreements (incorporated by reference to Exhibit 10.7 from Brocade’s quarterly report on Form 10-Q for the fiscal quarter ended July 30, 2005) | |
10.21* | Amended and Restated 1999 Nonstatutory Stock Option Plan and related forms of agreements (incorporated by reference to Exhibit 10.8 from Brocade’s quarterly report on Form 10-Q for the fiscal quarter ended July 30, 2005) | |
10.22 | Tolling Agreement dated as of January 1, 2006, between Gregory L. Reyes and Brocade, David House, William Krause, Nicholas Moore, William O’Brien, Christopher Paisley, Larry Sonsini, Seth Neiman, Neal Dempsey and Sanjay Vaswani (incorporated by reference to Exhibit 10.2 from Brocade’s quarterly report on Form 10-Q for the fiscal quarter ended January 28, 2006) | |
10.23 | Notice of partial termination of Tolling Agreement, dated September 11, 2006 (incorporated by reference to Exhibit 10.80 from Brocade’s annual report on Form 10-K for the fiscal year ended October 27, 2007) | |
10.24† | Amendment Number 4, dated January 20, 2006, to the OEM Purchase Agreement between Brocade and Hewlett-Packard Company, dated December 16, 2002 (incorporated by reference to Exhibit 10.1 from Brocade’s quarterly report on Form 10-Q for the fiscal quarter ended April 29, 2006) | |
10.25† | Amendment Number 26, dated September 19, 2006, to Statement of Work Number 1 between IBM and Brocade dated August 12, 2005 (incorporated by reference to Exhibit 10.103 from Brocade’s annual report on Form 10-K for the fiscal year ended October 28, 2006) | |
10.26† | Amendment Number 6, effective as of August 4, 2006, to OEM Purchase Agreement between Brocade and Hewlett-Packard Company, dated December 16, 2002 (incorporated by reference to Exhibit 10.105 from Brocade’s annual report on Form 10-K for the fiscal year ended October 28, 2006) | |
10.27† | Amendment Number 7, dated August 4, 2006, to OEM Purchase Agreement between Brocade and Hewlett-Packard Company, dated December 16, 2002 (incorporated by reference to Exhibit 10.106 from Brocade’s annual report on Form 10-K for the fiscal year ended October 28, 2006) | |
10.28† | Amendment Number 5, dated April 20, 2007, to OEM Purchase Agreement between Hewlett-Packard Company and Brocade (incorporated by reference to Exhibit 10.102 from Brocade’s annual report on Form 10-K for the fiscal year ended October 27, 2007) | |
10.29† | Amendment Number 8, dated September 6, 2007, to OEM Purchase Agreement between Hewlett-Packard Company and Brocade (incorporated by reference to Exhibit 10.103 from Brocade’s annual report on Form 10-K for the fiscal year ended October 27, 2007) | |
10.30† | Statement of Work Number 7, dated October 1, 2007, to Goods Agreement between IBM and Brocade (incorporated by reference to Exhibit 10.104 from Brocade’s annual report on Form 10-K for the fiscal year ended October 27, 2007) | |
10.31† | Ninth Amendment, dated November 5, 2007, to OEM Purchase Agreement, dated December 16, 2002, between Hewlett-Packard Company and Brocade (incorporated by reference to Exhibit 10.2 from Brocade’s quarterly report on Form 10-Q for the fiscal quarter ended January 26, 2008) | |
10.32† | Tenth Amendment, dated December 21, 2007, to OEM Purchase Agreement, dated December 16, 2002, between Hewlett-Packard Company and Brocade (incorporated by reference to Exhibit 10.4 from Brocade’s quarterly report on Form 10-Q for the fiscal quarter ended January 26, 2008) | |
109
Exhibit Number | Description of Document Number | |
10.33† | Amendment Number 32, dated January 22, 2008, to Statement of Work Number 1 to Goods Agreement between IBM and Brocade (incorporated by reference to Exhibit 10.6 from Brocade’s quarterly report on Form 10-Q for the fiscal quarter ended January 26, 2008) | |
10.34* | 1999 Director Plan as amended and restated April 10, 2008, and related forms of agreements, as amended (incorporated by reference to Exhibit 10.1 from Brocade’s quarterly report on Form 10-Q for the fiscal quarter ended April 26, 2008) | |
10.35* | 1999 Stock Plan as amended and restated November 27, 2006, and related forms of agreements, as amended (incorporated by reference to Exhibit 10.2 from Brocade’s quarterly report on Form 10-Q for the fiscal quarter ended April 26, 2008) | |
10.36† | OEM Purchase and License Agreement, dated May 20, 2008, between EMC Corporation and Brocade (incorporated by reference to Exhibit 10.1 from Brocade’s quarterly report on Form 10-Q for the fiscal quarter ended July 26, 2008) | |
10.37† | Amendment Number 11, dated April 28, 2008, to OEM Purchase Agreement between Hewlett-Packard Company and Brocade (incorporated by reference to Exhibit 10.2 from Brocade’s quarterly report on Form 10-Q for the fiscal quarter ended July 26, 2008) | |
10.38† | Amendment Number 34, dated June 23, 2008, to Statement of Work Number 1 to Goods Agreement between IBM and Brocade (incorporated by reference to Exhibit 10.122 from Brocade’s annual report on Form 10-K for the fiscal year ended October 25, 2008) | |
10.39† | Amendment Number 12, dated August 21, 2008, to Statement of Work Number 3 to Goods Agreement between IBM and Brocade (incorporated by reference to Exhibit 10.124 from Brocade’s annual report on Form 10-K for the fiscal year ended October 25, 2008) | |
10.40† | Amendment Number 1, dated July 10, 2008, to Statement of Work Number 7 to Goods Agreement between IBM and Brocade (incorporated by reference to Exhibit 10.125 from Brocade’s annual report on Form 10-K for the fiscal year ended October 25, 2008) | |
10.41† | Amendment Number 1, dated January 9, 2009, to OEM Purchase and License Agreement between EMC Corporation and Brocade (incorporated by reference to Exhibit 10.2 from Brocade’s quarterly report on Form 10-Q for the fiscal quarter ended January 24, 2009) | |
10.42† | Amendment Number 2, dated October 29, 2008, to Statement of Work Number 7 of the Goods Agreement between IBM and Brocade (incorporated by reference to Exhibit 10.4 from Brocade’s quarterly report on Form 10-Q for the fiscal quarter ended January 24, 2009) | |
10.43† | Amendment Number 12, dated March 11, 2009, with an effective date of February 28, 2008, to OEM Purchase Agreement between Hewlett-Packard Company and Brocade (incorporated by reference to Exhibit 10.1 from Brocade’s quarterly report on Form 10-Q for the fiscal quarter ended May 2, 2009) | |
10.44† | Amendment Number 13, dated March 14, 2009, with an effective date of March 6, 2009, to OEM Purchase Agreement between Hewlett-Packard Company and Brocade (incorporated by reference to Exhibit 10.2 from Brocade’s quarterly report on Form 10-Q for the fiscal quarter ended May 2, 2009) | |
10.45† | Amendment Number 14, dated March 14, 2009, with an effective date as of October 24, 2008, to OEM Purchase Agreement between Hewlett-Packard Company and Brocade (incorporated by reference to Exhibit 10.3 from Brocade’s quarterly report on Form 10-Q for the fiscal quarter ended May 2, 2009) | |
10.46† | Statement of Work Number 8, dated April 1, 2009, to Goods Agreement between International Business Machines and Brocade (incorporated by reference to Exhibit 10.4 from Brocade’s quarterly report on Form 10-Q for the fiscal quarter ended May 2, 2009) | |
10.47* | 2009 Stock Plan as amended and restated April 12, 2012, and related forms of agreements, as amended (incorporated by reference to Exhibit 10.2 from Brocade’s quarterly report on Form 10-Q for the fiscal quarter ended April 28, 2012) | |
10.48* | 2009 Employee Stock Purchase Plan, as amended and restated April 12, 2012 (incorporated by reference to Exhibit 10.1 from Brocade’s quarterly report on Form 10-Q for the fiscal quarter ended April 28, 2012) | |
10.49† | Amendment Number 15, dated May 11, 2009, with an effective date of February 1, 2009, to the Product Purchase Agreement between Hewlett-Packard Company and Brocade (incorporated by reference to Exhibit 10.1 from Brocade’s quarterly report on Form 10-Q for the quarterly period ended August 1, 2009) | |
110
Exhibit Number | Description of Document Number | |
10.50† | Amendment Number 37, dated June 22, 2009, with an effective date of June 19, 2008 [sic], to Statement of Work Number 1 of the Goods Agreement between IBM and Brocade (incorporated by reference to Exhibit 10.2 from Brocade’s quarterly report on Form 10-Q for the quarterly period ended August 1, 2009) | |
10.51† | Amendment Number 14, dated June 10, 2009, to Statement of Work Number 3 of the Goods Agreement between IBM and Brocade (incorporated by reference to Exhibit 10.3 from Brocade’s quarterly report on Form 10-Q for the quarterly period ended August 1, 2009) | |
10.52† | Amendment Number 15, dated June 23, 2009, to Statement of Work Number 3 of the Goods Agreement between IBM and Brocade (incorporated by reference to Exhibit 10.4 from Brocade’s quarterly report on Form 10-Q for the quarterly period ended August 1, 2009) | |
10.53† | Amendment Number 3, dated June 8, 2009, with an effective date of June 5, 2009, to Statement of Work Number 7 of the Goods Agreement between IBM and Brocade (incorporated by reference to Exhibit 10.5 from Brocade’s quarterly report on Form 10-Q for the quarterly period ended August 1, 2009) | |
10.54 | Amendment Number 5, dated August 3, 2009, to the Goods Agreement between IBM and Brocade (incorporated by reference to Exhibit 10.148 from Brocade’s annual report on Form 10-K for the fiscal year ended October 31, 2009) | |
10.55† | Amendment Number 38, dated September 19, 2009, to Statement of Work Number 1 of the Goods Agreement between IBM and Brocade (incorporated by reference to Exhibit 10.149 from Brocade’s annual report on Form 10-K for the fiscal year ended October 31, 2009) | |
10.56† | Amendment Number 16, dated September 10, 2009, with an effective date of September 18, 2009, to Statement of Work Number 3 of the Goods Agreement between IBM and Brocade (incorporated by reference to Exhibit 10.150 from Brocade’s annual report on Form 10-K for the fiscal year ended October 31, 2009) | |
10.57† | Amendment Number 17, dated October 30, 2009, with an effective date of October 28, 2009, to Statement of Work Number 3 of the Goods Agreement between IBM and Brocade (incorporated by reference to Exhibit 10.151 from Brocade’s annual report on Form 10-K for the fiscal year ended October 31, 2009) | |
10.58 | Amendment Number 4, dated September 22, 2009, to Statement of Work Number 7 of the Goods Agreement between IBM and Brocade (incorporated by reference to Exhibit 10.152 from Brocade’s annual report on Form 10-K for the fiscal year ended October 31, 2009) | |
10.59† | Amendment Number 5, dated September 15, 2009, to Statement of Work Number 7 of the Goods Agreement between IBM and Brocade (incorporated by reference to Exhibit 10.153 from Brocade’s annual report on Form 10-K for the fiscal year ended October 31, 2009) | |
10.60† | Amendment Number 1, dated October 3, 2009, to Statement of Work Number 8 of the Goods Agreement between IBM and Brocade (incorporated by reference to Exhibit 10.154 from Brocade’s annual report on Form 10-K for the fiscal year ended October 31, 2009) | |
10.61† | Amendment Number 2, dated October 13, 2009, to Statement of Work Number 8 of the Goods Agreement between IBM and Brocade (incorporated by reference to Exhibit 10.155 from Brocade’s annual report on Form 10-K for the fiscal year ended October 31, 2009) | |
10.62† | Amendment Number 3, dated October 1, 2009, to Statement of Work Number 8 of the Goods Agreement between International Business Machines and Brocade (incorporated by reference to Exhibit 10.156 from Brocade’s annual report on Form 10-K for the fiscal year ended October 31, 2009) | |
10.63* | Senior Leadership Plan (formerly Executive Leadership Plan), as amended as of December 2, 2010 (incorporated by reference to Exhibit 10.1 from Brocade’s quarterly report on Form 10-Q for the fiscal quarter ended January 29, 2011) | |
10.64* | Form of Restricted Stock Unit Agreement (Market Stock Units) under the 2009 Stock Plan (incorporated by reference to Exhibit 10.2 from Brocade’s current report on Form 8-K filed on December 9, 2009) | |
10.65† | Amendment Number 39, dated December 15, 2009, to Statement of Work Number 1 of the Goods Agreement between IBM and Brocade (incorporated by reference to Exhibit 10.3 from Brocade’s quarterly report on Form 10-Q for the fiscal quarter ended January 30, 2010) | |
10.66 | Real Estate Sale Agreement effective as of January 25, 2010, by and between Brocade Communications Systems Skyport LLC, a wholly owned subsidiary of Brocade, and CA-Skyport III Limited Partnership (incorporated by reference to Exhibit 10.10 from Brocade’s quarterly report on Form 10-Q for the fiscal quarter ended January 30, 2010) | |
111
Exhibit Number | Description of Document Number | |
10.67 | Lease Agreement dated as of January 28, 2010, by and between Brocade and CA-Skyport III Limited Partnership (incorporated by reference to Exhibit 10.11 from Brocade’s quarterly report on Form 10-Q for the fiscal quarter ended January 30, 2010) | |
10.68† | Amendment Number 2, dated February 2, 2010, to OEM Purchase and License Agreement between EMC Corporation and Brocade (incorporated by reference to Exhibit 10.12 from Brocade’s quarterly report on Form 10-Q for the fiscal quarter ended January 30, 2010) | |
10.69† | Amendment Number 3, dated April 13, 2010, to OEM Purchase and License Agreement between EMC Corporation and Brocade (incorporated by reference to Exhibit 10.2 from Brocade’s quarterly report on Form 10-Q for the fiscal quarter ended May 1, 2010) | |
10.70† | Amendment Number 16, dated March 24, 2010, with an effective date as of June 8, 2009, to the Product Purchase Agreement between Hewlett-Packard Company and Brocade (incorporated by reference to Exhibit 10.3 from Brocade’s quarterly report on Form 10-Q for the fiscal quarter ended May 1, 2010) | |
10.71† | Amendment Number 40, dated April 13, 2010, to Statement of Work Number 1 of the Goods Agreement between IBM and Brocade (incorporated by reference to Exhibit 10.4 from Brocade’s quarterly report on Form 10-Q for the fiscal quarter ended May 1, 2010) | |
10.72† | Amendment Number 3, dated April 19, 2010, with an effective date of January 1, 2010, to Statement of Work Number 6 of the Goods Agreement between IBM and Brocade (incorporated by reference to Exhibit 10.5 from Brocade’s quarterly report on Form 10-Q for the fiscal quarter ended May 1, 2010) | |
10.73† | Amendment Number 6, dated April 13, 2010, to Statement of Work Number 7 of the Goods Agreement between IBM and Brocade (incorporated by reference to Exhibit 10.6 from Brocade’s quarterly report on Form 10-Q for the fiscal quarter ended May 1, 2010) | |
10.74† | Amendment Number 17, dated May 21, 2010, to the Product Purchase Agreement between Hewlett-Packard Company and Brocade (incorporated by reference to Exhibit 10.1 from Brocade’s quarterly report on Form 10-Q for the fiscal quarter ended July 31, 2010) | |
10.75† | Amendment Number 4, dated May 18, 2010, to Statement of Work Number 8 of the Goods Agreement between IBM and Brocade (incorporated by reference to Exhibit 10.2 from Brocade’s quarterly report on Form 10-Q for the fiscal quarter ended July 31, 2010) | |
10.76† | Amendment Number 5, dated May 18, 2010, with an effective date of May 14, 2010, to Statement of Work Number 8 of the Goods Agreement between IBM and Brocade (incorporated by reference to Exhibit 10.3 from Brocade’s quarterly report on Form 10-Q for the fiscal quarter ended July 31, 2010) | |
10.77† | Amendment Number 19, dated August 4, 2010, to the Product Purchase Agreement between Hewlett-Packard Company and Brocade (incorporated by reference to Exhibit 10.131 from Brocade’s annual report on Form 10-K for the fiscal year ended October 30, 2010) | |
10.78 | Amendment Number 6, dated October 22, 2009, with an effective date of October 29, 2010, to the Goods Agreement between IBM and Brocade (incorporated by reference to Exhibit 10.132 from Brocade’s annual report on Form 10- K for the fiscal year ended October 30, 2010) | |
10.79† | Amendment Number 41, dated September 21, 2010, to Statement of Work Number 1 of the Goods Agreement between IBM and Brocade (incorporated by reference to Exhibit 10.133 from Brocade’s annual report on Form 10-K for the fiscal year ended October 30, 2010) | |
10.80† | Amendment Number 18, dated September 8, 2010, to Statement of Work Number 3 of the Goods Agreement between IBM and Brocade (incorporated by reference to Exhibit 10.134 from Brocade’s annual report on Form 10-K for the fiscal year ended October 30, 2010) | |
10.81 | Special Ethernet Bonus Program, as approved on December 2, 2010 (incorporated by reference to Exhibit 10.2 from Brocade’s quarterly report on Form 10-Q for the fiscal quarter ended January 29, 2011) | |
10.82 | Statement of Work Number 9, dated April 8, 2011, to Goods Agreement between IBM and Brocade (incorporated by reference to Exhibit 10.2 from Brocade’s quarterly report on Form 10-Q for the fiscal quarter ended April 30, 2011) | |
10.83 | French Sub-Plan under the 2009 Stock Plan and related forms of agreements (incorporated by reference to Exhibit 10.3 from Brocade’s quarterly report on Form 10-Q for the fiscal quarter ended April 30, 2011) | |
112
Exhibit Number | Description of Document Number | |
10.84 | Amendment Number 2, dated as of June 10, 2011, by and among Brocade, the lenders party thereto, and Bank of America, N.A., as administrative agent, swing line lender and letter of credit issuer, to the Credit Agreement, dated as of October 7, 2008 (as amended), by and among Brocade, the lenders party thereto, and Bank of America, N.A., as administrative agent, swing line lender and letter of credit issuer (incorporated by reference to Exhibit 10.1 from Brocade’s current report on Form 8-K filed on June 10, 2011) | |
10.85† | Amendment Number 42, dated June 30, 2011, to Statement of Work Number 1 of the Goods Agreement between IBM and Brocade (incorporated by reference to Exhibit 10.2 from Brocade’s quarterly report on Form 10-Q for the fiscal quarter ended July 30, 2011) | |
10.86† | Amendment Number 7, dated July 20, 2011, to Statement of Work Number 7 of the Goods Agreement between IBM and Brocade (incorporated by reference to Exhibit 10.3 from Brocade’s quarterly report on Form 10-Q for the fiscal quarter ended July 30, 2011) | |
10.87† | Amendment Number 43, dated September 23, 2011, to Statement of Work Number 1 of the Goods Agreement between IBM and Brocade (incorporated by reference to Exhibit 10.114 from Brocade’s annual report on Form 10-K for the fiscal year ended October 29, 2011) | |
10.88 | Amendment Number 19, dated October 12, 2011, with an effective date of October 24, 2011, to Statement of Work Number 3 of the Goods Agreement between IBM and Brocade (incorporated by reference to Exhibit 10.115 from Brocade’s annual report on Form 10-K for the fiscal year ended October 29, 2011) | |
10.89* | Senior Leadership Plan, as amended as of October 25, 2011 (incorporated by reference to Exhibit 10.116 from Brocade’s annual report on Form 10-K for the fiscal year ended October 29, 2011) | |
10.90* | Rev It Up Plan, approved as of October 25, 2011, and then clarified as of January 23, 2012 (incorporated by reference to Exhibit 10.3 from Brocade’s quarterly report on Form 10-Q for the fiscal quarter ended January 28, 2012) | |
10.91* | Sales Leader Plan, approved as of October 28, 2011, and then clarified as of December 21, 2011 (incorporated by reference to Exhibit 10.2 from Brocade’s quarterly report on Form 10-Q for the fiscal quarter ended January 28, 2012) | |
10.92* | Amended and Restated Change of Control Retention Agreement between Brocade and Michael Klayko effective as of December 22, 2008 (incorporated by reference to Exhibit 10.119 from Brocade’s annual report on Form 10-K for the fiscal year ended October 29, 2011) | |
10.93* | Form of Amended and Restated Change of Control Retention Agreement between Brocade and each of Tyler Wall and Ian Whiting, effective as of December 22, 2008 (incorporated by reference to Exhibit 10.120 from Brocade’s annual report on Form 10-K for the fiscal year ended October 29, 2011) | |
10.94* | Form of Change of Control Retention Agreement between Brocade and newly designated executive officers, including Daniel Fairfax, effective as of February 23, 2009 (incorporated by reference to Exhibit 10.121 from Brocade’s annual report on Form 10-K for the fiscal year ended October 29, 2011) | |
10.95* | Form of Restricted Stock Unit Agreement (2012 Market Stock Units) under the 2009 Stock Plan (incorporated by reference to Exhibit 10.1 from Brocade’s quarterly report on Form 10-Q for the fiscal quarter ended January 28, 2012) | |
10.96† | Amendment Number 20, dated February 21, 2012, with an effective date of February 29, 2012, to Statement of Work Number 3 of the Goods Agreement between IBM and Brocade (incorporated by reference to Exhibit 10.3 from Brocade’s quarterly report on Form 10-Q for the fiscal quarter ended April 28, 2012) | |
10.97† | Amendment Number 44, dated February 29, 2012, to Statement of Work Number 1 of the Goods Agreement between IBM and Brocade (incorporated by reference to Exhibit 10.4 from Brocade’s quarterly report on Form 10-Q for the fiscal quarter ended April 28, 2012) | |
10.98† | Amendment Number 45, dated May 18, 2012, to Statement of Work Number 1 of the Goods Agreement between IBM and Brocade (incorporated by reference to Exhibit 10.1 from Brocade’s quarterly report on Form 10-Q for the fiscal quarter ended July 28, 2012) | |
10.99* | Agreement and General Release of Claims by and between Brocade and Michael Klayko dated as of August 12, 2012 (incorporated by reference to Exhibit 10.2 from Brocade’s quarterly report on Form 10-Q for the fiscal quarter ended July 28, 2012) | |
113
Exhibit Number | Description of Document Number | |
10.100 | Amendment Number 4, dated October 11, 2012, to the OEM Purchase and License Agreement between EMC Corporation and Brocade (incorporated by reference to Exhibit 10.112 from Brocade’s annual report on Form 10-K for the fiscal year ended October 27, 2012) | |
10.101† | Amendment Number 21, dated October 18, 2012, with an effective date of October 22, 2012, to Statement of Work Number 3 of the Goods Agreement between IBM and Brocade (incorporated by reference to Exhibit 10.113 from Brocade’s annual report on Form 10-K for the fiscal year ended October 27, 2012) | |
10.102* | Offer Letter, dated December 20, 2012, between Brocade and Lloyd Carney (incorporated by reference to Exhibit 10.1 from Brocade’s Form 8-K filed on January 14, 2013) | |
10.103* | Change of Control Retention Agreement between Brocade and Lloyd Carney, effective as of January 14, 2013 (incorporated by reference to Exhibit 10.2 from Brocade’s Form 8-K filed on January 14, 2013) | |
10.104 | Purchase Agreement, dated January 16, 2013, among Brocade, Morgan Stanley & Co. LLC and J.P. Morgan Securities LLC, as representatives of the several Initial Purchasers listed in Schedule I thereto, and the Subsidiary Guarantors named therein (incorporated by reference to Exhibit 10.1 from Brocade’s Form 8-K filed on January 22, 2013) | |
10.105 | Registration Rights Agreement, dated as of January 22, 2013, by and among Brocade, the Subsidiary Guarantors listed on the signature pages thereto and the purchasers named therein (incorporated by reference to Exhibit 10.2 from Brocade’s Form 8-K filed on January 22, 2013) | |
10.106* | 2013 Inducement Award Plan (incorporated by reference to Exhibit 10.3 from Brocade’s Form 8-K filed on January 22, 2013) | |
10.107* | Form of Stock Option Agreement under the 2013 Inducement Award Plan (incorporated by reference to Exhibit 10.4 from Brocade’s Form 8-K filed on January 22, 2013) | |
10.108* | Form of Restricted Stock Unit Agreement under the 2013 Inducement Award Plan (incorporated by reference to Exhibit 10.5 from Brocade’s Form 8-K filed on January 22, 2013) | |
10.109* | Form of Amendment to Change of Control Agreement between Brocade and Brocade’s executive officers (incorporated by reference to Exhibit 10.1 from Brocade’s current report on Form 8-K filed on February 21, 2013) | |
10.110* | 2009 Director Plan, as amended and restated on April 11, 2013 (incorporated by reference to Exhibit 10.2 from Brocade’s quarterly report on Form 10-Q for the fiscal quarter ended April 27, 2013) | |
10.111* | Performance Bonus Plan, as approved on April 11, 2013 (incorporated by reference to Exhibit 10.3 from Brocade’s quarterly report on Form 10-Q for the fiscal quarter ended April 27, 2013) | |
10.112† | Amendment Number 5, dated February 13, 2013, to the OEM Purchase and License Agreement between EMC Corporation and Brocade (incorporated by reference to Exhibit 10.4 from Brocade’s quarterly report on Form 10-Q for the fiscal quarter ended April 27, 2013) | |
10.113† | Amendment Number 46, dated March 8, 2013, to Statement of Work Number 1 of the Goods Agreement between IBM and Brocade (incorporated by reference to Exhibit 10.5 from Brocade’s quarterly report on Form 10-Q for the fiscal quarter ended April 27, 2013) | |
10.114† | Amendment Number 22, dated March 14, 2013, with an effective date of March 20, 2013, to Statement of Work Number 3 of the Goods Agreement between IBM and Brocade (incorporated by reference to Exhibit 10.6 from Brocade’s quarterly report on Form 10-Q for the fiscal quarter ended April 27, 2013) | |
10.115† | Amendment Number 8, dated April 11, 2013, to Statement of Work Number 7 of the Goods Agreement between IBM and Brocade (incorporated by reference to Exhibit 10.7 from Brocade’s quarterly report on Form 10-Q for the fiscal quarter ended April 27, 2013) | |
10.116* | Senior Leadership Plan for fiscal year 2013, as approved on July 26, 2013 (incorporated by reference to Exhibit 10.1 from Brocade’s quarterly report on Form 10-Q for the fiscal quarter ended July 27, 2013) | |
10.117 | Amendment Number 6, dated June 19, 2013, with an effective date of May 22, 2013, to the OEM Purchase and License Agreement between EMC Corporation and Brocade (incorporated by reference to Exhibit 10.2 from Brocade’s quarterly report on Form 10-Q for the fiscal quarter ended July 27, 2013) | |
10.118* | Amended and Restated Change of Control Retention Agreement for Lloyd Carney between Brocade and Lloyd Carney, Brocade’s Chief Executive Officer (incorporated by reference to Exhibit 10.1 from Brocade’s Form 8-K filed on October 25, 2013) | |
114
Exhibit Number | Description of Document Number | |
10.119* | Form of Change of Control Retention Agreement between Brocade and Brocade’s executive officers other than the Chief Executive Officer (entered into with each of Ken Cheng, Dan Fairfax, Jeff Lindholm and Tyler Wall) (incorporated by reference to Exhibit 10.2 from Brocade’s Form 8-K filed on October 25, 2013) | |
10.120 | Amendment Number 3, dated as of January 8, 2013, by and among Brocade, the lenders party thereto, and Bank of America, N.A., as administrative agent, swing line lender and letter of credit issuer, to the Credit Agreement, dated as of October 7, 2008 (as amended), by and among Brocade, the lenders party thereto, and Bank of America, N.A., as administrative agent, swing line lender and letter of credit issuer (incorporated by reference to Exhibit 10.132 from Brocade’s annual report on Form 10-K filed on December 16, 2013) | |
10.121 | Amendment Number 4, dated as of October 7, 2013, by and among Brocade, the lenders party thereto, and Bank of America, N.A., as administrative agent, swing line lender and letter of credit issuer, to the Credit Agreement, dated as of October 7, 2008 (as amended), by and among Brocade, the lenders party thereto, and Bank of America, N.A., as administrative agent, swing line lender and letter of credit issuer (incorporated by reference to Exhibit 10.133 from Brocade’s annual report on Form 10-K filed on December 16, 2013) | |
10.122 | Amendment Number 1, dated October 29, 2013, to Statement of Work Number 9 of the Goods Agreement between IBM and Brocade (incorporated by reference to Exhibit 10.134 from Brocade’s annual report on Form 10-K filed on December 16, 2013) | |
10.123† | Amendment Number 23, dated September 30, 2013, with an effective date of October 10, 2013, to Statement of Work Number 3 of the Goods Agreement between IBM and Brocade (incorporated by reference to Exhibit 10.135 from Brocade’s annual report on Form 10-K filed on December 16, 2013) | |
10.124† | Amendment Number 47 dated October 9, 2013, to Statement of Work Number 1 of the Goods Agreement between IBM and Brocade (incorporated by reference to Exhibit 10.136 from Brocade’s annual report on Form 10-K filed on December 16, 2013) | |
10.125† | Amendment Number 9 dated October 16, 2013, to Statement of Work Number 7 of the Goods Agreement between IBM and Brocade (incorporated by reference to Exhibit 10.137 from Brocade’s annual report on Form 10-K filed on December 16, 2013) | |
10.126* | Form of Indemnification Agreement to be entered into between Brocade and each of its directors and executive officers (incorporated by reference to Exhibit 10.1 from Brocade’s quarterly report on Form 10-Q for the fiscal quarter ended May 3, 2014) | |
10.127† | Amendment Number 24 dated April 17, 2014, with an effective date of April 23, 2014, to Statement of Work Number 3 of the Goods Agreement between IBM and Brocade (incorporated by reference to Exhibit 10.2 from Brocade’s quarterly report on Form 10-Q for the fiscal quarter ended May 3, 2014) | |
10.128† | Amendment Number 48 dated August 15, 2014, to Statement of Work Number 1 of the Goods Agreement between IBM and Brocade (incorporated by reference to Exhibit 10.139 from Brocade’s annual report on Form 10-K for the fiscal year ended November 1, 2014) | |
10.129† | Amendment Number 10, dated September 5, 2014, to Statement of Work Number 7 of the Goods Agreement between IBM and Brocade (incorporated by reference to Exhibit 10.140 from Brocade’s annual report on Form 10-K for the fiscal year ended November 1, 2014) | |
10.130† | Amendment Number 7, dated October 31, 2014, to the OEM Purchase and License Agreement between EMC Corporation and Brocade (incorporated by reference to Exhibit 10.141 from Brocade’s annual report on Form 10-K for the fiscal year ended November 1, 2014) | |
10.131* | Form of Restricted Stock Unit Agreement for Performance Stock Units under the 2009 Stock Plan (incorporated by reference to Exhibit 10.1 from Brocade’s current report on Form 10-Q filed on March 6, 2015) | |
10.132* | 2009 Stock Plan as amended and restated January 26, 2015 (incorporated by reference to Exhibit 10.1 from Brocade’s current report on Form 8-K filed on January 30, 2015) | |
10.133 | Form of Convertible Note Hedge Transaction Confirmation (incorporated by reference to Exhibit 99.1 from Brocade’s current report on Form 8-K filed on January 14, 2015) | |
10.134 | Form of Warrant Transaction Confirmation (incorporated by reference to Exhibit 99.2 from Brocade’s current report on Form 8-K filed on January 14, 2015) | |
10.135* | 2009 Stock Plan, as amended and restated on April 7, 2015 (incorporated by reference to Exhibit 10.2 from Brocade’s current report on Form 8-K filed on April 8, 2015) | |
115
Exhibit Number | Description of Document Number | |
10.136* | 2009 Director Plan, as amended and restated on April 7, 2015 (incorporated by reference to Exhibit 10.4 from Brocade’s current report on Form 8-K filed on April 8, 2015) | |
10.137† | Amendment Number 20, dated February 12, 2015, to the OEM Purchase Agreement between Hewlett-Packard Company and Brocade (incorporated by reference to Exhibit 10.3 from Brocade’s current report on Form 10-Q filed on June 5, 2015) | |
10.138† | Amendment Number 49, dated June 5, 2015, to Statement of Work Number 1 of the Goods Agreement between IBM and Brocade (incorporated by reference to Exhibit 10.1 from Brocade’s current report on Form 10-Q filed on September 4, 2015) | |
10.139† | Amendment Number 11, dated June 10, 2015, to Statement of Work Number 7 of the Goods Agreement between IBM and Brocade (incorporated by reference to Exhibit 10.2 from Brocade’s current report on Form 10-Q filed on September 4, 2015) | |
10.140* | Form of 2009 Director Plan Restricted Stock Unit Agreement (incorporated by reference to Exhibit 10.3 from Brocade’s current report on Form 10-Q filed on September 4, 2015) | |
10.141* | 2009 Stock Plan, as amended and restated on September 24, 2015 (incorporated by reference to Exhibit 10.1 from Brocade’s current report on Form 8-K filed on September 30, 2015) | |
10.142* | Form of 2009 Stock Plan Global Restricted Stock Unit Agreement | |
10.143 | Amendment Number 21, dated October 16, 2015, to the OEM Purchase Agreement between Hewlett-Packard Company and Brocade | |
12.1 | Statement of Computation of Ratio of Earnings to Fixed Charges | |
21.1 | Subsidiaries of the Registrant | |
23.1 | Consent of Independent Registered Public Accounting Firm | |
24.1 | Power of attorney (see signatures page) | |
31.1 | Rule 13a-14(a)/15d-14(a) Certification of Principal Executive Officer | |
31.2 | Rule 13a-14(a)/15d-14(a) Certification of Principal Financial Officer | |
32.1 | Certification of Principal Executive Officer and Principal Financial Officer pursuant to 18 U.S.C. Section 1350, as adopted pursuant to Section 906 of the Sarbanes-Oxley Act of 2002 | |
101.INS | XBRL Instance Document | |
101.SCH | XBRL Taxonomy Extension Schema Document | |
101.CAL | XBRL Taxonomy Extension Calculation Linkbase Document | |
101.DEF | XBRL Taxonomy Extension Definition Linkbase Document | |
101.LAB | XBRL Taxonomy Extension Label Linkbase Document | |
101.PRE | XBRL Taxonomy Extension Presentation Linkbase Document | |
* | Indicates management compensatory plan, contract, or arrangement required to be filed as an exhibit pursuant to Item 15(b) of Form 10-K. | |
# | Unless otherwise indicated, SEC file number for each document incorporated by reference is 000-25601. | |
† | Confidential treatment granted as to certain portions, which portions were omitted and filed separately with the Securities and Exchange Commission. | |
b. | Exhibits |
See Exhibit Index included in Item 15(a) of this Form 10-K.
c. | Financial Statement Schedules |
116
SCHEDULE II
VALUATION AND QUALIFYING ACCOUNTS
Fiscal Years Ended October 31, 2015, November 1, 2014, and October 26, 2013
Balance at Beginning of Period | Additions (Recoveries) Charged to Revenues | Deductions (1) | Balance at End of Period | ||||||||||||
(In thousands) | |||||||||||||||
Allowance for doubtful accounts: | |||||||||||||||
2015 | $ | 80 | $ | 1,786 | $ | (28 | ) | $ | 1,838 | ||||||
2014 | $ | 575 | $ | (85 | ) | $ | (410 | ) | $ | 80 | |||||
2013 | $ | 833 | $ | 319 | $ | (577 | ) | $ | 575 | ||||||
Sales allowances: | |||||||||||||||
2015 | $ | 7,396 | $ | 9,466 | $ | (7,207 | ) | $ | 9,655 | ||||||
2014 | $ | 7,321 | $ | 7,563 | $ | (7,488 | ) | $ | 7,396 | ||||||
2013 | $ | 9,759 | $ | 8,885 | $ | (11,323 | ) | $ | 7,321 | ||||||
(1) | Deductions related to the allowance for doubtful accounts and sales allowances represent amounts written off against the allowance and recoveries. |
117
SIGNATURES
Pursuant to the requirements of Section 13 or 15(d) of the Securities Exchange Act of 1934, the registrant has duly caused this report to be signed on its behalf by the undersigned, thereunto duly authorized.
Brocade Communications Systems, Inc. | ||||
December 22, 2015 | By: | /S/ LLOYD A. CARNEY | ||
Lloyd A. Carney | ||||
Chief Executive Officer | ||||
POWER OF ATTORNEY
KNOW ALL PERSONS BY THESE PRESENTS, that each person whose signature appears below constitutes and appoints Lloyd A. Carney and Daniel W. Fairfax, and each of them, his and her true and lawful attorneys-in-fact, each with full power of substitution, for him and her in any and all capacities, to sign any amendments to this report on Form 10-K and to file the same, with exhibits thereto and other documents in connection therewith, with the Securities and Exchange Commission, hereby ratifying and confirming all that each of said attorneys-in-fact, or their substitute or substitutes, may do or cause to be done by virtue hereof.
Pursuant to the requirements of the Securities Exchange Act of 1934, this report has been signed below by the following persons on behalf of the registrant and in the capacities and on the dates indicated.
Signature | Title | Date | ||
/S/ LLOYD A. CARNEY | Director and Chief Executive Officer (Principal Executive Officer) | December 22, 2015 | ||
Lloyd A. Carney | ||||
/S/ DANIEL W. FAIRFAX | Senior Vice President and Chief Financial Officer (Principal Financial and Accounting Officer) | December 22, 2015 | ||
Daniel W. Fairfax | ||||
/S/ DAVID L. HOUSE | Chairman of the Board of Directors | December 15, 2015 | ||
David L. House | ||||
/S/ JUDY BRUNER | Director | December 15, 2015 | ||
Judy Bruner | ||||
/S/ RENATO A. DIPENTIMA | Director | December 15, 2015 | ||
Renato A. DiPentima | ||||
/S/ ALAN L. EARHART | Director | December 15, 2015 | ||
Alan L. Earhart | ||||
/S/ JOHN W. GERDELMAN | Director | December 15, 2015 | ||
John W. Gerdelman | ||||
/S/ L. WILLIAM KRAUSE | Director | December 15, 2015 | ||
L. William Krause | ||||
/S/ DAVID E. ROBERSON | Director | December 15, 2015 | ||
David E. Roberson | ||||
/S/ SANJAY VASWANI | Director | December 15, 2015 | ||
Sanjay Vaswani | ||||
118