Attached files
| file | filename |
|---|---|
| 8-K - 8-K - BOISE CASCADE Co | a8-k120915.htm |

0 Boise Cascade Company Investor Presentation July 2013 Investor Presentation December 2015

1 Forward-Looking Statements / Non-GAAP Financial Measures Forward-Looking Statements During the course of this presentation, we may make forward-looking statements or provide forward- looking information. All statements that address expectations or projections about the future are forward-looking statements. Some of these statements include words such as “expects,” “anticipates,” “believes,” “estimates,” “plans,” “intends,” “projects,” and “indicates.” Although they reflect our current expectations, these statements are not guarantees of future performance, but involve a number of risks, uncertainties, and assumptions which are difficult to predict. Some of the factors that may cause actual outcomes and results to differ materially from those expressed in, or implied by, the forward- looking statements include, but are not necessarily limited to, general economic conditions, competitive pressures, the commodity nature of the Company’s products and their price movements, raw material costs and availability, and the ability to retain key employees. The Company does not undertake to update any forward-looking statements as a result of future developments or new information. Non-GAAP Financial Measures Included in this presentation are certain non-GAAP financial measures, including EBITDA and Adjusted EBITDA, designed to complement the financial information presented in accordance with generally accepted accounting principles in the United States of America because management believes such measures are useful to investors. Our non-GAAP financial measures are not necessarily comparable to other similarly titled captions of other companies due to potential inconsistencies in the metrics of calculation. For a reconciliation of net income (loss) to EBITDA and Adjusted EBITDA and segment income (loss) to segment EBITDA and Adjusted Segment EBITDA, see the Appendix to this presentation.

2 LTM Sept-2015 Sales (1) $3,619 million (1) Segment percentages are calculated before intersegment eliminations. (2) Segment percentages exclude Corporate and Other segment expenses. • Large, vertically-integrated building products company operating two businesses: • Wood Products (Manufacturing) • Building Materials Distribution (BMD) • Leading market positions across portfolio • Broad base of more than 4,500 customers • Focused on new home construction, residential repair and remodel, light commercial construction, and industrial markets • Significant available capacity in Engineered Wood Products (EWP) and BMD to capitalize on housing recovery 70% LTM Sept-2015 EBITDA (2) $178.4 million Wood Products Wood Products Building Materials Distribution Building Materials Distribution Overview
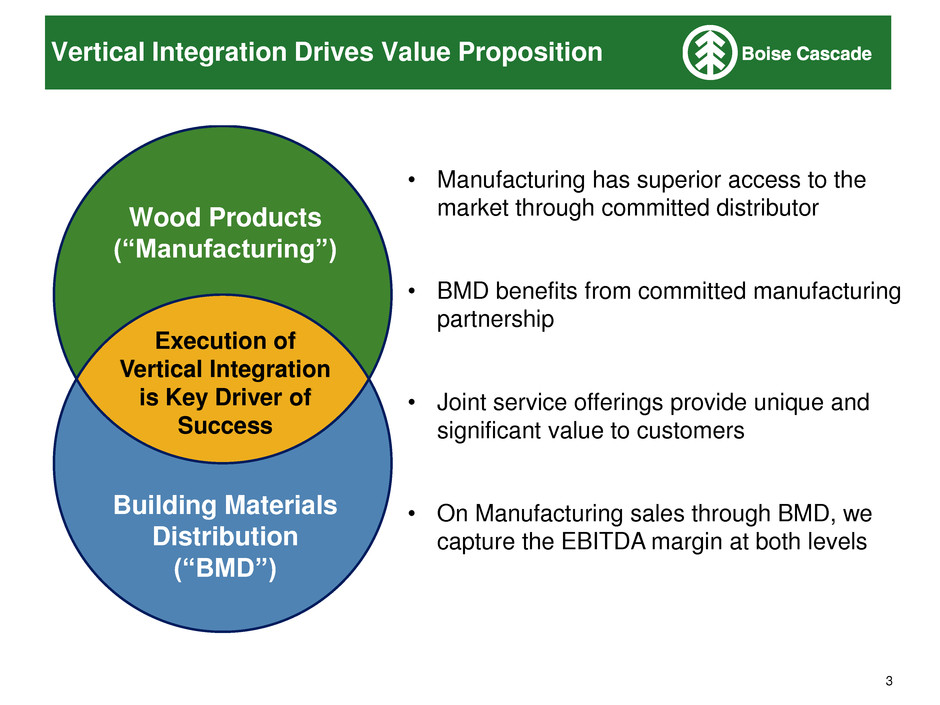
3 Vertical Integration Drives Value Proposition • Manufacturing has superior access to the market through committed distributor • BMD benefits from committed manufacturing partnership • Joint service offerings provide unique and significant value to customers • On Manufacturing sales through BMD, we capture the EBITDA margin at both levels Building Materials Distribution (“BMD”) Execution of Vertical Integration is Key Driver of Success Wood Products (“Manufacturing”)

4 Headquarters EWP Manufacturing Facilities (4) Plywood/Veneer Manufacturing Facilities (9) Lumber Manufacturing Facilities (5) Particleboard Manufacturing Facility (1) BMD Facilities (32) Truss Manufacturing Plant (1) • National distribution footprint capable of servicing larger metro areas • Manufacturing presence in major softwood producing regions Overview ID FL NM DE MD TX OK KS NE SD ND MT WY CO UT AZ NV WA CA OR KY ME NY VT NH MA RI CT WV IN IL NC TN SC AL MS AR LA MO IA MN WI NJ GA DC VA MI OH PA

5 Wood Products Manufacturing Value Chain Veneer Purchased Logs Plywood I-joist Conversion Costs Conversion Costs Conversion Costs Purchased Veneer / Lumber / OSB Purchased Plywood Maximize total return on raw materials purchased LVL
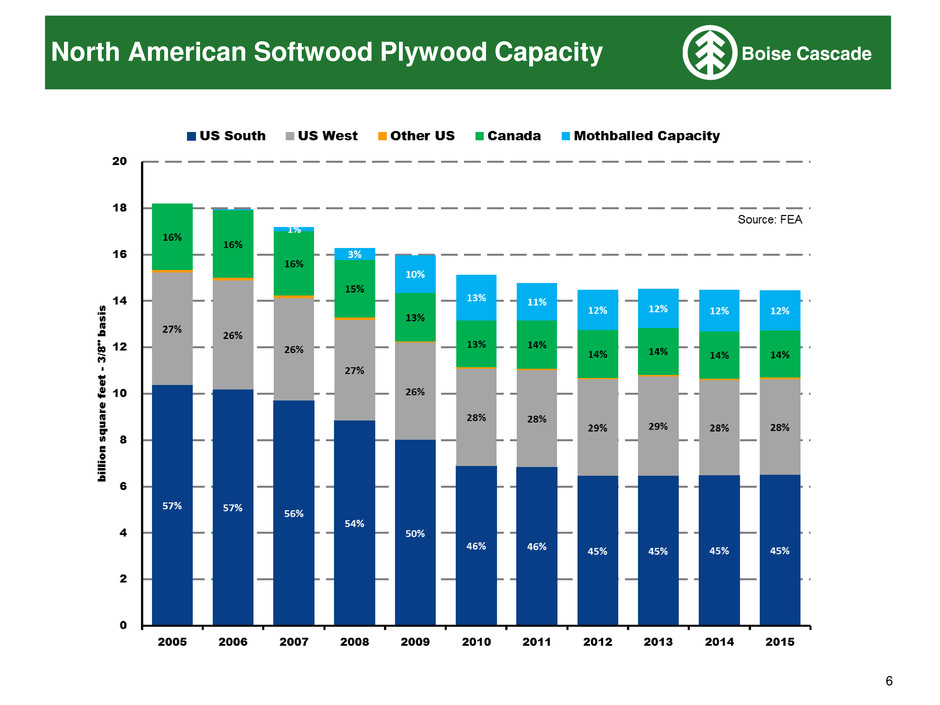
6 North American Softwood Plywood Capacity
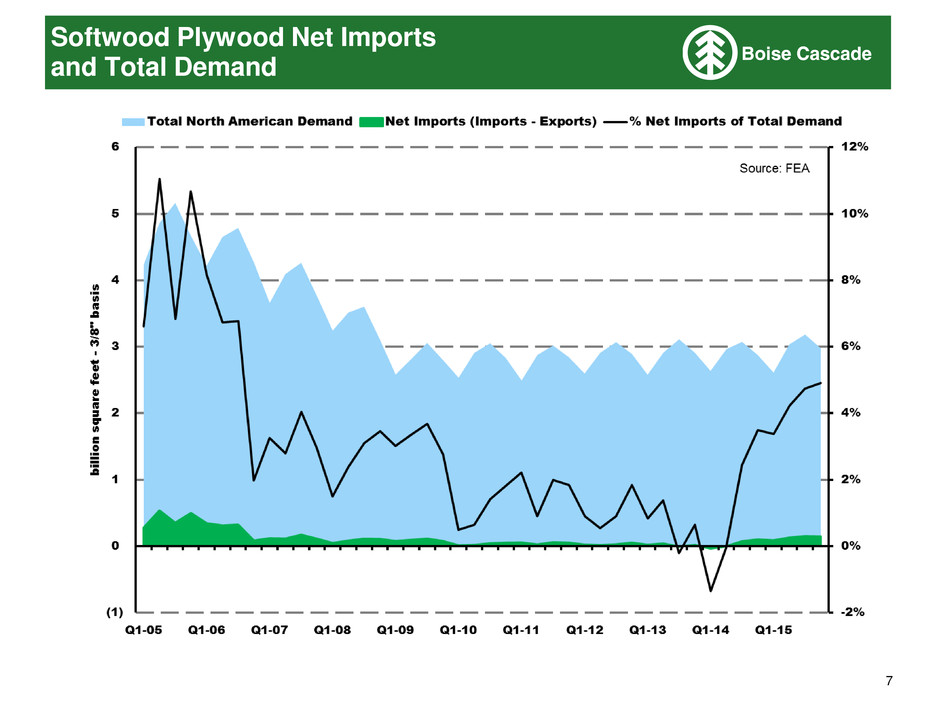
7 Softwood Plywood Net Imports and Total Demand

8 Quarterly BCC Wood Products Realization vs Random Lengths Composite Indexes

9 Total Structural Panel Usage for North America
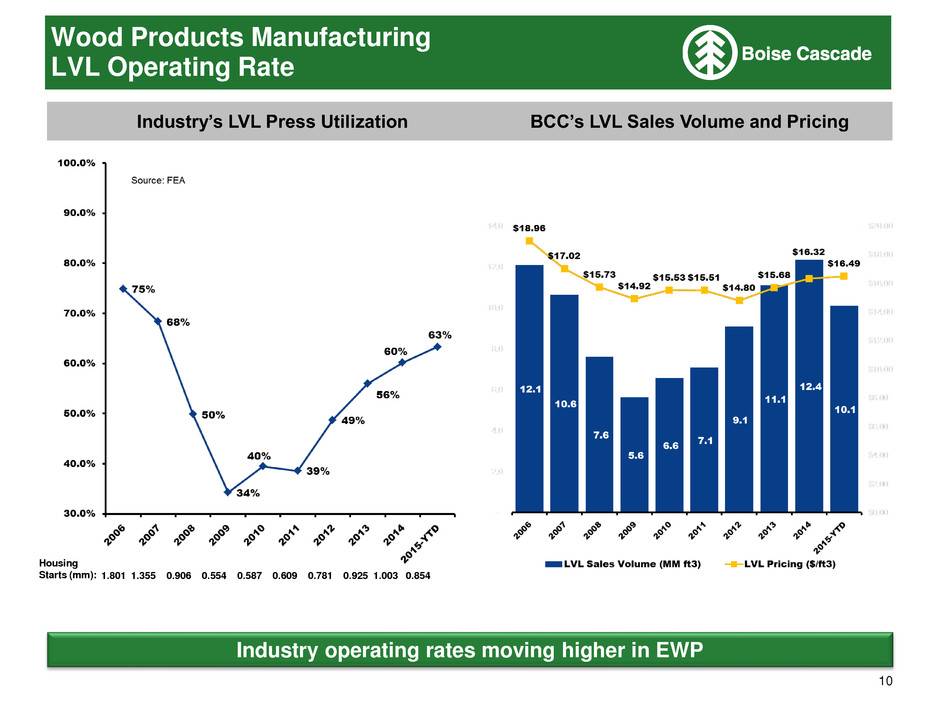
10 Housing Starts (mm): 1.801 1.355 0.906 0.554 0.587 0.609 0.781 0.925 1.003 0.854 Wood Products Manufacturing LVL Operating Rate Industry’s LVL Press Utilization BCC’s LVL Sales Volume and Pricing Industry operating rates moving higher in EWP

11 Wood Products Manufacturing I-joists Operating Rate Industry’s I-joists Utilization BCC’s I-joists Sales Volume and Pricing Industry operating rates moving higher in EWP Housing Starts (mm): 1.801 1.355 0.906 0.554 0.587 0.609 0.781 0.925 1.003 0.854
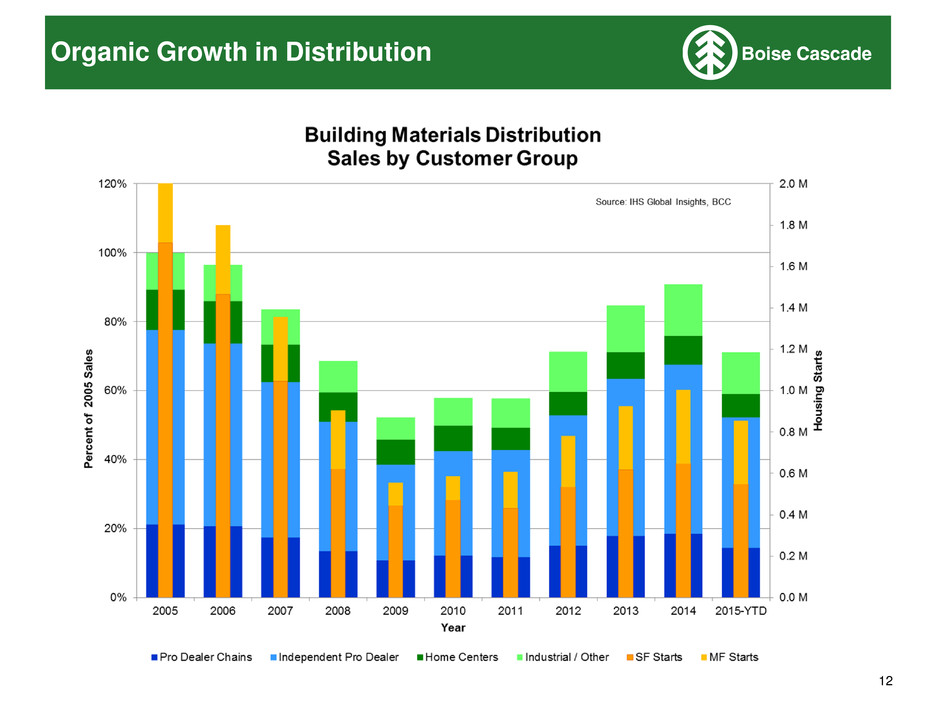
12 Organic Growth in Distribution

13 Leveraging “In-house” Distribution
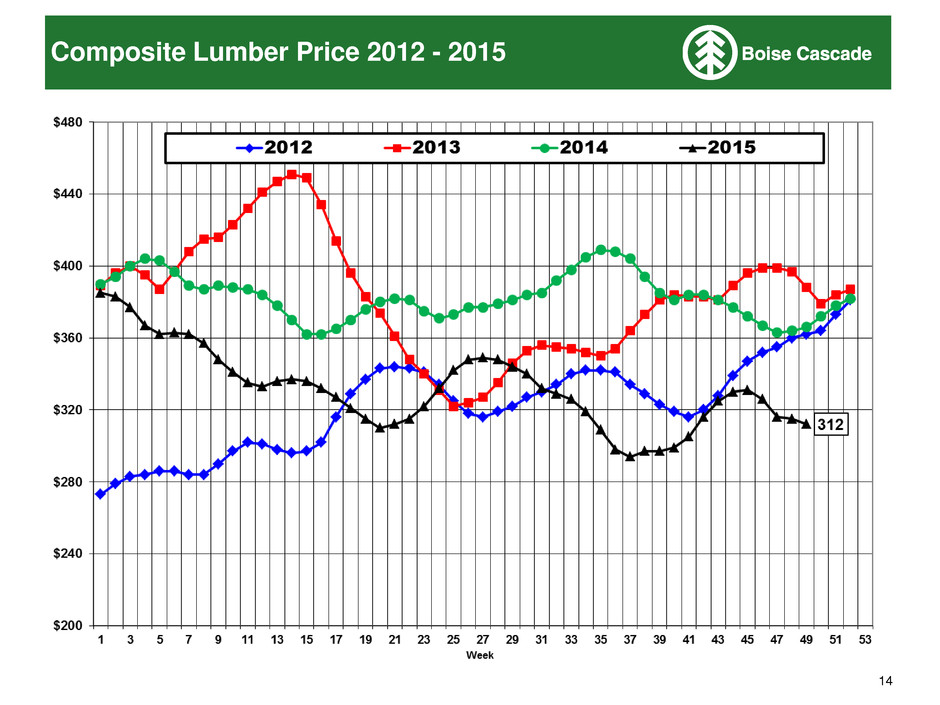
14 Composite Lumber Price 2012 - 2015
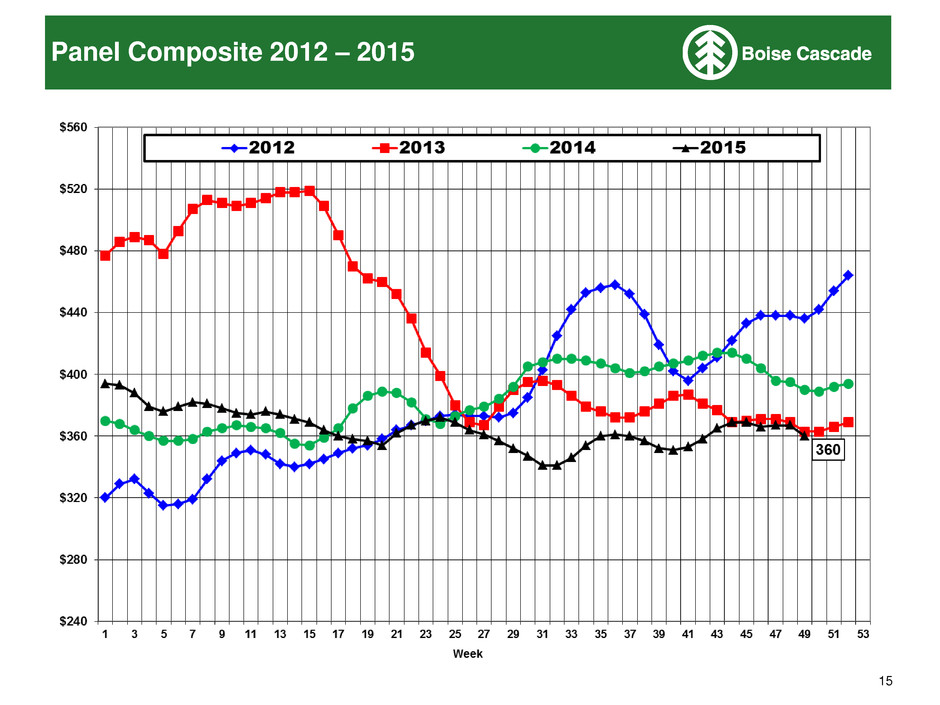
15 Panel Composite 2012 – 2015
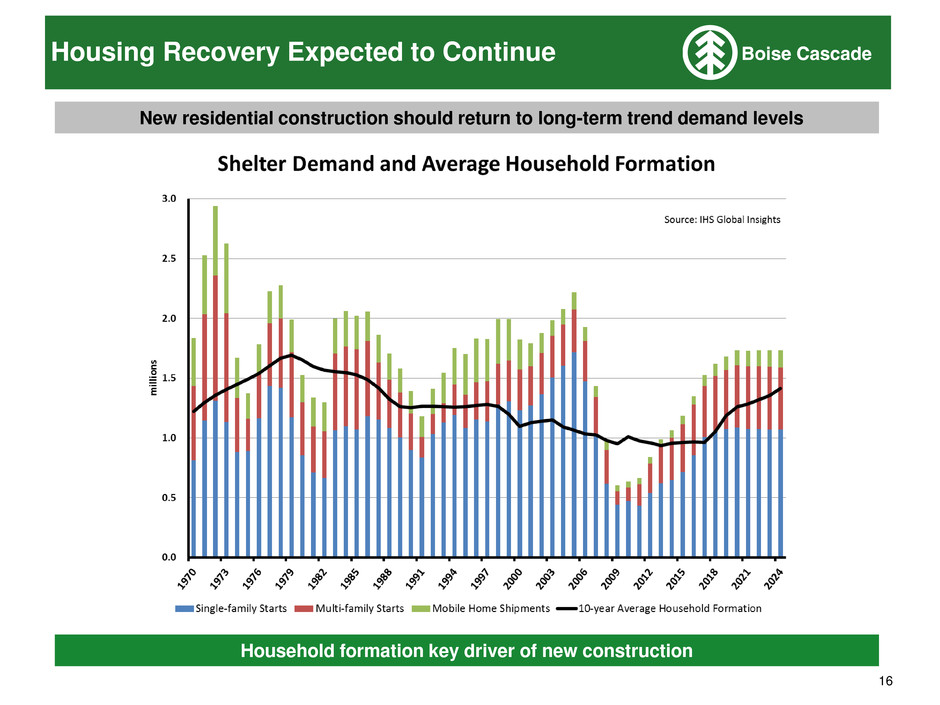
16 Household formation key driver of new construction New residential construction should return to long-term trend demand levels Housing Recovery Expected to Continue

17 Bulk of demand improvement will be from new residential construction New residential construction should return to long-term trend demand levels Housing Recovery Expected to Continue EWP and BMD growth driven primarily by increases in new single-family construction • EWP currently operating near 70% of capacity • With existing warehouse and yard space, BMD’s revenue capacity is $3.5-$4.0 billion Expect plywood to perform well • Mills currently operating at high utilization rates • Demand driven by repair and remodel, industrial uses, as well as new residential and commercial construction

18 Balance sheet supports planned growth initiatives Balance Sheet Metrics Sep-30-2015 Dec-31-2014 ($millions) Net Debt Long-term debt 351.3$ 301.4$ Cash & cash equivalents (212.8) (163.5) Net Debt 138.5$ 137.9$ Liquidity Postion ABL excess availability 292.7$ 266.8$ Cash & cash equivalents 212.8 163.5 Total liquidity 505.5$ 430.3$ LTM EBITDA 178.4$ 196.6$ Total Debt to EBITDA 2.0x 1.5x Net Debt to EBITDA .8x .7x

19 Capital Allocation Priorities ■ Accelerate organic growth New dryer at South Carolina plywood operation (completed late 2Q-2015) N.E. Oregon log utilization center upgrade (completed late 3Q-2015) Modernization project at Florien, LA plywood operations (estimated completion 2H-2016) ■ Pursue acquisitions ■ Repurchase shares with free cash flow Authorization for up to 2 million shares announced March 2015 722,911 shares repurchased through 9/4/15 at $32.80 per share

Appendix

21 Historical Financial Performance YTD Dollars in millions 2010 2011 2012 2013 2014 Q3-2015 Segment income (loss) ($8.1) ($15.1) $55.8 $77.7 $108.4 $66.5 Depreciation and amortization 27.1 28.4 24.4 28.7 41.5 32.2 Segment EBITDA $19.0 $13.3 $80.2 $106.3 $149.8 $98.7 Litigation gain (0.5) - - - - - Adjusted EBITDA $18.5 $13.3 $80.2 $106.3 $149.8 $98.7 YTD Dollars in millions 2010 2011 2012 2013 2014 Q3-2015 Segment income $11.6 $2.0 $24.0 $39.9 $56.7 $45.6 Depreciation and amortization 7.5 8.4 8.8 9.2 9.8 8.7 Segment EBITDA $19.1 $10.4 $32.9 $49.2 $66.5 $54.3 Litigation gain (4.1) - - - - - Adjusted EBITDA $15.0 $10.4 $32.9 $49.2 $66.5 $54.3 Year Ended December 31, Year Ended December 31, Wood Products Building Materials Distribution

22 EBITDA represents income (loss) before interest (interest expense and interest income), income taxes, and depreciation and amortization. Adjusted EBITDA represents EBITDA as further adjusted to exclude certain special items. The following table reconciles net income (loss) to EBITDA and Adjusted EBITDA. Total Company EBITDA Reconciliation YTD 2010 2011 2012 2013 2014 Q3-2015 Dollars in millions Net income (loss) ($33.3) ($46.4) $41.5 $116.9 $80.0 $49.9 Interest expense 21.0 19.0 21.8 20.4 22.0 16.8 Interest income (0.8) (0.4) (0.4) (0.2) (0.2) (0.2) Income tax provision (benefit) 0.3 0.2 0.3 (38.8) 43.3 28.8 Depreciation and amortization 34.9 37.0 33.4 38.0 51.4 41.1 EBITDA $22.1 $9.5 $96.6 $136.4 $196.6 $136.4 Litigation Gain (4.6) - - - - - Adjusted EBITDA $17.5 $9.5 $96.6 $136.4 $196.6 $136.4 Wood Products $687.4 $712.5 $943.3 $1,134.1 $1,317.0 $989.8 Building Materials Distribution $1,778.0 $1,779.4 $2,190.2 $2,599.6 $2,786.7 $2,184.0 Elimi ations & Other ($224.8) ($243.7) ($354.4) ($460.2) ($529.9) ($416.9) Total Sales $2,240.6 $2,248.1 $2,779.1 $3,273.5 $3,573.7 $2,756.9 Wood Products $19.0 $13.3 $80.2 $106.3 $149.8 $98.7 Building Materials Distribution $19.1 $10.4 $32.9 $49.2 $66.5 $54.3 Corporate & Other ($16.0) ($14.2) ($16.5) ($19.1) ($19.8) ($16.6) EBITDA $22.1 $9.5 $96.6 $136.4 $196.6 $136.4 Year Ended December 31

23 Brazilian Real Exchange Rate
