Attached files
| file | filename |
|---|---|
| EX-32.2 - SECTION 906 CFO CERTIFICATION - BOISE CASCADE Co | bcc12312017ex322.htm |
| EX-32.1 - SECTION 906 CEO CERTIFICATION - BOISE CASCADE Co | bcc12312017ex321.htm |
| EX-31.2 - SECTION 302 CFO CERTIFICATION - BOISE CASCADE Co | bcc12312017ex312.htm |
| EX-31.1 - SECTION 302 CEO CERTIFICATION - BOISE CASCADE Co | bcc12312017ex311.htm |
| EX-23.1 - CONSENT OF INDEPENDENT REGISTERED PUBLIC ACCOUNTING FIRM - BOISE CASCADE Co | bcc12312017ex231.htm |
| EX-21.1 - SUBSIDIARIES OF THE REGISTRANT - BOISE CASCADE Co | bcc12312017ex211.htm |
| EX-12.1 - RATIO OF EARNINGS TO FIXED CHARGES - BOISE CASCADE Co | bcc12312017ex121.htm |
| EX-10.18 - DEFERRED COMPENSATION PLAN - BOISE CASCADE Co | bccex101ar2004dcp.htm |
UNITED STATES
SECURITIES AND EXCHANGE COMMISSION
Washington, DC 20549
FORM 10-K
x | ANNUAL REPORT PURSUANT TO SECTION 13 OR 15(d) OF THE SECURITIES EXCHANGE ACT OF 1934 |
For the fiscal year ended December 31, 2017 | |
o | TRANSITION REPORT PURSUANT TO SECTION 13 OR 15(d) OF THE SECURITIES EXCHANGE ACT OF 1934 |
For the transition period from to | |
Commission File Number: 001-35805
Boise Cascade Company
(Exact name of registrant as specified in its charter)
Delaware | 20-1496201 |
(State or other jurisdiction of incorporation or organization) | (I.R.S. Employer Identification No.) |
1111 West Jefferson Street
Suite 300
Boise, Idaho 83702-5389
(Address of principal executive offices) (Zip Code)
(208) 384-6161
(Registrant's telephone number, including area code)
Securities registered pursuant to Section 12(b) of the Act:
Title of Each Class | Name of Each Exchange on Which Registered | |
Common Stock, $0.01 par value per share | New York Stock Exchange | |
Securities registered pursuant to Section 12(g) of the Act: None
Indicate by check mark if registrant is a well-known seasoned issuer, as defined in Rule 405 of the Securities Act. Yes x No o
Indicate by check mark if the registrant is not required to file reports pursuant to Section 13 or Section 15(d) of the Act. Yes o No x
Indicate by check mark whether the registrant (1) has filed all reports required to be filed by Section 13 or 15(d) of the Securities Exchange Act of 1934 during the preceding 12 months (or for such shorter period that the registrant was required to file such reports), and (2) has been subject to such filing requirements for the past 90 days. Yes x No o
Indicate by check mark whether the registrant has submitted electronically and posted on its corporate Web site, if any, every Interactive Data File required to be submitted and posted pursuant to Rule 405 of Regulation S-T (§232.405 of this chapter) during the preceding 12 months (or for such shorter period that the registrant was required to submit and post such files). Yes x No o
Indicate by check mark if disclosure of delinquent filers pursuant to Item 405 of Regulation S-K (§229.405 of this chapter) is not contained herein, and will not be contained, to the best of the registrant's knowledge, in definitive proxy or information statements incorporated by reference in Part III of this Form 10-K or any amendment to this Form 10-K. x
Indicate by check mark whether the registrant is a large accelerated filer, an accelerated filer, a non-accelerated filer, or a smaller reporting company. See the definitions of "large accelerated filer," "accelerated filer," and "smaller reporting company" in Rule 12b-2 of the Exchange Act.
Large accelerated filer x Accelerated filer o
Non-accelerated filer o (Do not check if a smaller reporting company) Smaller reporting company o
Emerging growth company o
If an emerging growth company, indicate by check mark if the registrant has elected not to use the extended transition period for complying with any new or revised financial accounting standards provided pursuant to Section 13(a) of the Exchange
Act. o
Indicate by check mark whether the registrant is a shell company (as defined in Rule 12b-2 of the Exchange Act). Yes o No x
The aggregate market value of the voting and non-voting common equity held by non-affiliates of the registrant on June 30, 2017, the last business day of the registrant's most recently completed second fiscal quarter, based on the last reported trading price of the registrant's common stock on the New York Stock Exchange was approximately $1,164 million.
There were 38,586,272 shares of the registrant's common stock, $0.01 par value per share, outstanding on February 16, 2018.
DOCUMENTS INCORPORATED BY REFERENCE
Portions of the registrant’s Proxy Statement for its 2018 annual meeting of stockholders are incorporated by reference into Part III of this Form 10-K.
Table of Contents
ii
iii
Cautionary Statement Concerning Forward-Looking Statements
Certain statements made in this Form 10-K contain forward-looking statements. Forward-looking statements are subject to risks and uncertainties that may cause our actual results, performance, or achievements to be materially different from any future results, performance, or achievements expressed or implied by these forward-looking statements. Forward-looking statements include information concerning our future financial performance, business strategy, plans, goals, and objectives.
Statements preceded or followed by, or that otherwise include, the words "believes," "expects," "anticipates," "intends," "project," "estimates," "plans," "forecast," "is likely to," and similar expressions or future or conditional verbs such as "will," "may," "would," "should," and "could" are generally forward-looking in nature and not historical facts. Such statements are based upon the current beliefs and expectations of our management and are subject to significant risks and uncertainties. Actual results may differ materially from those set forth in the forward-looking statements.
The following factors, among others, could cause our actual results, performance, or achievements to differ from those set forth in the forward-looking statements:
• | The commodity nature of our products and their price movements, which are driven largely by industry capacity and operating rates, industry cycles that affect supply and demand, and net import and export activity; |
• | General economic conditions, including but not limited to housing starts, repair-and-remodeling activity, light commercial construction, inventory levels of new and existing homes for sale, foreclosure rates, interest rates, unemployment rates, household formation rates, and mortgage availability and pricing, as well as other consumer financing mechanisms, that ultimately affect demand for our products; |
• | The highly competitive nature of our industry; |
• | Material disruptions and/or major equipment failure at our manufacturing facilities; |
• | Our ability to successfully and efficiently complete and integrate acquisitions; |
• | Impairment of our long-lived assets, goodwill, and/or intangible assets; |
• | Labor disruptions, shortages of skilled and technical labor, or increased labor costs; |
• | The need to successfully formulate and implement succession plans for key members of our management team; |
• | Cost and availability of raw materials, including wood fiber and glues and resins; |
• | Concentration of our sales among a relatively small group of customers, as well as the financial condition and creditworthiness of our customers; |
• | Product shortages, loss of key suppliers, and our dependence on third-party suppliers and manufacturers; |
• | Disruptions to information systems used to process and store customer, employee, and vendor information, as well as the technology that manages our operations and other business processes; |
• | Substantial ongoing capital investment costs, including those associated with recent acquisitions, and the difficulty in offsetting fixed costs related to those investments; |
• | Cost of compliance with government regulations, in particular environmental regulations; |
• | The impact of actuarial assumptions, investment return on pension assets, and regulatory activity on pension costs and pension funding requirements; |
• | The cost and availability of third-party transportation services used to deliver the goods we manufacture and distribute, as well as our raw materials; |
• | Exposure to product liability, product warranty, casualty, construction defect, and other claims; |
1
• | Declines in demand for our products due to competing technologies or materials, as well as changes in building code provisions; |
• | Our indebtedness, including the possibility that we may not generate sufficient cash flows from operations or that future borrowings may not be available in amounts sufficient to fulfill our debt obligations and fund other liquidity needs; |
• | Restrictive covenants contained in our debt agreements; and |
• | Fluctuations in the market for our equity. |
Certain of these and other factors are discussed in more detail in "Item 1A. Risk Factors" of this Form 10-K. These factors should not be construed as exhaustive and should be read in conjunction with the other cautionary statements that are included in this Form 10-K. While we believe that our forecasts and assumptions are reasonable, we caution that actual results may differ materially. If one or more of these or other risks or uncertainties materialize, or if our underlying assumptions prove to be incorrect, actual results may vary materially from what we projected. Consequently, actual events and results may vary significantly from those included in or contemplated or implied by our forward-looking statements.
PART I
ITEM 1. BUSINESS
Boise Cascade is a large, vertically-integrated wood products manufacturer and building materials distributor with widespread operations throughout the United States (U.S.) and one manufacturing facility in Canada. As used in this Form 10-K, the terms "Boise Cascade," "we," and "our" refer to Boise Cascade Company and its consolidated subsidiaries. We are one of the largest producers of engineered wood products (EWP) and plywood in North America and a leading U.S. wholesale distributor of building products. Our broad line of products is used primarily in new residential construction, residential repair-and-remodeling projects, light commercial construction, and industrial applications. We have a broad base of more than 4,500 customers, which includes a diverse mix of retail lumberyards, home improvement centers, leading wholesalers, specialty distributors, and industrial converters. We believe our large, vertically-integrated operations provide us with significant advantages over less integrated competitors and position us to optimally serve our customers. Our operations began on October 29, 2004, when we acquired the forest products assets of OfficeMax, Incorporated. We completed an initial public offering of our common stock on February 11, 2013.
Our Industry
The building products manufacturing and distribution industry in North America is highly competitive, with a number of producers manufacturing and selling a broad range of products. Demand for our products is principally influenced by new residential construction, residential repair-and-remodeling activity, and light commercial construction in the U.S. Drivers of new residential construction, residential repair-and-remodeling activity, and light commercial construction include new household formation, the age of the housing stock, availability of credit and other macroeconomic factors, such as GDP growth, population growth and migration, interest rates, employment, and consumer sentiment. Purchasing decisions made by the customers who buy our products are generally based on price, quality, availability, and customer service.
Segments
We operate our business using two reportable segments: Wood Products and Building Materials Distribution. We present information pertaining to our segments, including product sales, customer concentration, and the geographic areas in which we operate, in Note 14, Segment Information, of the Notes to Consolidated Financial Statements in "Item 8. Financial Statements and Supplementary Data" of this Form 10-K.
Wood Products
Products
We manufacture laminated veneer lumber (LVL), I-joists, and laminated beams, which are collectively referred to as EWP. LVL and laminated beams are structural products used in applications where extra strength and consistent quality are
2
required, such as headers and beams. LVL is also used in the manufacture of I-joists, which are assembled by combining a vertical web of oriented strand board (OSB) with top and bottom LVL or solid wood flanges. I-joists, which are used primarily in residential and commercial flooring and roofing systems and other structural applications, are stronger, lighter, and straighter than conventional lumber joists. In addition, we manufacture structural, appearance, and industrial plywood panels. We also produce ponderosa pine lumber, studs, and particleboard.
The following table sets forth the annual capacity and production of our principal products for the periods indicated:
Year Ended December 31 | |||||||||||||||
2017 | 2016 | 2015 | 2014 | 2013 | |||||||||||
(millions) | |||||||||||||||
Capacity (a) | |||||||||||||||
LVL (cubic feet) (b)(c) | 35.5 | 34.5 | 28.5 | 27.5 | 27.5 | ||||||||||
Plywood and Parallel Laminated Veneer (PLV) (sq. ft.) (3/8" basis) (d) | 2,440 | 2,400 | 2,385 | 2,380 | 2,380 | ||||||||||
Lumber (board feet) | 270 | 270 | 270 | 270 | 255 | ||||||||||
Production | |||||||||||||||
LVL (cubic feet) (b) | 26.2 | 23.9 | 20.1 | 20.1 | 17.2 | ||||||||||
I‑joists (equivalent lineal feet) (b) | 228 | 225 | 198 | 201 | 178 | ||||||||||
Plywood and PLV (sq. ft.) (3/8" basis) (d) | 1,828 | 1,852 | 1,951 | 1,973 | 1,647 | ||||||||||
Lumber (board feet) | 177 | 179 | 201 | 218 | 197 | ||||||||||
_______________________________________
(a) | Estimated annual capacity at the end of each year. |
(b) | During each of the years presented above, approximately one-third of the LVL we produced was utilized internally to produce I-joists. Capacity is based on LVL production only. |
(c) | In March 2016, we purchased two EWP facilities, one in Thorsby, Alabama, and one in Roxboro, North Carolina. Thorsby LVL capacity is estimated at 4.0 million cubic feet and Roxboro's estimated annual capacity is 2.0 million cubic feet. |
(d) | Approximately 22%, 21%, 18%, 19%, and 17%, respectively, of production in 2017, 2016, 2015, 2014, and 2013 was for PLV panels that are utilized internally to produce LVL. |
The following table sets forth segment sales, income, depreciation and amortization, and EBITDA for the periods indicated:
Year Ended December 31 | ||||||||||||||||||||
2017 | 2016 | 2015 | 2014 | 2013 | ||||||||||||||||
(millions) | ||||||||||||||||||||
Segment sales (a) | $ | 1,373.8 | $ | 1,280.4 | $ | 1,282.1 | $ | 1,317.0 | $ | 1,134.1 | ||||||||||
Segment income | $ | 53.6 | $ | 25.9 | $ | 64.2 | $ | 108.4 | $ | 77.7 | ||||||||||
Segment depreciation and amortization | 63.1 | 57.5 | 43.3 | 41.5 | 28.7 | |||||||||||||||
Segment EBITDA (b) | $ | 116.7 | $ | 83.5 | $ | 107.5 | $ | 149.8 | $ | 106.3 | ||||||||||
_______________________________________
(a) | Segment sales are calculated before elimination of sales to our Building Materials Distribution segment. |
(b) | Segment EBITDA is calculated as segment income before depreciation and amortization. See "Item 6. Selected Financial Data" of this Form 10-K for a description of our reasons for using EBITDA and for a discussion of the limitations of such a measure. |
Facilities
Our Wood Products segment operates six EWP facilities. Our two most significant EWP facilities are located in Louisiana and Oregon and have a high degree of raw material and manufacturing integration with our neighboring plywood and veneer facilities. We also operate nine plywood and veneer plants, five sawmills, and one particleboard plant.
3
Raw Materials and Input Costs
Wood fiber. Wood fiber is the primary raw material used in our Wood Products operations, and our primary source of wood fiber is logs. For the year ended December 31, 2017, wood fiber accounted for approximately 44% of materials, labor, and other operating expenses (excluding depreciation) in our Wood Products segment. Our EWP facilities use parallel-laminated veneer panels and veneer sheets produced by our facilities, as well as lumber, OSB, and veneer sheets purchased from third parties, to manufacture LVL, I-joists, and laminated beams. Our EWP, plywood, and veneer facilities use Douglas fir, white woods, pine, and hardwood logs as raw materials. We also use ponderosa pine, spruce, and white fir logs to manufacture various grades of lumber. Our particleboard facility uses wood residuals produced by us and by third-party lumber producers. Our manufacturing facilities are located in close proximity to active wood fiber markets.
Logs comprised approximately 75% of our wood fiber costs during 2017, and we satisfy our log requirements through a combination of purchases under supply agreements, open-market purchases, and purchases pursuant to contracts awarded under public auctions.
Approximately 71% of our log supply in 2017 was supplied through purchases from private land owners or through dealers. We also bid in auctions conducted by federal, state, and local authorities for the purchase of logs, generally at fixed prices, under contracts with terms of generally one to three years.
Our log requirements and our access to supply, as well as the cost of obtaining logs, are subject to change based on, among other things, the availability of logs in each of our operating areas, our operating schedules, competition from other manufacturers, the effect of governmental laws and regulations, impacts of weather or fire on log availability, and the status of environmental appeals. For a discussion of contractual commitments relating to log supply agreements, see "Contractual Obligations" in "Item 7. Management's Discussion and Analysis of Financial Condition and Results of Operations" of this Form 10-K.
The cost of logs is correlated with prevailing product prices for building materials and manufacturers' expectations for future product prices, with the increase in product prices driving increases in log costs. Generally, increases in the cost of logs lag product price increases, as improved manufacturer profitability often leads to increased demand for logs. Prices for logs have been historically cyclical in response to changes in domestic and foreign demand and supply. Our aggregate cost of obtaining logs is also affected by fuel costs and the distance of the log source from our facilities, as we are often required to transport the logs we purchase from the source to our facilities.
Demand for dimension lumber has a strong influence on log pricing, as the dimension lumber industry is the largest consumer of logs. Historically, the level of foreign demand for log exports from the western U.S. has fluctuated based on economic activity in China and other Pacific Rim countries, currency exchange rates, and the availability of log supplies from other countries such as Canada, Russia, and New Zealand. Sustained periods of high log costs may impair the cost competitiveness of our manufacturing facilities. Log costs in the western U.S. have historically been more volatile due to foreign demand for log exports. In addition, per-unit log costs in the western U.S. are higher than per-unit log costs in the southern U.S. due to various supply-side constraints, including seasonal weather related restrictions and a higher proportion of federal and state timberland ownership.
We also purchase OSB, which is used as the vertical web to assemble I-joists, from a supplier with multiple locations throughout North America. OSB accounted for approximately 7% of the aggregate amount of materials, labor, and other operating expenses (excluding depreciation) for our Wood Products segment in 2017. OSB is a commodity, and prices have been historically volatile in response to industry capacity and operating rates, inventory levels in various distribution channels, and seasonal demand patterns. Sustained periods of high OSB costs lead to higher costs of our I-joist production.
Wood fiber also includes, to a lesser extent than OSB, lumber purchased from third parties for I-joist production at our Canadian EWP facility and for production at our laminated beam plant in Idaho. Lumber input costs are subject to similar commodity-based volatility characteristics noted above for OSB. In addition, our particleboard operation uses wood residuals from lumber operations, approximately half of which is purchased from third parties. Periods of low demand for lumber can negatively affect supply and pricing of wood residuals used at our particleboard facility.
Other raw materials and energy costs. We use a significant quantity of various resins and glues in our manufacturing processes. Resin and glue product costs are influenced by changes in the prices of raw material input costs, primarily fossil fuel products. We purchase resins and glues, other raw materials, and energy used to manufacture our products in both the open market and through supply contracts. The contracts are generally with regional suppliers who agree to supply all of our needs for a certain raw material or energy within the applicable region. These contracts have terms of various lengths and typically
4
contain price adjustment mechanisms that take into account changes in market prices. Therefore, although our long-term contracts provide us with supplies of raw materials and energy that are more stable than open-market purchases, in many cases, they may not alleviate fluctuations in market prices.
Sales, Marketing, and Distribution
Our EWP sales force is managed centrally through a main office that oversees regional sales teams. Our sales force spends a significant amount of time working with end customers who purchase our EWP. Our sales force provides a variety of technical support services, including integrated design, engineering, product specification software, distributor inventory management software, and job-pack preparation systems. Sales management of plywood, lumber, and particleboard is also managed centrally and is organized by product line.
In 2017, EWP, plywood, and lumber accounted for 47%, 35%, and 7%, respectively, of our Wood Products sales. The majority of our wood products are sold to leading wholesalers (including our Building Materials Distribution segment), home improvement centers, retail lumberyards, and industrial converters in North America. Our Building Materials Distribution segment is our Wood Products segment's largest customer, representing approximately 52% of our Wood Products segment's overall sales in 2017. In 2017, 71%, 31%, and 7% of our Wood Products segment's EWP, plywood, and lumber sales volumes, respectively, were to our Building Materials Distribution segment.
The following table lists sales volumes for our principal wood products for the periods indicated:
Year Ended December 31 | |||||||||||||||
2017 | 2016 | 2015 | 2014 | 2013 | |||||||||||
(millions) | |||||||||||||||
Laminated veneer lumber (LVL) (cubic feet) (a) | 17.3 | 16.3 | 13.1 | 12.4 | 11.1 | ||||||||||
I-joists (equivalent lineal feet) | 235 | 226 | 201 | 193 | 179 | ||||||||||
Plywood (sq. ft.) (3/8" basis) (b) | 1,458 | 1,507 | 1,635 | 1,651 | 1,473 | ||||||||||
Lumber (board feet) | 171 | 187 | 206 | 212 | 199 | ||||||||||
_______________________________________
(a) Excludes LVL produced and used as flange stock in the manufacture of I-joists.
(b) Excludes PLV produced and used in the manufacture of LVL.
Segment Strategy
Grow Our Operations With a Focus on Expanding Our Market Position in EWP
In 2016, we expanded our market position in EWP with the acquisition of two EWP facilities in Thorsby, Alabama, and Roxboro, North Carolina. We have also expanded our market position in EWP by utilizing our large-scale manufacturing position, comprehensive customer service offering, design support capabilities, and efficient distribution network. We expect to see further increases in EWP demand as a result of the ongoing recovery in housing construction and intend to optimize our existing asset base to take advantage of these increases and continue to grow our market position in EWP. For further discussion on acquisitions, see Note 5, Acquisitions, of the Notes to Consolidated Financial Statements in "Item 8. Financial Statements and Supplementary Data" of this Form 10‑K.
Continue to Improve Our Competitiveness Through Operational Excellence
We use a disciplined cost management approach to maximize our competitiveness without sacrificing our ability to react to future growth opportunities. Additionally, we have made capital investments and process improvements in certain facilities. These capital investments and process improvements have improved our veneer self-sufficiency and allowed us to produce lower-cost, higher-quality veneers. We use a data-driven process improvement program to further strengthen our manufacturing operations. We believe there are opportunities to further apply this process improvement program in our manufacturing operations and apply similar techniques and methods to different functional areas to realize efficiencies in those areas.
5
Building Materials Distribution
Products
We sell a broad line of building materials, including OSB, plywood, and lumber (collectively commodities), general line items such as siding, composite decking, metal products, insulation, and roofing, and EWP. Except for EWP, we purchase most of these building materials from a vendor base of approximately 1,000 third-party suppliers ranging from large manufacturers, such as James Hardie Building Products, Trex Company, Huber Engineered Woods, and Louisiana-Pacific Corporation, to small regional producers. Substantially all of our EWP is sourced from our Wood Products segment. Our products are used in the construction of new residential housing, including single-family, multi-family, and manufactured homes, the repair-and-remodeling of existing housing, the construction of light industrial and commercial buildings, and other industrial applications.
The following table lists our product line sales mix for the periods indicated:
Year Ended December 31 | ||||||||||||||
2017 | 2016 | 2015 | 2014 | 2013 | ||||||||||
(percentage of Building Materials Distribution sales) | ||||||||||||||
Commodity | 47.9 | % | 46.6 | % | 46.5 | % | 49.4 | % | 51.3 | % | ||||
General line | 33.6 | % | 35.4 | % | 35.9 | % | 33.6 | % | 33.0 | % | ||||
Engineered wood products | 18.5 | % | 18.0 | % | 17.6 | % | 17.0 | % | 15.7 | % | ||||
The following table sets forth segment sales, income, depreciation and amortization, and EBITDA for the periods indicated:
Year Ended December 31 | ||||||||||||||||||||
2017 | 2016 | 2015 | 2014 | 2013 | ||||||||||||||||
(millions) | ||||||||||||||||||||
Segment sales | $ | 3,773.8 | $ | 3,227.2 | $ | 2,891.3 | $ | 2,786.7 | $ | 2,599.6 | ||||||||||
Segment income | $ | 116.8 | $ | 84.4 | $ | 60.8 | $ | 56.7 | $ | 39.9 | ||||||||||
Segment depreciation and amortization | 15.5 | 13.8 | 11.9 | 9.8 | 9.2 | |||||||||||||||
Segment EBITDA (a) | $ | 132.3 | $ | 98.1 | $ | 72.7 | $ | 66.5 | $ | 49.2 | ||||||||||
_______________________________________
(a) | Segment EBITDA is calculated as segment income before depreciation and amortization. See "Item 6. Selected Financial Data" of this Form 10-K for a description of our reasons for using EBITDA and for a discussion of the limitations of such a measure. |
Facilities
Our Building Materials Distribution segment operates a nationwide network of 33 building materials distribution facilities throughout the U.S. Our Building Materials Distribution segment also operates a single truss manufacturing plant. Our broad geographic presence reduces our exposure to market factors in any single region.
Sales, Marketing, and Distribution
We market our building materials primarily to retail lumberyards, home improvement centers, and specialty distributors that then sell the products to end customers, who are typically professional builders, independent contractors, and homeowners engaged in residential construction and repair-and-remodeling projects. We also market our products to a wide variety of industrial accounts, which use our products to assemble cabinets, doors, agricultural bins, crating, and other products used in industrial and construction applications. We believe that our national presence and long-standing relationships with many of our key suppliers allow us to obtain favorable price and term arrangements and offer excellent customer service on top brands in the building materials industry. We also believe our broad product line provides our customers with an efficient, one-stop resource for their building materials needs. We also have expertise in special-order sourcing and merchandising support, which is a key service for our home improvement center customers that choose not to stock certain items in inventory.
6
We sell products through two primary distribution channels: warehouse sales and direct sales. Warehouse sales are delivered from our distribution centers to our customers and direct sales are shipped from the manufacturer to the customer without our taking physical inventory possession. Each of our distribution centers implements its own distribution and logistics model using centralized information systems. We use internal and external trucking resources to deliver materials on a regularly scheduled basis. Our highly efficient logistics system allows us to deliver superior customer service and assist our customers in optimizing their working capital.
We have a large, decentralized sales force to support our suppliers and customers. Our sales force and product managers have local product knowledge and decision-making authority, which we believe enables them to optimize stocking, pricing, and product assortment decisions. Our sales force has access to centralized information technology systems, an extensive vendor base, and corporate-level working capital support, which we believe complements our localized sales model. Our sales force is compensated, in part, based on branch-level performance.
We regularly evaluate opportunities to introduce new products. Broadening our product offering helps us serve as a one-stop resource for building materials, which we believe improves our customers' purchasing and operating efficiencies. The introduction of new products is primarily driven by customer demand or product extensions originating from our vendors. We believe our long-standing customer relationships allow us to respond to customer feedback and introduce new products more rapidly. Broadening our product offering also helps us drive additional products through our distribution system, thereby increasing our scale and efficiency.
Segment Strategy
Grow Market Share
We intend to grow our Building Materials Distribution business in existing markets by adding products and services to better serve our customers. We also plan to opportunistically expand our Building Materials Distribution business by acquiring facilities, opening new locations, relocating and expanding capacity at existing facilities, and capturing local market share through our supply chain capabilities and customer service.
Further Differentiate Our Products and Services
We seek to continue to differentiate ourselves from our competitors by providing a broad line of high-quality products and superior customer service. Our highly efficient logistics system allows us to deliver superior customer service and assist our customers in optimizing their working capital. Our national distribution platform, coupled with the manufacturing capabilities of our Wood Products segment, differentiates us from most of our competitors and is critical to servicing retail lumberyards, home improvement centers, and industrial accounts locally, regionally, and nationally. Additionally, this system allows us to procure product more efficiently and to develop and maintain stronger relationships with our vendors. Because of these relationships and our national presence, we believe many of our vendors have offered us favorable pricing and provide us with enhanced product introductions and ongoing marketing support.
Customers
We maintain relationships with a broad customer base across multiple market segments and various end markets. For the year ended December 31, 2017, our top ten customers represented approximately 35% of our sales, with no customer accounting for 10% or more of total sales. At December 31, 2017, receivables from Home Depot and Builders FirstSource accounted for approximately 12% and 15%, respectively, of total receivables. Sales to Home Depot were recorded in our Building Materials Distribution and Wood Products segments and substantially all sales to Builders FirstSource were recorded in our Building Material Distribution segment. For additional information related to customers of our Wood Products and Building Materials Distribution segments, see the "Sales, Marketing, and Distribution" sections above.
7
Competition
The competitive environment in our industry in the U.S. continues to be challenging. Industry capacity in a number of product markets, including some of those in which we compete, exceeds the current level of demand. Our products and services compete with similar products manufactured and distributed by others. Many factors influence our competitive position in the markets in which we operate. Those factors include price, service, quality, product selection, and convenience of location.
Some of our competitors are larger than we are and have greater financial resources. These resources may afford those competitors greater purchasing power, increased financial flexibility, and more capital resources for expansion and improvement.
Wood Products. The wood products manufacturing markets in which we operate are large and highly competitive. We compete against several major North American EWP producers, such as Weyerhaeuser Company and Louisiana-Pacific Corporation, as well as several other smaller firms. Our EWP products also face competition from numerous dimension lumber producers, because EWP may be substituted by dimension lumber in many building applications. In plywood, we compete with Georgia-Pacific, the largest manufacturer in North America, other large producers such as Roseburg Forest Products, foreign imports produced principally in South America, and several smaller domestic producers. Our plywood products also face competition from OSB producers, because OSB can be substituted for plywood in many building applications. We have leading market positions in the manufacture of EWP, plywood, and ponderosa pine lumber. We hold much smaller market positions in our other manufactured products. In the wood products manufacturing markets, we compete primarily on the basis of price, quality, availability, and particularly with respect to EWP, customer service, product support, and performance features offered. Most of our competitors are located in the U.S. and Canada, although we also compete with manufacturers in other countries, particularly when the U.S. dollar and economy are stronger relative to other countries, encouraging foreign producers to sell more of their plywood and lumber products into the U.S. Our competition includes not only manufacturers and distributors of similar building products but also manufacturers and distributors of products made from alternative materials, such as steel and plastic. Some of our competitors enjoy strong reputations for product quality and customer service, and these competitors may have strong relationships with certain distributors, making it more difficult for our products to gain additional market share. Some of our competitors in this segment are also vertically integrated and/or have access to internal sources of wood fiber, which may allow them to subsidize their base manufacturing business in periods of rising fiber prices.
Building Materials Distribution. The building materials distribution markets in which we operate are highly fragmented, and we compete in each of our geographic and product markets with national, regional, and local distributors. Our national wholesale distribution competitors include BlueLinx Holdings Inc. and Weyerhaeuser Company. Regional wholesale distribution competitors include Cedar Creek, OrePac, and U.S. Lumber Group. We also compete with wholesale brokers, specialty distributors, and certain buying cooperatives. We compete on the basis of pricing and availability of product, service and delivery capabilities, ability to assist customers with problem solving, extension of credit terms, customer relationships, geographic coverage, and breadth of product offerings. We distribute products for some manufacturers that also engage in direct sales to our distribution customers. In recent years, there has been consolidation among retail lumberyards. As the customer base consolidates, this dynamic could affect our ability to maintain margins. Proximity to customers is an important factor in minimizing shipping costs and facilitating quick order turnaround and on-time delivery. We believe our ability to obtain quality materials, from both internal and external sources, the scale and efficiency of our national footprint, and our focus on customer service are our primary competitive advantages in this segment. Also, financial stability is important to suppliers and customers in choosing distributors and allows for more favorable terms on which we are able to obtain our products from our suppliers and sell our products to our customers.
Environmental
A discussion of general and industry-specific environmental laws and regulations is presented under the caption "Environmental" in "Item 7. Management's Discussion and Analysis of Financial Condition and Results of Operations" and "Item 3. Legal Proceedings" of this Form 10-K.
Capital Investment
Information concerning our capital expenditures is presented in "Investment Activities" under "Liquidity and Capital Resources" in "Item 7. Management's Discussion and Analysis of Financial Condition and Results of Operations" of this Form 10-K.
8
Seasonal and Inflationary Influences
We are exposed to fluctuations in quarterly sales volumes and expenses due to seasonal factors. These seasonal factors are common in the building products industry. For further information, see "Seasonal and Inflationary Influences" in "Item 7. Management's Discussion and Analysis of Financial Condition and Results of Operations" of this Form 10-K.
Employees
As of February 11, 2018, we had approximately 6,370 employees. Approximately 24% of these employees work pursuant to collective bargaining agreements. As of February 11, 2018, we had nine collective bargaining agreements. For discussion of risks related to labor disruptions and increased labor costs, refer to "Item 1A. Risk Factors" of this Form 10-K.
Trademarks
We maintain many trademarks for our manufactured wood products, particularly EWP. Our key registered trademarks include BOISE CASCADE® and the TREE-IN-A-CIRCLE® logo, which are perpetual in duration as long as we continue to timely file all post registration maintenance documents related thereto. We believe these key trademarks to be of significant importance to our business.
Available Information
We are subject to the reporting requirements of the Securities Exchange Act of 1934, as amended (the Exchange Act) and therefore file periodic reports and other information with the Securities and Exchange Commission (SEC). These reports may be obtained by visiting the Public Reference Room of the SEC at 100 F Street, NE, Washington, D.C. 20549, or by calling the SEC at 1-800-SEC-0330. In addition, the SEC maintains an Internet website at www.sec.gov that contains reports, proxy information statements, and other information regarding issuers that file electronically.
Our filings under the Exchange Act, including annual reports on Form 10-K, quarterly reports on Form 10-Q, current reports on Form 8-K, proxy statements, and all amendments to these filings, are also available free of charge on the investor relations portion of our website at www.bc.com. These reports are available as soon as reasonably practicable after such material is electronically filed with or furnished to the SEC. The reference to our website address does not constitute incorporation by reference of the information contained on the website, and the information contained on the website is not part of this document.
9
Executive Officers and Key Employees
Below is a list of names, ages, and a brief description of the business experience of our executive officers and key members of management, each as of February 16, 2018.
Name | Age | Position |
Executive Officers: | ||
Tom Corrick | 62 | Chief Executive Officer |
Wayne Rancourt | 55 | Executive Vice President, Chief Financial Officer, and Treasurer |
Dan Hutchinson | 66 | Executive Vice President, Wood Products Manufacturing |
Nick Stokes | 60 | Executive Vice President, Building Materials Distribution |
John Sahlberg | 64 | Senior Vice President, Human Resources and General Counsel |
Kelly Hibbs | 51 | Vice President and Controller |
Key Management: | ||
Mike Brown | 56 | Senior Vice President of Operations, Wood Products Manufacturing |
Nate Jorgensen | 53 | Senior Vice President of Engineered Wood Products, Wood Products Manufacturing |
Rich Viola | 60 | Senior Vice President of Sales and Marketing, Building Materials Distribution |
Frank Elfering | 51 | Vice President of Purchasing, Building Materials Distribution |
Tom Hoffmann | 59 | Vice President of Operations, Building Materials Distribution |
Erin Nuxoll | 58 | Vice President, Human Resources |
Mary Jo Nyblad | 62 | Vice President of Commodity Sales and Marketing, Wood Products Manufacturing |
Jill Twedt | 38 | Vice President, Legal and Corporate Secretary |
Tom Corrick, Chief Executive Officer
Mr. Corrick became our chief executive officer on March 6, 2015. Prior to his election as CEO, Mr. Corrick's previous positions with the company include:
• | Chief Operating Officer, November 2014 - March 2015 |
• | Executive Vice President, Wood Products, June 2014 - November 2014 |
• | Sr. Vice President, Wood Products, August 2012 - June 2014 |
• | Sr. Vice President, Engineered Wood Products, February 2011 - August 2012 |
Mr. Corrick received his bachelor's and master's degrees in business administration from Texas Christian University, Fort Worth, TX.
Wayne Rancourt, Executive Vice President, Chief Financial Officer, and Treasurer
Mr. Rancourt became our executive vice president, chief financial officer, and treasurer in November 2014. His previous positions with the company include:
• | Senior Vice President, Chief Financial Officer, and Treasurer, August 2009 - November 2014 |
• | Vice President, Treasurer and Investor Relations, February 2008 - August 2009 |
Mr. Rancourt received a B.S. degree in accounting from Central Washington University, Ellensburg, WA. He is a member of the board of directors of Commercial Vehicle Group, Inc., which is traded publicly on NASDAQ.
Dan Hutchinson, Executive Vice President, Wood Products Manufacturing
Mr. Hutchinson became our executive vice president, Wood Products Manufacturing, in November 2014. His previous positions with the company include:
10
• | Vice President of Operations, Wood Products Manufacturing, August 2012 - November 2014 |
• | General Manager of Operations, Engineered Wood Products, December 2008 - August 2012 |
Mr. Hutchinson received bachelor's degrees in accounting and finance from the University of Idaho, Moscow, ID, and an M.B.A. from Washington State University, Pullman, WA.
Nick Stokes, Executive Vice President, Building Materials Distribution
Mr. Stokes became our executive vice president, Building Materials Distribution, in March 2014. His previous positions with the company include:
• | Senior Vice President, Building Materials Distribution, February 2011 - March 2014 |
• | Vice President, Building Materials Distribution, October 2004 - February 2011 |
Mr. Stokes received a B.S. in management and a B.S. in marketing from the University of Utah, Salt Lake City, UT.
John Sahlberg, Senior Vice President, Human Resources and General Counsel
Mr. Sahlberg became our senior vice president, Human Resources and General Counsel, effective August 2012. His previous positions with the company include:
• | Vice President, Human Resources and General Counsel, January 2011 - August 2012 |
• | Vice President, Human Resources, February 2008 - January 2011 |
Mr. Sahlberg received a bachelor's degree in economics from Harvard College, Cambridge, MA, and a J.D. from Georgetown University, Washington, DC. He is a member of the Idaho State Bar. He is a member of the board of directors of US Ecology, Inc., which is a publicly traded company on NASDAQ.
Kelly Hibbs, Vice President and Controller
Mr. Hibbs became our vice president and controller in February 2011. His previous positions with the company include:
• | Director of Strategic Planning and Internal Audit, February 2008 - February 2011 |
Mr. Hibbs received a B.A. in accounting from Boise State University, Boise, ID. He is a certified public accountant.
Mike Brown, Senior Vice President of Operations, Wood Products Manufacturing
Mr. Brown became our senior vice president of operations, Wood Products Manufacturing, in November 2017. His previous positions with the company include:
• | Vice President of Operations, Wood Products Manufacturing, February 2016 - November 2017 |
• | Manufacturing Operations Manager, Wood Products Manufacturing, November 2014 - February 2016 |
• | Southeast Area Manager, Wood Products Manufacturing, September 2013 - November 2014 |
• | Southern Region Manager, Wood Products Manufacturing, January 2009 - September 2013 |
Mr. Brown received an M.B.A. from Cranfield University, England, and a bachelor of science degree in forestry from Australian National University in Canberra.
Nate Jorgensen, Senior Vice President of Engineered Wood Products, Wood Products Manufacturing
Mr. Jorgensen became our senior vice president of engineered wood products, Wood Products Manufacturing, in November 2017. His previous positions include:
• | Vice President of Engineered Wood Products, Wood Products Manufacturing, February 2016 - November 2017 |
• | Engineered Wood Products Marketing Manager, Wood Products Manufacturing, Boise Cascade Company, June 2015 - February 2016 |
• | Prior employment with Weyerhaeuser Company as Vice President of Weyerhaeuser Distribution, February 2011 - June 2015 |
11
Mr. Jorgensen received a bachelor of science, civil and environmental engineering degree from the University of Wisconsin and also attended the Tuck School of Business Executive Education Program, Dartmouth University, Hanover, NH.
Rich Viola, Senior Vice President of Sales and Marketing, Building Materials Distribution
Mr. Viola became our senior vice president of sales and marketing, Building Materials Distribution, in February 2016. His previous positions with the company include:
• | Vice President, Sales and Marketing, Building Materials Distribution, October 2013 - February 2016 |
• | Division Sales and Marketing Manager, Building Materials Distribution, August 2013 - October 2013 |
• | National Accounts Sales Manager & East Region Sales Manager, Building Materials Distribution, September 1999 - August 2013 |
Mr. Viola received a B.S. in marketing from Northeastern University, Boston, MA.
Frank Elfering, Vice President of Purchasing, Building Materials Distribution
Mr. Elfering became our vice president of purchasing, Building Materials Distribution, in October 2013. His previous positions with the company include:
• | Purchasing Manager, Building Materials Distribution, July 2013 - October 2013 |
• | Division Marketing Manager & West Region Sales Manager, Building Materials Distribution, 2008 - 2013 |
Mr. Elfering received a B.S. in marketing from Oregon State University, Corvallis, OR.
Tom Hoffmann, Vice President of Operations, Buildings Materials Distribution
Mr. Hoffmann became our vice president of operations, Building Materials Distribution, in October 2016. His previous positions with the company include:
• | Division Operations Manager, Building Materials Distribution, September 2015 - October 2016 |
• | Pacific Region Manager, Building Materials Distribution, November 2006 - September 2015 |
Mr. Hoffmann received a B.S. in business from the University of Idaho, Moscow, ID, with an emphasis in marketing and management.
Erin Nuxoll, Vice President, Human Resources
Ms. Nuxoll became our vice president, human resources in August 2016. Her previous positions include:
• | Senior Vice President, Human Resources, J.R. Simplot Company, February 2010 - March 2016 |
• | Vice President, Human Resources, J.R. Simplot Company, March 2006 - February 2010 |
• | Vice President, Human Resources, Boise Cascade, L.L.C., November 2004 - November 2005 |
Ms. Nuxoll received a master of arts in organizational leadership from Gonzaga University, Spokane, WA, and a bachelor of science in forest management from Washington State University, Pullman, WA.
Mary Jo Nyblad, Vice President of Commodity Sales and Marketing, Wood Products Manufacturing
Ms. Nyblad became our vice president of commodity sales and marketing, Wood Products Manufacturing, in February 2016. Her previous positions with the company include:
• | Director of Commodity Sales and Marketing, Wood Products Manufacturing, November 2014 - February 2016 |
• | General Sales Manager, Panels and Transportation, Wood Products Manufacturing, February 2005 - November 2014 |
Ms. Nyblad received an M.B.A. from Idaho State University, Pocatello, ID, and a bachelor’s degree in psychology from Whitman College, Walla Walla, WA. Ms. Nyblad has elected to retire from the company, effective April 1, 2018.
12
Jill Twedt, Vice President, Legal and Corporate Secretary
Ms. Twedt became our vice president of legal and corporate secretary in August 2017. Her previous positions include:
• | Associate General Counsel of Legal, July 2007 - August 2017 |
• | Associate Attorney, Boise law firm practicing employment law litigation, August 2003 - July 2007 |
Ms. Twedt received her law degree from University of Idaho, Moscow, ID, and a bachelor's degree in political science from the College of Idaho, Caldwell, ID.
ITEM 1A. RISK FACTORS
Risks Relating to Our Business
Many of the products we manufacture or purchase and resell are commodities whose price is determined by the market's supply and demand for such products, and the markets in which we operate are cyclical and competitive.
Many of the building products we produce or distribute, including OSB, plywood, lumber, and particleboard, are commodities that are widely available from other manufacturers or distributors with prices and volumes determined frequently in an auction market based on participants' perceptions of short-term supply and demand factors. At times, the price for any one or more of the products we produce or distribute may fall below our cash production or purchase costs, requiring us to either incur short-term losses on product sales or cease production at one or more of our manufacturing facilities. Therefore, our profitability with respect to these commodity products depends, in significant part, on effective facilities maintenance programs, and on managing our cost structure, particularly raw materials and labor, which represent the largest components of our operating costs. Commodity wood product prices could be volatile in response to industry operating rates, net import and export activity, inventory levels in various distribution channels, and seasonal demand patterns. Commodity price volatility also affects our distribution business, with falling price environments generally causing reduced revenues and margins, resulting in declines in profitability.
Demand for the products we manufacture, as well as the products we purchase and distribute, is closely correlated with new residential construction in the U.S. and, to a lesser extent, residential repair-and-remodeling activity and light commercial construction. New residential construction activity has historically been volatile with demand for new residential construction influenced by seasonal weather factors, mortgage availability and rates, unemployment levels, household formation rates, domestic population growth, immigration rates, residential vacancy and foreclosure rates, demand for second homes, existing home prices, consumer confidence, and other general economic factors.
Industry supply for the products we produce and distribute is influenced primarily by price-induced changes in the operating rates of existing facilities but is also influenced over time by the introduction of new product technologies, capacity additions and closures, restart of idled capacity, and log availability. The balance of supply and demand in the U.S. is also heavily influenced by imported products, principally from Canada and South America.
In addition, we sell wood chips that are a byproduct of processing logs at our manufacturing operations, or created through the chipping of small diameter logs that we are unable to process at our manufacturing operations. Our wood chips are primarily sold to paper mills in close proximity to our operations who convert the chips into wood pulp. Periods of high output from wood based operations, closure of paper mills in the regions that we operate, or declines in demand for paper grades that utilize our chips, can negatively affect the balance of supply and demand for chips. An oversupply of chips has a negative impact on our chip price realizations and profitability.
We have very limited control of the foregoing, and as a result, our profitability and cash flow may fluctuate materially in response to changes in the supply and demand balance for our primary products.
Our industry is highly competitive. If we are unable to compete effectively, our sales, operating results, and growth strategies could be negatively affected.
The markets for the products we manufacture in our Wood Products segment are highly competitive. Our competitors range from very large, fully integrated forest and building products firms to smaller firms that may manufacture only one or a few types of products. We also compete less directly with firms that manufacture substitutes for wood building products. Certain mills operated by our competitors may be lower-cost manufacturers than the mills operated by us.
13
The building products distribution industry that our Building Materials Distribution segment competes in is highly fragmented and competitive, and the barriers to entry for local competitors are relatively low. Competitive factors in our industry include pricing and availability of product, service and delivery capabilities, ability to assist customers with problem solving, extension of credit terms, customer relationships, geographic coverage, and breadth of product offerings. Also, financial stability is important to suppliers and customers in choosing distributors and allows for more favorable terms on which to obtain products from suppliers and sell products to customers. If our financial condition deteriorates in the future, our relationships with suppliers and customers may be negatively affected.
Some of the businesses with which we compete are part of larger companies and therefore have access to greater financial and other resources than we do. These resources may afford those competitors greater purchasing power, increased financial flexibility, and more capital resources for expansion and improvement, which may enable those competitors to compete more effectively than we can. In addition, certain suppliers to our distribution business also sell and distribute their products directly to our customers. Additional manufacturers of products distributed by us may elect to sell and distribute directly to our retail customers in the future or enter into exclusive supply arrangements with other distributors. Finally, we may not be able to maintain our costs at a level sufficiently low for us to compete effectively. If we are unable to compete effectively, our net sales and net income will be reduced.
A material disruption at one of our manufacturing facilities could prevent us from meeting customer demand, including the demand from our Building Materials Distribution business, reduce our sales, and/or negatively affect our financial results.
Any of our manufacturing facilities, or any of our machines within an otherwise operational facility, could cease operations unexpectedly due to a number of events, including but not limited to:
• | equipment failure, particularly a press at one of our major EWP production facilities; |
• | fires, floods, earthquakes, hurricanes, or other catastrophes; |
• | unscheduled maintenance outages; |
• | utility, information technology, telephonic, and transportation infrastructure disruptions; |
• | labor difficulties; |
• | other operational problems; or |
• | ecoterrorism or threats of ecoterrorism. |
Any downtime or facility damage could prevent us from meeting customer demand for our products and/or require us to make unplanned capital expenditures. If our machines or facilities were to incur significant downtime, our ability to satisfy customer requirements would be impaired, resulting in lower sales and net income.
Because approximately 52% of our Wood Products sales in 2017 were to our Building Materials Distribution business, a material disruption at our Wood Products facilities would also negatively affect our Building Materials Distribution business. We are therefore exposed to a larger extent to the risk of disruption to our Wood Products manufacturing facilities due to our vertical integration and the resulting impact on our Building Materials Distribution business.
In addition, a number of our suppliers are subject to the manufacturing facility disruption risks noted above. Our suppliers' inability to produce the necessary raw materials for our manufacturing processes or supply the finished goods that we distribute through our Building Materials Distribution segment may adversely affect our results of operations, cash flows, and financial position.
Our strategy includes pursuing acquisitions. We may be unable to efficiently integrate acquired operations or realize expected benefits from such acquisitions.
We may not be able to integrate the operations of acquired businesses in an efficient and cost-effective manner or without disruption to our existing operations or may not be able to realize expected benefits. Acquisitions involve significant risks and uncertainties, including some that may not be identifiable or resolvable in due diligence. Subsequent to making the investment, performance of the acquired assets is subject to economic uncertainties, as described in our other risk factors, as well as difficulties integrating acquired personnel into our business, the potential loss of key employees, customers, or
14
suppliers, difficulties in integrating different computer and accounting systems, exposure to unknown or unforeseen liabilities of acquired companies, and the diversion of management attention and resources from existing operations.
We acquired two EWP facilities in March 2016, one in Thorsby, Alabama, and one in Roxboro, North Carolina. At the time of our purchase, the Thorsby assets were operating well below normal rates of production and a significant portion of the assets at the Roxboro facility had been idled since 2010. The ramp-up of production at the Thorsby facility has proceeded as expected. However, although we have been able to restart the operations at Roxboro, manufacturing costs have been in excess of our expectations and we continue to incur operating losses at the facility. There is no assurance that we will be able to improve operating and financial performance at Roxboro, and we may not be able to realize the benefits we expected from its acquisition.
We continuously evaluate potential acquisitions and have in the past grown through acquisitions. In the future, we may be unable to successfully identify attractive potential acquisitions or effectively integrate potential acquisitions due to multiple factors, including those noted above, and potential issues related to regulatory review of the proposed transactions. We may also be required to incur additional debt in order to consummate acquisitions, which debt may be substantial and may limit our flexibility in using our cash flow from operations.
Our failure to integrate future acquired businesses effectively, realize expected benefits, or to manage other consequences of our acquisitions could adversely affect our financial condition, operating results, and cash flows.
If our long-lived assets, goodwill, and/or intangible assets become impaired, we may be required to record noncash impairment charges that could have a material impact on our results of operations.
We review the carrying value of long-lived assets for impairment when events or changes in circumstances indicate that the carrying amount of the assets may not be recoverable. We also test goodwill in each of our reporting units and intangible assets with indefinite lives for impairment annually in the fourth quarter or sooner if events or changes in circumstances indicate that the carrying value of the asset may exceed fair value. Factors such as lower than anticipated growth in single-family housing starts, loss of key customers, capacity additions by competitors, or changes in raw material or manufacturing costs that lead us to believe the long-lived asset will no longer provide a sufficient return on investment, could prompt decisions to curtail operations or to invest capital differently than expected. Any of these factors, among others, could result in noncash impairment charges in the future with respect to the investments we have completed and expect to complete, which could have a material impact on our results of operations in the period in which an impairment is recognized. For additional information and a discussion regarding the impact of impairment of long-lived assets on our results of operations and financial condition, see "Long-Lived Asset Impairment" included in "Critical Accounting Estimates" in "Item 7. Management's Discussion and Analysis of Financial Condition and Results of Operations" of this Form 10-K.
Labor disruptions, shortages of skilled and technical labor, or increased labor costs could adversely affect our business.
As of February 11, 2018, we had approximately 6,370 employees. Approximately 24% of these employees work pursuant to collective bargaining agreements. As of February 11, 2018, we had nine collective bargaining agreements. The agreement covering approximately 96 employees at our Canadian EWP facility expired on December 31, 2017, but has been extended indefinitely pending negotiations. We may not be able to renew this agreement or may renew it on terms that are less favorable to us than the current agreement. We could also experience a material labor disruption, strike, or significantly increased labor costs at one or more of our facilities, either in the course of negotiations of a labor agreement or otherwise. In addition, the ongoing recovery in the U.S. economy and our industry, when coupled with low unemployment rates, has made it difficult to acquire and retain the skilled labor necessary to successfully operate our facilities. Labor disruptions or shortages could prevent us from meeting customer demands or result in increased costs, thereby reducing our sales and profitability.
We may be unable to attract and retain key management and other key employees.
Our key managers are important to our success and may be difficult to replace because they have a significant amount of experience in wood products manufacturing and building materials distribution. While our senior management team has considerable experience, certain members of our management team are nearing or have reached retirement age. In addition, certain of our employees have assumed key roles in recent years and may not have the experience of retiring key managers. The failure to successfully formulate and implement succession plans for retiring employees, and training plans for new key managers, could result in inadequate depth of institutional knowledge or inadequate skill sets, which could adversely affect our business.
15
Our manufacturing operations may have difficulty obtaining wood fiber at favorable prices or at all.
Wood fiber is our principal raw material, which accounted for approximately 44% of the aggregate amount of materials, labor, and other operating expenses (excluding depreciation) for our Wood Products segment in 2017. Our primary source of wood fiber is logs. Log prices have been cyclical historically in response to changes in domestic and foreign demand and supply. In the future, we expect the level of foreign demand for log exports from the western U.S. to fluctuate based on the economic activity in China and other Pacific Rim countries, currency exchange rates, and the availability of log supplies from other countries such as Canada, Russia, and New Zealand. Sustained periods of high log costs may impair the cost competitiveness of our manufacturing facilities.
In our Pacific Northwest operations, a substantial portion of our logs are purchased from governmental authorities, including federal, state, and local governments. As a result, existing and future governmental regulation can affect our access to, and the cost of, such timber. Future domestic or foreign legislation and litigation concerning the use of timberlands, timber harvest methodologies, forest road construction and maintenance, the protection of endangered species, forest-based carbon sequestration, the promotion of forest health, and the response to and prevention of catastrophic wildfires can affect log and fiber supply from both government and private lands. Availability of harvested logs and fiber may be further limited by fire, insect infestation, disease, ice storms, windstorms, hurricanes, flooding, and other natural and man-made causes, thereby reducing supply and increasing prices. If we are unable to negotiate purchases for our log requirements in a particular region to satisfy our log needs at satisfactory prices or at all, which could include private purchases, open-market purchases, and purchases from governmental sources, it could have an adverse effect on our results of operations.
We also purchase OSB, which is used as the vertical web to assemble I-joists, from a supplier with multiple locations throughout North America. OSB accounted for approximately 7% of the aggregate amount of materials, labor, and other operating expenses (excluding depreciation) for our Wood Products segment in 2017. OSB is a commodity, and prices have been historically volatile in response to industry capacity restarts and operating rates, inventory levels in various distribution channels, and seasonal demand patterns. Sustained periods of high OSB costs lead to higher costs of our I-joist production.
Wood fiber also includes, to a lesser extent than OSB, lumber purchased from third parties for I-joist production at our Canadian EWP facility and for production at our laminated beam plant in Idaho. Lumber input costs are subject to similar commodity-based volatility characteristics noted above for OSB. In addition, our particleboard operation uses wood residuals from lumber operations, about half of which is purchased from third parties. Periods of low demand for lumber can negatively affect supply and pricing of wood residuals used at our particleboard facility.
A significant portion of our sales are concentrated with a small number of customers.
For the year ended December 31, 2017, our top ten customers represented approximately 35% of our sales. At December 31, 2017, receivables from two customers accounted for approximately 12% and 15% of total receivables. Although we believe that our relationships with our customers are strong, the loss of one or more of these customers could have a material adverse effect on our operating results, cash flow, and liquidity.
Adverse housing market conditions may increase the credit risk from our customers.
Our Building Materials Distribution and Wood Products segments extend credit to numerous customers who are generally susceptible to the same economic business risks as we are. Unfavorable housing market conditions could result in financial failures of one or more of our significant customers. Furthermore, we may not necessarily be aware of any deterioration in our customers' financial position. If our customers' financial positions become impaired, our ability to fully collect receivables from such customers could be impaired and negatively affect our operating results, cash flow, and liquidity.
Product shortages, loss of key suppliers, and our dependence on third-party suppliers and manufacturers could affect our financial health.
Our ability to offer a wide variety of products to our customers is dependent upon our ability to obtain adequate product supply from manufacturers and other suppliers. Generally, our products are obtainable from various sources and in sufficient quantities. However, the loss of, or a substantial decrease in the availability of, products from our suppliers or the loss of key supplier arrangements could adversely impact our financial condition, operating results, and cash flows.
Although in many instances we have agreements with our suppliers, these agreements are generally terminable by either party on limited notice. Failure by our suppliers to continue to supply us with products on commercially reasonable terms, or at all, could have a material adverse effect on our financial condition, operating results, and cash flows.
16
Cyber security risks related to the technology used in our operations and other business processes, as well as security breaches of company, customer, employee, and vendor information, could adversely affect our business.
We rely on various information technology systems to capture, process, store, and report data and interact with customers, vendors, and employees. The Company is continuously working to install new, and upgrade its existing, information technology systems and provide employee awareness training around phishing, malware, and other cyber risks to ensure that the Company is protected, to the greatest extent possible, against cyber risks and security breaches. Despite careful security and controls design, including independent third-party assessments, our information technology systems, and those of our third-party providers, have been subject to security breaches and cyber attacks. To date, none of the known security breaches or cyber attacks have had material adverse effects on our operations. However, in the future, network, system, and data breaches could result in misappropriation of sensitive data or operational disruptions, including interruption to systems availability and denial of access to and misuse of applications required by our customers to conduct business with us. In addition, sophisticated hardware and operating system software and applications that we procure from third parties may contain defects in design or manufacture, including "bugs" and other problems that could unexpectedly interfere with the operation of the systems. Misuse of internal applications; theft of intellectual property, trade secrets, or other corporate assets; and inappropriate disclosure of confidential information could stem from such incidents. Delayed sales, slowed production, or other repercussions resulting from these disruptions could result in lost sales, business delays, and negative publicity and could have a material adverse effect on our operations, financial condition, or cash flows.
Our operations require substantial capital, and recent significant capital investments and acquisitions have increased fixed costs, which could negatively affect our profitability.
In recent years, we have completed a number of capital investments, including the replacement or rebuild of veneer dryers and log utilization centers (or improvements to other manufacturing equipment), increasing our outdoor storage acreage, and leasing additional warehouse space. These capital investments, along with acquisitions, have resulted in increased fixed costs, which could negatively affect our profitability if the housing market does not continue to recover and revenues do not improve to offset our incremental fixed costs. Capital expenditures for expansion or replacement of existing facilities or equipment or to comply with future changes in environmental laws and regulations may be substantial. Although we maintain our production equipment with regular periodic and scheduled maintenance, we cannot guarantee that key pieces of equipment in our various manufacturing facilities will not need to be repaired or replaced or that we will not incur significant additional costs associated with environmental compliance. The costs of repairing or replacing such equipment and the associated downtime of the affected production line could have a material adverse effect on our financial condition, results of operations and cash flow. If for any reason we are unable to provide for our operating needs, capital expenditures, and other cash requirements on economic terms, we could experience a material adverse effect on our business, financial condition, results of operations, and cash flows.
We are subject to environmental regulation and environmental compliance expenditures, as well as other potential environmental liabilities.
Our businesses are subject to a wide range of general and industry-specific environmental laws and regulations, particularly with respect to air emissions, wastewater discharges, solid and hazardous waste management, and site remediation. Compliance with these laws and regulations is a significant factor in the operation of our businesses. Enactment of new environmental laws or regulations, including those aimed at addressing greenhouse gas emissions, or changes in existing laws or regulations might require us to make significant expenditures or restrict operations.
As an owner and operator of real estate, we may be liable under environmental laws for the cleanup of past and present spills and releases of hazardous or toxic substances on or from our properties and operations. We could be found liable under these laws whether or not we knew of, or were responsible for, the presence of such substances. In some cases, this liability may exceed the value of the property itself.
We may be unable to generate funds or other sources of liquidity and capital to fund unforeseen environmental liabilities or expenditures to the extent we are not indemnified by third parties. For example, in connection with prior transactions, certain third parties are generally obligated to indemnify us for hazardous substance releases and other environmental violations that occurred prior to such transactions. However, these third parties may not have sufficient funds to fully satisfy their indemnification obligations when required, and in some cases, we may not be contractually entitled to indemnification by them. For additional information on how environmental regulation and compliance affects our business, see "Environmental" in "Item 7. Management's Discussion and Analysis of Financial Condition and Results of Operations" of this Form 10-K.
17
Significant changes in discount rates, actual investment return on pension assets, and other factors could affect our earnings, equity, and pension contributions in future periods.
Our earnings may be negatively affected by the amount of expense we record for our pension plans. Generally accepted accounting principles (GAAP) require that we calculate expense for the plans using actuarial valuations. These valuations reflect assumptions relating to financial market and other economic conditions. Changes in key economic indicators can change the assumptions. The most significant assumptions used to estimate pension expense are the discount rate and the expected long-term rate of return on plan assets. In addition, we are required to make an annual measurement of plan assets and liabilities, which may result in a significant change to equity through a reduction or increase to "Accumulated other comprehensive loss." Our pension plan liabilities are sensitive to changes in interest rates. As interest rates decrease, the present value of our liabilities increases, potentially increasing pension expense and funding requirements. A decline in the market value of the pension assets could also increase our pension expense and funding requirements. Changes in demographics, including increased numbers of retirements or changes in life expectancy assumptions, may also increase the funding requirements of the obligations related to the pension plans. At December 31, 2017, the net underfunded status of our defined benefit pension plans was $61.3 million. If the status of our defined benefit plans continues to be underfunded, we anticipate significant future funding obligations, reducing the cash available for our business. For more discussion regarding how our financial statements can be affected by pension plan estimates, see "Pensions" included in "Critical Accounting Estimates" in "Item 7. Management's Discussion and Analysis of Financial Condition and Results of Operations" of this Form 10-K.
We depend on third parties for transportation services and limited availability or increases in costs of transportation could adversely affect our business and operations.
Our business depends on the transportation of a large number of products, via railroad or truck. We rely primarily on third parties for transportation of the products we manufacture or distribute and for the delivery of our raw materials. In addition, we are subject to seasonal capacity constraints and weather related delays for both rail and truck transportation.
If any of our third-party transportation providers were to fail to deliver the goods we manufacture or distribute in a timely manner, we may be unable to sell those products at full value. Similarly, if any of these providers were to fail to deliver raw materials to us in a timely manner, we may be unable to manufacture our products in response to customer demand. In addition, if any of these third parties were to cease operations or cease doing business with us, we may be unable to replace them at reasonable cost.
Any failure of a third-party transportation provider to deliver raw materials or finished products in a timely manner could harm our reputation, negatively affect our customer relationships, and have a material adverse effect on our operating results, cash flows, and financial condition.
In addition, an increase in transportation rates or fuel surcharges could adversely affect our sales, profitability, and cash flows.
The nature of our business exposes us to product liability, product warranty, casualty, manufacturing and construction defects, and other claims.
We may be involved in product liability, product warranty, casualty, manufacturing and construction defects, and other claims relating to the products we manufacture and distribute, and services we provide that could adversely affect our financial condition, operating results, and cash flows. We rely on manufacturers and other suppliers to provide us with many of the products we sell and distribute. Because we do not have direct control over the quality of such products manufactured or supplied by such third-party suppliers, we are exposed to risks relating to the quality of such products. In addition, we are exposed to potential claims arising from the conduct of our employees, and homebuilders and their subcontractors, for which we may be contractually liable. Although we currently maintain what we believe to be suitable and adequate insurance in excess of our self-insured amounts, there can be no assurance that we will be able to maintain such insurance on acceptable terms or that such insurance will provide adequate protection against potential liabilities. Product liability, product warranty, casualty, construction defect, and other claims can be expensive to defend and can divert the attention of management and other personnel for significant periods, regardless of the ultimate outcome. Claims of this nature could also have a negative impact on customer confidence in our products and our company. We cannot assure that any current or future claims will not adversely affect our financial condition, operating results, and cash flows.
18
Some of our products are vulnerable to declines in demand due to competing technologies or materials, as well as changes in building code provisions.
Our products may compete with alternative products in certain market segments. For example, plastic, concrete, steel, wood/plastic or composite materials may be used by builders as alternatives to the products produced by our Wood Products segment such as EWP, plywood, and lumber. Changes in prices for oil, chemicals, and wood-based fiber can change the competitive position of our products relative to available alternatives and could increase substitution of those products for our products. As the use of these alternatives grows, demand for our products may decline.
Our principal manufactured products are also subject to substitution from other wood-based products, such as EWP facing competition from numerous dimension lumber producers and other strand based EWP that we don't produce or plywood losing further market share to OSB in residential and non-residential applications.
In addition, building code provisions have been implemented in certain jurisdictions to address concerns for fire fighter safety related to the collapse of floors during residential fires. The I-joists that we manufacture are subject to this code change. As local jurisdictions adopt the new code, conventional I-joists will be competitively disadvantaged in houses that are built with ground floors over unfinished basements and could be subject to substitution by dimension lumber or other products.
Our ability to service our indebtedness or to fund our other liquidity needs is subject to various risks.
Our ability to make scheduled payments on our indebtedness and fund other liquidity needs depends on and is subject to our financial and operating performance, which in turn is affected by general and regional economic, financial, competitive, business, and other factors, including the availability of financing in the banking and capital markets as well as the other risks described herein. In particular, demand for our products correlates to a significant degree to the level of residential construction activity in North America, which historically has been characterized by significant cyclicality.
We cannot guarantee that our business will generate sufficient cash flows from operations or that future borrowings will be available to us at a cost or in an amount sufficient to enable us to service our debt or to fund our other liquidity needs. If we are unable to service our debt obligations or to fund our other liquidity needs, we could be forced to curtail our operations, reorganize our capital structure, or liquidate some or all of our assets.
The terms of our debt agreements restrict, and covenants contained in agreements governing indebtedness in the future may impose, significant operating and financial restrictions on our company and our subsidiaries, which may prevent us from capitalizing on business opportunities.
Our debt agreements contain, and any future indebtedness of ours may contain, a number of restrictive covenants that impose customary operating and financial restrictions on us. Our debt agreements limit our ability and the ability of our restricted subsidiaries, among other things, to:
• | incur additional debt; |
• | declare or pay dividends, redeem stock, or make other distributions to stockholders; |
• | make investments; |
• | create liens or use assets in security in other transactions; |
• | merge or consolidate, or sell, transfer, lease, or dispose of substantially all of our assets; |
• | enter into transactions with affiliates; |
• | sell or transfer certain assets; and |
• | in the case of our revolving credit facility, make prepayments on our senior notes and subordinated indebtedness. |
In addition, our revolving credit facility provides that if an event of default occurs or excess availability under our revolving credit facility drops below a threshold amount equal to the greater of 10% of the aggregate commitments under our revolving credit facility or $37 million (and until such time as excess availability for two consecutive fiscal months exceeds that threshold amount and no event of default has occurred and is continuing), we will be required to maintain a monthly minimum fixed charge coverage ratio of 1.0:1.0, determined on a trailing twelve-month basis.
19
Our failure to comply with any of these covenants could result in an event of default which, if not cured or waived, could result in the acceleration of all of our indebtedness.
Risks Relating to Ownership of Our Common Stock
The price of our common stock may fluctuate significantly.
Volatility in the market price of our common stock may prevent a stockholder from being able to sell shares at or above the price paid for them. The market price for our common stock could fluctuate significantly for various reasons, including:
•our operating and financial performance and prospects;
•our quarterly or annual earnings or those of other companies in our industry;
• | the public's reaction to our press releases, our other public announcements, and our filings with the Securities and Exchange Commission (SEC); |
• | changes in key personnel; |
• | strategic actions by us, our customers, or our competitors, such as acquisitions or restructurings; |
• | changes in, or failure to meet, earnings estimates or recommendations by research analysts who track our common stock or the stock of other companies in our industry; |
• | the failure of research analysts to cover our common stock; |
• | general economic, industry, and market conditions; |
• | new laws or regulations or new interpretations of existing laws or regulations applicable to our business; |
• | material litigation or government investigations; |
• | changes in general conditions in the U.S. and global economies or financial markets, including those resulting from war, incidents of terrorism, or responses to such events; |
• | sales of common stock by us or members of our management team; |
• | the granting of equity or equity-based incentives; |
• | volume of trading in our common stock (which may be impacted by future sales or repurchases of our common stock); |
• | changes in accounting standards, policies, guidance, interpretations, or principles; and |
• | the impact of the facts described elsewhere in "Item 1A. Risk Factors" of this Form 10-K. |
In addition, the stock market has regularly experienced significant price and volume fluctuations. This volatility has had a significant impact on the market price of securities issued by many companies, including companies in our industry. The changes frequently appear to occur without regard to the operating performance of the affected companies. Hence, the price of our common stock could fluctuate based upon factors that have little or nothing to do with us, and these fluctuations could materially reduce our share price.
We may not pay cash dividends in the future.
In November 2017, our board of directors approved a dividend policy pursuant to which we expect to pay quarterly cash dividends to holders of our common stock. Pursuant to this policy, the board of directors declared dividends in November 2017 and February 2018. However, the future declaration and payment of dividends will continue to be at the discretion of our board of directors and the dividend policy may be suspended or canceled at its discretion at any time. Declaration of future dividends will depend upon legal capital requirements and surplus, our future operations and earnings, general financial condition, contractual obligations, restrictions imposed by our asset-based credit facility, term loan, and the indenture governing our senior notes, applicable laws, and other factors that our board of directors may deem relevant. Unless we continue to pay cash dividends on our common stock in the future, the success of an investment in our common stock will
20
depend entirely upon its further appreciation. Our common stock may not appreciate in value or even maintain the price at which it was purchased.
Certain provisions of our organizational documents and other contractual provisions may make it difficult for stockholders to change the composition of our board of directors and may discourage hostile takeover attempts that some of our stockholders may consider to be beneficial.
Certain provisions of our certificate of incorporation and bylaws may have the effect of delaying or preventing changes in control if our board of directors in exercising its duty of care determines that such changes in control are not in the best interests of the company and our stockholders. The provisions in our certificate of incorporation and bylaws include, among other things, the following:
•a classified board of directors with three-year staggered terms;
• | the ability of our board of directors to issue shares of preferred stock and to determine the price and other terms, including preferences and voting rights, of those shares without stockholder approval; |
• | stockholder action can only be taken at a special or regular meeting and not by written consent; |
• | advance notice procedures for nominating candidates to our board of directors or presenting matters at stockholder meetings; |
• | removal of directors only for cause; |
• | allowing only our board of directors the ability to create additional director seats and fill vacancies on our board of directors; and |
• | super-majority voting requirements to amend our bylaws and certain provisions of our certificate of incorporation. |
We have elected in our certificate of incorporation not to be subject to Section 203 of the General Corporation Law of the State of Delaware (DGCL), an antitakeover law. However, our certificate of incorporation contains provisions that have the same effect as Section 203. These provisions prohibit a publicly held Delaware corporation from engaging in a business combination, such as a merger, with a person or group owning 15% or more of the corporation's voting stock for a period of three years following the date the person became an interested stockholder, unless (with certain exceptions) the business combination or the transaction in which the person became an interested stockholder is approved in a prescribed manner.
While these provisions have the effect of encouraging persons seeking to acquire control of our company to negotiate with our board of directors, they could enable the board of directors to hinder or frustrate a transaction that some, or a majority, of the stockholders might believe to be in their best interests and, in that case, may prevent or discourage attempts to remove and replace incumbent directors.
These provisions may frustrate or prevent any attempts by our stockholders to replace or remove our current management by making it more difficult for stockholders to replace members of our board of directors, which is responsible for appointing the members of our management.
Failure to establish and maintain effective internal controls in accordance with Section 404 of the Sarbanes-Oxley Act could have a material adverse effect on our business and stock price.
We are subject to the SEC's rules implementing Section 302 and 404 of the Sarbanes-Oxley Act, which require management to certify financial and other information in our quarterly and annual reports and provide an annual management report on the effectiveness of controls over financial reporting. In addition, we are required to disclose changes made in our internal controls and procedures on a quarterly basis, as well as perform an assessment of our internal control over financial reporting pursuant to Section 404 of the Sarbanes-Oxley Act. Testing and maintaining internal control could divert our management's attention from other matters that are important to the operation of our business.
Our independent registered public accounting firm is also required to attest to the effectiveness of our internal controls over financial reporting and may issue a report that is adverse in the event it is not satisfied with the level at which our controls are documented, designed, or operating.
21
If we are unable to conclude that we have effective internal control over financial reporting, our independent registered public accounting firm is unable to provide us with an unqualified report as required by Section 404 of the Sarbanes-Oxley Act, or we are required to restate our financial statements, we may fail to meet our public reporting obligations and investors could lose confidence in our reported financial information, which could have a negative effect on the trading price of our common stock.
ITEM 1B. UNRESOLVED STAFF COMMENTS
We have no unresolved comments from the Commission staff.
ITEM 2. PROPERTIES
Our properties are well-maintained and are suitable for the operations for which they are used. Information concerning production capacity and the utilization of our manufacturing facilities is presented in "Item 1. Business" of this Form 10-K.
The following is a list of our facilities by segment as of February 16, 2018. We lease office space for our corporate headquarters in Boise, Idaho.
Wood Products
We own all of our Wood Products manufacturing facilities. The following table summarizes our Wood Products facilities as of February 16, 2018:
Facility Type | Number of Facilities | Locations | ||
Plywood and veneer plants | 9 | Louisiana (2), North Carolina, Oregon (4), South Carolina, and Washington | ||
LVL/I-joist/laminated beam plants | 6 | Alabama, Louisiana, North Carolina, Oregon, Idaho, and Canada | ||
Sawmills | 5 | Oregon (3) and Washington (2) | ||
Particleboard plant | 1 | Oregon | ||
Building Materials Distribution
We lease and own properties in our Building Materials Distribution business. Substantially all of our leases are noncancelable and accounted for as operating leases. These leases are not subject to early termination except for standard nonperformance clauses. The following table summarizes our 34 Building Materials Distribution facilities as of February 16, 2018:
22
Location | Owned or Leased | Approximate Warehouse Square Footage | |||
Phoenix, Arizona | Owned | 33,000 | |||
Lathrop, California | Leased | 164,000 | |||
Riverside, California | Leased | 162,000 | |||
Denver, Colorado | Owned | 230,000 | |||
Grand Junction, Colorado | Owned/Leased | 97,000 | |||
Milton, Florida | Leased | 99,000 | |||
Orlando, Florida | Owned | 144,000 | |||
Pompano Beach, Florida | Leased | 112,400 | |||
Auburn, Georgia | Leased | 214,000 | |||
Boise, Idaho | Owned/Leased | 159,000 | |||
Idaho Falls, Idaho | Owned/Leased | 69,000 | |||
Pontoon Beach, Illinois | Leased | 21,000 | |||
Rochelle, Illinois | Leased | 170,000 | |||
Saco, Maine (a) | Leased | 59,000 | |||
Baltimore, Maryland | Leased | 247,000 | |||
Westfield, Massachusetts | Leased | 207,000 | |||
Wayne, Michigan | Leased | 108,000 | |||
Lakeville, Minnesota | Leased | 144,000 | |||
Lee's Summit, Missouri | Leased | 27,000 | |||
Billings, Montana | Owned | 81,000 | |||
Greenland, New Hampshire | Owned/Leased | 166,000 | |||
Delanco, New Jersey | Owned/Leased | 93,000 | |||
Albuquerque, New Mexico | Leased | 68,000 | |||
Greensboro, North Carolina | Leased | 157,000 | |||
Marion, Ohio | Leased | 95,000 | |||
Tulsa, Oklahoma | Owned | 129,000 | |||
Memphis, Tennessee | Owned | 78,000 | |||
Dallas, Texas | Owned/Leased | 233,000 | |||
Sugar Land, Texas | Leased | 203,000 | |||
Salt Lake City, Utah | Leased | 126,000 | |||
Spokane, Washington | Owned/Leased | 59,000 | |||
Vancouver, Washington | Leased | 86,000 | |||
Woodinville, Washington | Owned/Leased | 110,000 | |||
Yakima, Washington | Owned/Leased | 44,000 | |||
_______________________________________
(a) Truss manufacturing plant.
ITEM 3. LEGAL PROCEEDINGS
We are a party to legal proceedings that arise in the ordinary course of our business, including commercial liability claims, premises claims, environmental claims, and employment-related claims, among others. As of the date of this filing, we believe it is not reasonably possible that any of the legal actions against us will, individually or in the aggregate, have a material adverse effect on our financial position, results of operations, or cash flows.
ITEM 4. MINE SAFETY DISCLOSURES
Not applicable.
23
PART II
ITEM 5. MARKET FOR REGISTRANT'S COMMON EQUITY, RELATED STOCKHOLDER MATTERS, AND ISSUER PURCHASES OF EQUITY SECURITIES
Market Price of Our Common Stock
The following table sets forth the high and low sales prices of our common stock for 2017 and 2016 as reported by the NYSE:
High Sale Price | Low Sale Price | Dividends Paid Per Share | |||||||||
2017 | |||||||||||
Fourth Quarter | $ | 40.95 | $ | 33.85 | $ | 0.07 | |||||
Third Quarter | $ | 35.80 | $ | 27.60 | $ | — | |||||
Second Quarter | $ | 33.40 | $ | 26.25 | $ | — | |||||
First Quarter | $ | 28.70 | $ | 22.63 | $ | — | |||||
2016 | |||||||||||
Fourth Quarter | $ | 25.69 | $ | 17.80 | $ | — | |||||
Third Quarter | $ | 29.95 | $ | 21.11 | $ | — | |||||
Second Quarter | $ | 23.60 | $ | 20.07 | $ | — | |||||
First Quarter | $ | 25.46 | $ | 13.80 | $ | — | |||||
On February 16, 2018, there were 38,586,272 shares of our common stock outstanding, held by 13 stockholders of record, one of which was Cede & Co., which is the nominee of The Depository Trust Company. On February 16, 2018, the closing price of our common stock was $43.90.
Dividends
During the fourth quarter of 2017, our board of directors approved a dividend policy to pay quarterly cash dividends to holders of our common stock. Pursuant to such policy, our board of directors declared an initial dividend of $0.07 per share of our common stock, which was paid on December 15, 2017 to stockholders of record on November 27, 2017. Future quarterly dividend declarations, including amount per share, record date and payment date, will be made at the discretion of our board of directors and will depend upon, among other things, legal capital requirements and surplus, our future operations and earnings, general financial condition, contractual obligations, restrictions imposed by our asset-based credit facility, term loan, and the indenture governing our senior notes, applicable laws, and other factors that our board of directors may deem relevant. For a description of the restrictions in our asset-based credit facility, term loan, and the indenture governing our senior notes on our ability to pay dividends, see Note 7, Debt, of the Notes to Consolidated Financial Statements in "Item 8. Financial Statements and Supplementary Data" of this Form 10-K. The dividend policy may be suspended or canceled at the discretion of the board of directors at any time. We did not declare or pay any cash dividends on our common stock during the year ended December 31, 2016.
Performance Graph
The following graph compares the return on a $100 investment in our common stock on February 6, 2013 (the day we first began trading on the NYSE as Boise Cascade Company) with a $100 investment also made on February 6, 2013, in the S&P SmallCap 600 Index and in our peer group. The companies included in our peer group are Louisiana-Pacific Corporation, BlueLinx Holdings Inc., Universal Forest Products, Inc., Builders FirstSource, Inc., and Norbord Inc. The information in the graph below and table above is not "soliciting material," is not deemed "filed" with the SEC, and is not to be incorporated by reference in any of our filings under the Securities Act of 1933, as amended, or the Securities Exchange Act of 1934, as amended, whether made before or after the date of this Annual Report on Form 10-K, except to the extent that we specifically incorporate such information by reference. The stock performance shown below is not necessarily indicative of future performance.
24
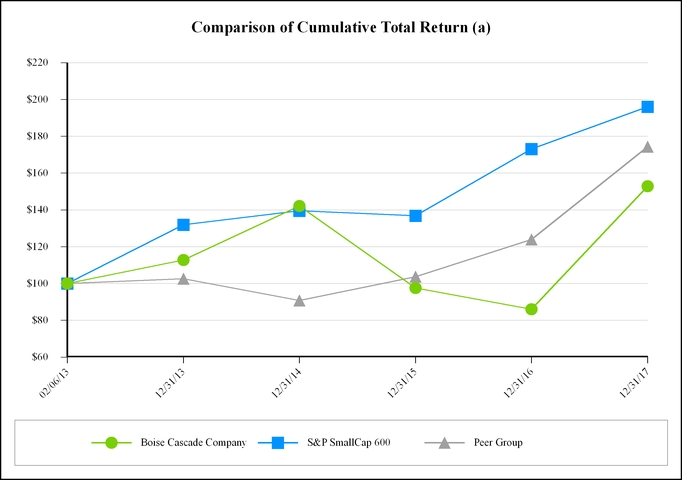
___________________________________
(a) | $100 invested in stock or index on February 6, 2013, including reinvestment of dividends in additional shares of the same class of equity securities. |
Unregistered Sales of Equity Securities
We did not sell any unregistered securities from January 1, 2015, through December 31, 2017.
Purchases of Equity Securities by the Issuer and Affiliated Purchasers
On February 25, 2015, our Board of Directors authorized a common stock repurchase program (Program), which allows us to purchase up to two million shares of our common stock, on an opportunistic basis, through open market transactions, privately negotiated transactions, or accelerated share repurchase transactions. As of December 31, 2017, there were 696,989 shares of common stock that may yet be purchased under the Program. We did not repurchase any shares of our common stock during the three months ended December 31, 2017.
25
ITEM 6. | SELECTED FINANCIAL DATA |
The following table sets forth our selected financial data for the periods indicated and should be read in conjunction with the disclosures in "Item 7. Management's Discussion and Analysis of Financial Condition and Results of Operations" and "Item 8. Financial Statements and Supplementary Data" of this Form 10-K.
Year Ended December 31 | ||||||||||||||||||||
2017 (a) | 2016 (b) | 2015 | 2014 | 2013 (c) | ||||||||||||||||
(millions, except per-share data) | ||||||||||||||||||||
Consolidated statement of operations data | ||||||||||||||||||||
Sales | $ | 4,432 | $ | 3,911 | $ | 3,633 | $ | 3,574 | $ | 3,273 | ||||||||||
Net income | $ | 83 | $ | 38 | $ | 52 | $ | 80 | $ | 117 | ||||||||||
Net income per common share – diluted | $ | 2.12 | $ | 0.98 | $ | 1.33 | $ | 2.03 | $ | 2.91 | ||||||||||
Earnings before interest, taxes, depreciation, and amortization (EBITDA) (d) | $ | 223 | $ | 142 | $ | 158 | $ | 197 | $ | 136 | ||||||||||
Adjusted EBITDA (d) | $ | 222 | $ | 153 | $ | 158 | $ | 197 | $ | 136 | ||||||||||
Cash dividends declared per common share | $ | 0.07 | $ | — | $ | — | $ | — | $ | — | ||||||||||
Balance sheet data (at end of year) | ||||||||||||||||||||
Cash and cash equivalents | $ | 177 | $ | 104 | $ | 184 | $ | 164 | $ | 118 | ||||||||||
Working capital, excluding cash and cash equivalents (e) | $ | 374 | $ | 344 | $ | 342 | $ | 335 | $ | 312 | ||||||||||
Total assets (f) | $ | 1,607 | $ | 1,439 | $ | 1,249 | $ | 1,213 | $ | 1,096 | ||||||||||
Total long-term debt (f) | $ | 438 | $ | 438 | $ | 345 | $ | 294 | $ | 293 | ||||||||||
_______________________________________
(a) | In 2017, net income includes an $8.1 million income tax benefit associated with the remeasurement of our deferred tax assets and liabilities at the new federal corporate income tax rate of 21% as of December 22, 2017 (date of enactment of the Tax Cuts and Jobs Act). For more information, see Note 3, Income Taxes, of the Notes to Consolidated Financial Statements in "Item 8. Financial Statements and Supplementary Data" of this Form 10-K. |
(b) | The following items impacted 2016 net income: |
• | $8.5 million of income tax benefit primarily associated with the reversal of a valuation allowance on foreign deferred tax assets, net of other tax adjustments. For more information, see Note 3, Income Taxes, of the Notes to Consolidated Financial Statements in "Item 8. Financial Statements and Supplementary Data" of this Form 10-K. |
• | $14.3 million pre-tax loss on extinguishment of debt. For more information, see Note 7, Debt, of the Notes to Consolidated Financial Statements in "Item 8. Financial Statements and Supplementary Data" of this Form 10-K. |
• | $3.9 million pre-tax settlement expense associated with voluntary lump-sum payments to pension plan participants. For more information, see Note 9, Retirement and Benefit Plans, of the Notes to Consolidated Financial Statements in "Item 8. Financial Statements and Supplementary Data" of this Form 10-K. |
At December 31, 2016, total assets include the EWP facilities located in Thorsby, Alabama, and Roxboro, North Carolina, we acquired in March 2016, for an aggregate purchase price of $215.9 million. For more information, see Note 5, Acquisitions, of the Notes to Consolidated Financial Statements in "Item 8. Financial Statements and Supplementary Data" of this Form 10-K.
(c) | In 2013, net income includes a $68.7 million income tax benefit associated with the recording of net deferred tax assets upon our conversion to a corporation. |
At December 31, 2013, total assets include the facilities in Chester, South Carolina, and Moncure, North Carolina, we acquired in September 2013, for an aggregate purchase price of $103.0 million.
26
(d) The following table reconciles net income to EBITDA and Adjusted EBITDA for the periods indicated:
Year Ended December 31 | ||||||||||||||||||||
2017 | 2016 | 2015 | 2014 | 2013 | ||||||||||||||||
(millions) | ||||||||||||||||||||
Net income | $ | 83 | $ | 38 | $ | 52 | $ | 80 | $ | 117 | ||||||||||
Interest expense | 25 | 27 | 23 | 22 | 20 | |||||||||||||||
Interest income | (1 | ) | — | — | — | — | ||||||||||||||
Income tax provision (benefit) | 35 | 5 | 29 | 43 | (39 | ) | ||||||||||||||
Depreciation and amortization | 80 | 73 | 56 | 51 | 38 | |||||||||||||||
EBITDA | 223 | 142 | 158 | 197 | 136 | |||||||||||||||
Change in fair value of interest rate swaps | (1 | ) | (4 | ) | — | — | — | |||||||||||||
Loss on extinguishment of debt | — | 14 | — | — | — | |||||||||||||||
Adjusted EBITDA | $ | 222 | $ | 153 | $ | 158 | $ | 197 | $ | 136 | ||||||||||
We define EBITDA as income before interest (interest expense and interest income), income taxes, and depreciation and amortization. Additionally, we disclose Adjusted EBITDA, which further adjusts EBITDA to exclude the change in fair value of interest rate swaps and loss on extinguishment of debt.
We believe EBITDA and Adjusted EBITDA are meaningful measures because they present a transparent view of our recurring operating performance and allow management to readily view operating trends, perform analytical comparisons, and identify strategies to improve operating performance. We also believe EBITDA and Adjusted EBITDA are useful to investors because they provide a means to evaluate the operating performance of our segments and our Company on an ongoing basis using criteria that are used by our management and because they are frequently used by investors and other interested parties when comparing companies in our industry that have different financing and capital structures and/or tax rates. EBITDA and Adjusted EBITDA, however, are not measures of our liquidity or financial performance under generally accepted accounting principles (GAAP) and should not be considered as alternatives to net income, income from operations, or any other performance measure derived in accordance with GAAP or as alternatives to cash flow from operating activities as a measure of our liquidity. The use of EBITDA and Adjusted EBITDA instead of net income or segment income (loss) have limitations as analytical tools, including the inability to determine profitability; the exclusion of interest expense, interest income, and associated significant cash requirements; and the exclusion of depreciation and amortization, which represent unavoidable operating costs. Management compensates for these limitations by relying on our GAAP results. Our measures of EBITDA and Adjusted EBITDA are not necessarily comparable to other similarly titled captions of other companies due to potential inconsistencies in the methods of calculation.
(e) | As of December 31, 2015, we retrospectively adopted Accounting Standards Update (ASU) 2015-17, Balance Sheet Classification of Deferred Taxes, by reclassifying previously reported current deferred tax assets as noncurrent on the balance sheet. This reclassification resulted in a reduction of working capital, as previously reported, of $20 million and $18 million as of December 31, 2014 and 2013, respectively. |
(f) | As of December 31, 2015, we retrospectively adopted ASU 2015-03, Simplifying the Presentation of Debt Issuance Costs, by reclassifying previously reported deferred financing costs as a direct deduction from the related debt liability rather than as an asset. This reclassification resulted in a reduction of total assets and total long-term debt, as previously reported, of $7 million and $8 million, respectively, as of December 31, 2014, and 2013. |
ITEM 7. | MANAGEMENT'S DISCUSSION AND ANALYSIS OF FINANCIAL CONDITION AND RESULTS OF OPERATIONS |
Understanding Our Financial Information
This Management's Discussion and Analysis of Financial Condition and Results of Operations should be read in conjunction with our consolidated financial statements and related notes and other financial information appearing elsewhere in this Form 10-K. The following discussion includes statements that are forward-looking statements and are based on the beliefs of our management, as well as assumptions made by, and information currently available to, our management. Actual results could differ materially from those discussed in or implied by forward-looking statements as a result of various factors, including those discussed below and elsewhere in this Annual Report on Form 10-K, particularly in the section entitled "Cautionary Statement Concerning Forward-Looking Statements" and in Item 1A. "Risk Factors." References to "fiscal year" or "fiscal" refer to our fiscal year ending on December 31 in each calendar year.
27
Overview
Company Background
Boise Cascade is a large, vertically-integrated wood products manufacturer and building materials distributor with widespread operations throughout the United States (U.S.) and one manufacturing facility in Canada. We completed an initial public offering of our common stock on February 11, 2013. We have two reportable segments: (i) Wood Products, which manufactures engineered wood products (EWP), plywood, ponderosa pine lumber, studs, and particleboard; and (ii) Building Materials Distribution (BMD), which is a wholesale distributor of building materials. For more information, see Note 14, Segment Information, of the Notes to Consolidated Financial Statements in "Item 8. Financial Statements and Supplementary Data" and "Item 1. Business" of this Form 10-K. Our broad line of products is used primarily in new residential construction, residential repair-and-remodeling projects, light commercial construction, and industrial applications. We have a broad base of more than 4,500 customers, which includes a diverse mix of retail lumberyards, home improvement centers, leading wholesalers, specialty distributors, and industrial converters. Our Wood Products and BMD segments are vertically-integrated from wood procurement through distribution. During 2017, approximately 52% of our Wood Products segment sales were to our BMD segment. In 2017, approximately 71%, 31%, and 7% of our Wood Product segment's EWP, plywood, and lumber sales volumes, respectively, were to our BMD segment.
Executive Summary
We recorded income from operations of $141.2 million during the year ended December 31, 2017, compared with $79.6 million during the same period in the prior year. In our Wood Products segment, income increased by $27.7 million to $53.6 million for the year ended December 31, 2017, from $25.9 million in 2016. The increase was due primarily to higher plywood, lumber, and EWP sales prices, offset partially by higher OSB costs used in the manufacture of I-joists and higher per-unit conversion costs. In addition, depreciation and amortization expense increased $5.6 million due primarily to the acquisition of two EWP facilities on March 31, 2016, and other capital expenditures. In our BMD segment, income improved $32.4 million to $116.8 million for the year ended December 31, 2017, from $84.4 million for the year ended December 31, 2016, driven primarily by a higher gross margin of $65.1 million generated from a sales increase of 17%. This improvement was offset partially by increased selling and distribution expenses of $28.2 million. These changes are discussed further in "Our Operating Results" below.
We ended 2017 with $177.1 million of cash and cash equivalents and $438.3 million of debt. At December 31, 2017, we had $379.8 million of unused committed bank line availability. We generated $73.2 million of cash during the year ended December 31, 2017, as cash provided by operations was offset partially by capital spending. A further description of our cash sources and uses for the comparative periods are discussed in "Liquidity and Capital Resources" below.
As in recent years, we expect to continue to experience modest demand growth for the products we manufacture and distribute in 2018. Total housing starts in the U.S. continue to show modest improvement, with single-family starts growth offsetting weakness in multi-family starts in 2017. We remain optimistic that the improvement in demand for our products will continue as household formation rates and residential construction continue to recover. We will continue to manage our production levels to our sales demand, which will likely result in operating some of our facilities below their capacity until demand further improves. Future commodity product pricing could be volatile in response to industry operating rates, net import and export activity, the North American softwood lumber trade dispute, inventory levels in various distribution channels, and seasonal demand patterns.
Factors That Affect Our Operating Results and Trends
Our results of operations and financial performance are influenced by a variety of factors, including: (i) the commodity nature of the products we manufacture and distribute; (ii) general economic and industry conditions affecting demand; and (iii) cost and availability of raw materials, including wood fiber and glues and resins. These factors have historically produced cyclicality in our results of operations, and we expect this cyclicality to continue in future periods.
28
Commodity Nature of Our Products
Many of the building products we manufacture or distribute, including oriented strand board (OSB), plywood, lumber, and particleboard, are commodities that are widely available from other manufacturers or distributors with prices and volumes determined frequently in an auction market based on buyers' and sellers' perceptions of short-term supply and demand factors. At times, the price for any one or more of the products we produce or distribute may fall below our cash production or purchase costs, requiring us to either incur short-term losses on product sales or cease production at one or more of our manufacturing facilities. As a result, our profitability with respect to these commodity products depends, in significant part, on effective facilities maintenance programs, and on managing our cost structure, particularly raw materials and labor, which represent the largest components of our operating costs. Composite structural panel and lumber prices have been historically volatile. Future commodity product prices could be volatile in response to industry operating rates, net import and export activity, the North American softwood lumber trade dispute, inventory levels in various distribution channels, and seasonal demand patterns.
The following table provides changes in the average composite panel, including certain panel subcategories, and average composite lumber prices as reflected by Random Lengths, an industry publication, for the periods noted below:
Year Ended December 31 | |||||
2017 versus 2016 | 2016 versus 2015 | 2015 versus 2014 | |||
Increase (decrease) in composite panel prices | 18% | 1% | (5)% | ||
Increase (decrease) in Western Fir plywood prices | 12% | (6)% | (4)% | ||
Increase (decrease) in Southern Pine plywood prices | 10% | (11)% | (6)% | ||
Increase (decrease) in OSB prices | 32% | 29% | (8)% | ||
Increase (decrease) in composite lumber prices | 19% | 4% | (14)% | ||
In our Wood Products segment, we manufacture plywood, but not OSB, and therefore our reported prices may not trend with the overall composite panel price index. Our BMD segment purchases and resells a broad mix of commodity products with periods of increasing prices providing the opportunity for higher sales and increased margins, while declining price environments may result in declines in sales and profitability. For further discussion of the impact of commodity prices on historical periods, see "Our Operating Results" in this Management's Discussion and Analysis of Financial Condition and Results of Operations.
General Economic and Industry Conditions Affecting Demand
The level of housing starts is especially important to our results of operations. As of February 2018, the Blue Chip Economic Indicators consensus forecast for 2018 single- and multi-family housing starts in the U.S. was approximately 1.28 million units, compared with actual housing starts of 1.20 million in 2017 and 1.17 million in 2016, as reported by the U.S. Census Bureau. New residential construction activity has historically been volatile with demand influenced by several economic conditions, including domestic population growth, immigration rates, residential vacancy and foreclosure rates, demand for second homes, and existing home prices. We believe U.S. demographics are supportive of further recovery in housing starts, although we expect only modest residential construction growth due to constraints faced by builders, such as availability of labor and building lots. The pace of household formation rates and residential repair-and-remodeling activity will also be affected by continued employment growth, wage growth, prospective home buyers' access to financing, improved consumer confidence, as well as other factors. Improved household formation rates in turn will help stimulate new construction. In addition, we have expanded our market position in EWP in recent years and further increases in EWP demand will be highly influenced by the ongoing recovery in single-family housing starts.
Industry supply for the products we produce and distribute is influenced primarily by price-induced changes in the operating rates of existing facilities, but is also influenced over time by the introduction of new product technologies, capacity additions and closures, restart of idled capacity, and log availability. The balance of supply and demand in the U.S. is also heavily influenced by imported products, principally from Canada and South America, particularly when the U.S. dollar and economy are stronger relative to other countries, encouraging foreign producers to sell more of their plywood and lumber products into the U.S.
We believe that our product line diversification provides us some protection from declines in new residential construction. Our products are used not only in new residential construction, but also in residential repair-and-remodeling projects. We believe the overall age of the U.S. housing stock, resales of existing homes, increased focus on making homes more energy efficient, rising home prices, and availability of consumer loans at low interest rates will continue to support long-
29
term growth in repair-and-remodeling expenditures and increased demand through home improvement centers and our other customers that service professional contractors.
Cost and Availability of Raw Materials
Our principal raw material is wood fiber, which accounted for approximately 44% of the aggregate amount of materials, labor, and other operating expenses (excluding depreciation), for our Wood Products segment in 2017. Logs comprised approximately 75% of our wood fiber costs during 2017, and we satisfy our log requirements through a combination of purchases under supply agreements, open-market purchases, and purchases pursuant to contracts awarded under public auctions conducted by federal, state, and local authorities.
The following table provides changes in our average per-unit log costs for the periods noted below:
Year Ended December 31 | |||||
2017 versus 2016 | 2016 versus 2015 | 2015 versus 2014 | |||
Increase (decrease) in per-unit log costs | 3% | (2)% | 1% | ||
The cost of logs is correlated with prevailing product prices for building materials and manufacturers' expectations for future product prices, with an increase in product prices driving increases in log costs. Generally, increases in the cost of logs lag product price increases, as improved manufacturer profitability often leads to increased demand for logs. Prices for logs have been historically cyclical in response to changes in domestic and foreign demand and supply. Our aggregate cost of obtaining logs is also affected by fuel costs and the distance of the log source from our facilities, as we are often required to transport the logs we purchase from the source to our facilities.
Demand for dimension lumber has a strong influence on log pricing, as the dimension lumber industry is the largest consumer of logs. In the future, we also expect the level of foreign demand for log exports from the western U.S. to fluctuate based on economic activity in China and other Pacific Rim countries, currency exchange rates, and the availability of log supplies from other countries such as Canada, Russia, and New Zealand. Log costs in the western U.S. have historically been more volatile due to foreign demand for log exports. In addition, per-unit log costs in the western U.S. are higher than per-unit log costs in the southern U.S. due to various supply-side constraints, including seasonal weather related restrictions and a higher proportion of federal and state timberland ownership.
Sustained periods of high log costs may impair the cost competitiveness of our manufacturing facilities. Our log requirements and our access to supply, as well as the cost of obtaining logs, are subject to change based on, among other things, the effect of governmental laws and regulations, our manufacturing operations not operating in the normal course of business, impacts of weather or fire on log availability, and the status of environmental appeals.
We also purchase OSB, which is used as the vertical web to assemble I-joists, from a supplier with multiple locations throughout North America. OSB accounted for approximately 7% of the aggregate amount of materials, labor, and other operating expenses (excluding depreciation) for our Wood Products segment in 2017. OSB is a commodity, and prices have been historically volatile in response to industry capacity restarts and operating rates, inventory levels in various distribution channels, and seasonal demand patterns. Sustained periods of high OSB costs lead to significantly higher costs of our I-joist production.
Wood fiber also includes, to a lesser extent than OSB, lumber purchased from third parties for I-joist production at our Canadian EWP facility and for production at our laminated beam plant in Idaho. Lumber input costs are subject to similar commodity-based volatility characteristics noted above for OSB. In addition, our particleboard operation uses wood residuals from lumber operations, about half of which is purchased from third parties. Periods of low demand for lumber can negatively affect supply and pricing of wood residuals.
We also use various resins and glues in our manufacturing processes, which accounted for approximately 6% of the aggregate amount of materials, labor, and other operating expenses (excluding depreciation) for our Wood Products segment in 2017. The costs of resins and glues are influenced by changes in the prices of raw material input costs, primarily fossil fuel products. We purchase many of our raw materials through long-term contracts that contain price adjustment mechanisms that take into account changes in market prices. Therefore, although our long-term contracts provide us with supplies of raw materials and energy that are more stable than open-market purchases, in many cases, they may not alleviate fluctuations in market prices.
30
Our Operating Results
The following tables set forth our operating results in dollars and as a percentage of sales for the years ended December 31, 2017, 2016, and 2015:
Year Ended December 31 | |||||||||||
2017 | 2016 | 2015 | |||||||||
(millions) | |||||||||||
Sales | $ | 4,432.0 | $ | 3,911.2 | $ | 3,633.4 | |||||
Costs and expenses | |||||||||||
Materials, labor, and other operating expenses (excluding depreciation) | 3,819.7 | 3,398.4 | 3,153.5 | ||||||||
Depreciation and amortization | 80.4 | 72.8 | 55.6 | ||||||||
Selling and distribution expenses | 327.4 | 300.8 | 273.3 | ||||||||
General and administrative expenses | 63.1 | 60.6 | 49.4 | ||||||||
Other (income) expense, net | 0.4 | (1.0 | ) | (1.6 | ) | ||||||
4,290.8 | 3,831.6 | 3,530.2 | |||||||||
Income from operations | $ | 141.2 | $ | 79.6 | $ | 103.2 | |||||
(percentage of sales) | |||||||||||
Sales | 100.0 | % | 100.0 | % | 100.0 | % | |||||
Costs and expenses | |||||||||||
Materials, labor, and other operating expenses (excluding depreciation) | 86.2 | % | 86.9 | % | 86.8 | % | |||||
Depreciation and amortization | 1.8 | 1.9 | 1.5 | ||||||||
Selling and distribution expenses | 7.4 | 7.7 | 7.5 | ||||||||
General and administrative expenses | 1.4 | 1.5 | 1.4 | ||||||||
Other (income) expense, net | — | — | — | ||||||||
96.8 | % | 98.0 | % | 97.2 | % | ||||||
Income from operations | 3.2 | % | 2.0 | % | 2.8 | % | |||||
31
Sales Volumes and Prices
Set forth below are historical U.S. housing starts data, segment sales volumes and average net selling prices for the principal products sold by our Wood Products segment, and sales mix and gross margin information for our Building Materials Distribution segment for the years ended December 31, 2017, 2016, and 2015.
Year Ended December 31 | |||||||||||
2017 | 2016 | 2015 | |||||||||
(thousands) | |||||||||||
U.S. Housing Starts (a) | |||||||||||
Single-family | 848.9 | 781.5 | 714.5 | ||||||||
Multi-family | 353.9 | 392.3 | 397.3 | ||||||||
1,202.8 | 1,173.8 | 1,111.8 | |||||||||
(millions) | |||||||||||
Segment Sales | |||||||||||
Wood Products | $ | 1,373.8 | $ | 1,280.4 | $ | 1,282.1 | |||||
Building Materials Distribution | 3,773.8 | 3,227.2 | 2,891.3 | ||||||||
Intersegment eliminations and other | (715.6 | ) | (596.4 | ) | (540.0 | ) | |||||
$ | 4,432.0 | $ | 3,911.2 | $ | 3,633.4 | ||||||
(millions) | |||||||||||
Wood Products | |||||||||||
Sales Volumes | |||||||||||
Laminated veneer lumber (LVL) (cubic feet) | 17.3 | 16.3 | 13.1 | ||||||||
I-joists (equivalent lineal feet) | 235 | 226 | 201 | ||||||||
Plywood (sq. ft.) (3/8" basis) | 1,458 | 1,507 | 1,635 | ||||||||
Lumber (board feet) | 171 | 187 | 206 | ||||||||
(dollars per unit) | |||||||||||
Wood Products | |||||||||||
Average Net Selling Prices | |||||||||||
Laminated veneer lumber (LVL) (cubic foot) | $ | 16.79 | $ | 16.59 | $ | 16.44 | |||||
I-joists (1,000 equivalent lineal feet) | 1,121 | 1,114 | 1,107 | ||||||||
Plywood (1,000 sq. ft.) (3/8" basis) | 312 | 272 | 291 | ||||||||
Lumber (1,000 board feet) | 540 | 472 | 482 | ||||||||
(percentage of Building Materials Distribution sales) | |||||||||||
Building Materials Distribution | |||||||||||
Product Line Sales | |||||||||||
Commodity | 47.9 | % | 46.6 | % | 46.5 | % | |||||
General line | 33.6 | % | 35.4 | % | 35.9 | % | |||||
Engineered wood products | 18.5 | % | 18.0 | % | 17.6 | % | |||||
Gross margin percentage (b) | 11.9 | % | 11.9 | % | 11.6 | % | |||||
_______________________________________
(a) | Actual U.S. housing starts as reported by the U.S. Census Bureau. |
(b) | We define gross margin as "Sales" less "Materials, labor, and other operating expenses (excluding depreciation)." Substantially all costs included in "Materials, labor, and other operating expenses (excluding depreciation)" for our Building Materials Distribution segment are for inventory purchased for resale. Gross margin percentage is gross margin as a percentage of segment sales. |
32
2017 Compared With 2016
Sales
For the year ended December 31, 2017, total sales increased $520.8 million, or 13%, to $4,432.0 million from $3,911.2 million during the year ended December 31, 2016. As described below, both of our segments had increased sales, with single-family residential construction activity being the key demand driver of our sales. During 2017, U.S. housing starts increased 2%, with single-family starts up 9%, compared with 2016. Single-family housing starts are the primary driver of our sales and typically result in higher building product utilization per start than multi-family units. For the year ended December 31, 2017, average composite lumber and average composite panel prices were up 19% and 18%, respectively, compared with the same period in the prior year, as reflected by Random Lengths composite lumber and panel pricing. These improvements in composite commodity pricing resulted in improved sales in both of our segments, as noted below.
Wood Products. During the year ended December 31, 2017, sales, including sales to our BMD segment, increased $93.3 million, or 7%, to $1,373.8 million from $1,280.4 million in 2016. The increase in sales was driven primarily by higher sales prices for plywood and lumber of 15% and 14%, respectively, resulting in increased sales of $58.1 million and $11.6 million, respectively. In addition, sales volumes of LVL and I-joists increased 6% and 4%, respectively, resulting in increased sales of $16.5 million and $10.5 million, respectively. An increase in sales prices of 1% for both LVL and I-joists also contributed $3.5 million and $1.5 million, respectively, to the improved sales. These increases were offset by decreases in plywood and lumber sales volumes of 3% and 8%, or $13.5 million and $7.3 million in sales, respectively. We have shifted a higher proportion of our internally produced veneer into EWP, resulting in the decline in plywood production and sales volumes.
Building Materials Distribution. During the year ended December 31, 2017, sales increased $546.6 million, or 17%, to $3,773.8 million from $3,227.2 million in 2016. Compared with the prior year, the overall increase in sales was driven by sales price and sales volume increases of 9% and 8%, respectively. By product line, commodity sales increased 20%, or $305.2 million; general line product sales increased 11%, or $127.6 million; and sales of EWP (substantially all of which is sourced through our Wood Products segment) increased 20%, or $113.8 million.
Costs and Expenses
Materials, labor, and other operating expenses (excluding depreciation) increased $421.2 million, or 12%, to $3,819.7 million for the year ended December 31, 2017, compared with $3,398.4 million during the prior year. In our Wood Products segment, the increase in materials, labor, and other operating expenses was primarily driven by higher per-unit costs of OSB and logs of 25% and 3%, respectively, compared with the prior year. However, materials, labor, and other operating expenses as a percentage of sales (MLO rate) in our Wood Products segment decreased by 170 basis points. The decrease in the MLO rate was primarily due to higher sales prices, resulting in improved leveraging of wood fiber, labor, and other manufacturing costs. In our BMD segment, the increase in materials, labor, and other operating expenses was driven by higher purchased materials costs as a result of higher sales volumes, compared with the prior year. However, the BMD segment MLO rate was flat compared with 2016. Improved margins on commodity products were offset by lower margins on general line products. EWP margins improved slightly.
Depreciation and amortization expenses increased $7.5 million, or 10%, to $80.4 million for the year ended December 31, 2017, compared with $72.8 million during the prior year. The increase was due primarily to the acquisition of two EWP facilities located in Thorsby, Alabama, and Roxboro, North Carolina, on March 31, 2016 (Acquisition), and other capital expenditures.
Selling and distribution expenses increased $26.6 million, or 9%, to $327.4 million for the year ended December 31, 2017, compared with $300.8 million for the prior year. The increase was due mostly to higher employee-related expenses and shipping and handling costs of $13.7 million and $9.6 million, respectively, primarily as a result of higher delivery and base compensation costs associated with increased sales volumes and higher incentive compensation costs from improved operating results in our BMD segment.
General and administrative expenses increased $2.5 million, or 4%, to $63.1 million for the year ended December 31, 2017, compared with $60.6 million for the prior year. The increase was due primarily to increased base and incentive compensation expenses of $6.2 million, offset partially by acquisition-related expenses of $3.6 million in our Wood Products segment in 2016.
33
For the year ended December 31, 2017, other (income) expense, net, was $0.4 million of expense, which included a $1.0 million noncash asset write-down, offset by a $1.2 million gain from the sale of machinery and equipment, in our Wood Products segment. For the year ended December 31, 2016, other (income) expense, net, was $1.0 million of income, which included a $1.5 million gain from the sale of a timber deed in our Wood Products segment.
Income From Operations
Income from operations increased $61.6 million to $141.2 million for the year ended December 31, 2017, compared with $79.6 million of income for the year ended December 31, 2016.
Wood Products. For the year ended December 31, 2017, segment income increased $27.7 million to $53.6 million from $25.9 million for the year ended December 31, 2016. The increase in segment income was due primarily to higher plywood, lumber, and EWP sales prices. In addition, the year ended December 31, 2016, included $3.6 million of acquisition-related expenses. These improvements were offset partially by higher OSB costs used in the manufacture of I-joists, as well as higher per-unit conversion costs. In addition, depreciation and amortization expense increased $5.6 million due primarily to the Acquisition on March 31, 2016, and other capital expenditures.
Building Materials Distribution. For the year ended December 31, 2017, segment income increased $32.4 million to $116.8 million from $84.4 million for the year ended December 31, 2016. The improvement in segment income was driven primarily by a gross margin increase of $65.1 million generated from a sales increase of 17%. This improvement was offset partially by increased selling and distribution expenses and general and administrative expense of $28.2 million and $2.5 million, respectively, as well as higher depreciation and amortization of $1.7 million.
Corporate. Unallocated corporate expenses decreased $1.5 million to $29.2 million for the year ended December 31, 2017, from $30.7 million for the year ended December 31, 2016. The decrease was primarily due to lower pension expense of $4.8 million, offset partially by higher employee-related expenses of $3.1 million. Pension expense decreased primarily due to a $3.9 million settlement charge resulting from lump-sum benefit payments in the fourth quarter of 2016. For more information related to our pension plan, see Note 9, Retirement and Benefit Plans, of the Notes to Consolidated Financial Statements in "Item 8. Financial Statements and Supplementary Data" of this Form 10-K.
Other
Interest Expense. Interest expense decreased $1.3 million, or 5%, to $25.4 million for the year ended December 31, 2017, compared with $26.7 million for the prior year. The higher interest expense during the prior year was primarily due to timing related to the senior notes refinancing in which we issued new senior notes on August 29, 2016, but did not redeem $115.5 million of the replaced senior notes until November 1, 2016. As such, the year ended December 31, 2016, included interest on both notes for a portion of the year.
Change in fair value of interest rate swaps. For information related to our interest rate swaps, see the discussion under "Disclosures of Financial Market Risks" and "Financial Instruments" included in this "Item 7. Management's Discussion and Analysis of Financial Condition and Results of Operations" of this Form 10-K.
Loss on extinguishment of debt. In connection with the issuance of the $350 million of 5.625% senior notes due September 1, 2024 (2024 Notes), we commenced a tender offer to purchase any and all of our $300.0 million aggregate principal amount of 6.375% senior notes (2020 Notes) then outstanding. On August 29, 2016, we accepted for purchase an aggregate principal amount of $184.5 million of the 2020 Notes that were tendered. On November 1, 2016, we redeemed the remaining $115.5 million in aggregate principal amount of the 2020 Notes outstanding. In connection with these transactions, we recognized a pre-tax loss on the extinguishment of debt of $14.3 million during 2016. The loss includes $11.3 million in debt extinguishment premiums and $3.0 million for the net write-off of the unamortized deferred financing costs and unamortized premium related to the 2020 Notes.
For more information related to our indebtedness, see Note 7, Debt, of the Notes to Consolidated Financial Statements in "Item 8. Financial Statements and Supplementary Data" of this Form 10-K.
34
2016 Compared With 2015
Sales
For the year ended December 31, 2016, total sales increased $277.8 million, or 8%, to $3,911.2 million from $3,633.4 million during the year ended December 31, 2015, driven by changes in sales volumes and prices, as described below. During 2016, U.S. housing starts increased 6%, with single-family starts up 9%, compared with 2015. For the year ended December 31, 2016, average composite lumber and average composite panel prices were up 4% and 1%, respectively, compared with the same period in the prior year, as reflected by Random Lengths composite lumber and panel pricing. These improvements in composite commodity pricing resulted in improved results in our BMD segment as noted below, particularly due to improved pricing in OSB and dimension lumber products. However, within our Wood Products segment, we manufacture plywood, but not OSB, and therefore our reported prices trended with the declines reflected in the plywood composite indexes and not the overall composite panel index. Average composite panel prices increased during the year ended December 31, 2016, but plywood prices were negatively impacted by a strong U.S. dollar and economy relative to other countries, resulting in foreign producers, particularly from South America, selling more of their plywood products into the eastern U.S. Given weak plywood pricing and improved demand for EWP, we also shifted more of our internally produced veneer to EWP, resulting in the decrease in plywood sales volume noted below.
Wood Products. During the year ended December 31, 2016, sales, including sales to our BMD segment, decreased $1.7 million, to $1,280.4 million from $1,282.1 million in 2015. Plywood and lumber sales volumes decreased 8% and 9%, respectively, contributing $37.2 million and $9.1 million, respectively, to the decrease in sales. Sales price decreases of 7% and 2%, respectively, in plywood and lumber resulted in sales decreases of $29.3 million and $1.8 million, respectively. In addition, lower sales volumes of veneer and lower byproduct price realizations resulted in sales decreases of $5.4 million and $6.5 million, respectively. These decreases were offset partially by sales volume increases of 25% in LVL and 13% in I-joists which resulted in sales increases of $53.3 million and $27.9 million, respectively. Increased EWP volumes were due primarily to the Acquisition and increased penetration with existing customers, as well as improved single-family housing starts. Sales prices for LVL and I-joists were relatively flat compared with the year ended December 31, 2015.
Building Materials Distribution. During the year ended December 31, 2016, sales increased $335.9 million, or 12%, to $3,227.2 million from $2,891.3 million for the prior year. Compared with the prior year, the overall increase in sales was driven by sales volume and sales price increases of 11% and 1%, respectively. By product line, commodity sales increased 12%, or $159.7 million; general line product sales increased 10%, or $104.1 million; and sales of EWP (substantially all of which is sourced through our Wood Products segment) increased 14%, or $72.2 million.
Costs and Expenses
Materials, labor, and other operating expenses (excluding depreciation) increased $244.9 million, or 8%, to $3,398.4 million for the year ended December 31, 2016, compared with $3,153.5 million during the prior year. In our Wood Products segment, the increase in materials, labor, and other operating expenses was primarily driven by higher sales volumes of EWP, as well as higher per-unit costs of OSB of 23%, compared with the prior year, offset partially by lower per-unit log costs of 2%. In addition, the MLO rate in our Wood Products segment increased by 120 basis points. The increase in the MLO rate was primarily the result of lower plywood and lumber sales prices and volumes, as well as higher OSB costs, which resulted in higher labor and wood fiber costs as a percent of sales, offset partially by lower other manufacturing costs. In our BMD segment, the increase in materials, labor, and other operating expenses was driven by higher purchased materials costs as a result of higher sales volumes, compared with the prior year. However, the BMD segment MLO rate improved 30 basis points compared with 2015 due to improved commodity product margins, as well as improved sales of general line products, which typically carry higher product margins than commodity products.
Depreciation and amortization expenses increased $17.3 million, or 31%, to $72.8 million for the year ended December 31, 2016, compared with $55.6 million during the prior year. The increase was due primarily to the acquisition of two EWP facilities on March 31, 2016, and other capital expenditures. As of December 31, 2016, we had approximately $45 million of idled veneer and LVL related machinery and equipment at Roxboro, North Carolina, that were purchased in the Acquisition.
Selling and distribution expenses increased $27.5 million, or 10%, to $300.8 million for the year ended December 31, 2016, compared with $273.3 million for the prior year. The increase was due to higher employee-related expenses and shipping and handling costs of $16.6 million and $5.7 million, respectively, primarily as a result of increased sales volumes and improved operating results in our BMD segment.
35
General and administrative expenses increased $11.2 million, or 23%, to $60.6 million for the year ended December 31, 2016, compared with $49.4 million for the prior year. The increase was due primarily to increased employee-related expenses of $7.5 million and higher acquisition-related expenses of $2.0 million in our Wood Products segment.
For the year ended December 31, 2016, other (income) expense, net, was $1.0 million of income, which included a $1.5 million gain from the sale of a timber deed in our Wood Products segment. For the year ended December 31, 2015, other (income) expense, net, was $1.6 million of income, which included a $0.9 million gain from the sale of a parcel of land in our Wood Products segment.
Income From Operations
Income from operations decreased $23.6 million to $79.6 million for the year ended December 31, 2016, compared with $103.2 million of income for the year ended December 31, 2015.
Wood Products. For the year ended December 31, 2016, segment income decreased $38.3 million to $25.9 million from $64.2 million for the year ended December 31, 2015. The decrease in segment income was due primarily to lower plywood and lumber sales prices, and higher OSB costs, as well as higher acquisition-related expenses of $2.0 million. In addition, depreciation and amortization expense increased $14.2 million due primarily to the Acquisition and other capital expenditures. These decreases were offset partially by improved sales volumes of EWP and lower log costs.
Building Materials Distribution. For the year ended December 31, 2016, segment income increased $23.6 million to $84.4 million from $60.8 million for the year ended December 31, 2015. The increase in segment income was driven primarily by a higher gross margin of $50.2 million generated from a sales increase of 12%, including an improvement in gross margin percentage of 30 basis points. This improvement was offset partially by increased selling and distribution expenses and general and administrative expenses of $21.9 million and $3.1 million, respectively, as well as higher depreciation and amortization of $1.8 million.
Corporate. Unallocated corporate expenses increased $8.9 million to $30.7 million for the year ended December 31, 2016, from $21.8 million for the year ended December 31, 2015. The increase was primarily due to higher pension expense, incentive compensation costs, and professional fees. Pension expense increased $3.4 million due primarily to a $3.9 million settlement charge resulting from lump-sum benefit payments in the fourth quarter of 2016. For more information related to our pension plan, see Note 9, Retirement and Benefit Plans, of the Notes to Consolidated Financial Statements in "Item 8. Financial Statements and Supplementary Data" of this Form 10-K.
Other
Interest Expense. Interest expense increased $4.2 million, or 18%, to $26.7 million for the year ended December 31, 2016, compared with $22.5 million for the prior year. The increase was due primarily to interest expense related to the issuance of the 2024 Notes on August 29, 2016, $125.0 million of receive-variable pay-fixed interest rate swaps, a $75 million term loan entered into on March 30, 2016, and 2016 borrowings under our credit facility, offset partially by a decrease in interest expense from the repayment of the 2020 Notes during 2016.
Change in fair value of interest rate swaps. For information related to our interest rate swaps, see the discussion under "Disclosures of Financial Market Risks" and "Financial Instruments" included in this "Item 7. Management's Discussion and Analysis of Financial Condition and Results of Operations" of this Form 10-K.
Loss on extinguishment of debt. For more information related to our loss on extinguishment of debt during 2016, reference the discussion above, "2017 Compared with 2016."
For more information related to our indebtedness, see Note 7, Debt, of the Notes to Consolidated Financial Statements in "Item 8. Financial Statements and Supplementary Data" of this Form 10-K.
Income Tax Provision
For the years ended December 31, 2017, 2016, and 2015, we recorded $34.6 million, $5.0 million, and $28.5 million, respectively, of income tax expense and had an effective rate of 29.5%, 11.7%, and 35.3%, respectively. Our rate is affected by
36
recurring items, such as state income taxes, and discrete items that may occur in any given year but are not consistent from year to year.
During the year ended December 31, 2017, the primary reasons for the difference between the federal statutory income tax rate of 35% and the effective tax rate were the effect of the following:
• | An $8.1 million reduction in income tax expense, or an effect of 6.9%, resulting from the remeasurement of deferred income taxes to the new federal statutory rate of 21%. |
• | A $3.7 million increase in income tax expense, or an effect of 3.2%, from state income taxes. |
During the year ended December 31, 2016, the primary reasons for the difference between the federal statutory income tax rate of 35% and the effective tax rate were the effect of the following:
• | A $9.9 million reduction in income tax expense, or an effect of 22.8%, resulting from the valuation allowance reversal in our Canadian tax jurisdiction. |
• | A $2.9 million reduction in income tax expense, or an effect of 6.7%, resulting from other tax credits. |
• | A $1.7 million increase in income tax expense, or an effect of 4.0%, resulting from unrecognized tax benefits. |
• | A $1.4 million increase in income tax expense, or an effect of 3.2%, from state income taxes. |
During the year ended December 31, 2015, the federal statutory income tax rate and the effective tax rate was 35%, as the effect of state taxes was offset by the domestic production activities deduction and other tax credits.
On December 22, 2017, the Tax Cuts and Jobs Act (the “Tax Act”), was enacted by the U.S. government. The legislation makes broad and complex changes to the U.S. tax code affecting the taxation of businesses in all industries. The most significant impact to our financial statements is the reduction of the corporate federal income tax rate from 35% to 21%. Based on our preliminary analysis, we expect our 2018 effective tax rate to be approximately 25%, inclusive of the effect of state income taxes. Other relevant provisions which may impact our financial statements in the future include, but are not limited to, the elimination of the production activities deduction, limitations on the deductibility of certain executive compensation, bonus depreciation to allow immediate expensing of qualified property, and limitations on deductible interest expense. For more information related to the Tax Act, see Note 3, Income Taxes, of the Notes to Consolidated Financial Statements in "Item 8. Financial Statements and Supplementary Data" of this Form 10-K.
Liquidity and Capital Resources
We ended 2017 with $177.1 million of cash and cash equivalents and $438.3 million of long-term debt. At December 31, 2017, we had $556.9 million of available liquidity (cash and cash equivalents and undrawn committed bank line availability). Our cash and cash equivalents increased by $73.2 million during the year ended December 31, 2017, as cash provided by operating activities was partially offset by capital spending, as further discussed below.
At December 31, 2017, our cash was invested in high-quality, short-term investments, which we record in "Cash and cash equivalents." The majority of our cash and cash equivalents is invested in money market funds that are broadly diversified and invested in high-quality, short-duration securities, including commercial paper, certificates of deposit, U.S. government agency securities, and similar instruments. We have significant amounts of cash and cash equivalents that are in excess of federally insured limits. Though we have not experienced any losses on our cash and cash equivalents to date and we do not anticipate incurring any losses, we cannot be assured that we will not experience losses on our short-term investments.
We believe that our cash flows from operations, combined with our current cash levels and available borrowing capacity, will be adequate to fund debt service requirements and provide cash, as required, to support our ongoing operations, capital expenditures, lease obligations, working capital, pension contributions, and to pay cash dividends to holders of our common stock over the next twelve months. We expect to fund our seasonal and intra-month working capital requirements in 2018 from cash on hand and, if necessary, borrowings under our revolving credit facility.
In recent years, our pension benefit obligations have fluctuated significantly, primarily due to the interest rate environment in the U.S. and its impact on the discount rate assumptions used to measure the present value of our pension
37
benefit obligations. At December 31, 2017, we used a discount rate assumption of 3.40% to measure the present value of our pension benefit obligations, which resulted in a pension benefit obligation of approximately $483.5 million. The fair value of our pension plan assets at December 31, 2017, was approximately $422.3 million, and thus we reported an underfunded status of our defined benefit pension plans of approximately $61.3 million. Given the underfunded status, we may be required to make future contributions to our qualified defined benefit pension plan depending upon actuarial assumptions, future interest rates, and pension asset investments returns. While we have no federally required contributions for 2018, we expect to make cash contributions of approximately $2 million to our pension plans. These contributions reflect benefit payments to plan participants of our nonqualified salaried pension plans and lease payments for properties we have contributed to our qualified defined benefit pension plan.
We intend to fund our future pension obligations with cash on hand, cash generated from operations, and external financing. See "Contractual Obligations" in this Management's Discussion and Analysis of Financial Condition and Results of Operations for an estimate of future minimum pension funding obligations. Also see "Critical Accounting Estimates" in this Management's Discussion and Analysis of Financial Condition and Results of Operations and Note 9, Retirement and Benefit Plans, of the Notes to Consolidated Financial Statements in "Item 8. Financial Statements and Supplementary Data" of this Form 10-K for a further discussion of the assumptions used to measure the present value of our pension benefit obligations.
Sources and Uses of Cash
We generate cash primarily from sales of our products, as well as short-term and long-term borrowings. Our primary uses of cash are for expenses related to the manufacture and distribution of building products, including inventory purchased for resale, wood fiber, labor, energy, and glues and resins. In addition to paying for ongoing operating costs, we use cash to invest in our business, service our debt and pension obligations, pay dividends, repurchase our common stock, and meet our contractual obligations and commercial commitments. Below is a discussion of our sources and uses of cash for operating activities, investing activities, and financing activities.
Year Ended December 31 | |||||||||||
2017 | 2016 | 2015 | |||||||||
(thousands) | |||||||||||
Net cash provided by operations | $ | 151,567 | $ | 151,907 | $ | 80,331 | |||||
Net cash used for investment | (73,212 | ) | (298,839 | ) | (84,392 | ) | |||||
Net cash provided by (used for) financing | (5,193 | ) | 66,414 | 25,008 | |||||||
Operating Activities
2017 Compared With 2016
In 2017, our operating activities generated $151.6 million of cash, compared with $151.9 million in 2016. The $0.3 million decrease in cash provided by operations in 2017 relates primarily to the following:
• | A $17.8 million increase in working capital during 2017, compared with a $12.2 million decrease in working capital during 2016. Working capital is subject to cyclical operating needs, seasonal buying patterns for inventory purchased for resale and logs, the timing of the collection of receivables, and the timing of payment of payables and expenses. The increase in working capital in 2017 was primarily attributable to higher receivables and inventories, offset partially by an increase in accounts payable and accrued liabilities. The increase in receivables in 2017 primarily reflects increased sales of approximately 18%, comparing sales for the month of December 2017 with sales for the month of December 2016. The decrease in working capital in 2016 was primarily attributable to higher accounts payable and accrued liabilities, offset partially by an increase in inventories. Inventories increased in both 2017 and 2016 primarily due to an increase in finished goods inventory in our Building Materials Distribution segment. The increase in accounts payable and accrued liabilities in 2017 was greater than the 2016 increase, reflecting the increase in inventories as of December 31, 2017, and higher incentive compensation accruals. |
• | A $29.4 million increase in cash paid for income taxes. The increase in cash paid for income taxes is primarily due to an increase in income from operations. |
• | A $32.4 million increase in income in our Building Materials Distribution segment and a $27.7 million increase in income in our Wood Products segment. See "Operating Results" above for a discussion on our results for 2017. |
38
2016 Compared With 2015
In 2016, our operating activities generated $151.9 million of cash, compared with $80.3 million in 2015. The $71.6 million increase in cash provided by operations in 2016 relates primarily to the following:
• | A decrease in cash contributions to our pension plans of $50.4 million. During 2016, we used $3.8 million of cash to make pension contributions, compared with $54.3 million during 2015. |
• | A $23.6 million increase in income in our Building Materials Distribution segment, offset by a $38.3 million decrease in income in our Wood Products segment. See "Operating Results" above for a discussion on our results for 2016. |
• | A $12.2 million decrease in working capital during 2016, compared with a $2.7 million increase in working capital during 2015. The decrease in working capital in 2016 was primarily attributable to higher accounts payable and accrued liabilities, offset partially by an increase in inventories. The increase in working capital in 2015 was primarily attributable to higher receivables, offset partially by an increase in accounts payable and accrued liabilities. The increase in receivables in 2015 primarily reflect increased sales of approximately 2%, comparing sales for the month of December 2015 with sales for the month of December 2014. In addition, inventories increased during 2016 compared with a decrease during 2015. Inventories increased in 2016 primarily due to an increase in finished goods inventory in our Building Materials Distribution segment. The increase in accounts payable and accrued liabilities in 2016 was greater than the 2015 increase, reflecting the increase in inventories as of December 31, 2016 and higher incentive compensation. |
• | A $5.9 million increase in cash paid for income taxes. The increase in cash paid for income taxes is primarily due to lower tax benefits related to the decrease in cash contributions to our pension plans, discussed above, offset partially by a decrease in income from operations. |
• | A $6.8 million decrease in other net long-term assets and liabilities during 2016, compared with an increase in other net long-term assets and liabilities during 2015. These changes primarily related to fluctuations in timber deposits. |
Investment Activities
Net cash used for investing activities was $73.2 million, $298.8 million, and $84.4 million during 2017, 2016, and 2015, respectively.
2017
During the year ended December 31, 2017, we used approximately $75.5 million of cash for purchases of property and equipment, which included business improvement and quality/efficiency projects, replacement and expansion projects, and ongoing environmental compliance. Quality and efficiency projects include quality improvements, modernization, energy, and cost-saving projects. Purchases of property and equipment included approximately $2 million for environmental compliance in 2017 and we expect to spend approximately $1 million in 2018. For the year ended December 31, 2017, we received asset sales proceeds of $2.5 million, primarily from the sale of machinery and equipment in our Wood Products segment.
Excluding potential acquisitions, we expect capital expenditures in 2018 to total approximately $75 million to $85 million. This level of capital expenditures could increase or decrease as a result of a number of factors, including our financial results, future economic conditions, and timing of equipment purchases. We expect our capital spending in 2018 will be for business improvement and quality/efficiency projects, replacement projects, and ongoing environmental compliance.
2016
During the year ended December 31, 2016, we used $215.9 million for the Acquisition. In addition, we used approximately $83.6 million of cash for purchases of property and equipment, which included business improvement and quality/efficiency projects, replacement and expansion projects, expenditures to restart certain idled assets at our recently acquired Roxboro, North Carolina, facility, and ongoing environmental compliance. Quality and efficiency projects include quality improvements, modernization, energy, and cost-saving projects. Purchases of property and equipment included approximately $8 million for environmental compliance in 2016.
39
2015
During the year ended December 31, 2015, we used approximately $87.5 million of cash for purchases of property and equipment, which included business improvement and quality/efficiency projects and replacement and expansion projects. In 2015, purchases of property and equipment included approximately $2 million for environmental compliance. For the year ended December 31, 2015, we received asset sale proceeds of $3.1 million, primarily from the sale of a parcel of land in our Wood Products segment.
Financing Activities
During 2017, our financing activities used $5.2 million of cash, primarily from tax withholding payments on stock-based awards of $2.9 million and common stock dividend payments (see further discussion below) of $2.7 million. During 2017, we borrowed $410.4 million under our revolving credit facility to fund intra-month working capital needs, which were subsequently repaid during the same period with cash on hand. At December 31, 2017, we had no borrowings outstanding under the revolving credit facility.
During 2016, our financing activities generated $66.4 million of cash, primarily from borrowings of long-term debt of $837.8 million offset partially by payments of long-term debt of $754.1 million and the repurchase of common stock for $10.3 million, as further discussed below.
On August 29, 2016, we issued $350 million of 2024 Notes. With proceeds from the 2024 Notes issuance, we retired our 2020 Notes. In connection with the retirement of the 2020 Notes, we made debt extinguishment premium payments of $11.3 million.
During the year ended December 31, 2016, we also issued a new $75.0 million secured term loan (Term Loan) to partially fund the Acquisition. Subsequently, in December 2016, we paid down $30.0 million on our Term Loan with cash on hand, resulting in $45 million outstanding at December 31, 2016. Under our revolving credit facility, we borrowed $357.8 million to fund intra-month working capital needs and $55.0 million to partially fund the Acquisition, which were subsequently repaid with cash on hand during the year ended December 31, 2016. At December 31, 2016, we had no borrowings outstanding under the revolving credit facility. During the year ended December 31, 2016, we also used $6.4 million of cash for financing costs related to our debt issuances and $10.3 million for the repurchase of 580,100 shares of our common stock.
During 2015, our financing activities generated $25.0 million of cash, primarily from the borrowings under a new $50.0 million term loan (ABL Term Loan) offset partially by the repurchase of 722,911 shares of our common stock for $23.7 million. Proceeds from the ABL Term Loan were used to fund a $40.0 million discretionary pension contribution and for general corporate purposes. During the year ended December 31, 2015, we had no borrowings outstanding under our revolving credit facility.
Dividends on Common Stock
In the fourth quarter of 2017, our board of directors approved a dividend policy to pay quarterly cash dividends to holders of our common stock. Our board of directors declared an initial dividend of $0.07 per share of our common stock, which was paid on December 15, 2017, to stockholders of record on November 27, 2017. Future quarterly dividend declarations, including amount per share, record date and payment date, will be made by the board of directors and will depend upon, among other things, legal capital requirements and surplus, our future operations and earnings, general financial condition, contractual obligations, restrictions imposed by our revolving credit facility and the indenture governing our senior notes, or applicable laws and other factors that our board of directors may deem relevant. For a description of the restrictions in our asset-based credit facility, term loan, and the indenture governing our senior notes on our ability to pay dividends, see Note 7, Debt, of the Notes to Consolidated Financial Statements in "Item 8. Financial Statements and Supplementary Data" of this Form 10-K. The dividend policy may be suspended or canceled at the discretion of the board of directors at any time.
Stock Repurchase Program
On February 25, 2015, our board of directors authorized a common stock repurchase program (Program) which allows us to purchase up to two million shares of our common stock, on an opportunistic basis, through open market transactions, privately negotiated transactions, or accelerated share repurchase transactions. We are not obligated to purchase any shares and there is no set date that the Program will expire. The board may increase or decrease the number of shares under the Program or
40
terminate the Program in its discretion at any time. As of December 31, 2017, there were 696,989 shares of common stock that may yet be purchased under the Program.
Debt Structure
For information related to our debt structure, see Note 7, Debt, of the Notes to Consolidated Financial Statements in "Item 8. Financial Statements and Supplementary Data" of this Form 10-K.
Contractual Obligations
In the table below, we set forth our contractual obligations as of December 31, 2017. Some of the amounts included in the table are based on management's estimates and assumptions about these obligations, including their duration, the possibility of renewal, anticipated actions by third parties, and other factors. Because these estimates and assumptions are necessarily subjective, our actual payments may vary from those reflected in the table. Purchase orders made in the ordinary course of business are excluded from the table below. Any amounts for which we are liable under purchase orders are reflected on the Consolidated Balance Sheets as accounts payable and accrued liabilities.
Payments Due by Period | |||||||||||||||||||
2018 | 2019-2020 | 2021-2022 | Thereafter | Total | |||||||||||||||
(millions) | |||||||||||||||||||
Long-term debt (a) | $ | — | $ | — | $ | 50.0 | $ | 395.0 | $ | 445.0 | |||||||||
Interest (b) | 22.4 | 44.7 | 43.8 | 43.3 | 154.2 | ||||||||||||||
Operating leases (c) | 15.1 | 28.7 | 23.8 | 58.7 | 126.3 | ||||||||||||||
Purchase obligations | |||||||||||||||||||
Raw materials (d) | 17.6 | 43.6 | 7.1 | 3.9 | 72.2 | ||||||||||||||
Other | 1.9 | — | — | — | 1.9 | ||||||||||||||
Other long-term liabilities reflected on our Balance Sheet (e) | |||||||||||||||||||
Compensation and benefits, including pension funding obligations (f) | 3.8 | 6.4 | 5.7 | 61.9 | 77.8 | ||||||||||||||
Other (g)(h) | 3.8 | 4.8 | 3.0 | 7.6 | 19.2 | ||||||||||||||
$ | 64.6 | $ | 128.2 | $ | 133.4 | $ | 570.4 | $ | 896.6 | ||||||||||
_______________________________________
(a) | These borrowings are further explained in Note 7, Debt, of the Notes to Consolidated Financial Statements in "Item 8. Financial Statements and Supplementary Data" of this Form 10-K. The table assumes our long-term debt is held to maturity. |
(b) | Amounts represent estimated interest payments on the 2024 Notes, ABL Term Loan, and Term Loan as of December 31, 2017, assuming these instruments are held to maturity. Unused commitment fees and letter of credit fees payable under the Revolving Credit Facility are excluded from the table above. In addition, we have excluded our interest rate swaps from interest in the table above. For information regarding average pay rates and average receive rates on our interest rate swaps, see "Financial Instruments" included in this "Item 7. Management's Discussion and Analysis of Financial Condition and Results of Operations" of this Form 10-K. |
(c) | We enter into operating leases in the normal course of business. We lease a portion of our distribution centers as well as other property and equipment under operating leases. Some lease agreements provide us with the option to renew the lease or purchase the leased property. Our operating lease obligations would change if we exercised these renewal options and/or if we entered into additional operating lease agreements. For more information, see Note 8, Leases, of the Notes to Consolidated Financial Statements in "Item 8. Financial Statements and Supplementary Data" of this Form 10-K. |
(d) | Amounts represent contracts to purchase approximately $72 million of logs, approximately $59 million of which will be purchased pursuant to fixed-price contracts and approximately $13 million of which will be purchased pursuant to variable-price contracts. The $13 million is estimated using current quarter pricing, but actual prices depend on future market prices. Under certain log agreements, we have the right to cancel or reduce our commitments in the event of a mill curtailment or shutdown. Future purchase prices under most of the variable-price agreements will be set quarterly or semiannually based on regional market prices. Our log requirements and our access to supply, as well as the cost of obtaining logs, are subject to change based on, among other things, the effect of governmental laws and regulations, our manufacturing operations not operating in the normal course of business, log availability, and the status of environmental appeals. Except for deposits required pursuant to log supply contracts, these obligations are not recorded in our consolidated financial statements until contract payment terms take effect. |
41
(e) | Long-term deferred income tax liabilities and unrecognized tax benefits are excluded from this table, because the timing of future cash outflows related to these items are uncertain. For more information, see Note 3, Income Taxes, of the Notes to Consolidated Financial Statements in "Item 8. Financial Statements and Supplementary Data" of this Form 10-K. |
(f) | Amounts consist of our pension and deferred compensation liabilities, including the current portion of those obligations of $2.3 million. Actuarially determined liabilities related to pension benefits are recorded based on estimates and assumptions. Key factors used in developing estimates of these liabilities include assumptions related to discount rates, expected rate of compensation increases, retirement and mortality rates, and other factors. Changes in estimates and assumptions related to the measurement of funded status could have a material impact on the amount reported. In the table above, we allocated our pension obligations by year based on the future required minimum pension contributions, as determined by our actuaries. |
(g) | Includes current portion of other long-term liabilities of $3.8 million. |
(h) | We have excluded $4.2 million and $0.5 million of deferred lease costs and deferred gains, respectively, from the other long-term liabilities in the above table. These amounts have been excluded because deferred lease costs relate to operating leases which are already reflected in the operating lease category above and deferred gains do not represent a contractual obligation that will be settled in cash. |
Off-Balance-Sheet Arrangements
At December 31, 2017 and 2016, we had no material off-balance-sheet arrangements with unconsolidated entities.
Guarantees
Note 7, Debt, and Note 15, Commitments, Legal Proceedings and Contingencies, and Guarantees, of the Notes to Consolidated Financial Statements in "Item 8. Financial Statements and Supplementary Data" of this Form 10-K describe the nature of our guarantees, including the approximate terms of the guarantees, how the guarantees arose, the events or circumstances that would require us to perform under the guarantees, and the maximum potential undiscounted amounts of future payments we could be required to make.
Seasonal and Inflationary Influences
We are exposed to fluctuations in quarterly sales volumes and expenses due to seasonal factors. These seasonal factors are common in the building products industry. Seasonal changes in levels of building activity affect our building products businesses, which are dependent on housing starts, repair-and-remodeling activities, and light commercial construction activities. We typically report lower sales in the first and fourth quarters due to the impact of poor weather on the construction market, and we generally have higher sales in the second and third quarters, reflecting an increase in construction due to more favorable weather conditions. We typically have higher working capital in the first and second quarters in preparation and response to the building season. Seasonally cold weather increases costs, especially energy consumption costs, at most of our manufacturing facilities.
Disclosures of Financial Market Risks
In the normal course of business, we are exposed to financial risks such as changes in interest rates, foreign currency exchange rates, and commodity prices. In 2017, 2016, and 2015, we did not use derivative instruments to manage these risks, except for interest rate swaps entered into in 2016 as discussed below.
Interest Rate Risk
We are exposed to interest rate risk arising from fluctuations in variable-rate LIBOR on our term loans and when we have loan amounts outstanding on our Revolving Credit Facility. At December 31, 2017, we had $95.0 million of variable-rate debt outstanding. Our objective is to limit the variability of interest payments on our debt. To meet this objective, in 2016 we entered into receive-variable, pay-fixed interest rate swaps to change the variable-rate cash flow exposure to fixed-rate cash flows. In accordance with our risk management strategy, we actively monitor our interest rate exposure and use derivative instruments from time to time to manage the related risk.
42
On February 16, 2016 and March 31, 2016, we entered into interest rate swap agreements with notional principal amounts of $50.0 million and $75.0 million, respectively, to offset risks associated with the variability in cash flows relating to interest payments that are based on one-month LIBOR. We do not speculate using derivative instruments. At December 31, 2017, and December 31, 2016, the notional principal amount of our interest rate swap agreements exceeded the $95.0 million of variable-rate debt outstanding after paying down $30.0 million of variable rate debt on our Term Loan in December 2016. The excess notional principal amount of our interest rate swaps over our variable-rate debt is within our management strategy as we have partially funded seasonal and intra-month working capital requirements from borrowings under our Revolving Credit Facility.
Under the interest rate swaps, we receive LIBOR-based variable interest rate payments and make fixed interest rate payments, thereby fixing the interest rate on $125.0 million of variable-rate debt exposure. Payments on the interest rate swaps with notional principal amounts of $50.0 million and $75.0 million are due on a monthly basis at an annual fixed rate of 1.007% and 1.256%, respectively, and expire in February 2022 and March 2022, respectively. The interest rate swap agreements were not designated as cash flow hedges, and as a result, all changes in the fair value are recognized in "Change in fair value of interest rate swaps" in the Consolidated Statements of Operations rather than through other comprehensive income. At December 31, 2017, and 2016, we recorded long-term assets of $4.7 million and $4.2 million, respectively, in "Other assets" on our Consolidated Balance Sheets, representing the fair value of the interest rate swap agreements.
Foreign Currency Risk
We have sales in countries outside the U.S. As a result, we are exposed to movements in foreign currency exchange rates, primarily in Canada, but we do not believe our exposure to currency fluctuations is significant.
Commodity Price Risk
Many of the products we manufacture or purchase and resell and some of our key production inputs are commodities whose price is determined by the market's supply and demand for such products. Price fluctuations in our selling prices and key costs have a significant effect on our financial performance. The markets for most of these commodities are cyclical and are primarily affected by various economic and industry factors, including the strength of the U.S. housing market, net import and export activity, changes in or disruptions to industry production capacity, changes in inventory levels, and other factors beyond our control. For further discussion of commodity price risk, refer to "Item 1A. Risk Factors" of this Form 10-K and "Factors That Affect Our Operating Results and Trends" in this Management's Discussion and Analysis of Financial Condition and Results of Operations.
Financial Instruments
The table below provides information as of December 31, 2017, about our financial instruments that are sensitive to changes in interest rates. The table presents principal cash flows and related weighted average interest rates by expected maturity dates. For obligations with variable interest rate sensitivity, the table sets forth payout amounts based on December 31, 2017 rates and does not attempt to project future rates. Other instruments subject to market risk, such as obligations for pension plans and other postretirement benefits, are not reflected in the table.
December 31, 2017 | |||||||||||||||||||||||||||||||
2018 | 2019 | 2020 | 2021 | 2022 | There- after | Total | Fair Value (b) | ||||||||||||||||||||||||
(millions, other than percentages) | |||||||||||||||||||||||||||||||
Long-term debt | |||||||||||||||||||||||||||||||
Fixed-rate debt payments (a) | |||||||||||||||||||||||||||||||
Senior Notes | $ | — | $ | — | $ | — | $ | — | $ | — | $ | 350.0 | $ | 350.0 | $ | 369.3 | |||||||||||||||
Average interest rates | — | — | — | — | — | 5.625 | % | 5.625 | % | — | |||||||||||||||||||||
Variable-rate debt payments (a) | |||||||||||||||||||||||||||||||
Term Loans | $ | — | $ | — | $ | — | $ | — | $ | 50.0 | $ | 45.0 | $ | 95.0 | $ | 95.0 | |||||||||||||||
Average interest rates | — | — | — | — | 2.5 | % | 2.7 | % | 2.6 | % | — | ||||||||||||||||||||
_______________________________________
43
(a) | These obligations are further explained in Note 7, Debt, of the Notes to Consolidated Financial Statements in "Item 8. Financial Statements and Supplementary Data" of this Form 10-K. The table assumes our long-term debt is held to maturity. |
(b) | We estimated the fair value using quoted market prices of our debt in inactive markets. |
The table below provides information as of December 31, 2017, about our interest rate swaps. For information on interest rate swaps, see Interest Rate Risk and Interest Rate Swaps of Note 13, Financial Instrument Risk, of the Notes to Consolidated Financial Statements in "Item 8. Financial Statements and Supplementary Data" of this Form 10-K. The following is information about the notional amount and interest rate by contractual maturity date for our interest rate swap agreements, as well as the fair value of the asset at December 31, 2017:
December 31, 2017 | |||||||||||||||||||||||||||||||
2018 | 2019 | 2020 | 2021 | 2022 | There- after | Total | Fair Value | ||||||||||||||||||||||||
(millions, other than percentages) | |||||||||||||||||||||||||||||||
Interest rate swaps | |||||||||||||||||||||||||||||||
Variable to fixed notional amount | $ | — | $ | — | $ | — | $ | — | $ | 125.0 | $ | — | $ | 125.0 | $ | 4.7 | |||||||||||||||
Average pay rate (a) | — | — | — | — | 1.2 | % | — | % | 1.2 | % | — | ||||||||||||||||||||
Average receive rate (b) | — | — | — | — | 1.5 | % | — | % | 1.5 | % | — | ||||||||||||||||||||
_______________________________________
(a) | Represents the weighted average actual fixed interest rate payable on our interest rate swaps. |
(b) | Represents the weighted average variable interest rate receivable on our interest rate swaps at December 31, 2017. |
Environmental
We are subject to a wide range of general and industry-specific environmental laws and regulations. In particular, we are affected by laws and regulations covering air emissions, wastewater discharges, solid and hazardous waste management, and site remediation. Compliance with these laws and regulations is a significant factor in the operation of our businesses. We believe that we have created a corporate culture of strong compliance by taking a conservative approach to environmental issues in order to assure that we are operating well within the bounds of regulatory requirements. However, we cannot guarantee that we will be in compliance with environmental requirements at all times, and we cannot guarantee that we will not incur fines and penalties in the future. In 2017, we paid an insignificant amount in environmental fines and penalties across our segments.
We incur capital and operating expenditures to comply with federal, state, and local environmental laws and regulations. Failure to comply with these laws and regulations could result in civil or criminal fines or penalties or in enforcement actions. Our failure to comply could also result in governmental or judicial orders that stop or interrupt our operations or require us to take corrective measures, install additional pollution control equipment, or take other remedial actions. During 2017, we spent approximately $2 million on capital expenditures to comply with environmental requirements. We expect to spend approximately $1 million in 2018 for this purpose.
As an owner and operator of real estate, we may be liable under environmental laws for the cleanup of past and present spills and releases of hazardous or toxic substances on or from our properties and operations. We can be found liable under these laws whether or not we knew of, or were responsible for, the presence of such substances. In some cases, this liability may exceed the value of the property itself.
In connection with prior transactions, certain third parties are generally obligated to indemnify us for hazardous substance releases and other environmental violations that occurred prior to such transactions. However, these third parties may not have sufficient funds to fully satisfy their indemnification obligations when required, and in some cases, we may not be contractually entitled to indemnification by them.
Climate Change
In recent years, various legislative and regulatory proposals to restrict emissions of greenhouse gases (GHG), such as CO2, have been under consideration in state legislative bodies and the Environmental Protection Agency (EPA). These proposals have included regulations to reduce GHG emissions from new and existing electric utilities, commonly referred to as
44
the Clean Power Plan. These proposals may result in increased electricity and natural gas prices as electric utilities convert from coal to natural gas. In addition, most of our manufacturing facilities operate boilers or other process equipment that emit GHG. Various regulatory initiatives may require us to modify operating procedures or production levels, incur capital expenditures, change fuel sources, or take other actions that may adversely affect our financial results. However, climate change regulation is in a state of uncertainty. The United States has withdrawn from the Paris Climate Accords, and the EPA is currently undergoing review of the Clean Power Plan to reverse or significantly limit it. It is possible that the EPA may seek to overturn the GHG endangerment finding which could eliminate the federal requirement to regulate GHG’s. States are taking various positions on climate change regulation. For example, Oregon and Washington may enact new legislation that could impose additional costs on our businesses, while other states may follow federal government regulation. Given the high degree of uncertainty about the ultimate parameters of any GHG regulatory initiatives, it is premature to make any prediction concerning such impacts.
Other Regulatory Initiatives
From time to time, legislative bodies and environmental regulatory agencies may promulgate new regulatory programs imposing significant incremental operating costs or capital costs on us. In 2016 our facilities began complying with the final Boiler MACT regulations, which regulate the emission of hazardous air pollutants from industrial boilers. There is on-going litigation of these regulations and there are pending revisions to certain boiler MACT standards. Any changes to these regulations could require changes to our compliance strategies and therefore could result in additional operating or capital expenditures to be in compliance with the revised regulations. However, at this time we are unable to predict the impact to our business due to the uncertainty.
Some of our wood products facilities are subject to the Plywood and Composite Wood Products (PCWP) MACT standards, and they have complied with these standards since 2007 or 2008. The EPA recently initiated the Risk and Technology Review (RTR) for PCWP sources as required by law for every MACT source category. EPA is under a court-ordered deadline to complete this RTR by June 2020. Wood products facilities subject to the PCWP MACT standards will be required to be in compliance with the revised PCWP MACT rule within 3 years of promulgation of the rule. At this time we are unable to predict the impact to our business due to the potential revisions to this rule.
The Oregon Department of Environmental Quality (ODEQ) released draft Cleaner Air Oregon (CAO) rules in late 2017. The rules are scheduled to be finalized by mid-year 2018, though that timeline could be extended. The CAO rules, once finalized, will regulate air toxic emissions for facilities located in Oregon. Nine of our nineteen wood products mills will be subject to the final rules. We have reviewed those rules and provided comments to the ODEQ. As proposed, these rules will require Oregon mills to mitigate risk to the public from air toxic emissions. Facilities must first determine this risk through modeling and risk assessment processes. Depending on the level of modeling required, the facilities will incur expenses to evaluate the risk to the public. Facilities may be required to incur additional operating or capital expenditures to mitigate any significant risk. Until the rules are finalized and facilities have conducted their risk assessments in accordance with the new rule, we are unable to predict the impact on our business.
Critical Accounting Estimates
The preparation of financial statements in accordance with generally accepted accounting principles in the United States of America requires management to make estimates and assumptions about future events. These estimates and the underlying assumptions affect the amounts of assets and liabilities reported, disclosures about contingent assets and liabilities, and reported amounts of revenues and expenses. Actual results could differ from these estimates. We believe that the accounting estimates discussed below represent the accounting estimates requiring the exercise of judgment where a different set of judgments could result in the greatest changes to reported results. We reviewed the development, selection, and disclosure of our critical accounting estimates with the Audit Committee of our board of directors. Our current critical accounting estimates are as follows:
Pensions
We calculate pension expense and liabilities based on existing retirement plan provisions currently in effect using actuarial assumptions, including discount rates, expected return on plan assets, expected rate of compensation increases, retirement and mortality rates, expected contributions, and other factors. We based the assumptions used to calculate pension expense on the following factors:
Discount Rate Assumption. The discount rate reflects the current rate at which the pension obligations could be settled based on the measurement dates of the plans — December 31. In all years presented, the discount rates were determined by
45
matching the expected plan benefit payments against a spot rate yield curve constructed to replicate the yields of Aa-rated corporate bonds.
Asset Return Assumption. We base our expected long-term rate of return on plan assets on a weighted average of our expected returns for the major asset classes (equities, fixed-income securities, and a hedge fund) in which we invest. The weights we assign each asset class are based on our investment strategy. Expected returns for the asset classes are based on long-term historical returns, inflation expectations, forecasted gross domestic product, earnings growth, and other economic factors. We developed our return assumption based on a review of the fund manager's estimates of future market expectations by broad asset class, and expected long-term rates of return from external investment managers. In 2017, the investment return on our pension asset portfolio was approximately 13%, as global economic and earnings growth, along with supportive monetary and fiscal policies, led to returns across the plan's U.S. and international equity investments in excess of 20%. The investment returns were above our weighted average expected return on plan assets of 5.00% for 2017. In 2016, the investment return on our pension asset portfolio was approximately 7.50%, driven primarily by the relative strength of the U.S. economy and low double-digit returns across the plan's U.S. equity investments. The investment returns were above our weighted average expected return on plan assets of 5.10% for 2016. The weighted average expected return on plan assets we will use in our calculation of 2018 net periodic benefit cost is 4.75%, which is lower than our expected return on plan assets for 2017 due to the transition of a higher proportion of the plan's assets into fixed income securities.
Rate of Compensation Increases. Pension benefits for all salaried employees are frozen, resulting in an assumption for the rate of compensation increase of zero. In addition to the salaried benefits being frozen, there are currently no scheduled increases in pension benefit rates applicable to past service covering a minimal amount of hourly employees who continue to accrue benefits.
Retirement and Mortality Rates. These rates are developed to reflect actual and projected plan experience. In 2017, we used the RP-2014 mortality tables adjusted to reflect the new two-dimensional mortality improvement scale MP-2017. In 2016, we used the RP-2014 mortality tables adjusted to reflect the two-dimensional mortality improvement scale MP-2016.
Expected Contributions. In 2017, we made $2.2 million in cash contributions to our pension plans. We expect to contribute approximately $2 million to our pension plans in 2018. The 2018 contributions reflect benefit payments to plan participants of our nonqualified salaried pension plans and lease payments for properties we have contributed to our qualified defined benefit pension plan. For information related to pension contributions, see "Cash Flows" in Note 9, Retirement and Benefit Plans, of the Notes to Consolidated Financial Statements in "Item 8. Financial Statements and Supplementary Data" in this Form 10-K.
We recognize the funded status of our pension plans on our Consolidated Balance Sheets and recognize the actuarial and experience gains and losses, net of tax, in our Consolidated Statements of Comprehensive Income. Actual results that differ from assumptions are accumulated and amortized over future periods and, therefore, generally affect recognized expense in future periods. While we believe that the assumptions used to measure our pension obligations are reasonable, differences in actual experience or changes in assumptions may materially affect our pension obligations and future expense.
We believe that the accounting estimate related to pensions is a critical accounting estimate because it is highly susceptible to change from period to period. The future effects of pension plans on our financial position and results of operations will depend on economic conditions, employee demographics, mortality rates, retirement rates, investment performance, the pension regulatory environment, benefit plan design, and funding decisions, among other factors. The following table presents selected assumptions used and expected to be used in the measurement of pension expense in the following periods:
Year Ending December 31, | Year Ended December 31 | |||||||||||||
2018 | 2017 | 2016 | ||||||||||||
(millions, except for percentages) | ||||||||||||||
Pension expense | $ | 1.8 | $ | 1.5 | $ | 6.2 | ||||||||
Discount rate (a) | 3.40 | % | 3.90 | % | 4.05 | % | / | 3.45 | % | |||||
Expected rate of return on plan assets (a) | 4.75 | % | 5.00 | % | 5.10 | % | / | 5.10 | % | |||||
Rate of compensation increases (b) | — | — | — | |||||||||||
_______________________________________
46
(a) | Prior to the remeasurement of our qualified defined benefit pension plan on November 1, 2016, the discount rate and expected rate of return on plan assets were 4.05% and 5.10%, respectively. The discount rate and expected rate of return on plan assets after the November 1, 2016, remeasurement were 3.45% and 5.10%, respectively. For information related to the remeasurement, see "Defined Benefit Plans" in Note 9, Retirement and Benefit Plans, of the Notes to Consolidated Financial Statements in "Item 8. Financial Statements and Supplementary Data" in this Form 10-K. |
(b) | The compensation increase is zero due to the fact that pension benefits for salaried employees are frozen. In addition to the salaried benefits being frozen, there are currently no scheduled increases in pension benefit rates applicable to past service covering a minimal amount of hourly employees who continue to accrue benefits. |
A change of 0.25% in either direction to the discount rate or the expected rate of return on plan assets would result in the following effect on 2018 and 2017 pension expense. These sensitivities are specific to 2018 and 2017. The sensitivities may not be additive, so the impact of changing multiple factors simultaneously cannot be calculated by combining the individual sensitivities shown.
Increase (Decrease) in Pension Expense | |||||||||||
Base Expense | 0.25 % Increase | 0.25% Decrease | |||||||||
(millions) | |||||||||||
2018 Expense | |||||||||||
Discount rate | $ | 1.8 | $ | (1.1 | ) | $ | 1.1 | ||||
Expected rate of return on plan assets | 1.8 | (1.0 | ) | 1.0 | |||||||
2017 Expense | |||||||||||
Discount rate | $ | 1.5 | $ | (1.1 | ) | $ | 1.1 | ||||
Expected rate of return on plan assets | 1.5 | (0.9 | ) | 0.9 | |||||||
Income Taxes
Our income tax expense, deferred tax assets and liabilities and liabilities for unrecognized tax benefits reflect management’s best estimate of current and future taxes to be paid. We are subject to income taxes in the U.S. and foreign jurisdictions. Significant judgments and estimates are required in the determination of the consolidated income tax expense.
Deferred income taxes arise from temporary differences between the tax basis of assets and liabilities and their reporting amounts in the financial statements, which will result in taxable or deductible amounts in the future. In evaluating our ability to recover our deferred tax assets in the jurisdiction from which they arise, we consider all available positive and negative evidence, including scheduled reversals of deferred tax liabilities, projected future taxable income, tax-planning strategies, and results of recent operations. The assumptions about future taxable income require the use of significant judgment and are consistent with the plans and estimates we are using to manage the underlying business. In evaluating the objective evidence that historical results provide, we consider three years of cumulative operating income (loss).
In the event that we determine that a deferred tax asset will not be realized, a valuation allowance is recorded against the deferred tax asset with a corresponding charge to tax expense in the period we make such determination. Based upon our projections, we believe it is more likely than not that we will realize the benefits of substantially all of these deductible differences.
As of December 31, 2017 and 2016, the deferred tax assets in our foreign subsidiaries were primarily the result of net operating losses. During fourth quarter 2016, because we achieved three years of cumulative pretax income in the Canadian tax jurisdiction and due to the implementation of a tax-planning strategy, management determined that there is sufficient positive evidence to conclude that it is more likely than not that the deferred tax assets are realizable and therefore released the valuation allowance in the amount of $9.9 million. As of December 31, 2017, we have foreign income tax net operating loss carryforwards of $23.3 million, which will expire beginning in 2026 through 2036 if not used.
The calculation of our tax liabilities involves dealing with uncertainties in the application of complex tax laws and regulations in a multitude of jurisdictions across our operations. Accounting Standards Codification 740, Income Taxes, (ASC 740) states that a tax benefit from an uncertain tax position may be recognized when it is more likely than not that the position will be sustained upon examination, including resolutions of any related appeals or litigation processes, on the basis of the technical merits.
47
We record unrecognized tax benefits as liabilities in accordance with ASC 740 and adjust these liabilities when our judgment changes as a result of the evaluation of new information not previously available. Because of the complexity of some of these uncertainties, the ultimate resolution may result in a payment that is materially different from our current estimate of the unrecognized tax liabilities. These differences will be reflected as increases or decreases to income tax expense in the period in which new information is available.
EWP Rebates and Allowances
We provide EWP rebates at various stages of the supply chain (including distributors, retail lumberyards, and professional builders) as a means to increase sales. EWP rebates are based on the volume of purchases (measured in dollars or units), among other factors such as customer loyalty, conversion, and commitment incentives, as well as temporary protection from price increases. EWP rebate estimates are based on the expected amount to be paid and are recorded as a decrease in "Sales" as revenue is recognized. The estimate of EWP rebates is inherently difficult due to information limitations as the products transition beyond our wholesale customers and through the supply chain to professional builders. In addition, some EWP rebate accruals are estimated based on achievement of tiered sales levels, which require management to forecast sales throughout the supply chain, using incentive terms that vary at each level. Information that we consider to estimate sales activity at retail lumberyards and professional homebuilders includes historical sales information, sales projections, publicly available information of housing starts by homebuilder, residential development audits, and economic forecasts of new residential construction, among other economic data. We update these forecasts on a regular basis. We adjust our estimate of revenue at the earlier of the time when the probability of EWP rebates paid changes or the time when the amounts of rebates become fixed. Because of the complexity of some of these rebates, the ultimate resolution may result in payments that are materially different from our current estimate of EWP rebates payable. At December 31, 2017 and 2016, we had $35.7 million and $23.8 million, respectively, of EWP rebates payable recorded in "Accrued liabilities, Other" on our Consolidated Balance Sheets.
Long-Lived Asset Impairment
We review long-lived assets for impairment when events or changes in circumstances indicate that the carrying amount of assets may not be recoverable (trigger event). An impairment of a long-lived asset exists when the carrying value is not recoverable through future undiscounted cash flows from operations and when the carrying value of an asset or asset group exceeds its fair value.
To the extent a trigger event is identified, we would be required to estimate the fair value of an asset or asset group, and long-lived asset impairment would become a critical accounting estimate. We estimate the fair value of an asset or asset group based on quoted market prices for similar assets (the amount for which the asset(s) could be bought or sold in a current transaction with a third party) when available (Level 2 measurement). When quoted market prices are not available, we use a discounted cash flow model to estimate fair value (Level 3 measurement). To measure future cash flows, we are required to make assumptions about future production volumes, future product pricing, and future expenses to be incurred. Estimates of future cash flows may change based on overall economic conditions, the cost and availability of wood fiber, environmental requirements, capital spending, and other strategic management decisions.
Factors such as lower than anticipated growth in single-family housing starts, loss of key customers, capacity additions by competitors, or changes in raw material or manufacturing costs that lead us to believe the long-lived asset will no longer provide a sufficient return on investment, could prompt decisions to curtail operations or to invest capital differently than expected. Any of these factors, among others, could result in noncash impairment charges in the future with respect to long-lived assets, which could have a material impact on our results of operations in the period in which an impairment is recognized. Due to the numerous variables associated with our judgments and assumptions relating to the valuation of assets and the effects of changes on these valuations, both the precision and reliability of our estimates are subject to uncertainty. As additional information becomes known, we may change our estimates.
New and Recently Adopted Accounting Standards
For information related to new and recently adopted accounting standards, see "New and Recently Adopted Accounting Standards" in Note 2, Summary of Significant Accounting Policies, of the Notes to Consolidated Financial Statements in "Item 8. Financial Statements and Supplementary Data" in this Form 10-K.
48
ITEM 7A. QUANTITATIVE AND QUALITATIVE DISCLOSURES ABOUT MARKET RISK
Information concerning quantitative and qualitative disclosures about market risk is included under the captions "Disclosures of Financial Market Risks" and "Financial Instruments" in "Item 7. Management's Discussion and Analysis of Financial Condition and Results of Operations" of this Form 10-K.
49
ITEM 8. | FINANCIAL STATEMENTS AND SUPPLEMENTARY DATA |
Boise Cascade Company Consolidated Statements of Operations | ||||||||||||
Year Ended December 31 | ||||||||||||
2017 | 2016 | 2015 | ||||||||||
(thousands, except per-share data) | ||||||||||||
Sales | $ | 4,431,991 | $ | 3,911,215 | $ | 3,633,415 | ||||||
Costs and expenses | ||||||||||||
Materials, labor, and other operating expenses (excluding depreciation) | 3,819,659 | 3,398,433 | 3,153,520 | |||||||||
Depreciation and amortization | 80,379 | 72,847 | 55,578 | |||||||||
Selling and distribution expenses | 327,355 | 300,797 | 273,308 | |||||||||
General and administrative expenses | 63,068 | 60,585 | 49,425 | |||||||||
Other (income) expense, net | 377 | (1,025 | ) | (1,605 | ) | |||||||
4,290,838 | 3,831,637 | 3,530,226 | ||||||||||
Income from operations | 141,153 | 79,578 | 103,189 | |||||||||
Foreign currency exchange gain (loss) | 720 | 119 | (298 | ) | ||||||||
Interest expense | (25,370 | ) | (26,692 | ) | (22,532 | ) | ||||||
Interest income | 547 | 390 | 323 | |||||||||
Change in fair value of interest rate swaps | 538 | 4,210 | — | |||||||||
Loss on extinguishment of debt | — | (14,304 | ) | — | ||||||||
(23,565 | ) | (36,277 | ) | (22,507 | ) | |||||||
Income before income taxes | 117,588 | 43,301 | 80,682 | |||||||||
Income tax provision | (34,631 | ) | (5,047 | ) | (28,500 | ) | ||||||
Net income | $ | 82,957 | $ | 38,254 | $ | 52,182 | ||||||
Weighted average common shares outstanding: | ||||||||||||
Basic | 38,623 | 38,761 | 39,239 | |||||||||
Diluted | 39,074 | 38,925 | 39,355 | |||||||||
Net income per common share: | ||||||||||||
Basic | $ | 2.15 | $ | 0.99 | $ | 1.33 | ||||||
Diluted | $ | 2.12 | $ | 0.98 | $ | 1.33 | ||||||
See accompanying notes to consolidated financial statements.
50
Boise Cascade Company Consolidated Statements of Comprehensive Income | |||||||||||
Year Ended December 31 | |||||||||||
2017 | 2016 | 2015 | |||||||||
(thousands) | |||||||||||
Net income | $ | 82,957 | $ | 38,254 | $ | 52,182 | |||||
Other comprehensive income, net of tax | |||||||||||
Defined benefit pension plans | |||||||||||
Actuarial gain, net of tax of $1,792, $3,703, 3,235 and respectively | 5,275 | 5,919 | 5,171 | ||||||||
Amortization of actuarial loss, net of tax of $651, $957, and $1,880, respectively | 1,035 | 1,527 | 3,004 | ||||||||
Effects of settlements, net of tax of $0, $1,598, and $193, respectively | — | 2,557 | 308 | ||||||||
Other comprehensive income, net of tax | 6,310 | 10,003 | 8,483 | ||||||||
Comprehensive income | $ | 89,267 | $ | 48,257 | $ | 60,665 | |||||
See accompanying notes to consolidated financial statements.
51
Boise Cascade Company Consolidated Balance Sheets | ||||||||
December 31 | ||||||||
2017 | 2016 | |||||||
(thousands) | ||||||||
ASSETS | ||||||||
Current | ||||||||
Cash and cash equivalents | $ | 177,140 | $ | 103,978 | ||||
Receivables | ||||||||
Trade, less allowances of $945 and $1,459 | 246,452 | 199,191 | ||||||
Related parties | 345 | 506 | ||||||
Other | 9,380 | 10,952 | ||||||
Inventories | 476,673 | 433,451 | ||||||
Prepaid expenses and other | 22,582 | 12,381 | ||||||
Total current assets | 932,572 | 760,459 | ||||||
Property and equipment, net | 565,792 | 568,702 | ||||||
Timber deposits | 13,503 | 14,901 | ||||||
Goodwill | 55,433 | 55,433 | ||||||
Intangible assets, net | 15,066 | 15,547 | ||||||
Deferred income taxes | 9,064 | 8,840 | ||||||
Other assets | 15,763 | 15,315 | ||||||
Total assets | $ | 1,607,193 | $ | 1,439,197 | ||||
See accompanying notes to consolidated financial statements.
52
Boise Cascade Company Consolidated Balance Sheets (continued) | ||||||||
December 31 | ||||||||
2017 | 2016 | |||||||
(thousands, except per-share data) | ||||||||
LIABILITIES AND STOCKHOLDERS' EQUITY | ||||||||
Current | ||||||||
Accounts payable | ||||||||
Trade | $ | 233,562 | $ | 194,010 | ||||
Related parties | 1,225 | 1,903 | ||||||
Accrued liabilities | ||||||||
Compensation and benefits | 84,246 | 67,752 | ||||||
Interest payable | 6,742 | 6,860 | ||||||
Other | 55,786 | 42,339 | ||||||
Total current liabilities | 381,561 | 312,864 | ||||||
Debt | ||||||||
Long-term debt | 438,312 | 437,629 | ||||||
Other | ||||||||
Compensation and benefits | 75,439 | 83,164 | ||||||
Deferred income taxes | 16,454 | 6,339 | ||||||
Other long-term liabilities | 20,878 | 19,197 | ||||||
112,771 | 108,700 | |||||||
Commitments and contingent liabilities | ||||||||
Stockholders' equity | ||||||||
Preferred stock, $0.01 par value per share; 50,000 shares authorized, no shares issued and outstanding | — | — | ||||||
Common stock, $0.01 par value per share; 300,000 shares authorized, 43,748 and 43,520 shares issued, respectively | 437 | 435 | ||||||
Treasury stock, 5,167 shares at cost | (133,979 | ) | (133,979 | ) | ||||
Additional paid-in capital | 523,550 | 515,410 | ||||||
Accumulated other comprehensive loss | (76,702 | ) | (83,012 | ) | ||||
Retained earnings | 361,243 | 281,150 | ||||||
Total stockholders' equity | 674,549 | 580,004 | ||||||
Total liabilities and stockholders' equity | $ | 1,607,193 | $ | 1,439,197 | ||||
See accompanying notes to consolidated financial statements.
53
Boise Cascade Company Consolidated Statements of Cash Flows | ||||||||||||
Year Ended December 31 | ||||||||||||
2017 | 2016 | 2015 | ||||||||||
(thousands) | ||||||||||||
Cash provided by (used for) operations | ||||||||||||
Net income | $ | 82,957 | $ | 38,254 | $ | 52,182 | ||||||
Items in net income not using (providing) cash | ||||||||||||
Depreciation and amortization, including deferred financing costs and other | 82,321 | 74,927 | 57,197 | |||||||||
Stock-based compensation | 9,730 | 8,177 | 5,825 | |||||||||
Pension expense | 1,464 | 6,240 | 2,825 | |||||||||
Deferred income taxes | 8,117 | (7,823 | ) | 30,883 | ||||||||
Change in fair value of interest rate swaps | (538 | ) | (4,210 | ) | — | |||||||
Other | 376 | 491 | (1,837 | ) | ||||||||
Loss on extinguishment of debt | — | 14,304 | — | |||||||||
Decrease (increase) in working capital, net of acquisitions | ||||||||||||
Receivables | (41,778 | ) | (1,118 | ) | (18,182 | ) | ||||||
Inventories | (43,222 | ) | (30,757 | ) | 9,604 | |||||||
Prepaid expenses and other | (887 | ) | (1,614 | ) | (985 | ) | ||||||
Accounts payable and accrued liabilities | 68,124 | 45,651 | 6,822 | |||||||||
Pension contributions | (2,193 | ) | (3,844 | ) | (54,257 | ) | ||||||
Income taxes payable | (14,292 | ) | 6,385 | (2,589 | ) | |||||||
Other | 1,388 | 6,844 | (7,157 | ) | ||||||||
Net cash provided by operations | 151,567 | 151,907 | 80,331 | |||||||||
Cash provided by (used for) investment | ||||||||||||
Expenditures for property and equipment | (75,450 | ) | (83,583 | ) | (87,526 | ) | ||||||
Acquisitions of businesses and facilities | — | (215,900 | ) | — | ||||||||
Proceeds from sales of assets and other | 2,238 | 644 | 3,134 | |||||||||
Net cash used for investment | (73,212 | ) | (298,839 | ) | (84,392 | ) | ||||||
Cash provided by (used for) financing | ||||||||||||
Borrowings of long-term debt, including revolving credit facility | 410,400 | 837,800 | 50,000 | |||||||||
Payments of long-term debt, including revolving credit facility | (410,400 | ) | (754,071 | ) | — | |||||||
Treasury stock purchased | — | (10,268 | ) | (23,711 | ) | |||||||
Financing costs | (478 | ) | (6,422 | ) | (702 | ) | ||||||
Tax withholding payments on stock-based awards | (2,902 | ) | (383 | ) | (1,160 | ) | ||||||
Proceeds from exercise of stock options | 1,144 | — | 237 | |||||||||
Dividends paid on common stock | (2,701 | ) | — | — | ||||||||
Other | (256 | ) | (242 | ) | 344 | |||||||
Net cash provided by (used for) financing | (5,193 | ) | 66,414 | 25,008 | ||||||||
Net increase (decrease) in cash and cash equivalents | 73,162 | (80,518 | ) | 20,947 | ||||||||
Balance at beginning of the period | 103,978 | 184,496 | 163,549 | |||||||||
Balance at end of the period | $ | 177,140 | $ | 103,978 | $ | 184,496 | ||||||
See accompanying notes to consolidated financial statements.
54
Boise Cascade Company Consolidated Statements of Stockholders' Equity | |||||||||||||||||||||||||||||
Common Stock | Treasury Stock | Additional Paid-In Capital | Accumulated Other Comprehensive Loss | Retained Earnings | Total | ||||||||||||||||||||||||
Shares | Amount | Shares | Amount | ||||||||||||||||||||||||||
(thousands) | |||||||||||||||||||||||||||||
Balance at December 31, 2014 | 43,282 | $ | 433 | 3,864 | $ | (100,000 | ) | $ | 502,739 | $ | (101,498 | ) | $ | 190,714 | $ | 492,388 | |||||||||||||
Net income | 52,182 | 52,182 | |||||||||||||||||||||||||||
Other comprehensive income | 8,483 | 8,483 | |||||||||||||||||||||||||||
Common stock issued | 131 | 1 | — | 1 | |||||||||||||||||||||||||
Treasury stock purchased | 723 | (23,711 | ) | (23,711 | ) | ||||||||||||||||||||||||
Stock-based compensation | 5,825 | 5,825 | |||||||||||||||||||||||||||
Other | (498 | ) | (498 | ) | |||||||||||||||||||||||||
Balance at December 31, 2015 | 43,413 | $ | 434 | 4,587 | $ | (123,711 | ) | $ | 508,066 | $ | (93,015 | ) | $ | 242,896 | $ | 534,670 | |||||||||||||
Net income | 38,254 | 38,254 | |||||||||||||||||||||||||||
Other comprehensive income | 10,003 | 10,003 | |||||||||||||||||||||||||||
Common stock issued | 107 | 1 | — | 1 | |||||||||||||||||||||||||
Treasury stock purchased | 580 | (10,268 | ) | (10,268 | ) | ||||||||||||||||||||||||
Stock-based compensation | 8,177 | 8,177 | |||||||||||||||||||||||||||
Other | (833 | ) | (833 | ) | |||||||||||||||||||||||||
Balance at December 31, 2016 | 43,520 | $ | 435 | 5,167 | $ | (133,979 | ) | $ | 515,410 | $ | (83,012 | ) | $ | 281,150 | $ | 580,004 | |||||||||||||
Net income | 82,957 | 82,957 | |||||||||||||||||||||||||||
Other comprehensive income | 6,310 | 6,310 | |||||||||||||||||||||||||||
Common stock issued | 228 | 2 | — | 2 | |||||||||||||||||||||||||
Stock-based compensation | 9,730 | 9,730 | |||||||||||||||||||||||||||
Common stock dividends ($0.07 per share) | (2,760 | ) | (2,760 | ) | |||||||||||||||||||||||||
Tax withholding payments on stock-based awards | (2,902 | ) | (2,902 | ) | |||||||||||||||||||||||||
Proceeds from exercise of stock options | 1,144 | 1,144 | |||||||||||||||||||||||||||
Other | 168 | (104 | ) | 64 | |||||||||||||||||||||||||
Balance at December 31, 2017 | 43,748 | $ | 437 | 5,167 | $ | (133,979 | ) | $ | 523,550 | $ | (76,702 | ) | $ | 361,243 | $ | 674,549 | |||||||||||||
See accompanying notes to consolidated financial statements.
55
Notes to Consolidated Financial Statements
1. Nature of Operations and Basis of Presentation
Boise Cascade Company is a building products company headquartered in Boise, Idaho. Our operations began on October 29, 2004 (inception), when we acquired the forest products assets of OfficeMax, Incorporated. As used in these consolidated financial statements, the terms "Boise Cascade," "we," and "our" refer to Boise Cascade Company and its consolidated subsidiaries. We are one of the largest producers of engineered wood products (EWP) and plywood in North America and a leading United States (U.S.) wholesale distributor of building products.
We operate our business using two reportable segments: (1) Wood Products, which manufactures EWP, plywood, ponderosa pine lumber, studs, and particleboard, and (2) Building Materials Distribution, which is a wholesale distributor of building materials. For more information, see Note 14, Segment Information.
2. Summary of Significant Accounting Policies
Principles of Consolidation
The consolidated financial statements include the accounts of Boise Cascade and its subsidiaries. Intercompany balances and transactions have been eliminated.
Use of Estimates
The preparation of financial statements in conformity with accounting principles generally accepted in the United States of America (GAAP) requires management to make estimates and assumptions about future events. These estimates and the underlying assumptions affect the amounts of assets and liabilities reported, disclosures about contingent assets and liabilities, and reported amounts of revenues and expenses. Such estimates include the valuation of accounts receivable, inventories, goodwill, intangible assets, and other long-lived assets; legal contingencies; guarantee obligations; indemnifications; assumptions used in retirement, medical, and workers' compensation benefits; stock-based compensation; fair value measurements; income taxes; and vendor and customer rebates, among others. These estimates and assumptions are based on management's best estimates and judgment. Management evaluates its estimates and assumptions on an ongoing basis using historical experience and other factors, including the current economic environment, which management believes to be reasonable under the circumstances. We adjust such estimates and assumptions when facts and circumstances dictate. As future events and their effects cannot be determined with precision, actual results could differ significantly from these estimates. Changes in these estimates resulting from continuing changes in the economic environment will be reflected in the consolidated financial statements in future periods.
Revenue Recognition
We recognize revenue when the following criteria are met: persuasive evidence of an arrangement exists, delivery has occurred or services have been rendered, our price to the buyer is fixed or determinable, and collectibility is reasonably assured. Delivery is not considered to have occurred until the customer takes title and assumes the risks and rewards of ownership. The timing of revenue recognition is dependent on shipping terms. Revenue is recorded at the time of shipment for terms designated free on board (fob) shipping point. For sales transactions designated fob destination, revenue is recorded when the product is delivered to the customer's delivery site.
Fees for shipping and handling charged to customers for sales transactions are included in "Sales." For our Wood Products segment, costs related to shipping and handling are included in "Materials, labor, and other operating expenses (excluding depreciation)." In our Wood Products segment, we view our shipping and handling costs as a cost of the manufacturing process and the movement of product to our end customers. For our Building Materials Distribution segment, costs related to shipping and handling of $139.4 million, $121.6 million, and $109.2 million are included in "Selling and distribution expenses" for the years ended December 31, 2017, 2016, and 2015, respectively. In our Building Materials Distribution segment, our activities relate to the purchase and resale of finished product, and excluding shipping and handling costs from “Materials, labor, and other operating expenses (excluding depreciation)” provides us a clearer view of our operating performance and the effectiveness of our sales and purchasing functions.
56
Cash and Cash Equivalents
Cash equivalents consist of short-term investments that have a maturity of three months or less at the date of purchase. At December 31, 2017 and 2016, the majority of our cash and cash equivalents were invested in money market funds that are broadly diversified and invested in high-quality, short-duration securities, including commercial paper, certificates of deposit, U.S. government agency securities, and similar instruments. We have significant amounts of cash and cash equivalents that are in excess of federally insured limits. Though we have not experienced any losses on our cash and cash equivalents to date and we do not anticipate incurring any losses, we cannot be assured that we will not experience losses on our cash and cash equivalents.
Trade Accounts Receivables and Allowance for Doubtful Accounts
Trade accounts receivable are stated at the amount we expect to collect. Trade accounts receivable do not bear interest. We make ongoing estimates relating to the collectibility of our accounts receivable and maintain a reserve for estimated losses resulting from the inability of our customers to meet their financial obligations to us. At December 31, 2017 and 2016, we had $0.9 million and $1.5 million, respectively, recorded as allowances for doubtful accounts. In determining the amount of the reserve and in order to manage credit risk, we consider our historical level of credit losses, customer concentrations, and current economic trends and monitor the creditworthiness of significant customers based on ongoing credit evaluations. Our sales are principally to customers in the building products industry located in the U.S. and Canada. A significant portion of our sales are concentrated with a relatively small number of customers. In 2017, our top ten customers represented approximately 35% of sales, with no customer accounting for 10% or more of total sales. At December 31, 2017, receivables from two customers accounted for approximately 12% and 15% of total receivables. At December 31, 2016, receivables from these two customers accounted for approximately 11% and 12% of total receivables. No other customer accounted for 10% or more of total receivables. Adjustments to the valuation allowance are charged to income. Trade accounts receivable balances that remain outstanding after we have used reasonable collection efforts are written off through a charge to the valuation allowance and a credit to accounts receivable. Although we have not experienced material credit losses in recent years, our actual future losses from uncollectible accounts may differ materially from our current estimates. As additional information becomes known, we may change our estimates. In the event we determine that a change in the reserve is appropriate, we will record a charge to "Selling and distribution expenses" in our Consolidated Statements of Operations in the period we make such a determination.
Fair Value
Fair value is defined as the price that would be received to sell an asset or paid to transfer a liability in an orderly transaction between market participants at the measurement date. The fair value hierarchy under GAAP gives the highest priority to quoted market prices (Level 1) and the lowest priority to unobservable inputs (Level 3). In general, and where applicable, we use quoted prices in active markets for identical assets or liabilities to determine fair value (Level 1). If quoted prices in active markets for identical assets or liabilities are not available to determine fair value, we use quoted prices for similar assets and liabilities or inputs that are observable either directly or indirectly (Level 2). If quoted prices for identical or similar assets are not available or are unobservable, we may use internally developed valuation models, whose inputs include bid prices, and third-party valuations utilizing underlying asset assumptions (Level 3). See Note 9, Retirement and Benefit Plans, for the fair value measurements of our defined benefit plans' assets.
Financial Instruments
Our financial instruments are cash and cash equivalents, accounts receivable, accounts payable, long-term debt, and interest rate swaps. Our cash is recorded at cost, which approximates fair value, and our cash equivalents are money market funds. As of December 31, 2017 and 2016, we held $137.5 million and $78.1 million, respectively, in money market funds that are measured at fair value on a recurring basis using Level 1 inputs. The recorded values of accounts receivable and accounts payable approximate fair values based on their short-term nature. At December 31, 2017 and 2016, the book value of our fixed-rate debt for each period was $350.0 million, and the fair value was estimated to be $369.3 million and $347.4 million, respectively. The difference between the book value and the fair value is derived from the difference between the period-end market interest rate and the stated rate of our fixed-rate, long-term debt. We estimated the fair value of our fixed-rate debt using quoted market prices of our debt in inactive markets (Level 2 inputs). The interest rate on our term loans is based on market conditions such as the London Interbank Offered Rate (LIBOR) or a base rate. Because the interest rate on the term loans is based on current market conditions, we believe that the estimated fair value of the outstanding balance on our term loans approximates book value.
We are exposed to financial risks such as changes in interest rates, foreign currency exchange rates, and commodity price risk. We employ a variety of practices to manage these risks, including operating and financing activities and, where
57
deemed appropriate, the use of derivative instruments. As discussed in Note 13, Financial Instrument Risk, we use interest rate swaps to mitigate our variable interest rate exposure, the fair value of which is measured based on Level 2 inputs.
Vendor and Customer Rebates and Allowances
We receive rebates and allowances from our vendors under a number of different programs, including vendor marketing programs. At December 31, 2017 and 2016, we had $6.7 million and $7.0 million, respectively, of vendor rebates and allowances recorded in "Receivables, Other" on the Consolidated Balance Sheets. Rebates and allowances received from our vendors are recognized as a reduction of "Materials, labor, and other operating expenses (excluding depreciation)" when the product is sold, unless the rebates and allowances are linked to a specific incremental cost to sell a vendor's product. Amounts received from vendors that are linked to specific selling and distribution expenses are recognized as a reduction of "Selling and distribution expenses" in the period the expense is incurred.
We also provide rebates to our customers and our customers' customers based on the volume of their purchases. We provide the rebates to increase the sell-through of our products. The rebates are recorded as a decrease in "Sales." At December 31, 2017 and 2016, we had $45.5 million and $31.6 million, respectively, of rebates payable recorded in "Accrued liabilities, Other" on our Consolidated Balance Sheets.
Foreign Currency
The functional currency for our operations outside the United States is the U.S. dollar. Nonmonetary assets and liabilities and related depreciation and amortization for these foreign operations are remeasured into U.S. dollars using historical exchange rates. Monetary assets and liabilities are remeasured into U.S. dollars using the exchange rates as of the Consolidated Balance Sheet date. Revenue and expense items are remeasured into U.S. dollars using an average exchange rate prevailing during the year.
Leases
We assess lease classification as either capital or operating at lease inception or upon modification. We lease a portion of our distribution centers as well as other property and equipment under operating leases. Substantially all lease agreements have fixed payment terms based on the passage of time. Some lease agreements provide us with the option to purchase the leased property. Additionally, some agreements contain renewal options generally ranging from one to ten years, with fixed payment terms similar to those in the original lease agreements. For purposes of determining straight-line rent expense, the lease term is calculated from the date we first take possession of the facility, including any periods of free rent and any renewal option periods we are reasonably assured of exercising.
Income Taxes
We account for income taxes under the asset and liability method. Deferred tax assets and liabilities are recognized for the future tax consequences attributable to temporary differences between the financial statement carrying amounts of existing assets and liabilities and respective tax bases and operating loss and tax credit carryforwards, as measured using enacted tax rates expected to be in effect in the periods where temporary differences are expected to be realized or settled. The effect on deferred tax assets and liabilities of a change in tax rates is recognized in income in the period that includes the enactment date.
We recognize deferred tax assets to the extent that we believe that these assets are more likely than not to be realized. In making such a determination, we consider all available positive and negative evidence, including future reversals of existing taxable temporary differences, projected future taxable income, tax-planning strategies, and results of recent operations. If we determine that we would be able to realize our deferred tax assets in the future in excess of their net recorded amount, we would make an adjustment to the deferred tax asset valuation allowance, which would reduce the provision for income taxes.
We review and update our tax positions as necessary to add any new uncertain tax positions taken, or to remove previously identified uncertain positions that have been adequately resolved. Additionally, uncertain positions may be remeasured as warranted by changes in facts or law. Accounting for uncertain tax positions requires estimating the amount, timing and likelihood of ultimate settlement. Although we believe that these estimates are reasonable, actual results could differ from these estimates.
58
Inventory Valuation
Inventories are valued at the lower of cost or net realizable value. Cost is based on the first-in, first-out (FIFO) method of inventory valuation or average cost. Wholesale distribution inventories include costs incurred in bringing inventory to its existing location. Manufactured inventories include costs for materials, labor, and factory overhead. Log inventories include costs to harvest and deliver the logs.
Inventories included the following (work in process is not material):
December 31, 2017 | December 31, 2016 | |||||||
(thousands) | ||||||||
Finished goods and work in process | $ | 377,266 | $ | 330,026 | ||||
Logs | 57,229 | 63,208 | ||||||
Other raw materials and supplies | 42,178 | 40,217 | ||||||
$ | 476,673 | $ | 433,451 | |||||
Property and Equipment
Property and equipment are recorded at cost. Cost includes expenditures for major improvements and replacements and the amount of interest cost associated with significant capital additions. For the years ended December 31, 2017, 2016, and 2015, we did not capitalize any interest. We expense all repair and maintenance costs as incurred. When property and equipment are retired, sold, or otherwise disposed of, the asset's carrying amount and related accumulated depreciation are removed from the accounts and any gain or loss is included in income (loss). We use the straight-line method of depreciation.
Property and equipment consisted of the following asset classes with the following general range of estimated useful lives:
December 31, 2017 | December 31, 2016 | General Range of Estimated Useful Lives in Years | ||||||||||
(thousands) | ||||||||||||
Land | $ | 38,606 | $ | 38,700 | ||||||||
Buildings | 144,404 | 136,087 | 20 | - | 40 | |||||||
Improvements | 55,267 | 50,655 | 10 | - | 15 | |||||||
Mobile equipment, information technology, and office furniture | 138,245 | 125,486 | 3 | - | 7 | |||||||
Machinery and equipment | 659,708 | 613,060 | 7 | - | 12 | |||||||
Construction in progress | 23,303 | 34,877 | ||||||||||
1,059,533 | 998,865 | |||||||||||
Less accumulated depreciation | (493,741 | ) | (430,163 | ) | ||||||||
$ | 565,792 | $ | 568,702 | |||||||||
Long-Lived Asset Impairment
We review long-lived assets for impairment when events or changes in circumstances indicate that the carrying amount of assets may not be recoverable. An impairment of long-lived assets exists when the carrying value is not recoverable through future undiscounted cash flows from operations and when the carrying value of an asset or asset group exceeds its fair value.
59
Goodwill and Intangible Assets Impairment
We maintain two reporting units for purposes of our goodwill impairment testing, Wood Products and Building Materials Distribution, which are the same as our operating segments discussed in Note 14, Segment Information. We test goodwill in each of our reporting units and intangible assets with indefinite lives for impairment annually in the fourth quarter or sooner if events or changes in circumstances indicate that the carrying value of the asset may exceed fair value. We also evaluate the remaining useful lives of our finite-lived purchased intangible assets to determine whether any adjustments to the useful lives are necessary.
We completed our annual assessment of goodwill in fourth quarter 2017 using a qualitative approach. The qualitative goodwill impairment assessment requires evaluating factors, based on the weight of evidence, to determine whether a reporting unit's carrying value would more likely than not exceed its fair value. As part of our goodwill qualitative testing process for each reporting unit, we evaluate various factors that are specific to the reporting unit as well as industry and macroeconomic factors in order to determine whether it is reasonably likely to have a material impact on the fair value of our reporting units. Based on the qualitative analysis performed in 2017, we concluded that there were no changes that were reasonably likely to cause the fair value of the reporting units to be less than the reporting units' carrying value and determined that there was no impairment of our goodwill. In the event we were to determine that a reporting unit's carrying value would more likely than not exceed its fair value, quantitative testing would be performed comparing carrying values to estimated fair values. See Note 6, Goodwill and Intangible Assets, for additional information.
Asset Retirement Obligations
We recognize our asset retirement obligations in the period in which they are incurred if sufficient information is available to reasonably estimate the fair value of the obligation. Fair value estimates are determined using Level 3 inputs in the fair value hierarchy. The fair values of our asset retirement obligations are measured using expected future cash outflows discounted using the company's credit-adjusted risk-free interest rate. When we record the liability, we capitalize the cost by increasing the carrying amount of the related long-lived asset. Over time, the liability is accreted to its settlement value, and the capitalized cost is depreciated over the useful life of the related asset. Upon settlement of the liability, we will recognize a gain or loss for any difference between the settlement amount and the liability recorded.
At December 31, 2017 and 2016, we had $1.1 million and $1.0 million, respectively, of asset retirement obligations recorded in "Other long-term liabilities" on our Consolidated Balance Sheets. At December 31, 2017, these liabilities related primarily to a waste treatment pond and landfill closure costs. The liabilities are based on the best estimate of current costs and are updated periodically to reflect current technology, laws and regulations, inflation, and other economic factors. We do not have any assets legally restricted for purposes of settling asset retirement obligations.
We have additional asset retirement obligations with indeterminate settlement dates. The fair value of these asset retirement obligations cannot be estimated due to the lack of sufficient information to estimate the settlement dates of the obligations. These asset retirement obligations include, for example, (i) removal and disposal of potentially hazardous materials on equipment and/or an operating facility if the equipment and/or facility were to undergo major maintenance, renovation, or demolition; (ii) retention ponds that may be required to be drained and/or cleaned if the related operating facility is closed; and (iii) storage sites or owned facilities for which removal and/or disposal of chemicals and other related materials are required if the operating facility is closed. We will recognize a liability in the period in which sufficient information becomes available to reasonably estimate the fair value of these obligations.
Pension Benefits
Several estimates and assumptions are required to record pension costs and liabilities, including discount rates, expected return on plan assets, expected rate of compensation increases, retirement and mortality rates, expected contributions, and other factors. We review and update these assumptions annually unless a plan curtailment or other event occurs requiring that we update the estimates on an interim basis. See Note 9, Retirement and Benefit Plans, for additional information related to our pension plan. While we believe that the assumptions used to measure our pension obligations are reasonable, differences in actual experience or changes in assumptions may materially affect our pension obligations and future expense.
60
Deferred Software Costs
We defer internal-use software costs that benefit future years. These costs are amortized using the straight-line method over the expected life of the software, typically three to five years. "Other assets" in the Consolidated Balance Sheets includes $5.7 million and $6.5 million, respectively, of deferred software costs at December 31, 2017 and 2016. We amortized $2.0 million, $2.1 million, and $1.6 million of deferred software costs for the years ended December 31, 2017, 2016, and 2015, respectively.
Labor Concentration and Unions
As of December 31, 2017, we had approximately 6,320 employees. Approximately 24% of these employees work pursuant to collective bargaining agreements. As of December 31, 2017, we had nine collective bargaining agreements. The agreement covering approximately 93 employees at our Canadian EWP facility expired on December 31, 2017, but has been extended indefinitely pending negotiations. During the course of negotiations, if this agreement is not renewed or extended upon its termination, we could experience a material labor disruption or significantly increased labor costs, which could prevent us from meeting customer demand or reduce our sales and profitability.
Self-Insurance
We are self-insured for certain losses related to workers' compensation and medical claims, general and auto liability, as well as property and business interruption losses. The expected ultimate costs for claims incurred are recognized as liabilities in the Consolidated Balance Sheets and are estimated based principally on an analysis of historical claims data and estimates of claims incurred but not reported. Losses are accrued and charged to operations when it is probable that a loss has been incurred and the amount can be reasonably estimated. We maintain third-party stop-loss insurance policies to cover these liability costs in excess of predetermined retained amounts. Costs related to the administration of the plans and related claims are expensed as incurred. At December 31, 2017 and 2016, self-insurance related liabilities of $9.6 million and $8.4 million, respectively, were classified within "Accrued liabilities," and $10.2 million and $10.0 million, respectively, were classified within "Other long-term liabilities" on our Consolidated Balance Sheets.
New and Recently Adopted Accounting Standards
In February 2018, the Financial Accounting Standards Board (FASB) issued Accounting Standards Update (ASU) 2018-02, Income Statement—Reporting Comprehensive Income (Topic 220): Reclassification of Certain Tax Effects from Accumulated Other Comprehensive Income. This ASU permits entities to reclassify stranded tax effects in accumulated other comprehensive income to retained earnings as a result of the Tax Cuts and Jobs Act enacted by the U.S. federal government on December 22, 2017. The updated guidance is effective for interim and annual reporting periods beginning after December 15, 2018, with early adoption permitted. We are currently evaluating the effects of this ASU on our financial statements.
In May 2017, the FASB issued ASU 2017-09, Compensation—Stock Compensation (Topic 718) - Scope of Modification Accounting. This ASU amends the scope of modification accounting for share-based payment arrangements and provides guidance on the types of changes to the terms or conditions of share-based payment awards to which an entity would be required to apply modification accounting under ASC 718. Specifically, an entity would not apply modification accounting if the fair value, vesting conditions, and classification of the awards are the same immediately before and after the modification. The guidance is effective prospectively for fiscal years beginning after December 15, 2017, and interim periods within that reporting period. Early adoption is permitted, including adoption in any interim period. We do not expect the adoption of this guidance to have a material effect on our financial statements.
In March 2017, the FASB issued ASU 2017-07, Compensation—Retirement Benefits (Topic 715): Improving the Presentation of Net Periodic Pension Cost and Net Periodic Postretirement Benefit Cost. This ASU requires entities to present the service cost component of net periodic benefit cost in the same income statement line item(s) as other employee compensation costs arising from services rendered during the period. The other components of net periodic benefit cost must be presented elsewhere in the income statement and outside of income from operations if that subtotal is presented. Entities will have to disclose the line(s) used to present the other components of net periodic benefit cost if the components are not presented separately in the income statement. The guidance on the income statement presentation of the components of net periodic benefit cost must be applied retrospectively. This new standard is effective for fiscal years beginning after December 15, 2017, and interim periods within that reporting period. We adopted the standard in first quarter 2018, which will result in a change in our income from operations in an amount equal to the other components of net periodic pension cost, which will be offset by a corresponding change outside of income from operations. The components of the net periodic cost are shown in Note 9, Retirement and Benefit Plans.
61
In January 2017, the FASB issued ASU 2017-04, Intangibles - Goodwill and Other (Topic 350): Simplifying the Test for Goodwill Impairment. This ASU is intended to simplify the accounting for goodwill impairment by removing the requirement to perform a hypothetical purchase price allocation. A goodwill impairment will now be the amount by which the reporting unit's carrying value exceeds its fair value, not to exceed the carrying amount of goodwill. All other goodwill impairment guidance will remain largely unchanged. This new standard will be applied prospectively and is effective for annual or interim goodwill impairment tests in fiscal years beginning after December 15, 2019. Early adoption is permitted after January 1, 2017. We adopted this standard in first quarter of 2017 and it did not have a material effect on our financial statements.
In August 2016, the FASB issued ASU 2016-15, Statement of Cash Flows (Topic 230): Classification of Certain Cash Receipts and Cash Payments (a consensus of the Emerging Issues Task Force). This ASU is intended to reduce diversity in practice in how certain transactions are classified in the statement of cash flows. This new standard is effective for annual periods beginning after December 15, 2017, and interim periods within that reporting period. Early adoption is permitted, provided that all of the amendments are adopted in the same period. The guidance requires application using a retrospective transition method. We adopted this standard in first quarter of 2018 and this guidance did not have a material effect on our consolidated statements of cash flows.
In March 2016, the FASB issued ASU 2016-09, Stock Compensation (Topic 718): Improvements to Employee Share-Based Payment Accounting. This ASU simplifies several aspects of the accounting for employee share-based payment transactions, including the accounting for income taxes, forfeitures, and statutory tax withholding requirements, as well as classification in the statement of cash flows. We adopted this standard in the first quarter of 2017, under the modified retrospective method, with the cumulative effect of adoption recorded as an adjustment to 2017 beginning retained earnings. The new standard results in excess tax benefits and deficiencies on share-based transactions being recorded as income tax expense or benefit rather than in additional-paid-in-capital. In addition, excess tax benefits on share-based payments are now classified in the operating section of our consolidated statement of cash flows. Furthermore, we recorded an adjustment to beginning retained earnings of approximately $0.1 million as we have made an election to account for share-based award forfeitures as they occur, rather than making estimates of future forfeitures.
In February 2016, the FASB issued ASU 2016-02, Leases (Topic 842). This amendment requires a lessee to recognize substantially all leases (whether operating or finance leases) on the balance sheet as a right-of-use asset and an associated lease liability. Short-term leases of 12 months or less are excluded from this amendment. For leases defined as finance leases under the new standard, the lessee subsequently recognizes interest expense and amortization of the right-of-use asset, similar to accounting for capital leases under current GAAP. For leases defined as operating leases under the new standard, the lessee subsequently recognizes straight-line lease expense over the life of the lease. This new standard is effective for fiscal years beginning after December 15, 2018, including interim periods within those fiscal years. Early adoption is permitted. The guidance is to be applied using a modified retrospective transition method with the option to elect a package of practical expedients. The adoption of this ASU will result in a significant increase to our balance sheet for lease liabilities and right-of-use assets, which has not yet been quantified. We are currently evaluating this and the other effects of this ASU on our financial statements.
In July 2015, the FASB issued ASU 2015-11, Inventory (Topic 330): Simplifying the Measurement of Inventory. This ASU requires entities to measure most inventory "at the lower of cost or net realizable value," thereby simplifying the current guidance under which an entity must measure inventory at the lower of cost or market. The new standard is effective for annual and interim reporting periods beginning after December 15, 2016. The adoption of this standard in first quarter of 2017 did not have a material effect on our financial statements.
In May 2014, the FASB issued ASU 2014-09, Revenue from Contracts with Customers (Topic 606). This ASU replaces most existing revenue recognition guidance in U.S. GAAP when it becomes effective and requires an entity to recognize the amount of revenue to which it expects to be entitled for the transfer of promised goods or services to customers. The guidance also requires additional disclosure to help users of financial statements better understand the nature, amount, timing, and uncertainty of revenue that is recognized. Furthermore, numerous updates were issued in 2016 that provide clarification on a number of specific issues. The new standard is effective for annual and interim reporting periods beginning after December 15, 2017 and we adopted it effective January 1, 2018. The standard permits the use of either the retrospective or modified retrospective (cumulative-effect) transition method. We adopted the standard using the modified retrospective method which did not require a cumulative effect adjustment to retained earnings. As a result of our assessment, there is no material impact on our revenue recognition practices but we will provide some additional required qualitative disclosures of our revenue recognition policies.
62
There were no other accounting standards recently issued that had or are expected to have a material impact on our consolidated financial statements and associated disclosures.
Reclassifications
Certain amounts in prior years' consolidated financial statements have been reclassified to conform with current year's presentation, none of which were considered material.
3. Income Taxes
On December 22, 2017, the Tax Cuts and Jobs Act (the “Tax Act”), was enacted by the U.S. government. The legislation makes broad and complex changes to the U.S. tax code affecting the taxation of businesses in all industries. The most significant impact to our financial statements is the reduction of the corporate federal income tax rate from 35% to 21%. Other relevant provisions which may impact our financial statements in the future include, but are not limited to, the elimination of the production activities deduction, limitations on the deductibility of certain executive compensation, bonus depreciation to allow immediate expensing of qualified property, and limitations on deductible interest expense.
As of December 31, 2017, we have not completed our assessment of the effects of the Tax Act on our financial statements. We have however made reasonable estimates of the effects on our existing deferred tax balances. In connection with our initial analysis of the Tax Act, we have recorded a provisional discrete tax benefit of $8.1 million during the year ended December 31, 2017, which is reflected in the tables below. We continue to evaluate the effects of the Tax Act on our financial statements particularly relating to the deferred balances subject to the rate reduction, the state tax effect of adjustments made to federal temporary differences, potential effects on valuation allowance analyses for state income tax credits, and the cost recovery provisions of the new bonus depreciation rules. The assessment is expected to be complete when the 2017 federal corporate income tax return is filed in 2018.
Income Tax Provision
Income before income taxes includes the following components:
Year Ended December 31 | ||||||||||||
2017 | 2016 | 2015 | ||||||||||
(thousands) | ||||||||||||
Domestic | $ | 115,083 | $ | 41,703 | $ | 79,414 | ||||||
Foreign | 2,505 | 1,598 | 1,268 | |||||||||
Income before income taxes | $ | 117,588 | $ | 43,301 | $ | 80,682 | ||||||
63
The income tax provision shown in the Consolidated Statements of Operations includes the following:
Year Ended December 31 | ||||||||||||
2017 | 2016 | 2015 | ||||||||||
(thousands) | ||||||||||||
Current income tax provision (benefit) | ||||||||||||
Federal | $ | 22,541 | $ | 10,664 | $ | (2,938 | ) | |||||
State | 3,973 | 2,201 | 555 | |||||||||
Foreign | — | 5 | — | |||||||||
Total current | 26,514 | 12,870 | (2,383 | ) | ||||||||
Deferred income tax provision (benefit) | ||||||||||||
Federal | 6,747 | 2,549 | 27,011 | |||||||||
State | 991 | (1,536 | ) | 3,872 | ||||||||
Foreign | 379 | (8,836 | ) | — | ||||||||
Total deferred | 8,117 | (7,823 | ) | 30,883 | ||||||||
Income tax provision | $ | 34,631 | $ | 5,047 | $ | 28,500 | ||||||
The effective tax rate varies from the U.S. Federal statutory income tax rate principally due to the following:
Year Ended December 31 | ||||||||||||
2017 | 2016 | 2015 | ||||||||||
(thousands, except percentages) | ||||||||||||
Income before income taxes | $ | 117,588 | $ | 43,301 | $ | 80,682 | ||||||
Statutory U.S. income tax rate | 35.0 | % | 35.0 | % | 35.0 | % | ||||||
Statutory tax provision | $ | 41,156 | $ | 15,155 | $ | 28,239 | ||||||
State taxes | 3,719 | 1,370 | 3,006 | |||||||||
Domestic production activities deduction | (963 | ) | (165 | ) | (299 | ) | ||||||
Unrecognized tax benefits | (86 | ) | 1,717 | 433 | ||||||||
Benefit from enactment of the Tax Cuts and Jobs Act | (8,129 | ) | — | — | ||||||||
Change in valuation allowance (a) | — | (9,884 | ) | — | ||||||||
Tax credits | (912 | ) | (2,904 | ) | (2,043 | ) | ||||||
Other | (154 | ) | (242 | ) | (836 | ) | ||||||
Total | $ | 34,631 | $ | 5,047 | $ | 28,500 | ||||||
Effective income tax rate | 29.5 | % | 11.7 | % | 35.3 | % | ||||||
______________________________________
(a) | Deferred tax assets in our foreign subsidiaries are primarily the result of net operating losses. As of each reporting date, management considers new evidence, both positive and negative, that could affect its view of the future realization of deferred tax assets. During fourth quarter 2016, because we achieved three years of cumulative pretax income in the Canadian tax jurisdiction and due to the implementation of a tax-planning strategy, management determined that there is sufficient positive evidence to conclude that it is more likely than not that the deferred tax assets are realizable and therefore released the valuation allowance in the amount of $9.9 million. |
During the years ended December 31, 2017, 2016, and 2015, cash paid for taxes, net of refunds received, was $36.1 million, $6.7 million, and $0.7 million, respectively.
64
Deferred income taxes reflect the net tax effects of temporary differences between the carrying amount of assets and liabilities for financial reporting purposes and the amounts for income tax purposes. The components of our net deferred tax assets and liabilities at December 31, 2017 and 2016, are summarized as follows:
December 31, 2017 | December 31, 2016 | |||||||
(thousands) | ||||||||
Deferred tax assets | ||||||||
Employee benefits | $ | 30,853 | $ | 54,895 | ||||
Inventories | 4,598 | 5,237 | ||||||
Foreign net operating loss carryforward | 5,137 | 5,383 | ||||||
Other | 6,003 | 7,628 | ||||||
Net deferred tax assets | $ | 46,591 | $ | 73,143 | ||||
Deferred tax liabilities | ||||||||
Property and equipment | $ | (47,946 | ) | $ | (62,948 | ) | ||
Intangible assets and other | (4,168 | ) | (5,039 | ) | ||||
Other | (1,867 | ) | (2,655 | ) | ||||
Deferred tax liabilities | $ | (53,981 | ) | $ | (70,642 | ) | ||
Total deferred tax assets (liabilities), net | $ | (7,390 | ) | $ | 2,501 | |||
As of December 31, 2017, we have foreign net operating loss carryforwards of $23.3 million, which if unused, will expire in years 2026 through 2036. We have state income tax credits totaling $1.6 million as of December 31, 2017, which if unused will expire in years 2020 through 2032. The foreign net operating loss and state credit carryforwards in the income tax returns filed included unrecognized tax benefits. The deferred tax assets recognized for those net operating loss and state credit carryforwards are presented net of these unrecognized tax benefits.
Income Tax Uncertainties
The following table summarizes the changes related to our gross unrecognized tax benefits excluding interest and penalties:
2017 | 2016 | 2015 | ||||||||||
(thousands) | ||||||||||||
Balance as of January 1 | $ | 2,224 | $ | 878 | $ | 309 | ||||||
Increases related to prior years' tax positions | 1 | 1,657 | 431 | |||||||||
Increases related to current year tax positions | 51 | 104 | 145 | |||||||||
Decreases related to prior years' tax positions | (12 | ) | — | (7 | ) | |||||||
Lapse of statute of limitations | (181 | ) | — | — | ||||||||
Settlements | — | (415 | ) | — | ||||||||
Balance as of December 31 | $ | 2,083 | $ | 2,224 | $ | 878 | ||||||
As of December 31, 2017, 2016 and 2015, we had $2.1 million, $2.2 million, and $0.9 million respectively, of unrecognized tax benefits recorded on our Consolidated Balance Sheets, excluding interest and penalties. Of the total unrecognized tax benefits recorded, $2.0 million, $2.1 million, and $0.7 million (net of the federal benefit for state taxes), respectively, would impact the effective tax rate if recognized.
We recognize interest and penalties related to uncertain tax positions as income tax expense in our Consolidated Statements of Operations. For the years ended December 31, 2017, 2016, and 2015, we recognized an insignificant amount of interest and penalties related to taxes. We recognize tax liabilities and adjust these liabilities when our judgment changes as a
65
result of the evaluation of new information not previously available or as new uncertainties occur. We do not expect the unrecognized tax benefits to change significantly over the next twelve months.
We file income tax returns in the U.S. and various state and foreign jurisdictions. Tax years 2014 to present remain open to examination in the U.S. and tax years 2013 to present remain open to examination in Canada and various states. We recorded net operating losses in Canada beginning in 2006 that are subject to examinations and adjustments up to four years following the year in which they are utilized.
4. | Net Income Per Common Share |
Basic net income per common share is computed by dividing net income by the weighted average number of common shares outstanding during the period. Weighted average common shares outstanding for the basic net income per common share calculation includes certain vested restricted stock units (RSUs) and performance stock units (PSUs) as there are no conditions under which those shares will not be issued. For more information about common share activity during the period, see Note 11, Stockholders' Equity. Diluted net income per common share is computed by dividing net income by the combination of other potentially dilutive weighted average common shares and the weighted average number of common shares outstanding during the period. Other potentially dilutive weighted average common shares include the dilutive effect of stock options, RSUs, and PSUs for each period using the treasury stock method. Under the treasury stock method, the exercise price of a share and the amount of compensation expense, if any, for future service that has not yet been recognized are assumed to be used to repurchase shares in the current period.
The following table sets forth the computation of basic and diluted net income per common share:
Year Ended December 31 | |||||||||||
2017 | 2016 | 2015 | |||||||||
(thousands, except per-share data) | |||||||||||
Net income | $ | 82,957 | $ | 38,254 | $ | 52,182 | |||||
Weighted average common shares outstanding during the period (for basic calculation) | 38,623 | 38,761 | 39,239 | ||||||||
Dilutive effect of other potential common shares | 451 | 164 | 116 | ||||||||
Weighted average common shares and potential common shares (for diluted calculation) | 39,074 | 38,925 | 39,355 | ||||||||
Net income per common share - Basic | $ | 2.15 | $ | 0.99 | $ | 1.33 | |||||
Net income per common share - Diluted | $ | 2.12 | $ | 0.98 | $ | 1.33 | |||||
The computation of the dilutive effect of other potential common shares excludes stock awards representing no shares, 0.2 million shares, and 0.1 million shares of common stock in the years ended December 31, 2017, 2016, and 2015, respectively. Under the treasury stock method, the inclusion of these stock awards would have been antidilutive.
5. Acquisitions
On March 31, 2016, our wholly owned subsidiary, Boise Cascade Wood Products, L.L.C., completed the acquisition of Georgia-Pacific LLC's and certain of its affiliates' (collectively, GP) EWP facilities located in Thorsby, Alabama, and Roxboro, North Carolina, for an aggregate purchase price of $215.9 million, including a post-closing adjustment of $0.3 million based upon a working capital target (the Acquisition). Acquisition-related costs of $3.6 million are recorded in "General and administrative expenses" in our Consolidated Statements of Operations for the year ended December 31, 2016.
The following pro forma financial information gives effect to the Acquisition as if it had occurred on January 1, 2015. The pro forma financial information also gives effect to the issuance of a $75.0 million term loan due March 30, 2026 and a $55.0 million draw under our revolving credit facility incurred to partially finance the Acquisition, as if such transactions had occurred on January 1, 2015. The pro forma results are intended for informational purposes only and do not purport to represent what our results of operations would actually have been had the Acquisition and related financing transactions occurred on January 1, 2015. They also do not reflect any revenue enhancements or cost savings, operating synergies, customer attrition, or incremental depreciation upon the restart of laminated veneer lumber assets at Roxboro.
66
Pro Forma | ||||||||
Year Ended December 31 | ||||||||
2016 | 2015 | |||||||
(unaudited, thousands, except per-share data) | ||||||||
Sales | $ | 3,938,409 | $ | 3,726,477 | ||||
Net income (a) | $ | 41,400 | $ | 54,425 | ||||
Net income per common share - Basic | $ | 1.07 | $ | 1.39 | ||||
Net income per common share - Diluted | $ | 1.06 | $ | 1.38 | ||||
______________________________________
(a) | The pro forma financial information for the years ended December 31, 2016 and 2015, was adjusted to exclude $3.6 million and $1.6 million, respectively, of pre-tax acquisition-related costs for legal, accounting, and other advisory-related services. |
6. | Goodwill and Intangible Assets |
Goodwill represents the excess of the purchase price and related costs over the fair value of the net tangible and intangible assets of businesses acquired.
The carrying amount of our goodwill by segment is as follows:
Building Materials Distribution | Wood Products | Total | ||||||||||
(thousands) | ||||||||||||
Balance at December 31, 2017 and 2016 | $ | 5,593 | $ | 49,840 | $ | 55,433 | ||||||
At December 31, 2017 and 2016, intangible assets represent the values assigned to trade names and trademarks and customer relationships. The trade names and trademarks have indefinite lives and are not amortized. The weighted-average useful life for customer relationships from the date of purchase is approximately 11 years. Amortization expense is expected to be approximately $0.7 million per year for the next five years.
Intangible assets consisted of the following:
December 31, 2017 | ||||||||||||
Gross Carrying Amount | Accumulated Amortization | Net Carrying Amount | ||||||||||
(thousands) | ||||||||||||
Trade names and trademarks | $ | 8,900 | $ | — | $ | 8,900 | ||||||
Customer relationships | 7,650 | (1,484 | ) | 6,166 | ||||||||
$ | 16,550 | $ | (1,484 | ) | $ | 15,066 | ||||||
December 31, 2016 | ||||||||||||
Gross Carrying Amount | Accumulated Amortization | Net Carrying Amount | ||||||||||
(thousands) | ||||||||||||
Trade names and trademarks | $ | 8,900 | $ | — | $ | 8,900 | ||||||
Customer relationships | 7,400 | (753 | ) | 6,647 | ||||||||
$ | 16,300 | $ | (753 | ) | $ | 15,547 | ||||||
67
7. | Debt |
Long-term debt consisted of the following:
December 31, 2017 | December 31, 2016 | |||||||
(thousands) | ||||||||
Asset-based revolving credit facility | $ | — | $ | — | ||||
Asset-based credit facility term loan due 2022 | 50,000 | 50,000 | ||||||
Term loan due 2026 | 45,000 | 45,000 | ||||||
5.625% senior notes due 2024 | 350,000 | 350,000 | ||||||
Deferred financing costs | (6,688 | ) | (7,371 | ) | ||||
Long-term debt | $ | 438,312 | $ | 437,629 | ||||
At December 31, 2017, the maturities for the aggregate amount of long-term debt outstanding were as follows (in thousands):
2018 | $ | — | ||
2019 | — | |||
2020 | — | |||
2021 | — | |||
2022 | 50,000 | |||
Thereafter | 395,000 | |||
Asset-Based Credit Facility
On May 15, 2015, Boise Cascade and its principal operating subsidiaries, Boise Cascade Wood Products, L.L.C., and Boise Cascade Building Materials Distribution, L.L.C., as borrowers, and Boise Cascade Wood Products Holdings Corp., Chester Wood Products LLC, and Moncure Plywood LLC, as guarantors, entered into an Amended and Restated Credit Agreement, as amended, (Amended Agreement) with Wells Fargo Capital Finance, LLC, as administrative agent, and the banks named therein as lenders. The Amended Agreement includes a $370 million senior secured asset-based revolving credit facility (Revolving Credit Facility) and a $50.0 million term loan (ABL Term Loan) maturing on May 1, 2022. Interest on borrowings under our Revolving Credit Facility and ABL Term Loan are payable monthly. Borrowings under the Amended Agreement are constrained by a borrowing base formula dependent upon levels of eligible receivables and inventory reduced by outstanding borrowings and letters of credit (Availability). On August 10, 2017, we entered into the fifth amendment to the Amended Agreement to extend the maturity date of the Revolving Credit Facility from April 30, 2020, to May 1, 2022, and to reduce the unused line fee to a singular rate of 0.25% per annum.
The Amended Agreement is secured by a first-priority security interest in substantially all of our assets, except for property and equipment. The proceeds of borrowings under the agreement are available for working capital and other general corporate purposes.
The Amended Agreement contains customary nonfinancial covenants, including a negative pledge covenant and restrictions on new indebtedness, investments, distributions to equity holders, asset sales, and affiliate transactions, the scope of which are dependent on the Availability existing from time to time. The Amended Agreement also contains a requirement that we meet a 1:1 fixed-charge coverage ratio (FCCR), applicable only if Availability falls below 10% of the aggregate revolving lending commitments (or $37 million). Availability exceeded the minimum threshold amounts required for testing of the FCCR at all times since entering into the Amended Agreement, and Availability at December 31, 2017, was $349.8 million.
The Amended Agreement permits us to pay dividends only if at the time of payment (i) no default has occurred or is continuing (or would result from such payment) under the Amended Agreement, and (ii) pro forma Excess Availability (as defined in the Amended Agreement) is equal to or exceeds 25% of the aggregate Revolver Commitments (as defined in the Amended Agreement) or (iii) (x) pro forma Excess Availability is equal to or exceeds 15% of the aggregate Revolver Commitment and (y) our fixed-charge coverage ratio is greater than or equal to 1:1 on a pro forma basis.
68
Revolving Credit Facility
Interest rates under the Revolving Credit Facility are based, at our election, on either LIBOR or a base rate, as defined in the Amended Agreement, plus a spread over the index elected that ranges from 1.25% to 1.75% for loans based on LIBOR and from 0.25% to 0.75% for loans based on the base rate. The spread is determined on the basis of a pricing grid that results in a higher spread as average quarterly Availability declines. Letters of credit are subject to a fronting fee payable to the issuing bank and a fee payable to the lenders equal to the LIBOR margin rate. In addition, we are required to pay an unused commitment fee at a rate of 0.25% per annum of the average unused portion of the lending commitments.
At both December 31, 2017 and 2016, we had no borrowings outstanding under the Revolving Credit Facility and $5.9 million of letters of credit outstanding. These letters of credit and borrowings, if any, reduce Availability under the Revolving Credit Facility by an equivalent amount. During the year ended December 31, 2017, the minimum and maximum borrowings under the Revolving Credit Facility were zero and $89.2 million, respectively, and the average interest rate on borrowings was approximately 2.25%.
ABL Term Loan
The ABL Term Loan was provided by institutions within the Farm Credit system. Borrowings under the ABL Term Loan may be repaid from time to time at the discretion of the borrowers without premium or penalty. However, any principal amount of ABL Term Loan repaid, may not be subsequently re-borrowed.
Interest rates under the ABL Term Loan are based, at our election, on either LIBOR or a base rate, as defined in the Amended Agreement, plus a spread over the index elected that ranges from 1.75% to 2.25% for LIBOR rate loans and from 0.75% to 1.25% for base rate loans, both dependent on the amount of Average Excess Availability (as defined in the Amended Agreement). During the year ended December 31, 2017, the average interest rate on the ABL Term Loan was approximately 2.83%.
We have received and expect to continue receiving patronage credits under the ABL Term Loan. Patronage credits are distributions of profits from banks in the Farm Credit system, which are cooperatives that are required to distribute profits to their members. Patronage distributions, which are generally made in cash, are received in the year after they are earned. Patronage credits are recorded as a reduction to interest expense in the year earned. After giving effect to expected patronage distributions, the effective net interest rate on the ABL Term Loan was approximately 2.1% during the year ended December 31, 2017.
Term Loan
On March 30, 2016 (Closing Date), Boise Cascade and its principal operating subsidiaries, Boise Cascade Wood Products, L.L.C., and Boise Cascade Building Materials Distribution, L.L.C., as borrowers, and the guarantors party thereto, entered into a term loan agreement, as amended, (Term Loan Agreement) with American AgCredit, PCA, as administrative agent and sole lead arranger, and other banks in the Farm Credit system named therein as lenders. The Term Loan Agreement was for a $75.0 million secured term loan (Term Loan). The outstanding principal balance of the Term Loan amortizes and is payable in equal installments of $10 million per year on each of the sixth, seventh, eighth, and ninth anniversaries of the Closing Date, with the remaining principal balance due and payable on March 30, 2026. In December 2016, we prepaid $30 million of the Term Loan, which became available to reborrow as discussed below. This prepayment satisfied our principal obligations due on the sixth, seventh, and eighth anniversaries of the Closing Date. Interest on our Term Loan is payable monthly.
The Term Loan Agreement allows us to prepay the Term Loan and subsequently reborrow amounts prepaid on or before December 31, 2018. The option to reborrow applicable prepaid principal amounts expires on December 31, 2019. Reborrowings may be made in up to three instances in minimum amounts of $10 million each. In addition, amounts prepaid and eligible for reborrowing are subject to an unused line fee of 0.325% per annum times the average daily amount of the unused commitments.
Pursuant to the Term Loan Agreement, the borrowers are required to maintain, as of the end of any fiscal quarter, a Capitalization Ratio lower than 60%, a Consolidated Net Worth greater than $350 million, and Available Liquidity greater than $100 million (each as defined in the Term Loan Agreement). In addition, under the Term Loan Agreement, and subject to certain exceptions, the borrowers may not, among other things, (i) incur indebtedness, (ii) incur liens, (iii) make junior payments, (iv) make certain investments, and (v) under certain circumstances, make capital expenditures in excess of
69
$50 million during four consecutive quarters. The Term Loan Agreement also includes customary representations of the borrowers and provides for certain events of default customary for similar facilities.
The Term Loan Agreement permits us to pay dividends only if at the time of payment (i) no default has occurred or is continuing (or would result from such payment) under the Term Loan Agreement, and (ii) our interest coverage ratio is greater than or equal to 3:1 at such time or (iii) our fixed-charge coverage ratio is greater than or equal to 1:1.
Interest rates under the Term Loan Agreement are based, at our election, on either the LIBOR or a base rate, as defined in the Term Loan Agreement, plus a spread over the index. The applicable spread for the Term Loan ranges from 1.875% to 2.125% for LIBOR rate loans, and 0.875% to 1.125% for base rate loans, both dependent on our Interest Coverage Ratio (as defined in the Term Loan Agreement). During the year ended December 31, 2017, the average interest rate on the Term Loan was approximately 2.95%. We have received and expect to continue receiving patronage credits under the Term Loan. After giving effect to expected patronage distributions, the effective average net interest rate on the Term Loan was approximately 2.2%.
The Term Loan is secured by a first priority mortgage on our Thorsby, Alabama, and Roxboro, North Carolina, EWP facilities and a first priority security interest on the equipment and certain tangible personal property located therein.
2024 Notes
On August 29, 2016, Boise Cascade issued $350 million of 5.625% senior notes due September 1, 2024 (2024 Notes) through a private placement that was exempt from the registration requirements of the Securities Act. Interest on our 2024 Notes is payable semiannually in arrears on March 1 and September 1. The 2024 Notes are guaranteed by each of our existing and future direct or indirect domestic subsidiaries that is a guarantor under our Amended Agreement.
The 2024 Notes are senior unsecured obligations and rank equally with all of the existing and future senior indebtedness of Boise Cascade Company and of the guarantors, senior to all of their existing and future subordinated indebtedness, effectively subordinated to all of their present and future senior secured indebtedness (including all borrowings with respect to our Amended Agreement to the extent of the value of the assets securing such indebtedness), and structurally subordinated to the indebtedness of any subsidiaries that do not guarantee the 2024 Notes.
The terms of the indenture governing the 2024 Notes, among other things, limit the ability of Boise Cascade and our restricted subsidiaries to: incur additional debt; declare or pay dividends; redeem stock or make other distributions to stockholders; make investments; create liens on assets; consolidate, merge or transfer substantially all of their assets; enter into transactions with affiliates; and sell or transfer certain assets. The indenture governing the 2024 Notes, permits us to pay dividends only if at the time of payment (i) no default has occurred or is continuing (or would result from such payment) under the indenture, and (ii) our consolidated coverage ratio is greater than or equal to 2:1, or (iii) the dividend, together with other dividends since the issue date, would not exceed our "builder" basket under the indenture. In addition, the indenture includes certain specific baskets for the payment of dividends.
The indenture governing the 2024 Notes provides for customary events of default and remedies.
In connection with the issuance of the 2024 Notes described above, we commenced a tender offer to purchase any and all of our $300.0 million aggregate principal amount of 6.375% senior notes due November 1, 2020 (2020 Notes) then outstanding. On August 29, 2016, we accepted for purchase an aggregate principal amount of $184.5 million of the 2020 Notes that were tendered. On November 1, 2016, we redeemed the remaining $115.5 million in aggregate principal amount of the 2020 Notes outstanding and our obligations under the indenture, pursuant to which the 2020 Notes were issued, were satisfied and discharged. In connection with these transactions, we recognized a pre-tax loss on the extinguishment of debt of $14.3 million during 2016. The loss includes $11.3 million of debt extinguishment premium payments and $3.0 million for the net write-off of a portion of the unamortized deferred financing costs and unamortized premium related to the 2020 Notes.
Interest Rate Swaps
For information on interest rate swaps, see Interest Rate Risk and Interest Rate Swaps of Note 13, Financial Instrument Risk.
70
Cash Paid for Interest
For the years ended December 31, 2017, 2016, and 2015, cash payments for interest were $23.5 million, $21.0 million, and $20.6 million, respectively.
8. Leases
Rental expense for operating leases was $19.3 million, $18.2 million, and $18.1 million for the years ended December 31, 2017, 2016, and 2015, respectively. Sublease rental income was not material in any of the periods presented.
As of December 31, 2017, our minimum lease payment requirements for noncancelable operating leases with terms of more than one year are as follows (in thousands):
2018 | $ | 15,137 | ||
2019 | 14,538 | |||
2020 | 14,185 | |||
2021 | 12,635 | |||
2022 | 11,129 | |||
Thereafter | 58,658 | |||
Total | $ | 126,282 | ||
These future minimum lease payment requirements have not been reduced by sublease income due in the future under noncancelable subleases. Minimum sublease income expected to be received in the future is not material.
9. Retirement and Benefit Plans
Our retirement plans consist of noncontributory defined benefit pension plans, contributory defined contribution savings plans, a deferred compensation plan, and a multiemployer health and welfare plan.
Defined Benefit Plans
Some of our employees are covered by noncontributory defined benefit pension plans. We have one qualified defined benefit pension plan, which includes the merging of a salaried plan and two plans for hourly employees to simplify administration of the plans. The following summarizes recent activity of each individual plan:
• | Benefits for salaried employees were frozen so that no future benefits have accrued since December 31, 2009. |
• | From 2011 through 2015, plan amendments affected certain union and non-union hourly employees by closing participation and freezing future benefits. The benefit for hourly employees is generally based on a fixed amount per year of service (years of service determined as of the freeze dates). As a result, only certain hourly employees continue to accrue benefits after the effective dates of these amendments. |
• | On March 9, 2015 and May 15, 2015, we made discretionary contributions to our qualified defined benefit pension plan (Pension Plan) of $10.0 million and $40.0 million, respectively. Due to the significant voluntary contributions made (not anticipated in our year end measurement), we elected to remeasure our Pension Plan on May 15, 2015. See "Assumptions" below for the impact on our discount rate and expected return on plan asset assumptions. |
• | During the third quarter 2016, we offered a program whereby certain terminated vested participants and active employees of the Boise Cascade Company Pension Plan could elect to take a one-time voluntary lump-sum payment equal to the present value of future benefits. Active employees were required to retire on or before November 1, 2016 to receive their lump-sum benefits. This program closed on September 30, 2016 with participants electing lump-sum payments totaling approximately $21 million. Plan participants who elected to participate in the program received their lump-sum benefits on November 1, 2016. We remeasured the Pension Plan on November 1, 2016 and recorded settlement expense of $3.9 million in fourth quarter 2016. See "Assumptions" below for the impact on our discount rate and expected return on plan asset assumptions. |
71
We also have nonqualified salaried pension plans, which were frozen so that no future benefits have accrued since December 31, 2009.
Defined Contribution Plans
We sponsor contributory defined contribution savings plans for most of our salaried and hourly employees, and we generally provide company contributions to the savings plans. Since March 1, 2010, we have contributed 4% of each salaried participant's eligible compensation to the plan as a nondiscretionary company contribution. In addition, beginning in 2012, for the years that a performance target is met, we contribute an additional amount of the employee's eligible compensation, depending on company performance and the employee's years of service. During the year ended December 31, 2017, company performance resulted in additional contributions in the range of 1% to 2% of eligible compensation. During the years ended December 31, 2016 and 2015, company performance resulted in no additional contributions. The company contributions for union and nonunion hourly employees vary by location. Company contributions paid, or to be paid, to our defined contribution savings plans for the years ended December 31, 2017, 2016, and 2015, were $15.9 million, $11.4 million, and $10.1 million, respectively.
Defined Contributory Trust
We have participated in a multiemployer defined contributory trust plan for certain union hourly employees since 2013. As of December 31, 2017, 2016, and 2015 approximately 1,365, 1,369 and 1,431, respectively, of our employees participated in this plan. For certain of these employees, per the terms of the representative collective bargaining agreements, we were required to contribute $0.80, $0.80 and $0.75, respectively, per hour per active employee during 2017, 2016, and 2015. For certain other of these employees, we were required to contribute 4.5% of the employee's earnings during 2017, and approximately 4% of the employee's earnings during 2016 and 2015. Company contributions to the multiemployer defined contributory trust plan for each of the years ended December 31, 2017, 2016 and 2015 were $2.8 million. After required contributions, we have no further obligation to the plan. The plan and its assets are managed by a joint board of trustees.
Deferred Compensation Plan
We sponsor a deferred compensation plan. Under the plan, participating employees irrevocably elect each year to defer receipt of a portion of their base salary and incentive compensation. A participant's account is credited with imputed interest at a rate equal to 130% of Moody's Composite Average of Yields on Corporate Bonds. Participants may receive payment of their deferred compensation plan balance in a lump sum or in monthly installments over a specified period of years following the termination of their employment with the company. The deferred compensation plan is unfunded; therefore, benefits are paid from our general assets.
For the years ended December 31, 2017, 2016, and 2015, we recognized $0.8 million, $0.7 million, and $0.6 million, respectively, of interest expense related to the plan. At December 31, 2017 and 2016, we had liabilities related to the plan of $1.6 million and $0.5 million, respectively, recorded in "Accrued liabilities, Compensation and benefits" and $14.8 million and $13.2 million, respectively, recorded in "Other, Compensation and benefits" on our Consolidated Balance Sheets.
Multiemployer Health and Welfare Plan
We participate in a multiemployer health and welfare plan that covers medical, dental, and life insurance benefits for certain active employees as well as benefits for retired employees. As of December 31, 2017, 2016, and 2015, approximately 649, 658, and 651, respectively, of our employees participated in this plan. Per the terms of the representative collective bargaining agreements, we were required to contribute $5.25 per hour per active employee in 2014 and through May 31, 2015. From June 1, 2015, to December 31, 2016, we were required to contribute $5.50 per hour per active employee. From January 1, 2017, to May 31, 2017, we were required to contribute $5.80 per hour per active employee. Since June 1, 2017, we are required to contribute $6.10 per hour per active employee. During the year ended December 31, 2017, company contributions to the multiemployer health and welfare plan were $8.1 million. Company contributions to the multiemployer health and welfare plan for both of the years ended December 31, 2016 and 2015, were $7.6 million. After required contributions, we have no further obligation to the plan. The trustees of the plan determine the allocation of benefits between active and retired employees.
72
Defined Benefit Obligations and Funded Status
The following table, which includes only company-sponsored defined benefit plans, reconciles the beginning and ending balances of our projected benefit obligation and fair value of plan assets. We recognize the underfunded status of our defined benefit pension plans on our Consolidated Balance Sheets. We recognize changes in funded status in the year changes occur through other comprehensive income.
December 31 | ||||||||
2017 | 2016 | |||||||
(thousands) | ||||||||
Change in benefit obligation | ||||||||
Benefit obligation at beginning of year | $ | 460,192 | $ | 484,079 | ||||
Service cost | 1,204 | 1,127 | ||||||
Interest cost | 17,542 | 18,798 | ||||||
Actuarial loss | 26,112 | 154 | ||||||
Benefits paid (a) | (21,525 | ) | (43,966 | ) | ||||
Benefit obligation at end of year | 483,525 | 460,192 | ||||||
Change in plan assets | ||||||||
Fair value of plan assets at beginning of year | 389,440 | 399,462 | ||||||
Actual return on plan assets | 52,147 | 30,100 | ||||||
Employer contributions | 2,193 | 3,844 | ||||||
Benefits paid (a) | (21,525 | ) | (43,966 | ) | ||||
Fair value of plan assets at end of year | 422,255 | 389,440 | ||||||
Underfunded status | $ | (61,270 | ) | $ | (70,752 | ) | ||
Amounts recognized on our Consolidated Balance Sheets | ||||||||
Current liabilities | $ | (715 | ) | $ | (804 | ) | ||
Noncurrent liabilities | (60,555 | ) | (69,948 | ) | ||||
Net liability | $ | (61,270 | ) | $ | (70,752 | ) | ||
Amounts recognized in accumulated other comprehensive loss | ||||||||
Net actuarial loss | $ | 50,787 | $ | 59,540 | ||||
Prior service cost | — | — | ||||||
Net loss recognized | $ | 50,787 | $ | 59,540 | ||||
______________________________________
(a) | Benefits paid during the year ended December 31, 2016 include approximately $21 million of lump-sum cash payments to certain terminated vested participants in settlement of pension obligations. |
The accumulated benefit obligation for all defined benefit pension plans was $483.5 million and $460.2 million at December 31, 2017 and 2016, respectively. All of our defined benefit pension plans have accumulated benefit obligations that exceed the fair value of plan assets.
73
Net Periodic Benefit Cost and Other Comprehensive Income
The components of net periodic benefit cost and other amounts recognized in other comprehensive income are as follows:
Year Ended December 31 | |||||||||||
2017 | 2016 | 2015 | |||||||||
(thousands) | |||||||||||
Net periodic benefit cost | |||||||||||
Service cost | $ | 1,204 | $ | 1,127 | $ | 739 | |||||
Interest cost | 17,542 | 18,798 | 19,067 | ||||||||
Expected return on plan assets | (18,968 | ) | (20,324 | ) | (22,366 | ) | |||||
Amortization of actuarial loss | 1,686 | 2,484 | 4,884 | ||||||||
Plan settlement expense (a) | — | 4,155 | 501 | ||||||||
Net periodic benefit cost | 1,464 | 6,240 | 2,825 | ||||||||
Changes in plan assets and benefit obligations recognized in other comprehensive income | |||||||||||
Net actuarial gain | (7,067 | ) | (9,622 | ) | (8,406 | ) | |||||
Amortization of actuarial loss | (1,686 | ) | (2,484 | ) | (4,884 | ) | |||||
Effect of settlements | — | (4,155 | ) | (501 | ) | ||||||
Total recognized in other comprehensive income | (8,753 | ) | (16,261 | ) | (13,791 | ) | |||||
Total recognized in net periodic cost and other comprehensive income | $ | (7,289 | ) | $ | (10,021 | ) | $ | (10,966 | ) | ||
______________________________________
(a) | Plan settlement expense during the year ended December 31, 2016 includes a $3.9 million settlement charge related to lump-sum cash payments to certain terminated vested participants in settlement of pension obligations. |
In 2018, we estimate net periodic pension expense will be approximately $1.8 million, including $3.3 million of net actuarial loss that will be amortized from accumulated other comprehensive loss.
Assumptions
The assumptions used in accounting for our plans are estimates of factors that will determine, among other things, the amount and timing of future contributions. The following table presents the assumptions used in the measurement of our benefit obligations:
December 31 | |||||
2017 | 2016 | ||||
Weighted average assumptions | |||||
Discount rate | 3.40 | % | 3.90 | % | |
Rate of compensation increases (c) | — | % | — | % | |
The following table presents the assumptions used in the measurement of net periodic benefit cost:
December 31 | |||||||||||||||
2017 | 2016 | 2015 | |||||||||||||
Weighted average assumptions | |||||||||||||||
Discount rate (a)(b) | 3.90 | % | 4.05 | % | / | 3.45 | % | 3.75 | % | / | 3.90 | % | |||
Expected long-term rate of return on plan assets (a)(b) | 5.00 | % | 5.10 | % | / | 5.10 | % | 6.15 | % | / | 5.85 | % | |||
Rate of compensation increases (c) | — | % | — | % | — | % | |||||||||
74
_______________________________________
(a) | Prior to the remeasurement of our qualified defined benefit pension plan on November 1, 2016, the discount rate and expected rate of return on plan assets were 4.05% and 5.10%. The discount rate and expected rate of return on plan assets after the November 1, 2016 remeasurement were 3.45% and 5.10%, respectively. |
(b) | Prior to the remeasurement of our qualified defined benefit pension plan on May 15, 2015, the discount rate and expected rate of return on plan assets were 3.75% and 6.15%. The discount rate and expected rate of return on plan assets after the May 15, 2015 remeasurement were 3.90% and 5.85%, respectively. |
(c) | Pension benefits for all salaried employees are frozen, resulting in an assumption for the rate of compensation increase of zero. In addition to the salaried benefits being frozen, there are currently no scheduled increases in pension benefit rates applicable to past service covering a minimal amount of hourly employees who continue to accrue benefits. |
Discount Rate Assumption. The discount rate reflects the current rate at which the pension obligations could be settled based on the measurement date of the plans — December 31. In all years presented, the discount rates were determined by matching the expected plan benefit payments against a spot rate yield curve constructed to replicate the yields of Aa-graded corporate bonds.
Asset Return Assumption. We base our expected long-term rate of return on plan assets on a weighted average of our expected returns for the major asset classes (equities, fixed-income securities, a hedge fund, and real estate) in which we invest. The weights we assign each asset class are based on our investment strategy. Expected returns for the asset classes are based on long-term historical returns, inflation expectations, forecasted gross domestic product, earnings growth, and other economic factors. We developed our return assumption based on a review of the fund manager's estimates of future market expectations by broad asset class, actuarial projections, and expected long-term rates of return from external investment managers. The weighted average expected return on plan assets we will use in our calculation of 2018 net periodic benefit cost is 4.75%.
Retirement and Mortality Rates. These rates are developed to reflect actual and projected plan experience. In 2017, we used the RP-2014 mortality tables adjusted to reflect the new two-dimensional mortality improvement scale MP-2017. In 2016, we used the RP-2014 mortality tables adjusted to reflect the two-dimensional mortality improvement scale MP-2016.
Investment Policies and Strategies
At December 31, 2017, 47% of our pension plan assets were invested in fixed-income securities, 41% in equity securities, 6% in a hedge fund, and 6% in real estate. The general investment objective for all of our plan assets is to optimize growth of the pension plan trust assets, while minimizing the risk of significant losses in order to enable the plans to satisfy their benefit payment obligations over time. The objectives take into account the long-term nature of the benefit obligations, the liquidity needs of the plans, and the expected risk/return trade-offs of the asset classes in which the plans may choose to invest. As our funded status improves, we may rebalance our plan assets to decrease our proportion of equity securities and increase our fixed-income securities consistent with a de-risking glide path established by our Retirement Funds Investment Committee (RFIC). The RFIC is responsible for establishing and overseeing the implementation of our investment policy. Russell Investments (Russell) oversees the active management of our pension investments through its manager of managers program in order to achieve broad diversification in a cost-effective manner. At December 31, 2017, our investment policy governing our relationship with Russell allocated 54% to fixed-income securities, 21% to large-capitalization U.S. equity securities, 15% to international equity securities, 6% to a hedge fund, and 4% to small- and mid-capitalization U.S. equity securities. Our arrangement with Russell allows monthly rebalancing to the policy targets noted above. In November 2017, the RFIC provided notice to Russell to liquidate our position in the real estate fund and expects to transition the available proceeds to fixed-income securities early in second quarter 2018.
Investment securities, in general, are exposed to various risks, such as interest rate, credit, and overall market volatility risk, all of which are subject to change. In addition, our overall investment strategy and related allocations between equity and fixed-income securities may change from time to time based on market conditions, external economic factors, and the funded status of our plans. Due to the level of risk associated with certain investment securities, it is reasonably possible that changes in the values of investment securities will occur in the near term, and such changes could materially affect the reported amounts.
75
Fair Value Measurements of Plan Assets
The following table sets forth by level, within the fair value hierarchy, the pension plan assets, by major asset category, at fair value at December 31, 2017 and 2016:
December 31, 2017 | ||||||||||||||||
Quoted Prices in Active Markets for Identical Assets (Level 1) | Significant Other Observable Inputs (Level 2) (a) | Significant Unobservable Inputs (Level 3) | Total | |||||||||||||
(thousands) | ||||||||||||||||
Equity securities | ||||||||||||||||
Large-cap U.S. equity securities (b) | $ | — | $ | 93,021 | $ | — | $ | 93,021 | ||||||||
Small- and mid-cap U.S. equity securities (c) | — | 17,187 | — | 17,187 | ||||||||||||
International equity securities (d) | — | 59,937 | — | 59,937 | ||||||||||||
Fixed-income securities (e) | — | 197,866 | — | 197,866 | ||||||||||||
Total investments at fair value | $ | — | $ | 368,011 | $ | — | 368,011 | |||||||||
Hedge fund measured at NAV (f) | 27,021 | |||||||||||||||
Real estate fund measured at NAV (g) | 25,894 | |||||||||||||||
Receivables and accrued expenses, net | 1,329 | |||||||||||||||
Fair value of plan assets | $ | 422,255 | ||||||||||||||
December 31, 2016 | ||||||||||||||||
Quoted Prices in Active Markets for Identical Assets (Level 1) | Significant Other Observable Inputs (Level 2) (a) | Significant Unobservable Inputs (Level 3) | Total | |||||||||||||
(thousands) | ||||||||||||||||
Equity securities | ||||||||||||||||
Large-cap U.S. equity securities (b) | $ | — | $ | 88,686 | $ | — | $ | 88,686 | ||||||||
Small- and mid-cap U.S. equity securities (c) | — | 16,021 | — | 16,021 | ||||||||||||
International equity securities (d) | — | 59,675 | — | 59,675 | ||||||||||||
Fixed-income securities (e) | — | 173,679 | — | 173,679 | ||||||||||||
Total investments at fair value | $ | — | $ | 338,061 | $ | — | 338,061 | |||||||||
Hedge fund measured at NAV (f) | 25,823 | |||||||||||||||
Real estate fund measured at NAV (g) | 24,263 | |||||||||||||||
Receivables and accrued expenses, net | 1,293 | |||||||||||||||
Fair value of plan assets | $ | 389,440 | ||||||||||||||
_______________________________________
(a) | Equity and fixed-income securities represent common collective trusts managed and valued by Russell Trust Company, the administrator of the funds. While the underlying assets are actively traded on an exchange, the funds are not. The investments in equity and fixed-income securities are considered to have a readily determinable fair value because the fair value per share (unit) is determined and published and is the basis for current transactions. We have the ability to redeem these equity and fixed-income securities with a one-day notice. |
(b) | Invested in the Russell Large Cap U.S. Equity Fund at December 31, 2017 and 2016. The fund seeks returns that exceed the Russell 1000 Index by investing in large-capitalization stocks of the U.S. stock market. In addition, at December 31, 2017 and 2016, our investments in this category included the Russell 1000 Index Fund, which seeks to track the investment results of an index composed of large- and mid-capitalization stocks of the U.S. stock market. |
76
(c) | Invested in the Russell Equity II Fund. The fund seeks returns that exceed the Russell 2500 Index by investing in the small- and mid-capitalization stocks of the U.S. stock market. |
(d) | Invested in the Russell International Fund with Active Currency at December 31, 2017 and 2016, which benchmarks against the Russell Developed ex-U.S. Large Cap Index Net and seeks favorable total returns and additional diversification through investment in non-U.S. equity securities and active currency management. The fund participates primarily in the stock markets of Europe and the Pacific Rim and seeks to opportunistically add value through active investment in foreign currencies. In addition, at December 31, 2017 and 2016, our investments in this category included the Russell Emerging Market Fund, which benchmarks against the Russell Emerging Markets Index and is designed to maintain a broadly diversified exposure to emerging market countries. |
(e) | Invested in the Russell Long Duration Fixed Income Fund at December 31, 2017 and 2016, which is designed to provide maximum total return through diversified strategies including sector rotation, modest interest rate timing, security selection, and tactical use of high-yield, emerging market bonds and other non-index securities. In addition, at December 31, 2017 and 2016, our investments in this category included the Russell Multi-Manager Bond Fund. The fund seeks to outperform the Barclays Capital U.S. Aggregate Bond Index over a full market cycle. The fund is designed to provide current income and, as a secondary objective, capital appreciation through a variety of diversified strategies, including sector rotation, modest interest rate timing, security selection, and tactical use of high-yield and emerging market bonds. |
(f) | Invested in the AQR Delta Offshore Fund. The fund seeks to produce high risk-adjusted returns while targeting a low long-term average correlation to traditional markets. The fund invests internationally in a broad range of instruments, including, but not limited to, equities, currencies, convertible securities, futures, forwards, options, swaps, and other derivative products. The fair value of the hedge fund is estimated using the net asset value (NAV) of the investment as a practical expedient for fair value. We have the ability to redeem these investments at NAV within the near term. The fund is classified outside the fair value hierarchy tables because fair value is measured using the NAV per share practical expedient. |
(g) | Invested in the Russell Real Estate Equity Fund. The fund seeks to obtain favorable total return through income and growth, and to outperform the NCREIF Open-End Diversified Core Equity Fund Index - Equal Weight. Real estate investments include those in limited partnerships, limited liability companies, and real estate investment trusts consisting of private real estate investments including office, apartment, retail, industrial, and other commercial properties. The fair value of the real estate fund is estimated using NAV of the investment as a practical expedient for fair value. Amounts realized on the sale of these investments may differ from the calculated values. We have the ability to redeem the real estate investments with a 110-calendar-day written notice prior to a quarterly trade date. The fund is classified outside the fair value hierarchy tables because fair value is measured using the NAV per share practical expedient. In November 2017, the RFIC provided notice to Russell to liquidate our position in the real estate fund and expects to transition the available proceeds to fixed-income securities early in second quarter 2018. |
Cash Flows
As of December 31, 2017, we have contributed a total of four company-owned real property locations from our Building Materials Distribution segment to our qualified defined benefit pension plan. These contributions constitute related party transactions. We are leasing back the contributed properties for initial terms of ten years ending between 2022 and 2025 with two five-year extension options and continue to use the properties in our distribution operations. Rent payments are made quarterly and include 2% annual escalation rates. Each lease provides us a right of first refusal on any subsequent sale by the pension plan, as well as repurchase options at the end of the initial term and extension periods. The plan engaged an independent fiduciary who negotiated the lease terms and also manages the properties on behalf of the plan.
We determined that the contribution of the properties does not meet the accounting definition of a plan asset within the scope of Accounting Standards Codification 715, Compensation — Retirement Benefits. Accordingly, the contributed properties are not considered a contribution for accounting purposes and, as a result, are not included in plan assets and have no impact on the net pension liability recorded on our Consolidated Balance Sheets. We continue to depreciate the carrying value of the properties in our financial statements, and no gain or loss was recognized at the contribution date for accounting purposes. Lease payments are recorded as pension contributions.
Our practice is to fund the pension plans in amounts sufficient to meet the minimum requirements of U.S. federal laws and regulations. Additional discretionary funding may be provided as deemed appropriate. For the years ended December 31, 2017, 2016, and 2015, we made cash contributions to our pension plans totaling $2.2 million, $3.8 million, and $54.3 million, respectively. Cash contributions during both 2017 and 2016 include $1.4 million of lease payments. During 2015, cash contributions include $1.3 million of lease payments. While we have no federally required contributions for 2018, we expect to make cash contributions of approximately $2 million to our pension plans. These contributions reflect benefit payments to plan participants of our nonqualified salaried pension plans and lease payments for properties we have contributed to our qualified defined benefit pension plan.
77
Qualified pension benefit payments are paid from plan assets, while nonqualified pension benefit payments are paid by the company. The following benefit payments are expected to be paid to plan participants (in thousands):
2018 | $ | 22,702 | ||
2019 | 23,768 | |||
2020 | 24,501 | |||
2021 | 25,272 | |||
2022 | 25,885 | |||
Years 2023-2027 | 134,600 | |||
10. Stock-Based Compensation
In February 2013, we adopted the 2013 Incentive Compensation Plan (2013 Incentive Plan), which was superseded by the 2016 Boise Cascade Omnibus Incentive Plan (2016 Incentive Plan), which was approved by our stockholders and became effective in April 2016. After the effective date of the 2016 Incentive Plan, no awards were granted under the 2013 Incentive Plan. The 2016 Incentive Plan provides for grants of stock options, stock appreciation rights, restricted stock, other stock-based awards, other cash-based compensation, and performance awards. Directors, officers, and other employees, as well as others performing consulting or advisory services for us, are eligible for grants under the 2016 Incentive Plan. These awards are at the discretion of the Compensation Committee of our board of directors, and they vest and expire in accordance with terms established at the time of grant. All awards under the 2016 Incentive Plan, other than stock options or stock appreciation rights, are eligible to participate in dividend or dividend equivalent payments, if any, which we would accrue to be paid when the awards vest. We issue new shares of common stock upon exercise of stock options and vesting of other stock-based awards. Shares issued pursuant to awards under the 2016 Incentive Plan are from our authorized but unissued shares. The maximum number of shares approved for grant under the 2016 Incentive Plan is 3.7 million shares.
In February 2017, we granted two types of stock-based awards under the 2016 Incentive Plan: performance stock units (PSUs) and restricted stock units (RSUs). In February 2016 and 2015, we granted two types of stock-based awards under the 2013 Incentive Plan: PSUs and RSUs. As of December 31, 2017, 2.7 million shares remained available for future issuance under the 2016 Incentive Plan.
PSU and RSU Awards
In 2017, we granted 178,021 PSUs to our officers and other employees, subject to performance and service conditions, at a weighted average grant date fair market value of $27.05. For the officers, the number of shares actually awarded will range from 0% and 200% of the target amount, depending upon Boise Cascade's 2017 return on invested capital (ROIC), determined in accordance with the related grant agreement. For the other employees, the number of shares actually awarded will range from 0% to 200% of the target amount, depending upon Boise Cascade's 2017 EBITDA, defined as income before interest (interest expense and interest income), income taxes, and depreciation and amortization, determined in accordance with the related grant agreement. Because the ROIC and EBITDA components contain a performance condition, we record compensation expense over the requisite service period based on the most probable number of shares expected to vest.
In 2016 and 2015, we granted 418,344 and 116,636 PSUs, at a weighted average grant date fair market value of $16.56 and $36.17, respectively, to our officers and other employees, subject to performance and service conditions. During the 2016 performance period, officers and other employees earned 97% and 104%, respectively, of the target based on Boise Cascade’s 2016 ROIC and EBITDA, determined by our Compensation Committee in accordance with the related grant agreement. During the 2015 performance period, participants earned 63% of the target based on Boise Cascade’s 2015 EBITDA, determined by our Compensation Committee in accordance with the related grant agreements.
In 2017, 2016, and 2015, we granted an aggregate of 214,035, 335,820, and 140,167 RSUs, at a weighted average grant date fair market value of $27.10, $16.73, and $36.16, respectively, to our officers, other employees, and nonemployee directors with only service conditions.
The PSUs granted to officers in 2017, if earned, generally vest over a three year period from the date of grant, while the PSUs granted to other employees vest in three equal tranches each year after the grant date. All PSU grants are subject to final determination of meeting the performance condition by the Compensation Committee of our board of directors. The RSUs
78
granted to officers and other employees vest in three equal tranches each year after the grant date. The RSUs granted to nonemployee directors vest over a one-year period.
We based the fair value of PSU and RSU awards on the closing market price of our common stock on the grant date. During the years ended December 31, 2017, 2016, and 2015, the total fair value of PSUs and RSUs vested was $8.5 million, $2.8 million, $4.9 million, respectively.
The following summarizes the activity of our PSUs and RSUs awarded under our incentive plans for the year ended December 31, 2017:
PSUs | RSUs | ||||||||||||||
Number of shares | Weighted Average Grant-Date Fair Value | Number of shares | Weighted Average Grant-Date Fair Value | ||||||||||||
Outstanding, December 31, 2016 | 448,500 | $ | 18.16 | 387,287 | $ | 19.73 | |||||||||
Granted | 178,021 | 27.05 | 214,035 | 27.10 | |||||||||||
Performance condition adjustment (a) | 5,175 | 16.56 | — | — | |||||||||||
Vested | (118,138 | ) | 20.44 | (182,489 | ) | 20.79 | |||||||||
Forfeited (b) | (26,398 | ) | 19.63 | (15,581 | ) | 22.41 | |||||||||
Outstanding, December 31, 2017 | 487,160 | $ | 20.76 | $ | 403,252 | $ | 23.06 | ||||||||
__________________
(a) | Amount represents additional PSU's earned during the year ended December 31, 2017, based on the performance condition adjustment, as other employees earned 104% of the target based Boise Cascade's 2016 EBITDA. |
(b) | Total PSUs forfeited during the year ended December 31, 2017, includes 8,457 shares related to the performance condition adjustment, as officers earned 97% of the target based on Boise Cascade’s 2016 ROIC. |
Compensation Expense
We record compensation expense over the awards' vesting period and account for share-based award forfeitures as they occur, rather than making estimates of future forfeitures. Any shares not vested are forfeited. We recognize stock awards with only service conditions on a straight-line basis over the requisite service period. Most of our share-based compensation expense was recorded in "General and administrative expenses" in our Consolidated Statements of Operations. Total stock-based compensation recognized from PSUs, RSUs, and stock options net of forfeitures, was as follows:
Year Ended December 31 | |||||||||||
2017 | 2016 | 2015 | |||||||||
(thousands) | |||||||||||
PSUs | $ | 4,923 | $ | 4,114 | $ | 2,295 | |||||
RSUs | 4,807 | 3,982 | 2,995 | ||||||||
Stock options | — | 81 | 535 | ||||||||
Total | $ | 9,730 | $ | 8,177 | $ | 5,825 | |||||
For the years ended December 31, 2017, 2016, and 2015, the related tax benefit was $2.5 million, $3.1 million, and $2.2 million, respectively. As of December 31, 2017, total unrecognized compensation expense related to nonvested share-based compensation arrangements was $10.7 million. This expense is expected to be recognized over a weighted-average period of 1.7 years.
11. Stockholders' Equity
Our certificate of incorporation has authorized 300,000,000 shares of common stock and 50,000,000 shares of preferred stock. No preferred stock was issued or outstanding as of December 31, 2017 and 2016. We had 43,747,805 and 43,519,647 shares of common stock issued and 38,580,732 and 38,352,574 shares of common stock outstanding as of
79
December 31, 2017 and 2016, respectively. Each share of common stock entitles the holder to one vote on matters to be voted on by the stockholders of Boise Cascade.
Dividends
On November 14, 2017, we announced that our board of directors approved a dividend policy to pay quarterly cash dividends to holders of our common stock. Our board of directors declared an initial dividend of $0.07 per share of our common stock, payable on December 15, 2017, to stockholders of record on November 27, 2017. During the year ended December 31, 2017, we paid $2.7 million of dividends to shareholders. We did not declare or pay any cash dividends on our common stock during the years ended December 31, 2016 and 2015. On February 7, 2018, the our board of directors declared a dividend of $0.07 per share of its common stock, payable on March 15, 2018, to stockholders of record on March 1, 2018. For a description of the restrictions in our asset-based credit facility, Term Loan, and the indenture governing our senior notes on our ability to pay dividends, see Note 7, Debt.
Stock Repurchase
On February 25, 2015, our board of directors authorized a two million share repurchase program (Program) pursuant to which we may, from time to time, purchase shares of our common stock through various means including, without limitation, open market transactions, privately negotiated transactions, or accelerated share repurchase transactions. We are not obligated to purchase any shares and there is no set date that the Program will expire. The board may increase or decrease the number of shares under the Program or terminate the Program in its discretion at any time. We did not purchase any shares under the Program during the year ended December 31, 2017. During 2016, we repurchased 580,100 shares under the Program at a cost of $10.3 million, or an average of $17.70 per share. During 2015, we repurchased 722,911 shares under the Program at a cost of $23.7 million, or $32.80 per share. The shares were purchased with cash on hand and are recorded as "Treasury stock" on our Consolidated Balance Sheet. As of December 31, 2017, there were 696,989 shares of common stock that may yet be purchased under the Program.
Accumulated Other Comprehensive Loss
Changes in accumulated other comprehensive loss are as follows:
Changes in Accumulated Other Comprehensive Loss | ||||||||||||
Year Ended December 31 | ||||||||||||
2017 | 2016 | 2015 | ||||||||||
(thousands) | ||||||||||||
Beginning Balance, net of taxes | $ | (83,012 | ) | $ | (93,015 | ) | $ | (101,498 | ) | |||
Net actuarial gain, current-period changes, before taxes | 7,067 | 9,622 | 8,406 | |||||||||
Amortization of actuarial loss, amounts reclassified from accumulated other comprehensive loss, before taxes (a) | 1,686 | 2,484 | 4,884 | |||||||||
Effect of settlements, amounts reclassified from accumulated other comprehensive loss, before taxes (a) | — | 4,155 | 501 | |||||||||
Income taxes | (2,443 | ) | (6,258 | ) | (5,308 | ) | ||||||
Ending Balance, net of taxes | $ | (76,702 | ) | $ | (83,012 | ) | $ | (93,015 | ) | |||
___________________________________
(a) | Represents amounts reclassified from accumulated other comprehensive loss. These amounts are included in the computation of net periodic pension cost. For additional information, see Note 9, Retirement and Benefit Plans. |
80
12. Transactions With Related Parties
Louisiana Timber Procurement Company, L.L.C. (LTP) is an unconsolidated variable-interest entity that is 50% owned by us and 50% owned by Packaging Corporation of America (PCA). LTP procures sawtimber, pulpwood, residual chips, and other residual wood fiber to meet the log and fiber requirements of us and PCA in Louisiana. We are not the primary beneficiary of LTP, as we do not have power to direct the activities that most significantly affect the economic performance of LTP. Accordingly, we do not consolidate LTP's results in our financial statements.
Sales
Related-party sales to LTP from our Wood Products segment in our Consolidated Statements of Operations were $16.6 million, $17.4 million, and $20.7 million, respectively, during the years ended December 31, 2017, 2016, and 2015. These sales are recorded in "Sales" in our Consolidated Statements of Operations.
Costs and Expenses
Related-party wood fiber purchases from LTP were $86.4 million, $87.2 million, and $88.8 million, respectively, during the years ended December 31, 2017, 2016, and 2015. These costs are recorded in "Materials, labor, and other operating expenses (excluding depreciation)" in our Consolidated Statements of Operations.
13. Financial Instrument Risk
In the normal course of business, we are exposed to financial risks such as changes in interest rates, foreign currency exchange rates, and commodity prices. In 2017, 2016, and 2015, we did not use derivative instruments to manage these risks, except for interest rate swaps entered into in 2016 as discussed below.
Interest Rate Risk and Interest Rate Swaps
We are exposed to interest rate risk arising from fluctuations in variable-rate LIBOR on our term loans and when we have loan amounts outstanding on our Revolving Credit Facility. At December 31, 2017, we had $95.0 million of variable-rate debt outstanding. Our objective is to limit the variability of interest payments on our debt. To meet this objective, in 2016 we entered into receive-variable, pay-fixed interest rate swaps to change the variable-rate cash flow exposure to fixed-rate cash flows. In accordance with our risk management strategy, we actively monitor our interest rate exposure and use derivative instruments from time to time to manage the related risk.
On February 16, 2016, and March 31, 2016, we entered into interest rate swap agreements with notional principal amounts of $50.0 million and $75.0 million, respectively, to offset risks associated with the variability in cash flows relating to interest payments that are based on one-month LIBOR. We do not speculate using derivative instruments. At December 31, 2017, and December 31, 2016, the notional principal amount of our interest rate swap agreements exceeded the $95.0 million of variable-rate debt outstanding after paying down $30.0 million of variable rate debt on our Term Loan in December 2016. The excess notional principal amount of our interest rate swaps over our variable-rate debt is within our management strategy as we have partially funded seasonal and intra-month working capital requirements from borrowings under our Revolving Credit Facility.
Under the interest rate swaps, we receive LIBOR-based variable interest rate payments and make fixed interest rate payments, thereby fixing the interest rate on $125.0 million of variable-rate debt exposure. Payments on the interest rate swaps with notional principal amounts of $50.0 million and $75.0 million are due on a monthly basis at an annual fixed rate of 1.007% and 1.256%, respectively, and expire in February 2022 and March 2022, respectively. The interest rate swap agreements were not designated as cash flow hedges, and as a result, all changes in the fair value are recognized in "Change in fair value of interest rate swaps" in the Consolidated Statements of Operations rather than through other comprehensive income. At December 31, 2017, and 2016, we recorded a long-term asset of $4.7 million and $4.2 million, respectively, in "Other assets" on our Consolidated Balance Sheets, representing the fair value of the interest rate swap agreements. The swaps were valued based on observable inputs for similar assets and liabilities and other observable inputs for interest rates and yield curves (Level 2 inputs).
81
Foreign Currency Risk
We have sales in countries outside the U.S. As a result, we are exposed to movements in foreign currency exchange rates, primarily in Canada, but we do not believe our exposure to currency fluctuations is significant.
Commodity Price Risk
Many of the products we manufacture or purchase and resell and some of our key production inputs are commodities whose price is determined by the market's supply and demand for such products. Price fluctuations in our selling prices and key costs have a significant effect on our financial performance. The markets for most of these commodities are cyclical and are primarily affected by various economic and industry factors, including the strength of the U.S. housing market, net import and export activity, changes in or disruptions to industry production capacity, changes in inventory levels, and other factors beyond our control.
14. Segment Information
As of January 1, 2017, we operate our business using two reportable segments: Wood Products and Building Materials Distribution. These segments represent distinct businesses that are managed separately because of differing products and services. Each of these businesses requires distinct operating and marketing strategies. Management reviews the performance of the company based on these segments.
Prior to January 1, 2017, we operated our business using three reportable segments: Wood Products, Building Materials Distribution, and Corporate and Other. This change is based on Corporate and Other no longer earning revenue as of January 1, 2017 and thus no longer meeting the definition of a reportable segment. Corporate results are now presented as reconciling items to arrive at total net sales and operating income. Corresponding information for the years ended December 31, 2016 and 2015, has been revised to conform with current presentation.
Our Wood Products segment manufactures EWP, consisting of laminated veneer lumber (LVL), I-joists, and laminated beams, which are structural products used in applications where extra strength and consistent quality are required, such as headers and beams. LVL is also used in the manufacture of I-joists, which are assembled by combining a vertical web of oriented strand board (OSB) with top and bottom LVL or solid wood flanges. In addition, we manufacture structural, appearance, and industrial plywood panels. We also produce ponderosa pine lumber, studs, and particleboard. Our wood products are used primarily in new residential construction, residential repair-and-remodeling markets, and light commercial construction. The majority of our wood products are sold to leading wholesalers (including our Building Materials Distribution segment), home improvement centers, retail lumberyards, and industrial converters. During 2017, approximately 52% of Wood Products' overall sales were to our Building Materials Distribution segment.
Our Building Materials Distribution segment is a leading national stocking wholesale distributor of building materials. We distribute a broad line of building materials, including EWP, OSB, plywood, lumber, and general line items such as siding, metal products, insulation, roofing, and composite decking. Except for EWP, we purchase most of these building materials from third-party suppliers and market them primarily to retail lumberyards, home improvement centers, and specialty distributors that then sell the products to the final end customers, who are typically professional builders, independent contractors, and homeowners engaged in residential construction projects.
Unallocated corporate costs include corporate support staff services, related assets and liabilities, and pension plan activity. Support services include, but are not limited to, information technology, human resources, finance, accounting, and legal functions. Specified expenses are allocated to the segments. For many of these allocated expenses, the related assets and liabilities remain in corporate.
The segments follow the accounting principles described in Note 2, Summary of Significant Accounting Policies.
For the years ended December 31, 2017, 2016, and 2015, no customers accounted for 10% or more of total sales. Sales to foreign unaffiliated customers were approximately $94 million, $71 million, and $85 million, respectively, for the years ended December 31, 2017, 2016, and 2015.
At December 31, 2017, 2016, and 2015, and for the years then ended, long-lived assets located in foreign countries and net sales originating in foreign countries were not material.
82
Wood Products and Building Materials Distribution segment sales to external customers, including related parties, by product line are as follows:
Year Ended December 31 | ||||||||||||
2017 | 2016 | 2015 | ||||||||||
(millions) | ||||||||||||
Wood Products | ||||||||||||
Engineered wood products | $ | 102.7 | $ | 154.4 | $ | 127.2 | ||||||
Plywood and veneer | 324.4 | 316.8 | 385.5 | |||||||||
Lumber | 87.6 | 87.2 | 96.5 | |||||||||
Byproducts | 53.2 | 56.0 | 62.0 | |||||||||
Particleboard | 46.0 | 49.3 | 51.6 | |||||||||
Other | 44.4 | 19.9 | 19.5 | |||||||||
658.3 | 683.6 | 742.3 | ||||||||||
Building Materials Distribution | ||||||||||||
Commodity | 1,808.2 | 1,503.0 | 1,343.4 | |||||||||
General line | 1,269.5 | 1,141.9 | 1,037.8 | |||||||||
Engineered wood products | 696.0 | 582.3 | 509.9 | |||||||||
3,773.7 | 3,227.2 | 2,891.1 | ||||||||||
$ | 4,432.0 | $ | 3,910.8 | $ | 3,633.4 | |||||||
An analysis of our operations by segment is as follows:
Year Ended December 31 | |||||||||||
2017 | 2016 | 2015 | |||||||||
(thousands) | |||||||||||
Net sales by segment | |||||||||||
Wood Products | $ | 1,373,760 | $ | 1,280,415 | $ | 1,282,113 | |||||
Building Materials Distribution | 3,773,810 | 3,227,207 | 2,891,302 | ||||||||
Intersegment eliminations and other (a) | (715,579 | ) | (596,407 | ) | (540,000 | ) | |||||
Total net sales | $ | 4,431,991 | $ | 3,911,215 | $ | 3,633,415 | |||||
Segment operating income | |||||||||||
Wood Products | $ | 53,629 | $ | 25,929 | $ | 64,221 | |||||
Building Materials Distribution | 116,760 | 84,359 | 60,751 | ||||||||
Total segment operating income | 170,389 | 110,288 | 124,972 | ||||||||
Unallocated corporate costs | (29,236 | ) | (30,710 | ) | (21,783 | ) | |||||
Income from operations | $ | 141,153 | $ | 79,578 | $ | 103,189 | |||||
Depreciation and amortization | |||||||||||
Wood Products | $ | 63,115 | $ | 57,521 | $ | 43,272 | |||||
Building Materials Distribution | 15,504 | 13,762 | 11,937 | ||||||||
Corporate | 1,760 | 1,564 | 369 | ||||||||
Total depreciation and amortization | $ | 80,379 | $ | 72,847 | $ | 55,578 | |||||
Capital expenditures | |||||||||||
Wood Products (b) | $ | 54,600 | $ | 282,403 | $ | 68,757 | |||||
Building Materials Distribution | 19,301 | 15,846 | 14,509 | ||||||||
Corporate | 1,549 | 1,234 | 4,260 | ||||||||
Total capital expenditures | $ | 75,450 | $ | 299,483 | $ | 87,526 | |||||
83
__________________
(a) | Primarily represents intersegment sales from our Wood Products segment to our Building Materials Distribution segment. |
(b) | Capital spending in 2016 for Wood Products includes $215.9 million for the acquisition of two EWP facilities. |
December 31 | |||||||
2017 | 2016 | ||||||
(thousands) | |||||||
Assets | |||||||
Wood Products | $ | 783,533 | $ | 781,672 | |||
Building Materials Distribution | 635,208 | 548,114 | |||||
Corporate | 188,452 | 109,411 | |||||
Total assets | $ | 1,607,193 | $ | 1,439,197 | |||
15. Commitments, Legal Proceedings and Contingencies, and Guarantees
Commitments
We have commitments for leases and long-term debt that are discussed further in Note 7, Debt, and Note 8, Leases. In addition, we have purchase obligations for goods and services, capital expenditures, and raw materials entered into in the normal course of business.
We are a party to a number of long-term log supply agreements. At December 31, 2017, our total obligation for log purchases under contracts with third parties was approximately $72 million based on fixed contract pricing or first quarter 2018 pricing for variable contracts. Under certain log supply agreements, we have the right to cancel or reduce our commitments in the event of a mill curtailment or shutdown. Future purchase prices under most of the variable-price agreements will be set quarterly or semiannually based on regional market prices. Our log obligations are subject to change based on, among other things, the effect of governmental laws and regulations, our manufacturing operations not operating in the normal course of business, log availability, and the status of environmental appeals. Except for deposits required pursuant to log supply contracts, these obligations are not recorded in our consolidated financial statements until the contract payment terms take effect.
Legal Proceedings and Contingencies
We are a party to legal proceedings that arise in the ordinary course of our business, including commercial liability claims, premises claims, environmental claims, and employment-related claims, among others. As of the date of this filing, we believe it is not reasonably possible that any of the legal actions against us will, individually or in the aggregate, have a material adverse effect on our financial position, results of operations, or cash flows.
Guarantees
We provide guarantees, indemnifications, and assurances to others.
Boise Cascade Company and its subsidiaries (Boise Cascade Building Materials Distribution, L.L.C., and Boise Cascade Wood Products, L.L.C.) act as co-borrowers under our Revolving Credit Facility, ABL Term Loan, and Term Loan, described in Note 7, Debt. Their obligations are guaranteed by each of our remaining domestic subsidiaries.
Boise Cascade has issued $350.0 million of 5.625% senior notes due in 2024. At December 31, 2017, $350.0 million of the 2024 Notes were outstanding. The 2024 Notes are guaranteed by each of Boise Cascade Company's existing and future direct or indirect domestic subsidiaries that is a guarantor or co-borrower under our Revolving Credit Facility. See Note 7, Debt, for more information.
Boise Cascade issued guarantees to a limited number of trade creditors of one or more of its principal operating subsidiaries, Boise Cascade Building Materials Distribution, L.L.C., and Boise Cascade Wood Products, L.L.C., for trade credit obligations arising in the ordinary course of the business of such operating subsidiaries. These included guarantees of the obligations of Boise Cascade Wood Products, L.L.C., with respect to present and future log sale agreements and several facility
84
and rolling stock leases entered into by such subsidiaries and by Boise Cascade Building Materials Distribution, L.L.C. Boise Cascade's exposure under these agreements is limited to future log purchases and the minimum lease payment requirements under the agreements. Boise Cascade also enters into guarantees of various raw materials arising in the ordinary course of business.
All surety bonds and most letters of credit supporting obligations of subsidiaries sold or liabilities assumed by Boise Inc., which became a wholly-owned subsidiary of PCA, in connection with the sale of our Paper and Packaging & Newsprint assets in 2008 have been replaced by new surety bonds or letters of credit issued without our credit support. The principal exception is letters of credit supporting workers' compensation obligations assumed by Boise Inc., which as a matter of state law must remain in our name even though the underlying liabilities and exposures have been assumed by Boise Inc. We are entitled to an indemnification from the purchaser for liabilities with respect to such letters of credit arising from workers' compensation claims assumed by Boise Inc. and for our costs of maintaining Boise Inc.'s share of any such letter of credit.
We enter into a wide range of indemnification arrangements in the ordinary course of business. At December 31, 2017, we are not aware of any material liabilities arising from these indemnifications.
16. Quarterly Results of Operations (unaudited)
2017 | ||||||||||||||||
First Quarter | Second Quarter | Third Quarter | Fourth Quarter (a) | |||||||||||||
(millions, except per-share amounts) | ||||||||||||||||
Net sales | $ | 974.4 | $ | 1,138.9 | $ | 1,226.6 | $ | 1,092.0 | ||||||||
Income from operations | $ | 21.1 | $ | 42.4 | $ | 56.0 | $ | 21.6 | ||||||||
Net income | $ | 10.0 | $ | 22.2 | $ | 31.7 | $ | 19.1 | ||||||||
Net income per common share – Basic | $ | 0.26 | $ | 0.57 | $ | 0.82 | $ | 0.49 | ||||||||
Net income per common share – Diluted | $ | 0.26 | $ | 0.57 | $ | 0.81 | $ | 0.49 | ||||||||
2016 | ||||||||||||||||
First Quarter | Second Quarter | Third Quarter (b) | Fourth Quarter (c) | |||||||||||||
(millions, except per-share amounts) | ||||||||||||||||
Net sales | $ | 880.7 | $ | 1,043.8 | $ | 1,067.2 | $ | 919.5 | ||||||||
Income (loss) from operations | $ | 13.4 | $ | 37.9 | $ | 31.3 | $ | (3.0 | ) | |||||||
Net income | $ | 5.0 | $ | 19.2 | $ | 10.0 | $ | 4.1 | ||||||||
Net income per common share – Basic | $ | 0.13 | $ | 0.50 | $ | 0.26 | $ | 0.11 | ||||||||
Net income per common share – Diluted | $ | 0.13 | $ | 0.49 | $ | 0.26 | $ | 0.11 | ||||||||
__________________
(a) | Fourth quarter 2017 results include an $8.1 million, or $0.21 per share, income tax benefit associated with the effects of the Tax Cuts and Jobs Act discussed further in Note 3, Income Taxes. |
(b) | Third quarter 2016 results include a $5.9 million, or $0.15 per share, after-tax loss on the extinguishment of debt, as we refinanced our senior notes. For more information, see Note 7, Debt. |
(c) | The following items impacted fourth quarter 2016 results: |
• | $8.5 million, or $0.22 per share, income tax benefit primarily associated with the reversal of a valuation allowance on foreign deferred tax assets, net of other tax adjustments. For more information, see Note 3, Income Taxes. |
• | $3.0 million, $0.08 per share, after-tax loss on the extinguishment of debt, as we refinanced our senior notes. For more information, see Note 7, Debt. |
• | $2.4 million, or $0.06 per share, after-tax settlement expense associated with voluntary lump-sum payments to pension plan participants. For more information, see Note 9, Retirement and Benefit Plans. |
85
Report of Independent Registered Public Accounting Firm
To the stockholders and board of directors
Boise Cascade Company:
Opinion on the Consolidated Financial Statements
We have audited the accompanying consolidated balance sheets of Boise Cascade Company and subsidiaries (the “Company”) as of December 31, 2017 and 2016, the related consolidated statements of operations, comprehensive income, stockholders’ equity, and cash flows for each of the years in the three‑year period ended December 31, 2017, and the related notes (collectively, the “consolidated financial statements”). In our opinion, the consolidated financial statements present fairly, in all material respects, the financial position of the Company as of December 31, 2017 and 2016, and the results of its operations and its cash flows for each of the years in the three‑year period ended December 31, 2017, in conformity with U.S. generally accepted accounting principles.
We also have audited, in accordance with the standards of the Public Company Accounting Oversight Board (United States) (“PCAOB”), the Company’s internal control over financial reporting as of December 31, 2017, based on criteria established in Internal Control - Integrated Framework (2013) issued by the Committee of Sponsoring Organizations of the Treadway Commission, and our report dated February 23, 2018 expressed an unqualified opinion on the effectiveness of the Company’s internal control over financial reporting
Basis for Opinion
These consolidated financial statements are the responsibility of the Company’s management. Our responsibility is to express an opinion on these consolidated financial statements based on our audits. We are a public accounting firm registered with the PCAOB and are required to be independent with respect to the Company in accordance with the U.S. federal securities laws and the applicable rules and regulations of the Securities and Exchange Commission and the PCAOB.
We conducted our audits in accordance with the standards of the PCAOB. Those standards require that we plan and perform the audit to obtain reasonable assurance about whether the consolidated financial statements are free of material misstatement, whether due to error or fraud. Our audits included performing procedures to assess the risks of material misstatement of the consolidated financial statements, whether due to error or fraud, and performing procedures that respond to those risks. Such procedures included examining, on a test basis, evidence regarding the amounts and disclosures in the consolidated financial statements. Our audits also included evaluating the accounting principles used and significant estimates made by management, as well as evaluating the overall presentation of the consolidated financial statements. We believe that our audits provide a reasonable basis for our opinion.
/s/ KPMG LLP
We have served as the Company’s auditor since 2005
Boise, Idaho
February 23, 2018
86
Report of Independent Registered Public Accounting Firm
To the stockholders and board of directors
Boise Cascade Company:
Opinion on Internal Control Over Financial Reporting
We have audited Boise Cascade Company and subsidiaries’ (the “Company”) internal control over financial reporting as of December 31, 2017, based on criteria established in Internal Control - Integrated Framework (2013) issued by the Committee of Sponsoring Organizations of the Treadway Commission. In our opinion, the Company maintained, in all material respects, effective internal control over financial reporting as of December 31, 2017, based on criteria established in Internal Control - Integrated Framework (2013) issued by the Committee of Sponsoring Organizations of the Treadway Commission.
We also have audited, in accordance with the standards of the Public Company Accounting Oversight Board (United States) (“PCAOB”), the consolidated balance sheets of the Company as of December 31, 2017 and 2016, the related consolidated statements of operations, comprehensive income, stockholders’ equity, and cash flows for each of the years in the three-year period ended December 31, 2017, and the related notes (collectively, the consolidated financial statements), and our report dated February 23, 2018 expressed an unqualified opinion on those consolidated financial statements.
Basis for Opinion
The Company’s management is responsible for maintaining effective internal control over financial reporting and for its assessment of the effectiveness of internal control over financial reporting, included in the accompanying management’s report on internal control over financial reporting in Item 9A. Our responsibility is to express an opinion on the Company’s internal control over financial reporting based on our audit. We are a public accounting firm registered with the PCAOB and are required to be independent with respect to the Company in accordance with the U.S. federal securities laws and the applicable rules and regulations of the Securities and Exchange Commission and the PCAOB.
We conducted our audit in accordance with the standards of the PCAOB. Those standards require that we plan and perform the audit to obtain reasonable assurance about whether effective internal control over financial reporting was maintained in all material respects. Our audit of internal control over financial reporting included obtaining an understanding of internal control over financial reporting, assessing the risk that a material weakness exists, and testing and evaluating the design and operating effectiveness of internal control based on the assessed risk. Our audit also included performing such other procedures as we considered necessary in the circumstances. We believe that our audit provides a reasonable basis for our opinion.
Definition and Limitations of Internal Control Over Financial Reporting
A company’s internal control over financial reporting is a process designed to provide reasonable assurance regarding the reliability of financial reporting and the preparation of financial statements for external purposes in accordance with generally accepted accounting principles. A company’s internal control over financial reporting includes those policies and procedures that (1) pertain to the maintenance of records that, in reasonable detail, accurately and fairly reflect the transactions and dispositions of the assets of the company; (2) provide reasonable assurance that transactions are recorded as necessary to permit preparation of financial statements in accordance with generally accepted accounting principles, and that receipts and expenditures of the company are being made only in accordance with authorizations of management and directors of the company; and (3) provide reasonable assurance regarding prevention or timely detection of unauthorized acquisition, use, or disposition of the company’s assets that could have a material effect on the financial statements.
Because of its inherent limitations, internal control over financial reporting may not prevent or detect misstatements. Also, projections of any evaluation of effectiveness to future periods are subject to the risk that controls may become inadequate because of changes in conditions, or that the degree of compliance with the policies or procedures may deteriorate.
/s/ KPMG LLP
Boise, Idaho
February 23, 2018
87
ITEM 9. | CHANGES IN AND DISAGREEMENTS WITH ACCOUNTANTS ON ACCOUNTING AND FINANCIAL DISCLOSURE |
None.
ITEM 9A. CONTROLS AND PROCEDURES
Evaluation of Disclosure Controls and Procedures
We maintain "disclosure controls and procedures," as defined in Rule 13a-15(e) under the Exchange Act. We have designed these controls and procedures to reasonably assure that information required to be disclosed in our reports filed or submitted under the Exchange Act, is recorded, processed, summarized, and reported within the time periods specified in the Securities and Exchange Commission's rules and forms. We have also designed our disclosure controls to provide reasonable assurance that such information is accumulated and communicated to our senior management, including our chief executive officer (CEO) and our chief financial officer (CFO), as appropriate, to allow them to make timely decisions regarding our required disclosures. Based on that evaluation, our CEO and CFO have concluded that as of December 31, 2017, our disclosure controls and procedures were effective in meeting the objectives for which they were designed and were operating at a reasonable assurance level.
Limitations on the Effectiveness of Controls and Procedures
In designing and evaluating our disclosure and/or internal controls and procedures, we recognized that no matter how well conceived and well operated, a control system can provide only reasonable, not absolute, assurance that the objectives of the control system are met. Because of its inherent limitations, a control system, no matter how well designed, may not prevent or detect misstatements due to error or fraud. Additionally, in designing a control system, our management necessarily was required to apply its judgment in evaluating the cost-benefit relationship of possible controls and procedures. We have also designed our disclosure and internal controls and procedures based in part upon assumptions about the likelihood of future events, and there can be no assurance that any design will succeed in achieving its stated goals under all potential future conditions.
Management's Report on Internal Control Over Financial Reporting
The management of Boise Cascade Company (Boise Cascade) is responsible for establishing and maintaining adequate internal control over financial reporting as defined in Rule 13a-15(f) or 15d-15(f) under the Exchange Act. Our internal control over financial reporting is a process designed to provide reasonable assurance regarding the reliability of financial reporting and the preparation of financial statements for external purposes in accordance with accounting principles generally accepted in the United States of America. Internal control over financial reporting includes those policies and procedures that:
• | pertain to the maintenance of records that in reasonable detail accurately and fairly reflect our transactions and dispositions of assets; |
• | provide reasonable assurance that transactions are recorded as necessary to permit preparation of financial statements in accordance with generally accepted accounting principles; |
• | provide reasonable assurance that our receipts and expenditures are being made only in accordance with authorizations of our management and directors; and |
• | provide reasonable assurance regarding prevention or timely detection of unauthorized acquisition, use, or disposition of our assets that could have a material effect on our consolidated financial statements. |
Internal control over financial reporting includes the controls themselves, monitoring and internal auditing practices, and actions taken to correct deficiencies as identified. As of December 31, 2017, management conducted an assessment of the effectiveness of Boise Cascade's internal control over financial reporting based on criteria for effective internal control over financial reporting described in "Internal Control—Integrated Framework" (2013) issued by the Committee of Sponsoring Organizations of the Treadway Commission. Based on this assessment, management has concluded as of December 31, 2017, our internal control over financial reporting was effective.
88
The effectiveness of our internal control over financial reporting as of December 31, 2017, has been audited by KPMG LLP, an independent registered public accounting firm, as stated in its report, which is included herein.
Changes in Internal Control Over Financial Reporting
There were no changes in our internal control over financial reporting that occurred during our latest fiscal quarter that has materially affected, or are reasonably likely to materially affect, our internal control over financial reporting.
ITEM 9B. OTHER INFORMATION
None.
89
PART III
ITEM 10. | DIRECTORS, EXECUTIVE OFFICERS, AND CORPORATE GOVERNANCE |
For information with respect to the executive officers of the Registrant, see "Executive Officers of the Registrant" in "Item 1. Business" of this Form 10-K.
We have adopted a Code of Ethics that applies to all of our employees, including our chief executive officer, chief financial officer, and principal accounting officer. Our Code of Ethics is available on our website at www.bc.com by clicking on About Boise Cascade and then Code of Ethics. Our website is not part of, and is not incorporated by reference to, this Form 10-K. If we amend or grant a waiver of one or more of the provisions of our Code of Ethics, we intend to satisfy the requirements under Item 5.05 of Item 8-K regarding the disclosure of amendments to or waivers from provisions of our Code of Ethics that apply to our principal executive officer and financial and accounting officers by posting the required information on our website at the above address.
The other information required by this Item is incorporated herein by reference to our Proxy Statement for the Annual Meeting of Stockholders to be held on May 3, 2018, to be filed with the Commission no later than 120 days after December 31, 2017, in accordance with General Instruction G(3) to the Form 10-K.
ITEM 11. | EXECUTIVE COMPENSATION |
The information required by this Item is incorporated herein by reference to our Proxy Statement for the Annual Meeting of Stockholders to be held on May 3, 2018, to be filed with the Commission no later than 120 days after December 31, 2017, in accordance with General Instruction G(3) to the Form 10-K.
ITEM 12. | SECURITY OWNERSHIP OF CERTAIN BENEFICIAL OWNERS AND MANAGEMENT AND RELATED STOCKHOLDER MATTERS |
The information required by this Item is incorporated herein by reference to our Proxy Statement for the Annual Meeting of Stockholders to be held on May 3, 2018, to be filed with the Commission no later than 120 days after December 31, 2017, in accordance with General Instruction G(3) to the Form 10-K.
ITEM 13. | CERTAIN RELATIONSHIPS AND RELATED TRANSACTIONS, AND DIRECTOR INDEPENDENCE |
The information required by this Item is incorporated herein by reference to our Proxy Statement for the Annual Meeting of Stockholders to be held on May 3, 2018, to be filed with the Commission no later than 120 days after December 31, 2017, in accordance with General Instruction G(3) to the Form 10-K.
ITEM 14. | PRINCIPAL ACCOUNTANT FEES AND SERVICES |
The information required by this Item is incorporated herein by reference to our Proxy Statement for the Annual Meeting of Stockholders to be held on May 3, 2018, to be filed with the Commission no later than 120 days after December 31, 2017, in accordance with General Instruction G(3) to the Form 10-K.
90
PART IV
ITEM 15. EXHIBITS AND FINANCIAL STATEMENT SCHEDULES
(a) The following documents are filed as a part of this Form 10-K:
(1) Consolidated Financial Statements
The Consolidated Financial Statements, the Notes to Consolidated Financial Statements, and the Reports of Independent Registered Public Accounting Firm for Boise Cascade Company are presented in "Item 8. Financial Statements and Supplementary Data" of this Form 10-K.
- Consolidated Statements of Operations for the years ended December 31, 2017, 2016, and 2015.
- | Consolidated Statements of Comprehensive Income for the years ended December 31, 2017, 2016, and 2015. |
- Consolidated Balance Sheets as of December 31, 2017 and 2016.
- Consolidated Statements of Cash Flows for the years ended December 31, 2017, 2016, and 2015.
- | Consolidated Statements of Stockholders' Equity for the years ended December 31, 2017, 2016, and 2015. |
- Notes to Consolidated Financial Statements.
- Reports of Independent Registered Public Accounting Firm.
(2) Financial Statement Schedules
All financial statement schedules have been omitted because they are inapplicable, not required, or shown in the consolidated financial statements and notes in "Item 8. Financial Statements and Supplementary Data" of this Form 10-K.
(3) Exhibits
A list of the exhibits required to be filed as part of this report is set forth in the Index to Exhibits and is incorporated by reference.
(b) See Index to Exhibits
91
BOISE CASCADE COMPANY
INDEX TO EXHIBITS
Exhibit Number | Exhibit Description | Incorporated by Reference | Filed or Furnished Herewith | |||
Form | File Number | Exhibit Number | Filing Date | |||
8-K/A | 001-35805 | 2.1 | 7/22/2013 | |||
10-K | 001-35805 | 2.5 | 2/24/2017 | |||
8-K | 001-35805 | 2.2 | 4/1/2016 | |||
10-Q | 001-35805 | 3.1 | 7/28/2016 | |||
10-Q | 001-35805 | 3.2 | 7/28/2016 | |||
S-1/A Amend. No. 3 | 333-184964 | 4.3 | 1/23/2013 | |||
8-K** | 333-122770** | 4.1** | 10/23/2012** | |||
8-K | 001-35805 | 4.1 | 10/2/2013 | |||
92
8-K | 001-35805 | 4.4 | 8/29/2016 | |||
8-K | 001-35805 | 4.1 | 8/29/2016 | |||
8-K | 001-35805 | 4.2 | 8/29/2016 | |||
8-K | 001-35805 | 4.3 | 8/29/2016 | |||
10-Q | 001-35805 | 10.1 | 7/29/2015 | |||
8-K | 001-35805 | 10.1 | 8/12/2015 | |||
10-Q | 001-35805 | 10.1 | 5/3/2016 | |||
10-Q | 001-35805 | 10.2 | 7/28/2016 | |||
93
10-Q | 001-35805 | 10.3 | 7/28/2016 | |||
8-K | 001-35805 | 10.2 | 12/8/2016 | |||
8-K | 001-35805 | 10.1 | 8/11/2017 | |||
10-Q | 001-35805 | 10.1 | 10/26/2016 | |||
10-Q | 001-35805 | 10.2 | 5/3/2016 | |||
8-K | 001-35805 | 10.1 | 12/8/2016 | |||
8-K** | 333-122770** | 99.1** | 11/2/2007** | |||
S-4 | 333-191191 | 10.17 | 9/16/2013 | |||
94
S-4 | 333-191191 | 10.18 | 9/16/2013 | |||
S-4 | 333-191191 | 10.19 | 9/16/2013 | |||
8-K** | 333-122770** | 99.4** | 12/18/2007** | |||
S-4 | 333-191191 | 10.21 | 9/16/2013 | |||
10-Q | 001-35805 | 10.2 | 11/14/2013 | |||
X | ||||||
10-Q | 001-35805 | 10.1 | 11/14/2013 | |||
8-K | 001-35805 | 10.4 | 2/13/2013 | |||
8-K | 001-35805 | 10.5 | 2/13/2013 | |||
10-Q | 001-35805 | 10.3 | 5/3/2016 | |||
10-Q | 001-35805 | 10.4 | 5/3/2016 | |||
10-Q | 001-35805 | 10.5 | 5/3/2016 | |||
10-Q | 001-35805 | 10.1 | 7/28/2016 | |||
8-K | 001-35805 | 10.1 | 8/30/2016 | |||
10-Q | 001-35805 | 10.1 | 8/3/2017 | |||
95
10-Q | 001-35805 | 10.2 | 8/3/2017 | |||
X | ||||||
X | ||||||
X | ||||||
X | ||||||
X | ||||||
X | ||||||
X | ||||||
101.INS | XBRL Instance Document | X | ||||
101.SCH | XBRL Taxonomy Extension Schema Document | X | ||||
101.CAL | XBRL Taxonomy Extension Calculation Linkbase Document | X | ||||
101.DEF | XBRL Taxonomy Definition Linkbase Document | X | ||||
101.LAB | XBRL Taxonomy Extension Label Linkbase Document | X | ||||
101.PRE | XBRL Taxonomy Extension Presentation Linkbase Document | X | ||||
* | Exhibits and schedules have been omitted pursuant to Item 601(b)(2) of Regulation S-K and will be furnished to the Securities and Exchange Commission upon request. |
** | Refers to filings of Boise Cascade Holdings, L.L.C. |
+ | Indicates exhibits that constitute management contracts or compensatory plans or arrangements. |
96
SIGNATURES
Pursuant to the requirements of Section 13 or 15(d) of the Securities Exchange Act of 1934, the registrant has duly caused this report to be signed on its behalf by the undersigned, thereunto duly authorized.
BOISE CASCADE COMPANY | ||
/s/ Thomas K. Corrick | ||
Thomas K. Corrick | ||
Chief Executive Officer | ||
Date: February 23, 2018
Pursuant to the requirements of the Securities Exchange Act of 1934, this report has been signed below on February 23, 2018, by the following persons on behalf of the registrant and in the capacities indicated.
Signature | Capacity | |||
Principal Executive Officer: | ||||
/s/ Thomas K. Corrick | Chief Executive Officer | |||
Thomas K. Corrick | ||||
Principal Financial Officer: | ||||
/s/ Wayne M. Rancourt | Executive Vice President, Chief Financial Officer, and Treasurer | |||
Wayne M. Rancourt | ||||
Principal Accounting Officer: | ||||
/s/ Kelly E. Hibbs | Vice President and Controller | |||
Kelly E. Hibbs | ||||
Directors: | ||||
/s/ Thomas E. Carlile | /s/ Mack L. Hogans | |||
Thomas E. Carlile, Chairman | Mack L. Hogans | |||
/s/ Steven C. Cooper | /s/ Kristopher J. Matula | |||
Steven C. Cooper | Kristopher J. Matula | |||
/s/ Richard H. Fleming | /s/ Duane C. McDougall | |||
Richard H. Fleming | Duane C. McDougall | |||
/s/ Karen E. Gowland | /s/ Christopher J. McGowan | |||
Karen E. Gowland | Christopher J. McGowan | |||
/s/ David H. Hannah | ||||
David H. Hannah | ||||
97