Attached files
| file | filename |
|---|---|
| 8-K - 8-K - BMC STOCK HOLDINGS, INC. | bmcstock8-k_dec15investorp.htm |
| EX-99.1 - EXHIBIT 99.1 - BMC STOCK HOLDINGS, INC. | bmcstock8-k_dec15ex991.htm |
BMC STOCK Holdings, Inc. Investor Presentation December 2015
2 Forward-Looking Statements This document contains “forward-looking statements” within the meaning of the Private Securities Litigation Reform Act of 1995. Forward-looking statements in this presentation may include, without limitation, statements regarding sales growth, price changes, earnings performance, strategic direction and the demand for our products. Forward-looking statements are typically identified by words or phrases such as “may,” “might,” “predict,” “future,” “seek to,” “assume,” “goal,” “objective,” “continue,” “will,” “could,” “should,” “would,” “anticipate,” “estimate,” “expect,” “project,” “intend,” “plan,” “believe,” “target,” “prospects,” “guidance,” “possible,” “predict,” “propose,” “potential” and “forecast,” or the negative of such terms and other words, terms and phrases of similar meaning. Forward-looking statements involve estimates, expectations, projections, goals, forecasts, assumptions, risks and uncertainties, many of which are outside BMC Stock Holdings, Inc’s. (the “Company”) control. The Company cautions readers that any forward-looking statement is not a guarantee of future performance and that actual results could differ materially from those contained in the forward-looking statement, therefore investors and shareholders should not place undue reliance on such statement. Such forward-looking statements include, but are not limited to, statements about the benefits of the recently completed merger with Building Materials Holding Corporation (“BMC”), including future financial and operating results, plans, objectives, expectations and intentions, and other statements that are not historical facts. There are a number of risks and uncertainties that could cause actual results to differ materially from the forward-looking statements included in this communication. Important factors that could cause actual results to differ materially from those indicated by such forward-looking statements include risks and uncertainties relating to: the risk that the BMC business will not be integrated successfully or that such integration will take longer, be more difficult, time-consuming or costly to accomplish than expected; the risk that the cost savings and any other synergies from the transaction may not be fully realized or may take longer to realize than expected; disruption from the transaction may make it more difficult to maintain relationships with customers, employees or suppliers; the diversion of management time on merger-related issues; general worldwide economic conditions and related uncertainties; changes in the markets for the Company’s business segments; unanticipated downturns in business relationships with customers; competitive pressures on the combined company’s sales and pricing; increases in the cost of material, energy and other production costs, or unexpected costs that cannot be recouped in product pricing; the introduction of competing technologies; unexpected technical or marketing difficulties; unexpected claims, charges, litigation or dispute resolutions; the effect of changes in governmental regulations; and other factors discussed or referred to in the “Risk Factors” section of the Company’s most recent Annual Report on Form 10-K filed with the Securities and Exchange Commission (the “SEC”) on March 2, 2015, the Company’s Quarterly Report on Form 10-Q filed with the SEC on November 5, 2015, and our subsequent filings with the SEC. All such factors are difficult to predict and are beyond the Company’s control. All forward-looking statements attributable to the Company or persons acting on the Company’s behalf are expressly qualified in their entirety by the foregoing cautionary statements. All such statements speak only as of the date made, and the Company undertakes no obligation to update or revise publicly any forward-looking statements, whether as a result of new information, future events or otherwise. Non-GAAP Financial Measures Included in this document are certain non-GAAP financial measures designed to complement the financial information presented in accordance with generally accepted accounting principles in the United States of America. Our management believes such measures are useful to investors. Because the Company’s calculations of these measures may differ from similar measures used by other companies, you should be careful when comparing the Company’s non-GAAP financial measures to those of other companies. A reconciliation of non-GAAP financial measures to GAAP financial measures is included in an appendix to this document. Disclaimer
3 Market leader with national scale and local expertise in a highly fragmented industry Strategic footprint in highly attractive long-term growth markets poised for continued recovery Opportunities to accelerate profitable growth through extensive value-added product and service capabilities Low cost, high service integrated supply chain and diverse customer base Strong balance sheet that supports efficient new market entry and growth opportunities Significant cost synergies anticipated from BMC STOCK combination – $30 to $40 million annually within two years BMC STOCK Investment Highlights
Company Overview 1
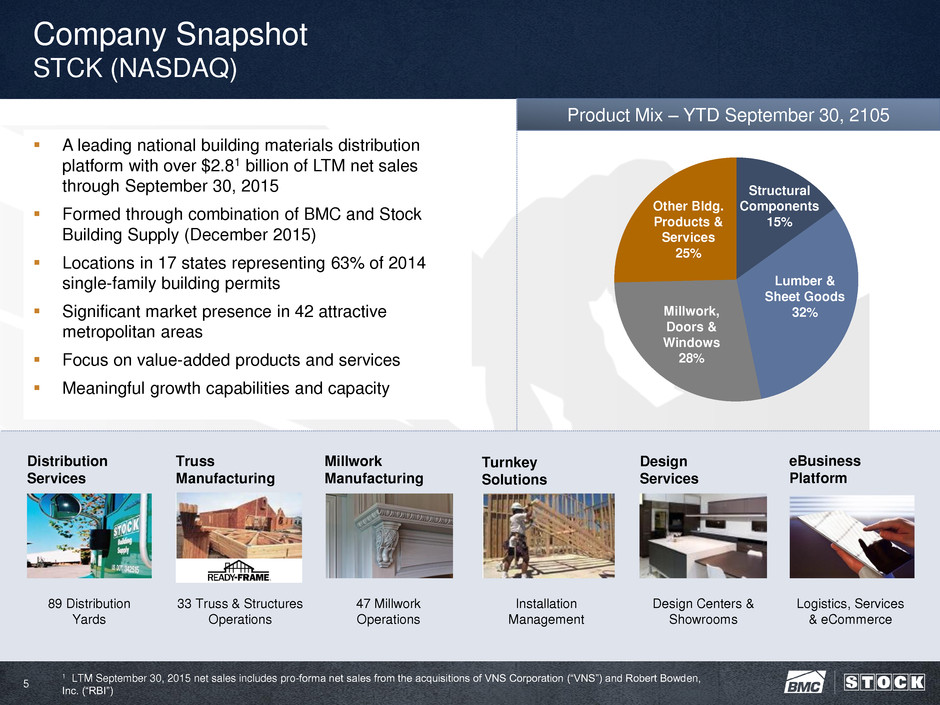
5 Product Mix – YTD September 30, 2105 Company Snapshot STCK (NASDAQ) A leading national building materials distribution platform with over $2.81 billion of LTM net sales through September 30, 2015 Formed through combination of BMC and Stock Building Supply (December 2015) Locations in 17 states representing 63% of 2014 single-family building permits Significant market presence in 42 attractive metropolitan areas Focus on value-added products and services Meaningful growth capabilities and capacity Design Services Truss Manufacturing Millwork Manufacturing Turnkey Solutions 89 Distribution Yards 33 Truss & Structures Operations 47 Millwork Operations Installation Management Design Centers & Showrooms eBusiness Platform Logistics, Services & eCommerce Distribution Services Other Bldg. Products & Services 25% Lumber & Sheet Goods 32% Millwork, Doors & Windows 28% Structural Components 15% 1 LTM September 30, 2015 net sales includes pro-forma net sales from the acquisitions of VNS Corporation (“VNS”) and Robert Bowden, Inc. (“RBI”)
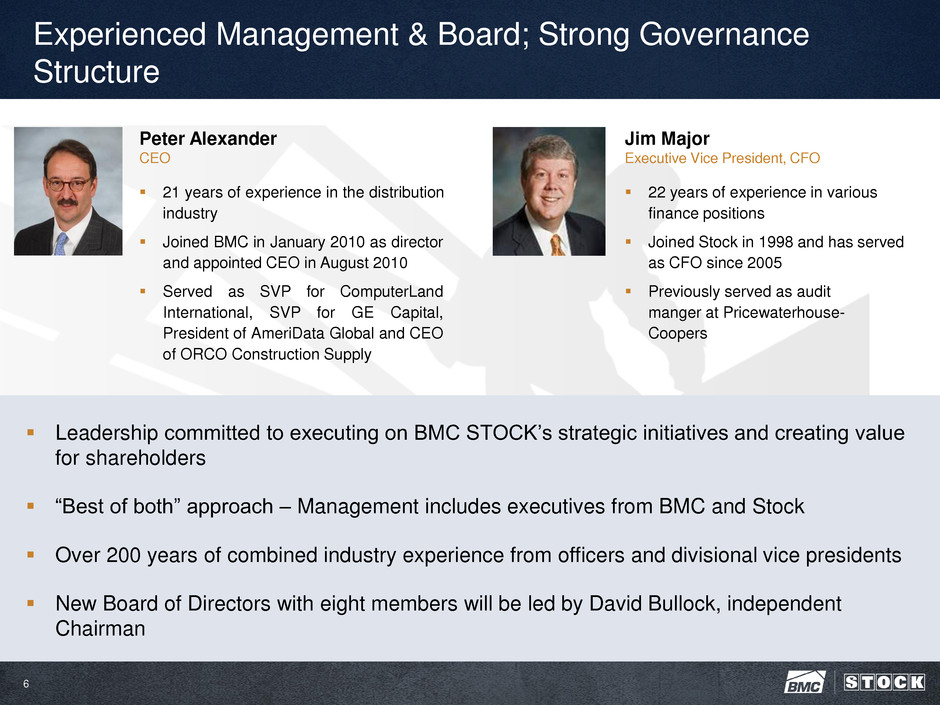
6 Experienced Management & Board; Strong Governance Structure Jim Major Executive Vice President, CFO 22 years of experience in various finance positions Joined Stock in 1998 and has served as CFO since 2005 Previously served as audit manger at Pricewaterhouse- Coopers Peter Alexander CEO 21 years of experience in the distribution industry Joined BMC in January 2010 as director and appointed CEO in August 2010 Served as SVP for ComputerLand International, SVP for GE Capital, President of AmeriData Global and CEO of ORCO Construction Supply Leadership committed to executing on BMC STOCK’s strategic initiatives and creating value for shareholders “Best of both” approach – Management includes executives from BMC and Stock Over 200 years of combined industry experience from officers and divisional vice presidents New Board of Directors with eight members will be led by David Bullock, independent Chairman
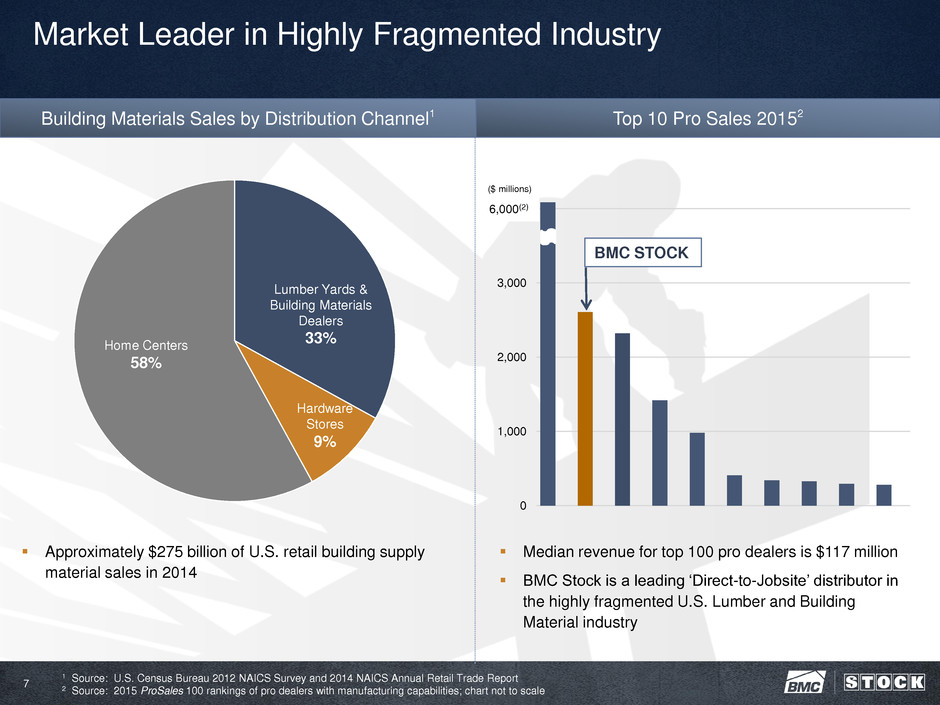
Lumber Yards & Building Materials Dealers 33% Home Centers 58% Hardware Stores 9% Market Leader in Highly Fragmented Industry 7 0 1,000 2,000 3,000 4,000 ($ millions) BMC STOCK Top 10 Pro Sales 20152 Building Materials Sales by Distribution Channel1 1 Source: U.S. Census Bureau 2012 NAICS Survey and 2014 NAICS Annual Retail Trade Report 2 Source: 2015 ProSales 100 rankings of pro dealers with manufacturing capabilities; chart not to scale Approximately $275 billion of U.S. retail building supply material sales in 2014 Median revenue for top 100 pro dealers is $117 million BMC Stock is a leading ‘Direct-to-Jobsite’ distributor in the highly fragmented U.S. Lumber and Building Material industry 6,0 (2)
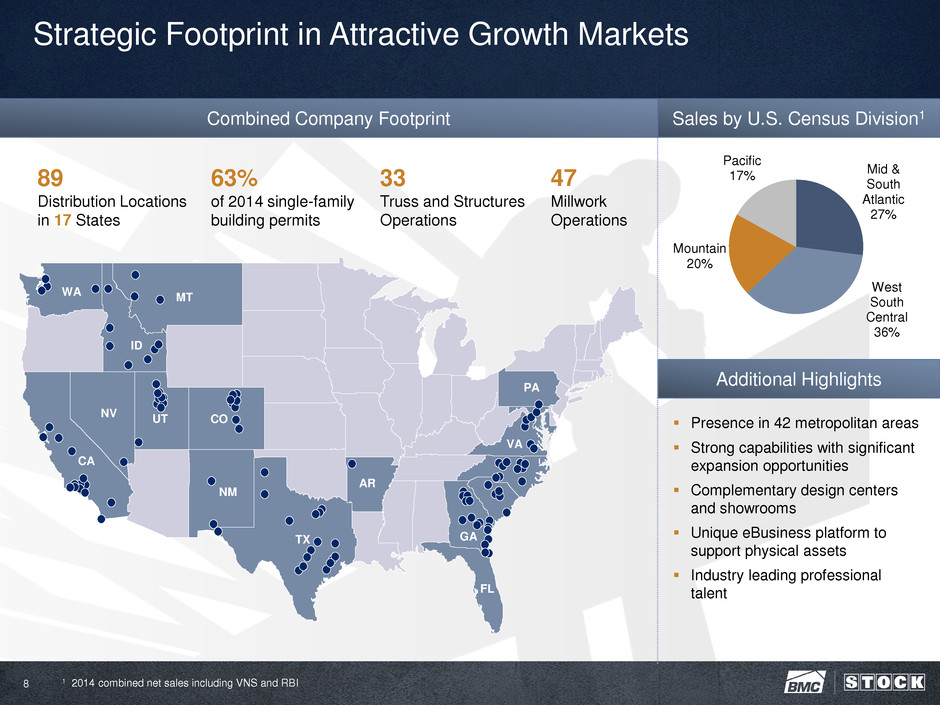
8 Strategic Footprint in Attractive Growth Markets Mid & South Atlantic 27% West South Central 36% Mountain 20% Pacific 17% Presence in 42 metropolitan areas Strong capabilities with significant expansion opportunities Complementary design centers and showrooms Unique eBusiness platform to support physical assets Industry leading professional talent Additional Highlights Sales by U.S. Census Division1 Combined Company Footprint 1 2014 combined net sales including VNS and RBI FL NM TX MT CO UT ID NV WA CA PA VA AR GA 89 Distribution Locations in 17 States 33 Truss and Structures Operations 47 Millwork Operations 63% of 2014 single-family building permits
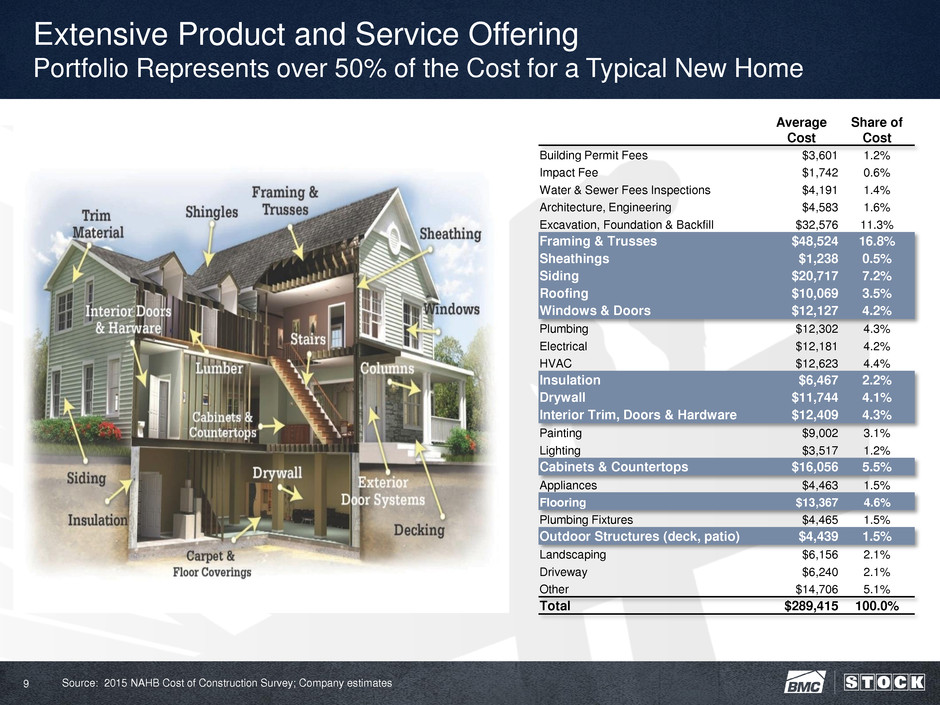
9 Extensive Product and Service Offering Portfolio Represents over 50% of the Cost for a Typical New Home Average Cost Share of Cost Building Permit Fees $3,601 1.2% Impact Fee $1,742 0.6% Water & Sewer Fees Inspections $4,191 1.4% Architecture, Engineering $4,583 1.6% Excavation, Foundation & Backfill $32,576 11.3% Framing & Trusses $48,524 16.8% Sheathings $1,238 0.5% Siding $20,717 7.2% Roofing $10,069 3.5% Windows & Doors $12,127 4.2% Plumbing $12,302 4.3% Electrical $12,181 4.2% HVAC $12,623 4.4% Insulation $6,467 2.2% Drywall $11,744 4.1% Interior Trim, Doors & Hardware $12,409 4.3% Painting $9,002 3.1% Lighting $3,517 1.2% Cabinets & Countertops $16,056 5.5% Appliances $4,463 1.5% Flooring $13,367 4.6% Plumbing Fixtures $4,465 1.5% Outdoor Structures (deck, patio) $4,439 1.5% Landscaping $6,156 2.1% Driveway $6,240 2.1% Other $14,706 5.1% Total $289,415 100.0% Source: 2015 NAHB Cost of Construction Survey; Company estimates
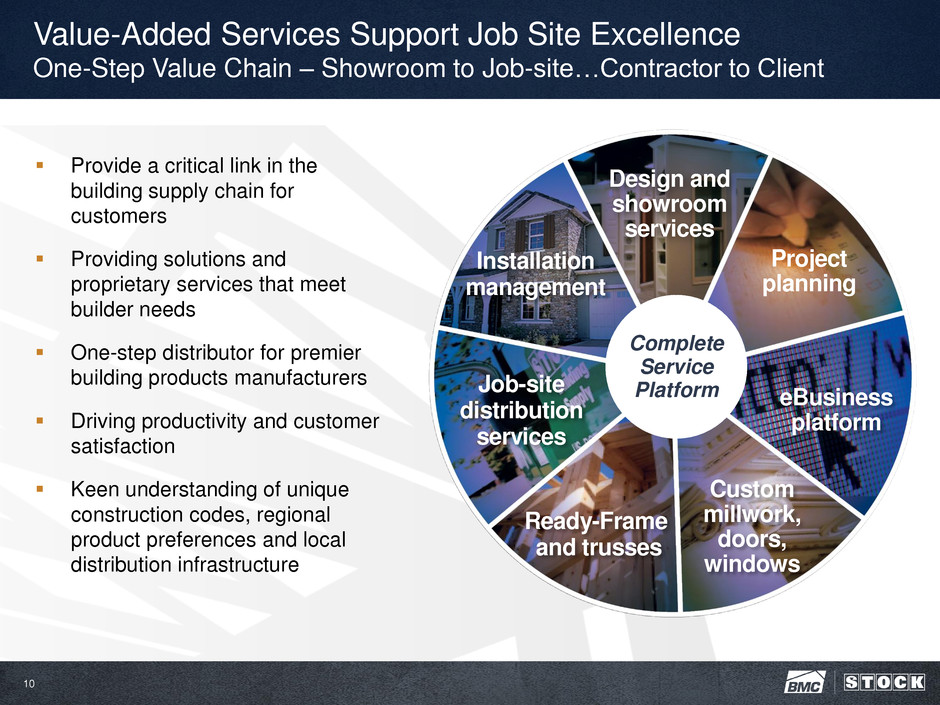
10 Value-Added Services Support Job Site Excellence One-Step Value Chain – Showroom to Job-site…Contractor to Client Provide a critical link in the building supply chain for customers Providing solutions and proprietary services that meet builder needs One-step distributor for premier building products manufacturers Driving productivity and customer satisfaction Keen understanding of unique construction codes, regional product preferences and local distribution infrastructure Design and showroom services Project planning eBusiness platform Custom millwork, doors, windows Ready-Frame and trusses Job-site distribution services Installation management Complete Service Platform
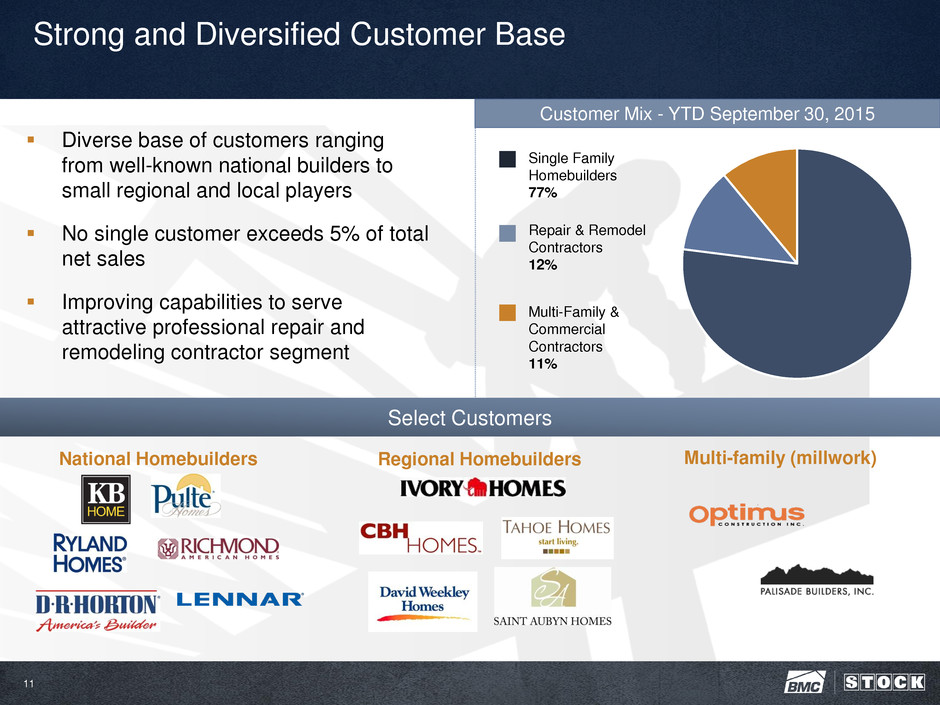
11 Diverse base of customers ranging from well-known national builders to small regional and local players No single customer exceeds 5% of total net sales Improving capabilities to serve attractive professional repair and remodeling contractor segment Strong and Diversified Customer Base Select Customers Multi-Family & Commercial Contractors 11% Repair & Remodel Contractors 12% Single Family Homebuilders 77% National Homebuilders Regional Homebuilders Multi-family (millwork) Customer Mix - YTD September 30, 2015
Focused Growth Strategy 2
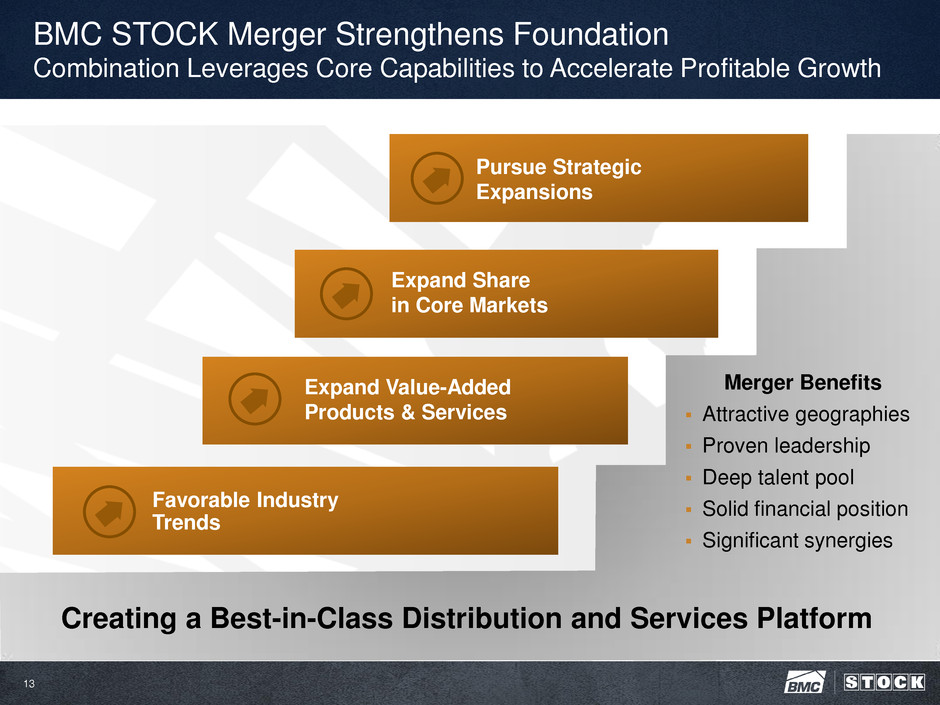
BMC STOCK Merger Strengthens Foundation Combination Leverages Core Capabilities to Accelerate Profitable Growth 13 Favorable Industry Trends Expand Value-Added Products & Services Expand Share in Core Markets Pursue Strategic Expansions Merger Benefits Attractive geographies Proven leadership Deep talent pool Solid financial position Significant synergies Creating a Best-in-Class Distribution and Services Platform
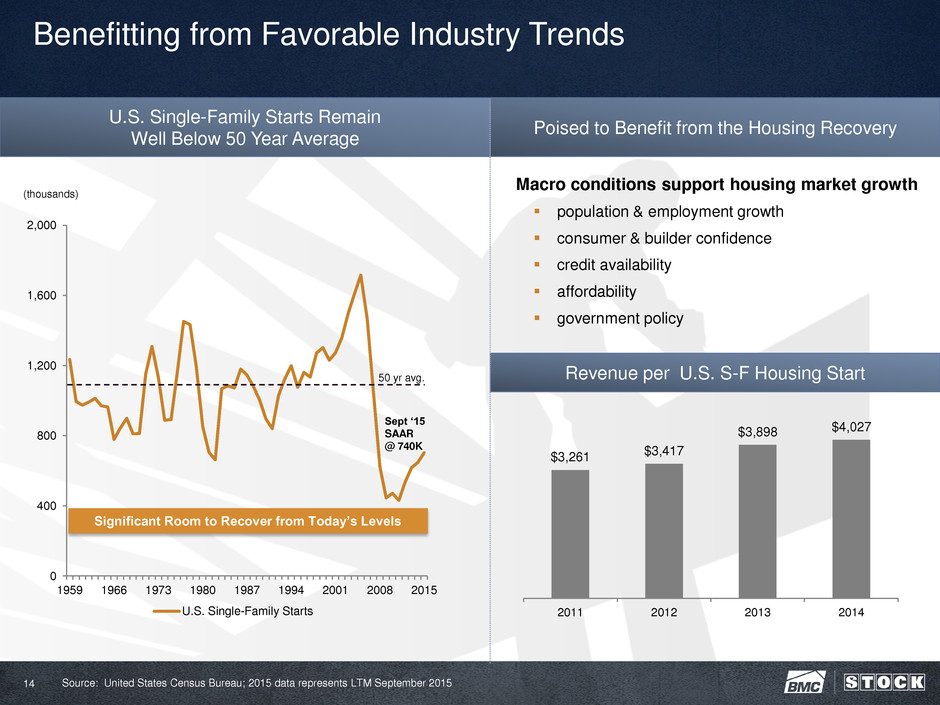
Poised to Benefit from the Housing Recovery Revenue per U.S. S-F Housing Start Macro conditions support housing market growth population & employment growth consumer & builder confidence credit availability affordability government policy 0 400 800 1,200 1,600 2,000 1959 1966 1973 1980 1987 1994 2001 2008 2015 U.S. Single-Family Starts Significant Room to Recover from Today’s Levels (thousands) Sept ‘15 SAAR @ 740K Benefitting from Favorable Industry Trends 14 U.S. Single-Family Starts Remain Well Below 50 Year Average 50 yr avg. Source: United States Census Bureau; 2015 data represents LTM September 2015 $3,261 $3,417 $3,898 $4,027 2011 2012 2013 2014
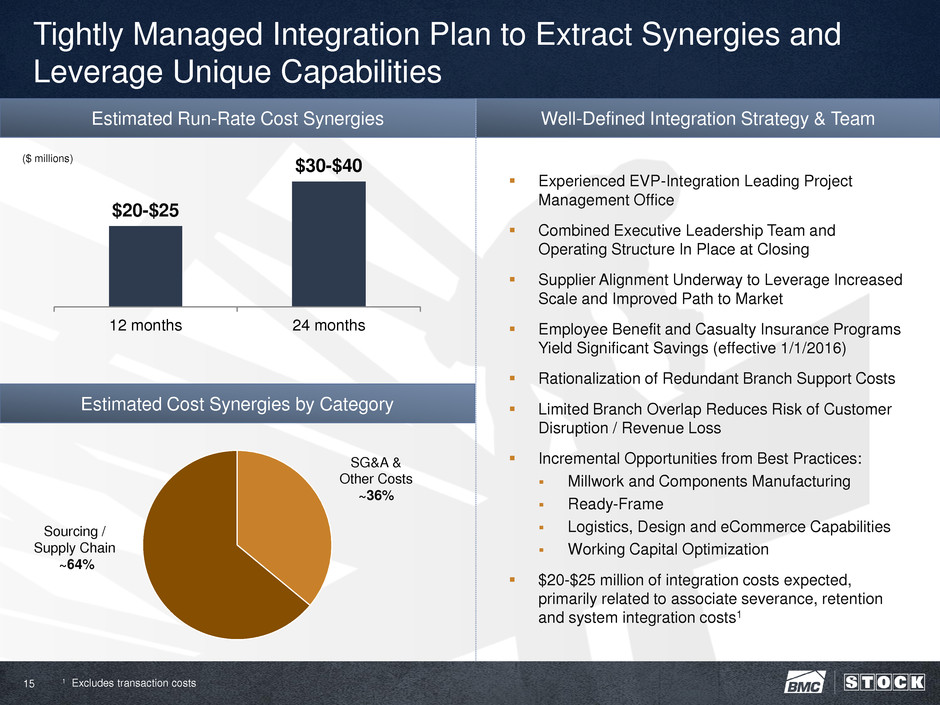
$20-$25 $30-$40 12 months 24 months Estimated Run-Rate Cost Synergies Tightly Managed Integration Plan to Extract Synergies and Leverage Unique Capabilities 15 ($ millions) Well-Defined Integration Strategy & Team Estimated Cost Synergies by Category Sourcing / Supply Chain ~64% SG&A & Other Costs ~36% 1 Excludes transaction costs Experienced EVP-Integration Leading Project Management Office Combined Executive Leadership Team and Operating Structure In Place at Closing Supplier Alignment Underway to Leverage Increased Scale and Improved Path to Market Employee Benefit and Casualty Insurance Programs Yield Significant Savings (effective 1/1/2016) Rationalization of Redundant Branch Support Costs Limited Branch Overlap Reduces Risk of Customer Disruption / Revenue Loss Incremental Opportunities from Best Practices: Millwork and Components Manufacturing Ready-Frame Logistics, Design and eCommerce Capabilities Working Capital Optimization $20-$25 million of integration costs expected, primarily related to associate severance, retention and system integration costs1
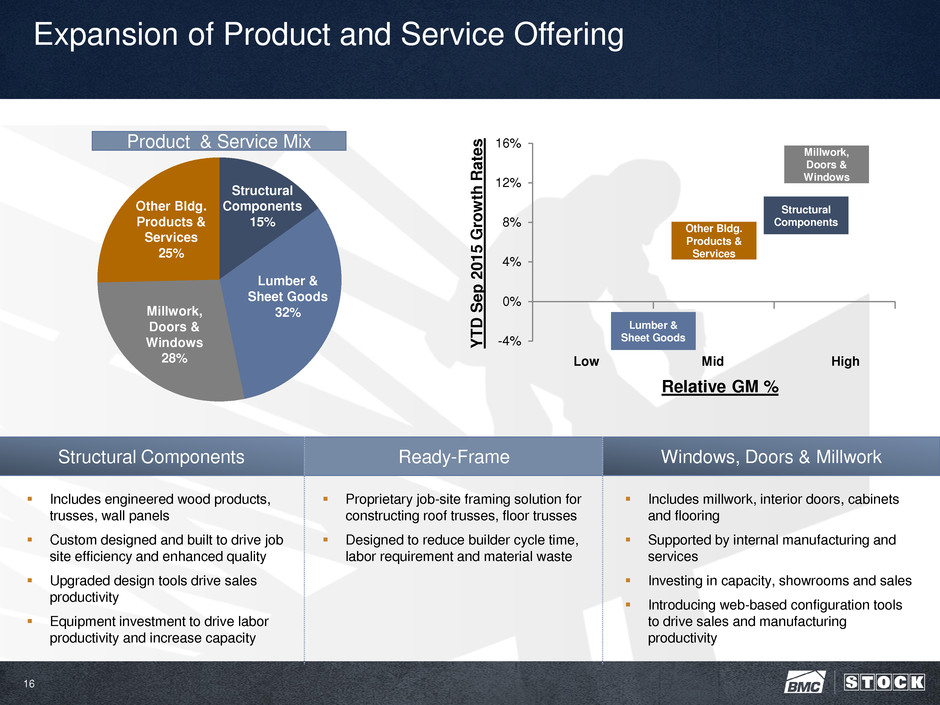
16 Other Bldg. Products & Services 25% Lumber & Sheet Goods 32% Millwork, Doors & Windows 28% Structural Components 15% Expansion of Product and Service Offering Relative GM % Y TD S e p 2 0 1 5 G ro w th Rat e s Low Mid High Includes engineered wood products, trusses, wall panels Custom designed and built to drive job site efficiency and enhanced quality Upgraded design tools drive sales productivity Equipment investment to drive labor productivity and increase capacity Proprietary job-site framing solution for constructing roof trusses, floor trusses Designed to reduce builder cycle time, labor requirement and material waste Includes millwork, interior doors, cabinets and flooring Supported by internal manufacturing and services Investing in capacity, showrooms and sales Introducing web-based configuration tools to drive sales and manufacturing productivity Ready-Frame Structural Components Windows, Doors & Millwork -4% 0% 4% 8% 12% 16% Structural Components Millwork, Doors & Windows Lumber & Sheet Goods Product & Service Mix Other Bldg. Products & Services
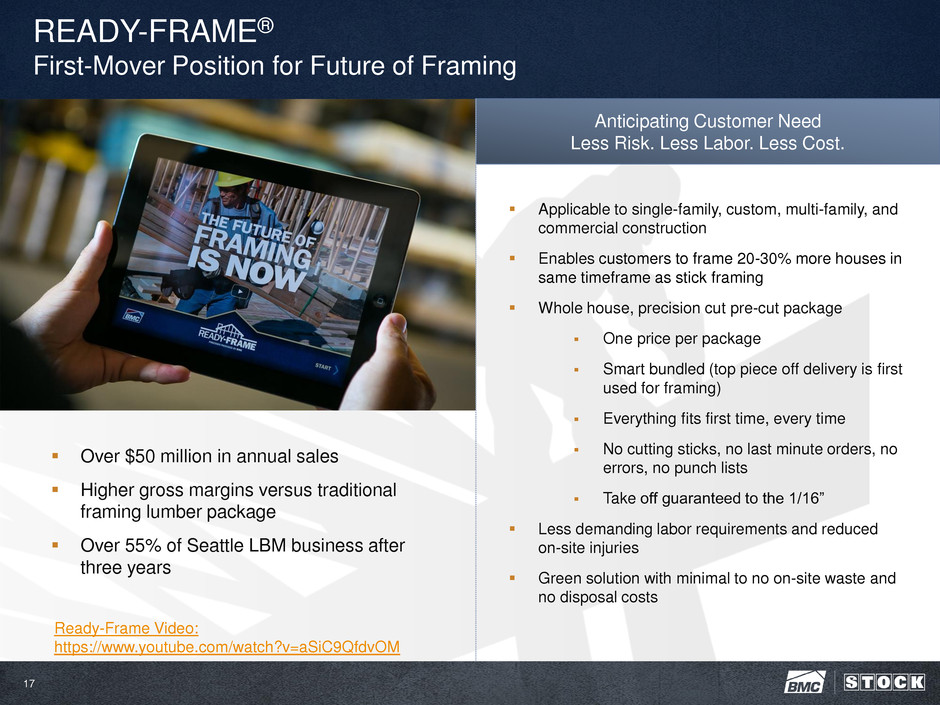
READY-FRAME® First-Mover Position for Future of Framing 17 Applicable to single-family, custom, multi-family, and commercial construction Enables customers to frame 20-30% more houses in same timeframe as stick framing Whole house, precision cut pre-cut package One price per package Smart bundled (top piece off delivery is first used for framing) Everything fits first time, every time No cutting sticks, no last minute orders, no errors, no punch lists Take off guaranteed to the 1/16” Less demanding labor requirements and reduced on-site injuries Green solution with minimal to no on-site waste and no disposal costs Over $50 million in annual sales Higher gross margins versus traditional framing lumber package Over 55% of Seattle LBM business after three years Anticipating Customer Need Less Risk. Less Labor. Less Cost. Ready-Frame Video: https://www.youtube.com/watch?v=aSiC9QfdvOM
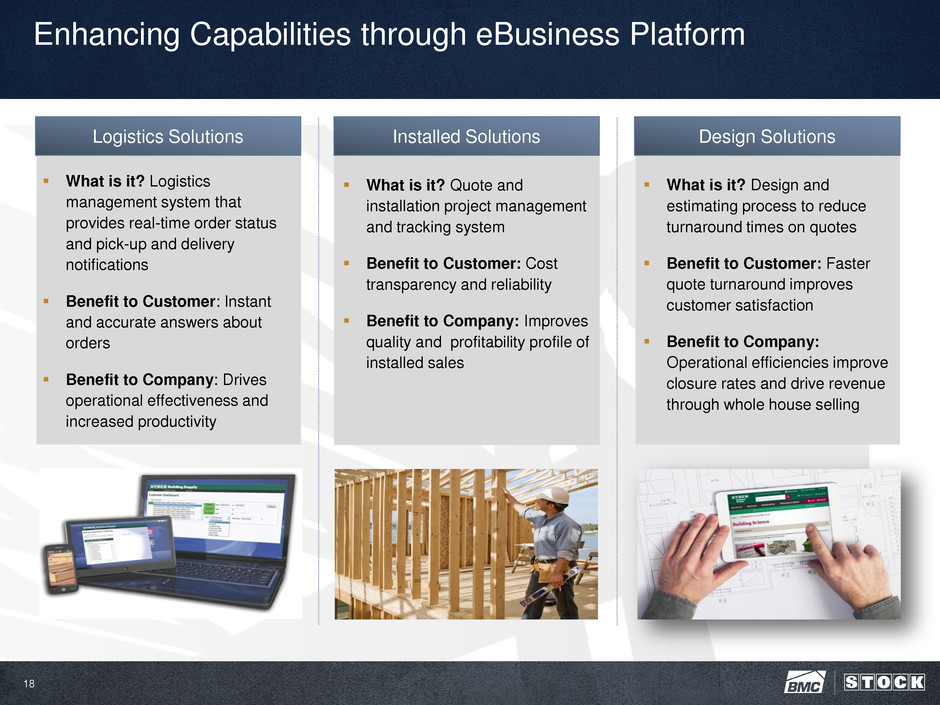
18 Enhancing Capabilities through eBusiness Platform Logistics Solutions What is it? Logistics management system that provides real-time order status and pick-up and delivery notifications Benefit to Customer: Instant and accurate answers about orders Benefit to Company: Drives operational effectiveness and increased productivity Installed Solutions What is it? Quote and installation project management and tracking system Benefit to Customer: Cost transparency and reliability Benefit to Company: Improves quality and profitability profile of installed sales Design Solutions What is it? Design and estimating process to reduce turnaround times on quotes Benefit to Customer: Faster quote turnaround improves customer satisfaction Benefit to Company: Operational efficiencies improve closure rates and drive revenue through whole house selling
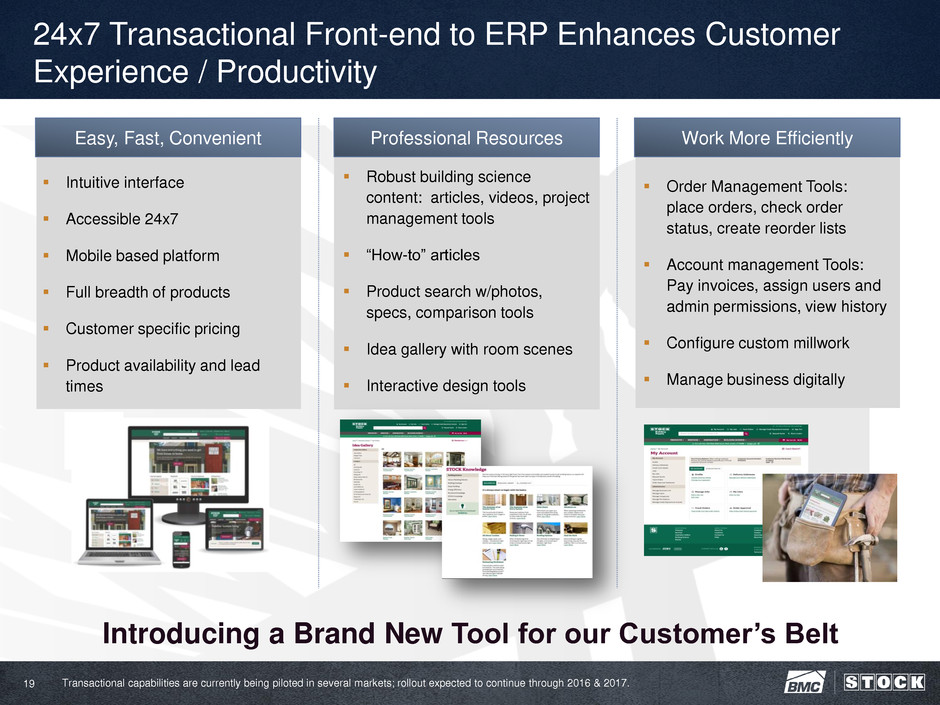
19 24x7 Transactional Front-end to ERP Enhances Customer Experience / Productivity Easy, Fast, Convenient Intuitive interface Accessible 24x7 Mobile based platform Full breadth of products Customer specific pricing Product availability and lead times Professional Resources Robust building science content: articles, videos, project management tools “How-to” articles Product search w/photos, specs, comparison tools Idea gallery with room scenes Interactive design tools Work More Efficiently Order Management Tools: place orders, check order status, create reorder lists Account management Tools: Pay invoices, assign users and admin permissions, view history Configure custom millwork Manage business digitally Introducing a Brand New Tool for our Customer’s Belt Transactional capabilities are currently being piloted in several markets; rollout expected to continue through 2016 & 2017.
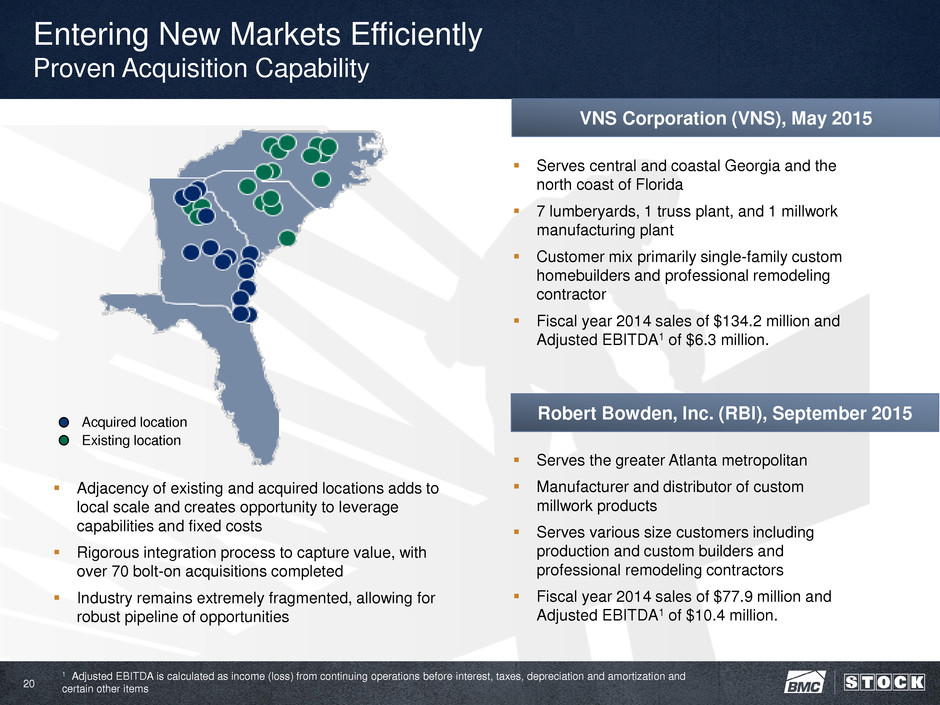
20 Entering New Markets Efficiently Proven Acquisition Capability Serves central and coastal Georgia and the north coast of Florida 7 lumberyards, 1 truss plant, and 1 millwork manufacturing plant Customer mix primarily single-family custom homebuilders and professional remodeling contractor Fiscal year 2014 sales of $134.2 million and Adjusted EBITDA1 of $6.3 million. Serves the greater Atlanta metropolitan Manufacturer and distributor of custom millwork products Serves various size customers including production and custom builders and professional remodeling contractors Fiscal year 2014 sales of $77.9 million and Adjusted EBITDA1 of $10.4 million. Adjacency of existing and acquired locations adds to local scale and creates opportunity to leverage capabilities and fixed costs Rigorous integration process to capture value, with over 70 bolt-on acquisitions completed Industry remains extremely fragmented, allowing for robust pipeline of opportunities Acquired location Existing location 1 Adjusted EBITDA is calculated as income (loss) from continuing operations before interest, taxes, depreciation and amortization and certain other items VNS Corporation (VNS), May 2015 Robert Bowden, Inc. (RBI), September 2015
Financial Overview 3
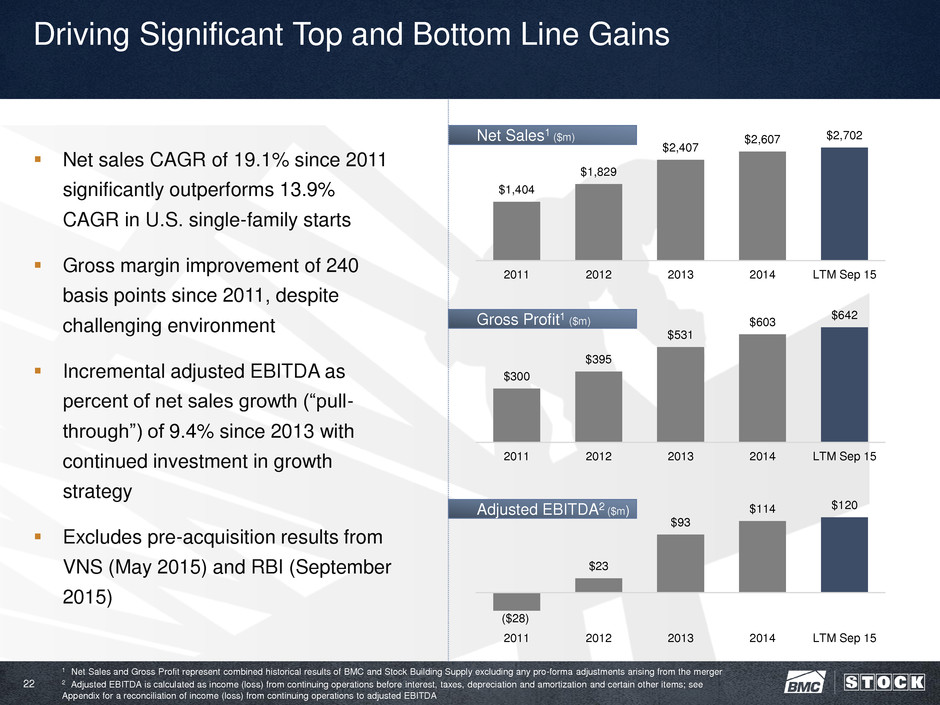
22 Driving Significant Top and Bottom Line Gains Net sales CAGR of 19.1% since 2011 significantly outperforms 13.9% CAGR in U.S. single-family starts Gross margin improvement of 240 basis points since 2011, despite challenging environment Incremental adjusted EBITDA as percent of net sales growth (“pull- through”) of 9.4% since 2013 with continued investment in growth strategy Excludes pre-acquisition results from VNS (May 2015) and RBI (September 2015) $300 $395 $531 $603 $642 2011 2012 2013 2014 LTM Sep 15 $1,404 $1,829 $2,407 $2,607 $2,702 2011 2012 2013 2014 LTM Sep 15 ($28) $23 $93 $114 $120 2011 2012 2013 2014 LTM Sep 15 Net Sales1 ($m) Gross Profit1 ($m) Adjusted EBITDA2 ($m) 1 Net Sales and Gross Profit represent combined historical results of BMC and Stock Building Supply excluding any pro-forma adjustments arising from the merger 2 Adjusted EBITDA is calculated as income (loss) from continuing operations before interest, taxes, depreciation and amortization and certain other items; see Appendix for a reconciliation of income (loss) from continuing operations to adjusted EBITDA
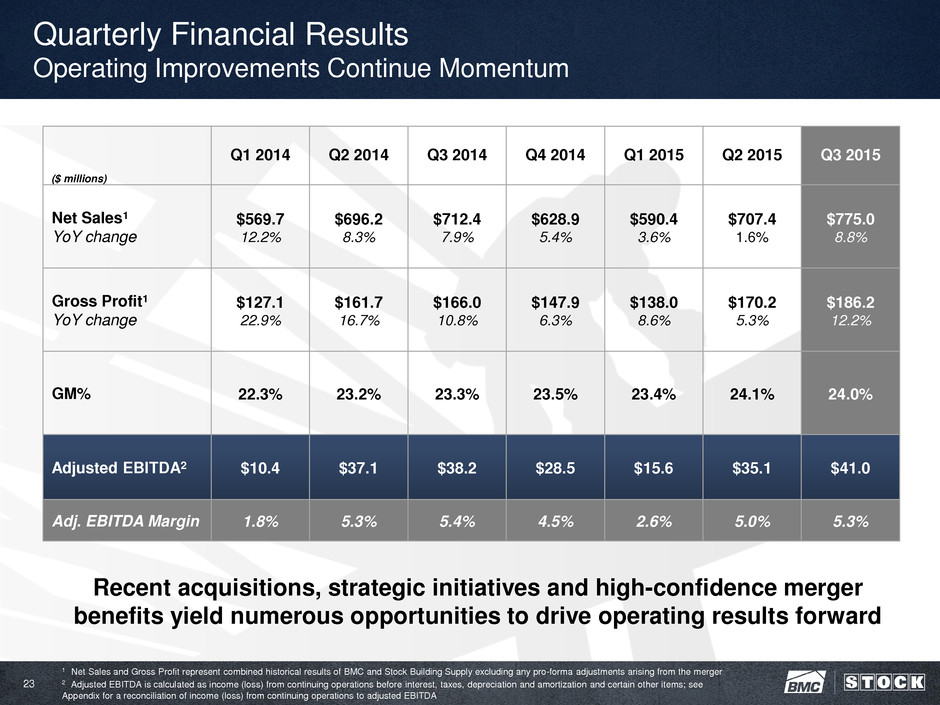
23 Quarterly Financial Results Operating Improvements Continue Momentum Q1 2014 Q2 2014 Q3 2014 Q4 2014 Q1 2015 Q2 2015 Q3 2015 Net Sales1 YoY change $569.7 12.2% $696.2 8.3% $712.4 7.9% $628.9 5.4% $590.4 3.6% $707.4 1.6% $775.0 8.8% Gross Profit1 YoY change $127.1 22.9% $161.7 16.7% $166.0 10.8% $147.9 6.3% $138.0 8.6% $170.2 5.3% $186.2 12.2% GM% 22.3% 23.2% 23.3% 23.5% 23.4% 24.1% 24.0% Adjusted EBITDA2 $10.4 $37.1 $38.2 $28.5 $15.6 $35.1 $41.0 Adj. EBITDA Margin 1.8% 5.3% 5.4% 4.5% 2.6% 5.0% 5.3% ($ millions) Recent acquisitions, strategic initiatives and high-confidence merger benefits yield numerous opportunities to drive operating results forward 1 Net Sales and Gross Profit represent combined historical results of BMC and Stock Building Supply excluding any pro-forma adjustments arising from the merger 2 Adjusted EBITDA is calculated as income (loss) from continuing operations before interest, taxes, depreciation and amortization and certain other items; see Appendix for a reconciliation of income (loss) from continuing operations to adjusted EBITDA
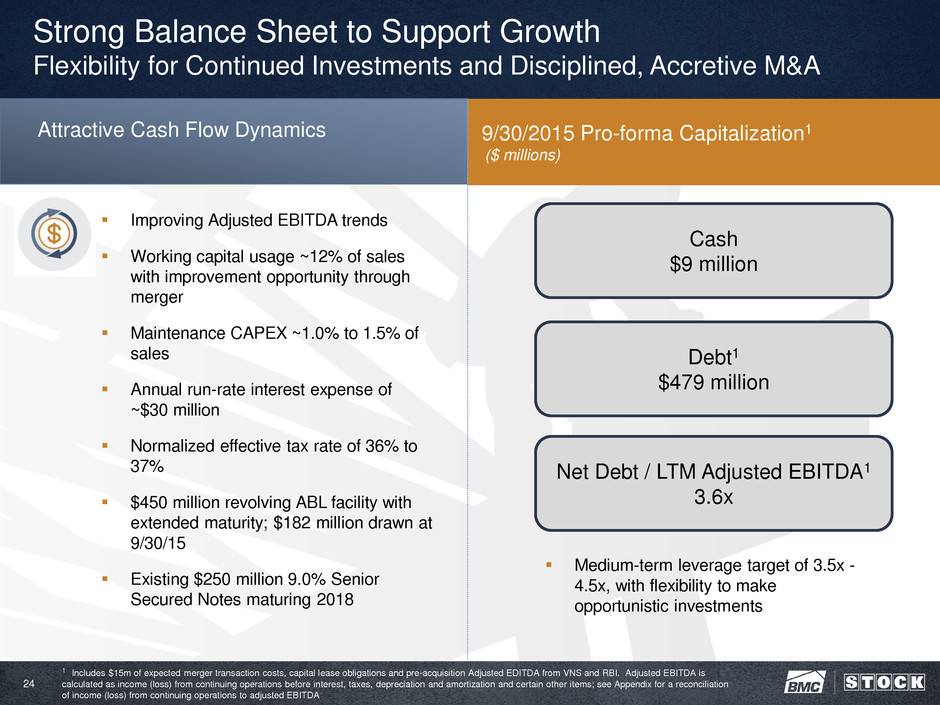
24 Strong Balance Sheet to Support Growth Flexibility for Continued Investments and Disciplined, Accretive M&A 9/30/2015 Pro-forma Capitalization1 ($ millions) 1 Includes $15m of expected merger transaction costs, capital lease obligations and pre-acquisition Adjusted EDITDA from VNS and RBI. Adjusted EBITDA is calculated as income (loss) from continuing operations before interest, taxes, depreciation and amortization and certain other items; see Appendix for a reconciliation of income (loss) from continuing operations to adjusted EBITDA Improving Adjusted EBITDA trends Working capital usage ~12% of sales with improvement opportunity through merger Maintenance CAPEX ~1.0% to 1.5% of sales Annual run-rate interest expense of ~$30 million Normalized effective tax rate of 36% to 37% $450 million revolving ABL facility with extended maturity; $182 million drawn at 9/30/15 Existing $250 million 9.0% Senior Secured Notes maturing 2018 Attractive Cash Flow Dynamics Cash $9 million Debt1 $479 million Net Debt / LTM Adjusted EBITDA1 3.6x Medium-term leverage target of 3.5x - 4.5x, with flexibility to make opportunistic investments
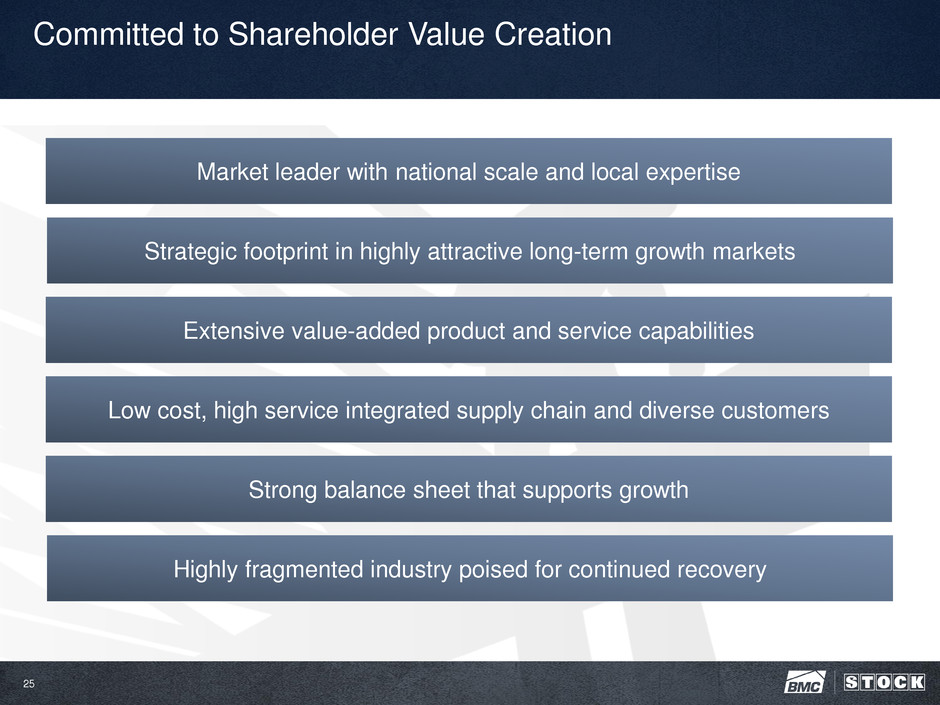
25 Committed to Shareholder Value Creation Market leader with national scale and local expertise Strategic footprint in highly attractive long-term growth markets Extensive value-added product and service capabilities Low cost, high service integrated supply chain and diverse customers Strong balance sheet that supports growth Highly fragmented industry poised for continued recovery

APPENDIX
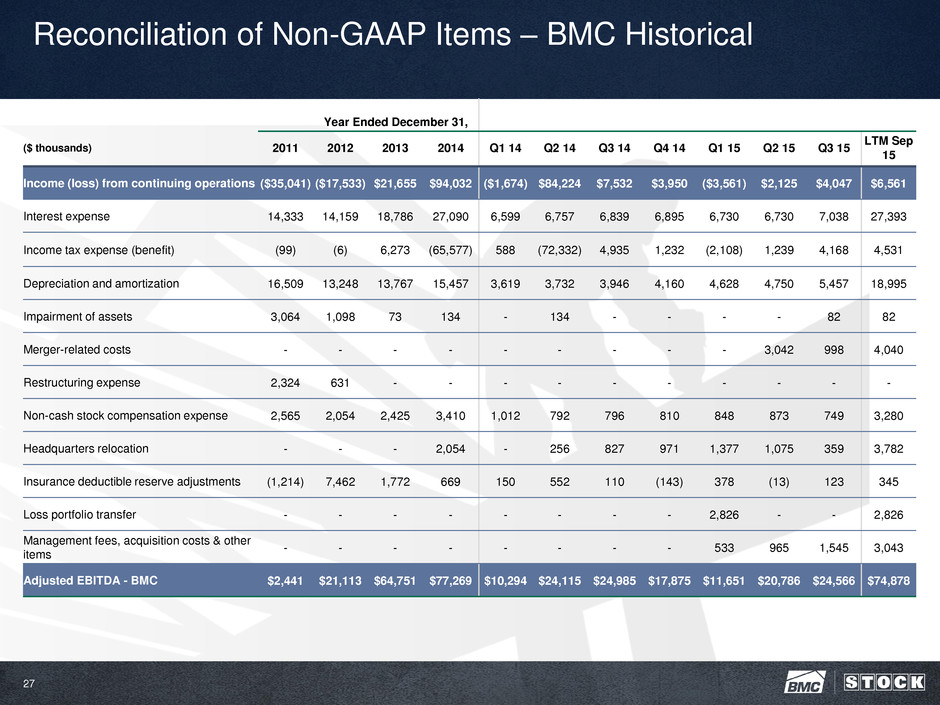
27 Reconciliation of Non-GAAP Items – BMC Historical Year Ended December 31, ($ thousands) 2011 2012 2013 2014 Q1 14 Q2 14 Q3 14 Q4 14 Q1 15 Q2 15 Q3 15 LTM Sep 15 Income (loss) from continuing operations ($35,041) ($17,533) $21,655 $94,032 ($1,674) $84,224 $7,532 $3,950 ($3,561) $2,125 $4,047 $6,561 Interest expense 14,333 14,159 18,786 27,090 6,599 6,757 6,839 6,895 6,730 6,730 7,038 27,393 Income tax expense (benefit) (99) (6) 6,273 (65,577) 588 (72,332) 4,935 1,232 (2,108) 1,239 4,168 4,531 Depreciation and amortization 16,509 13,248 13,767 15,457 3,619 3,732 3,946 4,160 4,628 4,750 5,457 18,995 Impairment of assets 3,064 1,098 73 134 - 134 - - - - 82 82 Merger-related costs - - - - - - - - - 3,042 998 4,040 Restructuring expense 2,324 631 - - - - - - - - - - Non-cash stock compensation expense 2,565 2,054 2,425 3,410 1,012 792 796 810 848 873 749 3,280 Headquarters relocation - - - 2,054 - 256 827 971 1,377 1,075 359 3,782 Insurance deductible reserve adjustments (1,214) 7,462 1,772 669 150 552 110 (143) 378 (13) 123 345 Loss portfolio transfer - - - - - - - - 2,826 - - 2,826 Management fees, acquisition costs & other items - - - - - - - - 533 965 1,545 3,043 Adjusted EBITDA - BMC $2,441 $21,113 $64,751 $77,269 $10,294 $24,115 $24,985 $17,875 $11,651 $20,786 $24,566 $74,878
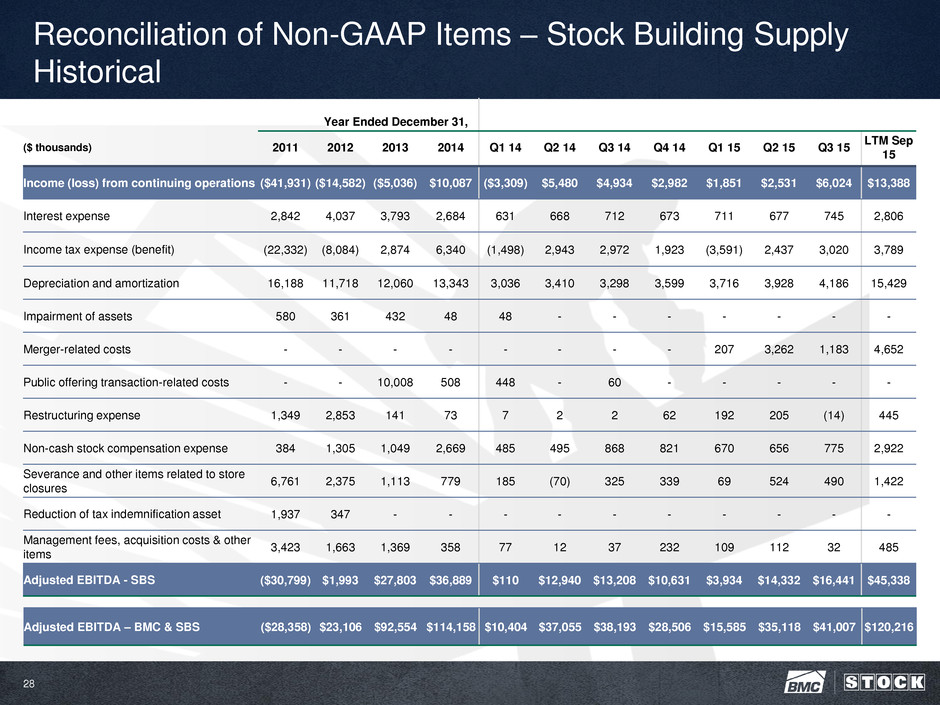
28 Reconciliation of Non-GAAP Items – Stock Building Supply Historical Year Ended December 31, ($ thousands) 2011 2012 2013 2014 Q1 14 Q2 14 Q3 14 Q4 14 Q1 15 Q2 15 Q3 15 LTM Sep 15 Income (loss) from continuing operations ($41,931) ($14,582) ($5,036) $10,087 ($3,309) $5,480 $4,934 $2,982 $1,851 $2,531 $6,024 $13,388 Interest expense 2,842 4,037 3,793 2,684 631 668 712 673 711 677 745 2,806 Income tax expense (benefit) (22,332) (8,084) 2,874 6,340 (1,498) 2,943 2,972 1,923 (3,591) 2,437 3,020 3,789 Depreciation and amortization 16,188 11,718 12,060 13,343 3,036 3,410 3,298 3,599 3,716 3,928 4,186 15,429 Impairment of assets 580 361 432 48 48 - - - - - - - Merger-related costs - - - - - - - - 207 3,262 1,183 4,652 Public offering transaction-related costs - - 10,008 508 448 - 60 - - - - - Restructuring expense 1,349 2,853 141 73 7 2 2 62 192 205 (14) 445 Non-cash stock compensation expense 384 1,305 1,049 2,669 485 495 868 821 670 656 775 2,922 Severance and other items related to store closures 6,761 2,375 1,113 779 185 (70) 325 339 69 524 490 1,422 Reduction of tax indemnification asset 1,937 347 - - - - - - - - - - Management fees, acquisition costs & other items 3,423 1,663 1,369 358 77 12 37 232 109 112 32 485 Adjusted EBITDA - SBS ($30,799) $1,993 $27,803 $36,889 $110 $12,940 $13,208 $10,631 $3,934 $14,332 $16,441 $45,338 Adjusted EBITDA – BMC & SBS ($28,358) $23,106 $92,554 $114,158 $10,404 $37,055 $38,193 $28,506 $15,585 $35,118 $41,007 $120,216
