Attached files
| file | filename |
|---|---|
| EX-99.5 - EX-99.5 - CBRE GROUP, INC. | a15-24478_1ex99d5.htm |
| EX-99.6 - EX-99.6 - CBRE GROUP, INC. | a15-24478_1ex99d6.htm |
| EX-99.2 - EX-99.2 - CBRE GROUP, INC. | a15-24478_1ex99d2.htm |
| EX-99.4 - EX-99.4 - CBRE GROUP, INC. | a15-24478_1ex99d4.htm |
| EX-99.3 - EX-99.3 - CBRE GROUP, INC. | a15-24478_1ex99d3.htm |
| EX-99.1 - EX-99.1 - CBRE GROUP, INC. | a15-24478_1ex99d1.htm |
| EX-99.7 - EX-99.7 - CBRE GROUP, INC. | a15-24478_1ex99d7.htm |
| 8-K - 8-K - CBRE GROUP, INC. | a15-24478_18k.htm |
Exhibit 99.8
Regional business outlook Panel Discussion

Rob Blain Executive Chairman, Asia Pacific Speakers Jim Reid Chief Operating Officer, Americas Martin Samworth Chief Executive Officer, Europe, Middle East and Africa Mike Lafitte Panel participants Chief Operating Officer Moderator

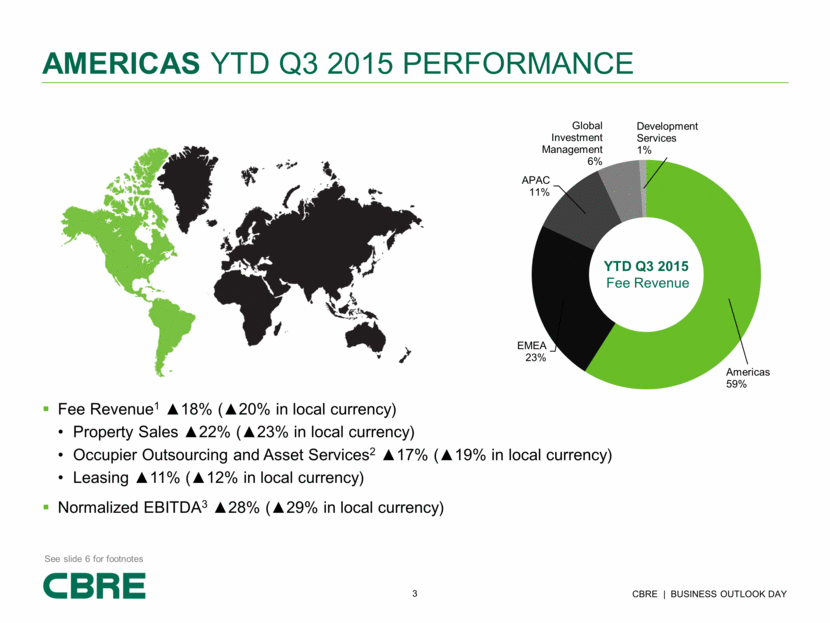
Americas ytd q3 2015 performance Fee Revenue1 ▲18% (▲20% in local currency) Property Sales ▲22% (▲23% in local currency) Occupier Outsourcing and Asset Services2 ▲17% (▲19% in local currency) Leasing ▲11% (▲12% in local currency) Normalized EBITDA3 ▲28% (▲29% in local currency) See slide 6 for footnotes YTD Q3 2015 Fee Revenue Americas 59% EMEA 23% APAC 11% Global Investment Management 6% Development Services 1%
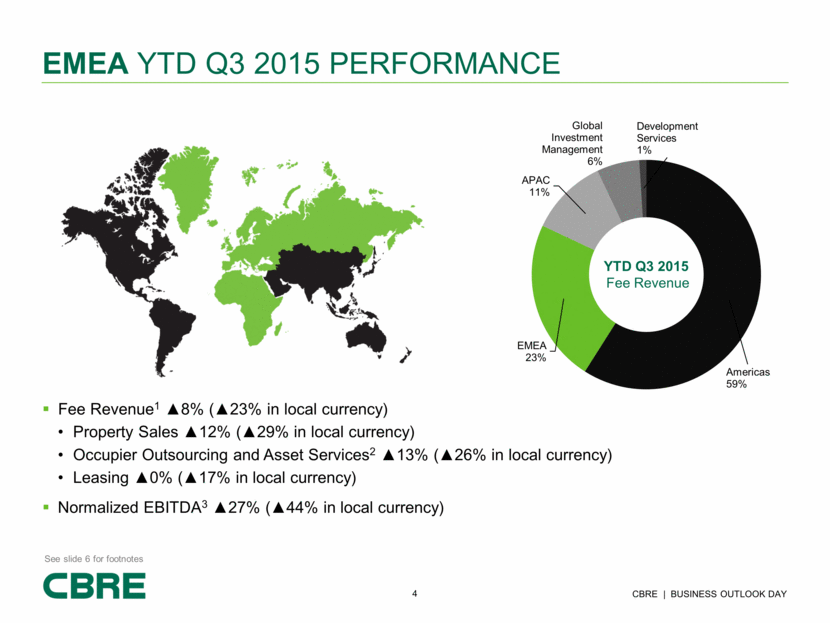
Fee Revenue1 ▲8% (▲23% in local currency) Property Sales ▲12% (▲29% in local currency) Occupier Outsourcing and Asset Services2 ▲13% (▲26% in local currency) Leasing ▲0% (▲17% in local currency) Normalized EBITDA3 ▲27% (▲44% in local currency) EMEA ytd q3 2015 performance YTD Q3 2015 Fee Revenue See slide 6 for footnotes Americas 59% EMEA 23% APAC 11% Global Investment Management 6% Development Services 1%
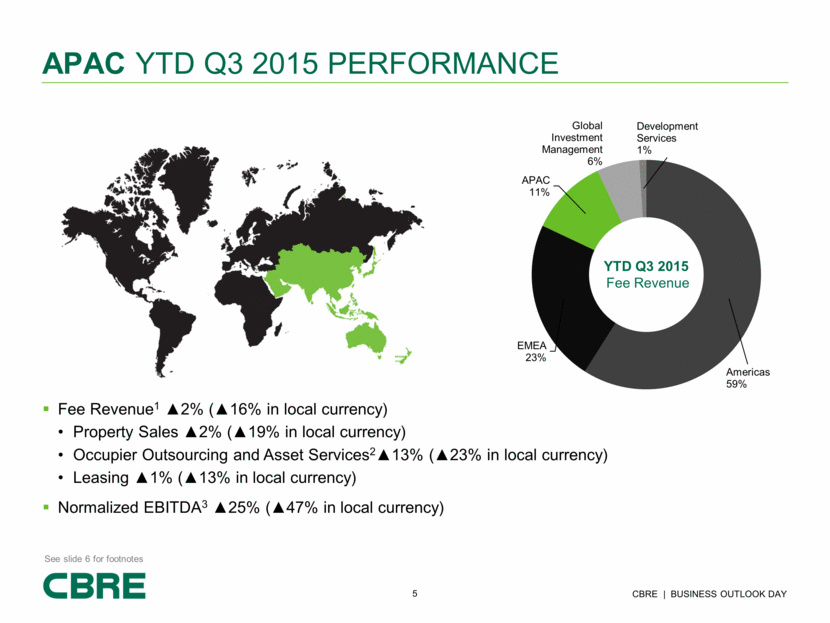
Fee Revenue1 ▲2% (▲16% in local currency) Property Sales ▲2% (▲19% in local currency) Occupier Outsourcing and Asset Services2▲13% (▲23% in local currency) Leasing ▲1% (▲13% in local currency) Normalized EBITDA3 ▲25% (▲47% in local currency) APAC ytd q3 2015 performance YTD Q3 2015 Fee Revenue See slide 6 for footnotes Americas 59% EMEA 23% APAC 11% Global Investment Management 6% Development Services 1%
footnotes Slides 3, 4 and 5 Fee revenue is gross revenue less both client reimbursed costs largely associated with employees that are dedicated to client facilities and subcontracted vendor work performed for clients. Occupier outsourcing and Asset Services exclude associated sales and lease revenue, most of which is contractual. Normalized EBITDA excludes (from EBITDA) integration and other costs related to acquisitions.
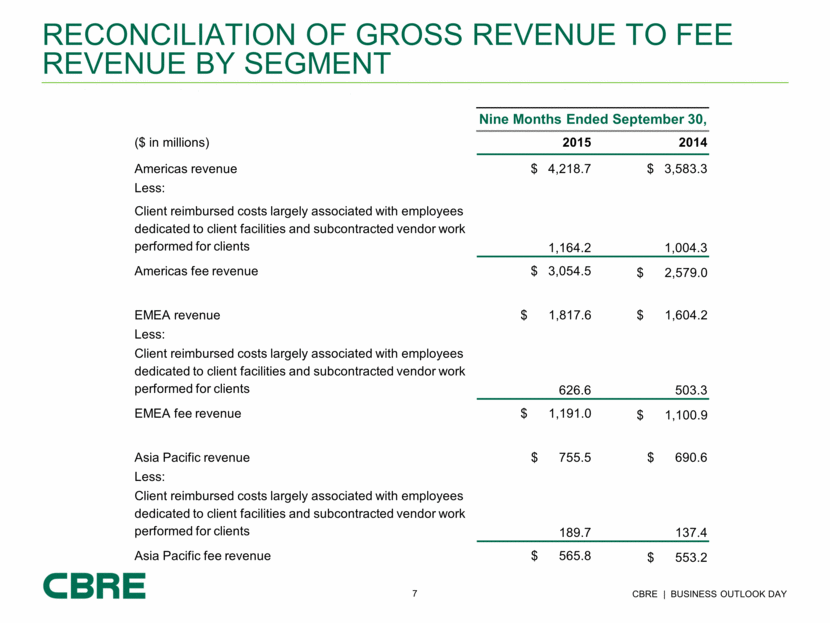
Nine Months Ended September 30, ($ in millions) 2015 2014 Americas revenue $ 4,218.7 $ 3,583.3 Less: Client reimbursed costs largely associated with employees dedicated to client facilities and subcontracted vendor work performed for clients 1,164.2 1,004.3 Americas fee revenue $ 3,054.5 $ 2,579.0 EMEA revenue $ 1,817.6 $ 1,604.2 Less: Client reimbursed costs largely associated with employees dedicated to client facilities and subcontracted vendor work performed for clients 626.6 503.3 EMEA fee revenue $ 1,191.0 $ 1,100.9 Asia Pacific revenue $ 755.5 $ 690.6 Less: Client reimbursed costs largely associated with employees dedicated to client facilities and subcontracted vendor work performed for clients 189.7 137.4 Asia Pacific fee revenue $ 565.8 $ 553.2 Reconciliation of gross revenue to fee revenue by segment
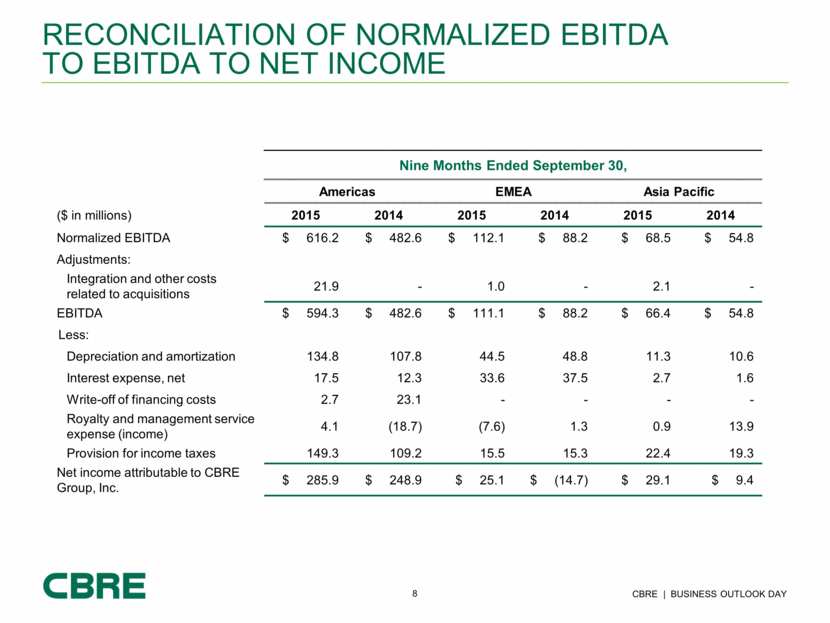
Nine Months Ended September 30, Americas EMEA Asia Pacific ($ in millions) 2015 2014 2015 2014 2015 2014 Normalized EBITDA $ 616.2 $ 482.6 $ 112.1 $ 88.2 $ 68.5 $ 54.8 Adjustments: Integration and other costs related to acquisitions 21.9 - 1.0 - 2.1 - EBITDA $ 594.3 $ 482.6 $ 111.1 $ 88.2 $ 66.4 $ 54.8 Less: Depreciation and amortization 134.8 107.8 44.5 48.8 11.3 10.6 Interest expense, net 17.5 12.3 33.6 37.5 2.7 1.6 Write-off of financing costs 2.7 23.1 - - - - Royalty and management service expense (income) 4.1 (18.7) (7.6) 1.3 0.9 13.9 Provision for income taxes 149.3 109.2 15.5 15.3 22.4 19.3 Net income attributable to CBRE Group, Inc. $ 285.9 $ 248.9 $ 25.1 $ (14.7) $ 29.1 $ 9.4 Reconciliation of Normalized EBITDA to EBITDA to Net Income
Asia Pacific Revenue by Country Revenue by Country YTD Q3 2015 Pacific 38% Greater China 21% India 15% Japan 13% Singapore 7% Thailand 3% Korea 2% Other 1%

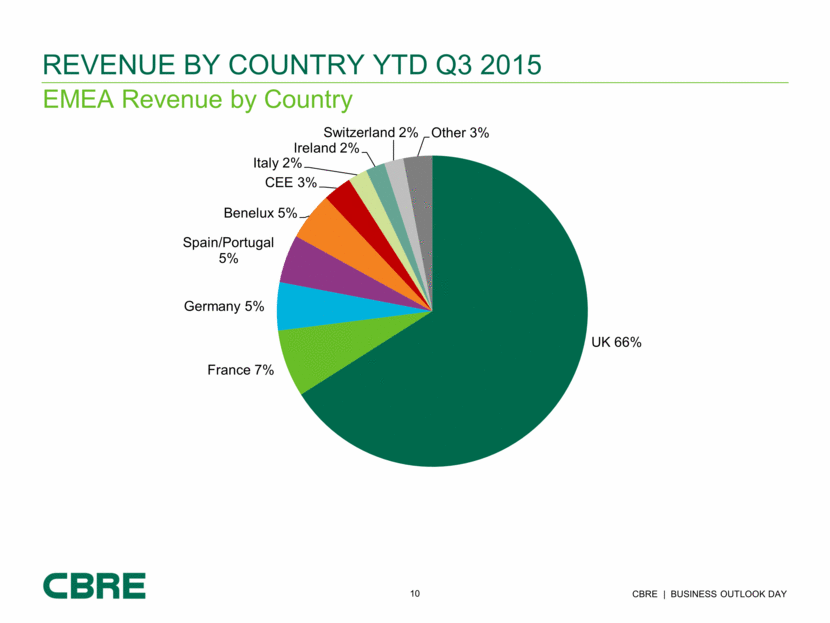
EMEA Revenue by Country Revenue by Country YTD Q3 2015 UK 66% France 7% Germany 5% Spain/Portugal 5% Benelux 5% CEE 3% Italy 2% Ireland 2% Switzerland 2% Other 3%