Attached files
| file | filename |
|---|---|
| EX-99.8 - EX-99.8 - CBRE GROUP, INC. | a15-24478_1ex99d8.htm |
| EX-99.6 - EX-99.6 - CBRE GROUP, INC. | a15-24478_1ex99d6.htm |
| EX-99.2 - EX-99.2 - CBRE GROUP, INC. | a15-24478_1ex99d2.htm |
| EX-99.4 - EX-99.4 - CBRE GROUP, INC. | a15-24478_1ex99d4.htm |
| EX-99.3 - EX-99.3 - CBRE GROUP, INC. | a15-24478_1ex99d3.htm |
| EX-99.1 - EX-99.1 - CBRE GROUP, INC. | a15-24478_1ex99d1.htm |
| EX-99.7 - EX-99.7 - CBRE GROUP, INC. | a15-24478_1ex99d7.htm |
| 8-K - 8-K - CBRE GROUP, INC. | a15-24478_18k.htm |
Exhibit 99.5
Capital and investment markets Panel Discussion

Brian Stoffers Global President, Debt & Structured Finance Peter Donovan Executive Managing Director, Multifamily, Capital Markets Chris Ludeman Global President, Capital Markets Panel participants Ritson Ferguson Global Chief Investment Officer, CBRE Global Investors
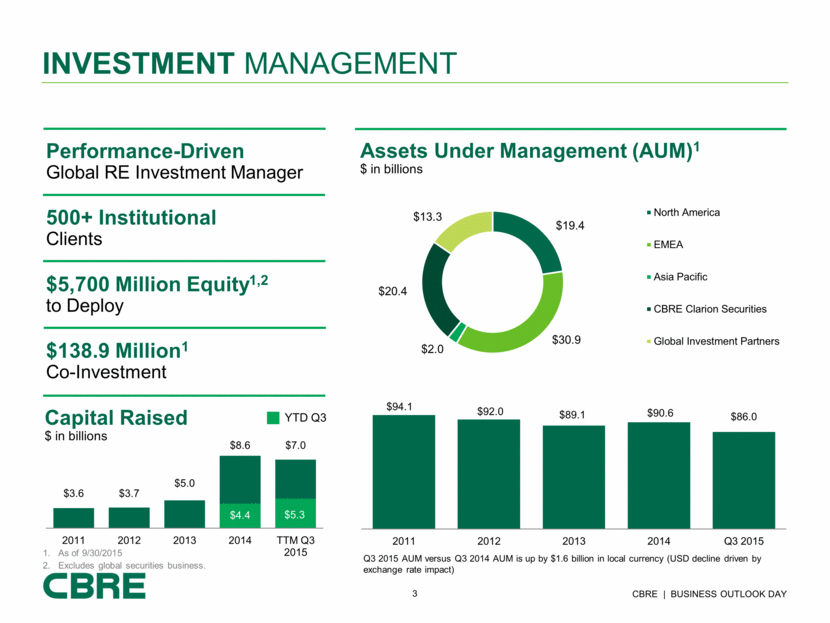
Investment management Performance-Driven Global RE Investment Manager 500+ Institutional Clients $5,700 Million Equity1,2 to Deploy $138.9 Million1 Co-Investment YTD Q3 Assets Under Management (AUM)1 $ in billions Q3 2015 AUM versus Q3 2014 AUM is up by $1.6 billion in local currency (USD decline driven by exchange rate impact) Capital Raised $ in billions As of 9/30/2015 Excludes global securities business. $94.1 $92.0 $89.1 $90.6 $86.0 2011 2012 2013 2014 Q3 2015 $4.4 $5.3 $3.6 $3.7 $5.0 $8.6 $7.0 2011 2012 2013 2014 TTM Q3 2015 $19.4 $30.9 $2.0 $20.4 $13.3 North America EMEA Asia Pacific CBRE Clarion Securities Global Investment Partners
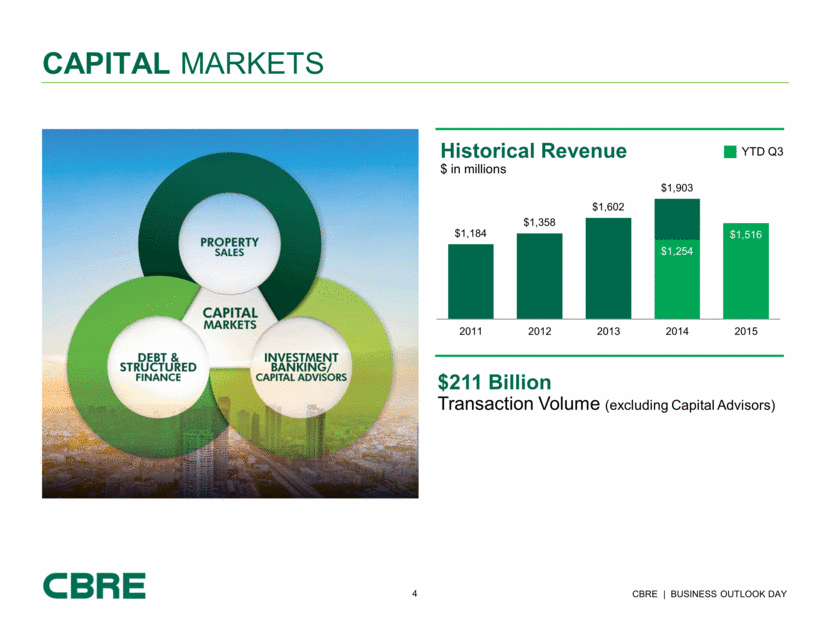
Capital Markets YTD Q3 Historical Revenue $ in millions $211 Billion Transaction Volume (excluding Capital Advisors) $1,184 $1,358 $1,602 $1,903 $1,254 $1,516 2011 2012 2013 2014 2015
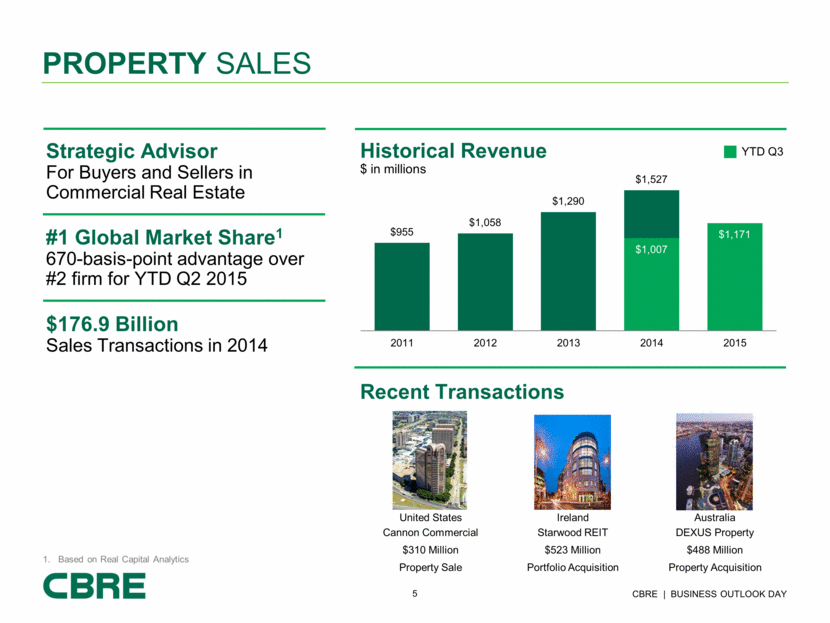
Based on Real Capital Analytics Strategic Advisor For Buyers and Sellers in Commercial Real Estate #1 Global Market Share1 670-basis-point advantage over #2 firm for YTD Q2 2015 $176.9 Billion Sales Transactions in 2014 YTD Q3 Historical Revenue $ in millions Recent Transactions Property Sales United States Ireland Australia Cannon Commercial Starwood REIT DEXUS Property $310 Million $523 Million $488 Million Property Sale Portfolio Acquisition Property Acquisition $955 $1,058 $1,290 $1,527 $1,007 $1,171 2011 2012 2013 2014 2015
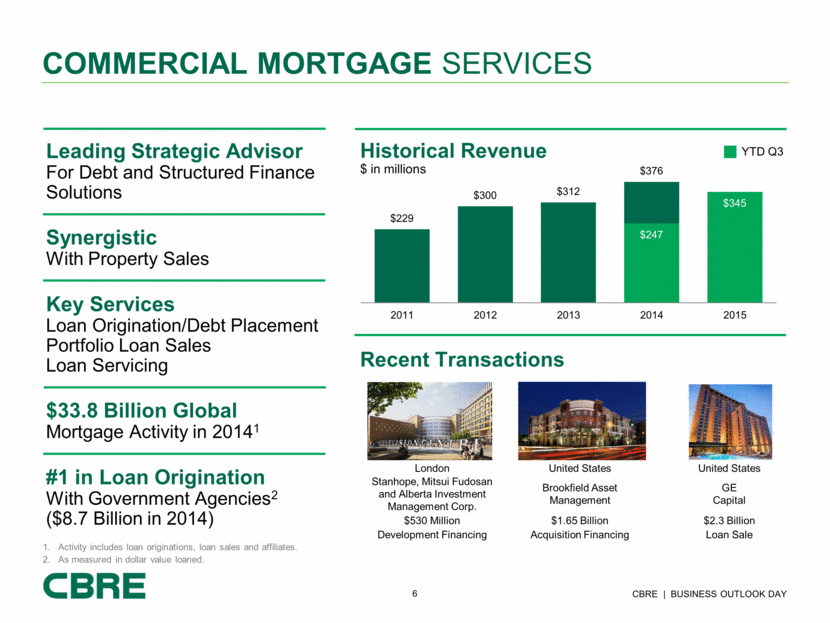
Commercial mortgage services Activity includes loan originations, loan sales and affiliates. As measured in dollar value loaned. Leading Strategic Advisor For Debt and Structured Finance Solutions Synergistic With Property Sales Key Services Loan Origination/Debt Placement Portfolio Loan Sales Loan Servicing $33.8 Billion Global Mortgage Activity in 20141 #1 in Loan Origination With Government Agencies2 ($8.7 Billion in 2014) YTD Q3 Historical Revenue $ in millions Recent Transactions London United States United States Stanhope, Mitsui Fudosan and Alberta Investment Management Corp. Brookfield Asset Management GE Capital $530 Million $1.65 Billion $2.3 Billion Development Financing Acquisition Financing Loan Sale $229 $300 $312 $376 $247 $345 2011 2012 2013 2014 2015
