Attached files
| file | filename |
|---|---|
| EX-99.5 - EX-99.5 - CBRE GROUP, INC. | a15-24478_1ex99d5.htm |
| EX-99.8 - EX-99.8 - CBRE GROUP, INC. | a15-24478_1ex99d8.htm |
| EX-99.6 - EX-99.6 - CBRE GROUP, INC. | a15-24478_1ex99d6.htm |
| EX-99.2 - EX-99.2 - CBRE GROUP, INC. | a15-24478_1ex99d2.htm |
| EX-99.4 - EX-99.4 - CBRE GROUP, INC. | a15-24478_1ex99d4.htm |
| EX-99.3 - EX-99.3 - CBRE GROUP, INC. | a15-24478_1ex99d3.htm |
| EX-99.7 - EX-99.7 - CBRE GROUP, INC. | a15-24478_1ex99d7.htm |
| 8-K - 8-K - CBRE GROUP, INC. | a15-24478_18k.htm |
Exhibit 99.1
Financial Overview Jim Groch Chief Financial Officer

This presentation contains statements that are forward looking within the meaning of the Private Securities Litigation Reform Act of 1995, including qualitative and quantitative statements regarding our future growth momentum, operations, financial performance, business outlook and our ability to integrate the recently-acquired Global Workplace Solutions business, including our ability to achieve anticipated cost synergies. These statements should be considered as estimates only and actual results may ultimately differ from these estimates. Except to the extent required by applicable securities laws, we undertake no obligation to update or publicly revise any of the forward-looking statements that you may hear today. Please refer to our quarterly reports on Form 10-Q for the quarters ended March 31, 2015, June 30, 2015 and September 30, 2015, and our most recent annual report on Form 10-K, in particular any discussion of risk factors or forward-looking statements, which are filed with the SEC and available at the SEC’s website (www.sec.gov), for a full discussion of the risks and other factors that may impact any forward-looking statements that you may hear today. We may make certain statements during the course of this presentation that include references to “non-GAAP financial measures,” as defined by SEC regulations. Where required by these regulations, we have provided reconciliations of these measures to what we believe are the most directly comparable GAAP measures, as well as explanations for the measures, within the appendix attached hereto. Forward-Looking Statements
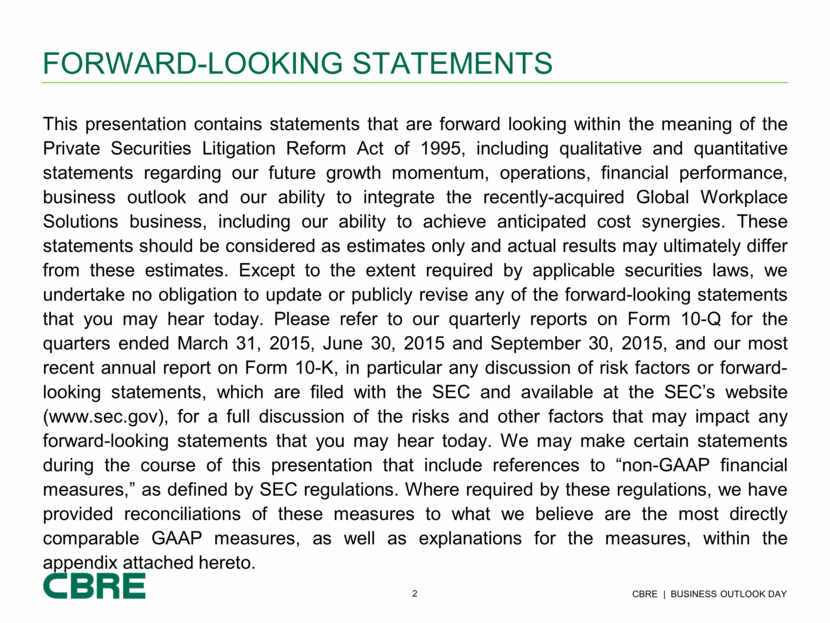
Positive trends Strong momentum across our business lines Underlying fundamentals continue to improve Market sentiment remains positive Considerations We remain attentive to uneven economic growth 2015 In October, we raised adjusted EPS guidance for 2015 by ten cents to $2.00 - $2.051 Outlook See slide 17 for footnotes.
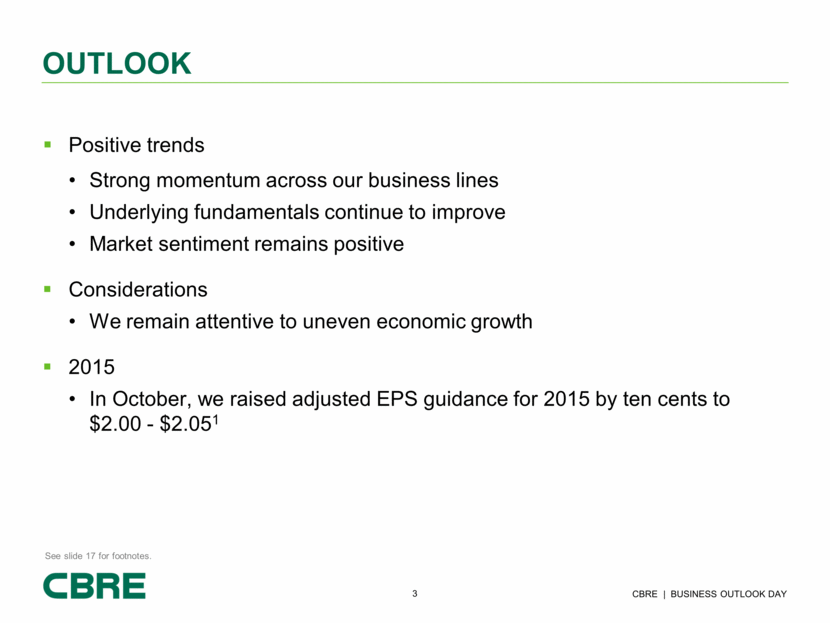
the global market leader CBRE is the premier global provider of integrated services to commercial real estate investors and occupiers GLOBAL LEADERSHIP WITH BROAD CAPABILITIES #1 Leasing #1 Property Sales #1 Outsourcing #1 Appraisal & Valuation $86 billion AUM Investment Management1 SCALE AND DIVERSITY 460+ offices in over 60 countries2 Serves 89% of the Fortune 100 $285 billion of sales and lease activity in 2014 5 billion square feet under management3 See slide 17 for footnotes.
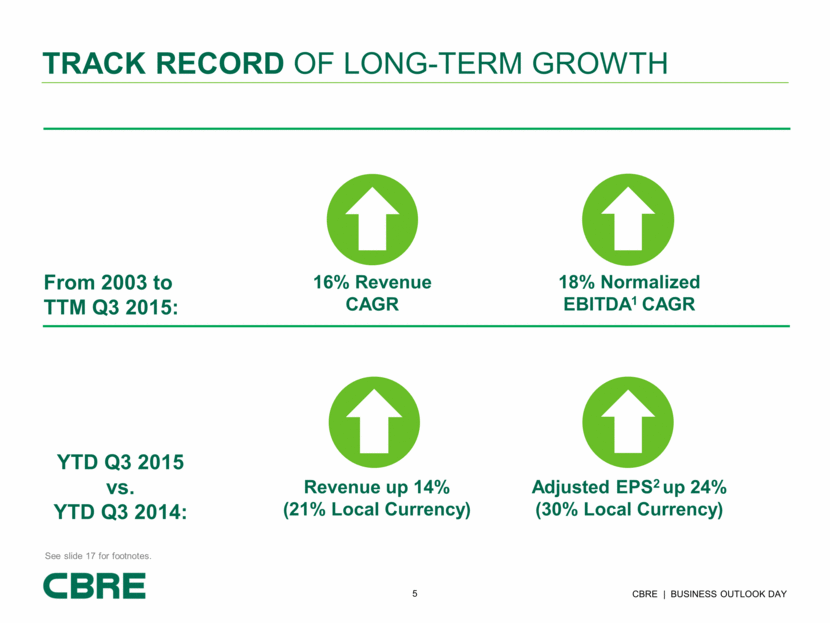
Revenue up 14% (21% Local Currency) Adjusted EPS2 up 24% (30% Local Currency) Track record of long-term growth 16% Revenue CAGR From 2003 to TTM Q3 2015: YTD Q3 2015 vs. YTD Q3 2014: 18% Normalized EBITDA1 CAGR See slide 17 for footnotes.
Consolidation Leasing and capital markets services continue to consolidate but remain highly fragmented Outsourcing Recurring contractual revenues Still in early stage of penetration with occupiers Contributes to largely recurring leasing revenues Strategic Position Closed acquisition of Global Workplace Solutions on September 1, 2015 Clients appreciate CBRE’s unmatched global depth and capability With Global Workplace Solutions, CBRE revenue now approaching 2x closest competition CBRE Leads a Sector With Strong Underlying Growth Dynamics Positioned for long-term growth
Capitalize on our unique leadership position to widen our competitive advantages in the marketplace Continue to: Drive market share gains in our core leasing and capital markets businesses with leadership and innovation Enrich our operating platform (Technology & Data Enablement, Research, Marketing, Workplace Strategy, etc.) to support long-term growth Acquire the leading companies in our sector that enhance our ability to serve clients Enhance depth and breadth of our Occupier Outsourcing business Key strategic priorities
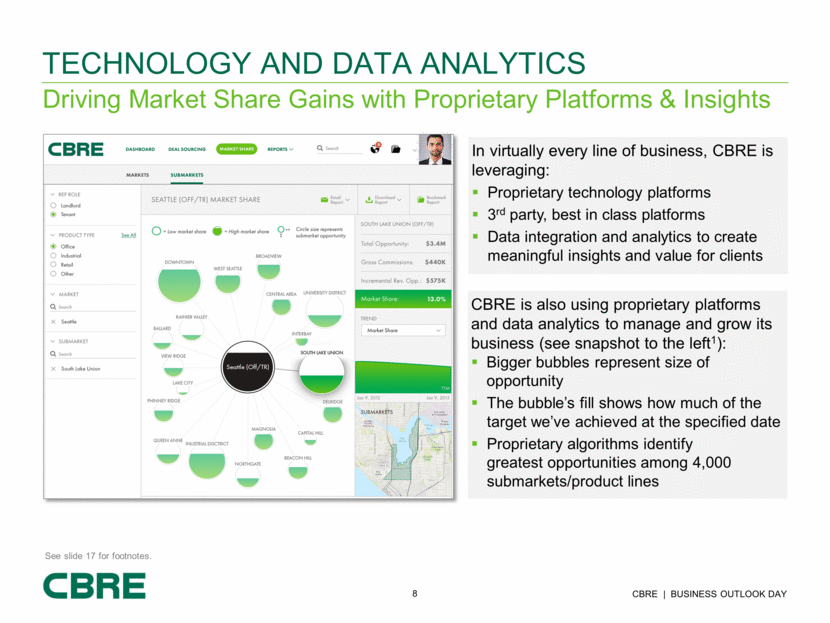
Driving Market Share Gains with Proprietary Platforms & Insights technology and data analytics CBRE is also using proprietary platforms and data analytics to manage and grow its business (see snapshot to the left1): Bigger bubbles represent size of opportunity The bubble’s fill shows how much of the target we’ve achieved at the specified date Proprietary algorithms identify greatest opportunities among 4,000 submarkets/product lines In virtually every line of business, CBRE is leveraging: Proprietary technology platforms 3rd party, best in class platforms Data integration and analytics to create meaningful insights and value for clients See slide 17 for footnotes.
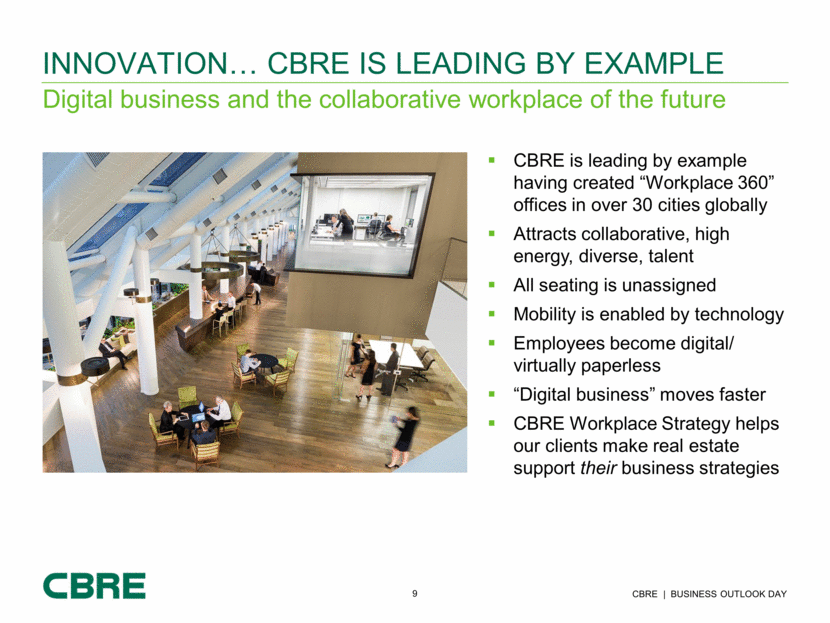
Digital business and the collaborative workplace of the future innovation CBRE is Leading by example CBRE is leading by example having created “Workplace 360” offices in over 30 cities globally Attracts collaborative, high energy, diverse, talent All seating is unassigned Mobility is enabled by technology Employees become digital/ virtually paperless “Digital business” moves faster CBRE Workplace Strategy helps our clients make real estate support their business strategies
Approximately 100 Acquisitions Since 2005 Mergers and acquisitions strategy Transactions generally fall into two categories: Strategic in-fill acquisitions sourced principally by lines of business Four larger, transformational transactions driven by macro strategy On September 1, 2015, CBRE acquired Global Workplace Solutions from Johnson Controls, Inc. $1.475 billion purchase ($1.3 billion net of the present value of expected tax benefits1) Approximately 7.3x multiple2 of net purchase price to 2014 calendar year adjusted EBITDA including expected run-rate synergies of $50 million See slide 17 for footnotes.
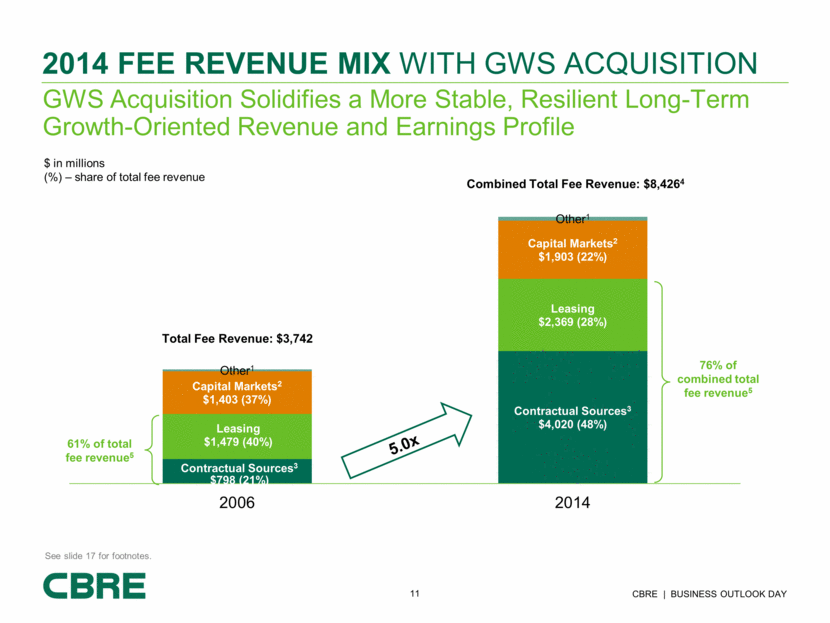
GWS Acquisition Solidifies a More Stable, Resilient Long-Term Growth-Oriented Revenue and Earnings Profile 2014 fee revenue Mix with gws acquisition Total Fee Revenue: $3,742 Combined Total Fee Revenue: $8,4264 5.0x See slide 17 for footnotes. Contractual Sources 3 $798 (21%) Contractual Sources 3 $4,020 (48%) Leasing $1,479 (40%) Leasing $2,369 (28%) Capital Markets 2 $1,403 (37%) Capital Markets 2 $1,903 (22%) Other 1 Other 1 2006 2014 $ in millions (%) – share of total fee revenue 76% of combined total fee revenue 5 61% of total fee revenue 5
CBRE: Leads an industry with strong underlying growth dynamics Is very well positioned to continue its long-term track record of growth Has developed into a balanced business with a more stable growth profile Has a strong balance sheet and significant liquidity Is continuing to extend its competitive advantage in the marketplace Key takeaways
Non-Gaap financial measures The following measures are considered “non-GAAP financial measures” under SEC guidelines: (i) Fee revenue (ii) Net income attributable to CBRE Group, Inc., as adjusted (which we also refer to as “adjusted net income”) (iii) Diluted income per share attributable to CBRE Group, Inc. shareholders, as adjusted (which we also refer to as “adjusted earnings per share” or “adjusted EPS”) (iv) EBITDA and EBITDA, as adjusted (the latter of which we also refer to as “Normalized EBITDA”) None of these measures is a recognized measurement under U.S. generally accepted accounting principles, or U.S. GAAP, and when analyzing our operating performance, readers should use them in addition to, and not as an alternative for, their most directly comparable financial measure calculated and presented in accordance with U.S. GAAP. Because not all companies use identical calculations, our presentation of these measures may not be comparable to similarly titled measures of other companies. Our management generally uses these non-GAAP financial measures to evaluate operating performance and for other discretionary purposes, and the Company believes that these measures provide a more complete understanding of ongoing operations, enhance comparability of current results to prior periods and may be useful for investors to analyze our financial performance because they eliminate the impact of selected charges that may obscure trends in the underlying performance of our business. The Company further uses certain of these measures, and believes that they are useful to investors, for purposes described below. With respect to fee revenue: The Company believes that investors may find this measure useful to analyze the financial performance of our Occupier Outsourcing and Asset Services business lines and our business generally because it excludes costs reimbursable by clients and as such provides greater visibility into the underlying performance of our business. With respect to adjusted net income, adjusted EPS, EBITDA and Normalized EBITDA: The Company believes that investors may find these measures useful in evaluating our operating performance compared to that of other companies in our industry because their calculations generally eliminate the accounting effects of acquisitions, which would include impairment charges of goodwill and intangibles created from acquisitions, and—in the case of EBITDA and Normalized EBITDA—the effects of financings and income tax and the accounting effects of capital spending. All of these measures may vary for different companies for reasons unrelated to overall operating performance. In the case of EBITDA and Normalized EBITDA, these measures are not intended to be measures of free cash flow for our management’s discretionary use because they do not consider cash requirements such as tax and debt service payments. The EBITDA and Normalized EBITDA measures calculated herein may also differ from the amounts calculated under similarly titled definitions in our credit facilities and debt instruments, which amounts are further adjusted to reflect certain other cash and non-cash charges and are used by us to determine compliance with financial covenants therein and our ability to engage in certain activities, such as incurring additional debt and making certain restricted payments. The Company also uses Normalized EBITDA and adjusted EPS as significant components when measuring our operating performance under our employee incentive compensation programs.
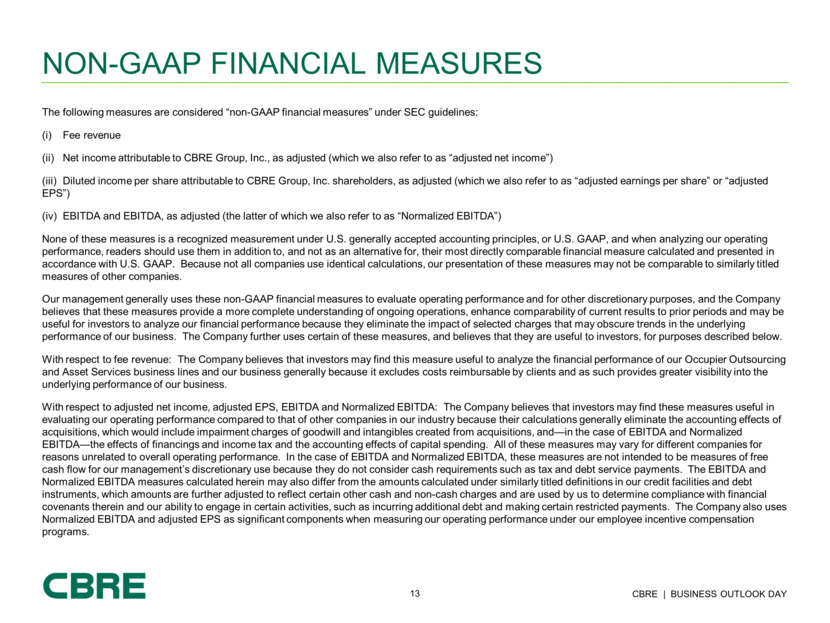
Twelve Months Ended ($ in millions) September 30, 2015 December 31, 2003 Normalized EBITDA $ 1,307.5 $ 183.2 Adjustments: Integration and other costs related to acquisitions 24.9 13.6 Carried interest incentive compensation expense1 20.9 - Cost containment expenses - 36.8 EBITDA 1,261.7 132.8 Add: Interest income 6.8 3.8 Less: Depreciation and amortization 284.9 92.8 Interest expense 110.8 71.3 Write-off of financing costs 2.7 - Loss on extinguishment of debt - 13.5 Provision for (benefit of) income taxes 298.7 (6.3) Net income (loss) attributable to CBRE Group, Inc. $ 571.4 $ (34.7) Reconciliation of Normalized EBITDA to EBITDA to Net Income (Loss) CBRE began normalizing carried interest compensation expense in Q2 2013 in order to better match the timing of this expense with associated carried interest revenue . This expense has only been normalized for funds that incurred carried interest expense for the first time in Q2 2013 or in subsequent quarters.
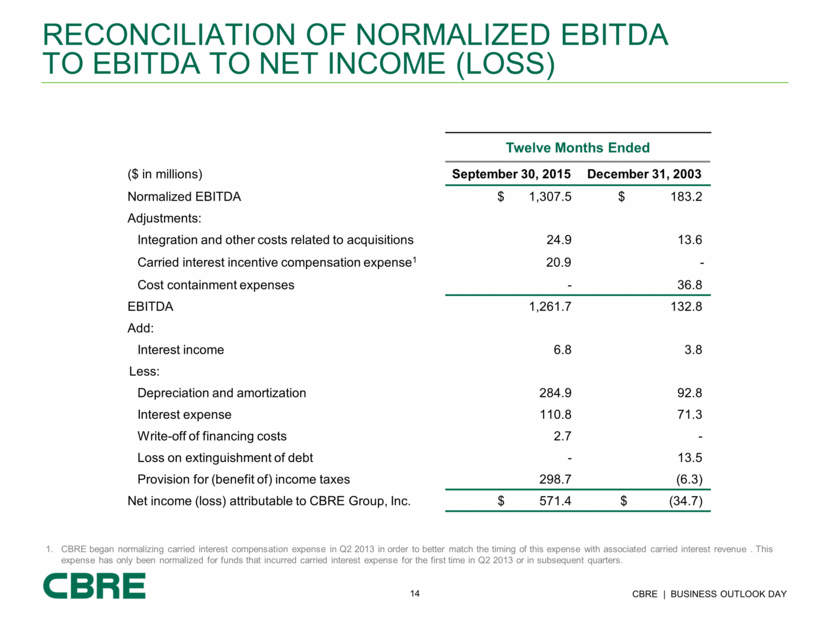
Nine Months Ended September 30, ($ in millions, except per share amounts) 2015 2014 Net income attributable to CBRE Group, Inc. $ 367.1 $ 280.2 Amortization expense related to certain intangible assets attributable to acquisitions, net of tax 34.3 37.3 Integration and other costs related to acquisitions, net of tax 18.0 - Write-off of financing costs, net of tax 1.6 14.1 Carried-interest incentive compensation expense, net of tax 0.3 2.1 Adjustment of taxes to normalized rate (3.6) - Adjusted net income attributable to CBRE Group, Inc. $ 417.7 $ 333.7 Adjusted diluted income per share attributable to CBRE Group, Inc. $ 1.24 $ 1.00 Weighted average shares outstanding for diluted income per share 336,140,923 333,855,131 Reconciliation of Net Income to adjusted Net Income and adjusted earnings per share
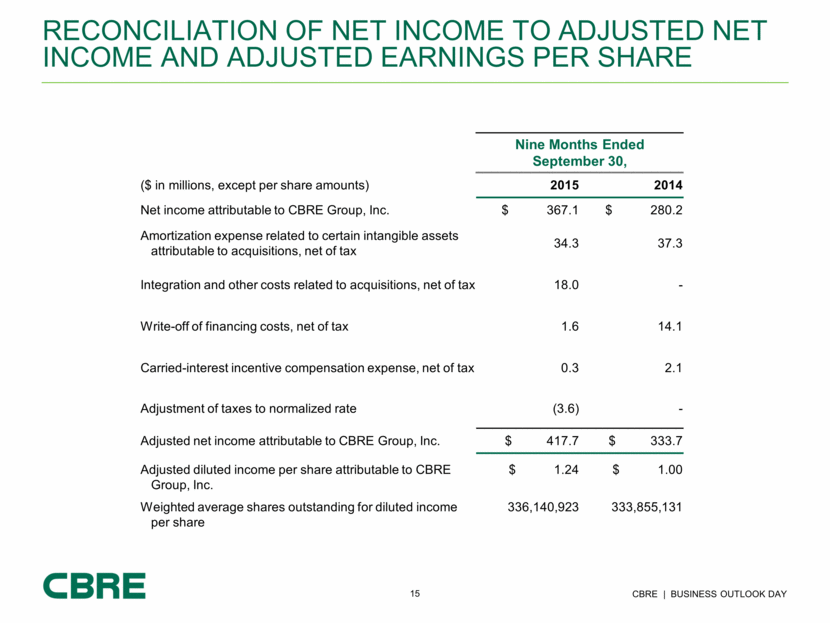
Reconciliation of gross revenue to fee revenue Twelve Months Ended December 31, ($ in millions) 2014 Pro-forma 1,2 2006 Consolidated revenue $ 12,457 $ 4,032 Less: Client reimbursed costs largely associated with employees dedicated to client facilities and subcontracted vendor work performed for clients 4,031 1,378 Consolidated fee revenue $ 8,426 $ 3,742 2014 pro-forma revenue includes revenue of the acquired GWS business representing the trailing twelve months as of December 31, 2014 and CBRE gross revenue for the year ended December 31, 2014. 2014 pro-forma fee revenue is defined as fee revenue for CBRE and the acquired GWS business on a combined basis for the year ended December 31, 2014.
Footnotes Slide 11 Note: Combined total fee revenue for 2014 has been adjusted downward from what was last presented in September 2015 for approximately $300 million of additional client-reimbursed sub-contracted vendor costs within the acquired Global Workplace Solutions business. Other includes Development Services (1% in both 2006 and 2014 combined) and Other (1% in both 2006 and 2014 combined). “Combined” means CBRE and the acquired GWS business on a combined basis for the year ended December 31, 2014. Capital Markets includes Sales (33% in 2006 and 18% in 2014 combined) and Commercial Mortgage Services (4% in both 2006 and 2014 combined). Contractual Revenues include Occupier Outsourcing and Asset Services (7% in 2006 and 36% in 2014 combined; excludes associated sales and lease revenues, most of which are contractual), Global Investment Management (6% in both 2006 and 2014 combined), and Valuation (8% in 2006 and 6% in 2014 combined). “Combined total fee revenue” is defined as fee revenue for CBRE and GWS combined for the year ended December 31, 2014. Fee Revenue is gross revenue less client reimbursed costs largely associated with our employees that are dedicated to client facilities and subcontracted vendor work performed for clients. Contractual plus leasing revenues are 64% of 2006 GAAP revenue and 84% of 2014 combined calendar year GAAP revenue. Slide 3 We have not reconciled the non-GAAP EPS guidance to the most directly comparable GAAP measure because this cannot be done without unreasonable effort. Slide 5 Note: Local currency percent changes versus prior year is a non-GAAP financial measure. These percent changes are calculated by comparing current year results versus prior year results, in each case at prior year exchange rates. Normalized EBITDA excludes cost containment expenses, integration and other costs related to acquisitions and certain carried interest expense (to better match with carried interest revenue realization). Adjusted EPS includes the impact of adjusting provision for income taxes to a normalized rate and excludes amortization expense related to certain intangible assets attributable to acquisitions (net of tax), integration and other costs related to acquisitions (net of tax), certain carried interest incentive compensation expense (net of tax) and the write-off of financing costs (net of tax). Slide 10 The base purchase price was $1.475 billion in cash plus approximately $36 million in estimated net adjustments for working capital and other items. Such net adjustments took into account approximately $45 million in cash acquired by CBRE in the acquisition. The purchase price is subject to post-closing adjustments as outlined in the purchase agreement for the transaction. Deal costs are excluded from the purchase price. Multiple based on GWS adjusted EBITDA as calculated by GWS (when owned by Johnson Controls) and using GWS’s methodologies (when owned by Johnson Controls). Slide 4 Assets Under Management (AUM) as of September 30, 2015. As of December 31, 2014, includes affiliates. Property and Corporate Facilities under Management. As of September 1, 2015; 4% of total from affiliates. Slide 8 Data is used for illustrative purposes. This is not actual data.
