Attached files
| file | filename |
|---|---|
| 8-K - 8-K - SELECT MEDICAL HOLDINGS CORP | a15-24363_28k.htm |
Exhibit 99.1
LENDER PRESENTATION DECEMBER 2015
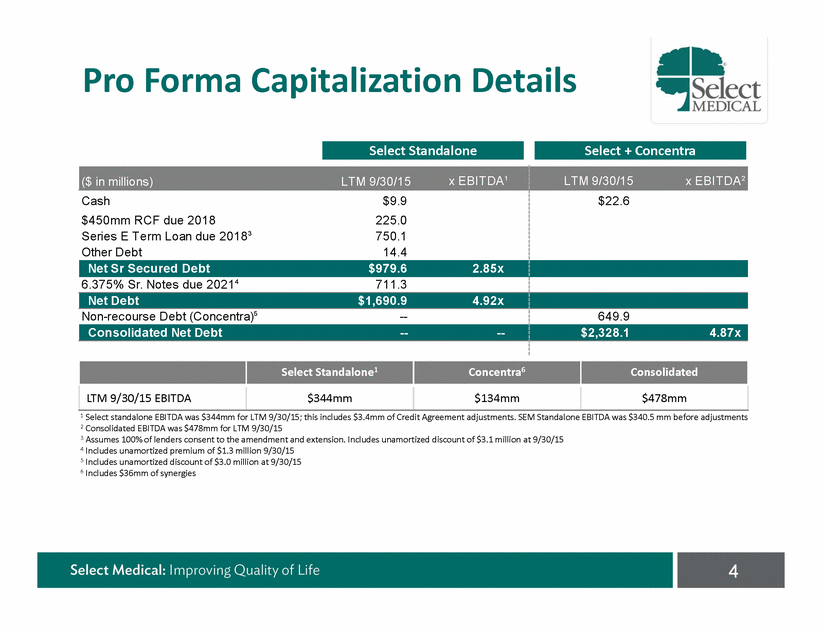
Transaction Overview • Select Medical Corporation (“Select” or the “Company”) is seeking to extend its existing Series D Term Loan and make other amendments to its existing credit facilities • Extend the maturity on the Series D Term Loan from December 2016 to June 2018, consistent with the Series E Term Loan – The extended Series E and D tranches will be one fungible Series E tranche • Other key amendment terms – Raise the financial maintenance covenant level from 5.0x total net leverage to 5.75x total net leverage (the original covenant at the time of the deal in 2011 was 6.0x) Refresh incremental Term Loan capacity EBITDA definition adds back start up losses at the inpatient rehab and LTACH facilities in first 12 months, subject to a cap – – • The amendment will strengthen the Company’s maturity profile, give additional operational flexibility, and capacity for future tuck in acquisitions • At close, leverage statistics will remain unchanged with Net Senior Secured Leverage will be 2.85x and Net Leverage will be 4.92x based on Select’s LTM 3Q15 EBITDA of $344M • Lender commitments due by December 8th at 5pm ET 2
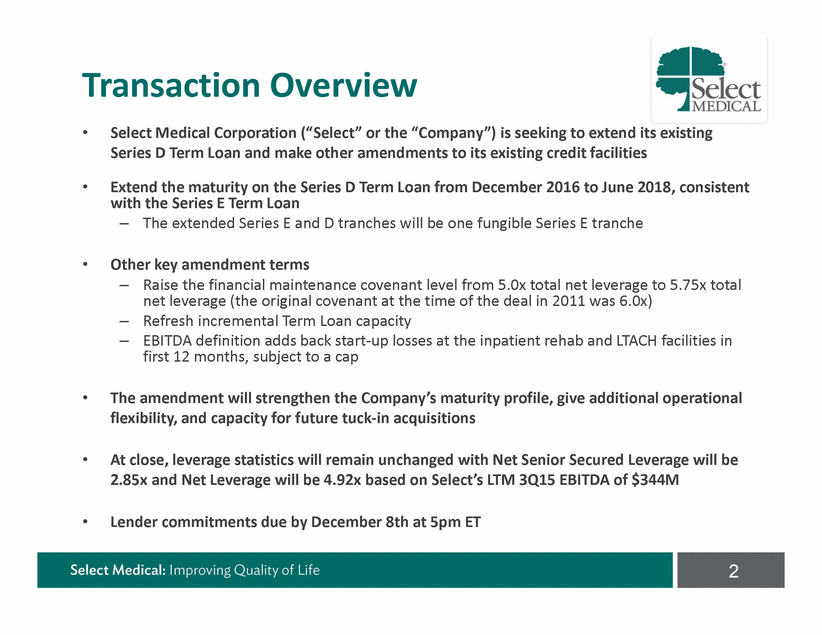
Summary Amendment Terms carryforward to next year 1 Secured leverage net of up to $75mm of cash 2 Total leverage net of up to $75mm of cash Proposed Pricing and Fees • Series D: – – Non extending: Unchanged; L+275, no LIBOR floor Extending: L+400 at current ratings; L+425 if corporate ratings fall below B1 / B+, 1% LIBOR floor • • Series E: L+400 at current ratings; L+425 if corporate ratings fall below B1 / B+, 1% LIBOR floor Amendment fee of 25.0bps 3 Existing Proposed Facility • R/C• Series D TLB• Series E TLB • R/C• Series D TLB• Series E TLB Amount • $450mm• $274mm• $479mm • • • Maturity • March 2018 • December 2016• June 2018 • • Non extending: Same as existing• • Extending: Extend to June 2018 (same as Series E TLB) Ratings • Corporate: B1 / B+ • Optional redemption • • Refresh 101 soft call for 6 months Incremental • $500 million subject to PF compliance with financial covenant and 3.50x Secured Leverage Ratio1 • $75mm remains after $275mm add on in 8/12, $50mm RC increase 8/14 and $100mm increase 5/15; $300mm short dated tranche was carved out) • $50mm free and clear basket • Refresh incremental to $400mm (grandfather the $75mm + $325mm) subject to 3.50x Secured Leverage Ratio1 • 50bps MFN for the life of the deal EBITDA definition • Add back start up losses attributable to LTACHs paid under acute care MS DRGs during their LTACH qualification period in connection with health care facilities acquired in any Permitted Acquisition, < $10mm in any single acquisition or group of related acquisitions and < $15mm in any fiscal year • Add back start up losses at in patient rehabilitation or LTACH facilities in first 12 months limited to the greater of: • $15mm annually with 50% carry forward to next year • EBITDA add back subject to a cap to not exceed 4.5% of EBITDA, with 50% Permitted acquisitions • 5.25x incurrence test • Raise incurrence test to 5.75x to conform to the move in the financial maintenance covenant Financial maintenance covenants • Total Net Leverage Ratio2 5.00x • Max capital expenditures of $125mm • Total Net Leverage Ratio2 5.75x • Max capital expenditures of $125mm
Pro Forma Capitalization Details Select Standalone Select + Concentra Cash $450mm RCF due 2018 Series E Term Loan due 20183 Other Debt $9.9 225.0 750.1 14.4 $22.6 Net Sr Secured Debt $979.6 2.85x 6.375% Sr. Notes due 20214 711.3 Non-recourse Debt (Concentra)5 --649.9 1 Select standalone EBITDA was $344mm for LTM 9/30/15; this includes $3.4mm of Credit Agreement adjustments. SEM Standalone EBITDA was $340.5 mm before adjustments 2 Consolidated EBITDA was $478mm for LTM 9/30/15 3 Assumes 100% of lenders consent to the amendment and extension. Includes unamortized discount of $3.1 million at 9/30/15 4 Includes unamortized premium of $1.3 million 9/30/15 5 Includes unamortized discount of $3.0 million at 9/30/15 6 Includes $36mm of synergies 4 Select Standalone1 Concentra6 Consolidated LTM 9/30/15 EBITDA $344mm $134mm $478mm Consolidated Net Debt ---- $2,328.1 4.87x Net Debt $1,690.9 4.92x ($ in millions) LTM 9/30/15 x EBITDA1 LTM 9/30/15 x EBITDA2
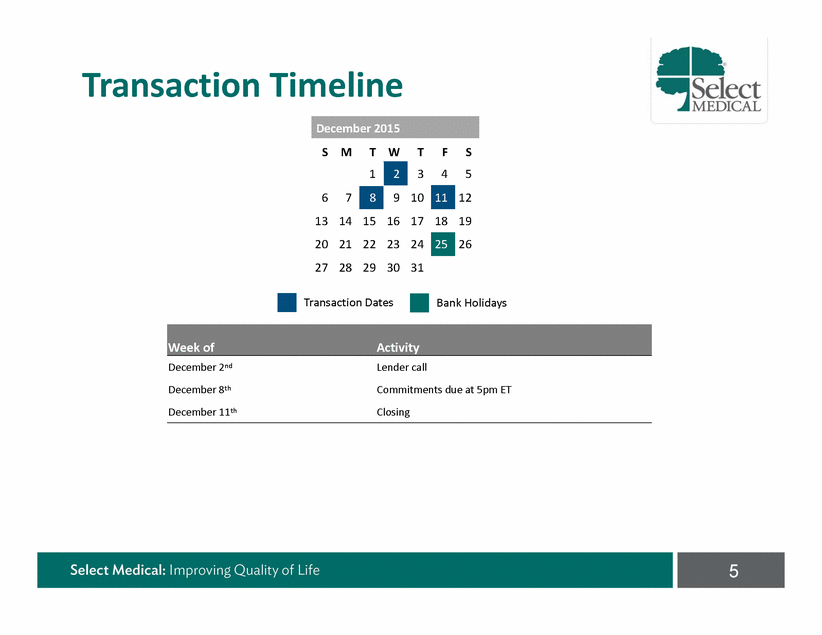
Transaction Timeline S M T W T 3 10 17 24 31 F 4 S 5 12 19 26 6 13 20 27 7 14 21 28 15 22 29 16 23 30 18 Transaction Dates Bank Holidays December 2nd December 8th December 11th Lender call Commitments due at 5pm ET Closing 5 Week ofActivity 25 11 1 2 8 9 December 2015
Business Update

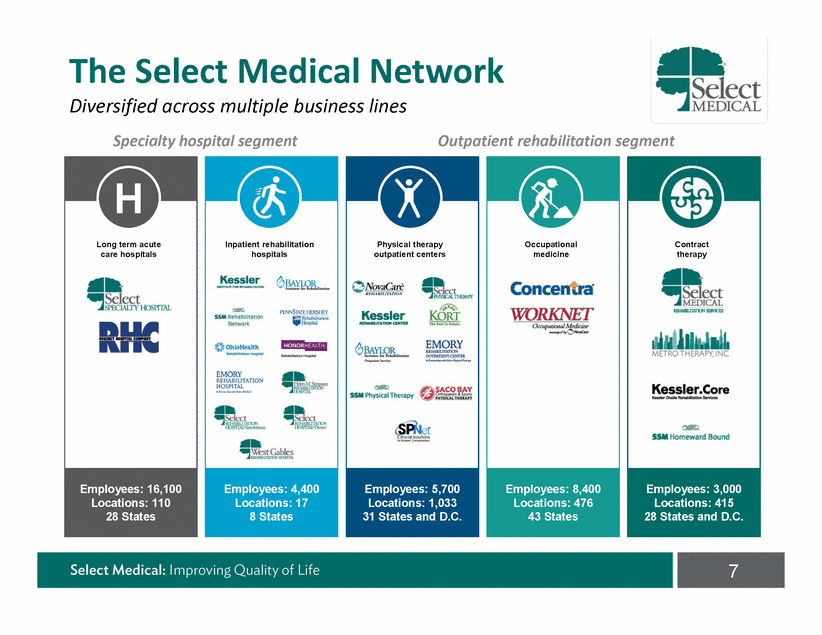
The Select Medical Network Diversified across multiple business lines Specialty hospital segment Outpatient rehabilitation segment 7 Contract therapy Employees: 3,000 Locations: 415 28 States and D.C. Occupational medicine Employees: 8,400 Locations: 476 43 States Physical therapy outpatient centers Employees: 5,700 Locations: 1,033 31 States and D.C. Inpatient rehabilitation hospitals Employees: 4,400 Locations: 17 8 States Long term acute care hospitals Employees: 16,100 Locations: 110 28 States
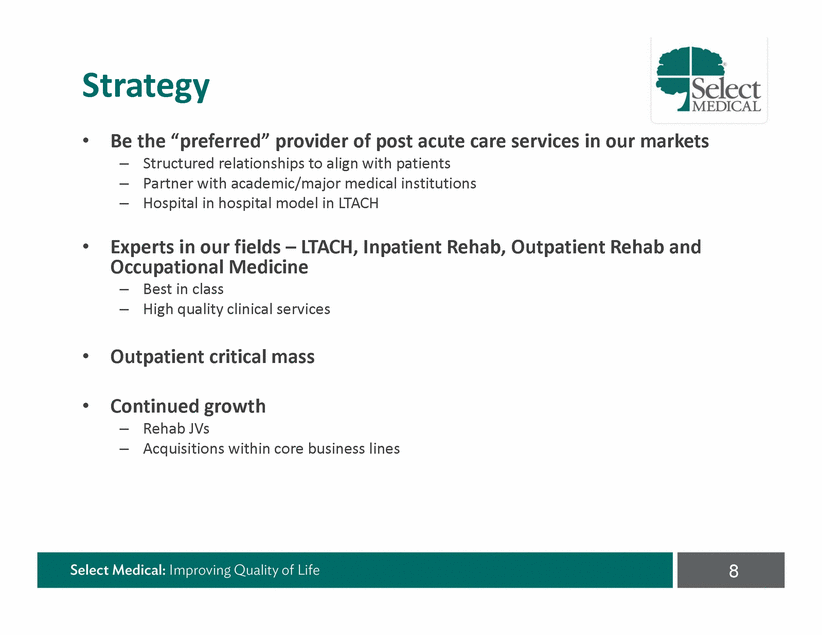
Strategy • Be the “preferred” provider of post acute care services in our markets – – – Structured relationships to align with patients Partner with academic/major medical institutions Hospital in hospital model in LTACH • Experts in our fields – LTACH, Inpatient Rehab, Outpatient Rehab and Occupational Medicine – – Best in class High quality clinical services • Outpatient critical mass • Continued growth – – Rehab JVs Acquisitions within core business lines 8
LTACH Regulatory Impact Well positioned to succeed in an evolving landscape • Patient criteria in place since October 1, 2015 – – 16 hospitals under criteria this quarter All hospitals to transition to criteria by the end of Q3 2016 • SEM hospitals are largely compliant – Current compliance for all SEM LTACHs at 80.9% • Significant market exists for LTACH compliant patients – ~350,000 – 400,000 / year compliant discharges from STACH vs. over ~134,000 annual LTACH industry admissions • Systematized way to identify compliant patients with acute care partners – Medpar data provides roadmap to compliant patients • Continued training of people and streamlining of processes to ensure successful transition to criteria 9
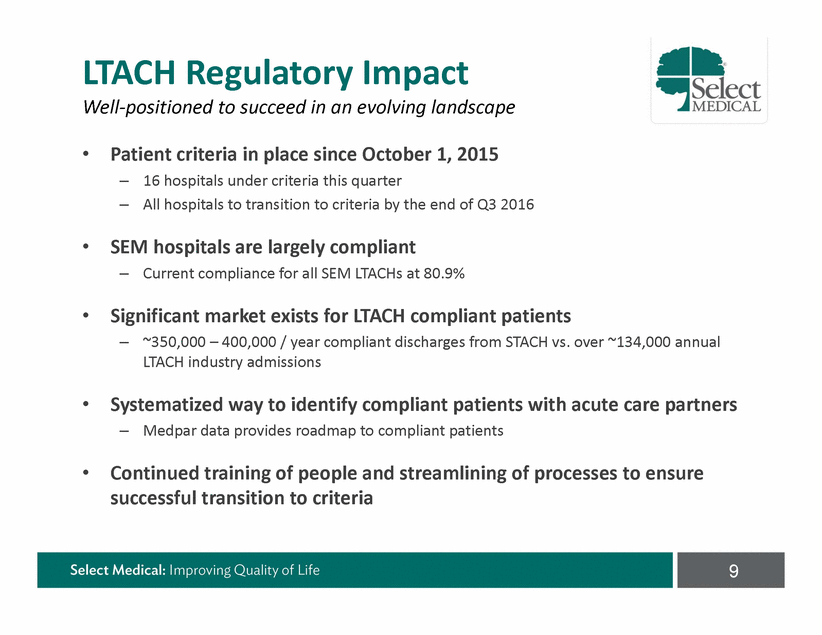
Patient Q4 ’15* Criteria Phase In Q1 ‘16 Q3 ‘16 Q2 ‘16 HOSPITALS BEDS MOVING TO CRITERIA >>> *4Q15 does not include Covington (38 beds) which was closed post 9/30/15 10 HOSPITALS 2015 2016 16 HOSPITALS 724 19 HOSPITALS 823 BEDS 36 1,343 BEDS 37 HOSPITALS 1,567 BEDS
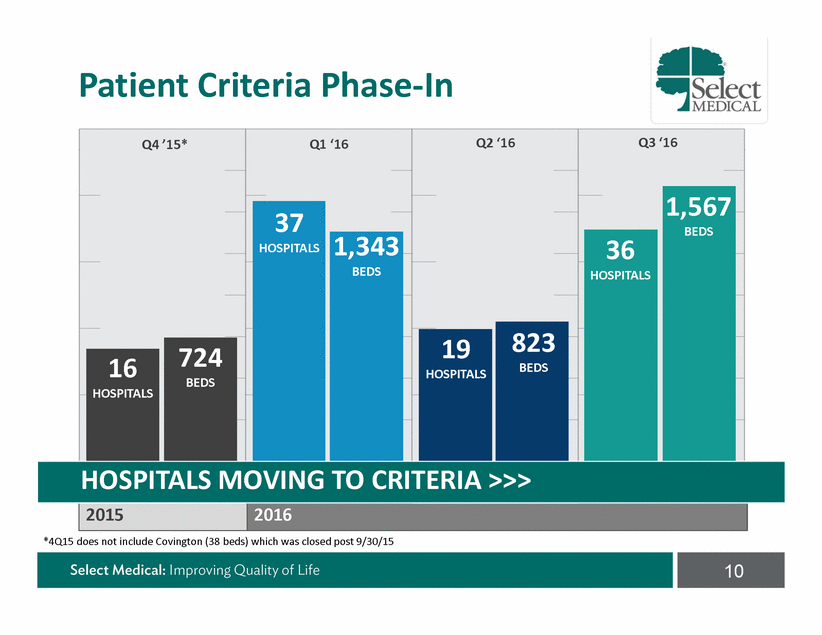
Impact on Select Positives: • • • Degree of segment certainty with phase in Expect higher CMI with compliant patients Hospital in hospital strategy Neutral: • Moratorium – on new hospitals and beds (with exceptions) through September 30, 2017 Negatives: • Potential loss of volume 11
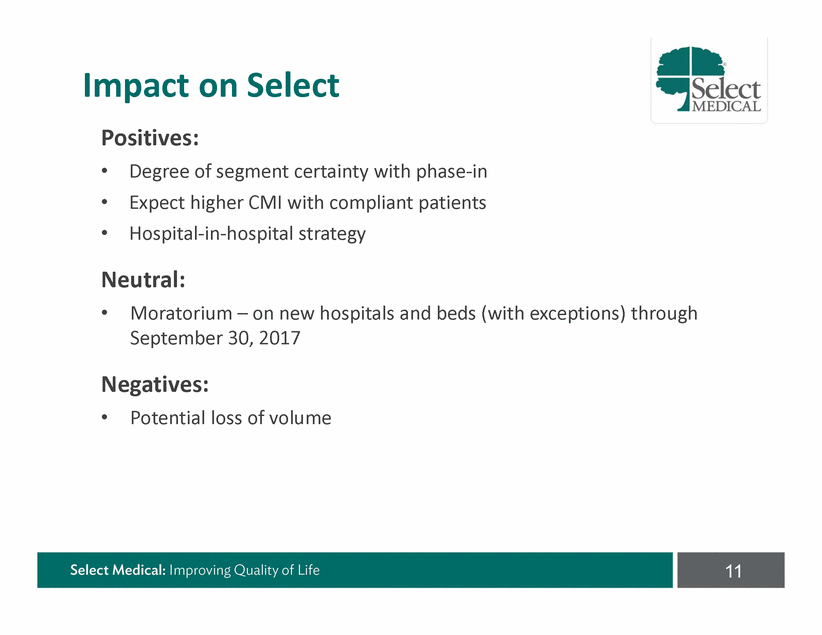
Inpatient Rehab Regulatory Environment • CMS Final Rule FY 2016 effective 10/1/15 Standard Payment Conversion Factor increase 1.8% - Removed several compliance list diagnosis codes from presumptive 12
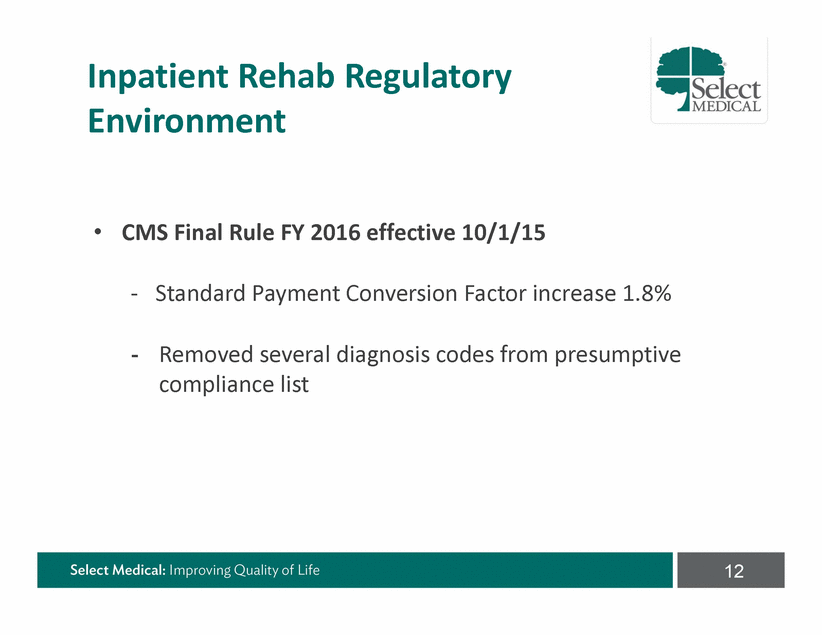
JVs Under Construction Cleveland, OH 60 bed IRF (opening late 2015) Currently managing 3 units with 97 total beds Los Angeles, CA 138 bed IRF (opening early 2016) New Orleans, LA 60 bed IRF (opening 2016) Currently managing 1unit with 29 total beds Cincinnati, OH 60 bed IRF (opening 2016) Currently managing 2 units with 46 total beds 13
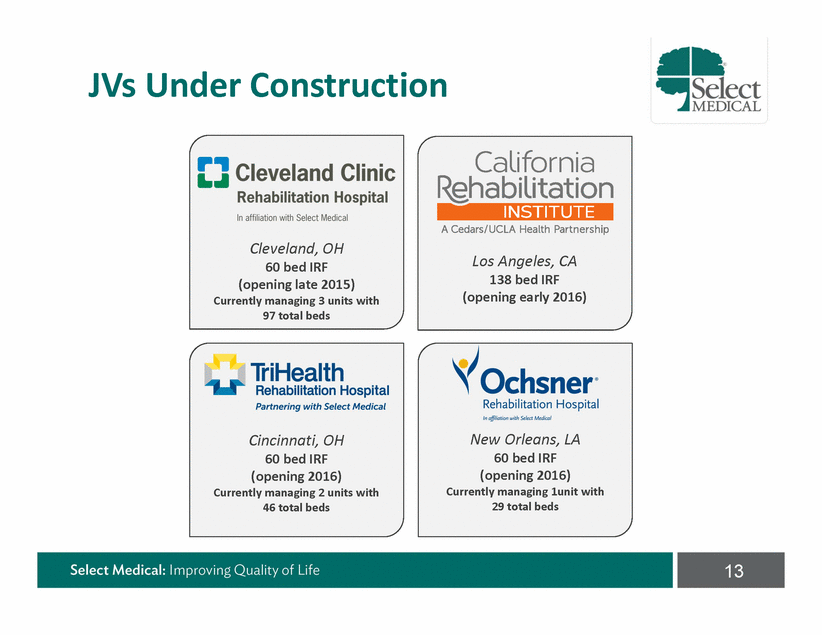
Growing Rehabilitation Network Partner in joint ventures with premier acute care hospitals and systems to build post acute networks •select -J MEDICAL []Cleveland Clini Rehabilitation Hospital .,_ ....Sdect_ Rehabilitation Od hu-ioHealth INSTITUTE FOR REHABIUTATION Select Medical HelenM.Simpson habilitation Partnering with Selt Medical . I InMt".l..uon¥ll'dh SMct l _I EMORY Rehabilitation Hospital REH ...-.,...., .--. HOSPITAL REHABILIWION HOSPITAL•SanAritonio REHABIUThTION HOSPrD\l!Dt enton Select Medical:Improving Quality of Life - Js•elect •JSelect ABI LITATION HONORHEALTH California A Cedars/UCLA Health Partnership INSTITUTE .-Ill Rfl-IA.BIUWION HOSPITAL SSM _IIJI' Rehabilitation Hospital ln partnershlpwithSelectMedlcal Network
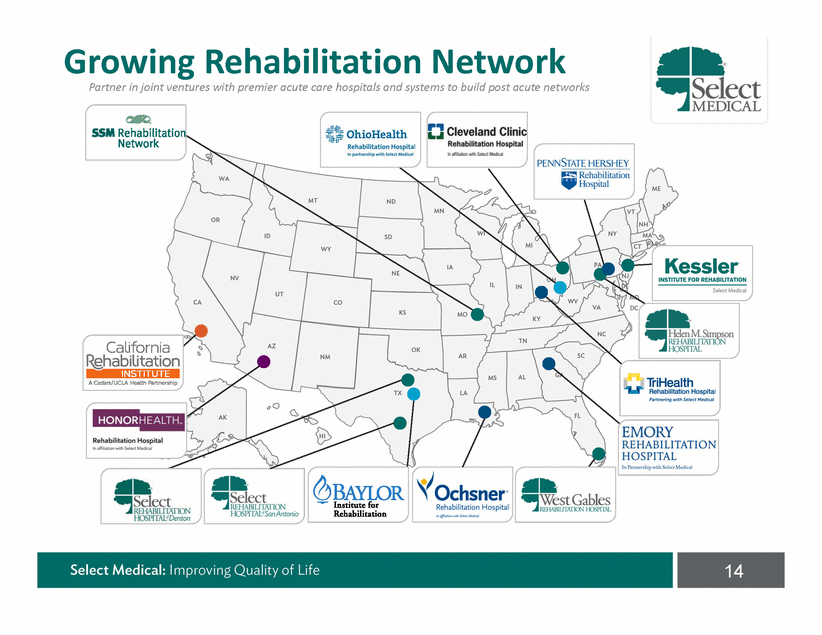
Specialty Hospitals Growth LTACH 2 new LTACHs 1 new LTACH Poised for Begin phase in of LTACH patient criteria 3 new LTACHs 1 new LTACH 1 new LTACH 2014 2015 2016 REHAB 15
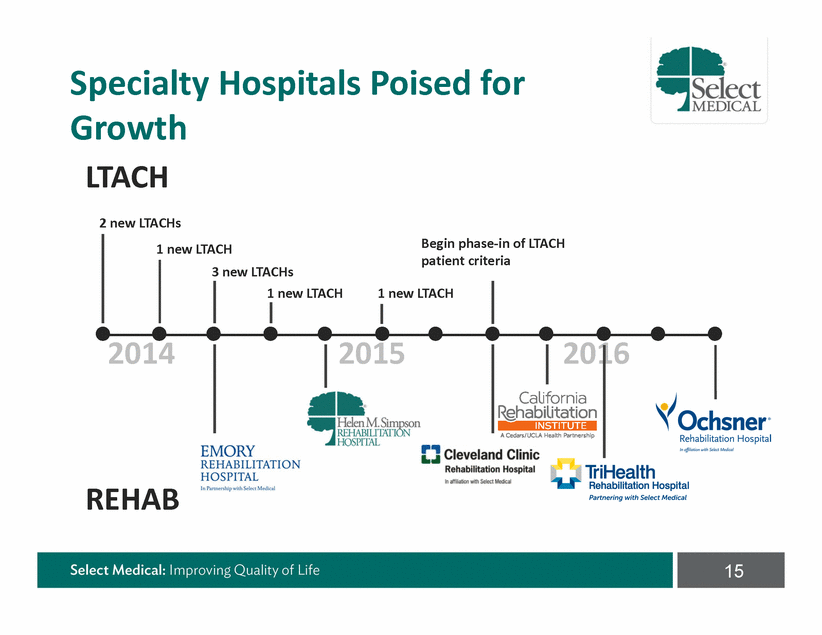
Outpatient Rehab Clinics 16 5,146 4,971 VISITS 4,781 (000’s) 4,567 4,569 4,470 YEAR20102011201220132014LTM Q3 ‘15 REVENUE $101 $103 $103 $104 $103 $103 PER VISIT
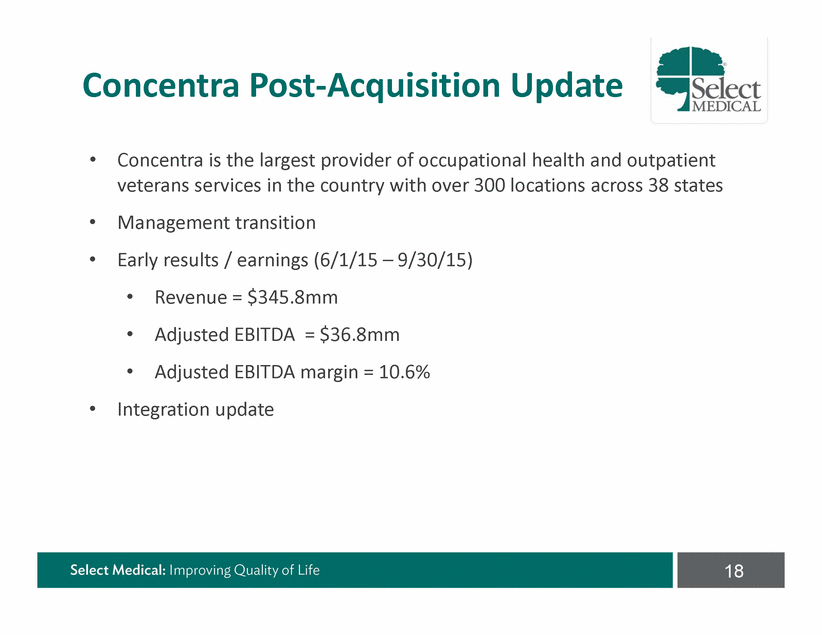
2015 Outpatient Initiatives • Continued growth in workers’ comp business by illustrating historical ROI benefits of working with Select • Payors/Employers • Expand hand therapy services to more clinics • Expand concussion management program • Continued development of start up clinics 17
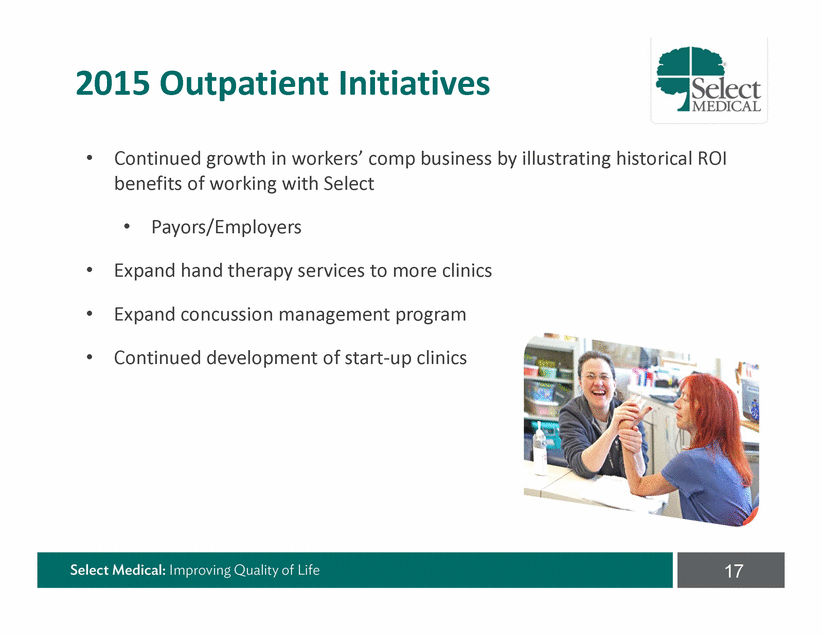
Concentra Post Acquisition Update • Concentra is the largest provider of occupational health and outpatient veterans services in the country with over 300 locations across 38 states Management transition Early results / earnings (6/1/15 – 9/30/15) • • • • • Revenue = $345.8mm Adjusted EBITDA = $36.8mm Adjusted EBITDA margin = 10.6% • Integration update 18
FinancialUpdate

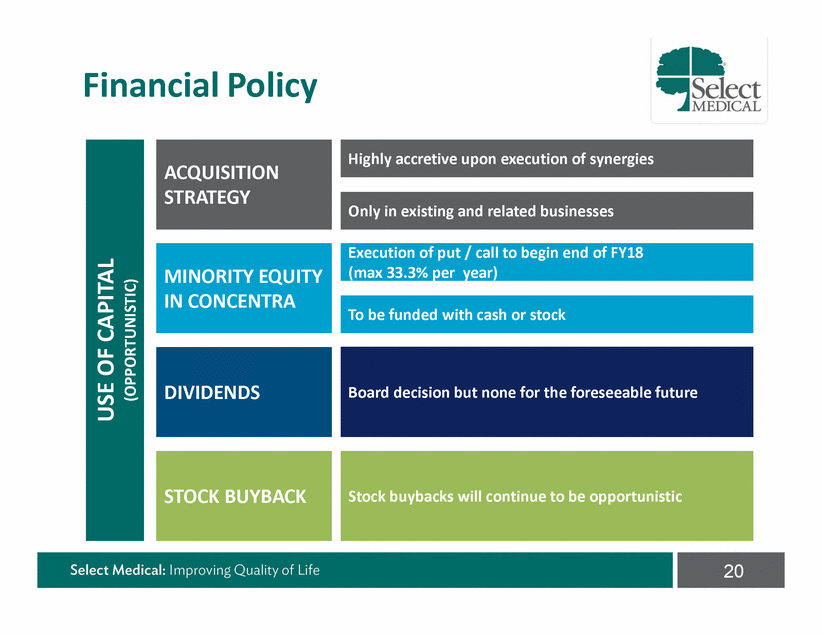
Financial Policy 20 USE OF CAPITAL (OPPORTUNISTIC) Stock buybacks will continue to be opportunistic STOCK BUYBACK Board decision but none for the foreseeable future DIVIDENDS To be funded with cash or stock MINORITY EQUITY IN CONCENTRA Execution of put / call to begin end of FY18 (max 33.3% per year) Only in existing and related businesses ACQUISITION STRATEGY Highly accretive upon execution of synergies
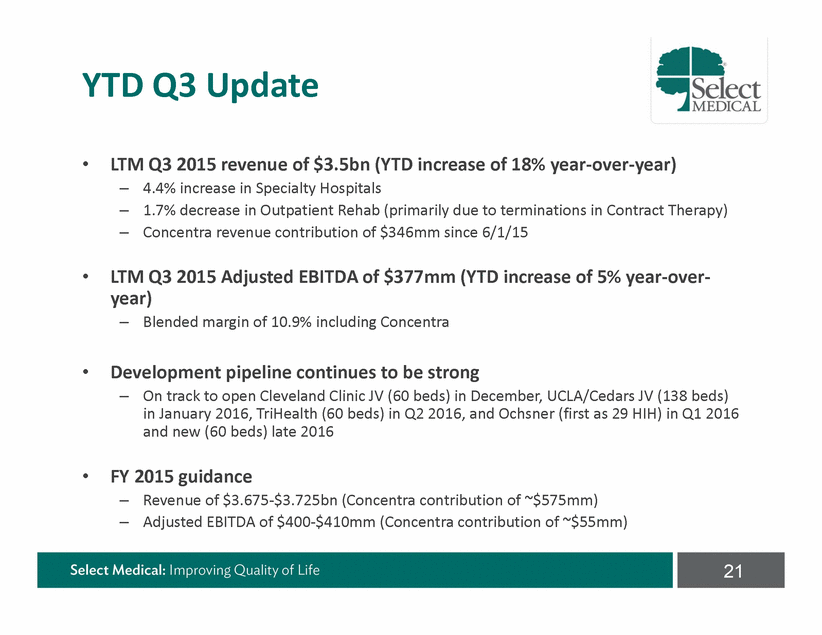
YTD Q3 Update • LTM Q3 2015 revenue of $3.5bn (YTD increase of 18% year over year) – – – 4.4% increase in Specialty Hospitals 1.7% decrease in Outpatient Rehab (primarily due to terminations in Contract Therapy) Concentra revenue contribution of $346mm since 6/1/15 • LTM Q3 2015 Adjusted EBITDA of $377mm (YTD increase of 5% year over year) – Blended margin of 10.9% including Concentra • Development pipeline continues to be strong – On track to open Cleveland Clinic JV (60 beds) in December, UCLA/Cedars JV (138 beds) in January 2016, TriHealth (60 beds) in Q2 2016, and Ochsner (first as 29 HIH) in Q1 2016 and new (60 beds) late 2016 • FY 2015 guidance – – Revenue of $3.675 $3.725bn (Concentra contribution of ~$575mm) Adjusted EBITDA of $400 $410mm (Concentra contribution of ~$55mm) 21
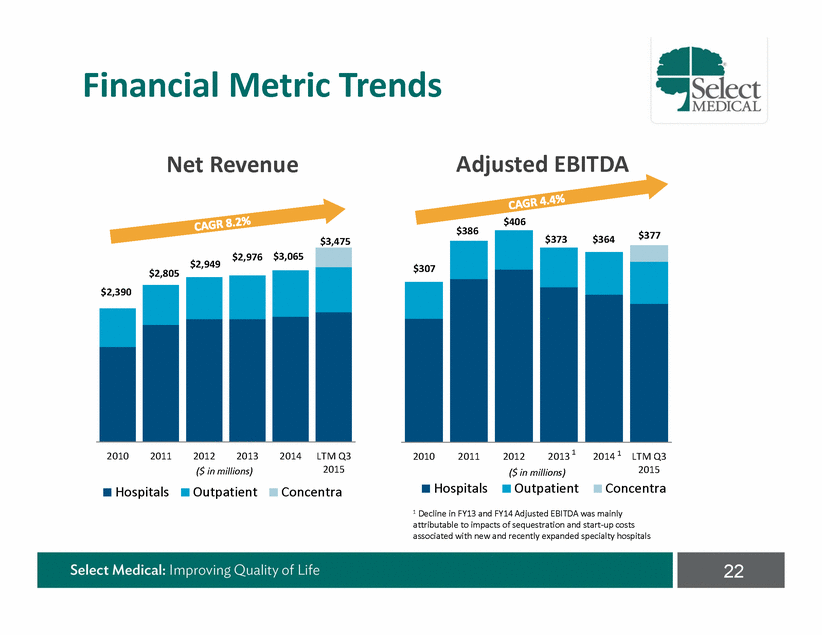
Financial Metric Trends Net Revenue Adjusted EBITDA $406 $386 $377 $373 $364 $3,475 2013 1 2014 1 2010 2011 2012 2013 2014 LTM Q3 2015 2010 2011 2012 LTM Q3 2015 ($ in millions) Outpatient ($ in millions) Hospitals Outpatient Concentra Hospitals Concentra 1 Decline in FY13 and FY14 Adjusted EBITDA was mainly attributable to impacts of sequestration and start up costs associated with new and recently expanded specialty hospitals 22 $2,949$2,976$3,065 $2,390 $2,805 $307
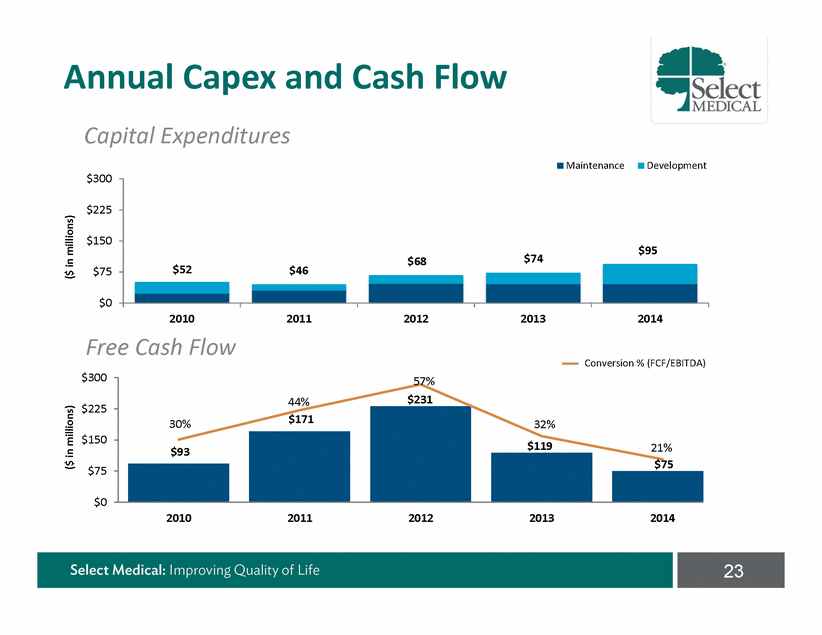
Annual Capex and Capital Expenditures Cash Flow Maintenance Development $300 $225 $150 $74 $68 $75 $0 2010 Cash Flow 2011 2012 2013 2014 Free Conversion % (FCF/EBITDA) $300 $225 $150 $75 $0 2010 2011 2012 2013 2014 23 ($ in millions) ($ in millions) 57% 44%$231 30%$171 32% $11921% $93 $75 $95 $52$46
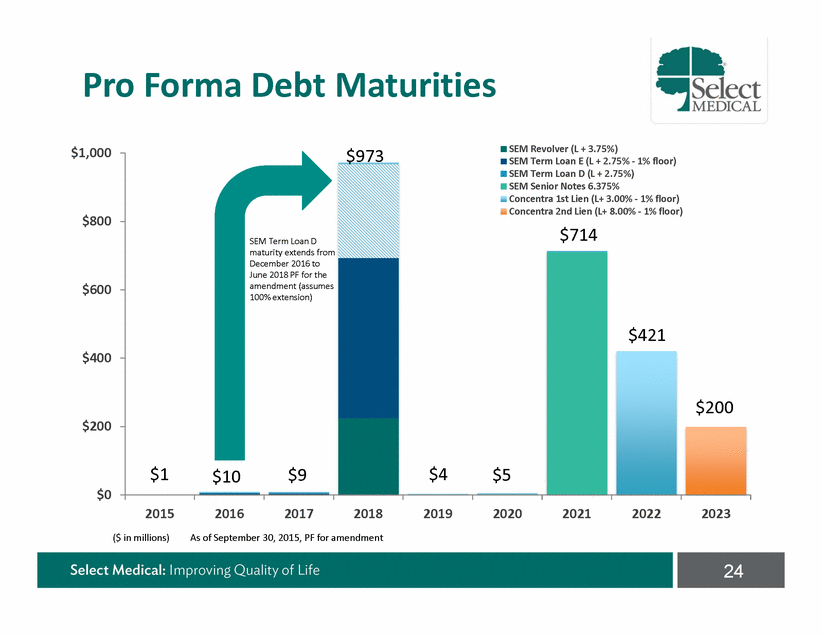
Pro Forma Debt Maturities SEM Revolver (L + 3.75%) $1,000 $973 $800 $600 $400 $200 $0 2015 ($ in millions) 2016 2017 2018 2019 2020 2021 2022 2023 As of September 30, 2015, PF for amendment 24 SEM Term Loan E (L + 2.75% 1% floor) SEM Term Loan D (L + 2.75%) SEM Senior Notes 6.375% Concentra 1st Lien (L+ 3.00% 1% floor) Concentra 2nd Lien (L+ 8.00% 1% floor) SEM Term Loan D$714 maturity extends from December 2016 to June 2018 PF for the amendment (assumes 100% extension) $421 $200 $1$10$9$4$5
Appendix: Additional Materials
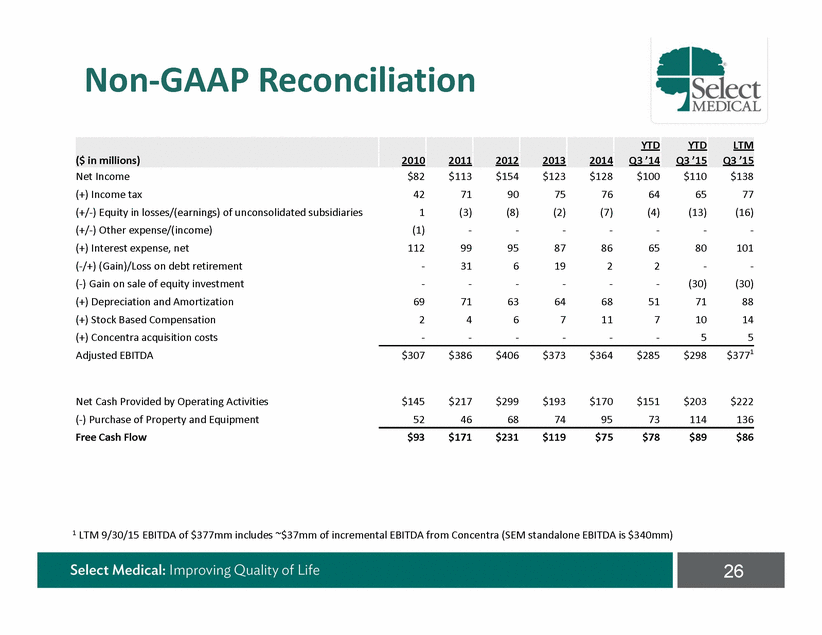
Non GAAP Reconciliation 1 LTM 9/30/15 EBITDA of $377mm includes ~$37mm of incremental EBITDA from Concentra (SEM standalone EBITDA is $340mm) 26 YTD YTD LTM ($ in millions) 2010 2011 2012 2013 2014 Q3 ’14 Q3 ’15 Q3 ’15 Net Income $82 $113 $154 $123 $128 $100 $110 $138 (+) Income tax 42 71 90 75 76 64 65 77 (+/) Equity in losses/(earnings) of unconsolidated subsidiaries 1 (3) (8) (2) (7) (4) (13) (16) (+/) Other expense/(income) (1) (+) Interest expense, net 112 99 95 87 86 65 80 101 (/+) (Gain)/Loss on debt retirement 31 6 19 2 2 () Gain on sale of equity investment (30) (30) (+) Depreciation and Amortization 69 71 63 64 68 51 71 88 (+) Stock Based Compensation 2 4 6 7 11 7 10 14 (+) Concentra acquisition costs Adjusted EBITDA Net Cash Provided by Operating Activities () Purchase of Property and Equipment Free Cash Flow 55 $307$386$406$373$364$285$298$3771 $145$217$299$193$170$151$203$222 524668749573114136 $93$171$231$119$75$78$89$86
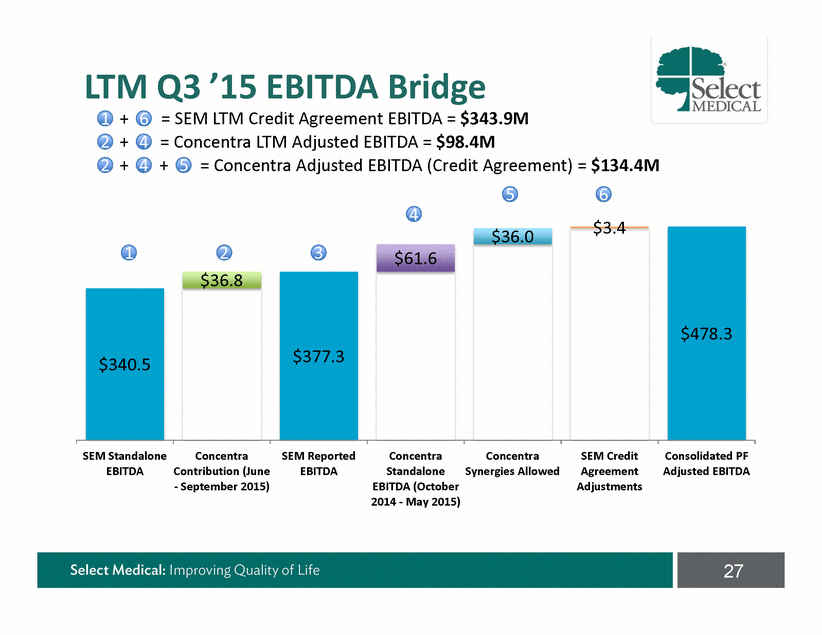
LTM Q3 ’15 EBITDA Bridge = SEM LTM Credit Agreement EBITDA = $343.9M = Concentra LTM Adjusted EBITDA = $98.4M + + + 1 2 2 6 4 4 + = Concentra Adjusted EBITDA (Credit Agreement) = $134.4M 5 5 6 $3.4 4 $36.0 1 2 $36.8 3 $61.6 $478.3 $377.3 $340.5 SEM Standalone EBITDA Concentra Contribution (June September 2015) SEM Reported EBITDA Concentra Standalone EBITDA (October 2014 May 2015) Concentra Synergies Allowed SEM Credit Agreement Adjustments Consolidated PF Adjusted EBITDA 27
selectmedical.com/investor relations/for investors
