Attached files
| file | filename |
|---|---|
| 8-K - 8-K - GUE Liquidation Companies, Inc. | a15-22638_18k.htm |
Exhibit 99.1
FTD Companies, Inc. Investor Presentation November 2015

Forward-Looking Statements and Risk Factors This presentation contains certain forward-looking statements within the meaning of the “safe harbor” provisions of the Private Securities Litigation Reform Act of 1995, as amended, based on our current expectations, estimates and projections about our operations, industry, financial condition, performance, results of operations, and liquidity. Statements containing words such as “may,” “believe,” “anticipate,” “expect,” “intend,” “plan,” “project,” “projections,” “business outlook,” “estimate,” or similar expressions constitute forward-looking statements. These forward-looking statements include, but are not limited to, statements about the Company’s strategies; statements regarding expected synergies and benefits of the Company’s acquisition of Provide Commerce, Inc.; expectations about future business plans, prospective performance and opportunities, including potential acquisitions; future financial performance; revenues; segment metrics; operating expenses; market trends, including those in the markets in which the Company competes; liquidity; cash flows and uses of cash; dividends; capital expenditures; depreciation and amortization; tax payments; foreign currency exchange rates; hedging arrangements; the Company’s ability to repay indebtedness and invest in initiatives; the Company’s products and services; pricing; marketing plans; competition; settlement of legal matters; and the impact of accounting changes and other pronouncements. Potential factors that could affect these forward-looking statements include, among others, the factors disclosed in the Company’s Annual Report on Form 10-K for the year ended December 31, 2014 and the Company’s other filings with the Securities and Exchange Commission (www.sec.gov), including without limitation, information under the captions “Management's Discussion and Analysis of Financial Condition and Results of Operations” and “Risk Factors.” Readers are cautioned not to place undue reliance on these forward-looking statements, which reflect management's analysis only as of the date hereof. Any such forward-looking statements are not guarantees of future performance or results and involve risks and uncertainties that may cause actual performance and results to differ materially from those predicted. Reported results should not be considered an indication of future performance. Except as required by law, we undertake no obligation to publicly release the results of any revision to these forward-looking statements that may be made to reflect events or circumstances after the date hereof or to reflect the occurrence of unanticipated events. FTD reserves all rights to our trademarks, trade names and service marks, regardless of the manner in which we refer to them in this presentation. All other trademarks, trade names and service marks appearing in this presentation are the property of their respective owners. 1
Robert S. Apatoff President, Chief Executive Officer and Director Rob Apatoff is our President and Chief Executive Officer and has served as one of our directors since November 2013. Mr. Apatoff served as President of FTD Group, Inc. from November 2008 to October 2013. He also served as a member of the board of directors of FTD Group, Inc., from November 2004 to August 2008. From August 2003 to May 2008, Mr. Apatoff served as President and Chief Executive Officer of Rand McNally & Company and then as Managing Director of Patriarch Partners, LLC's consumer brands portfolio from May to October 2008, following Patriarch's acquisition of Rand McNally & Company. Prior to that, Mr. Apatoff served as Senior Vice President and Chief Marketing Officer at The Allstate Corporation, and held senior management and marketing positions at Aetna, Inc., L.A. Gear, Inc., Reebok International, Ltd., and Anheuser-Busch, Inc. Mr. Apatoff earned a Bachelor of Arts in communications from DePauw University. Becky A. Sheehan Executive Vice President, Chief Financial Officer Becky Sheehan has been our Executive Vice President, Chief Financial Officer since November 2013. Ms. Sheehan joined FTD Group, Inc. in July 2006 as Executive Vice President, Chief Financial Officer. Prior to joining FTD Group, Inc., she was an Audit Partner with Deloitte and had 19 years of experience in public accounting with both Deloitte and Arthur Andersen. At Deloitte, Ms. Sheehan served as the leader of the Consumer Business and Manufacturing Audit Practice for the Chicago office. Prior to joining Deloitte, Ms. Sheehan was a partner with Arthur Andersen. She is a certified public accountant and received her Bachelor's degree in accounting from Illinois State University. 2

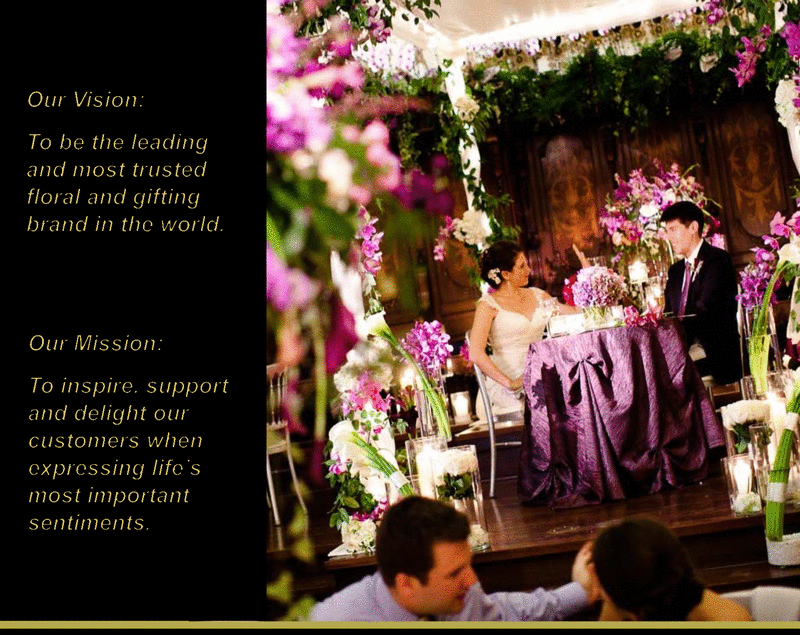
Our Vision: To be the leading and most trusted floral and gifting brand in the world. Our Mission to inspire, support and delight our customers when expressing life's most important sentiments.
FTD Companies, Inc. Investment Highlights Premier Brands: FTD, Interflora, ProFlowers, Shari’s Berries and Personal Creations Strong Financial Performance and Cash Flows Innovative and Differentiated Products and Services Differentiation Through “Best-In-Class” Partner Brands Growth Opportunities – Organic and Inorganic Experienced Management Team 4
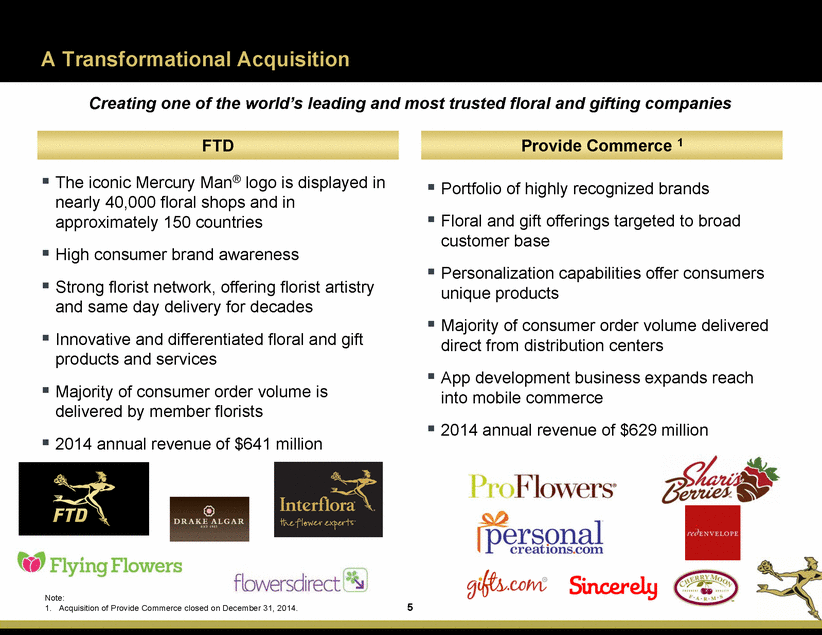
A Transformational Acquisition Creating one of the world’s leading and most trusted floral and gifting companies Provide Commerce 1 FTD The iconic Mercury Man® logo is displayed in nearly 40,000 floral shops and in approximately 150 countries High consumer brand awareness Strong florist network, offering florist artistry and same day delivery for decades Innovative and differentiated floral and gift products and services Majority of consumer order volume is delivered by member florists 2014 annual revenue of $641 million Portfolio of highly recognized brands Floral and gift offerings targeted to broad customer base Personalization capabilities offer consumers unique products Majority of consumer order volume delivered direct from distribution centers App development business expands reach into mobile commerce 2014 annual revenue of $629 million Note: 1. Acquisition of Provide Commerce closed on December 31, 2014. 5
FTD Companies, Inc.
Significant Expected Cost Synergies We expect to achieve $25 million in cost synergies over a 3 year period Procurement & Fulfillment: Reduce procurement, packaging and freight costs via vendor and SKU rationalization and renegotiation; transition ProFlowers florist delivered order volume to FTD; optimize fulfillment utilizing a combination of the FTD florist network, third-party vendors and company managed distribution centers. Other G&A: Eliminate redundancies in corporate overhead; renegotiate vendor rates and eliminate redundant spend. Marketing: Renegotiate vendor rates and eliminate redundant spend. Optimize marketing spend across brands and channels. Technology: Renegotiate vendor rates and eliminate redundant spend. 7
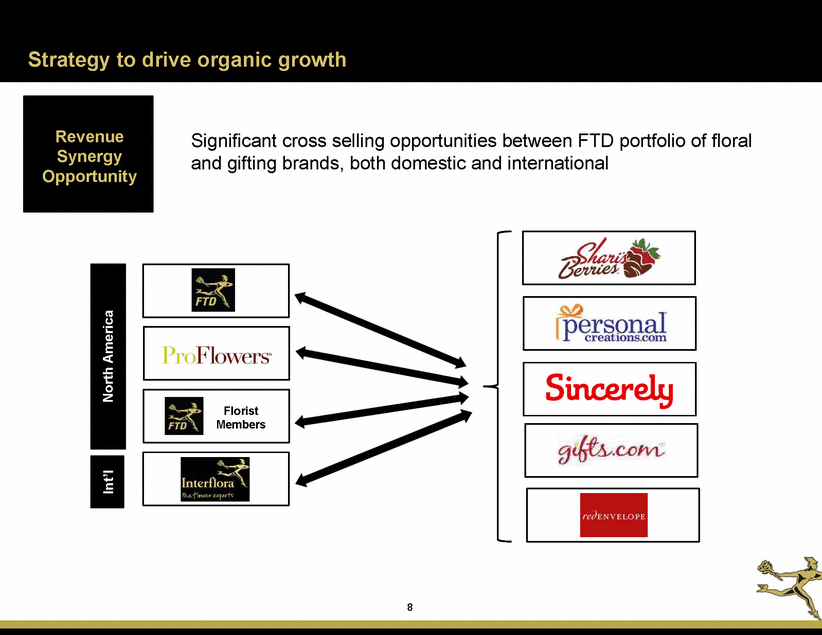
Strategy to drive organic growth Significant cross selling opportunities between FTD portfolio of floral and gifting brands, both domestic and international Florist Members 8 Int’l North America Revenue Synergy Opportunity
Strategy to drive organic growth (cont’d) • Continue to innovate the floral space to gain differentiation and fight commoditization - - - - Vera Wang Better Homes & Gardens College Roses Luxury - - - - - Good, Better, Best, Exquisite (GBBE) Direct ship to customers Gourmet dipped food Expansion of sympathy floral Best in class partnerships • Position complementary brands to reach segments broader consumer • $25MM cost synergies expected as a result of the acquisition of Provide Commerce Leading premier brands and innovative products to drive top line growth and profitability New portfolio cross selling and multi-gifting, bundling strategy to help secure larger share of customer wallet Drive efficiencies to improve margins and additional value for our FTD member florists • • • 9 Focus on Profitable Growth Leading Innovation
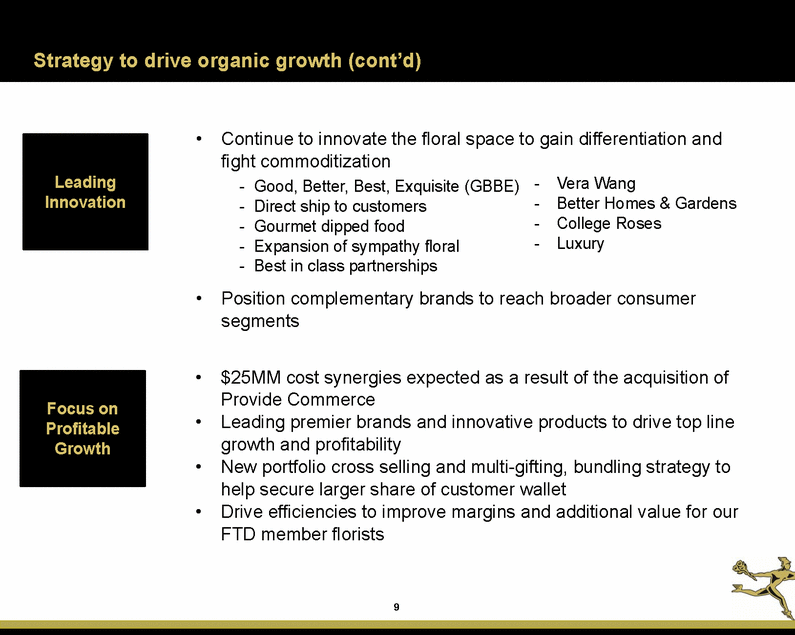
Large Floral & Gift Industries provide opportunity for growth Highly fragmented, competitive industries give FTD a key opportunity for differentiation U.S. Floral U.K. Floral U.S. Floral Industry - $27 billion industry 1 (including flowers, plants and related goods sold at retail florists, mass marketers and other outlets) U.K. Floral Industry: £2.2 billion industry 5 (cut flowers and house plants) with Interflora having highest unaided brand awareness for floral delivery U.S. Specialty Food & Gift Florists $7B in retail sales 2 14k retail florists 2 Retail Specialty Food market - $70 billion sales 6 Purchases of sweets and personalized items as gifts - $25 billion 7 Garden Centers & all other $9B in retail sales Supermarket / Mass Markets $7B in retail sales 3 Online $4B in retail sales 4 Notes: 1. 2. 3. 4. 5. 6. 7. Source: U.S. Department of Commerce (2014) Source: U.S. Census Bureau (2012) Source: Superfloral retailing website (2007) Source: Forrester (2008) Source: Mintel, a market research company (2013 study) Source: Specialty Food Magazine (2013) Source: Third party research (2012) 10
FTD Operates Complementary Businesses CONSUMER FLORIST CONSUMER FLORIST CONSUMER BUSINESSES FLORIST BUSINESSES Online-oriented direct marketer of floral and gift products, with high consumer brand recognition Large florist network fulfills the majority of FTD and Interflora consumer orders U.S. services include: U.K. services include: FTD and Interflora products delivered by member florists or third parties in an elegant, award winning gift box Membership / use of brand Order related Online services Publications/Advertising programs Systems access and support Credit card processing Flowers All Hours Membership / brand licensing Order related Hosting websites FTD and Interflora benefit from low-inventory and negative working capital business model, with consumers paying for their orders in advance of delivery U.K. products include: ProFlowers, Shari’s Berries and Personal Creations currently delivered through proprietary distribution network or third parties Hard goods (containers, vases, among other items) Fresh flowers U.S. products include: Point of sale systems Hard goods (containers, vases, among other items) Fresh flowers We also offer business-to-business products and services to other companies looking for floral and gifting solutions 11 INTERNATIONAL DOMESTIC

Widely-Recognized Brands in FTD, Interflora and the Iconic Mercury Man FTD, a true American iconic brand with over a 100 year history, and Interflora, an iconic brand with a 90 year history in the U.K FTD has high brand awareness in the floral industry and among consumers Interflora has the highest unaided brand awareness compared to its floral industry competitors 1 The iconic Mercury Man logo, one of the most recognized global floral symbols worldwide, is in nearly 40,000 floral shops in approximately 150 countries Note: 1. Source: Interflora Brand Awareness. Aurora Market Research (2013) 12

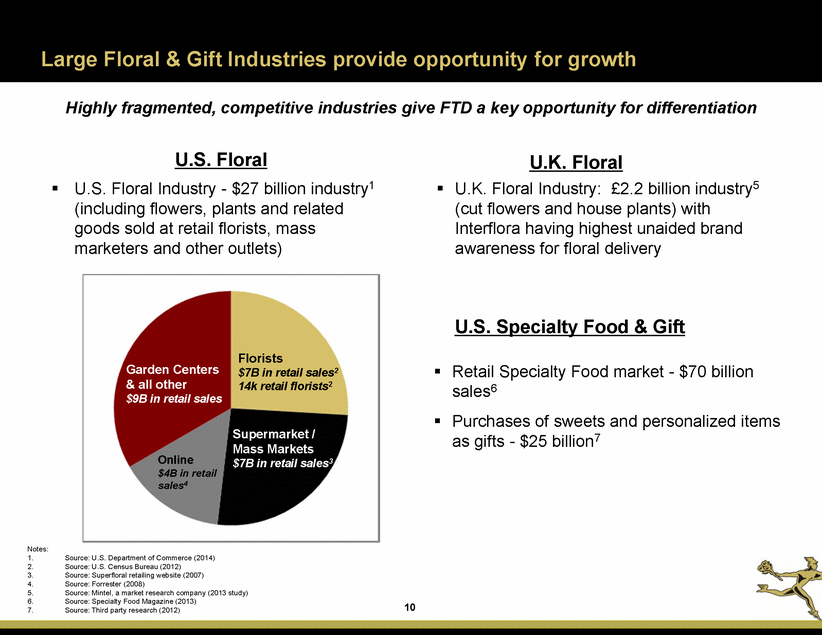
First mover and continued leader in direct ship floral, dipped berries and treats 13
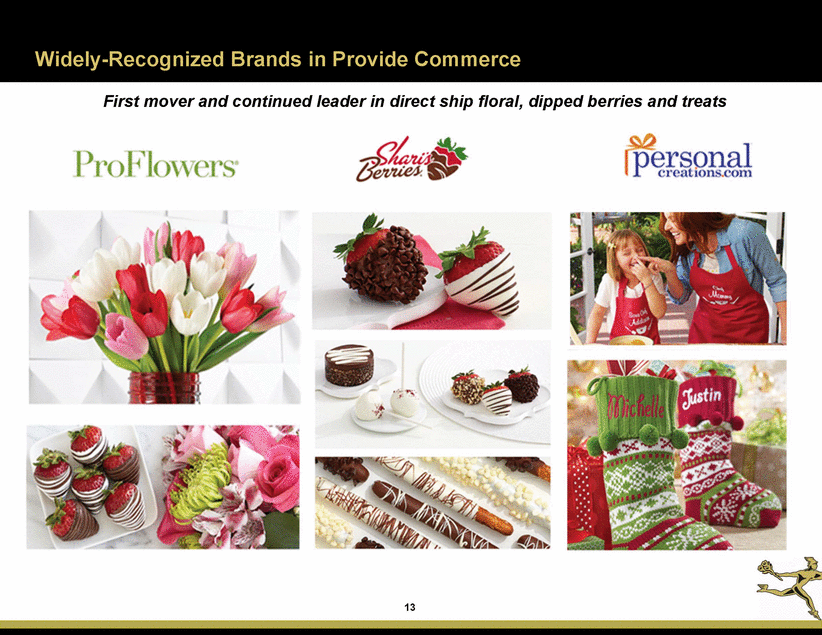
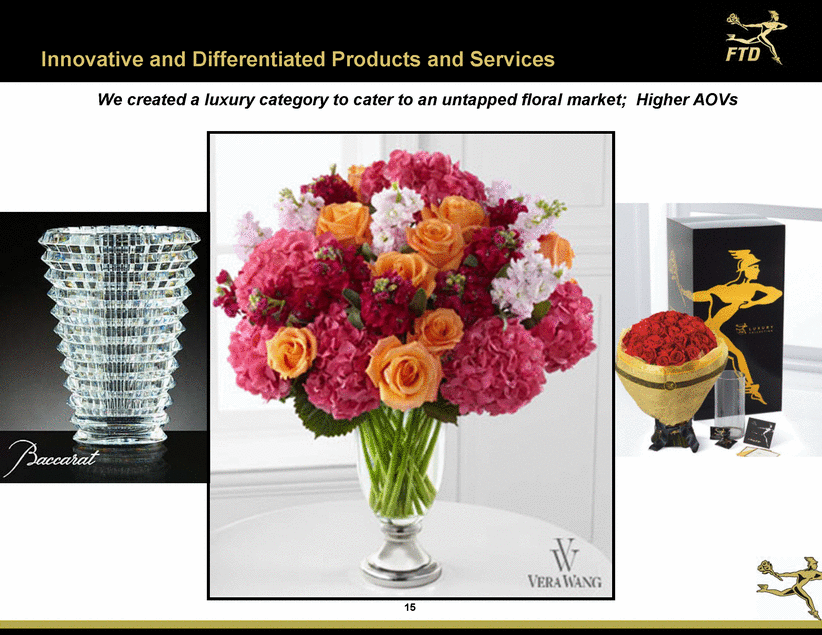
Innovative and Differentiated Products and Services Exclusive partnerships Created in collaboration with FTD and designers at Vera Wang and Better Homes and Gardens 14
We created a luxury category to cater to an untapped floral market; Higher AOVs 15
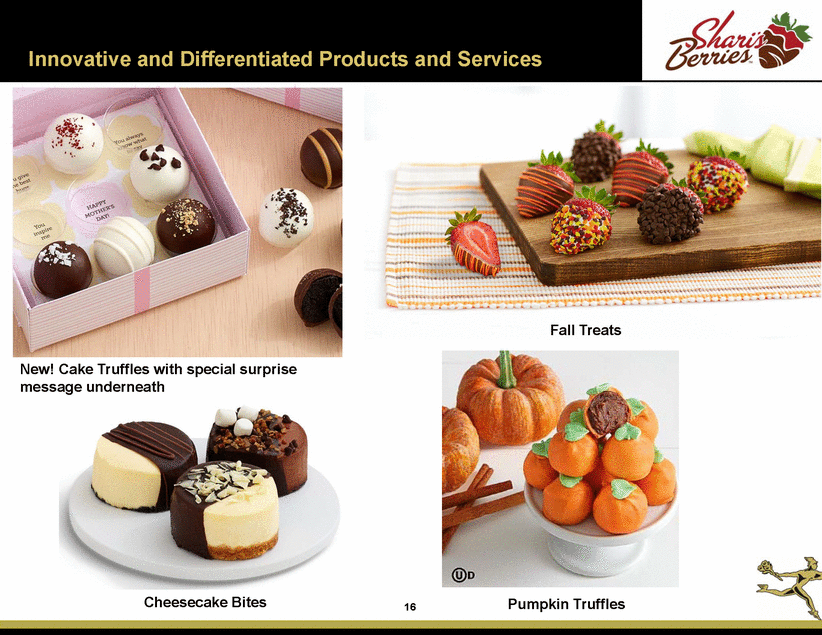
Innovative and Differentiated Products and Services Fall Treats New! Cake Truffles with special surprise message underneath Cheesecake Bites Pumpkin Truffles 16
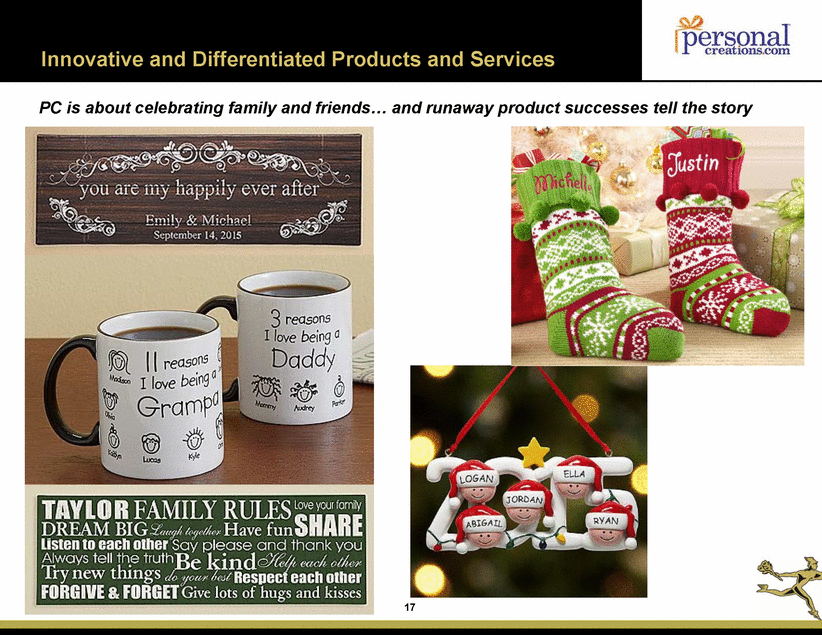
PC is about celebrating family and friends... and runaway product successes tell the story
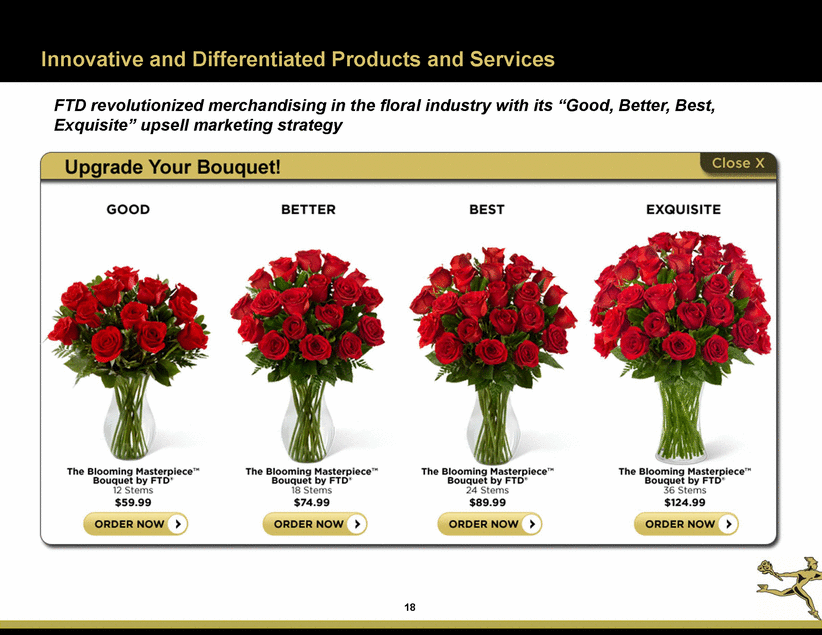
Innovative and Differentiated Products and Services FTD revolutionized merchandising in the floral industry with its “Good, Better, Best, Exquisite” upsell marketing strategy 18
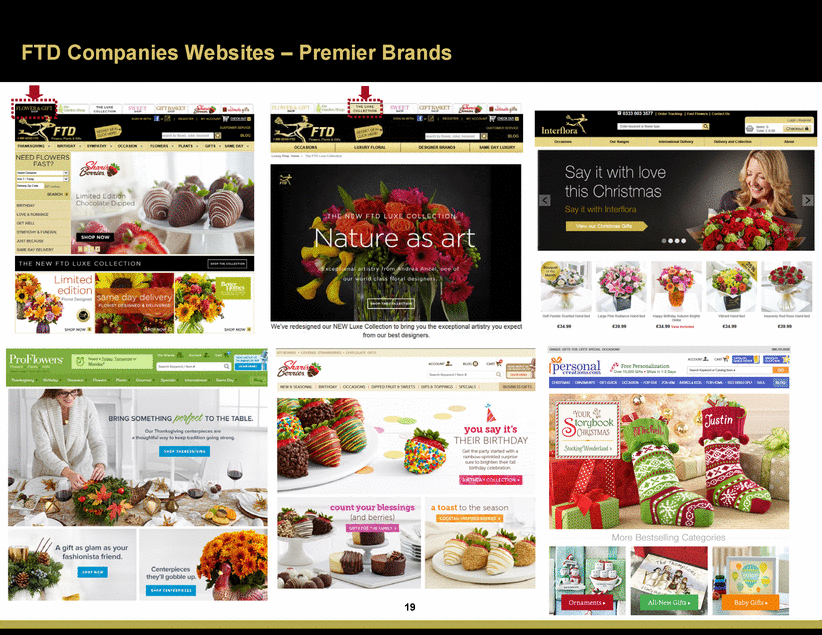
FTD Companies Websites – Premier Brands 19
Orrefors FINE CRYSTAL SINCE 1898 Crabtree &Evelyn· LONDON VERAWANG DEPUIS 1812 SINCE 4x CHAMPAGNE GODIVA CHOCOLATIER Better H9.ID£§. MASTER SWISS CHOCOLATIER SINCE 1845 Trademarks are registered and unregistered trademarks of their respective owners. 20 FLOWERS by FTD"

Differentiation Through “Best-In-Class” Partnerships 21 Trademarks are registered and unregistered trademarks of their respective owners. Supermarkets B to B Wedding Airlines Sympathy
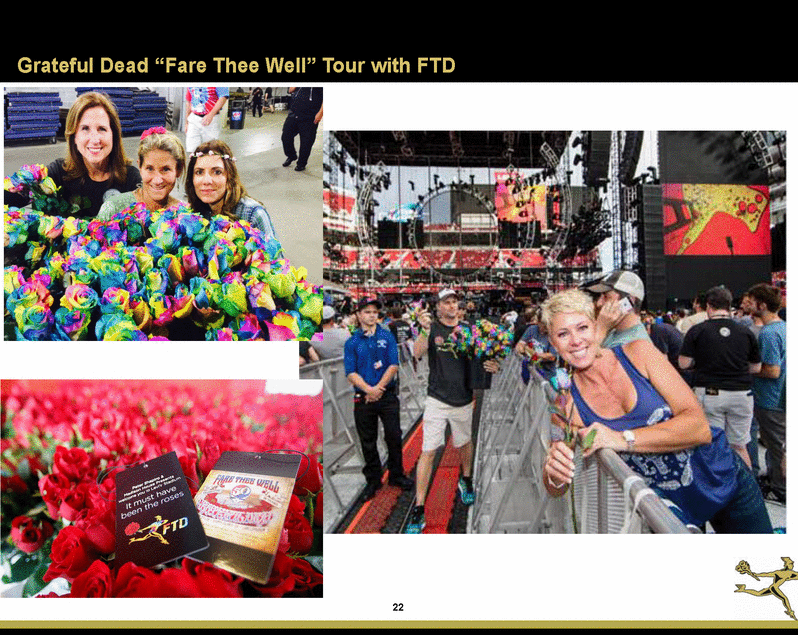
Grateful Dead “Fare Thee Well” Tour with FTD
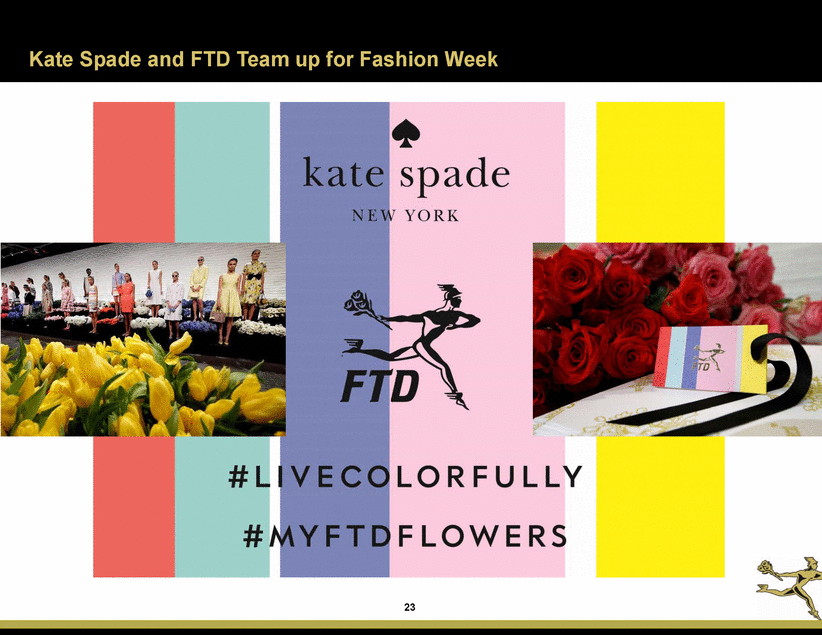
Kate Spade and FTD Team up for Fashion Week
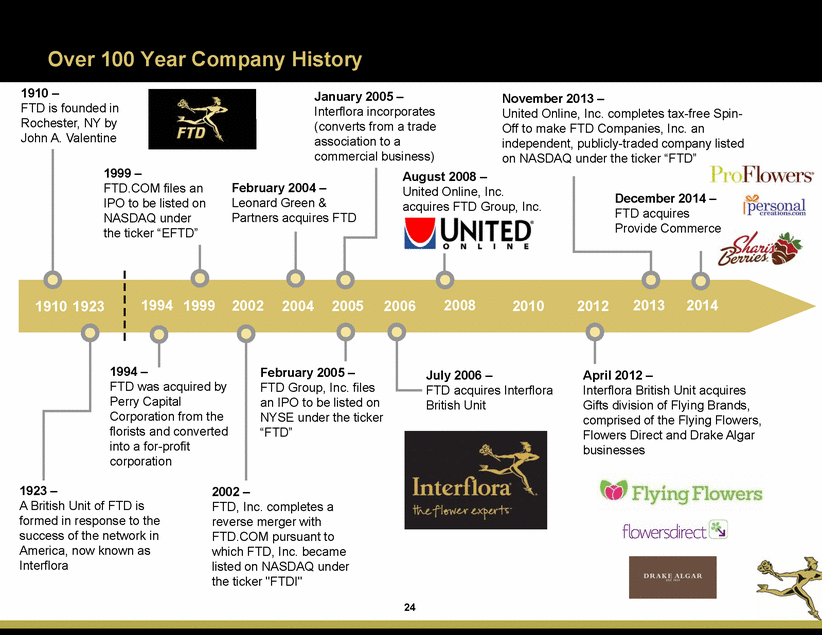
Over 100 Year Company History 1910 – FTD is founded in Rochester, NY by John A. Valentine January 2005 – Interflora incorporates (converts from a trade association to a commercial business) November 2013 – United Online, Inc. completes tax-free Spin-Off to make FTD Companies, Inc. an independent, publicly-traded company listed on NASDAQ under the ticker “FTD” 1999 – FTD.COM files an IPO to be listed on NASDAQ under the ticker “EFTD” August 2008 – United Online, Inc. acquires FTD Group, Inc. February 2004 – Leonard Green & Partners acquires FTD December 2014 – FTD acquires Provide Commerce 1994 1999 2002 2004 2005 2006 2008 2010 2012 2013 2014 1910 1923 1994 – February 2005 – FTD Group, Inc. files an IPO to be listed on NYSE under the ticker “FTD” July 2006 – FTD acquires Interflora British Unit April 2012 – Interflora British Unit acquires Gifts division of Flying Brands, comprised of the Flying Flowers, Flowers Direct and Drake Algar businesses FTD was acquired by Perry Capital Corporation from the florists and converted into a for-profit corporation 1923 – A British Unit of FTD is formed in response to the success of the network in America, now known as Interflora 2002 – FTD, Inc. completes a reverse merger with FTD.COM pursuant to which FTD, Inc. became listed on NASDAQ under the ticker "FTDI" 24
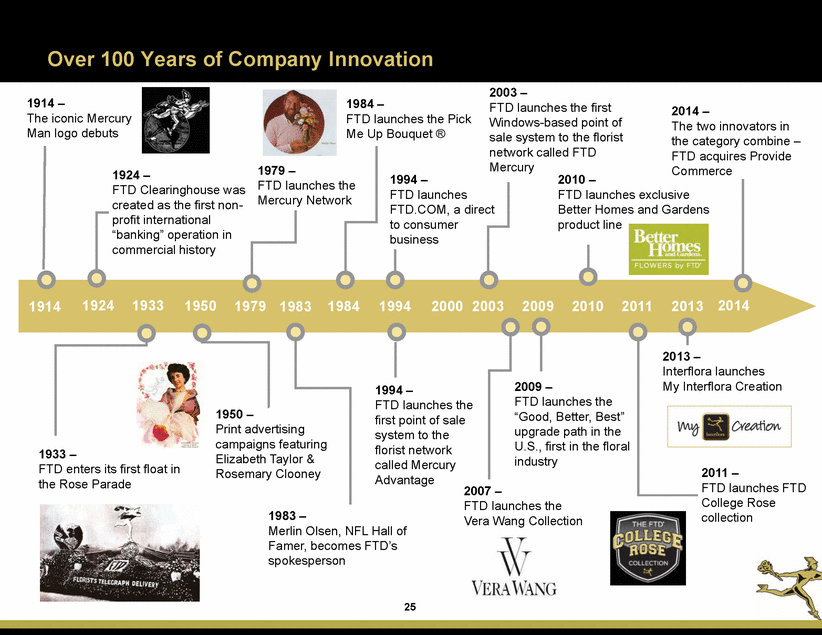
Over 100 Years of Company Innovation 2003 – FTD launches the first Windows-based point of sale system to the florist network called FTD Mercury 1914 – The iconic Mercury Man logo debuts 1984 – FTD launches the Pick Me Up Bouquet ® 2014 – The two innovators in the category combine – FTD acquires Provide Commerce 1979 – FTD launches the Mercury Network 1924 – FTD Clearinghouse was created as the first non-profit international “banking” operation in commercial history 1994 – FTD launches 2010 – FTD launches exclusive Better Homes and Gardens product line FTD.COM, a direct to consumer business 1924 1933 1950 1979 1984 1994 2000 2003 2009 2010 2011 2013 2014 1914 1983 2013 – Interflora launches My Interflora Creation 2009 – FTD launches the “Good, Better, Best” upgrade path in the U.S., first in the floral industry 1994 – FTD launches the first point of sale system to the florist network called Mercury 1950 – Print advertising campaigns featuring Elizabeth Taylor & Rosemary Clooney 1933 – FTD enters its first float in the Rose Parade 2011 – FTD launches FTD College Rose collection Advantage 2007 – FTD launches the Vera Wang Collection 1983 – Merlin Olsen, NFL Hall of Famer, becomes FTD’s spokesperson 25
FTD Financial Information 26
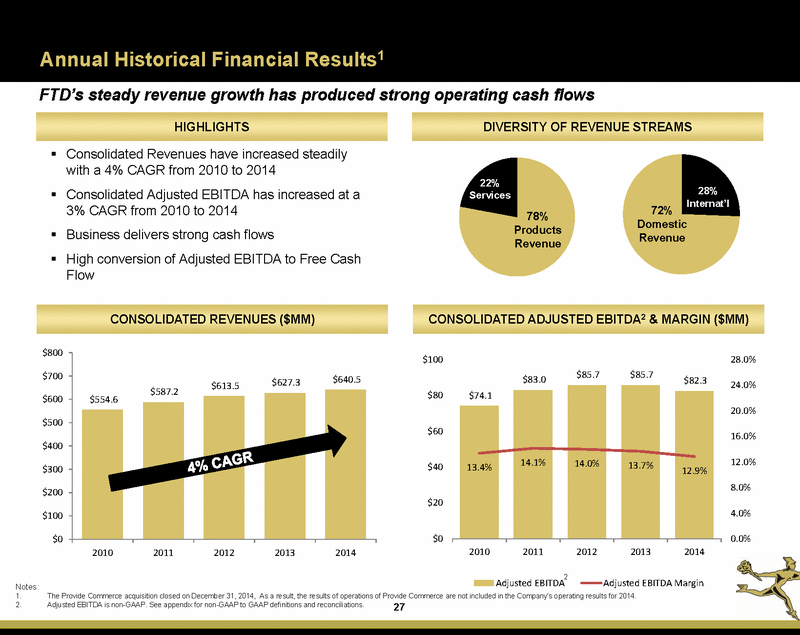
Annual Historical Financial Results 1 FTD’s steady revenue growth has produced strong operating cash flows HIGHLIGHTS DIVERSITY OF REVENUE STREAMS Consolidated Revenues have increased steadily with a 4% CAGR from 2010 to 2014 Consolidated Adjusted EBITDA has increased at a 3% CAGR from 2010 to 2014 Business delivers strong cash flows High conversion of Adjusted EBITDA to Free Cash Flow 22% Services 28% Internat’l 72% 78% Products Revenue Domestic Revenue CONSOLIDATED REVENUES ($MM) CONSOLIDATED ADJUSTED EBITDA 2 & MARGIN ($MM) $800 $100 28.0% $85.7 $85.7 $700 $83.0 $82.3 $627.3 $613.5 24.0% $587.2 $80 $600 $554.6 20.0% $500 $60 16.0% $400 12.0% $40 $300 8.0% $200 $20 4.0% $100 $0 $0 0.0% 2010 2011 2012 2013 2014 2010 2011 2012 2013 2014 2 Adjusted EBITDA Adjusted EBITDA Margin Notes: 1. 2. The Provide Commerce acquisition closed on December 31, 2014, As a result, the results of operations of Provide Commerce are not included in the Company’s operating results for 2014. Adjusted EBITDA is non-GAAP. See appendix for non-GAAP to GAAP definitions and reconciliations. 27 14.0% 13.7% $74.1 14.1% 12.9% 13.4% $640.5
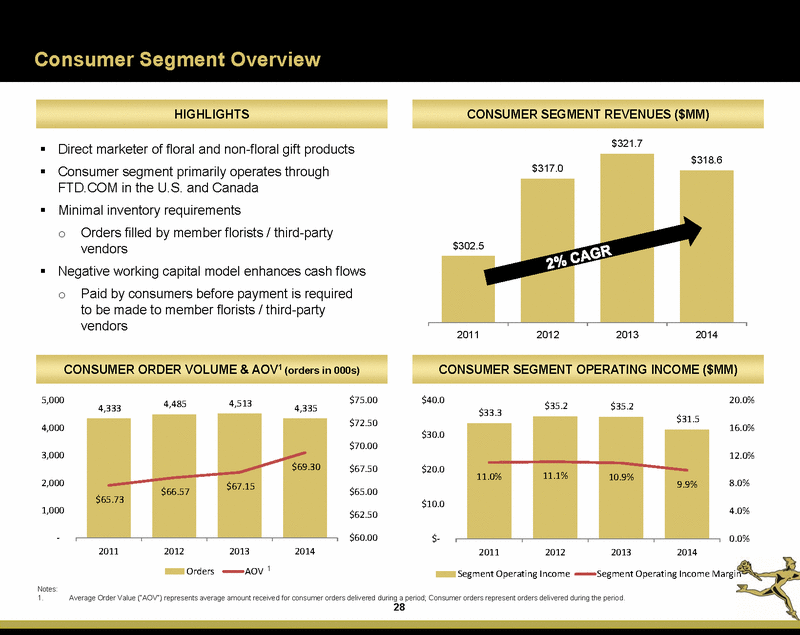
Consumer Segment Overview HIGHLIGHTS CONSUMER SEGMENT REVENUES ($MM) $321.7 Direct marketer of floral and non-floral gift products Consumer segment primarily operates through FTD.COM in the U.S. and Canada Minimal inventory requirements Orders filled by member florists / third-party vendors Negative working capital model enhances cash flows o Paid by consumers before payment is required to be made to member florists / third-party vendors o 2011 2012 2013 2014 CONSUMER ORDER VOLUME & AOV1 (orders in 000s) CONSUMER SEGMENT OPERATING INCOME ($MM) 5,000 $75.00 $40.0 20.0% 4,513 4,485 $35.2 $35.2 4,333 4,335 $33.3 $72.50 4,000 16.0% $30.0 $70.00 3,000 12.0% $67.50 $20.0 2,000 8.0% $65.00 $10.0 1,000 4.0% $62.50 - $60.00 $- 0.0% 2011 2012 2013 AOV 1 2014 2011 2012 2013 2014 Orders Segment Operating Income Segment Operating Income Margin Notes: 1. Average Order Value (“AOV”) represents average amount received for consumer orders delivered during a period; Consumer orders represent orders delivered during the period. 28 11.1% 10.9% $31.5 11.0% 9.9% $66.57 $67.15 $65.73 $69.30 $317.0 $318.6 $302.5
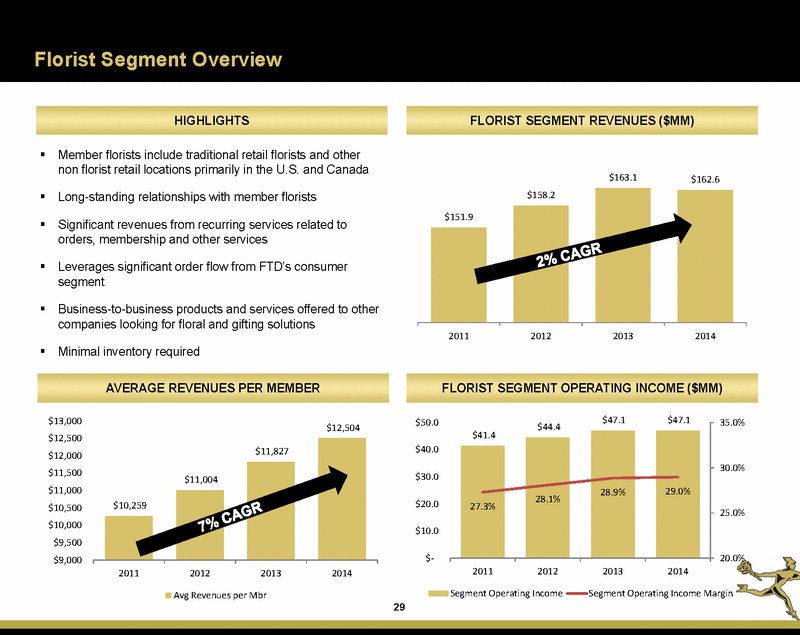
Florist Segment Overview HIGHLIGHTS FLORIST SEGMENT REVENUES ($MM) Member florists include traditional retail florists and other non florist retail locations primarily in the U.S. and Canada $163.1 $162.6 Long-standing relationships with member florists Significant revenues from recurring services related to orders, membership and other services Leverages significant order flow from FTD’s consumer segment Business-to-business products and services offered to other companies looking for floral and gifting solutions 2011 2012 2013 2014 Minimal inventory required AVERAGE REVENUES PER MEMBER FLORIST SEGMENT OPERATING INCOME ($MM) $47.1 $47.1 $13,000 $12,500 $12,000 $11,500 $11,000 $10,500 $10,000 $9,500 $9,000 $50.0 35.0% $44.4 $12,504 $40.0 30.0% $30.0 $20.0 25.0% $10.0 $- 20.0% 2011 2012 2013 2014 2011 2012 2013 2014 Segment Operating Income Segment Operating Income Margin Avg Revenues per Mbr 29 $11,827 $11,004 $10,259 $41.4 28.9% 29.0% 28.1% 27.3% $158.2 $151.9
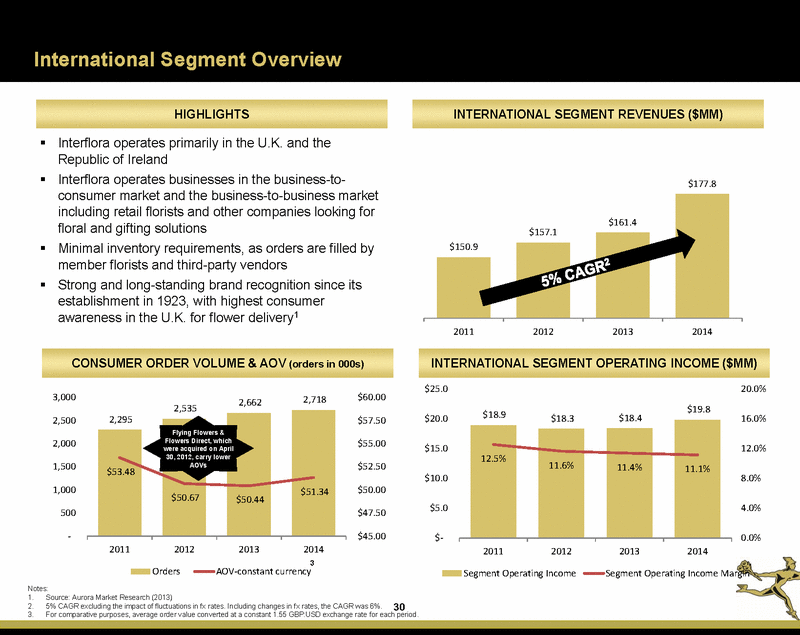
International Segment Overview HIGHLIGHTS INTERNATIONAL SEGMENT REVENUES ($MM) Interflora operates primarily in the U.K. and the Republic of Ireland Interflora operates businesses in the business-to-consumer market and the business-to-business market including retail florists and other companies looking for floral and gifting solutions Minimal inventory requirements, as orders are filled by member florists and third-party vendors Strong and long-standing brand recognition since its establishment in 1923, with highest consumer awareness in the U.K. for flower delivery 1 $177.8 2011 2012 2013 2014 CONSUMER ORDER VOLUME & AOV (orders in 000s) INTERNATIONAL SEGMENT OPERATING INCOME ($MM) $25.0 20.0% 3,000 $60.00 2,718 2,662 2,535 $19.8 $18.9 $18.4 $20.0 $18.3 16.0% 2,295 2,500 $57.50 Flowers & Direct, which 2,000 $55.00 $15.0 12.0% carry lower 1,500 $52.50 $10.0 8.0% 1,000 $50.00 $5.0 4.0% 500 $47.50 - $45.00 $- 0.0% 2011 2012 2013 2014 2011 2012 2013 2014 3 AOV-constant currency Orders Segment Operating Income Segment Operating Income Margin Notes: 1. 2. 3. Source: Aurora Market Research (2013) 5% CAGR excluding the impact of fluctuations in fx rates. Including changes in fx rates, the CAGR was 6%. 30 For comparative purposes, average order value converted at a constant 1.55 GBP: USD exchange rate for each period. 11.1% 12.5% 11.6% 11.4% ril $50.44 $51.34 Flying Flowers were acquired 30, 2012, AOVs $50.67 on Ap $53.48 $157.1$161.4 $150.9
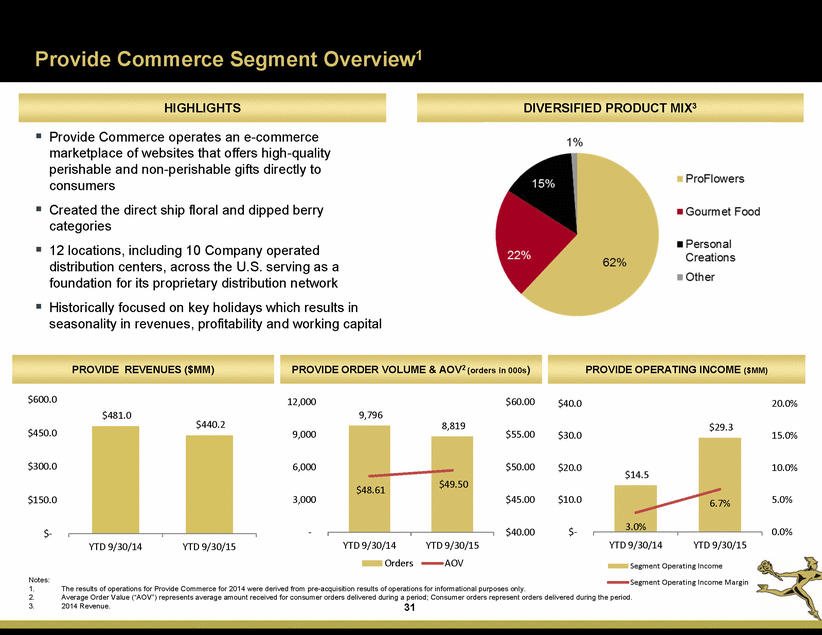
Provide Commerce Segment Overview 1 DIVERSIFIED PRODUCT MIX 3 HIGHLIGHTS Provide Commerce operates an e-commerce marketplace of websites that offers high-quality perishable and non-perishable gifts directly to consumers Created the direct ship floral and dipped berry categories 12 locations, including 10 Company operated distribution centers, across the U.S. serving as a foundation for its proprietary distribution network Historically focused on key holidays which results in seasonality in revenues, profitability and working capital PROVIDE ORDER VOLUME & AOV 2 (orders in 000s) PROVIDE REVENUES ($MM) PROVIDE OPERATING INCOME ($MM) $600.0 12,000 $60.00 $40.0 20.0% $481.0 9,796 $440.2 8,819 $29.3 $450.0 9,000 $55.00 $30.0 15.0% $300.0 6,000 $50.00 $20.0 10.0% $150.0 3,000 $45.00 $10.0 5.0% $- 0.0% - $40.00 $- YTD 9/30/14 YTD 9/30/15 YTD 9/30/14 YTD 9/30/15 AOV YTD 9/30/14 YTD 9/30/15 Orders Segment Operating Income Segment Operating Income Margin Notes: 1. 2. 3. The results of operations for Provide Commerce for 2014 were derived from pre-acquisition results of operations for informational purposes only. Average Order Value (“AOV”) represents average amount received for consumer orders delivered during a period; Consumer orders represent orders delivered during the period. 2014 Revenue. 31 $14.5 6.7% 3.0% $48.61 $49.50 DIVERSIFIED PRODUCT MIX3 ProFlowers Gorurmet Food Personal Creations Other
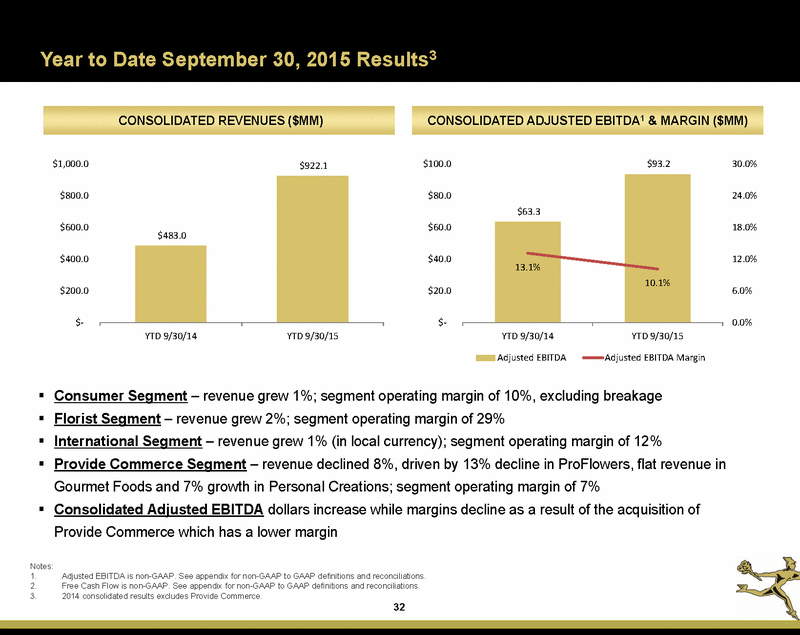
Results 3 Year to Date September 30, 2015 CONSOLIDATED ADJUSTED EBITDA 1 & MARGIN ($MM) CONSOLIDATED REVENUES ($MM) $1,000.0 $100.0 30.0% $93.2 $922.1 $800.0 $80.0 24.0% $600.0 $60.0 18.0% $400.0 $40.0 12.0% $200.0 $20.0 6.0% $- $- 0.0% YTD 9/30/14 YTD 9/30/15 YTD 9/30/14 YTD 9/30/15 Adjusted EBITDA Adjusted EBITDA Margin Consumer Segment – revenue grew 1%; segment operating margin of 10%, excluding breakage Florist Segment – revenue grew 2%; segment operating margin of 29% International Segment – revenue grew 1% (in local currency); segment operating margin of 12% Provide Commerce Segment – revenue declined 8%, driven by 13% decline in ProFlowers, flat revenue in Gourmet Foods and 7% growth in Personal Creations; segment operating margin of 7% Consolidated Adjusted EBITDA dollars increase while margins decline as a result of the acquisition of Provide Commerce which has a lower margin Notes: 1. 2. 3. Adjusted EBITDA is non-GAAP. See appendix for non-GAAP to GAAP definitions and reconciliations. Free Cash Flow is non-GAAP. See appendix for non-GAAP to GAAP definitions and reconciliations. 2014 consolidated results excludes Provide Commerce. 32 $63.3 10.1% 13.1% $483.0
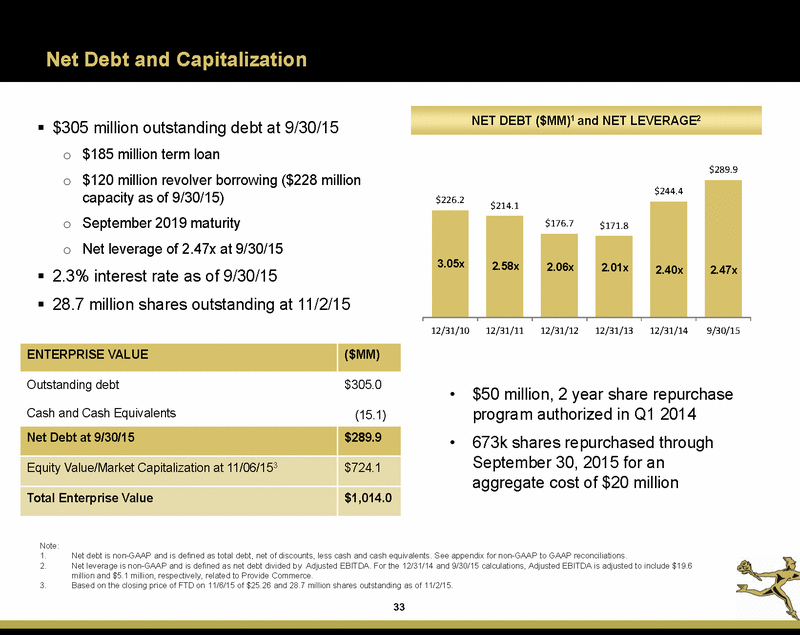
Net Debt and Capitalization NET DEBT ($MM)1 and NET LEVERAGE 2 $305 million outstanding debt at 9/30/15 o $185 million term loan o $120 million revolver borrowing ($228 million capacity as of 9/30/15) o September 2019 maturity o Net leverage of 2.47x at 9/30/15 2.3% interest rate as of 9/30/15 28.7 million shares outstanding at 11/2/15 $289.9 12/31/10 12/31/11 12/31/12 12/31/13 12/31/14 9/30/15 • $50 million, 2 year share repurchase program authorized in Q1 2014 673k shares repurchased through September 30, 2015 for an aggregate cost of $20 million • Note: 1. 2. Net debt is non-GAAP and is defined as total debt, net of discounts, less cash and cash equivalents. See appendix for non-GAAP to GAAP reconciliations. Net leverage is non-GAAP and is defined as net debt divided by Adjusted EBITDA. For the 12/31/14 and 9/30/15 calculations, Adjusted EBITDA is adjusted to include $19.6 million and $5.1 million, respectively, related to Provide Commerce. Based on the closing price of FTD on 11/6/15 of $25.26 and 28.7 million shares outstanding as of 11/2/15. 3. 33 ENTERPRISE VALUE ($MM) Outstanding debt $305.0 Cash and Cash Equivalents (15.1) Net Debt at 9/30/15 $289.9 Equity Value/Market Capitalization at 11/06/153 $724.1 Total Enterprise Value $1,014.0 $226.2$244.4 2.47x $214.1 2.40x 3.05x 2.58x $176.7$171.8 2.06x 2.01x
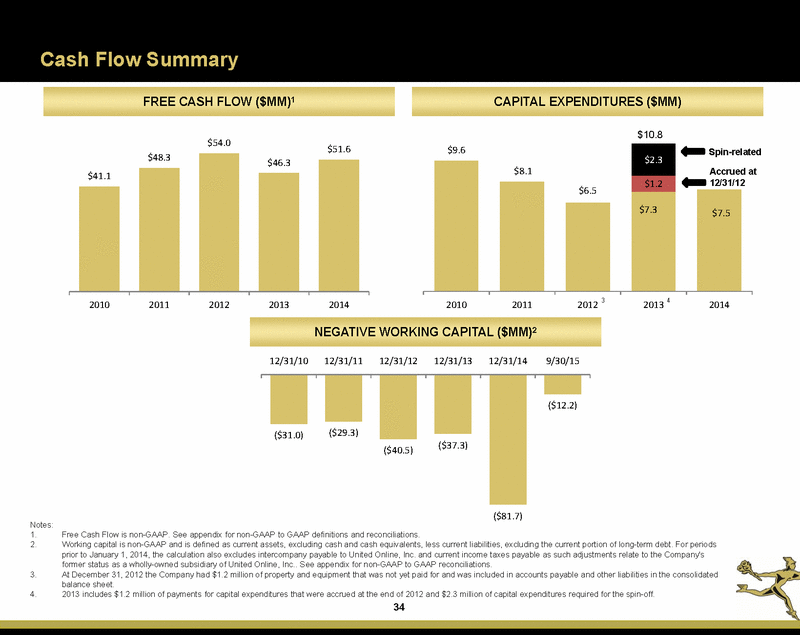
Cash Flow Summary FREE CASH FLOW ($MM)1 CAPITAL EXPENDITURES ($MM) $10.8 $54.0 $51.6 -related t 2012 3 2013 4 2010 2011 2012 2013 2014 2010 2011 2014 NEGATIVE WORKING CAPITAL ($MM)2 12/31/10 12/31/11 12/31/12 12/31/13 12/31/14 9/30/15 ($81.7) Notes: 1. 2. Free Cash Flow is non-GAAP. See appendix for non-GAAP to GAAP definitions and reconciliations. Working capital is non-GAAP and is defined as current assets, excluding cash and cash equivalents, less current liabilities, excluding the current portion of long-term debt. For periods prior to January 1, 2014, the calculation also excludes intercompany payable to United Online, Inc. and current income taxes payable as such adjustments relate to the Company's former status as a wholly-owned subsidiary of United Online, Inc.. See appendix for non-GAAP to GAAP reconciliations. At December 31, 2012 the Company had $1.2 million of property and equipment that was not yet paid for and was included in accounts payable and other liabilities in the consolidated balance sheet. 2013 includes $1.2 million of payments for capital expenditures that were accrued at the end of 2012 and $2.3 million of capital expenditures required for the spin-off. 34 3. 4. ($12.2) ($31.0)($29.3) ($40.5)($37.3) $48.3 $46.3 $41.1 $9.6 $2.3 Spin Accrued a 12/31/12 $8.1 $1.2 $6.5 $7.3 $7.5
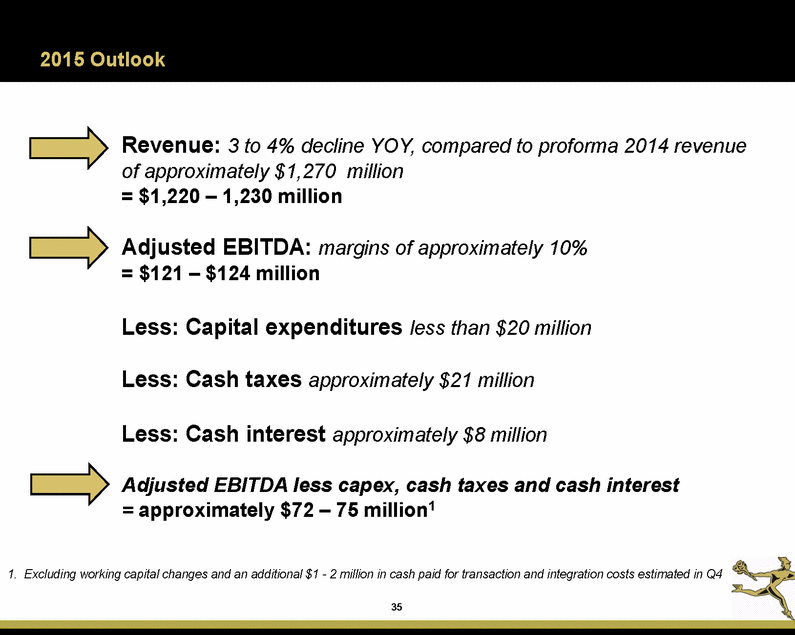
2015 Outlook Revenue: 3 to 4% decline YOY, compared to proforma of approximately $1,270 million = $1,220 – 1,230 million 2014 revenue Adjusted EBITDA: margins of approximately 10% = $121 – $124 million Less: Capital expenditures less than $20 million Less: Cash taxes approximately $21 million Less: Cash interest approximately $8 million Adjusted EBITDA less capex, cash taxes and cash = approximately $72 – 75 million 1 interest 1. Excluding working capital changes and an additional $1 - 2 million in cash paid for transaction and integration costs estimated in Q4 35
Priorities for Free Cash Flow Debt Paydown $20MM in annual mandatory payments Reinvest in the M&A Return Capital to Shareholders Share Repurchase Program Business to Drive Long Term Value 36 Free Cash Flow
ProFlowers® ProPlans flowers direct, Flying Flowers Sincerely 37
Appendix 38
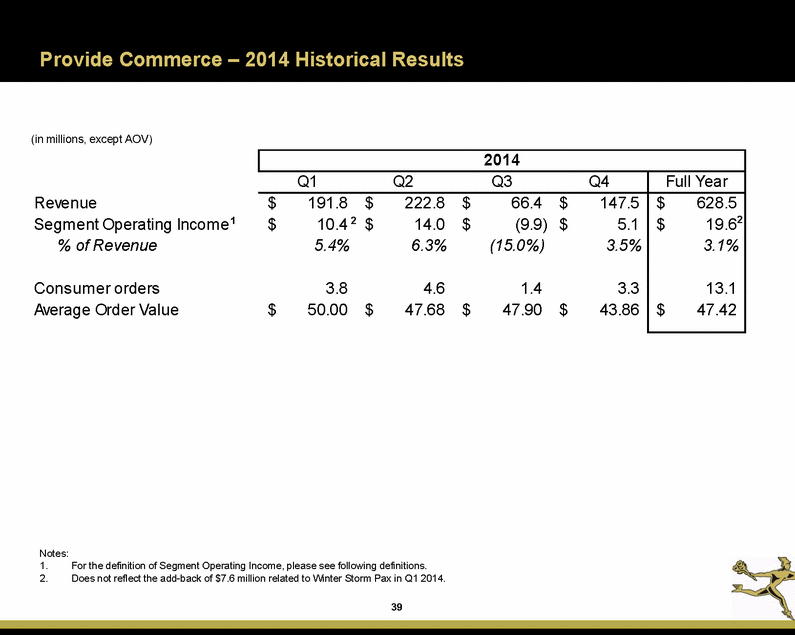
Provide Commerce – 2014 Historical Results (in millions, except AOV) Revenue Segment Operating Income 1 % of Revenue Consumer orders Average Order Value Notes: 1. 2. For the definition of Segment Operating Income, please see following definitions. Does not reflect the add-back of $7.6 million related to Winter Storm Pax in Q1 2014. 39 2014 Q1 Q2 Q3 Q4 Full Year $191.8$222.8$66.4$147.5 $10.4 2 $14.0$(9.9)$5.1 5.4%6.3%(15.0%)3.5% 3.84.61.43.3 $50.00$47.68$47.90$43.86 $628.5 $19.62 3.1% 13.1 $47.42
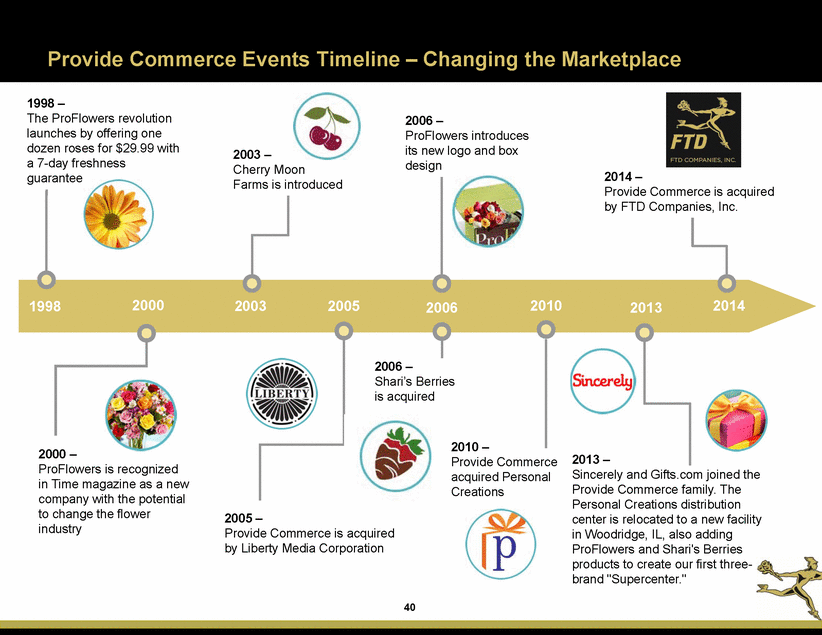
Provide Commerce Events Timeline – Changing the Marketplace 1998 – The ProFlowers revolution launches by offering one dozen roses for $29.99 with a 7-day freshness guarantee 2006 – ProFlowers introduces its new logo and box design 2003 – Cherry Moon Farms is introduced 2014 – Provide Commerce is acquired by FTD Companies, Inc. 2000 2003 2005 2010 2014 1998 2006 2013 2006 – Shari’s Berries is acquired 2010 – Provide Commerce acquired Personal Creations 2000 – ProFlowers is recognized in Time magazine as a new company with the potential to change the flower industry 2013 – Sincerely and Gifts.com joined the Provide Commerce family. The Personal Creations distribution center is relocated to a new facility in Woodridge, IL, also adding ProFlowers and Shari's Berries products to create our first three-brand "Supercenter." 2005 – Provide Commerce is acquired by Liberty Media Corporation 40
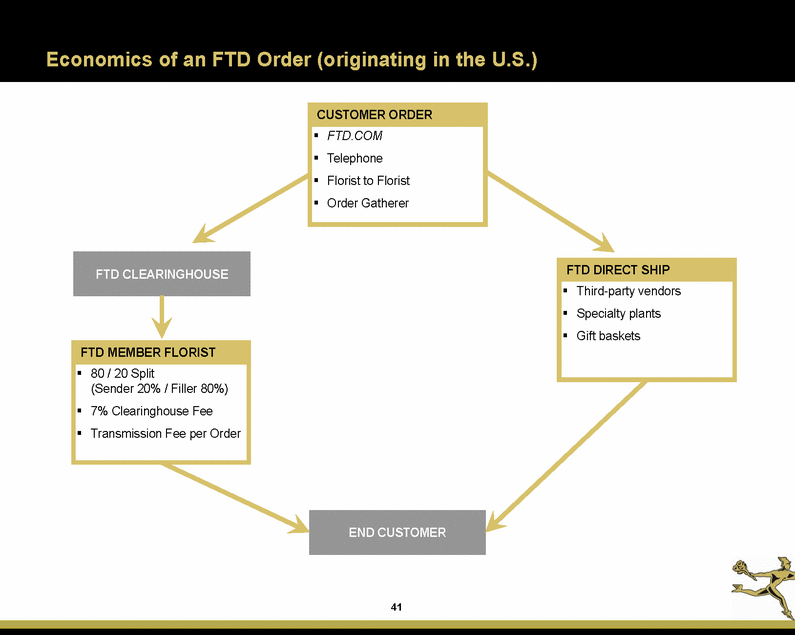
Economics of an FTD Order (originating in the U.S.) FTD.COM Telephone Florist to Florist Order Gatherer Third-party vendors Specialty plants Gift baskets 80 / 20 Split (Sender 20% / Filler 80%) 7% Clearinghouse Fee Transmission Fee per Order 41 END CUSTOMER FTD MEMBER FLORIST FTD DIRECT SHIP FTD CLEARINGHOUSE CUSTOMER ORDER
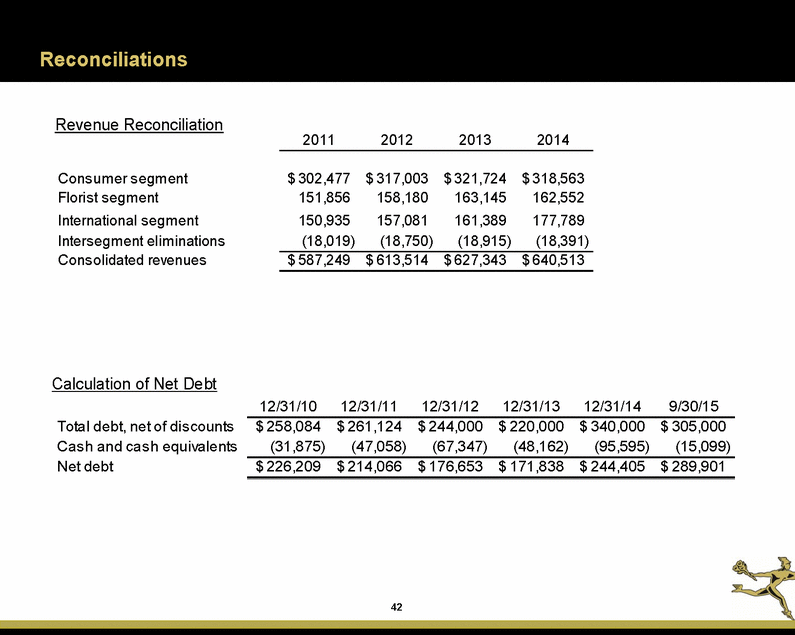
Reconciliations Revenue Reconciliation 2011 2012 2013 2014 Consumer segment Florist segment International segment Inter segment eliminations Consolidated revenues $ 302,477 151,856 150,935 (18,019) $ 317,003 158,180 157,081 (18,750) $ 321,724 163,145 161,389 (18,915) $ 318,563 162,552 177,789 (18,391) $ 587,249 $ 613,514 $ 627,343 $ 640,513 Calculation of Net Debt 12/31/10 12/31/11 12/31/12 12/31/13 12/31/14 9/30/15 Total debt, net of discounts Cash and cash equivalents Net debt $ 258,084 (31,875) $ 261,124 (47,058) $ 244,000 (67,347) $ 220,000 (48,162) $ 340,000 (95,595) $ 305,000 (15,099) $ 226,209 $ 214,066 $ 176,653 $ 171,838 $ 244,405 $ 289,901 42
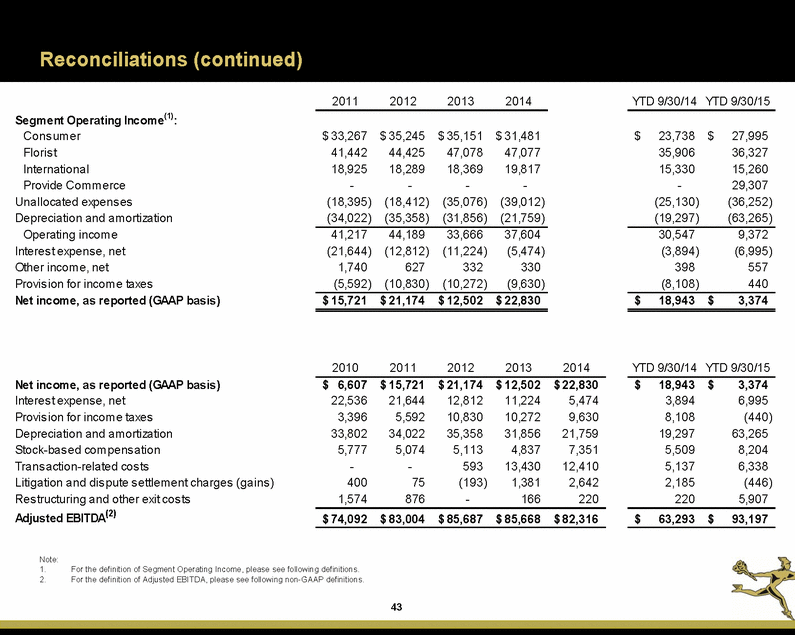
Reconciliations (continued) 2011 2012 2013 2014 YTD 9/30/14 YTD 9/30/15 Segment Operating Income(1): Consumer Florist International Provide Commerce Unallocated expenses Depreciation and amortization Operating income Interest expense, net Other income, net Provision for income taxes Net income, as reported (GAAP basis) $ 33,267 41,442 18,925 - (18,395) (34,022) $ 35,245 44,425 18,289 - (18,412) (35,358) $ 35,151 47,078 18,369 - (35,076) (31,856) $ 31,481 47,077 19,817 - (39,012) (21,759) $ 23,738 35,906 15,330 - (25,130) (19,297) $ 27,995 36,327 15,260 29,307 (36,252) (63,265) 41,217 (21,644) 1,740 (5,592) 44,189 (12,812) 627 (10,830) 33,666 (11,224) 332 (10,272) 37,604 (5,474) 330 (9,630) 30,547 (3,894) 398 (8,108) 9,372 (6,995) 557 440 $ 15,721 $ 21,174 $ 12,502 $ 22,830 $ 18,943 $ 3,374 2010 2011 2012 2013 2014 YTD 9/30/14 YTD 9/30/15 Net income, as reported (GAAP basis) Interest expense, net Provision for income taxes Depreciation and amortization Stock-based compensation Transaction-related costs Litigation and dispute settlement charges (gains ) Restructuring and other exit costs Adjusted EBITDA(2) $ 6,607 22,536 3,396 33,802 5,777 - 400 1,574 $ 15,721 21,644 5,592 34,022 5,074 - 75 876 $ 21,174 12,812 10,830 35,358 5,113 593 (193) - $ 12,502 11,224 10,272 31,856 4,837 13,430 1,381 166 $ 22,830 5,474 9,630 21,759 7,351 12,410 2,642 220 $ 18,943 3,894 8,108 19,297 5,509 5,137 2,185 220 $ 3,374 6,995 (440) 63,265 8,204 6,338 (446) 5,907 $ 74,092 $ 83,004 $ 85,687 $ 85,668 $ 82,316 $ 63,293 $ 93,197 Note: 1. 2. For the definition of Segment Operating Income, please see following definitions. For the definition of Adjusted EBITDA, please see following non-GAAP definitions. 43
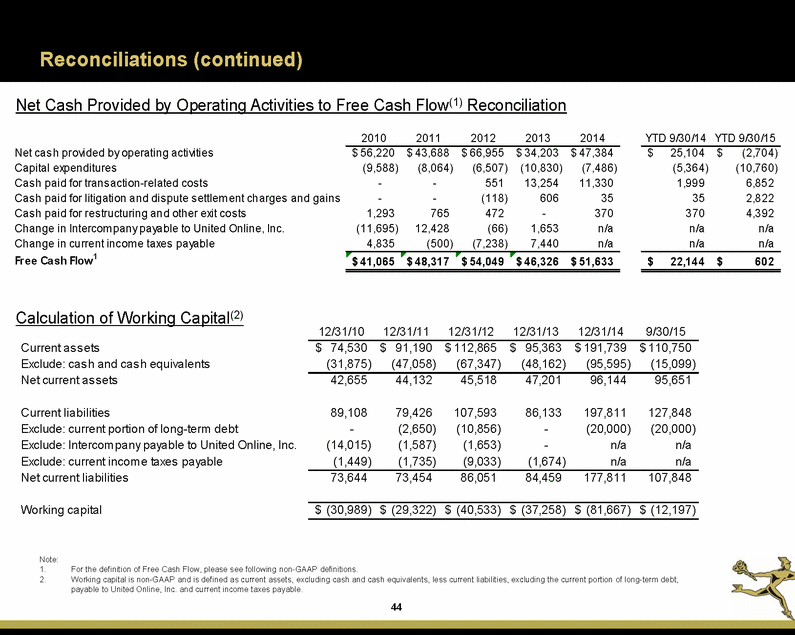
Reconciliations (continued) Net Cash Provided by Operating Activities to Free Cash Flow(1) Reconciliation 2010 2011 2012 2013 2014 YTD 9/30/14 YTD 9/30/15 Net cash provided by operating activities Capital expenditures Cash paid for transaction-related costs Cash paid for litigation and dispute settlement charges and gains Cash paid for restructuring and other exit costs Change in Intercompany payable to United Online, Inc. Change in current income taxes payable Free Cash Flow 1 $ 56,220 (9,588) - - 1,293 (11,695) 4,835 $ 43,688 (8,064) - - 765 12,428 (500) $ 66,955 (6,507) 551 (118) 472 (66) (7,238) $ 34,203 (10,830) 13,254 606 - 1,653 7,440 $ 47,384 (7,486) 11,330 35 370 n/a n/a $ 25,104 (5,364) 1,999 35 370 n/a n/a $ (2,704) (10,760) 6,852 2,822 4,392 n/a n/a $ 41,065 $ 48,317 $ 54,049 $ 46,326 $ 51,633 $ 22,144 $ 602 Calculation of Working Capital(2) 12/31/10 12/31/11 12/31/12 12/31/13 12/31/14 9/30/15 Current assets Exclude: Cash and Cash equivalents Net current assets $ 74,530 (31,875) $ 91,190 (47,058) $ 112,865 (67,347) $ 95,363 (48,162) $ 191,739 (95,595) $ 110,750 (15,099) 42,655 44,132 45,518 47,201 96,144 95,651 Current liabilities Exclude: current portion of long-term debt Exclude: Intercompany payable to United Online, Inc. Exclude: current income taxes payable Net current liabilities 89,108 - (14,015) (1,449) 79,426 (2,650) (1,587) (1,735) 107,593 (10,856) (1,653) (9,033) 86,133 - - (1,674) 197,811 (20,000) n/a n/a 127,848 (20,000) n/a n/a 73,644 73,454 86,051 84,459 177,811 107,848 Working capital $ (30,989) $ (29,322) $ (40,533) $ (37,258) $ (81,667) $ (12,197) Note: 1. 2. For the definition of Free Cash Flow, please see following non-GAAP definitions. Working capital is non-GAAP and is defined as current assets, excluding cash and cash equivalents, less current liabilities, excluding the current portion of long-term debt, payable to United Online, Inc. and current income taxes payable. 44
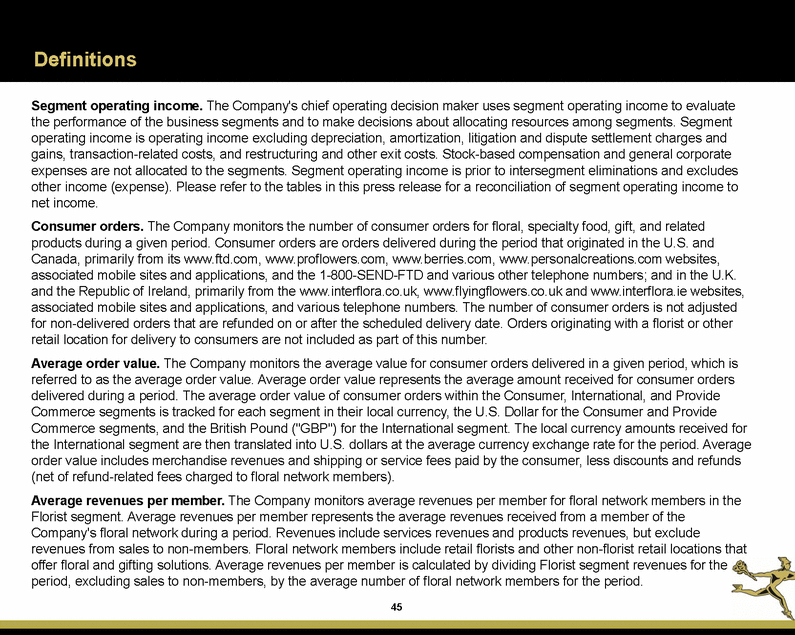
Definitions Segment operating income. The Company's chief operating decision maker uses segment operating income to evaluate the performance of the business segments and to make decisions about allocating resources among segments. Segment operating income is operating income excluding depreciation, amortization, litigation and dispute settlement charges and gains, transaction-related costs, and restructuring and other exit costs. Stock-based compensation and general corporate expenses are not allocated to the segments. Segment operating income is prior to intersegment eliminations and excludes other income (expense). Please refer to the tables in this press release for a reconciliation of segment operating income to net income. Consumer orders. The Company monitors the number of consumer orders for floral, specialty food, gift, and related products during a given period. Consumer orders are orders delivered during the period that originated in the U.S. and Canada, primarily from its www.ftd.com, www.proflowers.com, www.berries.com, www.personalcreations.com websites, associated mobile sites and applications, and the 1-800-SEND-FTD and various other telephone numbers; and in the U.K. and the Republic of Ireland, primarily from the www.interflora.co.uk, www.flyingflowers.co.uk and www.interflora.ie websites, associated mobile sites and applications, and various telephone numbers. The number of consumer orders is not adjusted for non-delivered orders that are refunded on or after the scheduled delivery date. Orders originating with a florist or other retail location for delivery to consumers are not included as part of this number. Average order value. The Company monitors the average value for consumer orders delivered in a given period, which is referred to as the average order value. Average order value represents the average amount received for consumer orders delivered during a period. The average order value of consumer orders within the Consumer, International, and Provide Commerce segments is tracked for each segment in their local currency, the U.S. Dollar for the Consumer and Provide Commerce segments, and the British Pound ("GBP") for the International segment. The local currency amounts received for the International segment are then translated into U.S. dollars at the average currency exchange rate for the period. Average order value includes merchandise revenues and shipping or service fees paid by the consumer, less discounts and refunds (net of refund-related fees charged to floral network members). Average revenues per member. The Company monitors average revenues per member for floral network members in the Florist segment. Average revenues per member represents the average revenues received from a member of the Company's floral network during a period. Revenues include services revenues and products revenues, but exclude revenues from sales to non-members. Floral network members include retail florists and other non-florist retail locations that offer floral and gifting solutions. Average revenues per member is calculated by dividing Florist segment revenues for the period, excluding sales to non-members, by the average number of floral network members for the period. 45
Non-GAAP Definitions Adjusted earnings before interest, taxes, depreciation and amortization (“Adjusted EBITDA”). The Company defines Adjusted EBITDA as net income before net interest expense, provision (benefit) for income taxes, depreciation, amortization, stock-based compensation, transaction-related costs, litigation and dispute settlement charges and gains, restructuring and other exit costs, and impairment of goodwill, intangible assets and long-lived assets. Litigation and dispute settlement charges and gains include estimated losses for which the Company has established a reserve, as well as actual settlements, judgments, fines, penalties, assessments or other resolutions against, or in favor of, the Company related to litigation, arbitration, investigations, disputes, or similar matters. Insurance recoveries received by the Company related to such matters are also included in these adjustments. Transaction-related costs are certain expense items resulting from actual or potential transactions such as business combinations, mergers, acquisitions, dispositions, spin-offs, financing transactions, and other strategic transactions, including, without limitation, (i) compensation expenses and (ii) expenses for advisors and representatives such as investment bankers, consultants, attorneys, and accounting firms. Transaction-related costs may also include, without limitation, transition and integration costs such as retention bonuses and acquisition-related milestone payments to acquired employees. The Company's definition of Adjusted EBITDA may be modified from time to time. Management believes that because Adjusted EBITDA excludes (i) certain non-cash expenses (such as depreciation, amortization, and stock-based compensation) and (ii) expenses that are not reflective of the Company's core operations, this measure provides investors with additional useful information to measure the Company's financial performance, particularly with respect to changes in performance from period to period. Management uses Adjusted EBITDA to measure the Company's performance. The Adjusted EBITDA metric also is used as a performance measure under the Company's senior secured credit facility and includes adjustments such as the items defined above and other further adjustments, which are defined in the senior secured credit facility. The Company also uses this measure as a basis in determining certain incentive compensation targets for certain members of the Company's management. Adjusted EBITDA is not determined in accordance with GAAP and should be considered in addition to, not as a substitute for or superior to, financial measures determined in accordance with GAAP. A limitation associated with the use of Adjusted EBITDA is that it does not reflect the periodic costs of certain tangible and intangible assets used in generating revenues in the Company's business. Management evaluates the costs of such tangible and intangible assets through other financial activities such as evaluations of capital expenditures and purchase accounting. An additional limitation associated with this measure is that it does not include stock-based compensation expenses related to the Company's workforce. A further limitation associated with the use of this measure is that it does not reflect expenses or gains that are not considered reflective of the Company's core operations. Management compensates for this limitation by providing supplemental information about such charges, gains and costs within its financial press releases and SEC filings, when applicable. An additional limitation associated with the use of this measure is that the term "Adjusted EBITDA" does not have a standardized meaning. Therefore, other companies may use the same or a similarly named measure but exclude different items or use different computations, which may not provide investors a comparable view of the Company's performance in relation to other companies. Management compensates for this limitation by presenting the most comparable GAAP measure, net income, directly ahead of Adjusted EBITDA within this and other financial press releases and by providing a reconciliation that shows and describes the adjustments made. A reconciliation to net income is provided in the accompanying tables. In addition, many of the adjustments to the Company's GAAP financial measures reflect the exclusion of items that are recurring in nature and will be reflected in the Company's financial results for the foreseeable future. Free Cash Flow. The Company defines Free Cash Flow as net cash provided by operating activities less capital expenditures, plus cash paid for transaction-related costs, cash paid for litigation and dispute settlement charges and gains, and cash paid for restructuring and other exit costs. Beginning with the quarter ended March 31, 2015, when presenting the Free Cash Flow metric, the Company is no longer further adjusting to exclude the change in intercompany payable to United Online, Inc. and the change in current income taxes payable. The Company believes that these further adjustments no longer provide investors with meaningful information as such adjustments related to the Company's former status as a wholly-owned subsidiary of United Online, Inc. Adjusted Net Income. The Company defines Adjusted Net Income as net income excluding the after tax impact of stock-based compensation, amortization, transaction-related costs, litigation and dispute settlement charges and gains, restructuring and other exit costs, and loss on extinguishment of debt. 46
