Attached files
| file | filename |
|---|---|
| 8-K - 8-K - FRANKLIN ELECTRIC CO INC | a20151109baird8-k.htm |

Baird 2015 Industrial Conference Franklin Electric Co. Inc. (FELE) November 9, 2015

Safe Harbor Statement “Safe Harbor” Statement under the Private Securities Litigation Reform Act of 1995. Any forward-looking statements contained herein, including those relating to market conditions or the Company’s financial results, costs, expenses or expense reductions, profit margins, inventory levels, foreign currency translation rates, liquidity expectations, business goals and sales growth, involve risks and uncertainties, including but not limited to, risks and uncertainties with respect to general economic and currency conditions, various conditions specific to the Company’s business and industry, weather conditions, new housing starts, market demand, competitive factors, changes in distribution channels, supply constraints, effect of price increases, raw material costs, technology factors, integration of acquisitions, litigation, government and regulatory actions, the Company’s accounting policies, future trends, and other risks which are detailed in the Company’s Securities and Exchange Commission filings, included in Item 1A of Part I of the Company’s Annual Report on Form 10-K for the fiscal year ending January 3, 2015, Exhibit 99.1 attached thereto and in Item 1A of Part II of the Company’s Quarterly Reports on Form 10-Q. These risks and uncertainties may cause actual results to differ materially from those indicated by the forward-looking statements. All forward-looking statements made herein are based on information currently available, and the Company assumes no obligation to update any forward-looking statements. 2

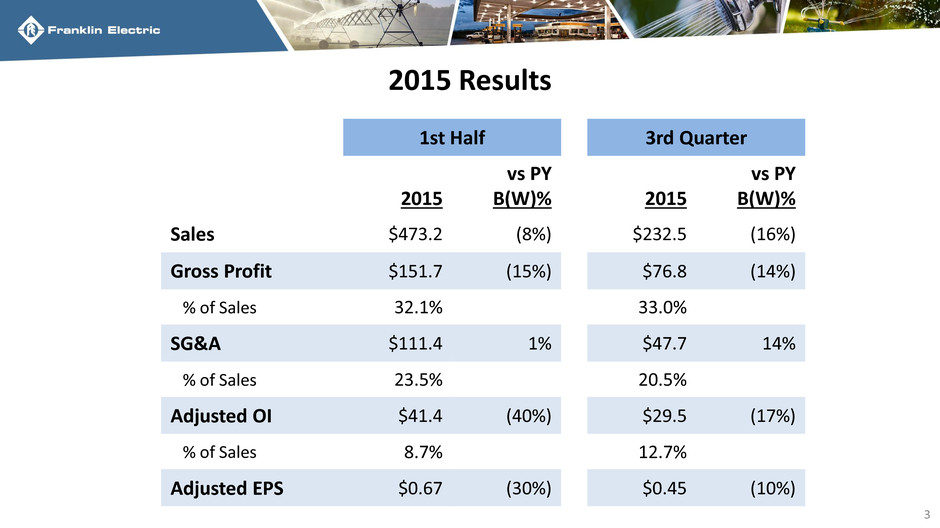
3 2015 Results 1st Half 2015 vs PY B(W)% Sales $473.2 (8%) Gross Profit $151.7 (15%) % of Sales 32.1% SG&A $111.4 1% % of Sales 23.5% Adjusted OI $41.4 (40%) % of Sales 8.7% Adjusted EPS $0.67 (30%) 3rd Quarter 2015 vs PY B(W)% $232.5 (16%) $76.8 (14%) 33.0% $47.7 14% 20.5% $29.5 (17%) 12.7% $0.45 (10%)

4 Two Current Issues

What’s Changed 5 3Q YTD 2014 Revenue $794 M Exchange Rates ($66) Oil Prices ($43) Acquisitions $20 All Other - Organic $ 1 3Q YTD 2015 Revenue $706 M

Business Segments 6 Water Systems 77% Fueling Systems 23% *Based on 2015 Q3 YTD revenue *

Macro Trends • 5 Billion people moving into the middle class drives growth in: – Consumption of water – Number of vehicles • Water scarcity, degradation of water quality, increase in water re-use • Increased regulation • Efficiency (energy savings) • Integrated products (systems) • More connected (smart) products • ‘Good enough’ products • Growth in use of alternative (non-liquid) fuels 7

Our Strategy To grow as a global provider of water and fuel pumping systems, through geographic expansion and product line extensions, leveraging our global platform and competency in system design. 8

Sales in Developing Regions 9 2010 $0 $50 $75 $100 $125 $150 $175 $200 $225 2004 2005 2006 2007 2008 2009 $25 2011 $250 $300 $350 2012 $325 $275 2013 $65 M 2014 $400 $375 $401 M $361 M $340 M $306 M $258 M $217 M $232 M $161 M $104 M $85 M

MENA (IMPO) US $ Local 13.0% 22.3% Water Systems Sales Growth Rates in US $ and Local Currency 10 LATIN AMERICA US $ Local 4.1% SOUTHERN AFRICA US $ Local (6.2%) APAC US $ Local 13.0% 2011-2014 (3-year CAGR) 15.3% 6.9% 20.6%

Fueling Systems Regional Growth Rates 11 United States 49% Developed Non-US 19% Developing Regions 32% *Based on 2014 revenue Developed Regions 5 YEAR CAGR 9.0% Developing Regions 5 YEAR CAGR 24.0%

Water Systems Sales 12 Groundwater Pumping Systems 60% Surface Pumps 40% * *Based on 2015 Q3 YTD revenue

Water Systems Sales 13 Irrigation & Industrial Groundwater Pumping Systems 25% Residential Groundwater Pumping Systems 35% Residential Surface Pumps 20% Irrigation & Industrial Surface Pumps 20% * *Based on 2015 Q3 YTD revenue

Water Systems Sales 14 * Irrigation & Industrial Groundwater Pumping Systems 25% Residential Groundwater Pumping Systems 35% Residential Surface Pumps 20% Irrigation & Industrial Surface Pumps 20% *Based on 2015 Q3 YTD revenue #2 Global Supplier to residential water pumping systems distribution channel #1 Global supplier to agricultural irrigation pumping systems distribution channel Non Discretionary Replacement Purchases Represent +80% of Sales

New Products 15 SEWER BYPASS COMMERCIAL BOOSTING SOLAR PUMPING CONSTANT PRESSURE WASTEWATER OVERFILL PREVENTION

Uses of Cash - 2006 to YTD 2015 16 Dividends/Stock Repurchase Capital Expenditures & R&D Acquisitions $255 M $388 M $449 M 23% 36% 41%

Baird 2015 Industrial Conference Franklin Electric Co. Inc. (FELE) November 9, 2015
