Attached files
| file | filename |
|---|---|
| EX-99.1 - EXHIBIT 99.1 - FRANKLIN ELECTRIC CO INC | a20171231ex991.htm |
| EX-32.2 - EXHIBIT 32.2 - FRANKLIN ELECTRIC CO INC | a20171231ex322.htm |
| EX-32.1 - EXHIBIT 32.1 - FRANKLIN ELECTRIC CO INC | a20171231ex321.htm |
| EX-31.2 - EXHIBIT 31.2 - FRANKLIN ELECTRIC CO INC | a20171231ex312.htm |
| EX-31.1 - EXHIBIT 31.1 - FRANKLIN ELECTRIC CO INC | a20171231ex311.htm |
| EX-23.1 - EXHIBIT 23.1 - FRANKLIN ELECTRIC CO INC | a20171231ex231.htm |
| EX-21 - EXHIBIT 21 - FRANKLIN ELECTRIC CO INC | a20171231ex21.htm |
UNITED STATES
SECURITIES AND EXCHANGE COMMISSION
WASHINGTON, D.C. 20549
_________
FORM 10-K
_________
ý ANNUAL REPORT PURSUANT TO SECTION 13 OR 15(d)
OF THE SECURITIES EXCHANGE ACT OF 1934
For the fiscal year ended December 31, 2017
OR
o TRANSITION REPORT PURSUANT TO SECTION 13 OR 15(d)
OF THE SECURITIES EXCHANGE ACT OF 1934
For the transition period from _____ to _____

Commission file number 0-362
FRANKLIN ELECTRIC CO., INC.
(Exact name of registrant as specified in its charter)
Indiana | 35-0827455 | |
(State or other jurisdiction of incorporation or organization) | (I.R.S. Employer Identification No.) | |
9255 Coverdale Road | ||
Fort Wayne, Indiana | 46809 | |
(Address of principal executive offices) | (Zip Code) | |
(260) 824-2900
(Registrant’s telephone number, including area code)
Securities registered pursuant to Section 12(b) of the Act:
Common Stock, $0.10 par value | NASDAQ Global Select Market | |
(Title of each class) | (Name of each exchange on which registered) | |
Securities registered pursuant to Section 12(g) of the Act:
None
(Title of each class)
Indicate by check mark if the registrant is a well-known seasoned issuer, as defined in Rule 405 of the Securities Act.
YES o | NO x |
1
Indicate by check mark if the registrant is not required to file reports pursuant to Section 13 or Section 15(d) of the Act.
YES o | NO x |
Indicate by check mark whether the registrant (1) has filed all reports required to be filed by Section 13 or 15(d) of the Securities Exchange Act of 1934 during the preceding 12 months (or for such shorter period that the registrant was required to file such reports), and (2) has been subject to such filing requirements for the past 90 days.
YES x | NO o |
Indicate by check mark whether the registrant has submitted electronically and posted on its corporate Web site, if any, every Interactive Data File required to be submitted and posted pursuant to Rule 405 of Regulation S-T (Section 232.405 of this chapter) during the preceding 12 months (or for such shorter period that the registrant was required to submit and post such files).
YES x | NO o |
Indicate by check mark if disclosure of delinquent filers pursuant to Item 405 of Regulation S-K (Section 229.405 of this chapter) is not contained herein, and will not be contained, to the best of registrant’s knowledge, in definitive proxy or information statements incorporated by reference in Part III of this Form 10-K or any amendment to this Form 10-K. o
Indicate by check mark whether the registrant is a large accelerated filer, an accelerated filer, a non-accelerated filer, or a smaller reporting company. See the definitions of “large accelerated filer,” “accelerated filer” and “smaller reporting company” in Rule 12b-2 of the Exchange Act.
Large Accelerated Filer x | Accelerated Filer o | Non-Accelerated Filer o | Smaller Reporting Company o |
Emerging Growth Company o | |||
If an emerging growth company, indicate by check mark if the registrant has elected not to use the extended transition period for complying with any new or revised financial accounting standards provided pursuant to Section 13(a) of the Exchange Act. o
Indicate by check mark whether the registrant is a shell company (as defined in Rule 12b-2 of the Act).
YES o | NO x |
The aggregate market value of the registrant’s common stock held by non-affiliates of the registrant at June 30, 2017 (the last business day of the registrant’s most recently completed second quarter) was $1,904,192,752. The stock price used in this computation was the last sales price on that date, as reported by NASDAQ Global Select Market. For purposes of this calculation, the registrant has excluded shares held by executive officers and directors of the registrant, including restricted shares and except for shares owned by the executive officers through the registrant’s 401(k) Plan. Determination of stock ownership by non-affiliates was made solely for the purpose of responding to this requirement and the registrant is not bound by this determination for any other purpose.
Number of shares of common stock outstanding at February 13, 2018:
46,629,982 shares
DOCUMENTS INCORPORATED BY REFERENCE
A portion of the Proxy Statement for the Annual Meeting of Shareholders to be held on May 4, 2018 (Part III).
2
FRANKLIN ELECTRIC CO., INC.
TABLE OF CONTENTS
Page | |||
PART I. | Number | ||
Item 1. | |||
Item 1A. | |||
Item 1B. | |||
Item 2. | |||
PART II. | |||
Item 5. | |||
Item 6. | |||
Item 7. | |||
Item 7A. | |||
Item 8. | |||
Item 9. | |||
Item 9A. | |||
Item 9B. | |||
PART III. | |||
Item 10. | |||
Item 11. | |||
Item 12. | |||
Item 13. | |||
Item 14. | |||
PART IV. | |||
Item 15. | |||
3
PART I
ITEM 1. BUSINESS
Description of the Business
Franklin Electric Co., Inc. (“Franklin Electric” or the “Company”) is an Indiana corporation founded in 1944 and incorporated in 1946. Named after America’s pioneer electrical engineer, Benjamin Franklin, Franklin Electric manufactured the first water-lubricated submersible motor for water systems, and the first submersible motor for fueling systems. With 2017 revenue of over $1.1 billion and approximately 5,600 employees, today the Company designs, manufactures and distributes water and fuel pumping systems, composed primarily of submersible motors, pumps, electronic controls and related parts and equipment.
The Company’s water pumping systems move fresh and waste water for the residential, agriculture, and other industrial end markets. With a growing global footprint, the Company has also evolved into a top supplier of submersible fueling systems at gas stations, making pumps, pipes, electronic controls, and monitoring devices. Fuel pumping systems account for the balance of the Company’s revenues.
The Company’s products are sold worldwide by its employee sales force and independent manufacturing representatives. The Company offers normal and customary trade terms to its customers, no significant part of which is of an extended nature. Special inventory requirements are not necessary, and customer merchandise return rights do not extend beyond normal warranty provisions.
Franklin Electric’s Key Factors for Success
While maintaining a culture of safety and lean principals, Franklin Electric promises to deliver quality, availability, service, innovation, and cost in every encounter the Company has with stakeholders, including direct or indirect customers, employees, shareholders, and suppliers. These key factors for success are a roadmap to ensure the Company can grow as a global provider of water and fuel systems, through geographic expansion and product line extensions, leveraging its global platform and competency in system design, all while consistently offering the best value to its customer.
Markets and Applications
The Companys business consists of three reportable segments based on the principal end market served: the Water Systems, the Fueling Systems, and Distribution segments. The Company includes unallocated corporate expenses in an “Intersegment Eliminations/Other” segment that, together with the Water Systems, Fueling Systems, and Distribution segments, represent the Company. Segment and geographic information appears in Note 16, “Segment and Geographic Information” to the consolidated financial statements.
The market for the Company’s products is highly competitive and includes diversified accounts by size and type. The Company’s Water Systems and Fueling Systems products and related equipment are sold to specialty distributors and some original equipment manufacturers (“OEMs”), as well as industrial and petroleum equipment distributors and major oil and utility companies.
Water Systems Segment
Water Systems is a global leader in the production and marketing of water pumping systems and is a technical leader in submersible motors, pumps, drives, electronic controls, and monitoring devices. The Water Systems segment designs, manufactures and sells motors, pumps, drives, electronic controls, monitoring devices, and related parts and equipment primarily for use in groundwater, wastewater, and fuel transfer applications.
Water Systems motors and pumps are used principally for pumping clean water and wastewater in a variety of residential, agricultural, and industrial applications. Water Systems also manufactures electronic drives and controls for the motors which control functionality and provide protection from various hazards, such as electrical surges, over-heating, dry wells or dry tanks.
The Water Systems business has grown from a domestic submersible motor manufacturer to a global manufacturer of systems and components for the movement of water and automotive fuels. Founded in the 1940s, the Company made submersible motors for pumps for much of its history. In 2004, it entered the pump business, and has since grown through acquisitions. Highlights of the Water Systems business transformation, from its origins to the present, are as follows:
• | 1950s - Domestic submersible motor manufacturer |
• | 1990s - Global manufacturer of submersible motors, electronic drives and controls selling to pump OEMs |
4
• | 2004 - Began to change the business model to include pumps and sell directly to wholesale distributors |
• | 2006 - Added adjacent pumping systems, acquired Little Giant Pump Company, United States |
• | 2007 - Expanded globally, acquired Pump Brands (Pty) Limited, South Africa |
• | 2008 - Continued global expansion, acquired Industrias Schneider SA, Brazil |
• | 2009 - International acquisition, Vertical, S.p.A., Italy |
• | 2011 - International acquisition, Impo Motor Pompa Sanayi ve Ticaret A.S., Turkey |
• | 2012 - Acquired majority interest, 70.5%, in mobile pumping systems company, Pioneer Pump Holdings, Inc. (“PPH”), a United States company with subsidiaries in the United Kingdom and South Africa |
• | 2014 - International acquisitions, Bombas Leao S.A., Brazil and majority interest, 70%, of Pluga Pumps and Motors Private Limited, India |
• | 2015 - Acquired remaining 29.5% noncontrolling interest of PPH |
• | 2017 - Acquired remaining 10% noncontrolling interest of Impo |
Water Systems products are sold in highly competitive markets. Water systems contribute about 65 to 70 percent of revenue. Significant portions of segment revenue come from selling groundwater and surface pumps to residential and commercial buildings, as well as agricultural sales which are more seasonal and subject to commodity price changes. The Water segment generates 40 percent of its revenue in developing markets, which often lack municipal water systems. As those countries bring systems up to date, the Company views those markets as an opportunity and, accordingly, acquired investments in India in 2014. The Company has had 10 to 15 percent compounded annual sales growth in developing regions in recent years. Water Systems competes in each of its targeted markets based on product design, quality of products and services, performance, availability, and price. The Company’s principal competitors in the specialty water products industry are Grundfos Management A/S, Pentair, Inc., and Xylem, Inc.
2017 Water Systems research and development expenditures were primarily related to the following activities:
• | Electronic drives and controls for pumping and HVAC applications, including SubDrive Utility, SubDrive Vantage, and Q-Link. |
• | Solar pumping technology, including new models and new accessories for the Fhoton™ Solar Pumping Systems. |
• | Submersible and surface pumps for residential, municipal, and agricultural applications. |
• | Gray water pumping equipment, including the redesigned PowerSewer™ Systems, and the new Little Giant Select Wastewater Pump Series. |
• | Submersible motor technology and motor protection, including SubMonitor Connect, and the MagForce™ permanent magnet motor system. |
Fueling Systems Segment
Fueling Systems is a global leader in the production and marketing of fuel pumping systems, fuel containment systems, and monitoring and control systems. The Fueling Systems segment designs, manufactures and sells pumps, pipe, sumps, fittings, vapor recovery components, electronic controls, monitoring devices and related parts and equipment primarily for use in submersible fueling system applications.
Fuel pumping systems are used principally in total system solutions for underground gasoline, diesel, and biofuel systems. Fueling systems also offers an array of components between the tank and the dispenser, including submersible pumps, station hardware, piping, sumps, vapor recovery and electronic controls. The segment serves other energy markets such as power reliability systems and includes intelligent electronic devices that are designed for online monitoring for the power utility, hydroelectric, and industrial markets.
Fueling Systems has expanded its product offerings through internal development and acquisitions. Highlights of the Fueling Systems history are as follows:
• | 1990s - Domestic manufacturer of submersible turbine pumping systems |
• | 2000 - Acquired Advanced Polymer Technology, Inc., a manufacturer of underground pipe for fueling applications, and EBW, Inc., a manufacturer and distributor of fueling hardware components |
• | 2006 - Acquired Healy Systems, Inc., a manufacturer of fueling nozzles and vapor recovery systems |
• | 2010 - Acquired PetroTechnik Limited, a United Kingdom distributor that designs and sources flexible and lightweight underground pipe |
• | 2012 - Acquired Flex-ing, Inc., a manufacturer of fueling equipment including stainless steel flexible hose connectors |
• | 2016 - Acquired GridSense, Inc., a manufacturer of remote monitoring equipment for distribution transformers and distribution lines |
5
Fueling Systems products are sold in highly competitive markets. Rising car use is leading to more investment in gas stations which, in turn, leads to increased demand for the Company’s Fueling Systems products. The Company believes there is growth opportunity in developing markets. Fueling Systems competes in each of its targeted markets based on product design, quality of products and services, performance, availability, and price. The Company’s principal competitors in the petroleum equipment industry are Fortive Corporation and Dover Corporation.
2017 Fueling Systems research and development expenditures were primarily related to the following activities:
• | Developed and launched the EVO™ Series family of Automatic Tank Gauges with the addition of the new EVO™ 200 and EVO™ 400 to our existing lineup of world class Automatic Tank Gauges. |
• | Developed and launched the Cable Tight™ wire management system which provides a true watertight end-to-end solution for electrical, sensor, and data wire management for petroleum fueling applications. |
• | Developed and launched the Defender Series® below grade spill container lineup. |
Distribution Segment
Distribution Segment is operated as a collection of wholly owned leading groundwater distributors known as the Headwater Companies. The Distribution segment ensures a focused groundwater distribution organization that delivers quality products and leading brands to the industry, providing contractors with the availability and service they demand to meet their application challenges. The Distribution segment operates within the U.S. professional groundwater market.
Information Regarding All Reportable Segments
Research and Development
The Company incurred research and development expense as follows:
(In millions) | 2017 | 2016 | 2015 | ||||||||
Research and development expense | $ | 20.8 | $ | 21.5 | $ | 18.4 | |||||
Expenses incurred were for activities related to the development of new products, improvement of existing products and manufacturing methods, and other applied research and development.
The Company owns a number of patents, trademarks, and licenses. In the aggregate, these patents are of material importance to the operation of the business; however, the Company believes that its operations are not dependent on any single patent or group of patents.
Raw Materials
The principal raw materials used in the manufacture of the Company’s products are coil and bar steel, stainless steel, copper wire, and aluminum ingot. Major components are electric motors, capacitors, motor protectors, forgings, gray iron castings, plastic resins, and bearings. Most of these raw materials are available from multiple sources in the United States and world markets. Generally, the Company believes that adequate alternative sources are available for the majority of its key raw material and purchased component needs; however, the Company is dependent on a single or limited number of suppliers for certain materials or components. Availability of fuel and energy is adequate to satisfy current and projected overall operations unless interrupted by government direction or allocation.
Major Customers
No single customer accounted for over 10 percent of net sales in 2017, 2016, or 2015. No single customer accounted for over 10 percent of gross accounts receivable in 2017 and 2016.
Backlog
The dollar amount of backlog by segment was as follows:
6
(In millions) | February 13, 2018 | February 15, 2017 | |||||
Water Systems | $ | 75.8 | $ | 39.4 | |||
Fueling Systems | 18.4 | 25.2 | |||||
Distribution | 6.3 | — | |||||
Consolidated | $ | 100.5 | $ | 64.6 | |||
The backlog is composed of written orders at prices adjustable on a price-at-the-time-of-shipment basis for products, primarily standard catalog items. All backlog orders are expected to be filled in fiscal 2018. The Company’s sales in the first quarter are generally less than its sales in other quarters due to generally less water well drilling and overall product sales during the winter months in the Northern hemisphere. Beyond that, there is no seasonal pattern to the backlog and the backlog has not proven to be a significant indicator of future sales.
Environmental Matters
The Company believes that it is in compliance with all applicable federal, state, and local laws concerning the discharge of material into the environment, or otherwise relating to the protection of the environment. The Company has not experienced any material costs in connection with environmental compliance, and does not believe that such compliance will have any material effect upon the financial position, results of operations, cash flows, or competitive position of the Company.
Available Information
The Company’s website address is www.franklin-electric.com. The Company makes available free of charge on or through its website its annual report on Form 10-K, quarterly reports on Form 10-Q, current reports on Form 8-K, and all amendments to those reports, as soon as reasonably practicable after such material is electronically filed with or furnished to the Securities and Exchange Commission. Additionally, the Company’s website includes the Company’s corporate governance guidelines, its Board committee charters, and the Company’s code of business conduct and ethics. Information contained on the Company’s website is not part of this annual report on Form 10-K.
ITEM 1A. RISK FACTORS
The following describes the principal risks affecting the Company and its business. Additional risks and uncertainties, not presently known to the Company, could negatively impact the Company’s results of operations or financial condition in the future.
Risks Related to the Industry
Reduced housing starts adversely affect demand for the Company’s products, thereby reducing revenues and earnings. Demand for certain Company products is affected by housing starts. Variation in housing starts due to economic volatility both within the United States and globally could adversely impact gross margins and operating results.
The Company’s results may be adversely affected by global macroeconomic supply and demand conditions related to the energy and mining industries. The energy and mining industries are users of the Company’s products, including the coal, iron ore, gold, copper, oil, and natural gas industries. Decisions to purchase the Company’s products are dependent upon the performance of the industries in which our customers operate. If demand or output in these industries increases, the demand for our products will generally increase. Likewise, if demand or output in these industries declines, the demand for our products will generally decrease. The energy and mining industries’ demand and output are impacted by the prices of commodities in these industries which are frequently volatile and change in response to general economic conditions, economic growth, commodity inventories, and any disruptions in production or distribution. Changes in these conditions could adversely impact sales, gross margin, and operating results.
Increases in the prices of raw materials, components, finished goods and other commodities could adversely affect operations. The Company purchases most of the raw materials for its products on the open market and relies on third parties for the sourcing of certain finished goods. Accordingly, the cost of its products may be affected by changes in the market price of raw materials, sourced components, or finished goods. The Company and its suppliers also use natural gas and electricity in manufacturing products both of which have historically been volatile. The Company does not generally engage in commodity hedging for raw materials and energy. Significant increases in the prices of commodities, sourced components, finished goods, energy or other commodities could cause product prices to increase, which may reduce demand for products or make the
7
Company more susceptible to competition. Furthermore, in the event the Company is unable to pass along increases in operating costs to its customers, margins and profitability may be adversely affected.
The growth of municipal water systems and increased government restrictions on groundwater pumping could reduce demand for private water wells and the Company’s products, thereby reducing revenues and earnings. Demand for certain Company products is affected by rural communities shifting from private and individual water well systems to city or municipal water systems. Many economic and other factors outside the Company’s control, including Federal and State regulations on water quality, and tax credits and incentives, could adversely impact the demand for private and individual water wells. A decline in private and individual water well systems in the United States or other economies in the international markets the Company serves could reduce demand for the Company’s products and adversely impact sales, gross margins, and operating results.
Demand for Fueling Systems products is impacted by environmental legislation which may cause significant fluctuations in costs and revenues. Environmental legislation related to air quality and fueling containment may create demand for certain Fueling Systems products which must be supplied in a relatively short time frame to meet the governmental mandate. During periods of increased demand the Company’s revenues and profitability could increase significantly, although the Company can also be at risk of not having capacity to meet demand or cost overruns due to inefficiencies during ramp up to the higher production levels. After the Company’s customers have met the compliance requirements, the Company’s revenues and profitability may decrease significantly as the demand for certain products declines substantially. The risk of not reducing production costs in relation to the decreased demand and reduced revenues could have a material adverse impact on gross margins and the Company’s results of operations.
Changes in tax legislation regarding the Company’s U.S. or foreign earnings could materially affect future results. Since the Company operates in different countries and is subject to taxation in different jurisdictions, the Company’s future effective tax rates could be impacted by changes in such countries’ tax laws or their interpretations. Both domestic and international tax laws are subject to change as a result of changes in fiscal policy, legislation, evolution of regulation and court rulings. The application of these tax laws and related regulations is subject to legal and factual interpretation, judgment, and uncertainty. The Company cannot predict whether any proposed changes in tax laws will be enacted into law or what, if any, changes may be made to any such proposals prior to their being enacted into law. If the tax laws change in a manner that increases the Company’s tax obligation, it could have a material adverse impact on the Company’s results of operations and financial condition.
The U.S. Tax Cuts and Jobs Act (Tax Act) was enacted on December 22, 2017 and introduces significant changes to U.S. income tax law. Effective in 2018, the Tax Act reduces the U.S. statutory tax rate from 35% to 21% and creates new incentives on U.S. based foreign exports, referred to as Foreign Derived Intangible Income, and other provision. In addition, in 2017 the company was subject to a one-time transition tax on accumulated foreign subsidiary earnings not previously subject to U.S. income tax. Due to the timing of the enactment and the complexity involved in applying the provisions of the Tax Act, the company has made reasonable estimates of the effects and recorded provisional amounts in our financial statements as of December 31, 2017. As the company collects and prepares necessary data, and interprets the Tax Act and any additional guidance issued by the U.S. Treasury Department, the IRS, and other standard-setting bodies, the company may make adjustments to the provisional amounts. Those adjustments may materially impact our provision for income taxes and effective tax rate in the period in which the adjustments are made. The accounting for the tax effects of the Tax Act will be completed in 2018.
Risks Related to the Business
The Company is exposed to political, economic and other risks that arise from operating a multinational business. The Company has significant operations outside the United States, including Europe, South Africa, Brazil, Mexico, India, China, and Turkey. Further, the Company obtains raw materials and finished goods from foreign suppliers. Accordingly, the Company’s business is subject to political, economic, and other risks that are inherent in operating a multinational business. These risks include, but are not limited to, the following:
• | Difficulty in enforcing agreements and collecting receivables through foreign legal systems |
• | Trade protection measures and import or export licensing requirements |
• | Inability to obtain raw materials and finished goods in a timely manner from foreign suppliers |
• | Imposition of tariffs, exchange controls or other restrictions |
• | Difficulty in staffing and managing widespread operations and the application of foreign labor regulations |
• | Compliance with foreign laws and regulations |
• | Changes in general economic and political conditions in countries where the Company operates |
8
Additionally, the Company’s operations outside the United States could be negatively impacted by changes in treaties, agreements, policies, and laws implemented by the United States.
If the Company does not anticipate and effectively manage these risks, these factors may have a material adverse impact on its international operations or on the business as a whole.
The Company’s acquisition strategy entails expense, integration risks, and other risks that could affect the Company’s earnings and financial condition. One of the Company’s continuing strategies is to increase revenues and expand market share through acquisitions that will provide complementary Water and Fueling Systems products, add to the Company’s global reach, or both. The Company spends significant time and effort expanding existing businesses through identifying, pursuing, completing, and integrating acquisitions, which generate expense whether or not the acquisitions are actually completed. Competition for acquisition candidates may limit the number of opportunities and may result in higher acquisition prices. There is uncertainty related to successfully acquiring, integrating and profitably managing additional businesses without substantial costs, delays or other problems. There can also be no assurance that acquired companies will achieve revenues, profitability or cash flows that justify the investment. Failure to manage or mitigate these risks could adversely affect the Company’s results of operations and financial condition.
The Company’s products are sold in highly competitive markets, by numerous competitors whose actions could negatively impact sales volume, pricing and profitability. The Company is a global leader in the production and marketing of groundwater and fuel pumping systems. End user demand, distribution relationships, industry consolidation, new product capabilities of the Company’s competitors or new competitors, and many other factors contribute to a highly competitive environment. Additionally, some of the Company’s competitors have substantially greater financial resources than the Company. The Company believes that consistency of product quality, timeliness of delivery, service, and continued product innovation, as well as price, are principal factors considered by customers in selecting suppliers. Competitive factors previously described may lead to declines in sales or in the prices of the Company’s products which could have an adverse impact on its results of operations and financial condition.
The Company’s products are sold to numerous distribution outlets based on market performance. The Company may, from time to time, change distribution outlets in certain markets based on market share and growth. These changes could adversely impact sales and operating results.
Transferring operations of the Company to lower cost regions may not result in the intended cost benefits. The Company is continuing its rationalization of manufacturing capacity between all existing manufacturing facilities and the manufacturing complexes in lower cost regions. To implement this strategy, the Company must complete the transfer of assets and intellectual property between operations. Each of these transfers involves the risk of disruption to the Company’s manufacturing capability, supply chain, and, ultimately, to the Company’s ability to service customers and generate revenues and profits and may include significant severance amounts.
The Company has significant investments in foreign entities and has significant sales and purchases in foreign denominated currencies creating exposure to foreign currency exchange rate fluctuations. The Company has significant investments outside the United States, including Europe, South Africa, Brazil, Mexico, India, China, and Turkey. Further, the Company has sales and makes purchases of raw materials and finished goods in foreign denominated currencies. Accordingly, the Company has exposure to fluctuations in foreign currency exchange rates relative to the U.S. dollar. Foreign currency exchange rate risk is partially mitigated through several means: maintenance of local production facilities in the markets served, invoicing of customers in the same currency as the source of the products, prompt settlement of inter-company balances, limited use of foreign currency denominated debt, and application of derivative instruments when appropriate. To the extent that these mitigating strategies are not successful, foreign currency rate fluctuations can have a material adverse impact on the Company’s international operations or on the business as a whole.
Delays in introducing new products or the inability to achieve or maintain market acceptance with existing or new products may cause the Company’s revenues to decrease. The industries to which the Company belongs are characterized by intense competition, changes in end-user requirements, and evolving product offerings and introductions. The Company believes future success will depend, in part, on the ability to anticipate and adapt to these factors and offer, on a timely basis, products that meet customer demands. Failure to successfully develop new and innovative products or to enhance existing products could result in the loss of existing customers to competitors or the inability to attract new business, either of which may adversely affect the Company’s revenues.
9
Certain Company products are subject to regulation and government performance requirements in addition to the warranties provided by the Company. The Company’s product lines have expanded significantly and certain products are subject to government regulations and standards for manufacture, assembly, and performance in addition to the warranties provided by the Company. The Company’s failure to meet all such standards or perform in accordance with warranties could result in significant warranty or repair costs, lost sales and profits, damage to the Company’s reputation, fines or penalties from governmental organizations, and increased litigation exposure. Changes to these regulations or standards may require the Company to modify its business objectives and incur additional costs to comply. Any liabilities or penalties actually incurred could have a material adverse effect on the Company’s earnings and operating results.
The Company has significant goodwill and intangible assets and future impairment of the value of these assets may adversely affect operating results and financial condition. The Company’s total assets reflect substantial intangible assets, primarily goodwill. Goodwill results from the Company’s acquisitions, representing the excess of the purchase price paid over the fair value of the net assets acquired. Goodwill and indefinite-lived intangible assets are tested annually for impairment during the fourth quarter or as warranted by triggering events. If future operating performance at one or more of the Company’s operating segments were to decline significantly below current levels, the Company could incur a non-cash charge to operating earnings for an impairment. Any future determination requiring the recognition of an impairment of a significant portion of the Company’s goodwill or intangible assets could have a material adverse impact on the Company’s results of operations and financial condition.
The Company’s business may be adversely affected by the seasonality of sales and weather conditions. The Company experiences seasonal demand in a number of markets within the Water Systems segment. End-user demand in primary markets follows warm weather trends and is at seasonal highs from April to August in the Northern Hemisphere. Demand for residential and agricultural water systems are also affected by weather-related disasters including heavy flooding and drought. Changes in these patterns could reduce demand for the Company’s products and adversely impact sales, gross margins, and operating results.
The Company depends on certain key suppliers, and any loss of those suppliers or their failure to meet commitments may adversely affect business and results of operations. The Company is dependent on a single or limited number of suppliers for some materials or components required in the manufacture of its products. If any of those suppliers fail to meet their commitments to the Company in terms of delivery or quality, the Company may experience supply shortages that could result in its inability to meet customer requirements, or could otherwise experience an interruption in operations that could negatively impact the Company’s business and results of operations.
The Company’s operations are dependent on information technology infrastructure and failures could significantly affect its business. The Company depends on information technology infrastructure in order to achieve business objectives. If the Company experiences a problem that impairs this infrastructure, such as a computer virus, a problem with the functioning of an important IT application, or an intentional disruption of IT systems by a third party, the resulting disruptions could impede the Company’s ability to record or process orders, manufacture and ship products in a timely manner, or otherwise carry on business in the ordinary course. Any such events could cause the loss of customers or revenue and could cause significant expense to be incurred to eliminate these problems and address related security concerns. The Company is also in the process of updating its global Enterprise Resource Planning (“ERP”) system that will redesign and deploy a common information system over a period of several years. The process of implementation can be costly and can divert the attention of management from the day-to-day operations of the business. As the Company implements the ERP system, the new system may not perform as expected, which could have an adverse effect on the Company’s business.
Additional Risks to the Company. The Company is subject to various risks in the normal course of business. Exhibit 99.1 sets forth risks and other factors that may affect future results, including those identified above, and is incorporated herein by reference.
ITEM 1B. UNRESOLVED STAFF COMMENTS
None.
ITEM 2. PROPERTIES
Franklin Electric serves customers worldwide with over 175 manufacturing and distribution facilities located in over 20 countries. The Global Headquarters is located in Fort Wayne, Indiana, United States and houses sales, marketing, and administrative offices along with a state of the art research and engineering facility. Besides the owned corporate facility, the Company considers the following to be principal properties:
10
Location / Segment | Purpose | Own/Lease |
Santa Catarina, Brazil / Water & Fueling | Manufacturing/Distribution/Sales | Own |
Sao Paulo, Brazil / Water & Fueling | Manufacturing/Distribution/Sales | Own |
Jiangsu Province, China / Water & Fueling | Manufacturing | Own |
Brno, Czech Republic / Water | Manufacturing | Own |
Vicenza, Italy / Water | Manufacturing | Own |
Nuevo Leon, Mexico / Water & Fueling | Manufacturing | Own |
Edenvale, South Africa / Water | Manufacturing | Own |
Izmir, Turkey / Water | Manufacturing/Distribution/Sales/R&D | Own |
California, United States / Distribution | Distribution | Lease |
Indiana, United States / Water & Fueling | Manufacturing/Distribution/Sales/R&D | Own |
Montana, United States / Distribution | Distribution | Own |
North Carolina, United States / Distribution | Distribution | Own |
Oklahoma, United States / Water | Manufacturing | Own |
Wisconsin, United States / Fueling | Manufacturing/Distribution/Sales/R&D | Own |
The Company also owns and leases other smaller facilities which serve as manufacturing locations and distribution warehouses. The Company does not consider these facilities to be principal to the business or operations. In the Company’s opinion, its facilities are suitable for their intended use, adequate for the Company’s business needs, all currently utilized, and in good condition.
11
EXECUTIVE OFFICERS OF THE REGISTRANT
Current executive officers of the Company, their ages, current position, and business experience during at least the past five years as of December 31, 2017, are as follows:
Name | Age | Position Held | Period Holding Position |
Gregg C. Sengstack | 59 | Chairman of the Board and Chief Executive Officer | 2015 - present |
President and Chief Executive Officer | 2014 - 2015 | ||
President and Chief Operating Officer | 2011 - 2014 | ||
Robert J. Stone | 53 | Senior Vice President and President, International Water Systems | 2012 - present |
Senior Vice President and President, Americas Water Systems Group | 2007 - 2012 | ||
Daniel J. Crose | 70 | Vice President, Global Water Product Supply | 2011 - 2017 |
DeLancey W. Davis | 52 | Vice President and President, Headwater Companies | 2017 - present |
Vice President and President, North America Water Systems | 2012 - 2017 | ||
Donald P. Kenney | 57 | Vice President and President, North America Water Systems | 2017 - present |
Vice President and President, Energy Systems | 2014 - 2017 | ||
President, Energy Systems | 2013 - 2014 | ||
President, Fueling Systems | 1991 - 2013 | ||
John J. Haines | 54 | Vice President, Chief Financial Officer | 2008 - present |
Julie S. Freigang | 50 | Vice President, Chief Information Officer | 2015 - present |
Chief Information Officer | 2014 - 2015 | ||
Vice President, Information Technologies - Eaton Corporation | 2011 - 2014 | ||
Steven W. Aikman | 58 | Vice President, Global Water Systems Engineering | 2010 - present |
Jonathan M. Grandon | 42 | Vice President, Chief Administrative Officer, General Counsel and Secretary | 2016 - present |
Vice President, Integration - Zimmer Biomet | 2015 - 2016 | ||
Senior Vice President and General Counsel - Biomet | 2014 - 2015 | ||
Vice President and Division General Counsel, Associate General Counsel, Corporate - Biomet | 2013 - 2014 | ||
Partner - Ropes & Gray LLP | 2008 - 2013 | ||
All executive officers are elected annually by the Board of Directors at the Board meeting held in conjunction with the annual meeting of shareholders. All executive officers hold office until their successors are duly elected or until their death, resignation, or removal by the Board.
12
PART II
ITEM 5. MARKET FOR REGISTRANT’S COMMON EQUITY, RELATED STOCKHOLDER MATTERS, AND ISSUER PURCHASES OF EQUITY SECURITIES
The number of shareholders of record as of February 13, 2018 was 730. The Company’s stock is traded on the NASDAQ Global Select Market under the symbol FELE.
Dividends paid and the price range per common share as quoted by the NASDAQ Global Select Market for 2017 and 2016 were as follows:
Dividends per Share | Price per Share | ||||||||||||||||||||||
2017 | 2016 | 2017 | 2016 | ||||||||||||||||||||
Low | High | Low | High | ||||||||||||||||||||
1st Quarter | $ | .1000 | $ | .0975 | $ | 38.75 | $ | 43.55 | $ | 23.93 | $ | 32.71 | |||||||||||
2nd Quarter | .1075 | .1000 | 36.55 | 44.75 | 30.58 | 35.37 | |||||||||||||||||
3rd Quarter | .1075 | .1000 | 38.05 | 45.15 | 32.65 | 40.71 | |||||||||||||||||
4th Quarter | .1075 | .1000 | 43.55 | 47.10 | 34.90 | 44.50 | |||||||||||||||||
The Company has increased dividend payments on an annual basis for 25 consecutive periods. The payment of dividends in the future will be determined by the Board of Directors and will depend on business conditions, earnings, and other factors.
Issuer Purchases of Equity Securities
In April 2007, the Company’s Board of Directors unanimously approved a plan to increase the number of shares remaining for
repurchase from 628,692 to 2,300,000 shares. There is no expiration date for this plan. On August 3, 2015, the Company’s Board of Directors approved a plan to increase the number of shares remaining for repurchase by an additional 3,000,000 shares. The authorization was in addition to the 535,107 shares that remained available for repurchase as of July 31, 2015. The Company did not repurchase any shares under this plan during the fourth quarter of 2017. The maximum number of shares that may still be purchased under this plan as of December 31, 2017 is 2,156,362.
13
Stock Performance Graph
The following graph compares the Company’s cumulative total shareholder return (Common Stock price appreciation plus dividends, on a reinvested basis) over the last five fiscal years with the Guggenheim S&P Global Water Index and the Russell 2000 Index.
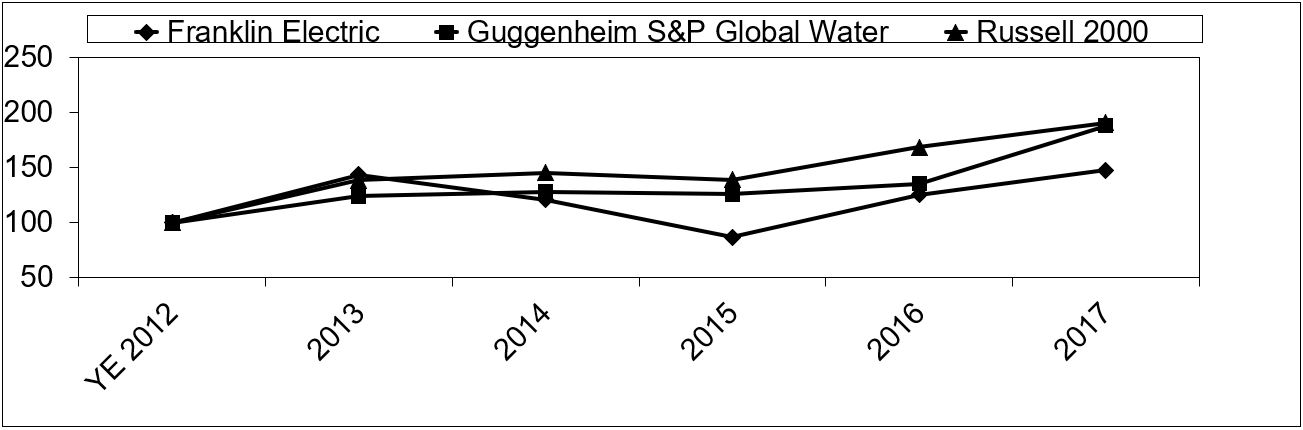
Hypothetical $100 invested on December 29, 2012 (fiscal year-end 2012) in Franklin Electric common stock (FELE), Guggenheim S&P Global Water Index, and Russell 2000 Index, assuming reinvestment of dividends:
YE 2012 | 2013 | 2014 | 2015 | 2016 | 2017 | |||||||||||||||||||
FELE | $ | 100 | $ | 144 | $ | 121 | $ | 87 | $ | 125 | $ | 148 | ||||||||||||
Guggenheim S&P Global Water | 100 | 124 | 128 | 126 | 136 | 188 | ||||||||||||||||||
Russell 2000 | 100 | 139 | 146 | 139 | 169 | 191 | ||||||||||||||||||
14
ITEM 6. SELECTED FINANCIAL DATA
The following selected financial data should be read in conjunction with the Company’s consolidated financial statements. The information set forth below is not necessarily indicative of future operations.
Five Year Financial Summary
(In thousands, except per share amounts and ratios) | 2017 | 2016 | 2015 | 2014 | 2013 | ||||||||||||||
(d) | (c) | ||||||||||||||||||
Operations: | |||||||||||||||||||
Net sales | $ | 1,124,909 | $ | 949,856 | $ | 924,923 | $ | 1,044,777 | $ | 965,462 | |||||||||
Gross profit | 376,982 | 331,406 | 297,608 | 344,410 | 331,514 | ||||||||||||||
Interest expense | 10,322 | 8,732 | 10,039 | 10,735 | 10,597 | ||||||||||||||
Income tax expense | 25,994 | 24,798 | 12,625 | 18,851 | 28,851 | ||||||||||||||
Net income attributable to Franklin Electric Co., Inc. | 78,180 | 78,745 | 72,945 | 69,806 | 81,958 | ||||||||||||||
Depreciation and amortization | 38,506 | 35,534 | 35,476 | 37,210 | 31,356 | ||||||||||||||
Capital expenditures | 33,379 | 37,624 | 25,933 | 42,396 | 67,206 | ||||||||||||||
Balance sheet: | |||||||||||||||||||
Working capital (a)(b)(e) | 343,230 | 326,058 | 293,450 | 268,434 | 333,880 | ||||||||||||||
Property, plant, and equipment, net | 215,694 | 196,137 | 190,039 | 209,786 | 208,596 | ||||||||||||||
Total assets (a) | 1,185,353 | 1,039,905 | 996,111 | 1,075,797 | 1,051,770 | ||||||||||||||
Long-term debt (a) | 125,596 | 156,544 | 187,806 | 143,605 | 174,063 | ||||||||||||||
Shareholders’ equity | 700,657 | 613,445 | 557,700 | 596,840 | 595,707 | ||||||||||||||
Other data: | |||||||||||||||||||
Net income attributable to Franklin Electric Co., Inc., to sales | 7.0 | % | 8.3 | % | 7.9 | % | 6.7 | % | 8.5 | % | |||||||||
Net income attributable to Franklin Electric Co., Inc., to average total assets | 7.0 | % | 7.7 | % | 7.0 | % | 6.6 | % | 8.1 | % | |||||||||
Current ratio (b)(f) | 2.4 | 3.1 | 3.0 | 2.3 | 3.4 | ||||||||||||||
Number of common shares outstanding | 46,630 | 46,376 | 46,219 | 47,594 | 47,715 | ||||||||||||||
Per share: | |||||||||||||||||||
Market price range | |||||||||||||||||||
High | $ | 47.10 | $ | 44.50 | $ | 39.56 | $ | 45.42 | $ | 45.62 | |||||||||
Low | $ | 36.55 | $ | 23.93 | $ | 26.75 | $ | 33.93 | $ | 29.95 | |||||||||
Net income attributable to Franklin Electric Co., Inc., per weighted average common share | $ | 1.67 | $ | 1.67 | $ | 1.52 | $ | 1.43 | $ | 1.70 | |||||||||
Net income attributable to Franklin Electric Co., Inc., per weighted average common share, assuming dilution | $ | 1.65 | $ | 1.65 | $ | 1.50 | $ | 1.41 | $ | 1.68 | |||||||||
Book value (g) | $ | 14.89 | $ | 13.12 | $ | 11.73 | $ | 12.38 | $ | 12.38 | |||||||||
Dividends per common share | $ | 0.4225 | $ | 0.3975 | $ | 0.3825 | $ | 0.3475 | $ | 0.3050 | |||||||||
(a) | In 2016, the Company adopted Financial Accounting Standard Board (“FASB”) Accounting Standard Update (“ASU”) 2015-03, Interest - Imputation of Interest (Subtopic 835-30): Simplifying the Presentation of Debt Issuance Costs. This ASU required retrospective adoption; therefore, years 2015, 2014, and 2013 were restated above to reflect the adoption of the ASU. |
(b) | Balances as of year-end 2014, and 2013 were not retrospectively adjusted for the adoption of ASU 2015-17, Income Taxes (Topic 740): Balance Sheet Classification of Deferred Taxes, which related to the presentation of deferred taxes. |
(c) | Includes the results of operations of the Company’s 100% wholly owned subsidiary, Bombas Leao S.A., since its acquisition in the second quarter of 2014, and 90% of the Company’s owned subsidiary, Impo Motor Pompa Sanayi ve Ticaret A.S., since the Company’s acquisition of an additional 10% in the second quarter of 2014. |
15
(d) | Includes the results of operations of the Company’s 100% wholly owned subsidiaries since its acquisition of three groundwater distribution companies (2M Company, Inc. (“2M”), Drillers Service, Inc. (“DSI”), and Western Hydro, LLC (“Western Hydro”)) in the second quarter of 2017, and 100% of the Company’s owned subsidiary, Impo Motor Pompa Sanayi ve Ticaret A.S., since the Company’s acquisition of an additional 10% in the second quarter of 2017. |
(e) | Working capital = Current assets minus current liabilities. |
(f) | Current ratio = Current assets divided by current liabilities. |
(g) | Book value = Shareholders’ equity divided by weighted average common shares, assuming full dilution. |
16
ITEM 7. MANAGEMENT’S DISCUSSION AND ANALYSIS OF FINANCIAL CONDITION AND RESULTS OF OPERATIONS
2017 vs. 2016
OVERVIEW
Sales in 2017 were up from last year. Net sales in 2017 were $1,124.9 million, an increase of $175.0 million or about 18 percent compared to 2016 sales of $949.9 million. The sales increase was primarily related to acquisitions. In 2017, the Company acquired a controlling interest in several distribution companies. The distribution companies are reported collectively as a new segment. The Company's consolidated gross profit was $377.0 million for 2017, an increase of $45.6 million or about 14 percent from 2016. The gross profit as a percent of net sales decreased 140 basis points to 33.5 percent in 2017 from 34.9 percent in 2016. The decline in gross profit margin percentage is primarily due to product and geographic sales mix shifts and higher raw material costs. For 2017, diluted earnings per share were $1.65, flat to 2016 diluted earnings per share of $1.65. The Company recorded a net tax expense of $10.2 million, or $0.21 in diluted earnings per share related to the enactment of the U.S. Tax Cuts and Jobs Act of 2017. Before the impact of the U.S. Tax Cuts and Jobs Act of 2017, diluted earnings per share for 2017 were $1.86 compared to the 2016 diluted earnings per share of $1.65 or an increase of about 13 percent.
RESULTS OF OPERATIONS
Net Sales
Net sales in 2017 were $1,124.9 million, an increase of $175.0 million or about 18 percent compared to sales in 2016 of $949.9 million. The sales increase was primarily from acquisition related sales. Sales revenue increased by $2.7 million or less than 1 percent in 2017 due to foreign currency translation. The sales change in 2017, excluding acquisitions and foreign currency translation, was a decrease of $4.4 million or less than 1 percent.
Net Sales | |||||||||||
(In millions) | 2017 | 2016 | 2017 v 2016 | ||||||||
Water Systems | $ | 748.6 | $ | 723.2 | $ | 25.4 | |||||
Fueling Systems | 245.9 | 226.7 | 19.2 | ||||||||
Distribution | 176.7 | — | 176.7 | ||||||||
Eliminations/Other | (46.3 | ) | — | (46.3 | ) | ||||||
Consolidated | $ | 1,124.9 | $ | 949.9 | $ | 175.0 | |||||
Net Sales-Water Systems
Water Systems sales were $748.6 million in 2017 and increased by $25.4 million or about 4 percent versus 2016. Foreign currency translation rate changes increased sales $2.0 million compared to sales in 2016. The Water Systems sales change in 2017, excluding foreign currency translation, was an increase of $23.4 million or about 3 percent.
Water Systems sales in the U.S. and Canada were up about 3 percent compared to 2016. The impact of foreign currency translation was not significant. Sales of Pioneer branded dewatering equipment increased by about 50 percent in 2017 when compared to the prior year resulting from the continued diversification of customers and strengthening in U.S. oil and gas end markets. Sales of other surface pumping equipment increased by 2 percent primarily in wastewater related products. Sales of groundwater pumping equipment were down by about 2 percent overall with flat residential water systems offset with declines in agricultural systems.
Water Systems sales in markets outside the U.S. and Canada overall increased by about 4 percent. The impact of foreign currency translation was not significant. International Water Systems sales were led by improved sales in Europe, including higher sales of Pioneer branded equipment, and the Middle East and Africa, but were offset by lower sales, in local currency, in the Latin American markets compared to last year.
Net Sales-Fueling Systems
Fueling Systems sales were $245.9 million in 2017 and increased $19.2 million or about 8 percent from 2016. Foreign currency translation rate changes increased sales $0.7 million or less than 1 percent compared to sales in 2016. The Fueling Systems sales change in 2017, excluding foreign currency translation, was an increase of $18.5 million or about 8 percent.
17
Fueling Systems sales in the U.S. and Canada grew by about 4 percent during 2017 with sales growth coming from all product lines. Outside the U.S. and Canada, Fueling Systems revenues were up by about 14 percent overall with increased sales in China and Europe partially offset by lower sales in India.
Net Sales-Distribution
Distribution sales were $176.7 million in 2017 and were all acquisition related. Management estimates Distribution sales declined by about 6 percent from 2016 primarily driven by supply chain disruptions and weak end market conditions in the Southeast region of the United States.
Cost of Sales
Cost of sales as a percent of net sales for 2017 and 2016 was 66.5 percent and 65.1 percent, respectively. Correspondingly, the gross profit margin was 33.5 percent and 34.9 percent for both years. The Company’s consolidated gross profit was $377.0 million for 2017, up $45.6 million from the gross profit of $331.4 million in 2016. The gross profit increase was primarily due to higher sales. The decline in gross profit margin percentage is partially attributable to the inclusion of the Distribution segment which impacted the margin by about 20 basis points and the balance is due to product and geographic sales mix shifts and higher raw material costs.
Selling, General and Administrative (“SG&A”)
Selling, general, and administrative expenses were $265.7 million in 2017 and increased by $44.5 million or 20 percent in 2017 compared to $221.2 million last year. The increase in SG&A expenses from acquired businesses were $45.1 million. Excluding the acquired entities, the Company’s SG&A expenses in 2017 were $220.6 and decreased by $0.6 million or flat to last year.
Restructuring Expenses
Restructuring expenses for 2017 were $4.3 million. Restructuring expenses were $2.7 million in the Water segment primarily related to the continuing Brazilian manufacturing realignments. Restructuring expenses were primarily severance expenses and other miscellaneous manufacturing realignment activities. The Fueling segment restructuring expenses in 2017 were $1.6 million. The Company wrote off its ownership share in a Fueling Systems joint venture in India. Restructuring charges for 2016 resulted in a net gain of $0.6 million. Restructuring expenses for 2016 included a gain of $2.0 million from the sale of land and building in Brazil and $1.4 million in expenses related to severance, equipment transfers, freight and relocation cost related to the transfer of production activities and other restructuring costs from continued manufacturing realignments.
Operating Income
Operating income was $107.0 million in 2017, down $3.8 million or about 3 percent from $110.8 million in 2016.
Operating income (loss) | ||||||||||||
(In millions) | 2017 | 2016 | 2017 v 2016 | |||||||||
Water Systems | $ | 102.0 | $ | 108.2 | $ | (6.2 | ) | |||||
Fueling Systems | 60.0 | 56.3 | 3.7 | |||||||||
Distribution | 3.7 | — | 3.7 | |||||||||
Eliminations/Other | (58.7 | ) | (53.7 | ) | (5.0 | ) | ||||||
Consolidated | $ | 107.0 | $ | 110.8 | $ | (3.8 | ) | |||||
Operating Income-Water Systems
Water Systems operating income was $102.0 million in 2017, down $6.2 million or about 6 percent versus 2016 of $108.2 million and operating income margin was 13.6 percent in 2017 compared to the 15.0 percent in 2016. As mentioned above Water Systems operating income was negatively impacted by $2.7 million in restructuring expenses in 2017 and favorably impacted by $1.2 million in the prior year. Water Systems operating income before restructuring was $104.7 million in 2017 and $107.0 million in 2016 and operating income margin before restructuring was 14.0 percent compared to the 14.8 percent in 2016. The decline in operating income margin is primarily related to product and geographic sales mix shifts and higher raw material costs.
Operating Income-Fueling Systems
Fueling Systems operating income was $60.0 million in 2017, up $3.7 million or about 7 percent compared to $56.3 million in 2016. The 2017 operating income margin was 24.4 percent compared to the 24.8 percent of net sales in 2016. As mentioned above Fueling Systems operating income was negatively impacted by $1.6 million in restructuring expenses in 2017 and
18
impacted by $0.6 million in the prior year. Fueling Systems operating income before restructuring was $61.6 million in 2017 and $56.9 million in 2016 and operating income margin before restructuring was 25.1 percent in both 2017 and 2016. The increase in operating income was primarily due to higher sales.
Operating Income-Distribution
Distribution operating income was $3.7 million in 2017 and the operating income margin was 2.1 percent.
Operating Income-Eliminations/Other
Operating income-Eliminations/Other is composed primarily of inter-segment sales and profit eliminations and unallocated general and administrative expenses. The inter-segment profit elimination impact in 2017 was $5.5 million. The intersegment elimination of operating income effectively defers the operating income on sales from Water Systems to Distribution in the consolidated financial results until such time as the transferred product is sold from the Distribution segment to its end third party customer. General and administrative expenses were lower by $0.5 million or flat to last year.
Interest Expense
Interest expense for 2017 and 2016 was $10.3 million and $8.7 million, respectively. The increase in interest expense in 2017 is due to interest charges on prior years VAT taxes as a result of an audit in an international jurisdiction and due to higher average borrowings resulting from the Headwater acquisitions.
Other Income or Expense
Other income or expense was income of $6.9 million in 2017. Included in other income in 2017 was a gain of $5.2 million related to the acquisition of controlling interests in three Distribution entities previously held as equity investments. Also, included in other income in 2017 was minority income of $0.6 million and interest income of $0.9 million, primarily derived from the investment of cash balances in short-term securities. 2016 was income of $1.0 million. Included in other income in 2016 was minority income $1.7 million and interest income of $1.0 million, primarily derived from the investment of cash balances in short-term securities.
Foreign Exchange
Foreign currency-based transactions produced a gain for 2017 and 2016 of $1.0 million and $1.1 million, respectively.
Income Taxes
The provision for income taxes in 2017 and 2016 was $26.0 million and $24.8 million, respectively. The effective tax rate for 2016 was about 24 percent and, before the impact of discrete events, was about 26 percent. The effective tax rate for 2017 was about 25 percent, both before and after the impact of discrete events. The tax rate was lower than the statutory rate of 35 percent primarily due to foreign earnings taxed at lower statutory rates and the recognition of US incentives. The Company recorded a provisional net tax expense of $10.2 million relating to the enactment of the U.S. Tax Cuts and Jobs Act of 2017. This expense was primarily derived from the recognition of a U.S. tax liability for the deemed repatriation of foreign earnings partially offset by the revaluation of other deferred tax liabilities. Other discrete benefits of $10.3 million offset the expense including a foreign currency translation loss on the repayment of an intercompany loan that was a long-term-investment in nature, a tax restructuring in a foreign tax jurisdiction that released a valuation allowance on a deferred tax asset, a tax benefit on the non-taxable gain recorded on the previously held equity investments, excess tax benefits from share-based compensation and the statute expiration on foreign uncertain tax positions. In 2018, the Company estimates its effective tax rate will be 13 to 17 percent, or about 10 points lower than the effective tax rate of 25 percent in 2017. The lower tax rate is primarily the result of the U.S. Tax Cuts and Jobs Act of 2017.
Net Income
Net income for 2017 was $78.6 million compared to 2016 net income of $79.3 million. Net income attributable to Franklin Electric Co., Inc. for 2017 was $78.2 million, or $1.65 per diluted share, compared to 2016 net income attributable to Franklin Electric Co., Inc. of $78.7 million or $1.65 per diluted share.
2016 vs. 2015
OVERVIEW
Sales in 2016 increased from the prior year. Net sales in 2016 were $949.9 million, an increase of about 3 percent compared to 2015 sales of $924.9 million. The sales increase was attributable to both volume and price increases partially offset by the impact of foreign currency translation as the US dollar strengthened against certain foreign currencies. The Company’s consolidated gross profit was $331.4 million for 2016, an increase of $33.8 million or about 11 percent from 2015. The gross profit as a percent of net sales increased 270 basis points to 34.9 percent in 2016 from 32.2 percent in 2015. The gross profit
19
margin change was due primarily to favorable pricing, lower direct material costs and lower fixed cost on higher sales. For 2016, diluted earnings per share were $1.65, an increase of 10 percent compared to 2015 diluted earnings per share of $1.50.
RESULTS OF OPERATIONS
Net Sales
Net sales in 2016 were $949.9 million, an increase of $25.0 million or about 3 percent compared to 2015 sales of $924.9 million. The incremental impact of sales from acquired businesses was $0.7 million. Sales revenue decreased by $23.2 million or about 2 percent in 2016 due to foreign currency translation. The sales change in 2016, excluding acquisitions and foreign currency translation, was an increase of $47.5 million or about 5 percent.
Net Sales | ||||||||||||
(In millions) | 2016 | 2015 | 2016 v 2015 | |||||||||
Water Systems | $ | 723.2 | $ | 707.6 | $ | 15.6 | ||||||
Fueling Systems | 226.7 | 217.3 | 9.4 | |||||||||
Consolidated | $ | 949.9 | $ | 924.9 | $ | 25.0 | ||||||
Net Sales-Water Systems
Water Systems sales were $723.2 million in 2016, an increase of $15.6 million or 2 percent versus 2015. The incremental impact of sales from acquired businesses was $0.7 million. Foreign currency translation rate changes decreased sales $21.4 million, or about 3 percent, compared to sales in 2015. The sales change in 2016, excluding acquisitions and foreign currency translation, was an increase of $36.3 million or about 5 percent.
Water Systems sales in the U.S. and Canada were 36 percent of consolidated sales and increased by about 5 percent in 2016 compared to the prior year. Sales revenue decreased by $2.1 million or less than 1 percent in 2016 due to foreign currency translation. The sales change in 2016, excluding acquisitions and foreign currency translation, was an increase of $16.4 million or about 5 percent. In 2016, sales of groundwater pumping equipment increased by about 9 percent. The growth in groundwater equipment sales was led by a 12 percent increase in sales of products for both residential and agricultural applications. Sales of Pioneer branded mobile dewatering equipment declined by about 12 percent. The decline in mobile dewatering equipment is primarily attributed to reduced demand in the oil and gas end markets.
Water Systems sales in Europe, Middle East and Africa were about 17 percent of consolidated sales and declined by about 4 percent compared to 2015. Water Systems in Europe, the Middle East and Africa were reduced by $10.5 million or about 6 percent due to foreign currency translation. Excluding the impact of foreign currency translation, sales were up in 2016 by about 2 percent compared to 2015. The growth was driven by strong sales of groundwater pumping equipment in Turkey.
In local currency sales in Turkey grew; however, this growth was offset by sales declines in other parts of the region due to political and economic turmoil and the lower price of oil which reduced investment by the public sector, particularly in Saudi Arabia.
Water Systems sales in Latin America were about 14 percent of consolidated sales for 2016 and declined by about 1 percent compared to 2015. Sales revenue decreased by $8.5 million or about 7 percent in 2016 due to foreign currency translation. The sales change in 2016, excluding foreign currency translation, was an increase of $7.4 million or about 6 percent. The growth in sales was led by increased sales in Mexico and Brazil, in local currency. This sales growth is a result of increasing demand for Franklin submersible pumps and motors, customer acceptance of the many product line upgrades that have been implemented over the past two years, and general market conditions.
Water Systems sales in the Asia Pacific region were 9 percent of consolidated sales and grew by about 12 percent compared to the prior year. Foreign currency translation rate changes decreased sales in 2016 in the Asia Pacific region by less than a percent. The Asia Pacific region experienced strong year over year growth in Southeast Asia and Australia.
Net Sales-Fueling Systems
Fueling Systems sales which represented 24 percent of consolidated sales were $226.7 million in 2016, an increase of $9.4 million or about 4 percent versus 2015. Foreign currency translation rate changes decreased sales $1.8 million or about 1 percent compared to sales in 2015. The sales change in 2016, excluding acquisitions and foreign currency translation, was an increase of $11.2 million or about 5 percent.
Fueling Systems sales in the U.S. and Canada grew by about 8 percent in 2016 compared to the prior year with sales growth coming from most product lines, most significantly our pumping and fuel management systems. Fueling Systems sales in the
20
rest of the world were down about 2 percent year over year. In 2016, Fueling Systems revenues increased in the Asia Pacific regions by about 14 percent, driven by higher sales in India. This growth in Asia was more than offset by a sales decline in Europe principally due to a 42 percent decline in the sale of storage tanks that support North Sea oil production.
Cost of Sales
Cost of sales as a percent of net sales for 2016 and 2015 was 65.1 percent and 67.8 percent, respectively. Correspondingly, the gross profit margin increased to 34.9 percent from 32.2 percent, a 270 basis point improvement. The gross profit margin increase was primarily due to lower raw material costs and lower fixed costs. Direct materials as a percentage of sales was 44.8 percent down 210 basis points compared to 46.9 percent last year. This decrease in direct materials was primarily due to favorable pricing and lower direct material costs. The Company’s consolidated gross profit was $331.4 million for 2016, up $33.8 million or 11 percent from 2015.
Selling, General and Administrative (“SG&A”)
Selling, general, and administrative (SG&A) expenses were $221.2 million in 2016 and increased by $16.9 million or about 8 percent in 2016 compared to last year. In 2016, increases in SG&A attributable to higher variable compensation expenses were about $12 million or about 6 percent. Additional year over year changes in SG&A costs were primarily in Marketing and Selling related expenses which increased about $2.5 million to support sales growth and, also, Research, Development & Engineering expense which increased by $2.3 million in the year.
Restructuring (Income)/Expense
Restructuring expenses for 2016 netted to a gain of $(0.6) million and increased diluted earnings per share about $0.01. Restructuring expenses for 2016 included a gain of $(2.0) million from the sale of land and building in Brazil and $1.4 million in expenses related to severance and pension costs, equipment relocation expenses, asset write-downs and other costs related to the transfer of production activities and other restructuring costs from continued manufacturing realignments.
Restructuring expenses for 2015 were $3.0 million and decreased diluted earnings per share about $0.04. Restructuring expenses in 2015 included severance and pension costs, equipment relocation expenses, and asset write-downs primarily related to the closure of the Wittlich, Germany facility and other manufacturing realignment activities in Europe and Brazil.
Operating Income
Operating income was $110.8 million in 2016, up $20.4 million from $90.4 million in 2015.
Operating income (loss) | ||||||||||||
(In millions) | 2016 | 2015 | 2016 v 2015 | |||||||||
Water Systems | $ | 108.2 | $ | 86.7 | $ | 21.5 | ||||||
Fueling Systems | 56.3 | 51.5 | 4.8 | |||||||||
Other | (53.7 | ) | (47.8 | ) | (5.9 | ) | ||||||
Consolidated | $ | 110.8 | $ | 90.4 | $ | 20.4 | ||||||
Operating Income-Water Systems
Water Systems operating income was $108.2 million in 2016, up $21.5 million or 25 percent versus the 2015. The 2016 operating income margin was 15.0 percent, up 270 basis points from 12.3 percent in 2015. The increase in basis points was primarily due to improved margins from lower variable costs.
Operating Income-Fueling Systems
Fueling Systems operating income was $56.3 million in 2016, up $4.8 million or about 9 percent compared to $51.5 million in 2015. The 2016 operating income margin was 24.8 percent, an increase of 110 basis points from the as reported 23.7 percent of net sales in 2015. The increase in basis points was primarily due to improved margins from lower variable costs.
Operating Income-Other
Operating income-other is composed primarily of unallocated general and administrative expenses. General and administrative expenses were higher, primarily due to higher variable compensation expenses.
Interest Expense
Interest expense for 2016 and 2015 was $8.7 million and $10.0 million, respectively.
21
Other Income or Expense
Other income or expense was a gain of $1.0 million in 2016. Included in other income or expense in 2016 was minority income of $1.7 million and interest income of $1.0 million, primarily derived from the investment of cash balances in short-term securities. In 2016, other expenses also included the reversal of an indemnification receivable related to a contingent tax liability for $1.9 million recorded at the time of a foreign acquisition. The contingent tax liability was for the same amount and was also reversed in 2016 and the benefit was recorded in the income tax provision. Other income or expense was income of $6.9 million in 2015. Included in other income or expense in 2016 was minority income of $2.8 million and interest income of $1.3 million, primarily derived from the investment of cash balances in short-term securities. The Company also realized a gain on the settlement of the redeemable non-controlling interest liability in the first quarter of 2015 of about $2.7 million.
Foreign Exchange
Foreign currency-based transactions produced a gain for 2016 of $1.1 million, primarily due to the Turkish lira relative to the U.S. dollar and euro. Foreign currency-based transactions produced a loss for 2015 of $0.9 million, primarily due to the South African rand, Colombian peso and Australian dollar relative to the U.S. dollar, none of which individually were significant.
Income Taxes
The provision for income taxes in 2016 and 2015 was $24.8 million and $12.6 million, respectively. The tax rate for 2016 was 23.8 percent and 2015 was 14.6 percent. Discrete adjustments in 2016 were primarily due to the favorable impact from equity compensation share based payments and the reversal of a contingent tax liability offset by adjustments to the Company’s valuation allowance against certain state deferred tax assets that are not likely to be realized. Discrete adjustments during 2015 were the reversal of a deferred tax liability of about $4.8 million created in 2012 when the Company acquired the controlling interest in the Pioneer subsidiary and realized a gain on the then equity investment in Pioneer. This purchase transaction also resulted in other tax benefits of about $3.5 million. The tax rate before discrete adjustments for 2016 was about 26 percent and 2015 was about 27 percent. The tax rate is lower than the statutory rate of 35 percent primarily due to the indefinite reinvestment of foreign earnings and reduced taxes on foreign and repatriated earnings. The Company has the ability to indefinitely reinvest these foreign earnings based on the earnings and cash projections of its other operations, current cash on hand and available credit.
Net Income
Net income for 2016 was $79.3 million compared to 2015 net income of $73.7 million. Net income attributable to Franklin Electric Co., Inc. for 2016 was $78.7 million, or $1.65 per diluted share, compared to 2015 net income attributable to Franklin Electric Co., Inc. of $72.9 million or $1.50 per diluted share.
CAPITAL RESOURCES AND LIQUIDITY
Sources of Liquidity
The Company’s primary sources of liquidity are cash on hand, cash flows from operations, revolving credit agreements, and long-term debt funds available. The Company believes its capital resources and liquidity position at December 31, 2017 is adequate to meet projected needs for the foreseeable future. The Company expects ongoing requirements for operations, capital expenditures, pension obligations, dividends, share repurchases, and debt service will be adequately funded from cash on hand, operations, and existing credit agreements.
On December 22, 2017, the U.S. Tax Cuts and Jobs Act of 2017 was enacted, and the Company recorded a tax liability for the transition tax on accumulated foreign subsidiary earnings of $18.9 million, of which $1.5 million and $17.4 million were presented within the “income taxes” and “income taxes payable non-current” respectively on the Company’s Consolidated Balance Sheets as of December 31, 2017. As permitted by the Tax Act, the Company intends to pay the transition tax in eight variable annual interest-free installments beginning in 2018.
As of December 31, 2017, the Company had a $300.0 million revolving credit facility. The facility is scheduled to mature on October 28, 2021. As of December 31, 2017, the Company had $227.5 million borrowing capacity under the Credit Agreement as $5.5 million in letters of commercial and standby letters of credit were outstanding and undrawn and $67.0 million in revolver borrowings were drawn and outstanding as of the end of the year which were primarily used for acquisition and working capital needs.
The Company also has other long-term debt borrowings outstanding as of December 31, 2017. See Note 11 - Debt for additional specifics regarding these obligations and future maturities.
22
At December 31, 2017, the Company had $59.2 million of cash and cash equivalents held in foreign jurisdictions, which is intended to be used to fund foreign operations. There is currently no need to repatriate these funds in order to meet domestic funding obligations or scheduled cash distributions.
Cash Flows
The following table summarizes significant sources and uses of cash and cash equivalents:
(in thousands) | 2017 | 2016 | 2015 | ||||||||
Net cash provided by operating activities | $ | 66.8 | $ | 115.4 | $ | 99.6 | |||||
Net cash used in investing activities | (84.7 | ) | (33.8 | ) | (29.6 | ) | |||||
Net cash used in financing activities | (22.6 | ) | (51.7 | ) | (41.1 | ) | |||||
Impact of exchange rates on cash and cash equivalents | 3.4 | (7.1 | ) | (6.5 | ) | ||||||
Change in cash and cash equivalents | $ | (37.1 | ) | $ | 22.8 | $ | 22.4 | ||||
Cash Flows Provided by Operating Activities
2017 vs. 2016
Net cash provided by operating activities was $66.8 million for 2017 compared to $115.4 million for 2016. A decrease in cash provided by operations in 2017 was largely attributable to an increase in inventory. Inventory increased primarily as actual shipments were less than sales projections for 2017 as well as advance purchases of strategic inventory products. The Company also had higher uses of cash related to payments to vendors and reduction of other accrued liabilities, primarily payments of incentive compensation
2016 vs. 2015
Net cash provided by operating activities was $115.4 million for 2016 compared to $99.6 million for 2015. An increase in cash provided by operations in 2016 was partially attributable to large cash outflows in 2015 related to restructuring costs previously accrued at year-end 2014. The increase in cash provided was partially offset by increased cash used during 2016 for higher receivables and inventory balances compared to year-end 2015, driven by higher sales volumes in 2016. Finally, during 2015 the mandatory share purchase liability of $22.9 million for Pioneer was settled, resulting in a non-cash gain and reversal of certain deferred tax liabilities, also non-cash, both of which were adjustments to net income.
Cash Flows Used in Investing Activities
2017 vs. 2016
Net cash used in investing activities was $84.7 million in 2017 compared to $33.8 million in 2016. The increase was almost entirely attributable to cash paid related to the Distribution acquisitions during the second quarter of 2017. The remainder of the change was partially offset by decreased capital expenditures in the current year due to the purchase of a building in the first quarter of 2016.
2016 vs. 2015
Net cash used in investing activities was $33.8 million in 2016 compared to $29.6 million in 2015. During 2016, the Company had increased capital expenditures compared to 2015, primarily attributable to the purchase of a building in the first quarter. Cash expended on this purchase was partially offset with proceeds realized from the sale of an idle building in Brazil which completed during the third quarter of 2016.
Cash Flows Used in Financing Activities
2017 vs. 2016
Net cash flows from financing activities were uses of cash of $22.6 million in 2017 compared to $51.7 million in 2016. The decrease of cash used in financing activities was primarily attributable to decreased repayment relative to overall borrowings in the current year.
2016 vs. 2015
Net cash flows from financing activities were uses of cash of $51.7 million in 2016 compared to $41.1 million in 2015. During 2016, the Company had net repayments of debt of about $30.4 million compared to net borrowings during 2015 of about $43.6 million, resulting in a greater use of cash. The Company paid dividends of $19.1 million in 2016, which was up slightly from $18.9 million in 2015. In addition, in 2015 the Company made a payment of $20.2 million for the Pioneer mandatory share purchase liability and repurchased a significant amount of the Company’s common stock, which were both large uses of cash that did not repeat in 2016.
23
AGGREGATE CONTRACTUAL OBLIGATIONS
The majority of the Company’s contractual obligations to third parties relate to debt obligations. In addition, the Company has certain contractual obligations for future lease payments and purchase obligations. The payment schedule for these contractual obligations is as follows:
(In millions) | More than | ||||||||||||||||||
Total | 2018 | 2019-2020 | 2021-2022 | 5 years | |||||||||||||||
Debt | $ | 226.3 | $ | 100.4 | $ | 32.6 | $ | 2.5 | $ | 90.8 | |||||||||
Debt interest | 26.8 | 5.7 | 6.8 | 5.7 | 8.6 | ||||||||||||||
Capital leases | 0.1 | 0.1 | — | — | — | ||||||||||||||
Operating leases | 37.2 | 12.0 | 15.0 | 7.9 | 2.3 | ||||||||||||||
Purchase obligations | 5.9 | 5.9 | — | — | — | ||||||||||||||
Income Taxes-U.S. Tax Cuts and Jobs Act transition tax | $ | 18.9 | $ | 1.5 | $ | 3.0 | $ | 3.0 | $ | 11.4 | |||||||||
$ | 315.2 | $ | 125.6 | $ | 57.4 | $ | 19.1 | $ | 113.1 | ||||||||||
The Company has pension and other post-retirement benefit obligations not included in the table above which will result in estimated future payments of approximately $4 million in 2018. The Company also has unrecognized tax benefits, none of which are included in the table above. The unrecognized tax benefits of approximately $1.3 million have been recorded as liabilities and the Company is uncertain as to if or when such amounts may be settled. Related to the unrecognized tax benefits, the Company has also recorded a liability for potential penalties and interest of $0.6 million.
ACCOUNTING PRONOUNCEMENTS
Accounting Standards Issued But Not Yet Adopted
In February 2018, the Financial Accounting Standards Board (“FASB”) issued Accounting Standards Update (“ASU”) 2018-02: Reclassification of Certain Tax Effects from Accumulated Other Comprehensive Income. This ASU was issued following the enactment of the U.S. Tax Cuts and Jobs Act of 2017 and permits entities to elect a reclassification from accumulated other comprehensive income to retained earnings for stranded tax effects resulting from the Tax Act. The ASU is effective for interim and annual periods beginning after December 15, 2018, with early adoption permitted, and may be applied either at the beginning of the period of adoption or retrospectively to each period in which the effect of the change in the U.S. federal corporate income tax rate in the Tax Act is recognized. The Company is currently assessing the impact of the ASU on the Company’s consolidated financial statements and the notes to the financial statements.
In March 2017, the Financial Accounting Standards Board (“FASB”) issued Accounting Standards Update (“ASU”) 2017-07, Compensation - Retirement Benefits (Topic 715): Improving the Presentation of Net Periodic Pension Cost and Net Periodic Postretirement Benefit Cost. This ASU requires entities to present only the service cost component of net periodic benefit cost as an operating expense (consistent with the presentation of other employee compensation costs). The other components of net periodic benefit cost are to be presented as a non-operating expense. The ASU is effective on a retrospective basis for interim and annual periods beginning after December 15, 2017. Early adoption is permitted as of the beginning of any annual period for which an entity’s financial statements have not been issued or made available for issuance. The Company plans to adopt the ASU in the first quarter ending March 31, 2018 and does not expect the adoption to have a material impact on the Company’s consolidated financial position, results of operations, or cash flows.
In January 2017, the FASB issued ASU 2017-04, Intangibles - Goodwill and Other (Topic 350): Simplifying the Test for Goodwill Impairment. ASU 2017-04 removes step two from the goodwill impairment test and instead requires an entity to recognize a goodwill impairment charge for the amount by which the goodwill carrying amount exceeds the reporting unit’s fair value. The ASU is effective on a prospective basis for interim and annual periods beginning after December 15, 2019 with early adoption permitted. The Company is still determining the date of adoption for this ASU but does not anticipate the adoption to have a material impact on the Company’s consolidated financial position, results of operations, or cash flows.
In February 2016, the FASB issued ASU 2016-02, Leases (Topic 842), which supersedes existing guidance on accounting for leases found in Accounting Standards Codification (“ASC”) Topic 840. This ASU requires lessees to present right-of-use assets and lease liabilities on the balance sheet for all leases with terms longer than 12 months. The guidance is to be applied using a modified retrospective approach at the beginning of the earliest comparative period in the financial statements and is effective for interim and annual periods beginning after December 15, 2018 with early adoption permitted. The Company has
24
begun the evaluation process for the adoption of the ASU, and anticipates that the majority of the Company’s outstanding operating leases would be recognized as right-of-use assets and lease liabilities upon adoption, resulting in a material impact to the Company’s consolidated balance sheets. The impact of this ASU is non-cash in nature and will not affect the Company’s cash position. The impact to the Company’s results of operations is still being evaluated.
In May 2014, the FASB issued ASU 2014-09, Revenue from Contracts with Customers (Topic 606) as modified by subsequently issued ASUs 2015-14, 2016-08, 2016-10, 2016-12 and 2016-20 (collectively ASU 2014-09). Topic 606 supersedes the revenue recognition requirements in Accounting Standards Codification (“ASC”) Topic 605, Revenue Recognition (“Topic 605”), and requires the recognition of revenue when promised goods or services are transferred to customers in an amount that reflects the considerations to which the entity expects to be entitled to in exchange for those goods or services.The guidance permits two methods of adoption: retrospectively to each prior reporting period presented (full retrospective method), or retrospectively with the cumulative effect of initially applying the guidance recognized at the date of initial application (modified retrospective method). The Company will adopt the standard effective January 1, 2018 utilizing the modified retrospective approach method of transition.The Company utilized questionnaires, reviewed contracts, and assessed revenue streams that may be impacted from the adoption of this ASU. From this analysis, the Company concluded that a significant majority of the Company’s revenues are not subject to the new guidance, accordingly the adoption of ASU 2014-09 is not expected to have a material impact on the Company’s consolidated financial position, results of operations, equity or cash flows as of the adoption date. The Company will continue to monitor revenue recognition processes after the adoption of the ASU.
CRITICAL ACCOUNTING ESTIMATES
Management’s discussion and analysis of its financial condition and results of operations are based upon the Company’s consolidated financial statements, which have been prepared in accordance with accounting principles generally accepted in the United States of America. The preparation of these financial statements requires management to make estimates and judgments that affect the reported amounts of assets, liabilities, revenues and expenses, and the related disclosure of contingent assets and liabilities. Management evaluates estimates on an ongoing basis. Estimates are based on historical experience and on other assumptions that are believed to be reasonable under the circumstances, the results of which form the basis for making judgments about the carrying value of assets and liabilities that are not readily apparent from other sources. Actual results may differ from these estimates under different assumptions or conditions. There were no material changes to estimates or methodologies used to develop those estimates in 2017.
The Company’s critical accounting estimates are identified below:
Inventory Valuation
The Company uses certain estimates and judgments to value inventory. Inventory is recorded at the lower of cost or market. The Company reviews its inventories for excess or obsolete products or components. Based on an analysis of historical usage, management’s evaluation of estimated future demand, market conditions, and alternative uses for possible excess or obsolete parts, carrying values are adjusted. The carrying value is reduced regularly to reflect the age and current anticipated product demand. If actual demand differs from the estimates, additional reductions would be necessary in the period such determination is made. Excess and obsolete inventory is periodically disposed of through sale to third parties, scrapping, or other means.
Business Combinations
The Company follows the guidance under FASB Accounting Standards Codification (“ASC”) Topic 805, Business Combinations. The acquisition purchase price is allocated to the assets acquired and liabilities assumed based upon their respective fair values. The Company shall report in its financial statements provisional amounts for the items for which accounting is incomplete. Goodwill is adjusted for any changes to provisional amounts made within the measurement period. The Company utilizes management estimates and an independent third-party valuation firm to assist in determining the fair values of assets acquired and liabilities assumed. Such estimates and valuations require the Company to make significant assumptions, including projections of future events and operating performance. The Company has not made any material changes to the method of valuing fair values of assets acquired and liabilities assumed during the last three years.
Trade Names and Goodwill
According to FASB ASC Topic 350, Intangibles - Goodwill and Other, intangible assets with indefinite lives must be tested for impairment at least annually or more frequently as warranted by triggering events that indicate potential impairment. The Company uses a variety of methodologies in conducting impairment assessments including income and market approaches. For indefinite-lived assets apart from goodwill, primarily trade names for the Company, if the fair value is less than the carrying amount, an impairment charge is recognized in an amount equal to that excess. The Company has not made any material changes to the method of evaluating impairments during the last three years.
25
In compliance with FASB ASC Topic 350, goodwill is not amortized. Goodwill is tested at the reporting unit level for impairment annually or more frequently as warranted by triggering events that indicate potential impairment. Reporting units are operating segments or one level below, known as components, which can be aggregated for testing purposes. The Company’s goodwill is allocated to the North America Water Systems, International Water, and Fueling Systems units, as components within the North America Water Systems and International Water reporting units can be aggregated. In 2017, as a result of the Headwater acquisition, the Company added a Distribution reporting unit. The Distribution reporting unit was subject to qualitative testing in the year of acquisition. Starting in 2018 the Distribution reporting unit will be tested in conjunction with the other reporting units using quantitative assessments. As the Company’s business model evolves, management will continue to evaluate its reporting units and review the aggregation criteria.
In assessing the recoverability of goodwill, the Company determines the fair value of its reporting units by utilizing a combination of both the market value and income approaches. The market value approach compares the reporting units’ current and projected financial results to entities of similar size and industry to determine the market value of the reporting unit. The income approach utilizes assumptions regarding estimated future cash flows and other factors to determine the fair value of the respective assets. These cash flows consider factors regarding expected future operating income and historical trends, as well as the effects of demand and competition. The Company may be required to record an impairment if these assumptions and estimates change whereby the fair value of the reporting units is below their associated carrying values. Goodwill included on the balance sheet as of the fiscal year ended 2017 was $236.8 million.
During the fourth quarter of 2017, the Company completed its annual impairment test of goodwill and tradenames and determined the fair value of all intangibles were substantially in excess of the respective carrying values. Significant judgment is required to determine if an indication of impairment has taken place. Factors to be considered include the following: adverse changes in operating results, decline in strategic business plans, significantly lower future cash flows, and sustainable declines in market data such as market capitalization. A 10 percent decrease in the fair value estimates used in the impairment test would not have changed this determination. The sensitivity analysis required the use of numerous subjective assumptions, which, if actual experience varies, could result in material differences in the requirements for impairment charges. Further, an extended downturn in the economy may impact certain components of the operating segments more significantly and could result in changes to the aggregation assumptions and impairment determination.
Income Taxes
Under the requirements of FASB ASC Topic 740, Income Taxes, the Company records deferred tax assets and liabilities for the future tax consequences attributable to differences between financial statement carrying amounts of existing assets and liabilities and their respective tax bases. Deferred tax assets and liabilities are measured using enacted tax rates expected to apply to taxable income in the years in which those temporary differences are expected to be recovered or settled. The Company analyzes the deferred tax assets and liabilities for their future realization based on the estimated existence of sufficient taxable income. This analysis considers the following sources of taxable income: prior year taxable income, future reversals of existing taxable temporary differences, future taxable income exclusive of reversing temporary differences and tax planning strategies that would generate taxable income in the relevant period. If sufficient taxable income is not projected then the Company will record a valuation allowance against the relevant deferred tax assets.
The Company’s operations involve dealing with uncertainties and judgments in the application of complex tax regulations in multiple jurisdictions. These jurisdictions have different tax rates, and the Company determines the allocation of income to each of these jurisdictions based upon various estimates and assumptions. In the normal course of business, the Company will undergo tax audits by various tax jurisdictions. Such audits often require an extended period of time to complete and may result in income tax adjustments if changes to the allocation are required between jurisdictions with different tax rates. The final taxes paid are dependent upon many factors, including negotiations with taxing authorities in the various jurisdictions and resolution of disputes arising from federal, state, and international tax audits. Although the Company has recorded all income tax uncertainties in accordance with FASB ASC Topic 740, these accruals represent estimates that are subject to the inherent uncertainties associated with the tax audit process, and therefore include uncertainties. Management judgment is required in determining the Company’s provision for income taxes, deferred tax assets and liabilities, which, if actual experience varies, could result in material adjustments to tax expense and/or deferred tax assets and liabilities.
Pension and Employee Benefit Obligations
The Company consults with its actuaries to assist with the calculation of discount rates used in its pension and post retirement plans. Beginning in 2016, the discount rates used to determine domestic pension and post-retirement plan liabilities are calculated using a full yield curve approach. The change compared to the previous method resulted in different service and interest components of net periodic benefit cost in the 2016 fiscal year. Historically, the Company estimated these service and interest cost components utilizing a single weighted-average discount rate derived from the yield curve used to measure the
26
benefit obligation at the beginning of the period. The Company made this change to provide a more precise measurement of service and interest costs by improving the correlation between projected benefit cash flows to the corresponding spot yield curve rates. Market conditions have caused the weighted-average discount rate to move from 4.13 percent last year to 3.61 percent this year for the domestic pension plans and from 3.89 percent last year to 3.51 percent this year for the postretirement health and life insurance plan. A change in the discount rate selected by the Company of 25 basis points would result in a change of about $0.1 million to employee benefit expense and a change of about $4.0 million of liability.
The Company consults with actuaries and investment advisors in making its determination of the expected long-term rate of return on plan assets. Using input from these consultations such as long-term investment sector expected returns, the correlations and standard deviations thereof, and the plan asset allocation, the Company has assumed an expected long-term rate of return on plan assets of 6 percent as of the fiscal year ended 2017. A change in the long-term rate of return selected by the Company of 25 basis points would result in a change of about $0.4 million of employee benefit expense.
According to FASB ASC 715, Compensation - Retirement Benefits, settlement accounting is triggered when lump sum payouts from a defined benefit plan exceed the sum of service cost and interest cost for the year. During 2016, one of the Company’s domestic pension plans required settlement accounting as a payout to a participant exceeded these criteria.
FACTORS THAT MAY AFFECT FUTURE RESULTS
This annual report on Form 10-K contains certain forward-looking information, such as statements about the Company’s financial goals, acquisition strategies, financial expectations including anticipated revenue or expense levels, business prospects, market positioning, product development, manufacturing re-alignment, capital expenditures, tax benefits and expenses, and the effect of contingencies or changes in accounting policies. Forward-looking statements are typically identified by words or phrases such as “believe,” “expect,” “anticipate,” “intend,” “estimate,” “may increase,” “may fluctuate,” “plan,” “goal,” “target,” “strategy,” and similar expressions or future or conditional verbs such as “may,” “will,” “should,” “would,” and “could.” While the Company believes that the assumptions underlying such forward-looking statements are reasonable based on present conditions, forward-looking statements made by the Company involve risks and uncertainties and are not guarantees of future performance. Actual results may differ materially from those forward-looking statements as a result of various factors, including general economic and currency conditions, various conditions specific to the Company’s business and industry, new housing starts, weather conditions, market demand, competitive factors, changes in distribution channels, supply constraints, effect of price increases, raw material costs, technology factors, integration of acquisitions, litigation, government and regulatory actions, the Company’s accounting policies, and other risks, all as described in Item 1A and Exhibit 99.1 of this Form 10-K. Any forward-looking statements included in this Form 10-K are based upon information presently available. The Company does not assume any obligation to update any forward-looking information, except as required by law.
ITEM 7A. QUANTITATIVE AND QUALITATIVE DISCLOSURES ABOUT MARKET RISK
The Company is subject to market risk associated with changes in foreign currency exchange rates, interest rates, and commodity prices. These exposures are actively monitored by management. Exposure to foreign exchange rate risk is due to certain costs, revenue and borrowings being denominated in currencies other than one of the Company’s subsidiaries functional currency. Similarly, the Company is exposed to market risk as the result of changes in interest rates which may affect the cost of financing.
Foreign Currency Exchange Rate Risk
Foreign currency exchange rate risk is mitigated through several means including maintenance of local production facilities in the markets served, invoicing of customers in the currency which the Company is billed for production inputs, prompt settlement of third party and inter-company balances, limited use of foreign currency denominated debt, maintaining minimal foreign currency denominated cash balances, and application of derivative instruments when appropriate. Based on the 2017 mix of foreign currencies, the Company estimates that a hypothetical strengthening of the US Dollar by about 1 percent would have reduced the Company’s 2017 sales by about 1 percent.
Interest Rate Risk
The results of operations are exposed to changes in interest rates primarily with respect to borrowings under the Company’s revolving credit agreement (the “Credit Agreement”) and the New York Life Agreement, where interest rates are tied to the prime rate or London Interbank Offered Rates (LIBOR). The Company had $67.0 million borrowings at year-end 2017 under the Credit Agreement and had $75.0 million outstanding under the New York Life Agreement. The Company estimates that a
27
hypothetical increase of 100 basis points in the prime rate and LIBOR rates would have increased interest expense by $1.2 million during 2017. The Company also has exposure to changes in interest rates in the form of the fair value of outstanding fixed rate debt fluctuating in response to changing interest rates. The Company does not, as a matter of policy, enter into derivative contracts for speculative purposes.
Commodity Price Exposures
Portions of the Company’s business are exposed to volatility in the prices of certain commodities, such as copper, nickel and aluminum, among others. The primary exposure to this volatility resides with the use of these materials in purchased component parts. We generally maintain long-term fixed price contracts on raw materials and component parts; however, the Company is prone to exposure as these contracts expire. Based on the 2017 use of commodities, the Company estimates that a hypothetical 10 percent adverse movement in prices for raw metal commodities would result in about a 100 basis point decrease of gross margin as a percent of sales.
28
ITEM 8. FINANCIAL STATEMENTS AND SUPPLEMENTARY DATA
FRANKLIN ELECTRIC CO., INC. AND CONSOLIDATED SUBSIDIARIES
CONSOLIDATED STATEMENTS OF INCOME
(In thousands, except per share amounts) | 2017 | 2016 | 2015 | ||||||||
Net sales | $ | 1,124,909 | $ | 949,856 | $ | 924,923 | |||||
Cost of sales | 747,927 | 618,450 | 627,315 | ||||||||
Gross profit | 376,982 | 331,406 | 297,608 | ||||||||
Selling, general, and administrative expenses | 265,686 | 221,209 | 204,250 | ||||||||
Restructuring (income)/expense | 4,307 | (598 | ) | 2,997 | |||||||
Operating income | 106,989 | 110,795 | 90,361 | ||||||||
Interest expense | (10,322 | ) | (8,732 | ) | (10,039 | ) | |||||
Other income, net | 6,895 | 993 | 6,863 | ||||||||
Foreign exchange income/(expense) | 1,025 | 1,057 | (869 | ) | |||||||
Income before income taxes | 104,587 | 104,113 | 86,316 | ||||||||
Income tax expense | 25,994 | 24,798 | 12,625 | ||||||||
Net income | $ | 78,593 | $ | 79,315 | $ | 73,691 | |||||
Less: Net income attributable to noncontrolling interests | (413 | ) | (570 | ) | (746 | ) | |||||
Net income attributable to Franklin Electric Co., Inc. | $ | 78,180 | $ | 78,745 | $ | 72,945 | |||||
Income per share: | |||||||||||
Basic | $ | 1.67 | $ | 1.67 | $ | 1.52 | |||||
Diluted | $ | 1.65 | $ | 1.65 | $ | 1.50 | |||||
Dividends per common share | $ | 0.4225 | $ | 0.3975 | $ | 0.3825 | |||||
See Notes to Consolidated Financial Statements.
29
FRANKLIN ELECTRIC CO., INC. AND CONSOLIDATED SUBSIDIARIES
CONSOLIDATED STATEMENTS OF COMPREHENSIVE INCOME
(In thousands) | 2017 | 2016 | 2015 | ||||||||
Net income | $ | 78,593 | $ | 79,315 | $ | 73,691 | |||||
Other comprehensive income/(loss), before tax: | |||||||||||
Foreign currency translation adjustments | 17,937 | (8,459 | ) | (58,886 | ) | ||||||
Employee benefit plan activity: | |||||||||||
Net gain/(loss) arising during period | (274 | ) | (3,809 | ) | 1,278 | ||||||
Amortization arising during period | 3,012 | 4,298 | 5,759 | ||||||||
Other comprehensive income/(loss) | 20,675 | (7,970 | ) | (51,849 | ) | ||||||
Income tax expense related to items of other comprehensive income/(loss) | (534 | ) | (499 | ) | (2,471 | ) | |||||
Other comprehensive income/(loss), net of tax | 20,141 | (8,469 | ) | (54,320 | ) | ||||||
Comprehensive income | 98,734 | 70,846 | 19,371 | ||||||||
Less: Comprehensive income/(loss) attributable to noncontrolling interests | (251 | ) | 345 | 121 | |||||||
Comprehensive income attributable to Franklin Electric Co., Inc. | $ | 98,985 | $ | 70,501 | $ | 19,250 | |||||
See Notes to Consolidated Financial Statements.
30
FRANKLIN ELECTRIC CO., INC. AND CONSOLIDATED SUBSIDIARIES
CONSOLIDATED BALANCE SHEETS
(In thousands, except per share amounts) | 2017 | 2016 | |||||
ASSETS | |||||||
Current assets: | |||||||
Cash and cash equivalents | $ | 67,233 | $ | 104,331 | |||
Receivables, less allowances of $4,430 and $3,601, respectively | 171,007 | 145,999 | |||||
Inventories: | |||||||
Raw material | 109,590 | 80,052 | |||||
Work-in-process | 16,742 | 18,735 | |||||
Finished goods | 185,993 | 104,684 | |||||
Total inventories | 312,325 | 203,471 | |||||
Other current assets | 38,566 | 30,018 | |||||
Total current assets | 589,131 | 483,819 | |||||
Property, plant, and equipment, at cost: | |||||||
Land and buildings | 142,088 | 121,364 | |||||
Machinery and equipment | 268,373 | 242,170 | |||||
Furniture and fixtures | 52,916 | 47,523 | |||||
Other | 22,810 | 19,089 | |||||
Property, plant, and equipment, gross | 486,187 | 430,146 | |||||
Less: Allowance for depreciation | (270,493 | ) | (234,009 | ) | |||
Property, plant, and equipment, net | 215,694 | 196,137 | |||||
Deferred income taxes | 8,929 | 4,621 | |||||
Intangible assets, net | 131,471 | 134,667 | |||||
Goodwill | 236,810 | 199,609 | |||||
Other assets | 3,318 | 21,052 | |||||
Total assets | $ | 1,185,353 | $ | 1,039,905 | |||
31
2017 | 2016 | ||||||
LIABILITIES AND EQUITY | |||||||
Current liabilities: | |||||||
Accounts payable | $ | 79,348 | $ | 63,927 | |||
Accrued expenses and other current liabilities | 63,887 | 56,845 | |||||
Income taxes | 2,213 | 3,274 | |||||
Current maturities of long-term debt and short-term borrowings | 100,453 | 33,715 | |||||
Total current liabilities | 245,901 | 157,761 | |||||
Long-term debt | 125,596 | 156,544 | |||||
Income taxes payable non-current | 17,391 | — | |||||
Deferred income taxes | 30,913 | 40,460 | |||||
Employee benefit plans | 42,178 | 45,307 | |||||
Other long-term liabilities | 19,251 | 17,093 | |||||
Commitments and contingencies (see Note 17) | — | — | |||||
Redeemable noncontrolling interest | 1,502 | 7,652 | |||||
Shareholders’ equity: | |||||||
Common stock (65,000 shares authorized, $.10 par value) outstanding (46,630 and 46,376, respectively) | 4,663 | 4,638 | |||||
Additional capital | 240,136 | 228,564 | |||||
Retained earnings | 604,905 | 550,095 | |||||
Accumulated other comprehensive loss | (149,047 | ) | (169,852 | ) | |||
Total shareholders’ equity | 700,657 | 613,445 | |||||
Noncontrolling interest | 1,964 | 1,643 | |||||
Total equity | 702,621 | 615,088 | |||||
Total liabilities and equity | $ | 1,185,353 | $ | 1,039,905 | |||
See Notes to Consolidated Financial Statements.
32
FRANKLIN ELECTRIC CO., INC. AND CONSOLIDATED SUBSIDIARIES
CONSOLIDATED STATEMENTS OF CASH FLOWS
(In thousands) | 2017 | 2016 | 2015 | ||||||||
Cash flows from operating activities: | |||||||||||
Net income | $ | 78,593 | $ | 79,315 | $ | 73,691 | |||||
Adjustments to reconcile net income to net cash flows from operating activities: | |||||||||||
Depreciation and amortization | 38,506 | 35,534 | 35,476 | ||||||||
Share-based compensation | 7,109 | 6,889 | 5,626 | ||||||||
Income taxes-U.S. Tax Cuts and Jobs Act | 10,198 | — | — | ||||||||
Deferred income taxes | (6,311 | ) | 2,978 | (6,802 | ) | ||||||
Loss on disposals of plant and equipment | 1,572 | 751 | 1,542 | ||||||||
Realized gain on share purchase liability | — | — | (2,723 | ) | |||||||
Gain on equity investment | (5,165 | ) | — | — | |||||||
Foreign exchange (income)/expense | (1,025 | ) | (1,057 | ) | 869 | ||||||
Excess tax from share-based payment arrangements | — | — | (932 | ) | |||||||
Changes in assets and liabilities, net of acquisitions: | |||||||||||
Receivables | 9,948 | (21,334 | ) | 3,444 | |||||||
Inventory | (46,372 | ) | (7,636 | ) | 9,350 | ||||||
Accounts payable and accrued expenses | (11,071 | ) | 11,782 | (19,744 | ) | ||||||
Income taxes | (2,513 | ) | 4,709 | 5,575 | |||||||
Employee benefit plans | (2,529 | ) | (1,049 | ) | (2,455 | ) | |||||
Other, net | (4,186 | ) | 4,492 | (3,314 | ) | ||||||
Net cash flows from operating activities | 66,754 | 115,374 | 99,603 | ||||||||
Cash flows from investing activities: | |||||||||||
Additions to property, plant, and equipment | (33,484 | ) | (39,136 | ) | (26,171 | ) | |||||
Proceeds from sale of property, plant, and equipment | 211 | 6,028 | 202 | ||||||||
Cash paid for acquisitions, net of cash acquired | (51,783 | ) | (1,007 | ) | (3,761 | ) | |||||
Additional consideration for prior acquisition | — | — | (127 | ) | |||||||
Other, net | 355 | 346 | 274 | ||||||||
Net cash flows from investing activities | (84,701 | ) | (33,769 | ) | (29,583 | ) | |||||
Cash flows from financing activities: | |||||||||||
Proceeds from issuance of debt | 193,358 | 64,681 | 233,486 | ||||||||
Repayment of debt | (191,476 | ) | (95,066 | ) | (189,910 | ) | |||||
Proceeds from issuance of common stock | 4,497 | 5,243 | 2,050 | ||||||||
Excess tax from share-based payment arrangements | — | — | 932 | ||||||||
Purchases of common stock | (3,621 | ) | (7,422 | ) | (48,579 | ) | |||||
Dividends paid | (20,289 | ) | (19,137 | ) | (18,926 | ) | |||||
Purchase of redeemable noncontrolling shares | (5,047 | ) | — | — | |||||||
Share purchase liability payment | — | — | (20,200 | ) | |||||||
Net cash flows from financing activities | (22,578 | ) | (51,701 | ) | (41,147 | ) | |||||
Effect of exchange rate changes on cash | 3,427 | (7,134 | ) | (6,453 | ) | ||||||
Net change in cash and equivalents | (37,098 | ) | 22,770 | 22,420 | |||||||
Cash and equivalents at beginning of period | 104,331 | 81,561 | 59,141 | ||||||||
33
(In thousands) | 2017 | 2016 | 2015 | ||||||||
Cash and equivalents at end of period | $ | 67,233 | $ | 104,331 | $ | 81,561 | |||||
Cash paid for income taxes, net of refunds | $ | 25,810 | $ | 22,296 | $ | 14,264 | |||||
Cash paid for interest | $ | 9,373 | $ | 8,965 | $ | 10,211 | |||||
Non-cash items: | |||||||||||
Payable to seller of Bombas Leao, S.A | $ | — | $ | 24 | $ | 24 | |||||
Additions to property, plant, and equipment, not yet paid | $ | 168 | $ | 366 | $ | 960 | |||||
See Notes to Consolidated Financial Statements.
34
FRANKLIN ELECTRIC CO., INC. AND CONSOLIDATED SUBSIDIARIES
CONSOLIDATED STATEMENTS OF EQUITY
Total Shareholders’ Equity | |||||||||||||||||||||||||||
(In thousands) | Common Shares Outstanding | Common Stock | Additional Capital | Retained Earnings | Accumulated Other Comprehensive Income/(Loss) | Noncontrolling Interest | Redeemable Noncontrolling Interest | ||||||||||||||||||||
Balance as of year end 2014 | 47,594 | $ | 4,759 | $ | 207,446 | $ | 492,548 | $ | (107,913 | ) | $ | 2,143 | $ | 6,420 | |||||||||||||
Net income | 72,945 | 591 | 155 | ||||||||||||||||||||||||
Currency translation adjustment | (58,261 | ) | (146 | ) | (479 | ) | |||||||||||||||||||||
Minimum pension liability adjustment, net of tax benefit of $2,471 | 4,566 | ||||||||||||||||||||||||||
Adjustments to Impo redemption value | (760 | ) | 760 | ||||||||||||||||||||||||
Dividends on common stock ($0.3825/share) | (18,103 | ) | |||||||||||||||||||||||||
Noncontrolling dividend | (823 | ) | |||||||||||||||||||||||||
Common stock issued | 108 | 11 | 2,039 | ||||||||||||||||||||||||
Share-based compensation | 151 | 15 | 5,611 | ||||||||||||||||||||||||
Common stock repurchased | (1,634 | ) | (163 | ) | (48,416 | ) | |||||||||||||||||||||
Tax benefit of stock options exercised | 1,376 | ||||||||||||||||||||||||||
Balance as of year end 2015 | 46,219 | $ | 4,622 | $ | 216,472 | $ | 498,214 | $ | (161,608 | ) | $ | 1,765 | $ | 6,856 | |||||||||||||
Net income | 78,745 | 577 | (7 | ) | |||||||||||||||||||||||
Currency translation adjustment | (8,234 | ) | (26 | ) | (199 | ) | |||||||||||||||||||||
Minimum pension liability adjustment, net of tax expense of $499 | (10 | ) | |||||||||||||||||||||||||
Adjustments to Impo redemption value | (1,002 | ) | 1,002 | ||||||||||||||||||||||||
Dividends on common stock ($0.3975/share) | (18,464 | ) | |||||||||||||||||||||||||
Noncontrolling dividend | (673 | ) | |||||||||||||||||||||||||
Common stock issued | 274 | 27 | 5,216 | ||||||||||||||||||||||||
Share-based compensation | 125 | 13 | 6,876 | ||||||||||||||||||||||||
Common stock repurchased | (242 | ) | (24 | ) | — | (7,398 | ) | ||||||||||||||||||||
Balance as of year end 2016 | 46,376 | $ | 4,638 | $ | 228,564 | $ | 550,095 | $ | (169,852 | ) | $ | 1,643 | $ | 7,652 | |||||||||||||
Net income | 78,180 | 661 | (248 | ) | |||||||||||||||||||||||
Currency translation adjustment | 18,601 | 164 | (828 | ) | |||||||||||||||||||||||
Minimum pension liability adjustment, net of tax expense of $534 | 2,204 | ||||||||||||||||||||||||||
Adjustments to Impo redemption value | 27 | (27 | ) | ||||||||||||||||||||||||
Purchase of redeemable noncontrolling shares | (5,047 | ) | |||||||||||||||||||||||||
Dividends on common stock ($0.4225/share) | (19,785 | ) | |||||||||||||||||||||||||
Noncontrolling dividend | (504 | ) | |||||||||||||||||||||||||
35
Total Shareholders’ Equity | |||||||||||||||||||||||||||
(In thousands) | Common Shares Outstanding | Common Stock | Additional Capital | Retained Earnings | Accumulated Other Comprehensive Income/(Loss) | Noncontrolling Interest | Redeemable Noncontrolling Interest | ||||||||||||||||||||
Common stock issued | 256 | 25 | 4,472 | ||||||||||||||||||||||||
Share-based compensation | 86 | 9 | 7,100 | ||||||||||||||||||||||||
Common stock repurchased | (88 | ) | (9 | ) | (3,612 | ) | |||||||||||||||||||||
Balance as of year end 2017 | 46,630 | $ | 4,663 | $ | 240,136 | $ | 604,905 | $ | (149,047 | ) | $ | 1,964 | $ | 1,502 | |||||||||||||
See Notes to Consolidated Financial Statements.
36
FRANKLIN ELECTRIC CO., INC. AND CONSOLIDATED SUBSIDIARIES
INDEX TO NOTES TO CONSOLIDATED FINANCIAL STATEMENTS
Page Number | ||
Note 1. | ||
Note 2. | ||
Note 3. | ||
Note 4. | ||
Note 5. | ||
Note 6. | ||
Note 7. | ||
Note 8. | ||
Note 9. | ||
Note 10. | ||
Note 11. | ||
Note 12. | ||
Note 13. | ||
Note 14. | ||
Note 15. | ||
Note 16. | ||
Note 17. | ||
Note 18. | ||
Note 19. | ||
Note 20. | ||
37
NOTES TO CONSOLIDATED FINANCIAL STATEMENTS
1. SUMMARY OF SIGNIFICANT ACCOUNTING POLICIES
Company--“Franklin Electric” or the “Company” shall refer to Franklin Electric Co., Inc. and its consolidated subsidiaries.
Fiscal Year--In December 2016, the Company’s Board of Directors approved a change in reporting periods from fiscal periods to a calendar year. This change took effect on January 1, 2017. For fiscal years 2016 and prior, the Company’s fiscal year ended on the Saturday nearest December 31. The financial statements and accompanying notes are as of and for the years ended December 31, 2017, December 31, 2016 (52 weeks), and January 2, 2016 (52 weeks), and referred to as 2017, 2016, and 2015, respectively.
Principles of Consolidation--The consolidated financial statements include the accounts of Franklin Electric Co., Inc. and its consolidated subsidiaries. All intercompany transactions have been eliminated.
Business Combinations--The Company allocates the purchase price of its acquisitions to the assets acquired, liabilities assumed, and noncontrolling interests based upon their respective fair values at the acquisition date. The Company utilizes management estimates and inputs from an independent third-party valuation firm to assist in determining these fair values. The excess of the acquisition price over estimated fair values is recorded as goodwill. Goodwill is adjusted for any changes to acquisition date fair value amounts made within the measurement period. Acquisition-related transaction costs are recognized separately from the business combination and expensed as incurred.
Revenue Recognition--Revenue is recognized when pervasive evidence of an arrangement exists, collectability is reasonably assured, the price is fixed or determinable, and shipment or delivery has occurred. For product sales, the Company recognizes revenue once the transfer of ownership and risk of loss pass to the customer, which is generally when the products are shipped.
Generally, the only post-shipment obligation on the Company’s products include routine warranty obligations. In the event that significant post-shipment obligations were to exist for the Company’s products, revenue recognition would be deferred until substantially all obligations were satisfied.
The Company records net sales revenues after discounts at the time of sale based on specific discount programs in effect, related historical data, and experience.
Shipping and Handling Costs--Shipping and handling costs are recorded as a component of cost of sales.
Research and Development Expense--The Company’s research and development activities are charged to expense in the period incurred. The Company incurred expenses of approximately $20.8 million in 2017, $21.5 million in 2016, and $18.4 million in 2015 related to research and development.
Cash and Cash Equivalents--The Company considers cash on hand, demand deposits, and highly liquid investments with an original maturity date of three months or less to be cash and cash equivalents.
Fair Value of Financial Instruments--Financial Accounting Standards Board (“FASB”) Accounting Standards Codification (“ASC”) Topic 820, Fair Value Measurements and Disclosures, provides guidance for defining, measuring, and disclosing fair value within an established framework and hierarchy. Fair value is defined as the exchange price that would be received for an asset or paid to transfer a liability (an exit price) in the principal or most advantageous market for the asset or liability in an orderly transaction between market participants on the measurement date. The standard established a fair value hierarchy which requires an entity to maximize the use of observable inputs and to minimize the use of unobservable inputs when measuring fair value. The three levels of inputs that may be used to measure fair value within the hierarchy are as follows:
Level 1 – Quoted prices for identical assets and liabilities in active markets;
Level 2 – Quoted prices for similar assets and liabilities in active markets, quoted prices for identical or similar assets and liabilities in markets that are not active, and model-derived valuations in which all significant inputs and significant value drivers are observable in active markets; and
Level 3 – Valuations derived from valuation techniques in which one or more significant inputs or significant value drivers are unobservable.
38
Accounts Receivable, Earned Discounts, and Allowance for Uncollectible Accounts--Accounts receivable are stated at estimated net realizable value. Accounts receivable are comprised of balances due from customers, net of earned discounts and estimated allowances for uncollectible accounts. Earned discounts are based on specific customer agreement terms. In determining allowances for uncollectible accounts, historical collection experience, current trends, aging of accounts receivable, and periodic credit evaluations of customers’ financial condition are reviewed.
Inventories-- Inventories are stated at the lower of cost or market. The majority of the cost of domestic and foreign inventories is determined using the FIFO method with a portion of inventory costs determined using the average cost method. The Company reviews its inventories for excess or obsolete products or components based on an analysis of historical usage and management’s evaluation of estimated future demand, market conditions, and alternative uses for possible excess or obsolete parts.
Property, Plant, and Equipment--Property, plant, and equipment are stated at historical cost. The Company capitalizes certain computer software and software development costs incurred in connection with developing or obtaining computer software for internal use, which are included in property, plant, and equipment. Depreciation of plant and equipment is calculated on a straight line basis over the following estimated useful lives:
Land improvement and buildings | 10-40 years |
Machinery and equipment | 5-10 years |
Software | 3-7 years |
Furniture and fixtures | 3-7 years |
Maintenance, repairs, and renewals of a minor nature are expensed as incurred. Betterments and major renewals which extend the useful lives or add to the productive capacity of buildings, improvements, and equipment are capitalized. The Company reviews its property, plant, and equipment for impairment at the asset group level whenever events or changes in circumstances indicate that the carrying amount of such assets may not be recoverable. If an indicator is present, the Company compares carrying values to undiscounted future cash flows; if the undiscounted future cash flows are less than the carrying value, an impairment would be recognized for the difference between the fair value and the carrying value.
The Company’s depreciation expense was $29.9 million, $27.1 million, and $26.8 million in 2017, 2016, and 2015, respectively.
Goodwill and Other Intangible Assets--Goodwill is tested at the reporting unit level, which the Company has determined to be the North America Water Systems, International Water, Fueling Systems, and Distribution units. In compliance with FASB ASC Topic 350, Intangibles - Goodwill and Other, the Company has evaluated the aggregation criteria and determined that the individual components within the North America Water Systems and International Water reporting units, respectively, can be aggregated in 2017.
In assessing the recoverability of goodwill, the Company determines the fair value of its reporting units by utilizing a combination of both the income and market valuation approaches. The income approach estimates fair value based upon future revenue, expenses, and cash flows discounted to present value. The market valuation approach estimates fair value using market multipliers of various financial measures compared to a set of comparable public companies. The fair value calculated for each reporting unit is considered a Level 3 measurement within the fair value hierarchy.
An indication of impairment exists if the carrying value of the reporting unit is higher than its fair value, as determined by the above approach. The second step of testing as outlined in FASB ASC Topic 350 must be performed to measure the amount of impairment loss. The amount of impairment is determined by comparing the implied fair value of the reporting unit’s goodwill to its carrying value in the same manner as if the reporting units were being acquired in a business combination. The Company would allocate the fair value to all of the reporting unit’s assets and liabilities, including any unrecognized intangible assets, in a hypothetical analysis that would calculate the implied fair value of goodwill. The Company would record an impairment charge for the difference between the implied fair value of goodwill and the recorded goodwill.
Beginning in 2017, the Company completed its annual goodwill impairment test during the fourth quarter, using balances as of October 1. Additionally, in 2017 as a result of the Headwater acquisitions, the Company added the Distribution reporting unit. The Distribution reporting unit was subject to qualitative testing in the year of acquisition. The Company did not recognize a goodwill impairment as a result of the qualitative assessment. Beginning in 2018, the Distribution reporting unit will be tested
39
in conjunction with the other reporting units using a quantitative assessment. The Company will test goodwill for impairment more frequently if warranted by triggering events that indicate potential impairment.
The Company also tests indefinite lived intangible assets, primarily trade names, for impairment on an annual basis during the fourth quarter of each year, or more frequently as warranted by triggering events that indicate potential impairment. In assessing the recoverability of the trade names, the Company determines the fair value using an income approach. The income approach estimates fair value based upon future revenue and estimated royalty rates. The fair value calculated for indefinite lived intangible assets is considered a Level 3 measurement within the fair value hierarchy. An indication of impairment exists if the carrying value of the trade names is higher than the fair value. The Company would record an impairment charge for the difference.
Amortization is recorded and calculated for other definite lived intangible assets on a basis that reflects cash flows over the estimated useful lives. The weighted average number of years over which each intangible class is amortized is as follows:
Patents | 17 years |
Technology | 15 years |
Customer relationships | 13-20 years |
Other | 5-8 years |
Warranty Obligations--The Company provides warranties on most of its products. The warranty terms vary but are generally two to five years from date of manufacture or one to five years from date of installation. Provisions for estimated expenses related to product warranty are made at the time products are sold or when specific warranty issues are identified. These estimates are established using historical information about the nature, frequency, and average cost of warranty claims. The Company actively studies trends of warranty claims and takes actions to improve product quality and minimize warranty claims. The Company believes that the warranty reserve is appropriate; however, actual claims incurred could differ from the original estimates, requiring adjustments to the reserve.
Income Taxes--Income taxes are accounted for in accordance with FASB ASC Topic 740, Income Taxes. Under this guidance, deferred tax assets and liabilities are determined based on the difference between the financial statement and tax basis of assets and liabilities and net operating loss and credit carry forwards using enacted tax rates in effect for the year in which the differences are expected to reverse. Valuation allowances are established when necessary to reduce deferred tax assets to the amounts expected to be realized. The Company records a liability for uncertain tax positions by establishing a recognition threshold and measurement attribute for recognition and measurement of a tax position taken or expected to be taken in a tax return.
Defined Benefit Plans--The Company makes its determination for pension, post retirement, and post employment benefit plans liabilities based on management estimates and consultation with actuaries. The Company incorporates estimates and assumptions of future plan service costs, future interest costs on projected benefit obligations, rates of compensation increases, employee turnover rates, anticipated mortality rates, expected investment returns on plan assets, asset allocation assumptions of plan assets, and other factors.
Earnings Per Common Share--Basic and diluted earnings per share are computed and disclosed in accordance with FASB ASC Topic 260, Earnings Per Share. The Company utilizes the two-class method to compute earnings available to common shareholders. Under the two-class method, earnings are adjusted by accretion amounts to redeemable noncontrolling interests recorded at redemption value. The adjustments represent dividend distributions, in substance, to the noncontrolling interest holder as the holders have contractual rights to receive an amount upon redemption other than the fair value of the applicable shares. As a result, earnings are adjusted to reflect this in substance distribution that is different from other common shareholders. In addition, the Company allocates net earnings to each class of common stock and participating security as if all of the net earnings for the period had been distributed. The Company’s participating securities consist of share-based payment awards that contain a non-forfeitable right to receive dividends and therefore are considered to participate in undistributed earnings with common shareholders. Basic earnings per common share excludes dilution and is calculated by dividing net earnings allocated to common shares by the weighted-average number of common shares outstanding for the period. Diluted earnings per common share is calculated by dividing net earnings allocable to common shares by the weighted-average number of common shares outstanding for the period, as adjusted for the potential dilutive effect of non-participating share-based awards.
Translation of Foreign Currency Financial Statements--All assets and liabilities of foreign subsidiaries in functional currency other than the U.S. dollar are translated at year end exchange rates. All revenue and expense accounts are translated at average
40
rates in effect during the respective period. Adjustments for translating longer term foreign currency assets and liabilities in U.S. dollars are included as a component of other comprehensive income. Transaction gains and losses that arise from shorter term exchange rate fluctuations are included in the “Foreign exchange income/(expense)” line within the Company’s consolidated statements of income, as incurred.
Significant Estimates--The preparation of financial statements in conformity with accounting principles generally accepted in the United States requires management to make significant estimates and assumptions that affect the reported amounts of assets and liabilities and disclosure of contingent assets and liabilities at the date of the financial statements and the reported amounts of expenses during the reporting periods. Significant estimates and assumptions by management affect inventory valuation, warranty, trade names and goodwill, income taxes, and pension and employee benefit obligations.
Although the Company regularly assesses these estimates, actual results could materially differ. The Company bases its estimates on historical experience and various other assumptions that it believes to be reasonable under the circumstances.
2. ACCOUNTING PRONOUNCEMENTS
Accounting Standards Issued But Not Yet Adopted
In February 2018, the Financial Accounting Standards Board (“FASB”) issued Accounting Standards Update (“ASU”) 2018-02: Reclassification of Certain Tax Effects from Accumulated Other Comprehensive Income. This ASU was issued following the enactment of the U.S. Tax Cuts and Jobs Act of 2017 and permits entities to elect a reclassification from accumulated other comprehensive income to retained earnings for stranded tax effects resulting from the Tax Act. The ASU is effective for interim and annual periods beginning after December 15, 2018, with early adoption permitted, and may be applied either at the beginning of the period of adoption or retrospectively to each period in which the effect of the change in the U.S. federal corporate income tax rate in the Tax Act is recognized. The Company is currently assessing the impact of the ASU on the Company’s consolidated financial position, results of operations, and cash flows.
In March 2017, the Financial Accounting Standards Board (“FASB”) issued Accounting Standards Update (“ASU”) 2017-07, Compensation - Retirement Benefits (Topic 715): Improving the Presentation of Net Periodic Pension Cost and Net Periodic Postretirement Benefit Cost. This ASU requires entities to present only the service cost component of net periodic benefit cost as an operating expense (consistent with the presentation of other employee compensation costs). The other components of net periodic benefit cost are to be presented as a non-operating expense. The ASU is effective on a retrospective basis for interim and annual periods beginning after December 15, 2017. Early adoption is permitted as of the beginning of any annual period for which an entity’s financial statements have not been issued or made available for issuance. The Company plans to adopt the ASU in the first quarter ended March 31, 2018 and does not expect the adoption to have a material impact on the Company’s consolidated financial position, results of operations, or cash flows.
In January 2017, the FASB issued ASU 2017-04, Intangibles - Goodwill and Other (Topic 350): Simplifying the Test for Goodwill Impairment. ASU 2017-04 removes step two from the goodwill impairment test and instead requires an entity to recognize a goodwill impairment charge for the amount by which the goodwill carrying amount exceeds the reporting unit’s fair value. The ASU is effective on a prospective basis for interim and annual periods beginning after December 15, 2019 with early adoption permitted. The Company is still determining the date of adoption for this ASU but does not anticipate the adoption to have a material impact on the Company’s consolidated financial position, results of operations, or cash flows.
In February 2016, the FASB issued ASU 2016-02, Leases (Topic 842), which supersedes existing guidance on accounting for leases found in Accounting Standards Codification (“ASC”) Topic 840. This ASU requires lessees to present right-of-use assets and lease liabilities on the balance sheet for all leases with terms longer than 12 months. The guidance is to be applied using a modified retrospective approach at the beginning of the earliest comparative period in the financial statements and is effective for interim and annual periods beginning after December 15, 2018 with early adoption permitted. The Company has begun the evaluation process for the adoption of the ASU, and anticipates that the majority of the Company’s outstanding operating leases would be recognized as right-of-use assets and lease liabilities upon adoption, resulting in a significant impact to the Company’s consolidated balance sheets. The impact of this ASU is non-cash in nature and will not affect the Company’s cash position. The impact to the Company’s results of operations is still being evaluated.
In May 2014, the FASB issued ASU 2014-09, Revenue from Contracts with Customers (Topic 606) as modified by subsequently issued ASUs 2015-14, 2016-08, 2016-10, 2016-12 and 2016-20 (collectively ASU 2014-09). Topic 606 supersedes the revenue recognition requirements in Accounting Standards Codification (“ASC”) Topic 605, Revenue Recognition (“Topic 605”), and requires the recognition of revenue when promised goods or services are transferred to customers in an amount that reflects the considerations to which the entity expects to be entitled to in exchange for those goods or services. The guidance permits two methods of adoption: retrospectively to each prior reporting period presented (full retrospective method), or retrospectively with the cumulative effect of initially applying the guidance recognized at the date of
41
initial application (modified retrospective method). The Company will adopt the standard effective January 1, 2018 utilizing the modified retrospective approach method of transition. The Company utilized questionnaires, reviewed contracts, and assessed revenue streams that may be impacted from the adoption of this ASU. From this analysis, the Company concluded that the adoption of ASU 2014-09 is not expected to have a material impact on the Company’s consolidated financial position, results of operations, equity or cash flows.
3. ACQUISITIONS
During the second quarter of 2017, the Company redeemed 10 percent of the noncontrolling interest of Impo, a Turkish subsidiary, increasing the Company’s ownership to 100 percent for approximately Turkish Lira (TRY) 17.0 million, $5.0 million at the then current exchange rate. The 10 percent redemption value was calculated using a specified formula and resulted in a reduction of the carrying value of TRY 0.6 million ($0.2 million). Due to the immaterial nature of the redemption, the Company has not included full year proforma statements of income for the acquisition year or previous year.
During the second quarter of 2017, the Company acquired controlling interests in three distributors (2M Company, Inc. (“2M”), Drillers Service, Inc. (“DSI”), and Western Hydro, LLC (“Western Hydro”), collectively referred to below as the “Headwater acquisitions”) in the U.S. professional groundwater market for a combined purchase price of approximately $57.4 million, subject to certain terms and conditions. The Company had previously prepaid a $3.0 million portion of the purchase price at the time of original investment. The Company funded the Headwater acquisitions with cash on hand and short-term borrowings from the Company’s Revolver (see Note 11 - Debt). The Headwater acquisitions are reported within a new “Distribution” segment (see Note 16 - Segment Information). The Headwater acquisitions provide the Company with a robust groundwater distribution channel throughout the United States.
The Company previously held equity interests in these entities, each of which was less than 50 percent, and accounted for by the equity method of accounting. The Company’s total interest in each of the entities is now 100 percent and the entities are included in the Company’s consolidated results effective from the date of acquisition. The original equity interests in the acquired entities were remeasured to their fair values as of the acquisition date (which aggregated was $20.6 million) based on the income approach, which utilized management estimates and consultation with an independent third-party valuation firm. Inputs included an analysis of the enterprise value based on financial projections and ownership percentages. As a result, the Company has recognized an aggregate gain on the acquisitions of $5.2 million. These gains are included in the “Other income, net” line of the Company’s consolidated statements of income.
The preliminary identifiable intangible assets recognized due to the Headwater acquisitions were $5.7 million, and consist of customer relationships, which will be amortized utilizing the straight-line method over 15 years. The fair value of the identifiable intangible assets has been estimated using an income approach, a valuation method that values an intangible asset by discounting the future incremental earnings that may be achieved by the subject intangible asset.
The preliminary goodwill of $33.9 million resulting from the Headwater acquisitions consists primarily of the benefits of forward channel integration opportunities and broadened product offerings. All of the goodwill was recorded as part of the Distribution segment, and only a portion ($7.8 million) is expected to be deductible for tax purposes.
The preliminary purchase price assigned to the major identifiable assets and liabilities for the Headwater acquisitions on an aggregated basis is as follows:
42
(In millions) | ||||
Cash | $ | 2.7 | ||
Receivables | 29.9 | |||
Inventory | 56.0 | |||
Other current assets | 5.1 | |||
Total current assets | 93.7 | |||
Property, plant, and equipment | 9.8 | |||
Intangible assets | 5.7 | |||
Goodwill | 33.9 | |||
Other assets | 0.2 | |||
Total assets | 143.3 | |||
Accounts payable | (19.6 | ) | ||
Accrued liabilities and other current liabilities | (11.4 | ) | ||
Current maturities of long-term debt | (31.6 | ) | ||
Total current liabilities | (62.6 | ) | ||
Long-term debt | (2.0 | ) | ||
Other long-term liabilities | (0.7 | ) | ||
Total liabilities | (65.3 | ) | ||
Total | 78.0 | |||
Less: Fair value of original equity interest | (20.6 | ) | ||
Total purchase price | $ | 57.4 | ||
The fair values of the assets acquired and liabilities assumed related to the Headwater acquisitions are provisional amounts as of December 31, 2017, pending final valuations and purchase accounting adjustments. The Company utilized management estimates and consultation with an independent third-party valuation firm to assist in the valuation process.
The following unaudited proforma financial information for the year ended December 31, 2017 and December 31, 2016 gives effect to the Headwater acquisitions as if the acquisitions had occurred as of January 3, 2016. These unaudited proforma condensed consolidated financial statements are prepared for informational purposes only and are not necessarily indicative of actual results or financial position that would have been achieved had the acquisitions been consummated on the dates indicated and are not necessarily indicative of future operating results or financial position of the consolidated companies. The unaudited proforma condensed consolidated financial statements do not give effect to any cost savings or incremental costs that may result from the integration of the Headwater acquisitions.
43
FRANKLIN ELECTRIC CO., INC. | ||||||||
PROFORMA CONDENSED CONSOLIDATED STATEMENTS OF INCOME | ||||||||
(in millions, except per share amounts) | 2017 | 2016 | ||||||
Revenue: | ||||||||
As reported | $ | 1,124.9 | $ | 949.9 | ||||
Proforma | 1,184.8 | 1,144.6 | ||||||
Net income: | ||||||||
As reported | $ | 78.2 | $ | 78.7 | ||||
Proforma | 79.4 | 85.0 | ||||||
Basic earnings per share: | ||||||||
As reported | $ | 1.67 | $ | 1.67 | ||||
Proforma | 1.70 | 1.80 | ||||||
Diluted earnings per share: | ||||||||
As reported | $ | 1.65 | $ | 1.65 | ||||
Proforma | 1.68 | 1.78 | ||||||
The Headwater entities contributed a total of $176.7 million of revenue and $1.4 million of net income to the Company’s consolidated statements of income from their acquisition dates through December 31, 2017.
In 2012, the Company acquired a controlling interest in Pioneer Pump Holdings, Inc. (“PPH”). Pursuant to the terms of the 2012 stock purchase agreement, the remaining 29.5 percent noncontrolling interest was recorded at $22.9 million and accounted for as a share purchase liability. During the first quarter of 2015, the Company purchased the remaining 29.5 percent of outstanding shares of PPH for $20.2 million, increasing the Company’s ownership in PPH to 100 percent. The purchase was considered the settlement of a financing obligation, and the resulting $2.7 million gain was recorded in the Company’s consolidated statements of income in the “Other income, net” line during the first quarter of 2015.
Transaction costs for all acquisition related activity were expensed as incurred under the guidance of FASB ASC Topic 805, Business Combinations. Transaction costs included in selling, general, and administrative expense in the Company’s consolidated statements of income were $0.6 million, $0.1 million, and $0.2 million for the fiscal years ended 2017, 2016, and 2015, respectively.
4. FAIR VALUE MEASUREMENTS
As of December 31, 2017 and December 31, 2016, the assets measured at fair value on a recurring basis were as set forth in the table below:
(In millions) | December 31, 2017 | Quoted Prices in Active Markets for Identical Assets (Level 1) | Significant Other Observable Inputs (Level 2) | Significant Unobservable Inputs (Level 3) | |||||||||||||
Cash equivalents | $ | 3.0 | $ | 3.0 | $ | — | $ | — | |||||||||
December 31, 2016 | Quoted Prices in Active Markets for Identical Assets (Level 1) | Significant Other Observable Inputs (Level 2) | Significant Unobservable Inputs (Level 3) | ||||||||||||||
Cash equivalents | $ | 3.6 | $ | 3.6 | $ | — | $ | — | |||||||||
The Company’s Level 1 assets consist of cash equivalents which are generally comprised of foreign bank guaranteed certificates of deposit.
44
The Company has no assets measured on a recurring basis classified as Level 2 or Level 3.
Total debt, including current maturities, have carrying amounts of $226.0 million at December 31, 2017 and $190.2 million at December 31, 2016. The estimated fair value of all debt was $230 million and $195 million at December 31, 2017 and December 31, 2016, respectively. In the absence of quoted prices in active markets, considerable judgment is required in developing estimates of fair value. Estimates are not necessarily indicative of the amounts the Company could realize in a current market transaction. In determining the fair value of its debt, the Company uses estimates based on rates currently available to the Company for debt with similar terms and remaining maturities. Accordingly, the fair value of debt is classified as Level 2 within the valuation hierarchy.
5. FINANCIAL INSTRUMENTS
The Company’s deferred compensation stock program is subject to variable plan accounting and, accordingly, is adjusted for changes in the Company’s stock price at the end of each reporting period. The Company has entered into share swap transaction agreements (“the swap”) to mitigate the Company’s exposure to these fluctuations in the Company’s stock price. The swap has not been designated as a hedge for accounting purposes and is cancellable with 30 days written notice by either party. As of December 31, 2017, the swap has a notional value based on 215,000 shares. For the years ended December 31, 2017, December 31, 2016, and January 2, 2016, the swap resulted in a gain of $1.4 million, a gain of $2.2 million, and a loss of $2.0 million, respectively. Gains and losses resulting from the swap were primarily offset by gains and losses on the fair value of the deferred compensation stock liability. All gains or losses and expenses related to the swap are recorded in the Company’s consolidated statements of income within the “Selling, general, and administrative expenses” line.
6. OTHER ASSETS
Through the second quarter of 2017, the Company held equity interests in the acquired companies identified in Note 3 - Acquisitions for various strategic purposes. The investments were accounted for under the equity method and were included in “Other assets” on the Company’s consolidated balance sheet. The carrying amount of the investments were adjusted for the Company’s proportionate share of earnings, losses, and dividends. The investments were not considered material to the Company’s financial position, either individually or in the aggregate. During the second quarter of 2017, the remaining interests of these equity method investments were purchased (see Note 3 - Acquisitions), bringing total ownership of these entities to 100 percent. As of December 31, 2017, there were no equity method investments recorded on the Company’s consolidated balance sheet. Prior to the purchase of the remaining interests, the Company’s proportionate share of earnings from its equity interests, were included in the “Other income, net” line of the Company’s consolidated statements of income. The amounts were immaterial for the years ended December 31, 2017, December 31, 2016, and January 2, 2016, respectively.
7. GOODWILL AND OTHER INTANGIBLE ASSETS
The carrying amounts of the Company’s intangible assets are as follows:
(In millions) | 2017 | 2016 | ||||||||||||||
Gross Carrying Amount | Accumulated Amortization | Gross Carrying Amount | Accumulated Amortization | |||||||||||||
Amortized intangibles: | ||||||||||||||||
Patents | $ | 7.5 | $ | (6.7 | ) | $ | 7.4 | $ | (6.4 | ) | ||||||
Technology | 7.5 | (5.8 | ) | 7.5 | (5.3 | ) | ||||||||||
Customer relationships | 138.9 | (57.6 | ) | 133.4 | (49.6 | ) | ||||||||||
Other | 2.9 | (2.4 | ) | 2.7 | (2.1 | ) | ||||||||||
Total | $ | 156.8 | $ | (72.5 | ) | $ | 151.0 | $ | (63.4 | ) | ||||||
Unamortized intangibles: | ||||||||||||||||
Trade names | 47.2 | — | 47.1 | — | ||||||||||||
Total intangibles | $ | 204.0 | $ | (72.5 | ) | $ | 198.1 | $ | (63.4 | ) | ||||||
Amortization expense related to intangible assets for fiscal years 2017, 2016, and 2015, was $8.6 million, $8.4 million, and $8.6 million, respectively.
Amortization expense for each of the five succeeding years is projected as follows:
45
(In millions) | 2018 | 2019 | 2020 | 2021 | 2022 | |||||||||||||||
$ | 8.7 | $ | 8.6 | $ | 8.4 | $ | 8.1 | $ | 7.9 | |||||||||||
The change in the carrying amount of goodwill by reportable segment for 2017 and 2016, is as follows:
(In millions) | ||||||||||||||||
Water Systems | Fueling Systems | Distribution | Consolidated | |||||||||||||
Balance as of January 2, 2016 | $ | 136.8 | $ | 63.0 | $ | — | $ | 199.8 | ||||||||
Acquisitions | — | 0.8 | — | 0.8 | ||||||||||||
Foreign currency translation | (0.5 | ) | (0.5 | ) | — | (1.0 | ) | |||||||||
Balance as of December 31, 2016 | $ | 136.3 | $ | 63.3 | $ | — | $ | 199.6 | ||||||||
Acquisitions | — | — | 33.9 | 33.9 | ||||||||||||
Foreign currency translation | 3.0 | 0.3 | — | 3.3 | ||||||||||||
Balance as of December 31, 2017 | $ | 139.3 | $ | 63.6 | 33.9 | $ | 236.8 | |||||||||
8. EMPLOYEE BENEFIT PLANS
Defined Benefit Plans - As of December 31, 2017, the Company maintained two domestic pension plans and three German pension plans. The Company used a December 31, 2017 measurement date for these plans. One of the Company’s domestic pension plans covers one active management employee, while the other domestic plan covers all eligible employees (plan was frozen as of December 31, 2011). The two domestic and three German plans collectively comprise the ‘Pension Benefits’ disclosure caption.
Other Benefits - The Company’s other post-retirement benefit plan provides health and life insurance to domestic employees hired prior to 1992. The Company effectively capped its cost for those benefits through plan amendments made in 1992, freezing Company contributions for insurance benefits at 1991 levels for current and future beneficiaries with actuarially reduced benefits for employees who retire before age 65. The disclosures surrounding this plan are reflected in the “Other Benefits” caption.
The following table sets forth aggregated information related to the Company’s pension benefits and other postretirement benefits, including changes in the benefit obligations, changes in plan assets, funded status, amounts recognized in the balance sheet, amounts recognized in accumulated other comprehensive income, and actuarial assumptions that the Company considered in its determination of benefit obligations and plan costs. Benefit obligation balances presented below reflect the projected benefit obligation (PBO) for the Company’s pension plans, and accumulated postretirement benefit obligations (APBO) for the Company’s other benefit plans.
46
(In millions) | Pension Benefits | Other Benefits | ||||||||||||||
2017 | 2016 | 2017 | 2016 | |||||||||||||
Accumulated benefit obligation, end of year | $ | 180.5 | $ | 177.0 | $ | 10.3 | $ | 10.5 | ||||||||
Change in benefit obligation: | ||||||||||||||||
Benefit obligation, beginning of year | $ | 181.1 | $ | 186.9 | $ | 10.5 | $ | 11.3 | ||||||||
Service cost | 0.7 | 0.9 | — | 0.1 | ||||||||||||
Interest cost | 5.6 | 6.0 | 0.3 | 0.3 | ||||||||||||
Actuarial (gain)/loss | 7.0 | 4.1 | 0.6 | — | ||||||||||||
Settlements paid | (0.2 | ) | (0.6 | ) | — | — | ||||||||||
Benefits paid | (11.9 | ) | (15.7 | ) | (1.1 | ) | (1.2 | ) | ||||||||
Curtailment | — | — | — | — | ||||||||||||
Foreign currency exchange | 2.8 | (0.5 | ) | — | — | |||||||||||
Benefit obligation, end of year | $ | 185.1 | $ | 181.1 | $ | 10.3 | $ | 10.5 | ||||||||
Change in plan assets: | ||||||||||||||||
Fair value of assets, beginning of year | $ | 146.1 | $ | 147.4 | $ | — | $ | — | ||||||||
Actual return on plan assets | 16.1 | 9.5 | — | — | ||||||||||||
Company contributions | 2.5 | 5.5 | 1.1 | 1.2 | ||||||||||||
Settlements paid | (0.1 | ) | (0.5 | ) | — | — | ||||||||||
Benefits paid | (11.9 | ) | (15.7 | ) | (1.1 | ) | (1.2 | ) | ||||||||
Foreign currency exchange | 0.6 | (0.1 | ) | — | — | |||||||||||
Plan assets, end of year | $ | 153.3 | $ | 146.1 | $ | — | $ | — | ||||||||
Funded status | $ | (31.8 | ) | $ | (35.0 | ) | $ | (10.3 | ) | $ | (10.5 | ) | ||||
Amounts recognized in balance sheet: | ||||||||||||||||
Current liabilities | $ | (0.4 | ) | $ | (0.3 | ) | $ | (1.1 | ) | $ | (1.1 | ) | ||||
Noncurrent liabilities | (31.4 | ) | (34.7 | ) | (9.2 | ) | (9.4 | ) | ||||||||
Net liability, end of year | $ | (31.8 | ) | $ | (35.0 | ) | $ | (10.3 | ) | $ | (10.5 | ) | ||||
Amount recognized in accumulated other comprehensive income/(loss): | ||||||||||||||||
Prior service cost | $ | — | $ | — | $ | 0.1 | $ | 0.2 | ||||||||
Net actuarial loss | 47.6 | 48.9 | 1.1 | 0.9 | ||||||||||||
Settlement | 0.5 | 1.5 | — | — | ||||||||||||
Total recognized in accumulated other comprehensive income/(loss) | $ | 48.1 | $ | 50.4 | $ | 1.2 | $ | 1.1 | ||||||||
47
The following table sets forth other changes in plan assets and benefit obligation recognized in other comprehensive income for 2017 and 2016:
(In millions) | Pension Benefits | Other Benefits | ||||||||||||||
2017 | 2016 | 2017 | 2016 | |||||||||||||
Net actuarial (gain)/loss | $ | (0.2 | ) | $ | 3.8 | $ | 0.5 | $ | — | |||||||
Amortization of: | ||||||||||||||||
Net actuarial gain | (2.4 | ) | (2.3 | ) | (0.1 | ) | (0.1 | ) | ||||||||
Prior service credit | — | — | (0.3 | ) | (0.4 | ) | ||||||||||
Settlement recognition | (0.5 | ) | (1.4 | ) | — | — | ||||||||||
Deferred tax asset | 0.5 | 0.3 | — | 0.2 | ||||||||||||
Foreign currency exchange | 0.3 | (0.1 | ) | — | — | |||||||||||
Total recognized in other comprehensive income | $ | (2.3 | ) | $ | 0.3 | $ | 0.1 | $ | (0.3 | ) | ||||||
Weighted-average assumptions used to determine domestic benefit obligations:
Pension Benefits | Other Benefits | |||||||||||
2017 | 2016 | 2017 | 2016 | |||||||||
Discount rate | 3.61 | % | 4.13 | % | 3.51 | % | 3.89 | % | ||||
Rate of increase in future compensation | — | % | * | — | % | * | 3.00 - 8.00% (Graded) | 3.00 - 8.00% (Graded) | ||||
*No rate of increases in future compensation used within assumptions for 2017 and 2016, as the cash balance component of the domestic Pension Plan was frozen and the other domestic Pension Plan components do not base benefits on compensation.
Assumptions used to determine domestic periodic benefit cost:
Pension Benefits | Other Benefits | |||||||||||||||||
2017 | 2016 | 2015 | 2017 | 2016 | 2015 | |||||||||||||
Discount rate | 4.13 | % | 4.40 | % | 4.00 | % | 3.91 | % | 4.09 | % | 3.75 | % | ||||||
Rate of increase in future compensation | — | % | * | — | % | * | — | % | * | 3.00 - 8.00% (Graded) | 3.00 - 8.00% (Graded) | 3.00 - 8.00% (Graded) | ||||||
Expected long-term rate of return on plan assets | 6.25 | % | 6.50 | % | 7.00 | % | — | % | — | % | — | % | ||||||
*No rate of increases in future compensation used within assumptions for 2017, 2016, and 2015, as the cash balance component of the domestic Pension Plan was frozen and the other domestic Pension Plan components do not base benefits on compensation.
For the fiscal year ended December 31, 2017, the Company used the RP-2014 aggregate table adjusted to back out estimated mortality improvements from 2006 to the measurement date using Scale MP-2014, and then projected forward using Scale MP-2017 released by the Society of Actuaries during 2017 to estimate future mortality rates based upon current data. For the fiscal year ended December 31, 2016, the Company used the RP-2014 aggregate table adjusted to back out estimated mortality improvements from 2006 to the measurement date using Scale MP-2014, and then projected forward using Scale MP-2016 released by the Society of Actuaries during 2016 to estimate future mortality rates.
48
The following table sets forth the aggregated net periodic benefit cost for all defined benefit plans for 2017, 2016, and 2015:
(In millions) | Pension Benefits | Other Benefits | |||||||||||||||||||||
2017 | 2016 | 2015 | 2017 | 2016 | 2015 | ||||||||||||||||||
Service cost | $ | 0.7 | $ | 0.9 | $ | 1.4 | $ | — | $ | 0.1 | $ | 0.1 | |||||||||||
Interest cost | 5.6 | 6.0 | 7.5 | 0.3 | 0.3 | 0.5 | |||||||||||||||||
Expected return on assets | (9.0 | ) | (9.2 | ) | (9.9 | ) | — | — | — | ||||||||||||||
Amortization of: | |||||||||||||||||||||||
Transition obligation | — | — | — | — | — | — | |||||||||||||||||
Settlement cost | — | 0.1 | — | — | — | — | |||||||||||||||||
Prior service cost | — | — | — | 0.3 | 0.3 | 0.4 | |||||||||||||||||
Actuarial loss | 2.8 | 2.5 | 3.4 | 0.1 | 0.1 | 0.2 | |||||||||||||||||
Settlement cost | — | 1.2 | 1.2 | — | — | — | |||||||||||||||||
Net periodic benefit cost | $ | 0.1 | $ | 1.5 | $ | 3.6 | $ | 0.7 | $ | 0.8 | $ | 1.2 | |||||||||||
The estimated net actuarial (gain)/loss and prior service cost/(credit) that will be amortized from accumulated other comprehensive income into net periodic benefit cost during the 2018 fiscal year are $2.9 million and $0.0 million, respectively, for the pension plans and $0.2 million and $0.1 million, respectively, for all other benefits.
The Company consults with a third party investment manager for the assets of the funded domestic defined benefit plan. The plan assets are currently invested primarily in pooled funds, where each fund in turn is composed of mutual funds that have at least daily net asset valuations. Thus, the Company’s funded domestic defined benefit plan assets are invested in a “fund of funds” approach.
The Company’s Board has delegated oversight and guidance to an appointed Employee Benefits Committee. The Committee has the tasks of reviewing plan performance and asset allocation, ensuring plan compliance with applicable laws, establishing plan policies, procedures, and controls, monitoring expenses, and other related activities.
The plan’s investment policies and strategies focus on the ability to fund benefit obligations as they come due. Considerations include the plan’s current funded level, plan design, benefit payment assumptions, funding regulations, impact of potentially volatile business results on the Company’s ability to make certain levels of contributions, and interest rate and asset return volatility among other considerations. The Company currently attempts to maintain plan funded status at approximately 80 percent or greater pursuant to the Pension Protection Act of 2007. Given the plan’s current funded status, the Company’s cash on hand, cash historically generated from business operations, and cash available under committed credit facilities, the Company sees ample liquidity to achieve this goal.
Risk management and continuous monitoring requirements are met through monthly investment portfolio reports, quarterly Employee Benefits Committee meetings, annual valuations, asset/liability studies, and the annual assumption process focusing primarily on the return on asset assumption and the discount rate assumption. As of December 31, 2017 and December 31, 2016, funds were invested in equity, fixed income, and other investments as follows:
Target Percentage | Plan Asset Allocation at Year-End | ||||||||
Asset Category | at Year-End 2017 | 2017 | 2016 | ||||||
Equity securities | 26 | % | 26 | % | 31 | % | |||
Fixed income securities | 70 | % | 70 | % | 65 | % | |||
Other | 4 | % | 4 | % | 4 | % | |||
Total | 100 | % | 100 | % | 100 | % | |||
The Company does not see any particular concentration of risk within the plans, nor any plan assets that pose difficulties for fair value assessment. The Company currently has no allocation to potentially illiquid or potentially difficult to value assets such as hedge funds, venture capital, private equity, and real estate.
49
The Company works with actuaries and consultants in making its determination of the asset rate of return assumption and also the discount rate assumption.
Asset class assumptions are set using a combination of empirical and forward-looking analysis for long-term rate of return on plan assets. A variety of models are applied for filtering historical data and isolating the fundamental characteristics of asset classes. These models provide empirical return estimates for each asset class, which are then reviewed and combined with a qualitative assessment of long-term relationships between asset classes before a return estimate is finalized. This provides an additional means for correcting for the effect of unrealistic or unsustainable short-term valuations or trends, opting instead for return levels and behavior that are more likely to prevail over long periods. With that, the Company has assumed an expected long-term rate of return on plan assets of 5.90 percent for the 2018 net periodic benefit cost, down from 6.25 percent in the prior year. This decrease in the assumed long-term rate of return is primarily due to a higher percentage of assets in fixed income securities.
The Company uses the Aon Hewitt AA Above Median curve to determine the discount rate. All cash flow obligations under the plan are matched to bonds in the Aon Hewitt universe of liquid, high-quality, non-callable / non-putable corporate bonds with outliers removed. From that matching exercise, a discount rate is determined.
At January 2, 2016, the Company changed the method used to calculate the service and interest components of net periodic benefit cost for the domestic pension plans and other postretirement benefit plan. This change compared to the previous method resulted in different service and interest components of net periodic benefit cost in the 2016 fiscal year. Historically, the Company estimated these service and interest cost components utilizing a single weighted-average discount rate derived from the yield curve used to measure the benefit obligation at the beginning of the period. The Company elected to utilize a full yield curve approach in the estimation of these components by applying the specific spot rates along the yield curve used in the determination of the benefit obligation to the relevant projected cash flows. The Company made this change to provide a more precise measurement of service and interest costs by improving the correlation between projected benefit cash flows to the corresponding spot yield curve rates. This change does not affect the measurement of the Company’s domestic pension and postretirement benefit obligations and is accounted for as a change in accounting estimate applied prospectively.
The Company’s German pension plans are funded by insurance contract policies whereby the insurance company guarantees a fixed minimum return. Due to tax legislation, individual pension benefits can only be financed using direct insurance policies up to certain maximums. These maximum amounts in respect of each member are paid into such an arrangement on a yearly basis.
The Company designated all equity and most domestic fixed income plan assets as Level 1, as they are mutual funds with prices that are readily available. The U.S. Treasury securities and German plan assets are designated as Level 2 inputs. The fair value of the German plan assets are measured by the reserve that is supervised by the German Federal Financial Supervisory Authority. The U.S. Treasury securities are administered by the United States government.
The fair values of the Company’s pension plan assets for 2017 and 2016 by asset category are as follows:
(In millions) | 2017 | Quoted Prices in Active Markets for Identical Assets (Level 1) | Significant Other Observable Inputs (Level 2) | Significant Unobservable Inputs (Level 3) | |||||||||||||
Equity | |||||||||||||||||
Domestic equity mutual funds | $ | 24.0 | $ | 24.0 | $ | — | $ | — | |||||||||
International equity mutual funds | 16.2 | 16.2 | — | — | |||||||||||||
Fixed income | |||||||||||||||||
U.S. treasury and government agency securities | 19.2 | — | 19.2 | — | |||||||||||||
Fixed income mutual funds | 87.9 | 87.9 | — | — | — | ||||||||||||
Other | |||||||||||||||||
Insurance contracts | 5.3 | — | 5.3 | — | |||||||||||||
Cash and equivalents | 0.7 | 0.7 | — | — | |||||||||||||
Total | $ | 153.3 | $ | 128.8 | $ | 24.5 | $ | — | |||||||||
50
(In millions) | 2016 | Quoted Prices in Active Markets for Identical Assets (Level 1) | Significant Other Observable Inputs (Level 2) | Significant Unobservable Inputs (Level 3) | |||||||||||||
Equity | |||||||||||||||||
Domestic equity mutual funds | $ | 27.8 | $ | 27.8 | $ | — | $ | — | |||||||||
International equity mutual funds | 17.5 | 17.5 | — | — | |||||||||||||
Fixed income | |||||||||||||||||
U.S. treasury and government agency securities | 16.4 | — | 16.4 | — | — | ||||||||||||
Fixed income mutual funds | 79.1 | 79.1 | — | — | |||||||||||||
Other | |||||||||||||||||
Insurance contracts | 4.5 | — | 4.5 | — | |||||||||||||
Cash and equivalents | 0.8 | 0.8 | — | — | |||||||||||||
Total | $ | 146.1 | $ | 125.2 | $ | 20.9 | $ | — | |||||||||
The Company estimates total contributions to the plans of $4 million in 2018.
The following benefit payments, which reflect expected future service, as appropriate, are expected to be paid in accordance with the following schedule:
(In millions) | Pension Benefits | Other Benefits | ||||||
2018 | $ | 12.2 | $ | 1.1 | ||||
2019 | 11.6 | 1.0 | ||||||
2020 | 11.5 | 1.0 | ||||||
2021 | 11.4 | 0.9 | ||||||
2022 | 11.0 | 0.9 | ||||||
Years 2023 through 2027 | 59.4 | 3.6 | ||||||
Defined Contribution Plans - The Company maintained two defined contribution plans during 2017, 2016, and 2015. The Company’s cash contributions are allocated to participant’s accounts based on investment elections.
The following table sets forth Company contributions to the defined contribution plans:
(In millions) | 2017 | 2016 | 2015 | |||||||||
Company contributions to the plans | $ | 6.7 | $ | 5.9 | $ | 5.9 | ||||||
9. ACCRUED EXPENSES AND OTHER CURRENT LIABILITIES
Accrued expenses and other current liabilities consist of:
(In millions) | 2017 | 2016 | ||||||
Salaries, wages, and commissions | $ | 29.6 | $ | 28.4 | ||||
Product warranty costs | 9.5 | 8.2 | ||||||
Insurance | 1.9 | 2.0 | ||||||
Employee benefits | 9.1 | 7.9 | ||||||
Other | 13.8 | 10.3 | ||||||
$ | 63.9 | $ | 56.8 | |||||
51
10. INCOME TAXES
Income before income taxes consisted of the following:
(In millions) | 2017 | 2016 | 2015 | |||||||||
Domestic | $ | 47.1 | $ | 45.4 | $ | 23.6 | ||||||
Foreign | 57.5 | 58.7 | 62.7 | |||||||||
$ | 104.6 | $ | 104.1 | $ | 86.3 | |||||||
The income tax provision/(benefit) from continuing operations consisted of the following:
(In millions) | 2017 | 2016 | 2015 | |||||||||
Current: | ||||||||||||
Federal | $ | 29.7 | $ | 9.6 | $ | 1.2 | ||||||
Foreign | 10.2 | 11.4 | 17.4 | |||||||||
State | 1.1 | 0.8 | 0.8 | |||||||||
Total current | 41.0 | 21.8 | 19.4 | |||||||||
Deferred: | ||||||||||||
Federal | (10.7 | ) | 2.9 | (1.8 | ) | |||||||
Foreign | (4.5 | ) | (1.0 | ) | (4.0 | ) | ||||||
State | 0.2 | 1.1 | (1.0 | ) | ||||||||
Total deferred | $ | (15.0 | ) | $ | 3.0 | $ | (6.8 | ) | ||||
$ | 26.0 | $ | 24.8 | $ | 12.6 | |||||||
A reconciliation of the tax provision for continuing operations at the U.S. statutory rate to the effective income tax expense rate as reported is as follows:
2017 | 2016 | 2015 | |||||||
U.S. Federal statutory rate | 35.0 | % | 35.0 | % | 35.0 | % | |||
State income taxes, net of federal benefit | 1.0 | (0.3 | ) | (0.3 | ) | ||||
Foreign operations | (10.2 | ) | (8.4 | ) | (13.1 | ) | |||
R&D tax credits | (0.9 | ) | (0.6 | ) | (1.0 | ) | |||
Uncertain tax position adjustments | (0.5 | ) | (2.5 | ) | (1.5 | ) | |||
Deferred tax adjustments - restructuring and rate adjustments | (1.2 | ) | 0.3 | 1.1 | |||||
Valuation allowance on state and foreign deferred tax | (1.2 | ) | 2.4 | 4.1 | |||||
Purchase of noncontrolling interest | (2.3 | ) | — | (9.4 | ) | ||||
Share-based compensation | (1.9 | ) | (1.1 | ) | — | ||||
Realized foreign currency loss | (1.5 | ) | — | — | |||||
Other items | (1.3 | ) | (1.0 | ) | (0.3 | ) | |||
Impact of the Tax Act | |||||||||
Transition tax | 18.1 | — | — | ||||||
Deferred tax effects | (8.3 | ) | — | — | |||||
Effective tax rate | 24.8 | % | 23.8 | % | 14.6 | % | |||
The effective tax rate continues to be lower than the statutory rate of 35 percent primarily due to foreign earnings taxed at rates below the U.S. statutory rate, offset by the recognition of the impact of the U.S. Tax Cuts and Jobs Act in 2017, further reduced by U.S. tax incentives, and certain discrete events.
52
The U.S. Tax Cuts and Jobs Act (Tax Act) was enacted on December 22, 2017 and introduces significant changes to U.S. income tax law. Effective in 2018, the Tax Act reduces the U.S. statutory tax rate from 35 percent to 21 percent and creates new incentives on U.S. based foreign exports, referred to as Foreign Derived Intangible Income, and other provisions. In addition, in 2017 the Company was subject to a transition tax on accumulated foreign subsidiary earnings not previously subject to U.S. income tax.
Due to the timing of the enactment and the complexity involved in applying the provisions of the Tax Act, the Company has made reasonable estimates of the effects and recorded provisional amounts in its financial statements as of December 31, 2017. As the Company collects and prepares necessary data, and interprets the Tax Act and any additional guidance issued by the U.S. Treasury Department, the IRS, and other standard-setting bodies, the Company may make adjustments to the provisional amounts during 2018. Those adjustments may materially impact the Company’s provision for income taxes and effective tax rate in the period in which the adjustments are made. The accounting for the tax effects of the Tax Act will be completed in 2018.
Provisional amounts which net to $10.2 million for the following income tax effects of the Tax Act have been recorded as of December 31, 2017 and are subject to change during 2018.
Transition tax
The Tax Act requires the Company to pay U.S. income taxes on accumulated foreign subsidiary earnings not previously subject to U.S. income tax at a rate of 15.5 percent to the extent of foreign cash and certain other net current assets and 8 percent on the remaining earnings. The Company has recorded a provisional amount for the one-time transition tax liability and income tax expense of $18.9 million. The Company has recorded provisional amounts based on estimates of the effects of the Tax Act as the analysis requires significant data from foreign subsidiaries that is not yet final due to future statutory deadlines. In addition, further analysis is required pending guidance from state and local tax authorities in the U.S.
Deferred tax effects
The Tax Act reduces the U.S. statutory tax rate from 35 percent to 21 percent for years after 2017. Accordingly, the Company has remeasured its deferred taxes as of December 31, 2017 to reflect the reduced rate that will apply in future periods when these deferred taxes are settled or realized. The Company recognized a deferred tax benefit of $8.7 million. Although the tax rate reduction is known, all of the data is not yet available and further analysis is required to finalize the effect of the Tax Act on the underlying deferred taxes and as such, the amounts recorded as of December 31, 2017 are provisional.
The Company recorded discrete excess tax benefits from share-based compensation of $1.8 million in the twelve-month period ended December 31, 2017 related to the adoption of ASU 2016-09 during 2016. The adoption of ASU 2016-09 for share-based compensation can add variability to the Company’s provision for income taxes, mainly due to the timing of stock option exercises, vesting of restricted stock, and the stock price.
During the second quarter ended June 30, 2017, the Company acquired controlling interests in three U.S. distributors (see Note 3 - Acquisitions). These transactions created a discrete non-taxable gain recognized on the original minority equity investments resulting in a tax benefit of $1.9 million.
During the first quarter ended March 31, 2017, the Company realized a foreign currency translation loss on discrete intercompany loans that were long-term-investment in nature resulting in a permanent tax benefit of $1.7 million and the Company released a valuation allowance on deferred tax of $1.9 million in a foreign jurisdiction where a restructuring occurred.
Significant components of the Company’s deferred tax assets and liabilities were as follows:
53
(In millions) | 2017 | 2016 | ||||||
Deferred tax assets: | ||||||||
Accrued expenses and reserves | $ | 9.6 | $ | 10.0 | ||||
Compensation and employee benefits | 17.4 | 24.2 | ||||||
Other items | 15.0 | 10.9 | ||||||
Valuation allowance on state and foreign deferred tax | (9.8 | ) | (9.8 | ) | ||||
Total deferred tax assets | 32.2 | 35.3 | ||||||
Deferred tax liabilities: | ||||||||
Accelerated depreciation on fixed assets | 12.0 | 13.8 | ||||||
Amortization of intangibles | 41.9 | 56.5 | ||||||
Other items | 0.3 | 0.9 | ||||||
Total deferred tax liabilities | 54.2 | 71.2 | ||||||
Net deferred tax liabilities | $ | (22.0 | ) | $ | (35.9 | ) | ||
The Company assesses the available positive and negative evidence to estimate whether sufficient future taxable income will be generated to permit use of the existing deferred tax assets. A significant piece of objective negative evidence evaluated was the cumulative loss for certain state and foreign income tax purposes incurred over the three-year period ended December 31, 2017. Such objective evidence limits the ability to consider other subjective evidence, such as projections for future growth.
On the basis of this evaluation, as of December 31, 2017, a valuation allowance of $9.8 million has been recorded to recognize only the portion of the deferred tax assets that are more likely than not to be realized. The Company has foreign income tax net operating loss (“NOL”) carryforwards of $7.0 million and state income tax NOL and credit carryforwards of $7.2 million, which will expire on various dates as follows:
(In millions) | |||
2018-2019 | $ | 1.1 | |
2020-2024 | 3.0 | ||
2025-2029 | 2.2 | ||
2030-2034 | 2.6 | ||
2035-2039 | 0.2 | ||
Unlimited | 5.1 | ||
$ | 14.2 | ||
The Company believes that it is more likely than not that the benefit from certain foreign NOL carryforwards as well as certain state NOL and state credit carryforwards will not be realized. In recognition of this risk, the Company has provided a valuation allowance of $2.7 million on the deferred tax assets related to these foreign NOL carryforwards and a valuation allowance of $7.1 million on the deferred tax assets related to these state NOL and credit carryforwards.
The Company continues to consider undistributed earnings from its foreign subsidiaries to be indefinitely reinvested with respect to the U.S. It is the Company’s policy to reinvest earnings as needed for operations, capital and acquisition spending. While the Tax Act resulted in the reduction of the excess of the amount for financial reporting over the tax basis in foreign subsidiaries, an actual repatriation from non-U.S. subsidiaries could still be subject to additional foreign withholding tax, foreign income tax, and U.S. state taxes. The Company considers the excess of the amount for financial reporting over the tax basis of its investments in its foreign subsidiaries of a provisional $325.2 million to be indefinitely reinvested and therefore have not recorded a deferred tax liability of $3.8 million.
As of the beginning of fiscal year 2017, the Company had gross unrecognized tax benefits of $1.3 million, excluding accrued interest and penalties. The unrecognized tax benefits increased due to uncertain tax positions identified in the current year based on evaluations made during 2017 which were offset by statue expirations. The Company had gross unrecognized tax benefits, excluding accrued interest and penalties, of $1.3 million as of December 31, 2017.
54
A reconciliation of the beginning and ending amount of gross unrecognized tax benefits for 2017, 2016, and 2015 (excluding interest and penalties) is as follows:
(In millions) | 2017 | 2016 | 2015 | |||||||||
Beginning balance | $ | 1.3 | $ | 2.4 | $ | 4.4 | ||||||
Additions for tax positions of the current year | 0.4 | 0.1 | 0.2 | |||||||||
Additions for tax positions of prior years | 0.2 | 0.1 | 0.2 | |||||||||
Reductions for tax positions of prior years | — | (0.2 | ) | (0.8 | ) | |||||||
Statute expirations | (0.6 | ) | (1.1 | ) | (1.6 | ) | ||||||
Settlements | — | — | — | |||||||||
Ending balance | $ | 1.3 | $ | 1.3 | $ | 2.4 | ||||||
If recognized, each annual effective tax rate would be affected by the net unrecognized tax benefits of $1.3 million, $1.3 million, and $2.3 million as of year-end 2017, 2016, and 2015, respectively.
The Company recognizes interest and penalties related to unrecognized tax benefits as a component of income tax expense. In 2017, interest and penalties decreased $0.5 million, for prior year tax positions. The Company has accrued interest and penalties as of December 31, 2017, December 31, 2016, and January 2, 2016 of approximately $0.6 million, $1.1 million, and $2.3 million, respectively.
The Company is subject to taxation in the United States and various state and foreign jurisdictions. With few exceptions, as of December 31, 2017, the Company is no longer subject to U.S. federal income tax examinations by tax authorities for years before 2014 and is no longer subject to foreign or state income tax examinations by tax authorities for years before 2012.
It is reasonably possible that the amounts of unrecognized tax benefits could change in the next twelve months as a result of an audit or due to the expiration of a statute of limitation. Based on the current audits in process and pending statute expirations, the payment of taxes as a result could be up to $0.9 million.
11. DEBT
Debt consisted of the following:
(In millions) | 2017 | 2016 | ||||||
New York Life | $ | 75.0 | $ | 75.0 | ||||
Credit Agreement | 67.0 | — | ||||||
Prudential Agreement | 60.0 | 90.0 | ||||||
Tax increment financing debt | 20.8 | 21.8 | ||||||
Capital leases | 0.1 | 0.1 | ||||||
Foreign subsidiary debt | 3.5 | 3.6 | ||||||
Less: unamortized debt issuance costs | (0.3 | ) | (0.3 | ) | ||||
226.1 | 190.2 | |||||||
Less current maturities | (100.5 | ) | (33.7 | ) | ||||
Long-term debt | $ | 125.6 | $ | 156.5 | ||||
Debt outstanding at December 31, 2017, excluding unamortized debt issuance costs, matures as follows:
(In millions) | Total | 2018 | 2019 | 2020 | 2021 | 2022 | Thereafter | |||||||||||||||||||||
Debt | $ | 226.3 | $ | 100.4 | $ | 31.3 | $ | 1.3 | $ | 1.2 | $ | 1.3 | $ | 90.8 | ||||||||||||||
Capital leases | 0.1 | 0.1 | — | — | — | — | — | |||||||||||||||||||||
$ | 226.4 | $ | 100.5 | $ | 31.3 | $ | 1.3 | $ | 1.2 | $ | 1.3 | $ | 90.8 | |||||||||||||||
55
New York Life
On May 27, 2015, the Company entered into an uncommitted and unsecured private shelf agreement with NYL Investors LLC, an affiliate of New York Life (the “New York Life Agreement”) for $150.0 million maximum aggregate principal borrowing capacity and the Company authorized the issuance of $75.0 million of floating rate senior notes due May 27, 2025. These senior notes have a floating interest rate of one-month USD LIBOR (1.55 percent as of December 31, 2017) plus a spread of 1.35 percent with interest-only payments due on a monthly basis. On October 28, 2016, the Company entered into the First Amendment to Note Purchase and Private Shelf Agreement. The Amendment was intended to make the covenants within the New York Life Agreement consistent with the covenants that were modified in the Third Amended and Restated Credit Agreement (the “Credit Agreement”). As of December 31, 2017, there was $75.0 million remaining borrowing capacity under the New York Life Agreement.
Project Bonds
On December 31, 2012, the Company, Allen County, Indiana and certain institutional investors entered into a Bond Purchase and Loan Agreement. Under the agreement, Allen County, Indiana issued a series of Project Bonds entitled “Taxable Economic Development Bonds, Series 2012 (Franklin Electric Co., Inc. Project).” The aggregate principal amount of the Project Bonds that were issued, authenticated, and are now outstanding thereunder was limited to $25.0 million. The Company then borrowed the proceeds under the Project Bonds through the issuance of Project Notes to finance the cost of acquisition, construction, installation and equipping of the new Global Corporate Headquarters and Engineering Center. These Project Notes (“Tax increment financing debt”) bear interest at 3.6 percent per annum. Interest and principal balance of the Project Notes are due and payable by the Company directly to the institutional investors in aggregate semi-annual installments commencing on July 10, 2013, and concluding on January 10, 2033. The use of the proceeds from the Project Notes was limited to assist the financing of the new Global Corporate Headquarters and Engineering Center. On May 5, 2015, the Company entered into Amendment No. 1 to the Bond Purchase and Loan Agreement. This amendment provided for debt repayment guarantees from certain Company subsidiaries and waived certain non-financial covenants related to subsidiary guarantees.
Prudential Agreement
On April 9, 2007, the Company entered into the Amended and Restated Note Purchase and Private Shelf Agreement (the “Prudential Agreement”) in the amount of $175.0 million. Under the Prudential Agreement, the Company issued notes in an aggregate principal amount of $110.0 million on April 30, 2007 (the “B-1 Notes”) and $40.0 million on September 7, 2007 (the “B-2 Notes”). The B-1 Notes and B-2 Notes bear a coupon of 5.79 percent and had at issuance an average life of 10 years with a final maturity in 2019. On July 22, 2010, the Company entered into Amendment No. 3 to the Prudential Agreement to increase its borrowing capacity by $25.0 million. On December 14, 2011, the Company entered into Amendment No. 4 to the Second Amended and Restated Note Purchase and Private Shelf Agreement to redefine the debt to EBITDA ratio covenant in order to be equivalent to that under the Agreement. On December 31, 2012, the Company and Prudential Insurance Company of America entered into an amendment to the Second Amended and Restated Note Purchase and Private Shelf Agreement to extend the effective date to December 31, 2015. On May 5, 2015, the Company entered into Amendment No. 6 to the Second Amended and Restated Note Purchase and Private Shelf Agreement. This amendment provided for debt repayment guarantees from certain Company subsidiaries and waived certain non-financial covenants related to subsidiary guarantees. On May 28, 2015, the Company entered into a Third Amended and Restated Note Purchase and Private Shelf Agreement with Prudential to increase the total borrowing capacity from $200.0 million to $250.0 million. On October 28, 2016, the Company entered into Amendment No. 1 to the Third Amended and Restated Note Purchase and Private Shelf Agreement. This amendment was intended to make the covenants within the Prudential Agreement consistent with the covenants that were modified in the Credit Agreement (below). As of December 31, 2017, the Company has $100.0 million borrowing capacity available under the Prudential Agreement. Principal installments of $30.0 million are payable annually commencing on April 30, 2015 and continuing to and including April 30, 2019, with any unpaid balance due at maturity.
Credit Agreement
On October 28, 2016, the Company entered into the Third Amended and Restated Credit Agreement (the “Credit Agreement”). The Credit Agreement extended the maturity date of the Company’s previous credit agreement to October 28, 2021 and increased the commitment amount from $150.0 million to $300.0 million. The Credit Agreement provides that the Borrowers may request an increase in the aggregate commitments by up to $150.0 million (not to exceed a total commitment of $450.0 million) subject to the conditions contained therein. All of the Company’s present and future material domestic subsidiaries unconditionally guaranty all of the Borrowers’ obligations under and in connection with the Credit Agreement. Additionally, the Company unconditionally guaranties all of the obligations of Franklin Electric B.V. under the Credit Agreement. Under the Credit Agreement, the Borrowers are required to pay certain fees, including a facility fee of 0.100% to 0.275% (depending on the Company’s leverage ratio) of the aggregate commitment, payable quarterly in arrears. Borrowings may be made either at (i) a Eurocurrency rate based on LIBOR plus an applicable margin of 0.75% to 1.60% (depending on the Company’s leverage ratio) or (ii) an alternative base rate as defined in the Credit Agreement.
56
As of December 31, 2017, the Company had $67.0 million outstanding borrowings, $5.5 million in letters of credit outstanding, and $227.5 million of available capacity under the Credit Agreement. As of December 31, 2016, the Company had no outstanding borrowings, $5.9 million in letters of credit outstanding, and $294.1 million of available capacity under the Credit Agreement.
Covenants
The Company’s credit agreements contain customary financial covenants. The Company’s most significant agreements and restrictive covenants are in the New York Life Agreement, the Project Bonds, the Prudential Agreement, and the Credit Agreement; each containing both affirmative and negative covenants. The affirmative covenants relate to financial statements, notices of material events, conduct of business, inspection of property, maintenance of insurance, compliance with laws and most favored lender obligations. The negative covenants include limitations on loans, advances and investments, and the granting of liens by the Company or its subsidiaries, as well as prohibitions on certain consolidations, mergers, sales and transfers of assets. The covenants also include financial requirements including a maximum leverage ratio of 3.50 to 1.00 (using net debt in the measure of leverage ratio, whereas the previous credit agreement used gross debt) and a minimum interest coverage ratio of 3.00 to 1.00 (using EBITDA in the measure, whereas the previous credit agreement used EBIT). Cross default is applicable with the Credit Agreement, the Prudential Agreement, the Project Bonds, and the New York Life Agreement, but only if the Company is defaulting on an obligation exceeding $10.0 million. The Company was in compliance with all financial covenants as of December 31, 2017.
12. SHAREHOLDERS’ EQUITY
Authorized Shares
The Company has the authority to issue 65,000,000, $.10 par value shares.
Share Repurchases
During 2017, 2016, and 2015, pursuant to a stock repurchase program authorized by the Company’s Board of Directors, the Company repurchased and retired the following amounts and number of shares:
(In millions, except share amounts) | 2017 | 2016 | 2015 | |||||||||
Repurchases | $ | — | $ | 3.8 | $ | 46.3 | ||||||
Shares | — | 144,600 | 1,568,731 | |||||||||
In 2017, the Company retired 87,679 shares that were received from employees as payment for the exercise price of their stock options and taxes owed upon the exercise of their stock options and release of their restricted awards. The Company also retired 14,033 shares that had been previously granted as stock awards to employees, but were forfeited upon not meeting the required restriction criteria or termination. In 2016, the Company retired 96,929 shares that were received from employees as payment for the exercise price of their stock options and taxes owed upon the exercise of their stock options and release of their restricted awards. The Company also retired 16,391 shares that had been previously granted as a stock award to employees, but were forfeited upon not meeting the required restriction criteria or termination. In 2015, the Company retired 65,209 shares that were received from employees as payment for the exercise price of their stock options and taxes owned upon the exercise of their stock options and release of their restricted awards. The Company also retired 958 shares that had been previously granted as stock awards to employees, but were forfeited upon not meeting the required restriction criteria or termination.
In 2015 the Company recorded $1.4 million as a reduction in tax liability and an increase to shareholders’ equity as a result of stock option exercises and award vests. In 2016, the Company early adopted ASU 2016-09; therefore, no amounts were recorded to equity as a result of stock option exercises and award vests for fiscal years 2017 and 2016.
57
13. ACCUMULATED OTHER COMPREHENSIVE INCOME/(LOSS)
Changes in accumulated other comprehensive income/(loss), net of tax, by component are summarized below:
(In millions) | Foreign Currency Translation Adjustments | Pension and Post-Retirement Plan Benefit Adjustments (2) | Total | ||||||||
Balance, January 3, 2015 | $ | (51.8 | ) | $ | (56.1 | ) | $ | (107.9 | ) | ||
Other comprehensive income/(loss) before reclassifications | (58.3 | ) | — | (58.3 | ) | ||||||
Amounts reclassified from accumulated other comprehensive income/(loss) (1) | — | 4.6 | 4.6 | ||||||||
Net other comprehensive income/(loss) | (58.3 | ) | 4.6 | (53.7 | ) | ||||||
Balance, January 2, 2016 | $ | (110.1 | ) | $ | (51.5 | ) | $ | (161.6 | ) | ||
Other comprehensive income/(loss) before reclassifications | (8.3 | ) | — | (8.3 | ) | ||||||
Amounts reclassified from accumulated other comprehensive income/(loss) (1) | — | — | — | ||||||||
Net other comprehensive income/(loss) | (8.3 | ) | — | (8.3 | ) | ||||||
Balance, December 31, 2016 | $ | (118.4 | ) | $ | (51.5 | ) | $ | (169.9 | ) | ||
Other comprehensive income/(loss) before reclassifications | 18.7 | — | 18.7 | ||||||||
Amounts reclassified from accumulated other comprehensive income/(loss) (1) | — | 2.2 | 2.2 | ||||||||
Net other comprehensive income/(loss) | 18.7 | 2.2 | 20.9 | ||||||||
Balance, December 31, 2017 | $ | (99.7 | ) | $ | (49.3 | ) | $ | (149.0 | ) | ||
(1) This accumulated other comprehensive income/(loss) component is included in the computation of net periodic pension cost (refer to Note 8 for additional details) and is included in the “Selling, general, and administrative expenses” line of the Company’s consolidated statements of income.
(2) Net of tax expense of $0.5 million, $0.5 million and $2.5 million for 2017, 2016, and 2015, respectively.
Amounts related to noncontrolling interests were not material.
14. EARNINGS PER SHARE
The Company calculates basic and diluted earnings per common share using the two-class method. Under the two-class method, net earnings are allocated to each class of common stock and participating security as if all of the net earnings for the period had been distributed. The Company’s participating securities consist of share-based payment awards that contain a nonforfeitable right to receive dividends and therefore are considered to participate in undistributed earnings with common shareholders.
Basic earnings per common share excludes dilution and is calculated by dividing net earnings allocable to common shares by the weighted-average number of common shares outstanding for the period. Diluted earnings per common share is calculated by dividing net earnings allocated to common shares by the weighted-average number of common shares outstanding for the period, as adjusted for the potential dilutive effect of non-participating share-based awards.
The following table sets forth the computation of basic and diluted earnings per share:
58
(In millions, except per share amounts) | 2017 | 2016 | 2015 | |||||||||
Numerator: | ||||||||||||
Net income attributable to Franklin Electric Co., Inc. | $ | 78.2 | $ | 78.7 | $ | 72.9 | ||||||
Less: Undistributed earnings allocated to participating securities | 0.6 | 0.7 | 0.7 | |||||||||
Less: Undistributed earnings allocated to redeemable noncontrolling interest | — | 1.0 | 0.8 | |||||||||
Net income available to common shareholders | $ | 77.6 | $ | 77.0 | $ | 71.4 | ||||||
Denominator: | ||||||||||||
Basic weighted average common shares outstanding | 46.5 | 46.2 | 47.1 | |||||||||
Effect of dilutive securities: | ||||||||||||
Non-participating employee stock options and performance awards | 0.5 | 0.5 | 0.5 | |||||||||
Diluted weighted average common shares outstanding | 47.0 | 46.7 | 47.6 | |||||||||
Basic earnings per share | $ | 1.67 | $ | 1.67 | $ | 1.52 | ||||||
Diluted earnings per share | $ | 1.65 | $ | 1.65 | $ | 1.50 | ||||||
There were 0.3 million, 0.4 million, and 0.3 million stock options outstanding as of 2017, 2016, and 2015, respectively, that were excluded from the computation of diluted earnings per share, as their inclusion would be anti-dilutive.
15. SHARE-BASED COMPENSATION
Effective May 5, 2017, the shareholders of the Company approved the Franklin Electric Co., Inc. 2017 Stock Plan (the “2017 Stock Plan”). The Board of Directors had previously approved the 2017 Stock Plan on March 15, 2017 subject to shareholder approval. The 2017 Stock Plan was enacted in addition to the previously approved 2009 and 2012 Stock Plans and is a share-based compensation plan that provides for discretionary grants of stock options, stock awards, stock unit awards, and stock appreciation rights (“SARs”) to key employees and non-employee directors. The number of shares that may be issued under the 2017 Stock Plan is 1,400,000. Stock options and SARs reduce the number of available shares by one share for each share subject to the option or SAR, and stock awards and stock unit awards settled in shares reduce the number of available shares by 1.5 shares for every one share delivered. No awards have been issued under the 2017 Stock Plan.
The Company also maintains the Franklin Electric Co., Inc. 2012 Stock Plan (the “2012 Stock Plan”), which is a share-based compensation plan that provides for discretionary grants of stock options, stock awards and stock unit awards to key employees and non-employee directors.
The 2012 Stock Plan authorized 2,400,000 shares for issuance as follows:
2012 Stock Plan | Authorized Shares | |
Stock Options | 1,680,000 | |
Stock/Stock Unit Awards | 720,000 | |
The Company also maintains the Amended and Restated Franklin Electric Co., Inc. Stock Plan (the “2009 Stock Plan”) which, as amended in 2009, provided for discretionary grants of stock options and stock awards. The 2009 Stock Plan authorized 4,400,000 shares for issuance as follows:
2009 Stock Plan | Authorized Shares |
Stock Options | 3,200,000 |
Stock Awards | 1,200,000 |
All options in the 2009 Stock Plan have been awarded.
The Company currently issues new shares from its common stock balance to satisfy option exercises and the settlement of stock awards and stock unit awards made under the 2009 Stock Plan and/or the 2012 Stock Plan.
59
The total share-based compensation expense recognized in 2017, 2016, and 2015 was $7.1 million, $6.9 million, and $5.6 million, respectively.
Stock Options:
Under the above plans, the exercise price of each option equals the market price of the Company’s common stock on the date of grant, and the options expire 10 years after the date of the grant. Options granted to employees vest at 25 percent a year and become fully vested and fully exercisable after 4 years (vesting is accelerated upon retirement, death, or disability). Subject to the terms of the plans, in general, the aggregate option exercise price and any applicable tax withholdings may be satisfied in cash or its equivalent, by the plan participant’s delivery of shares of the Company’s common stock having a fair market value at the time of exercise equal to the aggregate option exercise price and/or the applicable tax withholdings or by having shares otherwise subject to the award withheld by the Company or via cashless exercise through a broker-dealer.
The fair value of each option award is estimated on the date of grant using the Black-Scholes option valuation model with a single approach and amortized using a straight-line attribution method over the option’s vesting period. Options granted to retirement eligible employees are immediately expensed. The Company uses historical data to estimate the expected volatility of its stock, the weighted average expected life, the period of time options granted are expected to be outstanding, and its dividend yield. The risk-free rates for periods within the contractual life of the option are based on the U.S. Treasury yield curve in effect at the time of the grant.
The table below provides the weighted average grant-date fair values and key assumptions used for the Black-Scholes model to determine the fair value of options granted during 2017, 2016, and 2015:
2017 | 2016 | 2015 | ||||||||||
Risk-free interest rate | 1.89 | % | 1.21 | % | 1.59 | % | ||||||
Dividend yield | 0.94 | % | 1.32 | % | 0.95 | % | ||||||
Volatility factor | 31.19 | % | 37.70 | % | 37.90 | % | ||||||
Expected term | 5.5 years | 5.5 years | 5.5 years | |||||||||
Weighted average grant-date fair value of options | $ | 12.30 | $ | 9.18 | $ | 12.34 | ||||||
A summary of the Company’s outstanding stock option activity and related information is as follows:
(Shares in thousands) | |||||||||||||
Stock Options | Shares | Weighted-Average Exercise Price | Weighted-Average Remaining Contractual Term | Aggregate Intrinsic Value (000’s) | |||||||||
Outstanding at beginning of 2017 | 1,455 | $ | 25.02 | ||||||||||
Granted | 192 | 42.49 | |||||||||||
Exercised | (256 | ) | 17.56 | ||||||||||
Forfeited | (2 | ) | 35.99 | ||||||||||
Expired | (1 | ) | 43.27 | ||||||||||
Outstanding at end of 2017 | 1,388 | $ | 28.79 | 5.46 years | $ | 23,756 | |||||||
Expected to vest after applying forfeiture rate | 1,371 | $ | 28.69 | 5.42 years | $ | 23,600 | |||||||
Vested and exercisable at end of period | 903 | $ | 24.73 | 4.08 years | $ | 19,119 | |||||||
60
(In millions) | 2017 | 2016 | 2015 | |||||||||
Intrinsic value of options exercised | $ | 6.2 | $ | 5.2 | $ | 1.7 | ||||||
Cash received from the exercise of options | 4.5 | 5.2 | 2.0 | |||||||||
Fair value of shares vested | 2.1 | 1.7 | 1.4 | |||||||||
Tax benefit of options exercised | 2.1 | 1.9 | 0.7 | |||||||||
As of December 31, 2017, there was $1.6 million of total unrecognized compensation cost related to non-vested stock options granted under the 2012 Stock Plan. That cost is expected to be recognized over a weighted-average period of 1.83 years.
Stock/Stock Unit Awards:
Under the 2009 Stock Plan, non-employee directors and employees may be granted stock awards. Under the 2012 Stock Plan and the 2017 Stock Plan, non-employee directors and employees may be granted stock awards and stock units.
Stock awards to non-employee directors are generally fully vested when made. Stock/stock unit awards to employees cliff vest over 3 or 4 years (subject to accelerated vesting of a pro rata portion in the case of retirement, death or disability) and may be contingent on the attainment of certain performance goals. Dividends are paid to the recipient prior to vesting, except that dividends on performance-based stock awards under the 2012 Stock Plan and the 2017 Stock Plan will be paid only to the extent the performance goals are met.
Stock/stock unit awards granted to retirement eligible employees are expensed over the vesting period. Compensation cost for the performance stock/stock unit awards is accrued based on the probable outcome of specified performance conditions.
A summary of the Company’s restricted stock/stock unit award activity and related information is as follows:
(Shares in thousands) | |||||||
Restricted Stock/Stock Unit Awards | Shares | Weighted-Average Grant- Date Fair Value | |||||
Non-vested at beginning of 2017 | 473 | $ | 34.89 | ||||
Awarded | 136 | 42.23 | |||||
Vested | (109 | ) | 35.81 | ||||
Forfeited | (37 | ) | 36.51 | ||||
Non-vested at end of 2017 | 463 | $ | 36.71 | ||||
The weighted-average grant date fair value of restricted stock/stock unit awards granted in 2017, 2016, and 2015, is $42.23, $29.45, and $36.27, respectively.
As of December 31, 2017, there was $8.9 million of total unrecognized compensation cost related to non-vested stock/stock unit awards granted under the 2012 Stock Plan and the 2009 Stock Plan. That cost is expected to be recognized over a weighted-average period of 2.14 years.
16. SEGMENT AND GEOGRAPHIC INFORMATION
The Company’s business consists of the Water Systems, Distribution, and Fueling Systems reportable segments, based on the principal end market served. Within the Water Systems segment, North America Water Systems and International Water Systems have been identified as operating segments. For reportable segment purposes, the Company aggregates North America Water Systems and International Water Systems into the Water Systems segment, as they meet the aggregation criteria in FASB ASC 280. The Company includes unallocated corporate expenses and inter-company eliminations in an “Intersegment Eliminations/Other” segment that together with the Water Systems, Distribution, and Fueling Systems segments, represent the Company.
The Water Systems segment designs, manufactures and sells motors, pumps, electronic controls and related parts and equipment primarily for use in submersible water and other fluid system applications. The Fueling Systems segment designs, manufactures and sells pumps, electronic controls and related parts and equipment primarily for use in submersible fueling system applications. The Fueling Systems segment integrates and sells motors and electronic controls produced by the Water Systems segment. The Distribution segment sells to and provides pre sale support and specifications to the installing contractors. The Distribution segment sells products produced by the Water Systems segment.
The accounting policies of the Company’s reportable segments are the same as those described in Note 1 (Summary of Significant Accounting Policies). Performance is evaluated based on the sales and operating income of the segments and a variety of ratios to measure performance. These results are not necessarily indicative of the results of operations that would have occurred had each segment been an independent, stand-alone entity during the periods presented.
61
Financial information by reportable business segment is included in the following summary:
Net Sales | |||||||||||
(In millions) | 2017 | 2016 | 2015 | ||||||||
Water Systems | |||||||||||
External sales | 703.3 | 723.2 | 707.6 | ||||||||
Intersegment sales | 45.3 | — | — | ||||||||
Total sales | 748.6 | 723.2 | 707.6 | ||||||||
Distribution | |||||||||||
External sales | 176.7 | — | — | ||||||||
Intersegment sales | — | — | — | ||||||||
Total sales | 176.7 | — | — | ||||||||
Fueling Systems | |||||||||||
External sales | 244.9 | 226.7 | 217.3 | ||||||||
Intersegment sales | 1.0 | — | — | ||||||||
Total Sales | 245.9 | 226.7 | 217.3 | ||||||||
Intersegment Eliminations/Other | (46.3 | ) | — | — | |||||||
Consolidated | $ | 1,124.9 | $ | 949.9 | $ | 924.9 | |||||
Operating income (loss) | |||||||||||
2017 | 2016 | 2015 | |||||||||
Water Systems | $ | 102.0 | $ | 108.2 | $ | 86.7 | |||||
Distribution | 3.7 | — | — | ||||||||
Fueling Systems | 60.0 | 56.3 | 51.5 | ||||||||
Intersegment Eliminations/Other | (58.7 | ) | (53.7 | ) | (47.8 | ) | |||||
Consolidated | $ | 107.0 | $ | 110.8 | $ | 90.4 | |||||
Total assets | Depreciation | ||||||||||||||||||||||
2017 | 2016 | 2015 | 2017 | 2016 | 2015 | ||||||||||||||||||
Water Systems | $ | 695.4 | $ | 671.5 | $ | 677.6 | $ | 20.9 | $ | 19.5 | $ | 19.5 | |||||||||||
Distribution | 153.1 | — | — | 1.3 | — | — | |||||||||||||||||
Fueling Systems | 265.7 | 251.1 | 248.5 | 2.2 | 2.3 | 2.5 | |||||||||||||||||
Other | 71.2 | 117.3 | 70.0 | 5.5 | 5.3 | 4.8 | |||||||||||||||||
Consolidated | $ | 1,185.4 | $ | 1,039.9 | $ | 996.1 | $ | 29.9 | $ | 27.1 | $ | 26.8 | |||||||||||
Amortization | Capital expenditures | ||||||||||||||||||||||
2017 | 2016 | 2015 | 2017 | 2016 | 2015 | ||||||||||||||||||
Water Systems | $ | 6.2 | $ | 6.4 | $ | 6.6 | $ | 19.1 | $ | 31.8 | $ | 19.5 | |||||||||||
Distribution | 0.4 | — | — | 1.1 | — | — | |||||||||||||||||
Fueling Systems | 1.9 | 1.9 | 1.9 | 11.0 | 2.1 | 1.4 | |||||||||||||||||
Other | 0.1 | 0.1 | 0.1 | 2.2 | 3.7 | 5.0 | |||||||||||||||||
Consolidated | $ | 8.6 | $ | 8.4 | $ | 8.6 | $ | 33.4 | $ | 37.6 | $ | 25.9 | |||||||||||
Property, plant and equipment is the major asset group in “Other” of total assets at December 31, 2017. Cash is the major asset group in “Other” of total assets at December 31, 2016.
Financial information by geographic region is as follows:
62
Net sales | Long-lived assets | ||||||||||||||||||||||
(In millions) | 2017 | 2016 | 2015 | 2017 | 2016 | 2015 | |||||||||||||||||
United States | $ | 596.6 | $ | 446.9 | $ | 418.5 | $ | 326.1 | $ | 349.2 | $ | 404.1 | |||||||||||
Foreign | 528.3 | 503.0 | 506.4 | 261.2 | 202.3 | 150.7 | |||||||||||||||||
Consolidated | $ | 1,124.9 | $ | 949.9 | $ | 924.9 | $ | 587.3 | $ | 551.5 | $ | 554.8 | |||||||||||
Net sales are attributed to geographic regions based upon the ship to location of the customer. Long-lived assets are attributed to geographic regions based upon the country of domicile.
The Company offers a large array of products and systems to multiple markets and customers. Product sales information is tracked regionally and products are categorized differently between regions based on local needs and reporting requirements. However, net sales by segment are representative of the Company’s sales by major product category. The Company sells its products through various distribution channels including wholesale and retail distributors, specialty distributors, industrial and petroleum equipment distributors, as well as major oil and utility companies and original equipment manufacturers.
No single customer accounted for more than 10 percent of the Company’s consolidated sales in 2017, 2016, or 2015. No single customer accounted for more than 10 percent of the Company’s gross accounts receivable in 2017 or 2016.
17. COMMITMENTS AND CONTINGENCIES
The Company is defending various claims and legal actions which have arisen in the ordinary course of business. In the opinion of management, based on current knowledge of the facts and after discussion with counsel, these claims and legal actions can be defended or resolved without a material effect on the Company’s financial position, results of operations, and net cash flows.
Total rent expense charged to operations for operating leases including contingent rentals was $15.1 million, $11.7 million, and $11.9 million in 2017, 2016, and 2015, respectively.
The future minimum rental payments for non-cancelable operating leases as of December 31, 2017, are as follows:
(In millions) | 2018 | 2019 | 2020 | 2021 | 2022 | Thereafter | |||||||||||||||||
Future minimum rental payments | $ | 12.0 | $ | 8.8 | $ | 6.2 | $ | 4.7 | $ | 3.2 | $ | 2.3 | |||||||||||
At December 31, 2017, the Company had $5.9 million of commitments primarily for capital expenditures and the purchase of raw materials to be used in production.
The changes in the carrying amount of the warranty accrual, as recorded in the “Accrued expenses and other current liabilities” line of the Company’s consolidated balance sheets for 2017 and 2016, are as follows:
(In millions) | 2017 | 2016 | ||||||
Beginning balance | $ | 8.2 | $ | 9.3 | ||||
Accruals related to product warranties | 9.5 | 5.9 | ||||||
Additions related to acquisitions | 1.2 | — | ||||||
Reductions for payments made | (9.4 | ) | (7.0 | ) | ||||
Ending balance | $ | 9.5 | $ | 8.2 | ||||
18. RESTRUCTURING
During the fourth quarter of 2017, the Company approved a plan to close the Wadcorpp India Private Limited (“Wadcorpp”) joint venture. The Company purchased a controlling interest in the Wadcorpp entity during the third quarter 2014, and included the entity as a fully consolidated subsidiary in the Fueling Systems segment. As part of this action, the Company will continue to sell fueling product in the India market, while the Wadcorpp manufacturing operations will cease. The closure began in the fourth quarter 2017 and is estimated to conclude by the end of 2018. Charges for the closure are expected to range between $2 million and $4 million and will include severance expenses, asset write-offs and other closure expenses.
Costs incurred in the twelve months ended December 31, 2017, included in the “Restructuring (income)/expense” line of the Company’s consolidated statements of income, are as follows:
(In millions) | Water Systems | Fueling Systems | Distribution | Other | Consolidated | |||||||||||||||
Employee severance | $ | 1.6 | $ | — | — | $ | — | $ | 1.6 | |||||||||||
Equipment relocation | 0.1 | — | — | — | 0.1 | |||||||||||||||
Asset write-off, net of gain on disposal | — | 1.6 | — | — | 1.6 | |||||||||||||||
Other | 1.0 | — | — | — | 1.0 | |||||||||||||||
Total | $ | 2.7 | $ | 1.6 | $ | — | $ | — | $ | 4.3 | ||||||||||
Restructuring (income)/expense of $(0.6) million and $3.0 million were incurred in 2016 and 2015, respectively, primarily for the Water Systems realignment.
As of December 31, 2017 and December 31, 2016, there were no material restructuring reserves.
19. SELECTED QUARTERLY FINANCIAL DATA (UNAUDITED)
Unaudited quarterly financial information for 2017 and 2016, is as follows:
63
(In millions, except per share amounts) | |||||||||||||||||||||||
Net Sales | Gross Profit | Net Income | Net Income Attributable to Franklin Electric Co., Inc. | Basic Earnings Per Share | Diluted Earnings Per Share | ||||||||||||||||||
2017 | |||||||||||||||||||||||
1st quarter | $ | 220.3 | $ | 75.8 | $ | 15.9 | $ | 15.7 | $ | 0.33 | $ | 0.33 | |||||||||||
2nd quarter | 305.3 | 102.8 | 30.2 | 29.9 | 0.64 | 0.64 | |||||||||||||||||
3rd quarter | 311.1 | 103.8 | 24.5 | 24.5 | 0.52 | 0.52 | |||||||||||||||||
4th quarter | 288.2 | 94.6 | 8.0 | 8.1 | 0.17 | 0.17 | |||||||||||||||||
$ | 1,124.9 | $ | 377.0 | $ | 78.6 | $ | 78.2 | $ | 1.67 | $ | 1.65 | ||||||||||||
2016 | |||||||||||||||||||||||
1st quarter | $ | 218.4 | $ | 74.2 | $ | 13.6 | $ | 13.5 | $ | 0.28 | $ | 0.28 | |||||||||||
2nd quarter | 252.1 | 90.7 | 24.2 | 24.0 | 0.51 | 0.50 | |||||||||||||||||
3rd quarter | 239.8 | 85.5 | 23.7 | 23.7 | 0.51 | 0.50 | |||||||||||||||||
4th quarter | 239.6 | 81.0 | 17.8 | 17.5 | 0.37 | 0.37 | |||||||||||||||||
$ | 949.9 | $ | 331.4 | $ | 79.3 | $ | 78.7 | $ | 1.67 | $ | 1.65 | ||||||||||||
Basic and diluted earnings per share amounts are computed independently for each of the quarters presented. As a result, the sum of the quarterly earnings per share amounts may not equal the annual earnings per share amount.
20. SUBSEQUENT EVENT
On January 2, 2018, Headwater Company, LLC, a wholly owned subsidiary of the Company, acquired 100 percent interest of Valley Farm Supply, Inc. (Valley Farms) of Lansing, Michigan for approximately $9.0 million. Valley Farms will continue to operate as a professional groundwater distributor and will be included as a part of the Distribution Segment of the Company.
64
REPORT OF INDEPENDENT REGISTERED PUBLIC ACCOUNTING FIRM
To the Shareholders and the Board of Directors of Franklin Electric Co., Inc.
Fort Wayne, Indiana
Opinion on the Financial Statements
We have audited the accompanying consolidated balance sheets of Franklin Electric Co., Inc. and subsidiaries (the “Company”) as of December 31, 2017 and 2016, the related consolidated statements of income, comprehensive income, cash flows, and equity for each of the three years in the period ended December 31, 2017, and the related notes and the schedule listed in the Index at Item 15 (collectively referred to as the “financial statements”). In our opinion, the financial statements present fairly, in all material respects, the financial position of the Company as of December 31, 2017 and 2016, and the results of its operations and its cash flows for each of the three years in the period ended December 31, 2017, in conformity with accounting principles generally accepted in the United States of America.
We have also audited, in accordance with the standards of the Public Company Accounting Oversight Board (United States) (PCAOB), the Company’s internal control over financial reporting as of December 31, 2017, based on criteria established in Internal Control - Integrated Framework (2013) issued by the Committee of Sponsoring Organizations of the Treadway Commission and our report dated February 27, 2018, expressed an unqualified opinion on the Company’s internal control over financial reporting.
Basis for Opinion
These financial statements are the responsibility of the Company’s management. Our responsibility is to express an opinion on the Company’s financial statements based on our audits. We are a public accounting firm registered with the PCAOB and are required to be independent with respect to the Company in accordance with the U.S. federal securities laws and the applicable rules and regulations of the Securities and Exchange Commission and the PCAOB.
We conducted our audits in accordance with the standards of the PCAOB. Those standards require that we plan and perform the audit to obtain reasonable assurance about whether the financial statements are free of material misstatement, whether due to error or fraud. Our audits included performing procedures to assess the risks of material misstatement of the financial statements, whether due to error or fraud, and performing procedures that respond to those risks. Such procedures included examining, on a test basis, evidence regarding the amounts and disclosures in the financial statements. Our audits also included evaluating the accounting principles used and significant estimates made by management, as well as evaluating the overall presentation of the financial statements. We believe that our audits provide a reasonable basis for our opinion.
/s/DELOITTE & TOUCHE LLP
Chicago, Illinois
February 27, 2018
We have served as the Company’s auditor since 1988.
65
ITEM 9. CHANGES IN AND DISAGREEMENTS WITH ACCOUNTANTS ON ACCOUNTING AND FINANCIAL DISCLOSURE
None.
ITEM 9A. CONTROLS AND PROCEDURES
As of the end of the period covered by this report (the “Evaluation Date”), the Company carried out an evaluation, under the supervision and with the participation of the Company’s management, including the Company’s Chief Executive Officer and the Company’s Chief Financial Officer, of the effectiveness of the design and operation of the Company’s disclosure controls and procedures pursuant to Exchange Act Rules 13a-15. Based upon that evaluation, the Company’s Chief Executive Officer and the Company’s Chief Financial Officer concluded that, as of the Evaluation Date, the Company’s disclosure controls and procedures were effective.
In the third quarter of 2016, the Company began the process of a multi-year implementation of a global enterprise resource planning (“ERP”) system. The new ERP system was designed to better support the Company’s business needs in response to the changing operating environment. The implementation of a worldwide ERP system will likely affect the processes that constitute the Company’s internal control over financial reporting and will require testing for effectiveness as the implementation progresses. The Company expects that the new ERP system will enhance the overall system of internal controls over financial reporting through further automation and integration of business processes, although it is not being implemented in response to any identified deficiency in the Company’s internal controls over financial reporting.
Other than the ERP implementation, there have been no changes in the Company’s internal control over financial reporting identified in connection with the evaluation required by Rules 13a-15 under the Exchange Act during the last fiscal quarter that have materially affected, or are reasonably likely to materially affect the Company’s internal control over financial reporting.
MANAGEMENT’S REPORT ON INTERNAL CONTROL OVER FINANCIAL REPORTING
Management is responsible for establishing and maintaining an adequate system of internal control over financial reporting of the Company. This system is designed to provide reasonable assurance regarding the reliability of financial reporting and the preparation of financial statements for external purposes in accordance with accounting principles generally accepted in the United States of America.
The Company’s internal control over financial reporting includes those policies and procedures that (i) pertain to the maintenance of records that, in reasonable detail, accurately and fairly reflect the transactions and dispositions of the assets of the Company; (ii) provide reasonable assurance that transactions are recorded as necessary to permit preparation of financial statements in accordance with generally accepted accounting principles, and that receipts and expenditures of the Company are being made only in accordance with authorizations of management and directors of the Company; (iii) provide reasonable assurance regarding prevention or timely detection of unauthorized acquisition, use, or disposition of the Company’s assets that could have a material effect on the financial statements.
Because of its inherent limitations, internal control over financial reporting can provide only reasonable assurance with respect to financial statement preparation and may not prevent or detect misstatements. Further, because of changes in conditions, effectiveness of internal controls over financial reporting may vary over time.
Management conducted an evaluation of the effectiveness of the system of internal control over financial reporting based on the framework in the Internal Control - Integrated Framework (2013) issued by the Committee of Sponsoring Organizations of the Treadway Commission. Management excluded 2M, DSI, and Western Hydro from its assessment of internal controls over financial reporting because those entities were acquired by the Company in the second quarter of 2017. This exclusion is in accordance with the general guidance from the Staff of the Securities and Exchange Commission that an assessment of a recently acquired business may be omitted from the scope of management’s assessment of internal control over financial reporting for one year following the acquisition. The net sales and total assets of the Headwater acquisitions represented approximately 15.7 percent and 12.9 percent, respectively, of the consolidated financial statement amounts as of and for the year ended December 31, 2017. Based on its evaluation, management concluded that the Company’s system of internal control over financial reporting was effective as of December 31, 2017.
Our independent registered public accounting firm has issued an audit report on the effectiveness of the Company’s internal control over financial reporting as of December 31, 2017. This report appears on page 68.
66
REPORT OF INDEPENDENT REGISTERED PUBLIC ACCOUNTING FIRM
To the Shareholders and the Board of Directors of Franklin Electric Co., Inc.
Fort Wayne, Indiana
Opinion on Internal Control over Financial Reporting
We have audited the internal control over financial reporting of Franklin Electric Co., Inc. and subsidiaries (the “Company”) as of December 31, 2017, based on criteria established in Internal Control -Integrated Framework (2013) issued by the Committee of Sponsoring Organizations of the Treadway Commission (COSO). In our opinion, the Company maintained, in all material respects, effective internal control over financial reporting as of December 31, 2017, based on criteria established in Internal Control - Integrated Framework (2013) issued by COSO.
We have also audited, in accordance with the standards of the Public Company Accounting Oversight Board (United States) (PCAOB), the consolidated financial statements and financial statement schedule as of and for the year ended December 31, 2017 of the Company and our report dated February 27, 2018, expressed an unqualified opinion on those financial statements.
As described in Management’s Report on Internal Control over Financial Reporting, management excluded from its assessment the internal control over financial reporting at 2M Company, Inc. (“2M”), Drillers Service, Inc. (“DSI”), and Western Hydro, LLC (“Western Hydro”) (collectively referred to as the “Headwater acquisitions”), in which the Company acquired a controlling interest on April 10, 2017, April 30, 2017, and April 10, 2017, respectively, at which time the Headwater acquisitions became wholly-owned. The net sales and total assets of the Headwater acquisitions represented approximately 15.7 percent and 12.9 percent, respectively, of the consolidated financial statement amounts as of and for the year ended December 31, 2017. Accordingly, our audit did not include the internal control over financial reporting at the Headwater acquisitions.
Basis for Opinion
The Company’s management is responsible for maintaining effective internal control over financial reporting and for its assessment of the effectiveness of internal control over financial reporting, included in the accompanying Management’s Report on Internal Control over Financial Reporting. Our responsibility is to express an opinion on the Company’s internal control over financial reporting based on our audit. We are a public accounting firm registered with the PCAOB and are required to be independent with respect to the Company in accordance with the U.S. federal securities laws and the applicable rules and regulations of the Securities and Exchange Commission and the PCAOB.
We conducted our audit in accordance with the standards of the PCAOB. Those standards require that we plan and perform the audit to obtain reasonable assurance about whether effective internal control over financial reporting was maintained in all material respects. Our audit included obtaining an understanding of internal control over financial reporting, assessing the risk that a material weakness exists, testing and evaluating the design and operating effectiveness of internal control based on the assessed risk, and performing such other procedures as we considered necessary in the circumstances. We believe that our audit provides a reasonable basis for our opinion.
Definition and Limitations of Internal Control over Financial Reporting
A company’s internal control over financial reporting is a process designed to provide reasonable assurance regarding the reliability of financial reporting and the preparation of financial statements for external purposes in accordance with generally accepted accounting principles. A company’s internal control over financial reporting includes those policies and procedures that (1) pertain to the maintenance of records that, in reasonable detail, accurately and fairly reflect the transactions and dispositions of the assets of the company; (2) provide reasonable assurance that transactions are recorded as necessary to permit preparation of financial statements in accordance with generally accepted accounting principles, and that receipts and expenditures of the company are being made only in accordance with authorizations of management and directors of the company; and (3) provide reasonable assurance regarding prevention or timely detection of unauthorized acquisition, use, or disposition of the company’s assets that could have a material effect on the financial statements.
Because of its inherent limitations, internal control over financial reporting may not prevent or detect misstatements. Also, projections of any evaluation of effectiveness to future periods are subject to the risk that controls may become inadequate because of changes in conditions, or that the degree of compliance with the policies or procedures may deteriorate.
/s/ DELOITTE & TOUCHE LLP
Chicago, Illinois
February 27, 2018
67
ITEM 9B. OTHER INFORMATION
None.
68
PART III
ITEM 10. DIRECTORS, EXECUTIVE OFFICERS AND CORPORATE GOVERNANCE
The information concerning directors and director nominees required by this Item 10 is set forth in the Company’s Proxy Statement for the Annual Meeting of Shareholders to be held on May 4, 2018, under the headings of “ELECTION OF DIRECTORS” and “INFORMATION CONCERNING NOMINEES AND CONTINUING DIRECTORS,” and is incorporated herein by reference.
The information concerning executive officers required by this Item 10 is contained in Part I of this Form 10-K under the heading of “EXECUTIVE OFFICERS OF THE REGISTRANT,” and is incorporated herein by reference.
The information concerning Regulation S-K, Item 405 disclosures of delinquent Form 3, 4, or 5 filers required by this Item 10 is set forth in the Company’s Proxy Statement for the Annual Meeting of Shareholders to be held on May 4, 2018, under the heading of “SECTION 16(a) BENEFICIAL OWNERSHIP REPORTING COMPLIANCE,” and is incorporated herein by reference.
The information concerning the procedures for shareholders to recommend nominees to the Company’s board of directors, the Audit Committee of the board of directors, and the Company’s code of conduct and ethics required by this Item 10 is set forth in the Company’s Proxy Statement for the Annual Meeting of Shareholders to be held on May 4, 2018 under the heading “INFORMATION ABOUT THE BOARD AND ITS COMMITTEES,” and is incorporated herein by reference.
ITEM 11. EXECUTIVE COMPENSATION
The information required by Item 11 is set forth in the Company’s Proxy Statement for the Annual Meeting of Shareholders to be held on May 4, 2018, under the headings of “INFORMATION ABOUT THE BOARD AND ITS COMMITTEES,” “MANAGEMENT ORGANIZATION AND COMPENSATION COMMITTEE REPORT,” “COMPENSATION, DISCUSSION AND ANALYSIS,” “SUMMARY COMPENSATION TABLE,” “GRANT OF PLAN BASED AWARDS TABLE,” “OUTSTANDING EQUITY AWARDS AT FISCAL YEAR-END TABLE,” “OPTION EXCERCISES AND STOCK VESTED TABLE,” “PENSION BENEFITS TABLE,” “NON-QUALIFIED DEFERRED COMPENSATION,” “POTENTIAL PAYMENTS UPON TERMINATION OR CHANGE IN CONTROL OF THE COMPANY,” and “DIRECTOR COMPENSATION,” and is incorporated herein by reference.
ITEM 12. SECURITY OWNERSHIP OF CERTAIN BENEFICIAL OWNERS AND MANAGEMENT AND RELATED STOCKHOLDER MATTERS
The information required by Item 12 is set forth in the Company’s Proxy Statement for the Annual Meeting of Shareholders to be held on May 4, 2018, under the headings of “SECURITY OWNERSHIP OF CERTAIN BENEFICIAL OWNERS,” “SECURITY OWNERSHIP OF MANAGEMENT” and “SECURITIES AUTHORIZED FOR ISSUANCE UNDER EQUITY COMPENSATION PLANS,” and is incorporated herein by reference.
ITEM 13. CERTAIN RELATIONSHIPS AND RELATED TRANSACTIONS, AND DIRECTOR INDEPENDENCE
The information required by Item 13 is set forth in the Company’s Proxy Statement for the Annual Meeting of Shareholders to be held on May 4, 2018, under the heading “INFORMATION ABOUT THE BOARD AND ITS COMMITTEES,” and is incorporated herein by reference.
ITEM 14. PRINCIPAL ACCOUNTANT FEES AND SERVICES
The information required by Item 14 is set forth in the Company’s Proxy Statement for the Annual Meeting of Shareholders to be held on May 4, 2018, under the heading “PROPOSAL 2: RATIFICATION OF THE APPOINTMENT OF DELOITTE & TOUCHE LLP AS THE COMPANY’S INDEPENDENT REGISTERED PUBLIC ACCOUNTING FIRM FOR THE 2018 FISCAL YEAR,” and is incorporated herein by reference.
69
PART IV
ITEM 15. EXHIBITS AND FINANCIAL STATEMENTS SCHEDULES
Documents filed as part of this report: | Form 10-K Annual Report (page) | |
1. Financial Statements - Franklin Electric Co., Inc. | ||
2. Financial Statement Schedule - Franklin Electric Co., Inc. | ||
Schedules other than those listed above are omitted for the reason that they are not required or are not applicable, or the required information is disclosed elsewhere in the financial statements and related notes. | ||
3. Exhibits | ||
Management Contract, Compensatory Plan, or Arrangement is denoted by an asterisk (*). | ||
70
FRANKLIN ELECTRIC CO., INC. AND CONSOLIDATED SUBSIDIARIES
SCHEDULE II - VALUATION AND QUALIFYING ACCOUNTS
(In millions) | Balance at Beginning of Period | Additions Charged to Costs and Expenses | Deductions (a) | Other (b) | Balance at End of Period | |||||||||||||||
2017 | ||||||||||||||||||||
Allowance for doubtful accounts | $ | 3.6 | $ | (0.1 | ) | $ | 0.2 | $ | 1.1 | $ | 4.4 | |||||||||
Allowance for deferred taxes | 9.8 | 2.4 | 2.4 | — | 9.8 | |||||||||||||||
2016 | ||||||||||||||||||||
Allowance for doubtful accounts | $ | 3.8 | $ | 0.1 | $ | 0.3 | $ | — | $ | 3.6 | ||||||||||
Allowance for deferred taxes | 7.2 | 2.9 | 0.3 | — | 9.8 | |||||||||||||||
2015 | ||||||||||||||||||||
Allowance for doubtful accounts | $ | 3.2 | $ | 1.1 | $ | 0.5 | $ | — | $ | 3.8 | ||||||||||
Allowance for deferred taxes | 3.9 | 3.5 | 0.2 | — | 7.2 | |||||||||||||||
(a) Charges for which allowances were created.
(b) Primarily related to acquisitions
71
SIGNATURES
Pursuant to the requirements of Section 13 or 15(d) of the Securities Exchange Act of 1934, the registrant has duly caused this report to be signed on its behalf by the undersigned thereunto duly authorized.
FRANKLIN ELECTRIC CO., INC. | |||
Registrant | |||
Date: February 27, 2018 | By | /s/ Gregg C. Sengstack | |
Gregg C. Sengstack, Chairman and Chief Executive Officer | |||
72
Pursuant to the requirements of the Securities Exchange Act of 1934, this report has been signed below by the following persons on behalf of the registrant and in the capacities indicated on February 27, 2018.
By | /s/ Gregg C. Sengstack | |
Gregg C. Sengstack | ||
Chairman and Chief Executive Officer | ||
(Principal Executive Officer) | ||
/s/ John J. Haines | ||
John J. Haines | ||
Vice President and Chief Financial Officer | ||
(Principal Financial and Accounting Officer) | ||
/s/ David T. Brown | ||
David T. Brown | ||
Director | ||
/s/ Renee J. Peterson | ||
Renee J. Peterson | ||
Director | ||
/s/ David A. Roberts | ||
David A. Roberts | ||
Director | ||
/s/ Jennifer L. Sherman | ||
Jennifer L. Sherman | ||
Director | ||
/s/ Thomas R. VerHage | ||
Thomas R. VerHage | ||
Director | ||
/s/ David M. Wathen | ||
David M. Wathen | ||
Director | ||
73
FRANKLIN ELECTRIC CO., INC.
EXHIBIT INDEX TO THE ANNUAL REPORT ON FORM 10-K
FOR THE FISCAL YEAR ENDED DECEMBER 31, 2017
Number | Description | |
3.1 | ||
3.2 | ||
10.1 | ||
10.2 | ||
10.3 | ||
10.4 | ||
10.5 | ||
10.6 | ||
10.7 | ||
10.8 | ||
10.9 | ||
10.10 | ||
10.11 | ||
10.12 | ||
10.13 | ||
10.14 | ||
10.15 | ||
10.16 | ||
10.17 | ||
74
Number | Description | |
10.18 | ||
10.19 | ||
10.20 | ||
10.21 | ||
10.22 | ||
10.23 | ||
10.24 | ||
10.25 | ||
10.26 | ||
10.27 | ||
10.28 | ||
10.29 | ||
10.30 | ||
10.31 | ||
10.32 | ||
10.33 | ||
10.34 | ||
10.35 | ||
10.36 | ||
10.37 | ||
10.38 | ||
75
Number | Description | |
18.1 | ||
21 | ||
23.1 | ||
31.1 | ||
31.2 | ||
32.1 | ||
32.2 | ||
99.1 | ||
101.INS | XBRL Instance Document |
101.SCH | XBRL Taxonomy Extension Schema |
101.CAL | XBRL Taxonomy Extension Calculation Linkbase |
101.LAB | XBRL Taxonomy Extension Label Linkbase |
101.PRE | XBRL Taxonomy Extension Presentation Linkbase |
101.DEF | XBRL Taxonomy Extension Definition Linkbase |
* Management Contract, Compensatory Plan or Arrangement
76