Attached files
| file | filename |
|---|---|
| EX-32.1 - EX-32.1 - Jones Lang LaSalle Income Property Trust, Inc. | exhibit321nov62015.htm |
| EX-31.2 - EX-31.2 - Jones Lang LaSalle Income Property Trust, Inc. | exhibit312nov62015.htm |
| EX-32.2 - EX-32.2 - Jones Lang LaSalle Income Property Trust, Inc. | exhibit322nov62015.htm |
| EX-31.1 - EX-31.1 - Jones Lang LaSalle Income Property Trust, Inc. | exhibit311nov62015.htm |
______________________________________________________________________________________________________________________________________________________________________________________________________________________________________________________________________________________________________________________________________________________
UNITED STATES
SECURITIES AND EXCHANGE COMMISSION
Washington, D.C. 20549
_________________________________
FORM 10-Q
_________________________________
x | QUARTERLY REPORT PURSUANT TO SECTION 13 OR 15(d) OF THE SECURITIES EXCHANGE ACT OF 1934 |
For the quarterly period ended September 30, 2015
OR
¨ | TRANSITION REPORT PURSUANT TO SECTION 13 OR 15(d) OF THE SECURITIES EXCHANGE ACT OF 1934 |
For the transition period from to
Commission file number: 000-51948
_________________________________

Jones Lang LaSalle Income Property Trust, Inc.
(Exact name of registrant as specified in its charter)
_________________________________
Maryland | 20-1432284 | |
(State or other jurisdiction of incorporation or organization) | (I.R.S. Employer Identification Number) | |
333 West Wacker Drive, Chicago IL, 60606
(Address of principal executive offices, including Zip Code)
(312) 897-4000
(Registrant’s telephone number, including area code)
200 East Randolph Drive, Chicago IL, 60601
(Former name or former address, if changed since last report)
_________________________________
Indicate by check mark whether the registrant (1) has filed all reports required to be filed by Section 13 or 15(d) of the Securities Exchange Act of 1934 during the preceding 12 months (or for such shorter period that the registrant was required to file such reports), and (2) has been subject to such filing requirements for the past 90 days. YES x NO ¨
Indicate by check mark whether the registrant has submitted electronically and posted on its corporate Web site, if any, every Interactive Data File required to be submitted and posted pursuant to Rule 405 of Regulation S-T (§232.405 of this chapter) during the preceding 12 months (or for such shorter period that the registrant was required to submit and post such files). YES x NO ¨
Indicate by check mark whether the registrant is a large accelerated filer, an accelerated filer, or a non-accelerated filer.
Large accelerated filer | ¨ | Accelerated filer | ¨ | |||
Non-accelerated filer | x | Smaller reporting company | ¨ | |||
Indicate by check mark whether the registrant is a shell company (as defined in Rule 12b-2 of the Exchange Act). YES ¨ NO x
The number of shares of the registrant’s Common Stock, $.01 par value, outstanding on November 6, 2015 were 32,167,419 shares of Class A Common Stock, 27,094,538 shares of Class M Common Stock, 5,820,822 of Class A-I Common Stock, 3,056,532 of Class M-I Common Stock and 7,705,558 shares of Class D Common Stock.
______________________________________________________________________________________________________________________________________________________________________________________________________________________________________________________________________________________________________________________________________________________
Jones Lang LaSalle Income Property Trust, Inc.
INDEX
PAGE NUMBER | |
2
Item 1. Financial Statements.
Jones Lang LaSalle Income Property Trust, Inc.
CONSOLIDATED BALANCE SHEETS
$ in thousands, except per share amounts
The abbreviation “VIEs” above means Variable Interest Entities.
September 30, 2015 | December 31, 2014 | |||||||
(Unaudited) | ||||||||
ASSETS | ||||||||
Investments in real estate: | ||||||||
Land (including from VIEs of $18,986 and $18,986, respectively) | $ | 204,232 | $ | 145,357 | ||||
Buildings and equipment (including from VIEs of $115,329 and $114,176, respectively) | 819,890 | 601,569 | ||||||
Less accumulated depreciation (including from VIEs of $(20,250) and $(18,165), respectively) | (72,495 | ) | (60,569 | ) | ||||
Net property and equipment | 951,627 | 686,357 | ||||||
Investment in unconsolidated real estate affiliate | 17,805 | 17,069 | ||||||
Investments in real estate and other assets held for sale (including from VIEs of $0 and $95,161, respectively) | — | 95,161 | ||||||
Net investments in real estate | 969,432 | 798,587 | ||||||
Cash and cash equivalents (including from VIEs of $10,172 and $6,539, respectively) | 103,393 | 32,211 | ||||||
Restricted cash (including from VIEs of $1,025 and $792, respectively) | 1,877 | 1,457 | ||||||
Tenant accounts receivable, net (including from VIEs of $1,485 and $1,724, respectively) | 3,051 | 3,593 | ||||||
Deferred expenses, net (including from VIEs of $235 and $285, respectively) | 11,720 | 7,825 | ||||||
Acquired intangible assets, net (including from VIEs of $3,145 and $3,528, respectively) | 68,925 | 45,075 | ||||||
Deferred rent receivable, net (including from VIEs of $349 and $508, respectively) | 8,568 | 7,918 | ||||||
Prepaid expenses and other assets (including from VIEs of $535 and $159, respectively) | 5,033 | 2,100 | ||||||
TOTAL ASSETS | $ | 1,171,999 | $ | 898,766 | ||||
LIABILITIES AND EQUITY | ||||||||
Mortgage notes and other debt payable, net (including from VIEs of $90,178 and $91,047, respectively) | $ | 433,538 | $ | 350,331 | ||||
Liabilities held for sale (including from VIEs of $0 and $73,264) | — | 73,264 | ||||||
Accounts payable and other accrued expenses (including from VIEs of $1,543 and $1,059, respectively) | 18,747 | 13,936 | ||||||
Distributions payable | 7,641 | 5,137 | ||||||
Accrued interest (including from VIEs of $393 and $403, respectively) | 1,531 | 1,326 | ||||||
Accrued real estate taxes (including from VIEs of $535 and $533, respectively) | 5,124 | 2,018 | ||||||
Advisor fees payable | 1,662 | 790 | ||||||
Acquired intangible liabilities, net | 14,611 | 10,840 | ||||||
TOTAL LIABILITIES | 482,854 | 457,642 | ||||||
Commitments and contingencies | — | — | ||||||
Equity: | ||||||||
Class A common stock: $0.01 par value; 200,000,000 shares authorized; 29,438,803 and 16,243,819 shares issued and outstanding at September 30, 2015 and December 31, 2014, respectively | 294 | 162 | ||||||
Class M common stock: $0.01 par value; 200,000,000 shares authorized; 26,472,468 and 23,432,192 shares issued and outstanding at September 30, 2015 and December 31, 2014, respectively | 265 | 234 | ||||||
Class A-I common stock: $0.01 par value; 200,000,000 shares authorized; 5,457,911 and 4,580,309 shares issued and outstanding at September 30, 2015 and December 31, 2014, respectively | 55 | 46 | ||||||
Class M-I common stock: $0.01 par value; 200,000,000 shares authorized; 2,922,875 and 735,052 shares issued and outstanding at September 30, 2015 and December 31, 2014, respectively | 29 | 7 | ||||||
Class D common stock: $0.01 par value; 200,000,000 shares authorized; 7,705,558 and 3,358,562 shares issued and outstanding at September 30, 2015 and December 31, 2014, respectively | 77 | 34 | ||||||
Additional paid-in capital (net of offering costs of $23,453 and $15,152 as of September 30, 2015 and December 31, 2014, respectively) | 938,946 | 687,984 | ||||||
Accumulated other comprehensive loss | (2,085 | ) | (879 | ) | ||||
Distributions to stockholders | (142,656 | ) | (123,340 | ) | ||||
Accumulated deficit | (115,874 | ) | (135,745 | ) | ||||
Total Jones Lang LaSalle Income Property Trust, Inc. stockholders’ equity | 679,051 | 428,503 | ||||||
Noncontrolling interests | 10,094 | 12,621 | ||||||
Total equity | 689,145 | 441,124 | ||||||
TOTAL LIABILITIES AND EQUITY | $ | 1,171,999 | $ | 898,766 | ||||
See notes to consolidated financial statements.
3
Jones Lang LaSalle Income Property Trust, Inc.
CONSOLIDATED STATEMENTS OF OPERATIONS AND COMPREHENSIVE (LOSS) INCOME
$ in thousands, except share and per share amounts
(Unaudited)
Three months ended September 30, 2015 | Three months ended September 30, 2014 | Nine months ended September 30, 2015 | Nine months ended September 30, 2014 | |||||||||||||
Revenues: | ||||||||||||||||
Minimum rents | $ | 19,230 | $ | 20,515 | $ | 54,364 | $ | 60,370 | ||||||||
Tenant recoveries and other rental income | 4,045 | 4,165 | 12,110 | 11,865 | ||||||||||||
Total revenues | 23,275 | 24,680 | 66,474 | 72,235 | ||||||||||||
Operating expenses: | ||||||||||||||||
Real estate taxes | 2,817 | 3,195 | 8,415 | 9,036 | ||||||||||||
Property operating | 5,528 | 7,403 | 14,356 | 18,952 | ||||||||||||
Provision for doubtful accounts | 108 | 168 | 341 | 317 | ||||||||||||
Advisor fees | 3,090 | 1,554 | 6,545 | 4,356 | ||||||||||||
Company level expenses | 265 | 724 | 1,610 | 1,901 | ||||||||||||
General and administrative | 148 | 212 | 516 | 640 | ||||||||||||
Acquisition expenses | 482 | 5 | 1,120 | 520 | ||||||||||||
Depreciation and amortization | 9,859 | 7,353 | 24,007 | 20,685 | ||||||||||||
Total operating expenses | 22,297 | 20,614 | 56,910 | 56,407 | ||||||||||||
Operating income | 978 | 4,066 | 9,564 | 15,828 | ||||||||||||
Other income and (expenses): | ||||||||||||||||
Interest expense | (4,768 | ) | (4,687 | ) | (13,154 | ) | (13,736 | ) | ||||||||
Equity in income of unconsolidated affiliate | 244 | — | 651 | — | ||||||||||||
Gain on disposition of property and extinguishment of debt | — | 589 | 29,009 | 589 | ||||||||||||
Total other income and (expenses) | (4,524 | ) | (4,098 | ) | 16,506 | (13,147 | ) | |||||||||
(Loss) income from continuing operations | (3,546 | ) | (32 | ) | 26,070 | 2,681 | ||||||||||
Discontinued operations: | ||||||||||||||||
Income from discontinued operations | — | 813 | — | 813 | ||||||||||||
Total income from discontinued operations | — | 813 | — | 813 | ||||||||||||
Net (loss) income | (3,546 | ) | 781 | 26,070 | 3,494 | |||||||||||
Less: Net loss (income) attributable to the noncontrolling interests | 257 | 188 | (6,199 | ) | (367 | ) | ||||||||||
Net (loss) income attributable to Jones Lang LaSalle Income Property Trust, Inc. | $ | (3,289 | ) | $ | 969 | $ | 19,871 | $ | 3,127 | |||||||
Net (loss) income attributable to Jones Lang LaSalle Income Property Trust, Inc. per share-basic and diluted | $ | (0.05 | ) | $ | 0.02 | $ | 0.36 | $ | 0.07 | |||||||
Weighted average common stock outstanding-basic and diluted | 63,528,103 | 47,271,566 | 55,849,531 | 45,043,996 | ||||||||||||
Other comprehensive loss: | ||||||||||||||||
Foreign currency translation adjustment | (583 | ) | (448 | ) | (1,206 | ) | (474 | ) | ||||||||
Total other comprehensive loss | (583 | ) | (448 | ) | (1,206 | ) | (474 | ) | ||||||||
Net comprehensive (loss) income | $ | (3,872 | ) | $ | 521 | $ | 18,665 | $ | 2,653 | |||||||
See notes to consolidated financial statements.
4
Jones Lang LaSalle Income Property Trust, Inc.
CONSOLIDATED STATEMENT OF EQUITY
$ in thousands, except share and per share amounts
(Unaudited)
Common Stock | Additional Paid In Capital | Accumulated Other Comprehensive Loss | Distributions to Stockholders | Accumulated Deficit | Noncontrolling Interests | Total Equity | |||||||||||||||||||||||||
Shares | Amount | ||||||||||||||||||||||||||||||
Balance, January 1, 2015 | 48,349,934 | $ | 483 | $ | 687,984 | $ | (879 | ) | $ | (123,340 | ) | $ | (135,745 | ) | $ | 12,621 | $ | 441,124 | |||||||||||||
Issuance of common stock | 25,795,008 | 259 | 282,299 | — | — | — | — | 282,558 | |||||||||||||||||||||||
Repurchase of shares | (2,151,327 | ) | (22 | ) | (23,079 | ) | — | — | — | — | (23,101 | ) | |||||||||||||||||||
Offering costs | — | — | (8,301 | ) | — | — | — | — | (8,301 | ) | |||||||||||||||||||||
Stock based compensation | 4,000 | — | 43 | — | — | — | — | 43 | |||||||||||||||||||||||
Net income | — | — | — | — | — | 19,871 | 6,199 | 26,070 | |||||||||||||||||||||||
Other comprehensive loss | — | — | — | (1,206 | ) | — | — | — | (1,206 | ) | |||||||||||||||||||||
Contributions from noncontrolling interests | — | — | — | — | — | — | 2,494 | 2,494 | |||||||||||||||||||||||
Cash distributed to noncontrolling interests | — | — | — | — | — | — | (11,220 | ) | (11,220 | ) | |||||||||||||||||||||
Distributions declared per share ($0.36) | — | — | — | — | (19,316 | ) | — | — | (19,316 | ) | |||||||||||||||||||||
Balance, September 30, 2015 | 71,997,615 | $ | 720 | $ | 938,946 | $ | (2,085 | ) | $ | (142,656 | ) | $ | (115,874 | ) | $ | 10,094 | $ | 689,145 | |||||||||||||
See notes to consolidated financial statements.
5
Jones Lang LaSalle Income Property Trust, Inc.
CONSOLIDATED STATEMENTS OF CASH FLOWS
$ in thousands
(Unaudited)
See notes to consolidated financial statements.
Nine months ended September 30, 2015 | Nine months ended September 30, 2014 | |||||||
CASH FLOWS FROM OPERATING ACTIVITIES: | ||||||||
Net income | $ | 26,070 | $ | 3,494 | ||||
Adjustments to reconcile income to net cash provided by operating activities: | ||||||||
Depreciation and amortization | 22,919 | 19,664 | ||||||
Gain on disposition of property and extinguishment of debt | (29,009 | ) | (908 | ) | ||||
Net provision for doubtful accounts | 341 | 317 | ||||||
Straight line rent | (630 | ) | (1,973 | ) | ||||
Equity in income of unconsolidated affiliate | (651 | ) | — | |||||
Net changes in assets, liabilities and other | 3,439 | 2,855 | ||||||
Net cash provided by operating activities | 22,479 | 23,449 | ||||||
CASH FLOWS FROM INVESTING ACTIVITIES: | ||||||||
Purchase of real estate investment | (308,179 | ) | (136,865 | ) | ||||
Proceeds from sale of real estate investments, net | 121,694 | 14,301 | ||||||
Capital improvements and lease commissions | (3,894 | ) | (7,680 | ) | ||||
Investment in unconsolidated real estate affiliate | (85 | ) | — | |||||
Loan escrows | 1,252 | 632 | ||||||
Net cash used in investing activities | (189,212 | ) | (129,612 | ) | ||||
CASH FLOWS FROM FINANCING ACTIVITIES: | ||||||||
Issuance of common stock | 272,703 | 106,337 | ||||||
Repurchase of shares | (23,101 | ) | (51,988 | ) | ||||
Offering costs | (8,046 | ) | (5,719 | ) | ||||
Distributions to stockholders | (8,020 | ) | (8,650 | ) | ||||
Distributions paid to noncontrolling interests | (11,220 | ) | (596 | ) | ||||
Contributions received from noncontrolling interests | 2,494 | 243 | ||||||
Deposits for loan commitments | (541 | ) | — | |||||
Proceeds from mortgage notes and other debt payable | 97,290 | 91,770 | ||||||
Debt issuance costs | (1,143 | ) | (574 | ) | ||||
Payment on early extinguishment of debt | (711 | ) | — | |||||
Principal payments on mortgage notes and other debt payable | (81,529 | ) | (19,180 | ) | ||||
Net cash provided by financing activities | 238,176 | 111,643 | ||||||
Net increase in cash and cash equivalents | 71,443 | 5,480 | ||||||
Effect of exchange rates | (261 | ) | (83 | ) | ||||
Cash and cash equivalents at the beginning of the period | 32,211 | 35,124 | ||||||
Cash and cash equivalents at the end of the period | $ | 103,393 | $ | 40,521 | ||||
Supplemental disclosure of cash flow information: | ||||||||
Interest paid | $ | 12,704 | $ | 12,920 | ||||
Non-cash activities: | ||||||||
Write-offs of receivables | $ | 236 | $ | 341 | ||||
Write-offs of retired assets and liabilities | (45 | ) | 1,340 | |||||
Change in liability for capital expenditures | (2,660 | ) | (2,686 | ) | ||||
Deposit of holdback proceeds from sale of real estate investments | 1,847 | — | ||||||
Net liabilities transferred at sale of real estate investment | 973 | — | ||||||
Net liabilities assumed at acquisition | 1,730 | 748 | ||||||
Transfer of property in extinguishment of debt settlement | — | 5,442 | ||||||
Change in issuance of common stock receivable | 1,106 | 146 | ||||||
Change in accrued offering costs | 255 | (961 | ) | |||||
6
Jones Lang LaSalle Income Property Trust, Inc.
NOTES TO CONSOLIDATED FINANCIAL STATEMENTS
$ in thousands, except per share amounts
NOTE 1—ORGANIZATION
General
Except where the context suggests otherwise, the terms “we,” “us,” “our” and the “Company” refer to Jones Lang LaSalle Income Property Trust, Inc. The terms “Advisor” and “LaSalle” refer to LaSalle Investment Management, Inc.
Jones Lang LaSalle Income Property Trust, Inc. is an externally managed, non-listed, daily valued perpetual-life real estate investment trust ("REIT") that owns and manages a diversified portfolio of apartment, industrial, office, retail and other properties located primarily in the United States. We expect over time that our real estate portfolio will be further diversified on a global basis through the acquisition of additional properties outside of the United States and will be complemented by investments in real estate-related debt and equity securities. We were incorporated on May 28, 2004 under the laws of the State of Maryland. We believe that we have operated in such a manner to qualify to be taxed as a REIT for federal income tax purposes commencing with the taxable year ended December 31, 2004, when we first elected REIT status. As of September 30, 2015, we owned interests in a total of 37 properties, 36 of which are located in eleven states and one of which is located in Canada.
From our inception to October 1, 2012, we raised equity proceeds through private offerings of shares of our undesignated common stock. On October 1, 2012, the Securities and Exchange Commission (the "SEC") declared effective our Registration Statement on Form S-11 with respect to our continuous public offering of up to $3,000,000 in any combination of Class A and Class M shares of common stock (the "Initial Public Offering"). Affiliates of our sponsor, Jones Lang LaSalle Incorporated ("JLL" or our "Sponsor"), have invested an aggregate of $60,200 through purchases of shares of our common stock. As of January 15, 2015, the date our Initial Public Offering terminated, we had raised aggregate gross proceeds from the sale of shares of our Class A and Class M common stock in our Initial Public Offering of $216,037 and $52,944, respectively.
On January 16, 2015, our follow-on Registration Statement on Form S-11 was declared effective by the SEC (Commission File No. 333-196886) with respect to our continuous public offering of up to $2,700,000 in any combination of shares of our Class A, Class M, Class A-I and Class M-I common stock, consisting of up to $2,400,000 of shares offered in our primary offering and up to $300,000 in shares offered pursuant to our distribution reinvestment plan (the “First Extended Public Offering”). We reserve the right to terminate the First Extended Public Offering at any time and to extend the First Extended Public Offering term to the extent permissible under applicable law. As of September 30, 2015, we have raised aggregate gross proceeds from the sale of shares of our Class A, Class M, Class A-I and Class M-I shares in our First Extended Public Offering of $230,849.
On June 19, 2014, we began a private offering of up to $400,000 in any combination of our Class A-I, Class M-I and Class D shares of common stock (the "Initial Private Offering"). Upon the SEC declaring the registration statement for our First Extended Public Offering effective, we terminated the Initial Private Offering. As of January 15, 2015, we had raised aggregate gross proceeds from the sale of shares of our Class A-I, Class M-I and Class D common stock in our Initial Private Offering of approximately $43,510. On March 3, 2015, we commenced a new private offering (the "Follow-on Private Offering") of up to $350,000 in shares of our Class D common stock with indefinite duration. As of September 30, 2015, we have raised aggregate gross proceeds from the sale of our Class D shares in our Follow-on Private Offering of $48,223.
As of September 30, 2015, 29,438,803 shares of Class A common stock, 26,472,468 shares of Class M common stock, 5,457,911 shares of Class A-I common stock, 2,922,875 shares of Class M-I common stock, and 7,705,558 shares of Class D common stock were outstanding and held by a total of 5,844 stockholders.
LaSalle acts as our advisor pursuant to the second amended and restated advisory agreement between the Company and LaSalle, which was renewed on June 5, 2015 (the “Advisory Agreement”). Our Advisor, a registered investment adviser with the SEC, has broad discretion with respect to our investment decisions and is responsible for selecting our investments and for managing our investment portfolio pursuant to the terms of the Advisory Agreement. LaSalle is a wholly-owned, but operationally independent subsidiary of JLL, a New York Stock Exchange-listed global real estate services firm that specializes in commercial property management, leasing and investment management. We have no employees, as all operations are managed by our Advisor. Our executive officers are employees of and compensated by our Advisor.
7
NOTE 2—SUMMARY OF SIGNIFICANT ACCOUNTING POLICIES
Basis of Presentation and Principles of Consolidation
The accompanying consolidated financial statements have been prepared in accordance with U.S. generally accepted accounting principles (“GAAP”), the instructions to Form 10-Q and Rule 10-01 of Regulation S-X and include the accounts of our wholly-owned subsidiaries, consolidated variable interest entities ("VIE") and the unconsolidated investment in real estate affiliate accounted for under the equity method of accounting. We consider the authoritative guidance of accounting for investments in common stock, investments in real estate ventures, investors accounting for an investee when the investor has the majority of the voting interest but the minority partners have certain approval or veto rights, determining whether a general partner or general partners as a group controls a limited partnership or similar entity when the limited partners have certain rights and the consolidation of VIEs in which we own less than a 100% interest. All significant intercompany balances and transactions have been eliminated in consolidation.
Parenthetical disclosures are shown on our Consolidated Balance Sheets regarding the amounts of VIE assets and liabilities that are consolidated. As of September 30, 2015, our VIEs include entities owning The District at Howell Mill, The Edge at Lafayette and Campus Lodge Tampa as we maintain control over significant decisions, which began at the time of acquisition of the properties. The creditors of our VIEs do not have general recourse to us.
Noncontrolling interests represent the minority members’ proportionate share of the equity in our VIEs. At acquisition, the assets, liabilities and noncontrolling interests were measured and recorded at the estimated fair value. Noncontrolling interests will increase for the minority members’ share of net income of these entities and contributions and decrease for the minority members’ share of net loss and distributions. As of September 30, 2015, noncontrolling interests represented the minority members’ proportionate share of the equity of the entities listed above as VIEs, Grand Lakes Marketplace and Townlake of Coppell.
The accompanying unaudited interim consolidated financial statements have been prepared in accordance with the accounting policies described in the consolidated financial statements and related notes included in our Form 10-K filed with the SEC on March 5, 2015 (our “2014 Form 10-K”) and should be read in conjunction with such consolidated financial statements and related notes. The following notes to these interim consolidated financial statements highlight changes to the notes included in the December 31, 2014 audited consolidated financial statements included in our 2014 Form 10-K and present interim disclosures as required by the SEC.
The interim financial data as of September 30, 2015 and for the three and nine months ended September 30, 2015 and 2014 is unaudited. In the opinion of the Company, the interim data includes all adjustments, consisting only of normal recurring adjustments, necessary for a fair statement of the results for the interim periods.
Allowance for Doubtful Accounts
An allowance for doubtful accounts is provided against the portion of accounts receivable and deferred rent receivable that is estimated to be uncollectible. Such allowance is reviewed periodically based upon our recovery experience. At September 30, 2015 and December 31, 2014, our allowance for doubtful accounts was $160 and $58, respectively.
Deferred Expenses
Deferred expenses consist of debt issuance costs and lease commissions. Debt issuance costs are capitalized and amortized over the terms of the respective agreements as a component of interest expense. Lease commissions are capitalized and amortized over the term of the related lease as a component of depreciation and amortization expense. Accumulated amortization of deferred expenses at September 30, 2015 and December 31, 2014 was $3,559 and $3,276, respectively.
Acquisitions
We have allocated a portion of the purchase price of our acquisitions to acquired intangible assets, which include acquired in-place lease intangibles, acquired above-market in-place lease intangibles and acquired ground lease intangibles, which are reported net of accumulated amortization of $35,395 and $25,048 at September 30, 2015 and December 31, 2014, respectively, on the accompanying Consolidated Balance Sheets. The acquired intangible liabilities represent acquired below-market in-place leases, which are reported net of accumulated amortization of $3,319 and $2,660 at September 30, 2015 and December 31, 2014, respectively, on the accompanying Consolidated Balance Sheets.
8
Assets and Liabilities Measured at Fair Value
The Financial Accounting Standards Board’s (“FASB”) guidance for fair value measurement and disclosure states that fair value is an exit price, representing the amount that would be received to sell an asset or paid to transfer a liability in an orderly transaction between market participants. As such, fair value is a market-based measurement that should be determined based on assumptions that market participants would use in pricing an asset or liability. As a basis for considering assumptions, authoritative guidance establishes a three-tier fair value hierarchy, which prioritizes the inputs used in measuring fair value as follows:
• | Level 1—Inputs are quoted prices (unadjusted) in active markets for identical assets or liabilities that we have access to at the measurement date. |
• | Level 2—Observable inputs, other than quoted prices included in level 1 that are observable for the asset or liability, either directly or indirectly. Level 2 inputs are those in markets for which there are few transactions, the prices are not current, little public information exists or instances where prices vary substantially over time or among brokered market makers. |
• | Level 3—Unobservable inputs for the asset or liability. Unobservable inputs are those inputs that reflect our own assumptions that market participants would use to price the asset or liability based on the best available information. |
The authoritative guidance requires the disclosure of the fair value of our financial instruments for which it is practicable to estimate that value. The guidance does not apply to all balance sheet items. Market information as available or present value techniques have been utilized to estimate the amounts required to be disclosed. Since such amounts are estimates, there can be no assurance that the disclosed value of any financial instrument could be realized by immediate settlement of the instrument. We have estimated the fair value of our mortgage notes and other debt payable reflected in the accompanying Consolidated Balance Sheets at amounts that are based upon an interpretation of available market information and valuation methodologies (including discounted cash flow analysis with regard to fixed rate debt) for similar loans made to borrowers with similar credit ratings and for the same maturities. The fair value of our mortgage notes payable, including any outstanding balances on our line of credit, using level two inputs was $10,133 and $10,717 higher than the aggregate carrying amounts at September 30, 2015 and December 31, 2014, respectively. Such fair value estimates are not necessarily indicative of the amounts that would be realized upon disposition of our mortgage notes payable.
Derivative Financial Instruments
We record all derivatives on the Consolidated Balance Sheets at fair value in prepaid expenses and other assets or accounts payable and other accrued expenses. Changes in the fair value of our derivatives are recorded as a component of interest expense on our Consolidated Statements of Operations and Comprehensive (Loss) Income as we have not designated our derivative instruments as hedges. Our objective in using interest rate derivatives is to manage our exposure to interest rate movements. To accomplish this objective, we use interest rate caps and swaps.
As of September 30, 2015, we had the following outstanding interest rate derivatives related to managing our interest rate risk:
Interest Rate Derivative | Number of Instruments | Notional Amount | ||
Interest Rate Caps | 6 | $97,930 | ||
Interest Rate Swap | 1 | $8,600 | ||
The fair value of our interest rate caps and swaps represent liabilities of $256 and $96 at September 30, 2015 and December 31, 2014, respectively.
Use of Estimates
The preparation of consolidated financial statements in conformity with GAAP requires us to make estimates and assumptions. These estimates and assumptions impact the reported amounts of assets and liabilities and the disclosure of contingent assets and liabilities at the date of the financial statements and the reported amounts of revenues and expenses during the reporting period. For example, significant estimates and assumptions have been made with respect to useful lives of assets, recoverable amounts of receivables, fair value of derivatives and real estate assets, initial valuations and related amortization periods of deferred costs and intangibles, particularly with respect to property acquisitions. Actual results could differ from those estimates.
9
NOTE 3—PROPERTY
The primary reason we make acquisitions of real estate investments in the apartment, industrial, office, retail and other property sectors is to invest capital contributed by stockholders in a diversified portfolio of real estate assets. The consolidated properties we acquired during 2015 and our acquisition price of each are as follows:
Property Name | Sector | Square Feet | Location | Ownership % | Acquisition Date | Acquisition Price | ||||||||||
DFW Distribution Center: | ||||||||||||||||
4050 Corporate Drive | Industrial | 441,000 | Grapevine, TX | 100 | % | April 15, 2015 | $ | 25,839 | ||||||||
4055 Corporate Drive | Industrial | 202,000 | Grapevine, TX | 100 | April 15, 2015 | 18,357 | ||||||||||
Skokie Commons | Retail | 93,000 | Skokie, IL | 100 | May 15, 2015 | 43,750 | ||||||||||
Townlake of Coppell | Apartment | 351,000 | Coppell, TX | 90 | May 22, 2015 | 43,200 | ||||||||||
AQ Rittenhouse | Apartment | 92,000 | Philadelphia, PA | 100 | July 30, 2015 | 51,000 | ||||||||||
Whitestone Market | Retail | 145,000 | Austin, TX | 100 | September 30, 2015 | 51,500 | ||||||||||
O’Hare Industrial Portfolio: | ||||||||||||||||
200 Lewis | Industrial | 31,000 | Wood Dale, IL | 100 | September 30, 2015 | 6,310 | ||||||||||
1225 Michael Drive | Industrial | 109,000 | Wood Dale, IL | 100 | September 30, 2015 | 9,770 | ||||||||||
1300 Michael Drive | Industrial | 71,000 | Wood Dale, IL | 100 | September 30, 2015 | 9,455 | ||||||||||
1301 Mittel Drive | Industrial | 53,000 | Wood Dale, IL | 100 | September 30, 2015 | 10,289 | ||||||||||
1350 Michael Drive | Industrial | 56,000 | Wood Dale, IL | 100 | September 30, 2015 | 7,151 | ||||||||||
2501 Allan Drive | Industrial | 198,000 | Elk Grove, IL | 100 | September 30, 2015 | 16,846 | ||||||||||
2601 Allan Drive | Industrial | 124,000 | Elk Grove, IL | 100 | September 30, 2015 | 11,190 | ||||||||||
During the nine months ended September 30, 2015 and 2014, we incurred $1,120 and $520, respectively, of acquisition expenses recorded on the Consolidated Statements of Operations and Comprehensive (Loss) Income. For properties acquired during 2015, we recorded total revenue of $4,887 and net loss of $2,533 for the nine months ended September 30, 2015. For properties acquired during 2014, we recorded total revenue of $6,874 and net income of $222 for the nine months ended September 30, 2014.
2015 Acquisitions
We allocated the purchase price of our 2015 acquisitions in accordance with authoritative guidance as follows:
2015 Acquisitions | |||
Land | $ | 59,603 | |
Building and equipment | 220,335 | ||
In-place lease intangible | 32,677 | ||
Above-market lease intangible | 1,952 | ||
Below-market lease intangible | (5,394 | ) | |
$ | 309,173 | ||
Amortization period for intangible assets and liabilities | 1 month -18 years | ||
10
Proforma Information
The following pro forma financial information is presented as if our 2014 and 2015 acquisitions had been consummated on January 1, 2014 or the date the property began operations if operations began after January 1, 2014. The pro forma financial information is for comparative purposes only and not necessarily indicative of what our actual results of operations would have been had our 2014 and 2015 acquisitions been consummated on January 1, 2014 or the date the property began operations, nor does it purport to represent the results of operations for future periods.
If our 2015 acquisitions had occurred on January 1, 2014 or the date the property began operations, our consolidated revenues and net income for the nine months ended September 30, 2015 would have been $76,194 and $28,056, respectively, and our consolidated revenues and net income for the nine months ended September 30, 2014 would have been $88,360 and $3,721, respectively.
If our 2014 acquisitions had occurred on January 1, 2013 or the date the property began operations, our consolidated revenues and net loss for the nine months ended September 30, 2014 would have been $76,734 and $4,982, respectively.
2015 Dispositions
On January 27, 2015, we sold Cabana Beach San Marcos, Cabana Beach Gainesville, Campus Lodge Athens and Campus Lodge Columbia for approximately $123,800. In connection with the disposition, the mortgage loans associated with the four properties totaling approximately $71,000 were repaid. We recorded a gain on the sale of the properties in the amount of $30,454 and recorded a loss on the extinguishment of the debt of $1,318.
NOTE 4—MORTGAGE NOTES AND OTHER DEBT PAYABLE
Mortgage notes and other debt payable have various maturities through 2027 and consist of the following:
Mortgage notes and other debt payable | Maturity/Extinguishment Date | Interest Rate | Amount payable as of | |||||||||
September 30, 2015 | December 31, 2014 | |||||||||||
Mortgage notes payable (1) (2) (3) (4) (5) (6) | October 2016 - March 2027 | 2.68% - 6.14% | $ | 432,977 | $ | 420,517 | ||||||
Net debt premium on assumed debt | 561 | 814 | ||||||||||
Mortgage notes and other debt payable, net | $ | 433,538 | $ | 421,331 | ||||||||
(1) On January 27, 2015, we repaid the mortgage notes payable on Cabana Beach San Marcos, Cabana Beach Gainesville, Campus Lodge Athens and Campus Lodge Columbia in junction with the sale of the properties. The outstanding balance of the mortgage notes payable was $71,000.
(2) On March 20, 2015, we repaid the mortgage note payable on the South Beach Parking Garage. The outstanding balance of the mortgage note payable was $9,250, and we recognized a loss on the extinguishment of debt of $127.
(3) On May 20, 2015, we entered into a $24,400 mortgage note payable on Skokie Commons. The mortgage note is for ten years at a fixed rate of 3.31%, interest-only for 5 years.
(4) On May 22, 2015, we entered into a $28,800 mortgage note payable on Townlake of Coppell. The mortgage note is for five years at a fixed rate of 3.25% interest-only for 4 years.
(5) On May 29, 2015, we entered into a $17,720 mortgage note payable on DFW Distribution Center. The mortgage note is for ten years at a fixed rate of 3.23%, interest-only for 10 years.
(6) On July 30, 2015, we entered into a $26,370 mortgage note payable on AQ Rittenhouse. The mortgage note is for ten years at a fixed rate of 3.65%, interest-only for 10 years.
Aggregate future principal payments of mortgage notes payable as of September 30, 2015 are as follows:
Year | Amount | |||
2015 | $ | 440 | ||
2016 | 33,286 | |||
2017 | 80,687 | |||
2018 | 19,994 | |||
2019 | 11,309 | |||
Thereafter | 287,261 | |||
Total | $ | 432,977 | ||
11
Line of Credit
On June 8, 2015, we extended our existing $40,000 revolving line of credit agreement with Bank of America, N.A. The line of credit has a two-year term with a one-year extension at our option and bears interest based on LIBOR plus a spread ranging from 1.35% to 2.10%, depending on our leverage ratio (1.35% spread at September 30, 2015). The line of credit also contains an accordion feature that allows us to increase the facility to $75,000. We intend to use the line of credit to cover short-term capital needs, for new property acquisitions and working capital. We may not draw funds on our line of credit if we experience a material adverse effect, which is defined to include, among other things, (a) a material adverse effect upon the operations, business, assets, liabilities or financial condition of the Company, taken as a whole; (b) a material impairment of the rights and remedies of any lender under any loan document or the ability of any loan party to perform its obligations under any loan document; or (c) a material adverse effect upon the legality, validity, binding effect or enforceability against any loan party of any loan document to which it is a party. As of September 30, 2015, no material adverse effects had occurred. Our line of credit does require us to meet certain customary debt covenants, which include a maximum leverage ratio, a minimum debt service coverage ratio as well as maintaining minimum amounts of equity and liquidity. There was no outstanding balance on our line of credit as of September 30, 2015 and December 31, 2014.
At September 30, 2015, we were in compliance with all debt covenants.
NOTE 5—COMMON STOCK
We have five classes of common stock authorized as of September 30, 2015, Class A, Class M, Class A-I, Class M-I, and Class D. The fees payable to LaSalle Investment Management Distributors, LLC, an affiliate of our Advisor and the dealer manager for our offerings (the "Dealer Manager"), with respect to each outstanding share of each class, as a percentage of NAV, are as follows:
Selling Commission (1) | Dealer Manager Fee (2) | |||
Class A Shares | up to 3.5% | 1.05% | ||
Class M Shares | None | 0.30% | ||
Class A-I Shares | up to 1.5% | 0.30% | ||
Class M-I Shares | None | 0.05% | ||
Class D Shares (3) | up to 1.0% | None | ||
(1) Selling commissions are paid on the date of purchase.
(2) Dealer manager fees are accrued daily on a continuous basis equal to 1/365th of the stated fee.
(3) Shares of Class D common stock are only being offered pursuant to a private offering.
The selling commission and dealer manager fee are offering costs and are recorded as a reduction of additional paid in capital.
Stock Transactions
The stock transactions for each of our classes of common stock for the nine months ended September 30, 2015 were as follows:
Shares of Class A Common Stock | Shares of Class M Common Stock | Shares of Class A-I Common Stock | Shares of Class M-I Common Stock | Shares of Class D Common Stock | |||||||||||
Balance, December 31, 2014 | 16,243,819 | 23,432,192 | 4,580,309 | 735,052 | 3,358,562 | ||||||||||
Issuance of common stock | 13,574,672 | 4,196,407 | 1,493,110 | 2,187,823 | 4,346,996 | ||||||||||
Repurchase of shares | (379,688 | ) | (1,156,131 | ) | (615,508 | ) | — | — | |||||||
Balance, September 30, 2015 | 29,438,803 | 26,472,468 | 5,457,911 | 2,922,875 | 7,705,558 | ||||||||||
12
Stock Issuances
The stock issuances for our classes of shares, including those issued through our distribution reinvestment plan, for the nine months ended September 30, 2015 were as follows:
Nine months ended | ||||||
September 30, 2015 | ||||||
# of shares | Amount | |||||
Class A Shares | 13,574,672 | $ | 148,745 | |||
Class M Shares | 4,196,407 | 45,643 | ||||
Class A-I Shares | 1,493,110 | 16,232 | ||||
Class M-I Shares | 2,187,823 | 23,757 | ||||
Class D Shares | 4,346,996 | 48,224 | ||||
Total | $ | 282,601 | ||||
Share Repurchase Plan
Our share repurchase plan allows stockholders, subject to a one-year holding period, with certain exceptions, to request that we repurchase all or a portion of their shares on a daily basis at that day's NAV per share, limited to 5% of aggregate Company NAV per quarter. For the nine months ended September 30, 2015, we repurchased 2,151,327 shares of common stock. During the nine months ended September 30, 2014, we repurchased 580,520 shares of common stock.
Distribution Reinvestment Plan
Pursuant to our distribution reinvestment plan, holders of shares of any class of our common stock may elect to have their cash distributions reinvested in additional shares of our common stock at the NAV per share applicable to the class of shares being purchased on the distribution date. For the nine months ended September 30, 2015, we issued 810,772 shares of common stock for $8,792 under the distribution reinvestment plan. For the nine months ended September 30, 2014, we issued 341,148 shares of common stock for $3,531 under the distribution reinvestment plan.
Earnings Per Share (“EPS”)
Basic per share amounts are based on the weighted average of shares outstanding of 63,528,103 and 55,849,531 for the three and nine months ended September 30, 2015, respectively, and 47,271,566 and 45,043,996 for the three and nine months ended September 30, 2014, respectively. We have no dilutive or potentially dilutive securities.
Organization and Offering Costs
Organization and offering costs include, but are not limited to, legal, accounting and printing fees and personnel costs of our Advisor (including reimbursement of personnel costs for our executive officers prior to the commencement of the offerings) attributable to our organization, preparation of the registration statement, registration and qualification of our common stock for sale with the SEC and in the various states and filing fees incurred by our Advisor. LaSalle agreed to fund our organization and offering expenses through October 1, 2012, which is the date the SEC declared our registration statement effective for the Initial Public Offering, following which time we commenced reimbursing LaSalle over 36 months for organization and offering costs incurred prior to the commencement date of the Initial Public Offering. Following the Initial Public Offering commencement date, we began paying directly or reimbursing LaSalle if it pays on our behalf any organization and offering costs incurred during the Initial Public Offering period (other than selling commissions and dealer manager fees) as and when incurred. After the termination of each of the Initial Public Offering and the First Extended Public Offering, our Advisor has agreed to reimburse us to the extent that the organization and offering costs that we incur exceed 15% of our gross proceeds from each of the Initial Public Offering and the First Extended Public Offering. LaSalle also agreed to fund our organization and offering expenses through January 15, 2015, related to the First Extended Public Offering, following which time we commenced reimbursing LaSalle over 36 months for the organization and offering costs incurred prior to the commencement of the First Extended Public Offering. Organization costs are expensed, whereas offering costs are recorded as a reduction of capital in excess of par value. As of September 30, 2015 and December 31, 2014, LaSalle had paid $1,904 and $1,986, respectively, of organization and offering costs on our behalf which we had not yet reimbursed. These costs are included in Accounts payable and other accrued expenses.
13
NOTE 6—RELATED PARTY TRANSACTIONS
Effective as of October 1, 2012, we entered into a first amended and restated advisory agreement with LaSalle, pursuant to which we pay a fixed advisory fee of 1.25% of our NAV calculated daily. The Advisory Agreement allows for a performance fee to be earned for each share class based on the total return of that share class during the calendar year. The performance fee is calculated as 10% of the return in excess of 7% per annum. On May 5, 2015, we renewed our Advisory Agreement with our Advisor for a one year term expiring on June 5, 2016.
The fixed advisory fees for the three and nine months ended September 30, 2015 were $2,195 and $5,650, respectively. The fixed advisory fees for the three and nine months ended September 30, 2014 were $1,554 and $4,356, respectively. The performance fees for both the three and nine months ended September 30, 2015 were $895. The performance fees for both the three and nine months ended September 30, 2014 were $0. Included in Advisor fees payable at September 30, 2015 and December 31, 2014 were $767 and $790 of fixed advisory fees, respectively. Included in Advisor fees payable at September 30, 2015 and December 31, 2014 were $895 and $0 of performance fees, respectively.
We pay Jones Lang LaSalle Americas, Inc. (“JLL Americas”), an affiliate of our Advisor, for property management and leasing services performed at various properties we own, on terms no less favorable than we could receive from other third party service providers. For the three and nine months ended September 30, 2015, we paid JLL Americas $139 and $321, respectively. For the three and nine months ended September 30, 2014, we paid JLL Americas $367 and $780, respectively. During the three and nine months ended September 30, 2015, we paid JLL Americas a total of $132 and $254, respectively in loan placement fees related to the mortgage notes payable on Skokie Commons and AQ Rittenhouse. During the nine months ended September 30, 2014, we paid JLL Americas $201 in loan placement fees related to the mortgage notes payable on South Seattle Distribution Center and Oak Grove Plaza.
We pay the Dealer Manager selling commissions and dealer manager fees in connection with our offerings. For the three and nine months ended September 30, 2015, we paid the Dealer Manager selling commissions and dealer manager fees totaling $1,669 and $3,927, respectively. For the three and nine months ended September 30, 2014, we paid the Dealer Manager selling commissions and dealer manager fees totaling $891 and $2,718, respectively. A majority of the selling commissions and dealer manager fees are reallowed to participating broker-dealers.
As of September 30, 2015 and December 31, 2014, we owed $1,806 and $1,986, respectively, for organization and offering costs paid by LaSalle (see Note 5-Common Stock). These costs are included in Accounts payable and other accrued expenses.
NOTE 7—COMMITMENTS AND CONTINGENCIES
We are involved in various claims and litigation matters arising in the ordinary course of business, some of which involve claims for damages. Many of these matters are covered by insurance, although they may nevertheless be subject to deductibles or retentions. Although the ultimate liability for these matters cannot be determined, based upon information currently available, we believe the ultimate resolution of such claims and litigation will not have a material adverse effect on our financial position, results of operations or liquidity.
From time to time, we have entered into contingent agreements for the acquisition and financing of properties. Such acquisitions and financings are subject to satisfactory completion of due diligence or meeting certain leasing or occupancy thresholds.
We are subject to fixed ground lease payments on South Beach Parking Garage of $94 per year until September 30, 2016. The fixed amount will increase on September 30, 2016 and every five years thereafter by the lesser of 12% or the cumulative CPI over the previous five year period. We are also subject to a variable ground lease payment calculated as 2.5% of revenue. The lease expires September 30, 2041 and has a ten-year renewal option.
The operating agreement for Townlake of Coppell allows the unrelated third party joint venture partner, owning a 10% interest, to put their interest to us at a market determined value for a period of 90 days beginning in 2018.
14
NOTE 8—SEGMENT REPORTING
We have five operating segments: apartment, industrial, office, retail and other properties. Consistent with how we review and manage our properties, the financial information summarized below is presented by operating segment and reconciled to net (loss) income from continuing operations for the three and nine months ended September 30, 2015 and 2014.
Apartment | Industrial | Office | Retail | Other | Total | |||||||||||||||||||
Assets as of September 30, 2015 | $ | 213,624 | $ | 296,003 | $ | 242,745 | $ | 297,303 | $ | 22,136 | $ | 1,071,811 | ||||||||||||
Assets as of December 31, 2014 | 207,691 | 182,338 | 250,870 | 204,077 | 22,074 | 867,050 | ||||||||||||||||||
Three Months Ended September 30, 2015 | ||||||||||||||||||||||||
Revenues: | ||||||||||||||||||||||||
Minimum rents | $ | 5,117 | $ | 3,800 | $ | 5,983 | $ | 4,269 | $ | 61 | $ | 19,230 | ||||||||||||
Tenant recoveries and other rental income | 240 | 985 | 1,234 | 1,019 | 567 | 4,045 | ||||||||||||||||||
Total revenues | $ | 5,357 | $ | 4,785 | $ | 7,217 | $ | 5,288 | $ | 628 | $ | 23,275 | ||||||||||||
Operating expenses: | ||||||||||||||||||||||||
Real estate taxes | $ | 561 | $ | 732 | $ | 721 | $ | 689 | $ | 114 | $ | 2,817 | ||||||||||||
Property operating | 2,439 | 370 | 1,895 | 633 | 191 | 5,528 | ||||||||||||||||||
Provision for doubtful accounts | 51 | — | — | 57 | — | 108 | ||||||||||||||||||
Total segment operating expenses | $ | 3,051 | $ | 1,102 | $ | 2,616 | $ | 1,379 | $ | 305 | $ | 8,453 | ||||||||||||
Operating income - Segments | $ | 2,306 | $ | 3,683 | $ | 4,601 | $ | 3,909 | $ | 323 | $ | 14,822 | ||||||||||||
Capital expenditures by segment | $ | 474 | $ | 27 | $ | 3,968 | $ | 197 | $ | 176 | $ | 4,842 | ||||||||||||
Reconciliation to loss from continuing operations | ||||||||||||||||||||||||
Operating income - Segments | $ | 14,822 | ||||||||||||||||||||||
Advisor fees | 3,090 | |||||||||||||||||||||||
Company level expenses | 265 | |||||||||||||||||||||||
General and administrative | 148 | |||||||||||||||||||||||
Acquisition expenses | 482 | |||||||||||||||||||||||
Depreciation and amortization | 9,859 | |||||||||||||||||||||||
Operating income | $ | 978 | ||||||||||||||||||||||
Other income and (expenses): | ||||||||||||||||||||||||
Interest expense | $ | (4,768 | ) | |||||||||||||||||||||
Equity in income of unconsolidated affiliate | 244 | |||||||||||||||||||||||
Total other income and (expenses) | $ | (4,524 | ) | |||||||||||||||||||||
Loss from continuing operations | $ | (3,546 | ) | |||||||||||||||||||||
Reconciliation to total consolidated assets as of September 30, 2015 | ||||||||||||||||||||||||
Assets per reportable segments | $ | 1,071,811 | ||||||||||||||||||||||
Corporate level assets | 100,188 | |||||||||||||||||||||||
Total consolidated assets | $ | 1,171,999 | ||||||||||||||||||||||
Reconciliation to total consolidated assets as of December 31, 2014 | ||||||||||||||||||||||||
Assets per reportable segments | $ | 867,050 | ||||||||||||||||||||||
Corporate level assets | 31,716 | |||||||||||||||||||||||
Total consolidated assets | $ | 898,766 | ||||||||||||||||||||||
15
Apartment | Industrial | Office | Retail | Other | Total | |||||||||||||||||||
Three Months Ended September 30, 2014 | ||||||||||||||||||||||||
Revenues: | ||||||||||||||||||||||||
Minimum rents | $ | 7,341 | $ | 3,249 | $ | 6,346 | $ | 3,508 | $ | 71 | $ | 20,515 | ||||||||||||
Tenant recoveries and other rental income | 521 | 694 | 1,098 | 1,210 | 642 | 4,165 | ||||||||||||||||||
Total revenues | $ | 7,862 | $ | 3,943 | $ | 7,444 | $ | 4,718 | $ | 713 | $ | 24,680 | ||||||||||||
Operating expenses: | ||||||||||||||||||||||||
Real estate taxes | $ | 936 | $ | 554 | $ | 841 | $ | 788 | $ | 76 | $ | 3,195 | ||||||||||||
Property operating | 4,469 | 177 | 1,738 | 664 | 355 | 7,403 | ||||||||||||||||||
Provision for doubtful accounts | 162 | — | 5 | — | 1 | 168 | ||||||||||||||||||
Total segment operating expenses | $ | 5,567 | $ | 731 | $ | 2,584 | $ | 1,452 | $ | 432 | $ | 10,766 | ||||||||||||
Operating income - Segments | $ | 2,295 | $ | 3,212 | $ | 4,860 | $ | 3,266 | $ | 281 | $ | 13,914 | ||||||||||||
Capital expenditures by segment | $ | 1,551 | $ | 605 | $ | 751 | $ | 160 | $ | — | $ | 3,067 | ||||||||||||
Reconciliation to loss from continuing operations | ||||||||||||||||||||||||
Operating income - Segments | $ | 13,914 | ||||||||||||||||||||||
Advisor fees | 1,554 | |||||||||||||||||||||||
Company level expenses | 724 | |||||||||||||||||||||||
General and administrative | 212 | |||||||||||||||||||||||
Acquisition expenses | 5 | |||||||||||||||||||||||
Depreciation and amortization | 7,353 | |||||||||||||||||||||||
Operating income | $ | 4,066 | ||||||||||||||||||||||
Other income and (expenses): | ||||||||||||||||||||||||
Interest expense | $ | (4,687 | ) | |||||||||||||||||||||
Gain on disposition of property and extinguishment of debt | 589 | |||||||||||||||||||||||
Total other income and (expenses) | $ | (4,098 | ) | |||||||||||||||||||||
Loss from continuing operations | $ | (32 | ) | |||||||||||||||||||||
16
Apartments | Industrial | Office | Retail | Other | Total | |||||||||||||||||||
Nine Months Ended September 30, 2015 | ||||||||||||||||||||||||
Revenues: | ||||||||||||||||||||||||
Minimum rents | $ | 14,026 | $ | 10,598 | $ | 18,217 | $ | 11,321 | $ | 202 | $ | 54,364 | ||||||||||||
Tenant recoveries and other rental income | 691 | 2,762 | 3,456 | 3,221 | 1,980 | 12,110 | ||||||||||||||||||
Total revenues | $ | 14,717 | $ | 13,360 | $ | 21,673 | $ | 14,542 | $ | 2,182 | $ | 66,474 | ||||||||||||
Operating expenses: | ||||||||||||||||||||||||
Real estate taxes | $ | 1,497 | $ | 2,106 | $ | 2,321 | $ | 2,101 | $ | 390 | $ | 8,415 | ||||||||||||
Property operating | 5,949 | 854 | 5,163 | 1,705 | 685 | 14,356 | ||||||||||||||||||
Provision for doubtful accounts | 162 | — | 1 | 177 | 1 | 341 | ||||||||||||||||||
Total segment operating expenses | $ | 7,608 | $ | 2,960 | $ | 7,485 | $ | 3,983 | $ | 1,076 | $ | 23,112 | ||||||||||||
Operating income - Segments | $ | 7,109 | $ | 10,400 | $ | 14,188 | $ | 10,559 | $ | 1,106 | $ | 43,362 | ||||||||||||
Capital expenditures by segment | $ | 1,364 | $ | 62 | $ | 4,508 | $ | 277 | $ | 222 | $ | 6,433 | ||||||||||||
Reconciliation to income from continuing operations | ||||||||||||||||||||||||
Operating income - Segments | $ | 43,362 | ||||||||||||||||||||||
Advisor fees | 6,545 | |||||||||||||||||||||||
Company level expenses | 1,610 | |||||||||||||||||||||||
General and administrative | 516 | |||||||||||||||||||||||
Acquisition expenses | 1,120 | |||||||||||||||||||||||
Depreciation and amortization | 24,007 | |||||||||||||||||||||||
Operating income | $ | 9,564 | ||||||||||||||||||||||
Other income and (expenses): | ||||||||||||||||||||||||
Interest expense | $ | (13,154 | ) | |||||||||||||||||||||
Equity in income of unconsolidated affiliates | 651 | |||||||||||||||||||||||
Gain on disposition of property and extinguishment of debt | 29,009 | |||||||||||||||||||||||
Total other income and (expenses) | $ | 16,506 | ||||||||||||||||||||||
Income from continuing operations | $ | 26,070 | ||||||||||||||||||||||
17
Apartments | Industrial | Office | Retail | Other | Total | |||||||||||||||||||
Nine Months Ended September 30, 2014 | ||||||||||||||||||||||||
Revenues: | ||||||||||||||||||||||||
Minimum rents | $ | 23,477 | $ | 8,826 | $ | 18,856 | $ | 9,021 | $ | 190 | $ | 60,370 | ||||||||||||
Tenant recoveries and other rental income | 1,390 | 2,315 | 3,168 | 3,015 | 1,977 | 11,865 | ||||||||||||||||||
Total revenues | $ | 24,867 | $ | 11,141 | $ | 22,024 | $ | 12,036 | $ | 2,167 | $ | 72,235 | ||||||||||||
Operating expenses: | ||||||||||||||||||||||||
Real estate taxes | $ | 2,676 | $ | 1,771 | $ | 2,499 | $ | 1,854 | $ | 236 | $ | 9,036 | ||||||||||||
Property operating | 10,809 | 488 | 5,020 | 1,598 | 1,037 | 18,952 | ||||||||||||||||||
Provision for doubtful accounts | 245 | — | 47 | 24 | 1 | 317 | ||||||||||||||||||
Total segment operating expenses | $ | 13,730 | $ | 2,259 | $ | 7,566 | $ | 3,476 | $ | 1,274 | $ | 28,305 | ||||||||||||
Operating income - Segments | $ | 11,137 | $ | 8,882 | $ | 14,458 | $ | 8,560 | $ | 893 | $ | 43,930 | ||||||||||||
Capital expenditures by segment | $ | 2,936 | $ | 1,454 | $ | 4,842 | $ | 265 | $ | — | $ | 9,497 | ||||||||||||
Reconciliation to income from continuing operations | ||||||||||||||||||||||||
Operating income - Segments | $ | 43,930 | ||||||||||||||||||||||
Advisor fees | 4,356 | |||||||||||||||||||||||
Company level expenses | 1,901 | |||||||||||||||||||||||
General and administrative | 640 | |||||||||||||||||||||||
Acquisition expenses | 520 | |||||||||||||||||||||||
Depreciation and amortization | 20,685 | |||||||||||||||||||||||
Operating income | $ | 15,828 | ||||||||||||||||||||||
Other income and (expenses): | ||||||||||||||||||||||||
Interest expense | $ | (13,736 | ) | |||||||||||||||||||||
Gain on disposition of property and extinguishment of debt | 589 | |||||||||||||||||||||||
Total other income and (expenses) | $ | (13,147 | ) | |||||||||||||||||||||
Income from continuing operations | $ | 2,681 | ||||||||||||||||||||||
18
NOTE 9—DISTRIBUTIONS PAYABLE
On August 6, 2015, our board of directors approved a gross dividend for the third quarter of 2015 of $0.12 per share to stockholders of record as of September 29, 2015. The dividend was paid on November 6, 2015. Class A, Class M, Class A-I, Class M-I and Class D stockholders received $0.12 per share, less applicable class-specific fees, if any.
NOTE 10— RECENTLY ISSUED ACCOUNTING PRONOUNCEMENTS
In May 2014, the FASB issued an accounting standard update that will use a five step model to recognize revenue from customer contracts in an effort to increase consistency and comparability throughout global capital markets and across industries. The model will identify the contract, identify any separate performance obligations in the contract, determine the transaction price, allocate the transaction price and recognize revenue when the performance obligation is satisfied. The new standard will replace most existing revenue recognition in GAAP when it becomes effective for us on January 1, 2018. We have not yet selected a transition method nor have we determined the effect of the standard on our ongoing financial reporting.
In February 2015, the FASB issued Accounting Standards Update No. 2015-02, Amendments to the Consolidation Analysis (Topic 810), which improves targeted areas of the consolidation guidance and reduces the number of consolidation models. The amendments in the ASU are effective for annual and interim periods in fiscal years beginning after December 15, 2015, with early adoption permitted. We are currently evaluating the effect the guidance will have on our consolidated financial statements.
On April 7, 2015, the FASB issued Accounting Standard Update 2015-03, Simplifying the Presentation of Debt Issuance Costs, which requires debt issuance costs to be presented in the balance sheet as a direct deduction from the associated debt liability. For public business entities, the ASU is effective for annual and interim periods in fiscal years beginning after December 15, 2015, with early adoption permitted. The new guidance will be applied on a retrospective basis.
NOTE 11—SUBSEQUENT EVENTS
On October 30, 2015, we entered into an agreement to acquire an approximate 28% interest in a limited partnership which has agreed to acquire an approximate 49% interest in a fund that owns 15 retail properties in the greater New York City area ("NYC Retail Portfolio"). We will own an approximate 14% interest in the NYC Retail Portfolio. The purchase price is approximately $85 million and is subject to normal closing prorations and adjustments. The NYC Retail Portfolio contains approximately 2.7 million square feet across urban infill locations in Manhattan, Brooklyn, Queens, the Bronx, Staten Island and New Jersey. The aggregate gross value of the NYC Retail Portfolio is approximately $1.3 billion, with the Company’s 14% interest equating to approximately $179 million in gross assets. The Company expects to fund the transaction using cash on hand with closing expected to occur before year-end.
On November 5, 2015, our board of directors approved a gross dividend for the fourth quarter of 2015 of $0.12 per share to stockholders of record as of December 30, 2015. The dividend will be paid on or around February 5, 2016. Class A, Class M, Class A-I, Class M-I and Class D stockholders will receive $0.12 per share, less applicable class-specific fees, if any.
* * * * * *
19
Item 2. | Management’s Discussion and Analysis of Financial Condition and Results of Operations. |
$ in thousands, except per share amounts
Cautionary Note Regarding Forward-Looking Statements
This Quarterly Report on Form 10-Q may contain forward-looking statements within the meaning of Section 21E of the Securities Exchange Act of 1934, as amended (the “Exchange Act”), and Section 27A of the Securities Act of 1933, as amended (the "Securities Act"), regarding, among other things, our plans, strategies and prospects, both business and financial. Forward-looking statements include, but are not limited to, statements that represent our beliefs concerning future operations, strategies, financial results or other developments. Forward-looking statements can be identified by the use of forward-looking terminology such as, but not limited to, “may,” “should,” “expect,” “anticipate,” “estimate,” “would be,” “believe,” or “continue” or the negative or other variations of comparable terminology. Because these forward-looking statements are based on estimates and assumptions that are subject to significant business, economic and competitive uncertainties, many of which are beyond our control or are subject to change, actual results could be materially different. Although we believe that our plans, intentions and expectations reflected in or suggested by these forward-looking statements are reasonable, we cannot assure you that we will achieve or realize these plans, intentions or expectations. Forward-looking statements are inherently subject to risks, uncertainties and assumptions. Readers are cautioned not to place undue reliance on these forward-looking statements, which speak only as of the date this Form 10-Q is filed with the SEC. Except as required by law, we do not undertake to update or revise any forward-looking statements contained in this Form 10-Q. Important factors that could cause actual results to differ materially from the forward-looking statements are disclosed in “Item 1A. Risk Factors,” “Item 1. Business” and “Item 7. Management’s Discussion and Analysis of Financial Condition and Results of Operations” contained in our 2014 Form 10-K and our periodic reports filed with the SEC.
Management Overview
The following Management’s Discussion and Analysis of Financial Condition and Results of Operations (“MD&A”) is intended to help the reader understand our results of operations and financial condition. This MD&A is provided as a supplement to, and should be read in conjunction with, our consolidated financial statements and the accompanying notes to the consolidated financial statements appearing elsewhere in this Form 10-Q. All references to numbered Notes are to specific notes to our Consolidated Financial Statements beginning on page 7 of this Form 10-Q, and the descriptions referred to are incorporated into the applicable portion of this section by reference. References to “base rent” in this Form 10-Q refer to cash payments made under the relevant lease(s), excluding real estate taxes and certain property operating expenses that are paid by us and are recoverable under the relevant lease(s) and exclude adjustments for straight-line rent revenue and above- and below-market lease amortization.
The discussions surrounding our consolidated properties refer to our wholly or majority owned and controlled properties, which as of September 30, 2015, were comprised of:
Apartment
• | Station Nine Apartments, |
• | The Edge at Lafayette, |
• | Campus Lodge Tampa, |
• | Townlake of Coppell (acquired in 2015) and |
• | AQ Rittenhouse (acquired in 2015). |
Industrial
• | Kendall Distribution Center, |
• | Norfleet Distribution Center, |
• | Joliet Distribution Center, |
• | Suwanee Distribution Center, |
• | South Seattle Distribution Center, |
• | Grand Prairie Distribution Center (acquired in 2014), |
• | Charlotte Distribution Center (acquired in 2014), |
• | DFW Distribution Center (acquired in 2015) and |
• | O'Hare Industrial Portfolio (acquired in 2015). |
20
Office
• | Monument IV at Worldgate, |
• | 111 Sutter Street, |
• | 14600 Sherman Way, |
• | 14624 Sherman Way, |
• | 36 Research Park Drive and |
• | Railway Street Corporate Centre. |
Retail
• | The District at Howell Mill, |
• | Grand Lakes Marketplace, |
• | Oak Grove Plaza (acquired in 2014), |
• | Rancho Temecula Town Center (acquired in 2014), |
• | Skokie Commons (acquired in 2015) and |
• | Whitestone Market (acquired in 2015). |
Other
• | South Beach Parking Garage (acquired in 2014). |
Sold Properties
• | Stirling Slidell Shopping Centre (sold in 2014), |
• | 4 Research Park Drive (transferred to the lender in 2014), |
• | Cabana Beach San Marcos (sold in 2015), |
• | Cabana Beach Gainesville (sold in 2015), |
• | Campus Lodge Athens (sold in 2015) and |
• | Campus Lodge Columbia (sold in 2015). |
Discussions surrounding our Unconsolidated Properties refer to properties owned through joint venture arrangements or condominium interests, which as of September 30, 2015 and December 31, 2014 consists of Chicago Parking Garage.
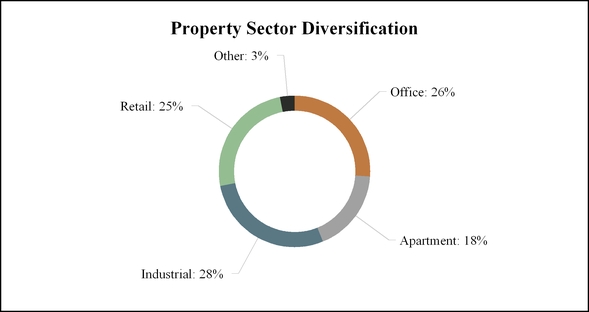
Our primary business is the ownership and management of a diversified portfolio of apartment, industrial, office, retail and other properties primarily located in the United States. It is expected that over time our real estate portfolio will be further diversified on a global basis and will be complemented by investments in real estate-related assets.
We are managed by our Advisor, LaSalle Investment Management, Inc., a subsidiary of our Sponsor, Jones Lang LaSalle Incorporated (NYSE: JLL), a leading financial and professional services firm that specializes in commercial real estate services and investment management. We hire property management and leasing companies to provide the on-site, day-to-day management and leasing services for our properties. When selecting a property management or leasing company for one of our properties, we look for service providers that have a strong local market or industry presence, create portfolio efficiencies, have the ability to develop new business for us and will provide a strong internal control environment that will comply with our Sarbanes-Oxley Act of 2002 (“Sarbanes-Oxley”) internal control requirements. We currently use a mix of property management and leasing service providers that include large national real estate service firms, including an affiliate of our Advisor and smaller local firms.
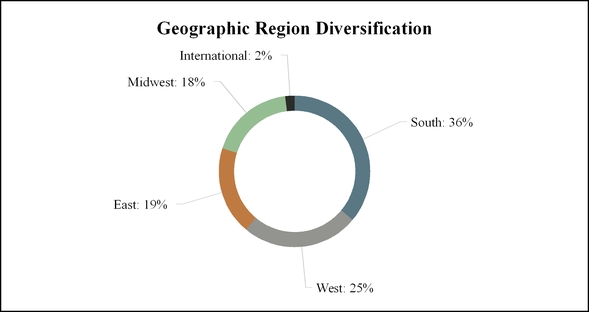
We seek to minimize risk and maintain stability of income and principal value through broad diversification across property sectors and geographic markets and by balancing tenant lease expirations and debt maturities across the real estate portfolio. Our diversification goals also take into account investing in sectors or regions we believe will create returns consistent with our investment objectives. Under normal conditions, we intend to pursue investments principally in well-located, well-leased properties within the apartment, industrial, office, retail and other sectors. We expect to actively manage the mix of properties and markets over time in response to changing operating fundamentals within each property sector and to changing economies and real estate markets in the geographic areas considered for investment. When consistent with our investment objectives, we also seek to maximize the tax efficiency of our investments through like-kind exchanges and other tax planning strategies.
21
The following charts summarize our portfolio diversification by property sector and geographic region based upon the fair value of our properties. These tables provide examples of how our Advisor evaluates our real estate portfolio when making investment decisions.
Estimated Percent of Fair Value as of September 30, 2015:
22
Seasonality
For our two student-oriented apartments, the majority of our leases commence mid-August and terminate the last day of July. These dates generally coincide with the commencement of the universities’ fall academic term and the completion of the subsequent summer school session. In certain cases we enter into leases for less than the full academic year, including nine-month or shorter-term leases. As a result, cash flows may be reduced during the summer months at properties having lease terms shorter than 12 months. The annual releasing cycle results in significant turnover in the tenant population from year to year. Accordingly, certain property revenues and operating expenses tend to be seasonal in nature, and therefore not incurred ratably over the course of the year. Prior to the commencement of each new lease period, mostly during the first two weeks of August, we prepare the units for new incoming tenants. Other than revenue generated by in-place leases for returning tenants, we do not generally recognize lease revenue during this period, referred to as the “Turn,” as we have no leases in place. In addition, during the Turn we incur significant expenses making our units ready for occupancy, which we recognize immediately. This lease Turn period results in seasonality impacts on our operating results during the second and third quarter of each year.
With the exception of our student-oriented apartments described above, our investments are not materially impacted by seasonality, despite certain of our retail tenants being impacted by seasonality. Percentage rents (rents computed as a percentage of tenant sales) that we earn from investments in retail properties may, in the future, be impacted by seasonality.
Use of Estimates
The preparation of financial statements in conformity with GAAP requires us to make estimates and assumptions. These estimates and assumptions impact the reported amounts of assets and liabilities and the disclosure of contingent assets and liabilities at the date of the consolidated financial statements and the reported amounts of revenues and expenses during the reporting period. For example, significant estimates and assumptions have been made with respect to the useful lives of assets, recoverable amounts of receivables, fair value of derivatives and real estate assets, initial valuations and related amortization periods of deferred costs and intangibles, particularly with respect to property acquisitions. Actual results could differ from those estimates.
Critical Accounting Policies
The MD&A is based upon our consolidated financial statements, which have been prepared in accordance with GAAP. The preparation of these consolidated financial statements requires management to make estimates and judgments that affect the reported amounts of assets, liabilities, revenues and expenses. Management bases its estimates on historical experience and assumptions that are believed to be reasonable under the circumstances, the results of which form the basis for making judgments about carrying value of assets and liabilities that are not readily apparent from other sources. Actual results may differ from these estimates under different assumptions or conditions. We believe there have been no significant changes during the nine months ended September 30, 2015 to the items that we disclosed as our critical accounting policies and estimates under “Item 7. Management’s Discussion and Analysis of Financial Condition and Results of Operations,” in our 2014 Form 10-K.
Initial Valuations and Estimated Useful Lives or Amortization Periods for Real Estate Investments and Intangibles
These estimates are particularly important as they are used for the allocation of purchase price between depreciable and non-depreciable real estate and other identifiable intangibles, including above, below and at-market leases. As a result, the impact of these estimates on our operations could be substantial. Significant differences in annual depreciation or amortization expense may result from the differing useful life or amortization periods related to such purchased assets and liabilities.
Impairment of Long-Lived Assets
Our estimate of the expected future cash flows used in testing for impairment is highly subjective and based on, among other things, our estimates regarding future market conditions, rental rates, occupancy levels, costs of tenant improvements, leasing commissions and other tenant concessions, assumptions regarding the residual value of our properties at the end of our anticipated holding period, discount rates and the length of our anticipated holding period. These assumptions could differ materially from actual results. If our strategy changes or if market conditions otherwise dictate a reduction in the holding period and an earlier sale date, an impairment loss could be recognized and such loss could be material.
23
Properties
Properties owned at September 30, 2015 are as follows:
Percentage Leased as of September 30, 2015 | ||||||||||
Property Name | Location | Acquisition Date | Ownership % | Net Rentable Square Feet | ||||||
Apartment Segment: | ||||||||||
Station Nine Apartments | Durham, NC | April 16, 2007 | 100% | 312,000 | 94% | |||||
Townlake of Coppell (1) | Coppell, TX | May 22, 2015 | 90 | 351,000 | 96 | |||||
AQ Rittenhouse | Philadelphia, PA | July 30, 2015 | 100 | 92,000 | 70 | |||||
Student-oriented Apartment Communities: | ||||||||||
The Edge at Lafayette (1) | Lafayette, LA | January 15, 2008 | 78 | 207,000 | 99 | |||||
Campus Lodge Tampa (1) | Tampa, FL | February 29, 2008 | 78 | 477,000 | 99 | |||||
Industrial Segment: | ||||||||||
Kendall Distribution Center | Atlanta, GA | June 30, 2005 | 100 | 409,000 | 100 | |||||
Norfleet Distribution Center | Kansas City, MO | February 27, 2007 | 100 | 702,000 | 100 | |||||
Joliet Distribution Center | Joliet, IL | June 26, 2013 | 100 | 442,000 | 100 | |||||
Suwanee Distribution Center | Suwanee, GA | June 28, 2013 | 100 | 559,000 | 100 | |||||
South Seattle Distribution Center | ||||||||||
3800 1st Avenue | Seattle, WA | December 18, 2013 | 100 | 162,000 | 100 | |||||
3844 1st Avenue | Seattle, WA | December 18, 2013 | 100 | 101,000 | 100 | |||||
3601 2nd Avenue | Seattle, WA | December 18, 2013 | 100 | 60,000 | 100 | |||||
Grand Prairie Distribution Center | Grand Prairie, TX | January 22, 2014 | 100 | 277,000 | 100 | |||||
Charlotte Distribution Center | Charlotte, NC | June 27, 2014 | 100 | 347,000 | 100 | |||||
DFW Distribution Center | ||||||||||
4050 Corporate Drive | Grapevine, TX | April 15, 2015 | 100 | 441,000 | 100 | |||||
4055 Corporate Drive | Grapevine, TX | April 15, 2015 | 100 | 202,000 | 100 | |||||
O’Hare Industrial Portfolio | ||||||||||
200 Lewis | Wood Dale, IL | September 30, 2015 | 100 | 31,000 | 100 | |||||
1225 Michael Drive | Wood Dale, IL | September 30, 2015 | 100 | 109,000 | 100 | |||||
1300 Michael Drive | Wood Dale, IL | September 30, 2015 | 100 | 71,000 | 100 | |||||
1301 Mittel Drive | Wood Dale, IL | September 30, 2015 | 100 | 53,000 | 100 | |||||
1350 Michael Drive | Wood Dale, IL | September 30, 2015 | 100 | 56,000 | 100 | |||||
2501 Allan Drive | Elk Grove, IL | September 30, 2015 | 100 | 198,000 | 74 | |||||
2601 Allan Drive | Elk Grove, IL | September 30, 2015 | 100 | 124,000 | 100 | |||||
Office Segment: | ||||||||||
Monument IV at Worldgate | Herndon, VA | August 27, 2004 | 100 | 228,000 | 100 | |||||
111 Sutter Street | San Francisco, CA | March 29, 2005 | 100 | 286,000 | 96 | |||||
14600 Sherman Way | Van Nuys, CA | December 21, 2005 | 100 | 50,000 | 92 | |||||
14624 Sherman Way | Van Nuys, CA | December 21, 2005 | 100 | 53,000 | 89 | |||||
36 Research Park Drive | St. Charles, MO | June 13, 2007 | 100 | 81,000 | 100 | |||||
Railway Street Corporate Centre | Calgary, Canada | August 30, 2007 | 100 | 135,000 | 71 | |||||
Retail Segment: | ||||||||||
The District at Howell Mill (1) | Atlanta, GA | June 15, 2007 | 88 | 306,000 | 96 | |||||
Grand Lakes Marketplace (1) | Katy, TX | September 17, 2013 | 90 | 131,000 | 100 | |||||
Oak Grove Plaza | Sachse, TX | January 17, 2014 | 100 | 120,000 | 93 | |||||
Rancho Temecula Town Center | Temecula, CA | June 16, 2014 | 100 | 165,000 | 93 | |||||
Skokie Commons | Skokie, IL | May 15, 2015 | 100 | 93,000 | 97 | |||||
Whitestone Market | Austin, TX | September 30, 2015 | 100 | 145,000 | 100 | |||||
24
Other Segment: | ||||||||||
South Beach Parking Garage (2) | Miami Beach, FL | January 28, 2014 | 100 | 130,000 | N/A | |||||
Unconsolidated Other Property: | ||||||||||
Chicago Parking Garage (3) | Chicago, IL | December 23, 2014 | 100 | 167,000 | N/A | |||||
(1) | We own an interest in the joint venture that owns a fee interest in this property. |
(2) | The parking garage contains 343 stalls. This property is owned subject to a ground lease. |
(3) | We own a condominium interest in the building that contains a 366 stall parking garage. |
Operating Statistics
We generally hold investments in properties with high occupancy rates leased to quality tenants under long-term, non-cancelable leases. We also hold investments in apartment properties which typically have one year leases. We believe these leases are beneficial to achieving our investment objectives. The following table shows our operating statistics by property type for our consolidated properties as of September 30, 2015:
Number of Properties | Total Area (Sq Ft) | % of Total Area | Occupancy % | Average Minimum Base Rent per Occupied Sq Ft (1) | ||||||||||||
Apartment | 5 | 1,438,000 | 19 | % | 95 | % | $ | 15.87 | ||||||||
Industrial | 18 | 4,345,000 | 56 | 99 | 4.25 | |||||||||||
Office | 6 | 833,000 | 11 | 93 | 32.72 | |||||||||||
Retail | 6 | 961,000 | 12 | 97 | 18.76 | |||||||||||
Other | 1 | 130,000 | 2 | N/A | N/A | |||||||||||
Total | 36 | 7,707,000 | 100 | % | 97 | % | $ | 11.13 | ||||||||
(1) | Amount calculated as in-place minimum base rent for all occupied space at September 30, 2015 and excludes any straight line rents, tenant recoveries and percentage rent revenues. |
As of September 30, 2015, our average effective annual rent per square foot, calculated as average minimum base rent per occupied square foot less tenant concessions and allowances, was $10.68.
Recent Events and Outlook
General Company and Market Commentary
On January 16, 2015, we commenced our First Extended Public Offering of up to $2,700,000 in any combination of Class A, Class M, Class A-I and Class M-I shares of common stock, consisting of up to $2,400,000 of shares in our primary offering and up to $300,000 of shares pursuant to our distribution reinvestment plan, and our Initial Public Offering automatically terminated. We intend to offer shares of our common stock on a continuous basis for an indefinite period of time by filing a new registration statement before the end of each offering period, subject to regulatory approval. The per share purchase price varies from day-to-day and, on each day, equals our NAV per share for each class of common stock, plus, for Class A and Class A-I shares, applicable selling commissions. The Dealer Manager has agreed to distribute shares of our common stock in our First Extended Public Offering. We intend to primarily use the net proceeds from the offering, after we pay the fees and expenses attributable to the offerings and our operations, to (1) grow and further diversify our portfolio by making investments in accordance with our investment strategy and policies, (2) reduce borrowings and repay indebtedness incurred under various financing instruments and (3) fund repurchases of our shares under our share repurchase plan and through conducting tender offers.
Private Offering
On March 3, 2015, we commenced a new private offering of up to $350,000 in shares of our Class D common stock with an indefinite duration. Proceeds from our private offering will be used for the same corporate purposes as the proceeds from the First Extended Public Offering.
25
Capital Raised and Use of Proceeds
As of September 30, 2015, we raised gross proceeds of over $640,000 from our offerings and other private share sales since 2012. We used these proceeds along with proceeds from mortgage debt to acquire approximately $630,000 of real estate investments, deleverage the company by repaying mortgage loans of approximately $240,000 and repurchase shares of our common stock of approximately $130,000.
Property Acquisitions and Financings
On April 15, 2015, we acquired DFW Distribution Center, a two building, 643,000 square foot industrial property located in Grapevine, TX, for approximately $44,200. The acquisition was financed with a ten-year mortgage loan that bears interest at a fixed-rate of 3.23%, in the amount of $17,720, and cash on hand. The property is 100% leased to six tenants with a weighted average lease term of four years.
On May 15, 2015, we acquired Skokie Commons, a newly constructed 93,000 square foot grocery-anchored retail property located in Skokie, IL, for approximately $43,750. The acquisition was financed with a ten-year mortgage loan that bears interest at a fixed-rate of 3.31%, in the amount of $24,400, and cash on hand. We will acquire an additional retail outparcel located at this property upon completion of the construction for approximately $4,000 later in 2015.
On May 22, 2015, we acquired a 90% interest in Townlake of Coppell, a 398 unit garden style apartment property, for approximately $43,200. The acquisition was financed with a five-year mortgage loan that bears interest at a fixed-rate of 3.25%, in the amount of $28,800, and cash on hand.
On July 30, 2015, we acquired AQ Rittenhouse, a newly constructed Class A apartment property located near Rittenhouse Square in Philadelphia, PA, for approximately $51,000. The 110 unit, 12 story apartment building, is complemented by 13,000 square feet of fully leased ground floor commercial space. The acquisition was financed with a ten-year mortgage loan that bears interest at a fixed-rate of 3.65%, in the amount of $26,370, and cash on hand.
On September 30, 2015, we acquired Whitestone Market, a 145,000 square foot, 100% leased, grocery anchored
retail center for approximately $51,500. Whitestone Market, located in Austin, Texas, is anchored by an HEB grocery store and was funded with cash on hand.
On September 30, 2015, we acquired O'Hare Industrial Portfolio, a seven property, 642,000 square foot, 92%
leased industrial portfolio for approximately $71,011. O'Hare Industrial Portfolio is located near O'Hare Airport
just outside Chicago, IL and was funded with cash on hand.
Property Dispositions
On January 18, 2015, we sold Cabana Beach San Marcos, Cabana Beach Gainesville, Campus Lodge Athens and Campus Lodge Columbia for a total of approximately $123,800. In connection with the disposition, the mortgage loans associated with the four properties totaling $71,000 were retired. The sale is consistent with our strategy to reorient our portfolio away from more seasonal student-oriented apartment investments and also to dispose of or refinance our higher loan-to-value investments. At sale, these four properties were at 59% loan-to-value.
Line of Credit
On June 8, 2015, we extended and expanded our revolving line of credit with Bank of America, N.A. The new facility has a two year term with a one-year extension at our option, includes an accordion feature which allows us to expand the available balance from $40,000 to $75,000 and bears interest at a rate of LIBOR plus a spread ranging from 1.35% to 2.10% depending on our company leverage.
Leasing
During September 2015, we signed Amazon Corporate LLC to an expansion and extension of their lease at Monument IV at Worldgate. The lease amendment increases their occupancy in the building by approximately 83,000 square feet and extends the lease expiration to April 2027. The lease amendment keeps the building 100% leased through April 2027.
Mortgage Repayment
On March 20, 2015, we retired the $9,250 mortgage loan secured by South Beach Parking Garage in advance of the March 2017 maturity date using cash on hand.
26
Stock Repurchases
For the nine months ended September 30, 2015, we repurchased $23,101 of shares of our common stock through the share repurchase plan.
Subsequent Events
On October 30, 2015, we entered into an agreement to acquire an approximate 28% interest in a limited partnership which has agreed to acquire an approximate 49% interest in a fund that owns 15 retail properties in the greater New York City area. We will own an approximate 14% interest in the NYC Retail Portfolio. The purchase price is approximately $85 million and is subject to normal closing prorations and adjustments. The NYC Retail Portfolio contains approximately 2.7 million square feet across urban infill locations in Manhattan, Brooklyn, Queens, the Bronx, Staten Island and New Jersey. The aggregate gross value of the NYC Retail Portfolio is approximately $1.3 billion, with the Company’s 14% interest equating to approximately $179 million in gross assets. The Company expects to fund the transaction using cash on hand with closing expected to occur before year-end.
Investment Objectives and Strategy
Over the past three years we have acquired 25 new properties (all of these consistent with our go-forward strategy), sold 21 non-strategic properties, reduced our Company leverage ratio, decreased our average interest rate on debt, increased cash reserves and Company-wide liquidity, while also providing cash flow to our stockholders through our regular quarterly dividend payments.
Our primary investment objectives are:
• | to generate an attractive level of current income for distribution to our stockholders; |
• | to preserve and protect our stockholders' capital investments; |
• | to achieve appreciation of our NAV over time; and |
• | to enable stockholders to utilize real estate as an asset class in diversified, long-term investment portfolios. |
The cornerstone of our investment strategy is to acquire and manage income-producing commercial real estate properties and real estate-related assets around the world. We believe this strategy enables us to provide our stockholders with a portfolio that is well-diversified across property type, geographic region and industry, both in the United States and, over time, internationally. It is our belief that adding international investments to our portfolio over time will serve as an effective tool to construct a well-diversified portfolio designed to provide our stockholders with stable distributions and attractive long-term risk-adjusted returns.
We believe that our broadly diversified portfolio benefits our stockholders by providing:
• | diversification of sources of income; |
• | access to attractive real estate opportunities currently in the United States and, over time, around the world; and |
• | exposure to a return profile that should have lower correlations with other investments. |
Since real estate markets are often cyclical in nature, our strategy allows us to more effectively deploy capital into property types and geographic regions where the underlying investment fundamentals are relatively strong or strengthening and away from those property types and geographic regions where such fundamentals are relatively weak or weakening. We intend to meet our investment objectives by selecting investments across multiple property types and geographic regions to achieve portfolio stability, diversification, current income and favorable risk-adjusted returns. To a lesser degree, we also intend to invest in debt and equity interests backed principally by real estate, which we refer to collectively as “real estate-related assets.”
Our board of directors has adopted investment guidelines for our Advisor to implement and actively monitor in order to allow us to achieve and maintain diversification in our overall investment portfolio. Our board of directors formally reviews our investment guidelines on an annual basis and our investment portfolio on a quarterly basis or, in each case, more often as they deem appropriate. Our board of directors reviews the investment guidelines to ensure that the guidelines are being followed and are in the best interests of our stockholders.
We seek to invest:
• | up to 95% of our assets in properties; |
27
• | up to 25% of our assets in real estate-related assets; and |
• | up to 15% of our assets in cash, cash equivalents and other short-term investments. |
Notwithstanding the above, the actual percentage of our portfolio that is invested in each investment type may from time to time be outside these target levels due to numerous factors including, but not limited to, large inflows of capital over a short period of time, lack of attractive investment opportunities or increases in anticipated cash requirements for repurchase requests.
We expect to maintain a targeted Company leverage ratio (calculated as our share of total liabilities divided by our share of the fair value of total assets) of between 30% and 50%. We intend to use low leverage, or in some cases possibly no leverage, to finance new acquisitions in order to maintain our targeted Company leverage ratio. Our Company leverage ratio was 36% as of September 30, 2015.
2015 Key Initiatives
During 2015, we intend to use capital raised from our offerings to make new acquisitions that will further our investment objectives and are in keeping with our investment strategy. Likely acquisition candidates may include well-located, well-leased industrial properties, grocery-anchored community oriented retail properties and apartment properties. We will look to acquire other property types when the opportunities and risk profile match our investment objectives and strategy. We will also attempt to further our geographic diversification by targeting investment properties located in the eastern and western United States. We will use debt financing to take advantage of the current favorable interest rate environment, while looking to keep the Company leverage ratio between 30% and 50% in the near term. We also intend to use our revolving line of credit to allow us to more efficiently manage our cash flows.
28
Results of Operations
General
Our revenues are primarily received from tenants in the form of fixed minimum base rents and recoveries of operating expenses. Our expenses primarily relate to the costs of operating and financing the properties. Our share of the net income or net loss from our unconsolidated property is included in the equity in income of unconsolidated affiliate. We believe the following analysis of reportable segments provides important information about the operating results of our real estate investments, such as trends in total revenues or operating expenses that may not be as apparent in a period-over-period comparison of the entire Company. We group our investments in real estate assets from continuing operations into five reportable operating segments based on the type of property, which are apartment, industrial, office, retail and other. Operations from corporate level items and real estate assets sold are excluded from reportable segments.
Properties acquired or sold during any of the periods presented are presented within the recent acquisitions and sold properties line until the property has been owned for all periods presented. The properties currently presented within the recent acquisitions and sold properties line include the properties listed as either acquired or sold in the Management Overview section above. Properties owned for the nine months ended September 30, 2015 and 2014 are referred to as our comparable properties.
Results of Operations for the Three Months Ended September 30, 2015 and 2014
Revenues
The following chart sets forth revenues by reportable segment, for the three months ended September 30, 2015 and 2014:
Three months ended September 30, 2015 | Three months ended September 30, 2014 | $ Change | % Change | ||||||||||||
Revenues: | |||||||||||||||
Minimum rents | |||||||||||||||
Apartment | $ | 3,539 | $ | 3,360 | $ | 179 | 5.3 | % | |||||||
Industrial | 2,443 | 2,561 | (118 | ) | (4.6 | ) | |||||||||
Office | 5,983 | 6,120 | (137 | ) | (2.2 | ) | |||||||||
Retail | 1,886 | 1,886 | — | — | |||||||||||
Comparable properties total | $ | 13,851 | $ | 13,927 | $ | (76 | ) | (0.5 | )% | ||||||
Recent acquisitions and sold properties | 5,379 | 6,588 | (1,209 | ) | (18.4 | ) | |||||||||
Total | $ | 19,230 | $ | 20,515 | $ | (1,285 | ) | (6.3 | )% | ||||||
Tenant recoveries and other rental income | |||||||||||||||
Apartment | $ | 170 | $ | 178 | $ | (8 | ) | (4.5 | )% | ||||||
Industrial | 584 | 539 | 45 | 8.3 | |||||||||||
Office | 1,234 | 1,054 | 180 | 17.1 | |||||||||||
Retail | 613 | 730 | (117 | ) | (16.0 | ) | |||||||||
Comparable properties total | $ | 2,601 | $ | 2,501 | $ | 100 | 4.0 | % | |||||||
Recent acquisitions and sold properties | 1,444 | 1,664 | (220 | ) | (13.2 | ) | |||||||||
Total | $ | 4,045 | $ | 4,165 | $ | (120 | ) | (2.9 | )% | ||||||
Total revenues | $ | 23,275 | $ | 24,680 | $ | (1,405 | ) | (5.7 | )% | ||||||
Minimum rents at comparable properties decreased by $76 for the three months ended September 30, 2015 as compared to the same period in 2014. The decrease is primarily due to a decrease of $183 at Railway Street Corporate Centre related to an unfavorable exchange rate and lower occupancy during the three months ended September 30, 2015 as compared to the same period in 2014. Additionally, Norfleet Distribution Center decreased $131 due to a lower rental rate for the lease extension effective for 2015. Partially offsetting the decrease was an increase of $217 at our student-oriented apartment properties due to increases in occupancy and rental rates for the three months ended September 30, 2015 as compared to the same period in 2014.
Tenant recoveries relate mainly to real estate taxes and certain property operating expenses that are paid by us and are recoverable under the various tenants’ leases. Tenant recoveries and other rental income at comparable properties increased by $100 for the three months ended September 30, 2015 as compared to the same period in 2014. The increase is primarily related
29
to higher recoveries of $138 at Monument IV and $69 at 111 Sutter Street due to higher operating expenses during the three months ended September 30, 2015 as compared to the same period in 2014. Partially offsetting these increases was a decrease of $148 at The District of Howell Mill related to lower real estate taxes for the three months ended September 30, 2015 as compared to the same period in 2014.
Operating Expenses
The following chart sets forth real estate taxes, property operating expenses and provisions for doubtful accounts by reportable segment, for the three months ended September 30, 2015 and 2014:
Three months ended September 30, 2015 | Three months ended September 30, 2014 | $ Change | % Change | ||||||||||||
Operating expenses: | |||||||||||||||
Real estate taxes | |||||||||||||||
Apartment | $ | 358 | $ | 390 | $ | (32 | ) | (8.2 | )% | ||||||
Industrial | 488 | 430 | 58 | 13.5 | |||||||||||
Office | 721 | 800 | (79 | ) | (9.9 | ) | |||||||||
Retail | 373 | 423 | (50 | ) | (11.8 | ) | |||||||||
Comparable properties total | $ | 1,940 | $ | 2,043 | $ | (103 | ) | (5.0 | )% | ||||||
Recent acquisitions and sold properties | 877 | 1,152 | (275 | ) | (23.9 | ) | |||||||||
Total | $ | 2,817 | $ | 3,195 | $ | (378 | ) | (11.8 | )% | ||||||
Property operating | |||||||||||||||
Apartment | $ | 1,873 | $ | 1,714 | $ | 159 | 9.3 | % | |||||||
Industrial | 147 | 156 | (9 | ) | (5.8 | ) | |||||||||
Office | 1,895 | 1,735 | 160 | 9.2 | |||||||||||
Retail | 410 | 418 | (8 | ) | (1.9 | ) | |||||||||
Comparable properties total | $ | 4,325 | $ | 4,023 | $ | 302 | 7.5 | % | |||||||
Recent acquisitions and sold properties | 1,203 | 3,380 | (2,177 | ) | (64.4 | ) | |||||||||
Total | $ | 5,528 | $ | 7,403 | $ | (1,875 | ) | (25.3 | )% | ||||||
Net provision for doubtful accounts | |||||||||||||||
Apartment | $ | 51 | $ | 60 | $ | (9 | ) | (15.0 | )% | ||||||
Office | — | 5 | (5 | ) | (100.0 | ) | |||||||||
Comparable properties total | $ | 51 | $ | 65 | $ | (14 | ) | (21.5 | )% | ||||||
Recent acquisitions and sold properties | 57 | 103 | (46 | ) | (44.7 | ) | |||||||||
Total | $ | 108 | $ | 168 | $ | (60 | ) | (35.7 | )% | ||||||
Total operating expenses | $ | 8,453 | $ | 10,766 | $ | (2,313 | ) | (21.5 | )% | ||||||
Real estate taxes at comparable properties decreased by $103 for the three months ended September 30, 2015 as compared to the same period in 2014. Our properties are reassessed periodically by the taxing authorities, which may result in increases or decreases in real estates taxes that we owe. Overall, we expect real estate taxes to increase over time; however, we utilize real estate tax consultants to attempt to control assessment increases.
Property operating expenses consist of the costs of ownership and operation of the real estate investments, many of which are recoverable under net leases. Examples of property operating expenses include insurance, utilities and repair and maintenance expenses. Property operating expenses at comparable properties increased $302 for the three months ended September 30, 2015 as compared to the same period in 2014. The increase is primarily related to increased turn costs of $166 at our student-oriented apartment properties and higher repairs and maintenance and utilities expenses of $144 at 111 Sutter Street.
Net provision for doubtful accounts relates to receivables deemed potentially uncollectable due to the age of the receivable or the status of the tenant. Provision for doubtful accounts at comparable properties decreased by $14 for the three months ended September 30, 2015 as compared to the same period in 2014.
30
The following chart sets forth expenses not directly related to the operations of the reportable segments for the three months ended September 30, 2015 and 2014:
Three months ended September 30, 2015 | Three months ended September 30, 2014 | $ Change | % Change | ||||||||||||
Advisor fees | $ | 3,090 | $ | 1,554 | $ | 1,536 | 98.8 | % | |||||||
Company level expenses | 265 | 724 | (459 | ) | (63.4 | ) | |||||||||
General and administrative | 148 | 212 | (64 | ) | (30.2 | ) | |||||||||
Acquisition expenses | 482 | 5 | 477 | 9,540 | |||||||||||
Depreciation and amortization | 9,859 | 7,353 | 2,506 | 34.1 | |||||||||||
Interest expense | 4,768 | 4,687 | 81 | 1.7 | |||||||||||
Equity in income from unconsolidated affiliate | (244 | ) | — | (244 | ) | 100.0 | |||||||||
Gain on disposition of property and extinguishment of debt | — | (589 | ) | 589 | (100.0 | ) | |||||||||
Income from discontinued operations | — | (813 | ) | 813 | (100.0 | ) | |||||||||
Total expenses | $ | 18,368 | $ | 13,133 | $ | 5,235 | 39.9 | % | |||||||
Advisor fees relate to the fixed advisory and performance fees earned by the Advisor. Fixed fees increase or decrease based on changes in our NAV which will be primarily impacted by changes in capital raised and the value of our properties. The performance fee is accrued when the total return per share for a share class exceeds 7% for that calendar year, where in our Advisor will receive 10% of the excess total return above the 7% threshold. The increase in advisor fees of $1,536 for the three months ended September 30, 2015 as compared to the same period of 2014 is related to the increase in our net asset value attributable to capital raised over the past year, as well as the performance fee of $895 accrued during the three months ended September 30, 2015. There was no performance fee accrued during the three months ended September 30, 2014.
Company level expenses relate mainly to our compliance and administration related costs. Company level expenses decreased $459 for the three months ended September 30, 2015 as compared to the same period in 2014 primarily due to costs related to the tender offer conducted in 2014 and reduced professional service fees in 2015.
General and administrative expenses relate mainly to property expenses unrelated to the operations of the property. General and administrative expenses decreased $64 primarily due to the dispositions of four student-oriented apartment properties in January 2015.
Acquisition expenses relate to expenses incurred during the acquisition of a property. Acquisition expenses increased $477 for the three months ended September 30, 2015 as compared to the same period ended September 30, 2014 related to the acquisition of AQ Rittenhouse, Whitestone Market and the O'Hare Industrial Portfolio during the three months ended September 30, 2015. We did not make an acquisition during the three months ended September 30, 2014.
Depreciation and amortization expense is impacted by the values assigned to buildings, personal property and in-place lease assets as part of the initial purchase price allocation. The increase of $2,506 in depreciation and amortization expense for the three months ended September 30, 2015 as compared to the same period in 2014 is primarily related to an increase of $3,239 for our acquisitions that occurred in 2014 and 2015 offset partially by a decrease of $734 for our student-oriented apartment properties sold in January 2015.
Interest expense increased by $81 for the three months ended September 30, 2015 as compared to the same period in 2014 from new debt incurred as part of our property acquisitions in 2014 and 2015 offset by debt payoffs and interest savings from refinancing loans.
Equity in income from unconsolidated affiliate relates to the income from Chicago Parking Garage, which we acquired on December 23, 2014.
Gain on disposition of property and extinguishment of debt of $589 is related to the disposition of Stirling Slidell Shopping Centre and 4 Research Park Drive during the three months ended September 30, 2014.
Income from discontinued operations in the period ended September 30, 2014 is related to bankruptcy proceeds received from the former tenant at Canyon Plaza, a property we sold in 2013.
31
Results of Operations for the Nine Months Ended September 30, 2015 and 2014
Revenues
The following chart sets forth revenues by reportable segment, for the nine months ended September 30, 2015 and 2014:
Nine months ended September 30, 2015 | Nine months ended September 30, 2014 | $ Change | % Change | ||||||||||||
Revenues: | |||||||||||||||
Minimum rents | |||||||||||||||
Apartment | $ | 10,648 | $ | 10,523 | $ | 125 | 1.2 | % | |||||||
Industrial | 7,348 | 7,678 | (330 | ) | (4.3 | ) | |||||||||
Office | 18,217 | 18,180 | 37 | 0.2 | |||||||||||
Retail | 5,655 | 5,641 | 14 | 0.2 | |||||||||||
Comparable properties total | $ | 41,868 | $ | 42,022 | $ | (154 | ) | (0.4 | )% | ||||||
Recent acquisitions and sold properties | 12,496 | 18,348 | (5,852 | ) | (31.9 | ) | |||||||||
Total | $ | 54,364 | $ | 60,370 | $ | (6,006 | ) | (9.9 | )% | ||||||
Tenant recoveries and other rental income | |||||||||||||||
Apartment | $ | 548 | $ | 503 | $ | 45 | 8.9 | % | |||||||
Industrial | 1,864 | 1,975 | (111 | ) | (5.6 | ) | |||||||||
Office | 3,456 | 3,041 | 415 | 13.6 | |||||||||||
Retail | 2,126 | 2,071 | 55 | 2.7 | |||||||||||
Comparable properties total | $ | 7,994 | $ | 7,590 | $ | 404 | 5.3 | % | |||||||
Recent acquisitions and sold properties | 4,116 | 4,275 | (159 | ) | (3.7 | ) | |||||||||
Total | $ | 12,110 | $ | 11,865 | $ | 245 | 2.1 | % | |||||||
Total revenues | $ | 66,474 | $ | 72,235 | $ | (5,761 | ) | (8.0 | )% | ||||||
Minimum rents at comparable properties decreased by $154 for the nine months ended September 30, 2015 as compared to the same period in 2014. The decrease is primarily due to a decrease of $394 at Norfleet Distribution Center related to a lower rental rate for the lease extension effective for 2015. Partially offsetting the decrease was an increase of $102 at our student-oriented apartment properties due to increases in occupancy and rental rates during the nine months ended September 30, 2015 compared to the same period in 2014.
Tenant recoveries and other rental income relate mainly to real estate taxes and certain property operating expenses that are paid by us and are recoverable under the various tenants’ leases. Tenant recoveries and other rental income at comparable properties increased by $404 for the nine months ended September 30, 2015 as compared to the same period in 2014. The increase is primarily related to higher recoveries of $386 at Monument IV at Worldgate and $223 at 111 Sutter Street due to higher operating expenses during the nine months ended September 30, 2015 as compared to the same period in 2014. Partially offsetting these increases was a decrease of $269 at Railway Street Corporate Centre related to lower occupancy and an unfavorable exchange rate, as well as a decrease of $121 at Joliet Distribution Center related to lower real estate taxes for the nine months ended September 30, 2015 as compared to the same period in 2014.
32
Operating Expenses
The following chart sets forth real estate taxes, property operating expenses and provisions for doubtful accounts by reportable segment, for the nine months ended September 30, 2015 and 2014:
Nine months ended September 30, 2015 | Nine months ended September 30, 2014 | $ Change | % Change | ||||||||||||
Operating expenses: | |||||||||||||||
Real estate taxes | |||||||||||||||
Apartment | $ | 1,077 | $ | 1,169 | $ | (92 | ) | (7.9 | )% | ||||||
Industrial | 1,497 | 1,493 | 4 | 0.3 | |||||||||||
Office | 2,321 | 2,371 | (50 | ) | (2.1 | ) | |||||||||
Retail | 1,248 | 1,202 | 46 | 3.8 | |||||||||||
Comparable properties total | $ | 6,143 | $ | 6,235 | $ | (92 | ) | (1.5 | )% | ||||||
Recent acquisitions and sold properties | 2,272 | 2,801 | (529 | ) | (18.9 | ) | |||||||||
Total | $ | 8,415 | $ | 9,036 | $ | (621 | ) | (6.9 | )% | ||||||
Property operating | |||||||||||||||
Apartment | $ | 4,470 | $ | 4,227 | $ | 243 | 5.7 | % | |||||||
Industrial | 441 | 444 | (3 | ) | (0.7 | ) | |||||||||
Office | 5,163 | 5,011 | 152 | 3.0 | |||||||||||
Retail | 1,101 | 1,099 | 2 | 0.2 | |||||||||||
Comparable properties total | $ | 11,175 | $ | 10,781 | $ | 394 | 3.7 | % | |||||||
Recent acquisitions and sold properties | 3,181 | 8,171 | (4,990 | ) | (61.1 | ) | |||||||||
Total | $ | 14,356 | $ | 18,952 | $ | (4,596 | ) | (24.3 | )% | ||||||
Net provision for doubtful accounts | |||||||||||||||
Apartment | $ | 148 | $ | 68 | $ | 80 | 117.6 | % | |||||||
Office | 1 | 47 | (46 | ) | (97.9 | ) | |||||||||
Retail | 90 | 1 | 89 | 8,900 | |||||||||||
Comparable properties total | $ | 239 | $ | 116 | 123 | 106.0 | % | ||||||||
Recent acquisitions and sold properties | 102 | 201 | (99 | ) | (49.3 | ) | |||||||||
Total | $ | 341 | $ | 317 | $ | 24 | 7.6 | % | |||||||
Total operating expenses | $ | 23,112 | $ | 28,305 | $ | (5,193 | ) | (18.3 | )% | ||||||
Real estate taxes at comparable properties decreased by $92 for the nine months ended September 30, 2015 as compared to the same period in 2014. Our properties are reassessed periodically by the taxing authorities which may result in increases or decreases in real estates taxes that we owe. Overall, we expect real estate taxes to increase over time; however, we utilize real estate tax consultants to attempt to control assessment increases.
Property operating expenses consist of the costs of ownership and operation of the real estate investments, many of which are recoverable under net leases. Examples of property operating expenses include insurance, utilities and repair and maintenance expenses. Property operating expenses at comparable properties increased $394 for the nine months ended September 30, 2015 as compared to the same period of 2014. The increase is primarily related to increased turn costs and repairs and maintenance expenses of $258 at Campus Lodge Tampa and $283 at 111 Sutter Street due to higher repairs and maintenance and utilities expense.
Net provision for doubtful accounts relates to receivables deemed potentially uncollectible due to the age of the receivable or the status of the tenant. Provision for doubtful accounts increased by $123 for the nine months ended September 30, 2015 as compared to the same period of 2014, primarily related to $80 of higher bad debts at Campus Lodge Tampa related to early move outs that occurred during the period. Additionally, at The District of Howell Mill there were $89 of receivables deemed uncollectable from a tenant bankruptcy during the nine months ended September 30, 2015.
33
The following chart sets forth expenses not directly related to the operations of the reportable segments for the nine months ended September 30, 2015 and 2014:
Nine months ended September 30, 2015 | Nine months ended September 30, 2014 | $ Change | % Change | ||||||||||||
Advisor fees | $ | 6,545 | $ | 4,356 | $ | 2,189 | 50.3 | % | |||||||
Company level expenses | 1,610 | 1,901 | (291 | ) | (15.3 | )% | |||||||||
General and administrative | 516 | 640 | (124 | ) | (19.4 | )% | |||||||||
Acquisition expenses | 1,120 | 520 | 600 | 115.4 | % | ||||||||||
Depreciation and amortization | 24,007 | 20,685 | 3,322 | 16.1 | % | ||||||||||
Interest expense | 13,154 | 13,736 | (582 | ) | (4.2 | )% | |||||||||
Equity in income of unconsolidated affiliate | (651 | ) | — | (651 | ) | 100.0 | % | ||||||||
Gain on disposition of property and extinguishment of debt | (29,009 | ) | (589 | ) | (28,420 | ) | 4,825 | % | |||||||
Income from discontinued operations | — | (813 | ) | 813 | (100.0 | )% | |||||||||
Total expenses | $ | 17,292 | $ | 40,436 | $ | (23,144 | ) | (57.2 | )% | ||||||
Advisor fees relate to the fixed advisory and performance fees earned by the Advisor. Fixed fees increase or decrease based on changes in our NAV which will be primarily impacted by changes in capital raised and the value of our properties. The performance fee is accrued when the total return per share for a share class exceeds 7% for that calendar year, where in our Advisor will receive 10% of the excess total return above the 7% threshold. The increase in advisor fees of $2,189 for the nine months ended September 30, 2015 as compared to the same period of 2014 is primarily related to increases in capital raised over the past year as well as the performance fee of $895 accrued during the nine months ended September 30, 2015. There was no performance fee accrued during the nine months ended September 30, 2014.
Company level expenses relate mainly to our compliance and administration related costs. Company level expenses decreased $291 for the nine months ended September 30, 2015 as compared to the same period in 2014 primarily due to costs related to the tender offer conducted in 2014 and reduced professional service fees in 2015.
General and administrative expenses relate mainly to property expenses unrelated to the operations of the property. General and administrative expenses decreased $124 primarily due to the dispositions of four student-oriented apartment properties in January 2015.
Acquisition expenses relate to expenses incurred during the acquisition of a property. Acquisition expenses increased $600 for the nine months ended September 30, 2015 as compared to the same period in 2014 primarily due to the acquisitions of DFW Distribution Center, Skokie Commons,Townlake of Coppell, AQ Rittenhouse, Whitestone Market and O'Hare Industrial Portfolio during the nine months ended September 30, 2015. Acquisition expenses incurred during the nine months ended September 30, 2014 relate to our acquisition of Oak Grove Plaza, Grand Prairie Distribution Center, South Beach Parking Garage, Rancho Temecula Town Center and Charlotte Distribution Center.
Depreciation and amortization expense is impacted by the values assigned to buildings, personal property and in-place lease assets as part of the initial purchase price allocation. The increase of $3,322 in depreciation and amortization expense for the nine months ended September 30, 2015 as compared to the same period in 2014 is primarily related to an increase of $5,497 related to our 2014 and 2015 acquisitions. These increases were partially offset by a decrease of $2,161 related to our four student-oriented apartment properties sold during the nine months ended September 30, 2015.
Interest expense decreased by $582 for the nine months ended September 30, 2015 as compared to the same period in 2014 as debt payoffs and interest savings from refinancing loans more than offset new debt incurred as part of our new property acquisitions.
Equity in income of unconsolidated affiliate relates to the income from Chicago Parking Garage, which we acquired on December 23, 2014.
Gain on disposition of property and extinguishment of debt of $28,420 is related to the dispositions Cabana Beach San Marcos, Cabana Beach Gainesville, Campus Lodge Athens and Campus Lodge Columbia as well as the payoff of the mortgage note payable on South Beach Parking Garage during the nine months ended September 30, 2015. During the nine months ended September 30, 2014, the gain on disposition of property and extinguishment of debt of $589 is related to the disposition of Stirling Slidell Shopping Centre and 4 Research Park Drive.
Income from discontinued operations in the nine months ended September 30, 2014 is related to bankruptcy proceeds from the former tenant at Canyon Plaza, a property we sold in 2013.
34
Funds From Operations
Consistent with real estate industry and investment community preferences, we consider funds from operations ("FFO") as a supplemental measure of the operating performance for a real estate investment trust and a complement to GAAP measures because it facilitates an understanding of the operating performance of our properties. The National Association of Real Estate Investment Trusts ("NAREIT") defines FFO as net income (loss) attributable to the Company (computed in accordance with GAAP), excluding gains or losses from cumulative effects of accounting changes, extraordinary items, impairment write-downs of depreciable real estate and sales of properties, plus real estate related depreciation and amortization and after adjustments for these items related to noncontrolling interests and unconsolidated affiliates.
FFO does not give effect to real estate depreciation and amortization because these amounts are computed to allocate the cost of a property over its useful life. Because values for well-maintained real estate assets have historically increased or decreased based upon prevailing market conditions, we believe that FFO provides investors with an additional view of our operating performance. We also use Adjusted FFO ("AFFO") as a supplemental measure of operating performance. We define AFFO as FFO adjusted for straight-line rental income, amortization of above- and below-market leases, amortization of net discount on assumed debt, gains or losses on the extinguishment and modification of debt, performance fees based on the investment returns on shares of our common stock and acquisition costs.
In order to provide a better understanding of the relationship between FFO, AFFO and GAAP net income, the most directly comparable GAAP financial reporting measure, we have provided reconciliations of GAAP net income attributable to Jones Lang LaSalle Income Property Trust, Inc. to FFO, and FFO to AFFO. FFO and AFFO do not represent cash flow from operating activities in accordance with GAAP, should not be considered as an alternative to GAAP net income and are not necessarily indicative of cash available to fund cash needs. Our presentations of FFO and AFFO are not necessarily comparable to the similarly titled measures of other REITs due to the fact that not all REITs use the same definitions.
The following table presents a reconciliation of GAAP net income to NAREIT FFO for the periods presented:
Reconciliation of GAAP net income to NAREIT FFO | Three months ended September 30, 2015 | Three months ended September 30, 2014 | Nine months ended September 30, 2015 | Nine months ended September 30, 2014 | ||||||||||||
Net (loss) income attributable to Jones Lang LaSalle Income Property Trust, Inc. Common Stockholders (1) | $ | (3,289 | ) | $ | 969 | $ | 19,871 | $ | 3,127 | |||||||
Real estate depreciation and amortization (1) | 9,585 | 7,010 | 23,509 | 19,672 | ||||||||||||
Gain on disposition of property (1) | — | (441 | ) | (23,754 | ) | (441 | ) | |||||||||
NAREIT FFO attributable to Jones Lang LaSalle Income Property Trust, Inc. Common Stockholders | $ | 6,296 | $ | 7,538 | $ | 19,626 | $ | 22,358 | ||||||||
Weighted average shares outstanding, basic and diluted | 63,528,103 | 47,271,566 | 55,849,531 | 45,043,996 | ||||||||||||
NAREIT FFO per share, basic and diluted | $ | 0.10 | $ | 0.16 | $ | 0.35 | $ | 0.50 | ||||||||
(1) | Excludes amounts attributable to noncontrolling interests and includes our share of amounts attributable to unconsolidated real estate affiliate. |
We believe AFFO is useful to investors because it provides supplemental information regarding the performance of our portfolio over time.
35
The following table presents a reconciliation of NAREIT FFO to AFFO for the periods presented:
Reconciliation of NAREIT FFO to AFFO | Three months ended September 30, 2015 | Three months ended September 30, 2014 | Nine months ended September 30, 2015 | Nine months ended September 30, 2014 | ||||||||||||
NAREIT FFO attributable to Jones Lang LaSalle Income Property Trust, Inc. Common Stockholders | $ | 6,296 | $ | 7,538 | $ | 19,626 | $ | 22,358 | ||||||||
Straight-line rental income (1) | (104 | ) | (332 | ) | (663 | ) | (1,931 | ) | ||||||||
Amortization of above- and below-market leases (1) | (590 | ) | (344 | ) | (1,216 | ) | (1,055 | ) | ||||||||
Amortization of net discount on assumed debt (1) | (81 | ) | (78 | ) | (240 | ) | (231 | ) | ||||||||
Loss (gain) on derivative instruments and extinguishment or modification of debt (1) | 99 | (206 | ) | 1,286 | (90 | ) | ||||||||||
Performance fees | 895 | — | 895 | — | ||||||||||||
Acquisition expenses (1) | 482 | 5 | 1,120 | 520 | ||||||||||||
AFFO attributable to Jones Lang LaSalle Income Property Trust, Inc. Common Stockholders | $ | 6,997 | $ | 6,583 | $ | 20,808 | $ | 19,571 | ||||||||
Weighted average shares outstanding, basic and diluted | 63,528,103 | 47,271,566 | 55,849,531 | 45,043,996 | ||||||||||||
AFFO per share, basic and diluted | $ | 0.11 | $ | 0.14 | $ | 0.37 | $ | 0.43 | ||||||||
(1) | Excludes amounts attributable to noncontrolling interests and includes our share of amounts attributable to unconsolidated real estate affiliate. |
NAV as of September 30, 2015
The following table provides a breakdown of the major components of our NAV as of September 30, 2015:
September 30, 2015 | ||||||||||||||||||||
Component of NAV | Class A Shares | Class M Shares | Class A-I Shares | Class M-I Shares | Class D Shares | |||||||||||||||
Real estate investments (1) | $ | 459,648 | $ | 414,124 | $ | 85,420 | $ | 45,754 | $ | 120,471 | ||||||||||
Debt | (168,151 | ) | (151,497 | ) | (31,249 | ) | (16,738 | ) | (44,071 | ) | ||||||||||
Other assets and liabilities, net | 34,746 | 31,304 | 6,457 | 3,458 | 9,106 | |||||||||||||||
Estimated enterprise value premium | None assumed | None assumed | None assumed | None assumed | None assumed | |||||||||||||||
NAV | $ | 326,243 | $ | 293,931 | $ | 60,628 | $ | 32,474 | $ | 85,506 | ||||||||||
Number of outstanding shares | 29,438,803 | 26,472,468 | 5,457,911 | 2,922,875 | 7,705,558 | |||||||||||||||
NAV per share | $ | 11.08 | $ | 11.10 | $ | 11.11 | $ | 11.11 | $ | 11.10 | ||||||||||
(1) | The value of our real estate investments was greater than the historical cost by 3.2% as of September 30, 2015. |
The following table provides a breakdown of the major components of our NAV as of December 31, 2014:
December 31, 2014 | ||||||||||||||||||||
Component of NAV | Class A Shares | Class M Shares | Class A-I Shares | Class M-I Shares | Class D Shares | |||||||||||||||
Real estate investments (1) | $ | 294,228 | $ | 426,336 | $ | 83,480 | $ | 13,398 | $ | 61,164 | ||||||||||
Debt | (129,344 | ) | (187,420 | ) | (36,698 | ) | (5,890 | ) | (26,888 | ) | ||||||||||
Other assets and liabilities, net | 5,794 | 8,396 | 1,644 | 264 | 1,205 | |||||||||||||||
Estimated enterprise value premium | None assumed | None assumed | None assumed | None assumed | None assumed | |||||||||||||||
NAV | $ | 170,678 | $ | 247,312 | $ | 48,426 | $ | 7,772 | $ | 35,481 | ||||||||||
Number of outstanding shares | 16,243,819 | 23,432,192 | 4,580,309 | 735,052 | 3,358,562 | |||||||||||||||
NAV per share | $ | 10.55 | $ | 10.57 | $ | 10.57 | $ | 10.57 | $ | 10.56 | ||||||||||
(1) | The value of our real estate investments was less than the historical cost by 2.8% as of December 31, 2014. |
The increases in NAV per share from December 31, 2014 are primarily related to a net increase of 3.4% in the value of our properties, which resulted in an increase in NAV of $0.53 for Class A and Class M and $0.54 for Class A-I, Class M-I, and Class D. Property operations for the nine months ended September 30, 2015 had an insignificant impact on NAV as dividends declared
36
offset property operations for the period. Our NAV for the different share classes is reduced by normal and recurring class-specific fees and offering and organization costs.
The following are key assumptions (shown on a weighted-average basis) that are used in the discounted cash flow models to estimate the value of our real estate investments as of September 30, 2015:
Apartment | Industrial | Office | Retail | Other (1) | Total Company | |||||||||||||
Exit capitalization rate | 6.45 | % | 6.44 | % | 6.43 | % | 6.32 | % | 7.50 | % | 6.45 | % | ||||||
Discount rate/internal rate of return (IRR) | 7.87 | 7.12 | 7.44 | 7.17 | 8.50 | 7.40 | ||||||||||||
Annual market rent growth rate | 2.91 | 3.06 | 2.97 | 3.14 | 3.65 | 3.05 | ||||||||||||
Holding period (years) | 10.00 | 10.00 | 10.00 | 10.00 | 23.77 | 10.49 | ||||||||||||
(1) | Other includes South Beach Parking Garage, which is subject to a ground lease. Its appraisal incorporates discounted cash flows over the remaining term of the ground lease. |
The following are key assumptions (shown on a weighted-average basis) that are used in the discounted cash flow models to estimate the value of our real estate investments as of December 31, 2014:
Apartment | Industrial | Office | Retail | Other (1) | Total Company | |||||||||||||
Exit capitalization rate | 6.94 | % | 6.44 | % | 6.61 | % | 6.48 | % | N/A | 6.62 | % | |||||||
Discount rate/internal rate of return (IRR) | 8.26 | 7.27 | 7.67 | 7.25 | 8.75 | % | 7.65 | |||||||||||
Annual market rent growth rate | 2.81 | 3.03 | 3.18 | 3.21 | 3.89 | 3.08 | ||||||||||||
Holding period (years) | 10.00 | 10.00 | 10.00 | 10.00 | 35.00 | 10.30 | ||||||||||||
(1) | Other includes South Beach Parking Garage, which is subject to a ground lease. Its appraisal incorporates discounted cash flows over the remaining term of the ground lease. |
While we believe our assumptions are reasonable, a change in these assumptions would impact the calculation of the value of our real estate assets. For example, assuming all other factors remain unchanged, an increase in the weighted-average discount rate/internal rate of return ("IRR") used as of September 30, 2015 of 0.25% would cause a decrease in our total real estate investment value of 1.4% and our NAV per share class would have been $10.87, $10.89, $10.89, $10.89 and $10.88 for Class A, Class M, Class A-I, Class M-I and Class D, respectively. An increase in the weighted-average discount rate/IRR used as of December 31, 2014 of 0.25% would yield a decrease in our total real estate asset value of 1.9% and our NAV per each share class would have been $10.22, $10.23. $10.23, $10.24 and $10.23 for Class A, Class M, Class A-I, Class M-I and Class D, respectively.
Limitations and Risks
As with any valuation methodology, our methodology is based upon a number of estimates and assumptions that may not be accurate or complete. Different parties with different assumptions and estimates could derive a different NAV per share. Accordingly, with respect to our NAV per share, we can provide no assurance that:
• | a stockholder would be able to realize this NAV per share upon attempting to resell his or her shares; |
• | we would be able to achieve for our stockholders the NAV per share upon a listing of our shares of common stock on a national securities exchange, selling our real estate portfolio or merging with another company; or |
• | the NAV per share, or the methodologies relied upon to estimate the NAV per share, will be found by any regulatory authority to comply with any regulatory requirements. |
Furthermore, the NAV per share was calculated as of a particular point in time. The NAV per share will fluctuate over time in response to, among other things, changes in real estate market fundamentals, capital markets activities and attributes specific to the properties and leases within our portfolio.
37
Liquidity and Capital Resources
Our primary uses and sources of cash are as follows:
Uses | Sources | |||
Short-term liquidity and capital needs such as: | • | Operating cash flow, including the receipt of distributions of our share of cash flow produced by our unconsolidated real estate affiliates | ||
• | Interest payments on debt | |||
• | Distributions to stockholders | • | Proceeds from secured loans collateralized by individual properties | |
• | Fees payable to our Advisor | |||
• | Minor improvements made to individual properties that are not recoverable through expense recoveries or common area maintenance charges to tenants | • | Proceeds from our revolving line of credit | |
• | Sales of our shares | |||
• | General and administrative costs | • | Sales of real estate investments | |
• | Costs associated with our continuous public offering | • | Draws from lender escrow accounts | |
• | Other Company level expenses | |||
• | Lender escrow accounts for real estate taxes, insurance, and capital expenditures | |||
• | Fees payable to our Dealer Manager | |||
Longer-term liquidity and capital needs such as: | ||||
• | Acquisitions of new real estate investments | |||
• | Expansion of existing properties | |||
• | Tenant improvements and leasing commissions | |||
• | Debt repayment requirements, including both principal and interest | |||
• | Repurchases of our shares pursuant to our Share Repurchase Plan | |||
The sources and uses of cash for the nine months ended September 30, 2015 and 2014 were as follows:
Nine months ended September 30, 2015 | Nine months ended September 30, 2014 | $ Change | ||||||||||
Net cash provided by operating activities | $ | 22,479 | $ | 23,449 | $ | (970 | ) | |||||
Net cash used in investing activities | (189,212 | ) | (129,612 | ) | (59,600 | ) | ||||||
Net cash provided by financing activities | 238,176 | 111,643 | 126,533 | |||||||||
Cash provided by operating activities decreased by $970 for the nine months ended September 30, 2015 as compared to the same period in 2014. A decrease of $1,554 in cash from operating activities is primarily related to the sale of four student-oriented apartment properties on January 27, 2015. Also impacting our cash provided by operating activities are changes in our working capital, which include tenant accounts receivable, prepaid expenses and other assets, Advisor fee payable and accounts payable and other accrued expenses. These changes in our working capital caused an increase to cash provided by operating activities of $584 between the nine months ended September 30, 2015 and the same period in 2014, primarily related to a decrease in tenant accounts receivable.
Cash used in investing activities increased by $59,600 for the nine months ended September 30, 2015 as compared to the same period in 2014. The increase was primarily generated from an increase in cash used to purchase new properties of $171,314 offset by cash received from the sale of four student-oriented apartment properties totaling $107,393 during the nine months ended September 30, 2015.
Cash provided by financing activities increased by $126,533 for the nine months ended September 30, 2015 as compared to the same period in 2014. The increase primarily relates to $192,926 of net proceeds received from the sale and repurchase of shares during 2015 as compared to 2014. Offsetting the increase are net proceeds from mortgage note payables of $13,366 during the nine months ended September 30, 2015 as compared to net proceeds of $72,016 during the same period in 2014.
38
Also decreasing cash provided by financing activities for the nine months ended September 30, 2015 was an increase in distributions to noncontrolling interests of $10,624 related to the sale of four student-oriented apartment properties.
Financing
We have relied primarily on fixed-rate financing, locking in what were favorable spreads between real estate income yields and mortgage interest rates, and have tried to maintain a balanced schedule of debt maturities. We also use interest rate derivatives to manage our exposure to interest rate movements on our variable rate debt. The following consolidated debt table provides information on the outstanding principal balances and the weighted average interest rates at September 30, 2015 and December 31, 2014 for such debt.
Consolidated Debt
September 30, 2015 | December 31, 2014 | |||||||||||||
Principal Balance | Weighted Average Interest Rate | Principal Balance | Weighted Average Interest Rate | |||||||||||
Fixed | $ | 403,297 | 4.43 | % | $ | 310,587 | 4.77 | % | ||||||
Variable | 29,680 | 2.79 | 109,930 | 2.60 | ||||||||||
Total | $ | 432,977 | 4.31 | % | $ | 420,517 | 4.20 | % | ||||||
Contractual Cash Obligations and Commitments
From time to time, we have entered into contingent agreements for the acquisition and financing of properties. Such acquisitions and financings are subject to satisfactory completion of due diligence or meeting certain leasing or occupancy thresholds.
We are subject to fixed ground lease payments on South Beach Parking Garage of $94 per year until September 30, 2016. The fixed amount will increase on September 30, 2016 and every five years thereafter by the lesser of 12% or the cumulative CPI over the previous five year period. We are also subject to a variable ground lease payment calculated as 2.5% of revenue. The lease expires September 30, 2041 and has one ten-year renewal option.
The operating agreement for Townlake of Coppell allows the unrelated third party joint venture partner, owning a 10% interest, to put their interest to us at a market determined value for a period of 90 days beginning in 2018.
Other Sources
On January 16, 2015, our First Extended Public Offering registration statement was declared effective with the SEC (Commission File No. 333-196886) to register up to $2,700,000 in any combination of shares of our Class A, Class M, Class A-I and Class M-I common stock, consisting of up to $2,400,000 of shares offered in our primary offering and up to $300,000 in shares offered pursuant to our distribution reinvestment plan. We intend to offer shares of our common stock on a continuous basis for an indefinite period of time by filing a new registration statement before the end of each three-year offering period, subject to regulatory approval. We intend to use the net proceeds from the First Extended Public Offering, which are not used to pay the fees and other expenses attributable to our operations, to (1) grow and further diversify our portfolio by making investments in accordance with our investment strategy and policies, (2) reduce borrowings and repay indebtedness incurred under various financing instruments and (3) fund repurchases under our share repurchase plan.
On March 3, 2015, we commenced our Follow-on Private Offering of up to $350,000 of our Class D shares of common stock. We will reserve the right to terminate the Follow-on Private Offering at any time and to extend the Follow-on Private Offering term to the extent permissible under applicable law.
Off Balance Sheet Arrangements
At September 30, 2015 and December 31, 2014, we had approximately $150 in outstanding letters of credit, none of which are reflected as liabilities on our balance sheet. We have no other off balance sheet arrangements.
39
Distributions to Stockholders
To remain qualified as a REIT for federal income tax purposes, we must distribute or pay tax on 100% of our capital gains and distribute at least 90% of ordinary taxable income to stockholders.
The following factors, among others, will affect operating cash flow and, accordingly, influence the decisions of our board of directors regarding distributions:
• | scheduled increases in base rents of existing leases; |
• | changes in minimum base rents and/or overage rents attributable to replacement of existing leases with new or renewal leases; |
• | changes in occupancy rates at existing properties and procurement of leases for newly acquired or developed properties; |
• | necessary capital improvement expenditures or debt repayments at existing properties; and |
• | our share of distributions of operating cash flow generated by the unconsolidated real estate affiliate, less management costs and debt service on additional loans that have been or will be incurred. |
We anticipate that operating cash flow, cash on hand, proceeds from dispositions of real estate investments or refinancings will provide adequate liquidity to conduct our operations, fund general and administrative expenses, fund operating costs and interest payments and allow distributions to our stockholders in accordance with the REIT qualification requirements of the Internal Revenue Code of 1986, as amended.
Recently Issued Accounting Pronouncements
In May 2014, the FASB issued an accounting standard update that will use a five step model to recognize revenue from customer contracts in an effort to increase consistency and comparability throughout global capital markets and across industries. The model will identify the contract, identify any separate performance obligations in the contract, determine the transaction price, allocate the transaction price and recognize revenue when the performance obligation is satisfied. The new standard will replace most existing revenue recognition in GAAP when it becomes effective for us on January 1, 2018. We have not yet selected a transition method nor have we determined the effect of the standard on our ongoing financial reporting.
In February 2015, the FASB issued Accounting Standards Update No. 2015-02, Amendments to the Consolidation Analysis (Topic 810), which improves targeted areas of the consolidation guidance and reduces the number of consolidation models. The amendments in the ASU are effective for annual and interim periods in fiscal years beginning after December 15, 2015, with early adoption permitted. We are currently evaluating the effect the guidance will have on our consolidated financial statements and plan on adopting the standard on January 1, 2016.
On April 7, 2015, the FASB issued Accounting Standard Update 2015-03, Simplifying the Presentation of Debt Issuance Costs, which requires debt issuance costs to be presented in the balance sheet as a direct deduction from the associated debt liability. For public business entities, the ASU is effective for annual and interim periods in fiscal years beginning after December 15, 2015, with early adoption permitted. The new guidance will be applied on a retrospective basis. We plan on adopting the standard on January 1, 2016.
Item 3. | Quantitative and Qualitative Disclosures About Market Risk. |
We are subject to market risk associated with changes in interest rates in terms of our variable-rate debt and the price of new fixed-rate debt for refinancing of existing debt. We manage our interest rate risk exposure by obtaining fixed-rate loans where possible as well as by entering into interest rate cap and swap agreements. As of September 30, 2015, we had consolidated debt of $432,977, which included $29,680 of variable-rate debt. Including the $561 net premium on the assumption of debt, we have consolidated debt of $433,538 at September 30, 2015. We also entered into interest rate cap and swap agreements on $26,280 of debt which cap the LIBOR rate at between 1.0% and 3.3% over the next three years. A 0.25% movement in the interest rate on the $29,680 of variable-rate debt would have resulted in an $74 annualized increase or decrease in consolidated interest expense and cash flow from operating activities.
We are subject to interest rate risk with respect to our fixed-rate financing in that changes in interest rates will impact the fair value of our fixed-rate financing. To determine fair market value, the fixed-rate debt is discounted at a rate based on an estimate of current lending rates, assuming the debt is outstanding through maturity and considering the collateral. At September 30, 2015, the fair value of our mortgage notes payable was estimated to be $10,133 higher than the carrying value of
40
$432,977. If treasury rates were 0.25% higher at September 30, 2015, the fair value of our mortgage notes payable would have been $4,293 higher than the carrying value.
In August 2007, we purchased Railway Street Corporate Centre located in Calgary, Canada. For this investment, we use the Canadian dollar as the functional currency. When preparing consolidated financial statements, assets and liabilities of foreign entities are translated at the exchange rates at the balance sheet date, while income and expense items are translated at weighted average rates for the period. Foreign currency translation adjustments are recorded in accumulated other comprehensive income on the Consolidated Balance Sheet and foreign currency translation adjustment on the Consolidated Statement of Operations and Comprehensive Income.
As a result of our Canadian investment, we are subject to market risk associated with changes in foreign currency exchange rates. These risks include the translation of local currency balances of our Canadian investment and transactions denominated in Canadian dollars. Our objective is to control our exposure to these risks through our normal operating activities. For the nine months ended September 30, 2015 and 2014, we recognized a foreign currency translation loss of $1,206 and $474, respectively. At September 30, 2015, a 10% unfavorable exchange rate movement would have caused our $1,206 foreign currency translation loss to be increased by $697, resulting in a foreign currency translation loss of $1,903.
Item 4. | Controls and Procedures. |
Evaluation of Disclosure Controls and Procedures
Under the supervision and with the participation of our management, including our chief executive officer and chief financial officer, we conducted an evaluation of the effectiveness of the design and operation of our disclosure controls and procedures (as defined in Rules 13a-15(e) and 15d-15(e) under the Exchange Act), as of the end of the period covered by this report. Based on management’s evaluation as of September 30, 2015, our chief executive officer and chief financial officer concluded that our disclosure controls and procedures were effective to provide reasonable assurance that the information required to be disclosed by us in our reports that we file or submit under the Exchange Act is recorded, processed, summarized and reported within the time periods specified in the SEC’s rules and forms and such information is accumulated and communicated to management, including our chief executive officer and chief financial officer, as appropriate, to allow timely decisions regarding required disclosure.
Changes in Internal Control Over Financial Reporting
There were no changes to our internal control over financial reporting during the quarter ended September 30, 2015 that have materially affected, or are reasonably likely to materially affect, our internal control over financial reporting.
PART II
OTHER INFORMATION
Item 1. | Legal Proceedings. |
We are involved in various claims and litigation matters arising in the ordinary course of business, some of which involve claims for damages. Many of these matters are covered by insurance, although they may nevertheless be subject to deductibles or retentions. Although the ultimate liability for these matters cannot be determined, based upon information currently available, we believe the ultimate resolution of such claims and litigation will not have a material adverse effect on our financial position, results of operations or liquidity.
Item 1A. | Risk Factors. |
The most significant risk factors applicable to the Company are described in Item 1A to our 2014 Form 10-K. There have been no material changes to those previously-disclosed risk factors.
Item 2. | Unregistered Sales of Equity Securities and Use of Proceeds. |
Our share repurchase plan limits repurchases during any calendar quarter to shares with an aggregate value (based on the repurchase price per share on the day the repurchase is effected) of 5% of the combined NAV of all classes of shares as of the last day of the previous calendar quarter, which means that in any 12-month period, we limit repurchases to approximately 20% of our total NAV. If the quarterly volume limitation is reached on or before the third business day of a calendar quarter,
41
repurchase requests during the next quarter will be satisfied on a stockholder by stockholder basis, which we refer to as a “per stockholder allocation,” instead of a first-come, first-served basis. Pursuant to the per stockholder allocation, each of our stockholders would be allowed to request repurchase at any time during such quarter of a total number of shares not to exceed 5% of the shares of common stock the stockholder held as of the end of the prior quarter. The per stockholder allocation requirement will remain in effect for each succeeding quarter for which the total repurchases for the immediately preceding quarter exceeded four percent of our NAV on the last business day of such preceding quarter. If total repurchases during a quarter for which the per stockholder allocation applies are equal to or less than four percent of our NAV on the last business day of such preceding quarter, then repurchases will again be first-come, first-served for the next succeeding quarter and each quarter thereafter.
During the three months ended September 30, 2015, we repurchased 385,288 shares of common stock under the share repurchase plan.
Period | Total Number of Shares Redeemed | Average Price Paid per Share | Total Number of Shares Purchased as Part of Publicly Announced Plans or Programs | Maximum Number of Shares that May Yet Be Purchased Pursuant to the Program (1) | ||||
July 1-July 31, 2015 | 180,596 | $10.85 | 180,596 | — | ||||
August 1-August 31, 2015 | 89,281 | $11.05 | 89,281 | — | ||||
September 1-September 30, 2015 | 115,411 | $11.07 | 115,411 | — | ||||
(1) Redemptions are limited as described above.
On June 19, 2014, we began our Initial Private Offering of up to $400,000 in any combination of our Class A-I, Class M-I and Class D shares of common stock. Upon the SEC declaring the registration statement for our First Extended Public Offering effective, we terminated the Initial Private Offering. As of January 15, 2015, we have raised aggregate gross proceeds from the sale of shares of our Class A-I, Class M-I and Class D common stock in our Initial Private Offering of approximately $43,510. On March 3, 2015, we commenced the Follow-on Private Offering of up to $350,000 in shares of our Class D common stock with an indefinite duration.
As of January 15, 2015, we have sold the following shares of common stock and raised the following proceeds in connection with the Initial Private Offering:
Shares | Proceeds | |||||
Private Offering | ||||||
Class A-I Shares | 486,773 | $ | 5,100 | |||
Class M-I Shares | 286,564 | 3,012 | ||||
Class D Shares | 3,358,562 | 35,398 | ||||
Total | 4,131,899 | $ | 43,510 | |||
From the commencement of the Initial Private Offering through January 15, 2015, the net proceeds to us were used to increase our cash and cash equivalents and fund redemptions. We paid $66 of selling commissions on the shares issued from the commencement of the Initial Private offering through January 15, 2015.
On August 10, 2015, we received $412 related to the issuance of 37,326 of our Class D common stock at $11.05 per share pursuant to our distribution reinvestment plan. No selling commissions are paid on the sale of shares pursuant to our distribution reinvestment plan. On September 22, 2015, we sold 4,234,234 of our Class D common stock and raised $47,000 in proceeds under our Follow-on Private Offering which were used to increase our cash and cash equivalents.
These sales are exempt from registration under Section 4(2) of the Securities Act and the purchaser is an accredited investor within the meaning of Regulation D promulgated under the Securities Act.
42
Item 3. | Defaults Upon Senior Securities. |
Not applicable.
Item 4. | Mine Safety Disclosures. |
Not applicable.
Item 5. | Other Information. |
None.
Item 6. | Exhibits. |
The Exhibit Index that immediately follows the signature page to this Form 10-Q is incorporated herein by reference.
43
SIGNATURES
Pursuant to the requirements of Section 13 or 15(d) of the Securities Exchange Act of 1934, the Registrant, Jones Lang LaSalle Income Property Trust, Inc., has duly caused this report to be signed on its behalf by the undersigned, thereunto duly authorized.
JONES LANG LASALLE INCOME PROPERTY TRUST, INC. | |||
Date: | November 6, 2015 | By: | /s/ C. Allan Swaringen |
C. Allan Swaringen | |||
President, Chief Executive Officer | |||
44
EXHIBIT INDEX
Exhibit No. | Description | |
31.1 | Certification of Chief Executive Officer Pursuant to Section 302 of the Sarbanes-Oxley Act of 2002. | |
31.2 | Certification of Chief Financial Officer Pursuant to Section 302 of the Sarbanes-Oxley Act of 2002. | |
32.1 | Certification of Chief Executive Officer Pursuant to Section 906 of the Sarbanes-Oxley Act of 2002. | |
32.2 | Certification of Chief Financial Officer Pursuant to Section 906 of the Sarbanes-Oxley Act of 2002. | |
101.INS* | XBRL Instance Document | |
101.SCH* | XBRL Schema Document | |
101.CAL* | XBRL Calculation Linkbase Document | |
101.DEF* | Definition Linkbase Document | |
101.LAB* | XBRL Labels Linkbase Document | |
101.PRE* | XBRL Presentation Linkbase Document | |
* Pursuant to Rule 406T of Regulation S-T, this interactive data file is deemed not filed or part of a registration statement or prospectus for purposes of Sections 11 or 12 of the Securities Act of 1933, is deemed not filed for purposes of section 18 of the Securities Exchange Act of 1934, and otherwise is not subject to liability under these sections.
45