Attached files
| file | filename |
|---|---|
| 8-K - FORM 8-K - Quotient Technology Inc. | v423727_8k.htm |
| EX-99.1 - EXHIBIT 99.1 - Quotient Technology Inc. | v423727_ex99-1.htm |
Exhibit 99.2

1

©2015 Quotient Technology Inc. Q3 FY2015 Earnings Call Investor Presentation November 4, 2015

©2015 Quotient Technology Inc. This presentation and the accompanying oral presentation contain “forward - looking” statements that are based on our management’s beliefs and assumptions and on information currently available to management, including Quotient’s projected fourth quarter and full year 2015 results, its plans, including produ ct launches, strategy, and business outlook, the Company's expectations for the continued accelerating shift to the Retailer iQ digital platform, Quotient’s expectations regarding implementing the Retailer iQ platform with other retailer partners, including increased consumer coupon and mobile growth, Quotient’s expectations regarding increased media sale opportunities, and increased operating leverage, and Quotient’s expectations regarding future adoption from Retailer iQ , Quotient’s expectations about having additional Retailer IQ’s customers go live in the future, Quotient’s expectations regarding digital growth and Quotient’s expectations regarding the impact of mobile growth on the platform. Quotient operates in very competiti ve and rapidly changing environments, and new risks may emerge from time to time. It is not possible for Quotient’s management to predict all risks, nor can it assess the impact o f all factors on our business or the extent to which any factor, or combination of factors, may cause actual results to differ materially from those contained in any forward - looking statements Quo tient may make. Forward - looking statements should not be read as guarantees of future performance or results, and will not necessarily be accurate indications of the times at, or by, wh ich such performance or results will be achieved. Forward - looking statements are based on information available to Quotient’s management at the date of this release and its management ’s good faith belief as of such date with respect to future events, and are subject to risks and uncertainties that could cause actual performance or results to differ materially from t hos e expressed in or suggested by the forward - looking statements. Important factors that could cause such differences include, but are not limited to, possible accounting adjustments made in the process of finalizing reported financial results; Quotient’s financial performance, including its revenues, margins, costs, expenditures, growth rates and operating expenses, and its abi lit y to generate positive cash flow and become profitable; the amount and timing of digital promotions by CPGs, which are affected by budget cycles, economic conditions and other factors; the Company’s ability to adapt to changing market conditions; the Company’s ability to retain and expand its business with existing CPGs and retailers; the Company’s ability to negotiate fee arrangements with CPGs and retailers; the Company’s ability to maintain and expand the use by consumers of digital promotions on its platforms; the Company’s ability to attract and reta in third - party advertising agencies, performance marketing networks and other intermediaries; the Company’s ability to effectively manage its growth; the effects of increased competiti on in the Company’s markets and its ability to compete effectively; the Company’s ability to effectively grow and train its sales team; the Company’s ability to obtain new CPGs and re tailers and to do so efficiently; the Company’s ability to maintain, protect and enhance its brand and intellectual property; costs associated with defending intellectual property infr ing ement and other claims; the Company’s ability to successfully enter new markets; the Company’s ability to acquire and integrate new companies; the Company’s ability to develop and launch new services and features; the Company’s ability to attract and retain qualified employees and key personnel; the Company’s ability to successfully integrate acquired companies into its business. These factors, together with those described in greater detail in the Company’s annual report on Form 10 - K filed with the SEC on March 19, 2015, the Company’s quarterly reports on Form 10 - Q filed on May 14, 2015 and August 13, 2015 and in the Company’s future quarterly reports on Form 10 - Q, annual reports on Form 10 - K and other filings made with the SEC , may cause our actual results, performance or achievements to differ materially and adversely from those anticipated or implied by our forward - looking statements. Quotient di sclaims any obligation to update information contained in these forward - looking statements whether as a result of new information, future events, or otherwise. In addition to the U.S. GAAP financials, this presentation includes certain non - GAAP financial measures. The non - GAAP measures have limitations as analytical tools and you should not consider them in isolation or as a substitute for an analysis of our results under U.S. GAAP. There are a number of limitations related to the use of these non - GAAP financial measures versus their nearest GAAP equivalents. For example, other companies may calculate non - GAAP financial measures differently or may use other measures to evaluate their performance, all of which could reduce the usefulness of our non - GAAP financial measures as tools for comparison. Quotient considers these non - G AAP financial measures to be important because they provide useful measures of the operating performance of the company, exclusive of unusual events or factors that do not direc tly affect what we consider to be our core operating performance, and are used by the company's management for that purpose. The use of non - GAAP measures is further discussed in th e accompanying press release, which has been furnished to the SEC on Form 8 - K and posted on Quotient’s website. The press release also defines our non - GAAP financial measu res. A reconciliation between GAAP and non - GAAP measures can also be found in the accompanying press release and in the Appendix hereto. Forward - Looking Statements 3

©2015 Quotient Technology Inc. 4 Steven Boal CEO

©2015 Quotient Technology Inc. US Mothers Depend on Smartphones Throughout Shopping Process eMarketer http:// www.emarketer.com / article.aspx?R =1013187&RewroteTitle=1&ecid=NL1001 More moms are relying on mobile when it comes to shopping - related activities this year vs. last year Behaviors like visiting a retailer’s site, redeeming a mobile coupon and reading product reviews have increased Using a retailer’s app, in particular, has grown by 9 percentage points in 2015 vs. 2014 U.S. mothers’ ownership of smartphones has grown from 9% in 2009 to 84% in 2015 5

©2015 Quotient Technology Inc. Shopmium Shopmium is a mobile receipt scanning and cash - back app platform Expands our reach through mobile, in the U.S and internationally Leverages our large sales force and deep relationships with CPGs and retailers E nhances our capabilities in data, personalization, targeted media and promotions 6

©2015 Quotient Technology Inc. Personalized digital circular experience, with integrated offers and media Retailers spend 60% - 70% of their marketing budget on printed ads Digital Circular Expands Opportunity 7

©2015 Quotient Technology Inc. Retailers Leveraging Coupons.com Shoppers Shoppers can now download paperless offers directly to their retailer account from Coupons.com app 8
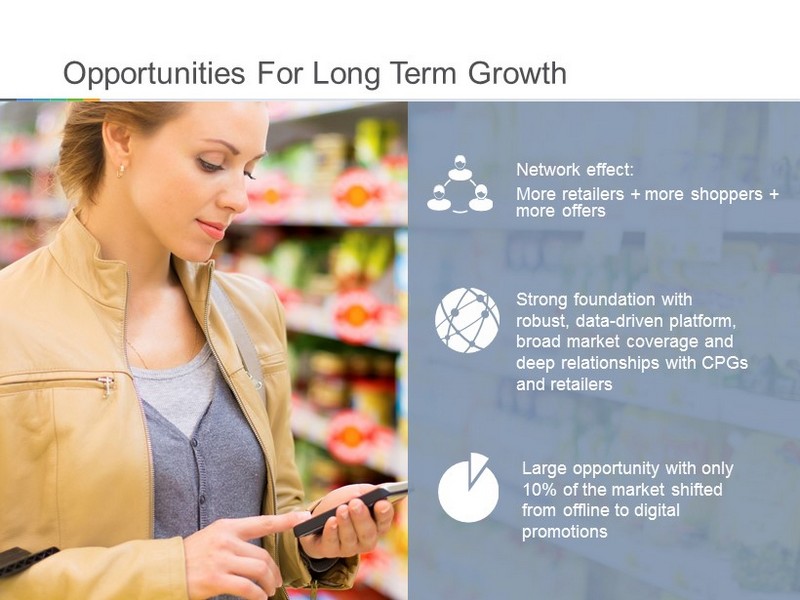
©2015 Quotient Technology Inc. Network effect: More retailers + more shoppers + more offers Strong foundation with robust, data - driven platform, broad market coverage and deep relationships with CPGs and retailers Large opportunity with only 10% of the market shifted from offline to digital promotions Opportunities For Long Term Growth

©2015 Quotient Technology Inc. 10 Jennifer Ceran CFO

©2015 Quotient Technology Inc. Q3 FY2015 Financial Summary 11 • Revenue was $56.5 million • Up 1% sequentially and down 4% YoY primarily due to softness in digital print, partially offset by strength in digital paperless • Total transactions were 403 million • Up 8% sequentially, driven by both digital print and digital paperless • Adjusted EBITDA was $2.2 million, reflecting softness in revenue and an uptick in operating expenses for headcount and brand marketing and media • Re - paid $7.5 million in outstanding debt and re - purchased $6.8 million in stock, ending Q3 with a cash balance of $190 million

©2015 Quotient Technology Inc. Revenue 12 Revenue $58.5 $60.0 $55.6 $55.9 $56.5 QoQ 13% 2% - 7% 1% 1% YoY 47% 14% 8% 8% - 4% $44.2 $45.9 $42.5 $ 40.9 $41.7 $ 14.3 $14.1 $13.1 $15.0 $ 14.8 Q3 FY14 Q4 FY14 Q1 FY15 Q2 FY15 Q3 FY15 Promotions Media Millions

©2015 Quotient Technology Inc. Transactions 13 440 377 413 372 403 Q3 FY14 Q4 FY14 Q1 FY15 Q2 FY15 Q3 FY15 Digital Print Digital Paperless QoQ 15% - 14% 10% - 10% 8% YoY 41% 1% 1% - 3% - 8% • QoQ growth driven by 7% increase in digital print and 10% increase in digital paperless • Retailer iQ transactions up 44% QoQ • YoY decline of 28% in digital print driven by ongoing shift to mobile, while digital paperless was up 26% • Average revenue per promotion transaction in Q3 FY15 was $0.10 Millions A transaction is defined as any action that generates revenue, directly or indirectly, including per item transaction fees, set up fees, volume - based fixed fees, and revenue sharing. Transactions continue to exclude retailer offers that generate no direct revenue.

©2015 Quotient Technology Inc. Retailer iQ R ollout 14 By Retailer Banner Q2 FY15 Q3 FY15 As of Today Implemented Retailer iQ deployed at POS and live at retail stores 9 10 12 Marketing Retailer has begun marketing digital coupon program to build consumer adoption 6 7 7 Implementation delays primarily due to retailers’ POS release schedules for other priorities, such as EMV compliance. Deadline of October 5 is now behind us, and we expect deployments to resume in early 2016

©2015 Quotient Technology Inc. Non - GAAP Gross Margin 15 • Excludes ~0.8% for SBC expense • The decline YoY was driven primarily by revenue softness, while expenses slightly improved Non - GAAP Gross Margin excludes stock - based compensation expense. A reconciliation table for the periods presented can be found i n the Appendix section of this presentation. 61.5% 64.6% 61.5% 61.2% 60.4% Q3 FY14 Q4 FY14 Q1 FY15 Q2 FY15 Q3 FY15

©2015 Quotient Technology Inc. 30% 37% 16% 17% 9% 10% Q3 FY14 Q3 FY15 Q3 Non - GAAP Operating Expenses Non - GAAP Operating Expenses e xcludes stock - based compensation expense and any changes in fair value of contingent consideration. A reconciliation table for the periods presented can be found in the Appendix section of this presentation. 16 Sales & Mktg Research & Dev Gen’l and Admin • YoY increase driven primarily by marketing expense (~4 pts) and headcount (~ 2 pts) • YoY increase driven primarily by engineering headcount • YoY increase driven primarily by headcount and consulting costs $36.0M $31.8M

©2015 Quotient Technology Inc. Adjusted EBITDA Margin 14% 14% 7% 8% 4% • QoQ decline impacted primarily by higher sales & marketing expenses as well as consulting services • Full - time headcount increased 16% YoY to 587 vs 505 a year ago, primarily in India and Ohio Millions $8.1 $8.3 $4.0 $4.6 $2.2 Q3 FY14 Q4 FY14 Q1 FY15 Q2 FY15 Q3 FY15 Note: Adjusted EBITDA, a non - GAAP financial measure, is net l oss adjusted for interest expense, other income (expense) - net, provision for (benefit from) income taxes, depreciation and amortization, change in fair value contingent consideration and stock - based compensation.
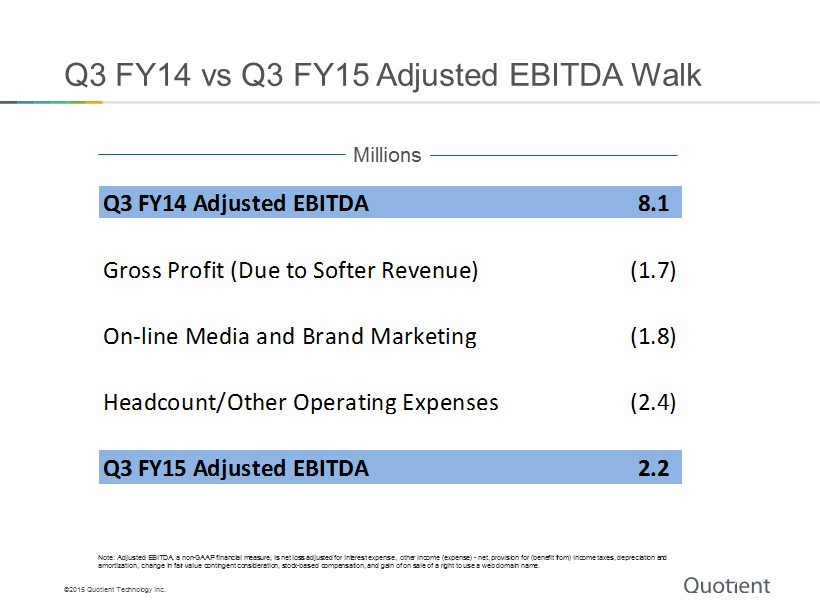
©2015 Quotient Technology Inc. Q3 FY14 vs Q3 FY15 Adjusted EBITDA Walk Millions Q3 FY14 Adjusted EBITDA 8.1 Gross Profit (Due to Softer Revenue) (1.7) On-line Media and Brand Marketing (1.8) Headcount/Other Operating Expenses (2.4) Q3 FY15 Adjusted EBITDA 2.2 Note: Adjusted EBITDA, a non - GAAP financial measure, is net l oss adjusted for interest expense, other income (expense) - net, provision for (benefit from) income taxes, depreciation and amortization, change in fair value contingent consideration and stock - based compensation.

©2015 Quotient Technology Inc. Capital Structure • Bought back over 707K shares for $6.8 million during the quarter for a total of 920K shares for $8.8 million as of September 30 th • As of November 3 rd , we have repurchased over 1.6 million shares for a total of $13.9 million • Repaid $7.5 million in debt and terminated $25 million line of credit on September 30 th

©2015 Quotient Technology Inc. Q4 & Full Year Outlook • Q4 EBITDA includes continued brand marketing and infrastructure investments • Recent acquisition assumes less than $1M of incremental revenue, $500K in transaction costs and business operations to be EBITDA neutral in Q4 Additional Guidance Note: Adjusted EBITDA, a non - GAAP financial measure, is net income (loss) adjusted for interest expense, other income (expense) - net, provision for (benefit from) income taxes, depreciation and amortization, change in fair value contingent consideration and stock - based compensation, and gain on sale of a right to use a web domain name 20 FY2015 Q4 Full Year Low High Low High Revenue (M) $59 $61 $227 $229 YoY Growth -2% 2% 2% 3% Q4 Full Year Adjusted EBITDA (M) $1 $2 $12 $13 Margin 2% 3% 5% 6%

©2015 Quotient Technology Inc. In Summary • Q3 results impacted by weakness in digital print and delays in Retailer iQ launches and marketing, partially offset by strength in digital paperless • With EMV behind us, we expect more Retailer iQ implementations in the new year • Meanwhile, we continue to add new services, such as mobile print and digital - circular, to improve the consumer experience • Continue to lay foundation to connect consumers, brands and retailers in the mobile world

©2015 Quotient Technology Inc. Q&A 22

©2015 Quotient Technology Inc. Appendix 23

©2015 Quotient Technology Inc. Reconciliation of Non - GAAP Gross Margin 24

©2015 Quotient Technology Inc. Reconciliation of Non - GAAP Operating Expense 25

©2015 Quotient Technology Inc. Reconciliation of Net Loss to Adjusted EBITDA 26 Note: Adjusted EBITDA, a non - GAAP financial measure, is net l oss adjusted for interest expense, other income (expense) - net, provision for (benefit from) income taxes, depreciation and amortization, change in fair value contingent consideration and stock - based compensation.