Attached files
| file | filename |
|---|---|
| EX-32.1 - EX-32.1 - Quotient Technology Inc. | coup-ex321_201412318.htm |
| EX-31.1 - EX-31.1 - Quotient Technology Inc. | coup-ex311_201412316.htm |
| EX-31.2 - EX-31.2 - Quotient Technology Inc. | coup-ex312_201412317.htm |
| EX-32.2 - EX-32.2 - Quotient Technology Inc. | coup-ex322_201412319.htm |
| EX-23.1 - EX-23.1 - Quotient Technology Inc. | coup-ex231_20141231731.htm |
| EX-21.1 - EX-21.1 - Quotient Technology Inc. | coup-ex211_20141231272.htm |
| EX-10.15 - EX-10.15 - Quotient Technology Inc. | coup-ex1015_20141231282.htm |
| EXCEL - IDEA: XBRL DOCUMENT - Quotient Technology Inc. | Financial_Report.xls |
UNITED STATES
SECURITIES AND EXCHANGE COMMISSION
Washington, D.C. 20549
FORM 10-K
(Mark One)
|
x |
ANNUAL REPORT PURSUANT TO SECTION 13 OR 15(d) OF THE SECURITIES EXCHANGE ACT OF 1934 |
For the fiscal year ended December 31, 2014
OR
|
¨ |
TRANSITION REPORT PURSUANT TO SECTION 13 OR 15(d) OF THE SECURITIES EXCHANGE ACT OF 1934 |
For the transition period from to
Commission File Number 001-36331
Coupons.com Incorporated
(Exact name of registrant as specified in its Charter)
|
Delaware |
|
77-0485123 |
|
(State or other jurisdiction of incorporation or organization) |
|
(I.R.S. Employer Identification No.) |
|
|
||
|
|
|
|
|
400 Logue Avenue Mountain View, CA |
|
94043 |
|
(Address of principal executive offices) |
|
(Zip Code) |
Registrant’s telephone number, including area code: (650) 605-4600
Securities Registered pursuant to Section 12(b) of the Act:
|
Title of each class |
|
Name of each exchange on which registered |
|
Common Stock, $0.00001 par value per share |
|
New York Stock Exchange |
Indicate by check mark if the registrant is a well-known seasoned issuer, as defined in Rule 405 of the Securities Act. YES ¨ NO x
Indicate by check mark if the registrant is not required to file reports pursuant to Section 13 or 15(d) of the Act. YES ¨ NO x
Indicate by check mark whether the registrant: (1) has filed all reports required to be filed by Section 13 or 15(d) of the Securities Exchange Act of 1934 during the preceding 12 months (or for such shorter period that the registrant was required to file such reports), and (2) has been subject to such filing requirements for the past 90 days. YES x NO ¨
Indicate by check mark whether the registrant has submitted electronically and posted on its corporate Web site, if any, every Interactive Data File required to be submitted and posted pursuant to Rule 405 of Regulation S-T (§232.405 of this chapter) during the preceding 12 months (or for such shorter period that the registrant was required to submit and post such files). YES x NO ¨
Indicate by check mark if disclosure of delinquent filers pursuant to Item 405 of Regulation S-K (§229.405) is not contained herein, and will not be contained, to the best of registrant’s knowledge, in definitive proxy or information statements incorporated by reference in Part III of this Form 10-K or any amendment to this Form 10-K. x
Indicate by check mark whether the registrant is a large accelerated filer, an accelerated filer, a non-accelerated filer, or a smaller reporting company. See the definition of “large accelerated filer”, “accelerated filer”, and “smaller reporting company” in Rule 12b-2 of the Exchange Act. (Check one):
|
Large accelerated filer |
|
¨ |
|
Accelerated filer |
|
¨ |
|
|
|
|
|
|||
|
Non-accelerated filer |
|
x (Do not check if a small reporting company) |
|
Small reporting company |
|
¨ |
Indicate by check mark whether the registrant is a shell company (as defined in Rule 12b-2 of the Exchange Act). YES ¨ NO x
The aggregate market value of the voting and non-voting common equity held by non-affiliates of the registrant, as of June 30, 2014, the last business day of the registrant’s most recently completed second fiscal quarter, based on the closing price of $26.31 per share of the Registrant’s common stock as reported by the New York Stock Exchange on June 30, 2014, was $1,115,954,278.14. Shares of common stock held by each executive officer, director, and their affiliated holders and by each entity or person that, to the Registrant’s knowledge, owned 5% or more of the Registrant’s outstanding common stock as of June 30, 2014, have been excluded in that such persons may be deemed to be affiliates. This determination of affiliate status is not necessarily a conclusive determination for other purposes.
The number of shares of registrant’s Common Stock outstanding as of March 18, 2015 was 82,717,213.
DOCUMENTS INCORPORATED BY REFERENCE
Portions of the registrant’s Definitive Proxy Statement relating to the Annual Meeting of Stockholders are incorporated by reference into Part III of this Annual Report on Form 10-K where indicated. Such definitive Proxy Statement will be filed with the Securities and Exchange Commission within 120 days after the end of the registrant’s fiscal year ended December 31, 2014.
Table of Contents
|
|
|
|
|
Page |
|
PART I |
||||
|
Item 1. |
|
|
|
3 |
|
Item 1A. |
|
|
|
10 |
|
Item 1B. |
|
|
|
30 |
|
Item 2. |
|
|
|
31 |
|
Item 3. |
|
|
|
31 |
|
Item 4. |
|
|
|
31 |
|
|
|
PART II |
|
|
|
Item 5. |
|
|
|
32 |
|
Item 6. |
|
|
|
34 |
|
Item 7. |
|
Management’s Discussion and Analysis of Financial Condition and Results of Operations |
|
35 |
|
Item 7A. |
|
|
|
50 |
|
Item 8. |
|
|
|
51 |
|
Item 9. |
|
Changes in and Disagreements With Accountants on Accounting and Financial Disclosure |
|
79 |
|
Item 9A. |
|
|
|
79 |
|
Item 9B. |
|
|
|
80 |
|
|
|
PART III |
|
|
|
Item 10. |
|
|
|
81 |
|
Item 11. |
|
|
|
81 |
|
Item 12. |
|
Security Ownership of Certain Beneficial Owners and Management and Related Stockholder Matters |
|
81 |
|
Item 13. |
|
Certain Relationships and Related Transactions, and Director Independence |
|
81 |
|
Item 14. |
|
|
|
81 |
|
|
|
PART IV |
|
|
|
Item 15. |
|
|
|
82 |
Unless the context otherwise requires, the terms “Coupons,” “the company,” “we,” “us” and “our” in this Annual Report on Form 10-K refer to Coupons.com Incorporated and its consolidated subsidiaries.
The Coupons logo and our other registered or common law trademarks, service marks or trade names appearing in this Annual Report on Form 10-K are the property of Coupons. Other trademarks and trade names referred to in this Annual Report on Form 10-K are the property of their respective owners.
1
SPECIAL NOTE REGARDING FORWARD‑LOOKING STATEMENTS
This Annual Report on Form 10-K contains forward-looking statements within the meaning of Section 27A of the Securities Act of 1933, as amended (the “Securities Act”) and Section 21E of the Securities Exchange Act of 1934, as amended (the “Exchange Act”). The words “anticipate,” “believe,” “continue,” “could,” “seek,” “might,” “estimate,” “expect,” “intend,” “may,” “plan,” “potential,” “predict,” “approximately,” “project,” “should,” “will,” “would” or the negative or plural of these words or similar expressions, as they relate to our company, business and management, are intended to identify forward-looking statements. Forward-looking statements contained in this Annual Report on Form 10-K include, but are not limited to, statements about:
|
● |
our financial performance, including our revenues, margins, costs, expenditures, growth rates and operating expenses, and our ability to generate positive cash flow and become profitable; |
|
● |
the amount and timing of digital promotions by CPGs, which are affected by budget cycles, economic conditions and other factors; |
|
● |
our ability to adapt to changing market conditions; |
|
● |
our ability to grow and scale Retailer iQ; |
|
● |
our ability to retain and expand our business with existing CPGs and retailers; |
|
● |
our ability to maintain and expand the use by consumers of digital promotions on our platforms; |
|
● |
our ability to attract and retain third-party advertising agencies, performance marketing networks and other intermediaries; |
|
● |
our ability to effectively manage our growth; |
|
● |
the effects of increased competition in our markets and our ability to compete effectively; |
|
● |
our ability to effectively grow and train our sales team; |
|
● |
our ability to obtain new CPGs and retailers and to do so efficiently; |
|
● |
our ability to maintain, protect and enhance our brand and intellectual property; |
|
● |
costs associated with defending intellectual property infringement and other claims; |
|
● |
our ability to successfully enter new markets; |
|
● |
our significant operating leverage in our business; |
|
● |
our ability to develop and launch new services and features; and |
|
● |
our ability to attract and retain qualified employees and key personnel. |
We caution you that the foregoing list may not contain all of the forward-looking statements made in this Annual Report on Form 10-K.
We have based these forward-looking statements on our current expectations and projections about future events and financial trends affecting our business. Forward-looking statements should not be read as guarantees of future performance or results, and will not necessarily be accurate indications of the times at, or by, which such performance or results will be achieved. Forward-looking statements are based on information available to our management at the date of this Annual Report on Form 10-K and our management’s good faith belief as of such date with respect to future events, and are subject to risks and uncertainties that could cause actual performance or results to differ materially from those expressed in or suggested by the forward-looking statements. Forward-looking statements involve known and unknown risks, uncertainties and other factors that may cause our actual results, performance or achievements to be materially different from any future results, performance or achievements expressed or implied by the forward-looking statements. We discuss these risks in greater detail in “Item 1A: Risk Factors” and elsewhere in this Annual Report on Form10-K. Forward-looking statements speak only as of the date of this Annual Report on Form10-K. We caution you that the foregoing list of important factors may not contain all of the material factors that are important to you. Except as required by law, we assume no obligation to publicly update or revise any forward-looking statement to reflect actual results, changes in assumptions based on new information, future events or otherwise. If we update one or more forward-looking statements, no inference should be drawn that we will make additional updates with respect to those or other forward-looking statements. Given these risks and uncertainties, you are cautioned not to place undue reliance on such forward-looking statements.
2
PART I
Overview
We connect great brands and retailers with consumers by delivering digital promotions and media to consumers. Over 2,000 brands from approximately 700 consumer packaged goods companies, or CPGs, and many of the leading grocery, drug, dollar channel and mass merchandise retailers use our digital platform to engage consumers at the critical moments when they are choosing which products they will buy and where they will shop. We deliver digital coupons, including coupon codes, and media and advertising through our platform. Our platform includes our web, mobile and social channels, as well as those of our CPGs and retailers, and our extensive network of approximately 30,000 publishers that display our coupon and media offerings on their websites and mobile applications.
Our platform serves three key constituencies:
|
● |
approximately 700 CPGs representing over 2,000 brands; |
|
● |
retailers operating approximately 61,000 store locations in North America; and |
|
● |
consumers who (i) visit Coupons.com and our other sites, (ii) visit the sites or use the mobile applications of our CPGs, retailers and publishers and, (iii) download our mobile applications. |
The synergy from the combination of our CPGs, retailers, publishers and consumers, all served by our digital promotion and media platform, has resulted in powerful network effects, which we believe to be a significant competitive advantage. Our large and growing base of retailers integrated into our platform has allowed us to attract, retain and grow the digital promotion and media spending of leading CPGs. The breadth of our offerings from these leading brands enables us to attract and retain a growing and more diverse range of retailers, publishers and consumers.
Our CPG customers include many of the leading food, beverage, drug, personal and household product manufacturers. We primarily generate revenue from CPGs through coupons and media offered through our platform and our publisher network. Our retailers include leading grocery, drug, dollar channel and mass market retailers. We also service a broad range of specialty stores, including clothing, electronics, home improvement and many others through which we generate revenue primarily from offering coupon codes through our platform.
We generate promotion revenues from digital transactions on our network. Each time a consumer activates a digital coupon on our platform by either printing it for physical redemption at a retailer or saving it to a retailer loyalty account for automatic digital redemption, we are paid a fee that is not dependent on the digital coupon being redeemed. For coupon codes, we are paid a fee when a consumer makes a purchase using a coupon code from our platform. We pay a distribution fee to retailers and publishers when a consumer activates a digital promotion on their website or mobile app. These distribution fees are included in our cost of revenues. We also generate media revenue through the placement of online advertisements from CPGs and retailers that are displayed on our websites and mobile apps, as well as those of our publishers, retailers, and other third-parties.
Our mobile solutions include our Coupons.com app, apps that we power through the Coupons.com Retailer iQ platform, which we refer to as Retailer iQ, as well as our Grocery iQ app. Our Coupons.com app serves as a companion to the Coupons.com website and allows consumers to access our content from mobile devices. Retailer iQ is a mobile first platform delivering targeted and personalized digital coupons to consumers primarily through retailer web and mobile properties, along with data and analytics to retailers and CPGs. Our Grocery iQ app finds and delivers relevant coupons for consumers based on their saved grocery lists.
During 2014, we generated revenues of $221.8 million, representing 32% growth over 2013, and a net loss of $23.4 million as compared to $11.2 million in 2013. See our Consolidated Financial Statements and accompanying notes for more information.
3
Our Strengths
We are a leading digital promotion and media platform that connects CPGs and retailers with consumers. Our key strengths include:
|
● |
Powerful network effects. The large and growing base of retailers using our platform has allowed us to attract, retain and grow the digital promotion spending of leading CPGs. The breadth of our offerings from these leading brands enables us to attract and retain a growing and more diverse range of retailers, publishers and consumers. Our Retailer iQ platform increases consumer engagement and retailer integration, which enhances the value offered to CPGs. |
|
● |
Deep integration with retailers. Our platform provides promotion content for the web, mobile applications, loyalty rewards and/or point of sale systems of our retail partners. Using our integrated platform, CPGs and retailers can closely coordinate coupon and trade promotion spending to most effectively engage consumers with their products. |
|
● |
Extensive publisher network. Our publisher network multiplies the reach of our platform to consumers and increases the value of our platform to our CPGs and retailers. This network of approximately 30,000 publishers includes many of the top lifestyle, media and specialty sites. We enable these publishers to monetize their web and mobile traffic and drive user engagement by placing coupons or media, served by us, in a wide variety of effective ways. |
|
● |
Secure, proven and proprietary technology for digital coupons. Our technology provides a secure and trusted end-to-end solution. Our technology has proven to meet the complex technical and operational requirements of CPGs and retailers, reflecting the cumulative investments that we have made over the past 16 years. |
|
● |
Proprietary data on consumer behavior from intent to purchase. Because of the scale of our platform and our long operating history, we have significant differentiated data on the associated searches, activations, redemptions, shopping list building and social sharing of coupons. We use the insights from this data to enable highly effective promotions and media by CPGs and retailers, and in turn provide personalized user experiences to consumers on our platform and on our publisher network. |
|
● |
Experienced and specialized sales, integration, campaign management and customer support. We have a team of dedicated specialists with skills and capabilities focused on CPGs, retailers, publishers and consumers. Based on our 16 years of responding, winning and executing against the requests for proposals from the world’s largest CPGs and retailers, we believe that our sales, integration, campaign management and customer support capabilities are difficult to replicate, a key catalyst for the growth of our business. |
|
● |
Attractive Business Model. We have invested in the technology, organization and process capabilities required to operate our business at significantly greater scale. In addition, our platform already serves more than 2,000 brands and many of the retailers that are most important to the CPGs that own those brands. As a result, we believe that there is significant operating leverage in our business. |
Growth Strategy
We intend to grow our platform and our business through the following key strategies:
Increase revenues from CPGs already on our platform. Based on our experience to date, we believe we have opportunities to continue increasing revenues from our existing CPG customer base through:
|
● |
increasing our share of CPG spending on overall coupons and trade promotions; |
|
● |
increasing the number of brands that are using our platform within each CPG; |
|
● |
increase media and advertising spending on our platform; and |
|
● |
maximizing lifetime value of consumers across all products. |
Deepen integration of retailers with our platforms. We believe the value of our platform to CPGs increases as we further integrate with retailers’ systems, as we have begun to do with Retailer iQ. We intend to continue to invest in technologies and product offerings that further integrate digital promotions and media into retailers’ in-store and point of sale systems and other channels so that CPGs and retailers can more effectively engage consumers and drive their own sales.
Grow our current customer base and add new industry segments. We believe we have the opportunity to grow the number of CPGs and retailers that we serve, thereby increasing the value of our platform to all constituents. In addition,
4
we intend to continue growing our business with other manufacturers and retailers in new industry segments such as convenience and specialty/franchise retail, restaurants and entertainment venues.
Continue to grow consumer selection and use of our digital offerings. We plan to continue to innovate and invest in Retailer iQ, mobile solutions and digital promotion offerings for specialty/franchise retail, including coupon codes. We believe that CPG spending on digital promotions and marketing will continue to grow as point of sale, mobile channels and social media offer new opportunities to engage consumers from intent to purchase of their products. We also plan to leverage our reach to consumers and the strength of our platform to broaden the selection and use of coupon codes by consumers.
Grow international operations. Many CPGs and retailers on our platform have global operations and we believe that we can opportunistically grow our operations and offerings in existing international markets and partner with our existing clients to enter new geographies in which they operate.
Selectively pursue strategic acquisitions. We may expand our business through selective acquisitions.
Customers
Our CPG customers include many of the leading food, beverage, drug, personal and household product manufacturers. Our retailers include leading grocery, drug, dollar channel and mass market retailers which distribute and accept our coupons. Our retailers also include a broad range of specialty stores, including clothing, electronics, home improvement and many others which offer coupon codes through our platform. For the year ended December 31, 2014, total revenue from The Procter and Gamble Company accounted for more than 10% of our total revenue. No other customer generated revenues for more than 10% of our total revenue for the year ended December 31, 2014. For the years ended December 31, 2013 and December 31, 2012, no single customer represented more than 10% of our total revenue.
Our Platform and Solutions
We offer a comprehensive digital promotion and media platform to connect CPGs and retailers with consumers. Our platform distributes content at scale across multiple channels enabling CPGs and retailers to deliver promotions and media to consumers at the point when they are most engaged and likely to make a purchasing decision. We distribute digital coupons, which includes both coupons and coupon codes. Our digital coupons can be printed and redeemed at any retailer accepting coupons or saved digitally to retailer loyalty accounts for automatic redemption without the presentation of a physical coupon at the point of sale. Our coupon codes are discounts generally offered by retailers that consumers can use in connection with an online or mobile purchase.
Promotional Channels
Our Digital FSI Network. Through our platform, CPGs and retailers are able to reach shoppers on the web and on mobile devices by offering digital coupons and media through our extensive network which includes:
|
● |
the Coupons.com website and our Coupons.com and Grocery iQ mobile applications; |
|
● |
CPG and retailer websites and mobile applications, either hosted by us or hosted by them using our APIs; and |
|
● |
the websites and mobile applications of approximately 30,000 publishers included in our publisher network. |
We have designed and engineered our platform to support personalization and optimization in the delivery of digital coupons and media. We start with demographic and geography based personalization techniques to ensure that consumers see and can easily access the most relevant content. We can also personalize content based on which offers the consumer has clicked on and what searches the consumer may conduct on our network as well as the coupons that the consumer previously activated by printing or loading to their loyalty cards and redeeming. In addition, our Grocery iQ mobile application delivers personalized coupons based on a consumer’s grocery list.
Retailer iQ. Retailer iQ allows retailers to integrate our digital promotions with their loyalty programs and point of sale systems. Retailer iQ brings personalization to help retailers and brands drive loyalty and engagement with their customers. By integrating with the retailer point of sale or loyalty system, our solution manages the entire flow of digital couponing including: creation, issuance, activation, redemption, validation and clearing. In order to optimize personalization, Retailer iQ leverages data that is available across various touch points – including web, mobile and customer channels such as email. The platform also provides real-time recommendations of coupons and products, real-
5
time reporting, sophisticated targeting and analytics, and a digital receipt platform that helps retailers and brands maintain communication channels with their shoppers. We have entered into agreements with 9 retail partners serving a total of 18 retail brand names.
Mobile. Our mobile solutions are designed to create a multi-channel consumer shopper experience to drive consumer adoption and engagement across our platform. For example, our Retailer iQ platform powers retailer mobile applications and websites to enable consumers to download coupons, create shopping lists, and search for offers while on the go. CPGs can target Retailer iQ consumers to personalize brand engagement or provide brand information. In addition, our Grocery iQ mobile application is a leading grocery shopping list application that automatically finds relevant coupon offers for consumers based on their grocery lists. Our Coupons.com mobile application allows consumers to access our printable digital coupons and coupon codes, and is designed to provide personalized and location-based content.
Publishing Tools
Our platform includes numerous tools we and our CPGs, retailers and publishers use to enhance the effectiveness of their promotions and ability to monetize the use of our platform.
Brandcaster. Our Brandcaster technology powers our affiliate program by enabling third-party publishers to easily display our promotions and media to visitors on their sites. Brandcaster’s easy-to-use self-service platform allows publishers to produce a look and feel customized to their brand and earn revenues for the coupons that are activated on their site.
CLIP. Our Content Layout and Integration Platform, or CLIP, is a set of proprietary web services designed for publishers who want greater control and flexibility managing the presentation and application flow of coupons and content in their own website environment. CLIP provides more customization options than our Brandcaster program, and is designed to provide greater flexibility in developing rich and seamless user experiences that meet the growing needs of publisher web sites. We generally provide additional consulting and implementation services for publishers who use CLIP.
Emails. We send emails to consumers, including registered users on our Coupons.com site, including coupon offers that can be customized based upon the user’s interaction with our site.
Social. We enable CPGs to distribute coupons on their Facebook fan pages in a seamless and fully customizable solution through an API on our platform. They then can manage the look and feel of the experience for consumers. Typically, CPGs will use coupons as an incentive for consumers to “like” their Facebook pages and brands and our application handles the process and tracking.
Bricks. Our Bricks services include coupons that operate just like the digital coupons that we distribute on Coupons.com and our Digital FSI network, but the CPG is responsible for setting up and driving distribution. For example, our Bricks service may enable a CPG to make available a specific coupon on their website. CPGs are able to leverage our technology to facilitate the printing and tracking of coupons in a secure manner, but the CPG distributes the coupon through its own distribution process such as an email campaign or as part of a special promotion on their site.
Media
We offer media and advertising solutions through our platform which provides CPGs and retailers access to an attractive target audience and complements their digital promotion activities. Furthermore, we allow CPGs and retailers to take advantage of special promotional opportunities to highlight their brands including special media and advertising placements on the site, promoted positions within our coupon galleries and premium placement in our marketing efforts.
We use the data flowing through our platform to understand shopper behavior and intent and use those insights for advertising targeting and analytics. Our data processing systems are able to provide consumer intent to various advertising networks and extend our reach, which effectively increases advertising sales. We can reach users through web, mobile and social channels. For example, we can target consumers on Facebook who have used a particular category of coupon with advertising for that category of product. The quality and real-time nature of our data network enables us to offer campaigns that exceed our clients’ expectations, even as the number of their promotions increases. As our platform and network and audience grows, the value of our data and analytics increases.
6
Security
Our platform includes a proprietary digital distribution management system to enable CPGs and retailers to securely control the number of coupons distributed by device. Consumers must download and install our Coupon Printer software on their device in order to print coupons which allows us to limit the number of coupons printed. Similar controls are in place for downloading coupons to loyalty cards and other paperless solutions. Each printed coupon carries a unique ID that is encrypted, enabling each coupon to be traced from print to redemption. All of our coupons can be authenticated and validated using this unique code. This unique ID also can be used to detect counterfeit or altered coupons. Our platform allows us to systematically identify and respond to fraudulent and prohibited activities by restricting a device from printing coupons.
Sales and Marketing
We have a team of dedicated, skilled specialists focused on CPGs and retailers. Based on our 16 years of execution for some of the world’s largest CPGs and retailers, we believe that our sales, integration, promotions management and customer support capabilities are difficult to replicate and a key reason for the growth of our business. Much of our sales activity is focused on expanding the number of brands within our existing CPG customers that offer digital promotions and media through our platform as well as expanding the volume of offers made by the brands currently using our platform. In addition to seeking new CPG and retailer customers, we are focused on continuing to increase the size and breadth of our publisher network. We are also seeking to partner with CPGs and other manufacturers and retailers in new industry segments such as convenience and specialty/franchise retail, restaurants and entertainment venues.
In addition to sales support during the campaign planning process, our sales representatives provide additional support to CPGs and retailers to ensure that their campaigns are launched and delivered within specified timeframes. Representatives assigned to specific customers review performance metrics and share feedback with the advertiser.
We are focused on managing our brand, increasing market awareness and generating new advertiser leads. In doing so, we often present at industry conferences, create custom events and invest in public relations. In addition, our marketing team advertises online, in print and in other forms of media, creates case studies, sponsors research, publishes marketing collateral and undertakes customer research studies.
Technology and Infrastructure
Since inception, we have made significant investments and will continue to invest in developing our differentiated and proprietary solution, aimed at solving the problems of CPGs and retailers in ways that traditional solutions cannot. We are focused on offering a solution that provides measurable results. We have assembled a team of highly skilled engineers and computer scientists with deep expertise across a broad range of relevant disciplines. Key focus areas of our engineering team include:
|
● |
Scalable infrastructure. We use a combination of proprietary and open-source software to achieve a horizontally scalable, global, distributed and fault-tolerant architecture, with the goal of enabling us to ensure the continuity of our business, regardless of local disruptions. Our computational infrastructure currently processes millions of events per day and is designed in a way that enables us to add significant capacity to our platform as we scale our business without requiring any material design or architecture modifications. Our private cloud technology infrastructure is hosted across four data centers in co-location facilities in California, Nevada, and Virginia. Two data centers support our current platform and two data centers support Retailer iQ. |
|
● |
Redundancy. Our production infrastructure utilizes a hot failover configuration which allows us to switch server loads, be it a single server or an entire data center, to the other data center within minutes. Data is constantly replicated between sites, and multiple copies at each site provide fast recovery whenever it is requested. Each data center has been designed to handle more than our entire server needs, which enables us to perform platform maintenance, business resumption and disaster recovery without any customer impact. |
|
● |
Reporting. Based on the latest technologies, our user interface provides flexible reporting and interactive visualization of the key drivers of success for each media campaign. We use these reporting and visualization products internally to manage campaigns and provide advertisers with campaign insights. |
|
● |
Security. Our security policy adheres to established policies to ensure that all data, code, and production infrastructure are secure and protected. Our data centers are SSAE 16 Type II certified and we are PCI DSS compliant where required. We use our internal team and third parties to test, audit, and review our entire production environment to protect it. |
7
Our research and development expenses were $49.6 million, $40.1 million and $40.2 million during 2014, 2013 and 2012, respectively. We capitalized internal-use software development costs of $3.6 million, $6.8 million and $16.3 million during 2014, 2013, and 2012, respectively.
Competition
We compete against a variety of different businesses with respect to different aspects of our business, including:
|
● |
traditional offline coupon and discount services, as well as newspapers, magazines and other traditional media companies that provide coupon promotions and discounts on products and services in free standing inserts or other forms, including Valassis Interactive, Inc., News America Marketing Interactive, Inc. and Catalina Marketing Corporation; |
|
● |
providers of digital coupons such as Valassis’ Redplum.com, Catalina Marketing Corporation’s Cellfire and News America Marketing’s SmartSource, companies that offer coupon codes such as RetailMeNot, Inc., Exponential Interactive Inc.’s TechBargains, Savings.com, Inc. and Ebates Performance Marketing, Inc., and companies providing other e-commerce based services that allow consumers to obtain direct or indirect discounts on purchases; |
|
● |
internet sites that are focused on specific communities or interests that offer coupons or discount arrangements related to such communities or interests; |
|
● |
companies offering online and marketing services to retailers and CPGs, such as MyWebGrocer, Inc. and Wishabi Inc.; and |
|
● |
companies offering media services, such as Triad Media Inc. and RichRelevance, Inc. |
We believe the principal factors that generally determine a company’s competitive advantage in our market include the following:
|
● |
scale and effectiveness of reach in connecting CPGs and retailers to consumers in a digital manner, through web, mobile and other online properties; |
|
● |
ability to attract consumers to use digital coupons delivered by it; |
|
● |
platform security, scalability, reliability and availability; |
|
● |
number of channels by which a company engages with consumers; |
|
● |
integration of products and solutions; |
|
● |
rapid deployment of products and services for customers; |
|
● |
breadth, quality and relevance of the company’s digital coupons; |
|
● |
ability to deliver digital coupons that are widely available and easy to use in consumers’ preferred form; |
|
● |
integration with retailer applications; |
|
● |
brand recognition; |
|
● |
quality of tools, reporting and analytics for planning, development and optimization of promotions; and |
|
● |
breadth and expertise of the company’s sales organization. |
While we believe we compete effectively with respect to the factors identified above, we may face increasing competition from larger or more established companies that seek to enter our market or from smaller companies that launch new products and services that we do not offer and that could gain market acceptance.
Culture and Employees
We are proud of our company culture and consider it to be one of our competitive strengths. Our culture helps drive our business and compete for talented employees in a highly competitive market. We seek to offer an environment that allows our employees to thrive and grow. We are proud to have been named one of the Top Work Places in the Bay Area for 2012, 2013 and 2014 by the Bay Area News Group.
As of December 31, 2014, we had 552 full-time employees, consisting of 502 employees in the United States and 50 employees internationally.
8
Intellectual Property
We rely on federal, state, common law and international rights, as well as contractual restrictions, to protect our intellectual property. We control access to our proprietary technology and algorithms by entering into confidentiality and invention assignment agreements with our employees and contractors, and confidentiality agreements with third parties.
In addition to these contractual arrangements, we also rely on a combination of trade secrets, copyrights, trademarks, service marks and domain names to protect our intellectual property. We pursue the registration of our copyrights, trademarks, service marks and domain names in the United States and in certain locations outside the United States. As of December 31, 2014, we hold or have exclusive rights to 19 issued patents in the United States and nine patents that have been issued outside of the United States with terms expiring between 2016 and 2031. Additionally, we have 47 patent applications pending in the United States and as well as additional patent applications pending in Europe and other international jurisdictions.
Circumstances outside our control could pose a threat to our intellectual property rights. For example, effective intellectual property protection may not be available in the United States or other countries in which we operate. Also, the efforts we have taken to protect our proprietary rights may not be sufficient or effective. Any significant impairment of our intellectual property rights could harm our business or our ability to compete. Also, protecting our intellectual property rights is costly and time- consuming. Any unauthorized disclosure or use of our intellectual property could make it more expensive to do business and harm our operating results.
Companies in Internet-related industries may own large numbers of patents, copyrights and trademarks and may frequently request license agreements, threaten litigation or file suit against us based on allegations of infringement or other violations of intellectual property rights. We have been subject to in the past, and expect to face in the future, allegations that we have infringed the trademarks, copyrights, patents and other intellectual property rights of third parties, including our competitors and non-practicing entities. As we face increasing competition and as our business grows, we will likely face more claims of infringement.
Corporate Information
We were incorporated in California in May 1998 and reincorporated in Delaware in June 2009. Our principal executive offices are located at 400 Logue Avenue, Mountain View, California 94043, and our telephone number is (650) 605-4600. Our corporate website address is www.couponsinc.com. Information contained on, or that can be accessed through, our website does not constitute part of this report and inclusions of our website address in this report are inactive textual references only. The Coupons logo and our other registered or common law trademarks, service marks or trade names appearing in this prospectus are the property of Coupons. Other trademarks and trade names referred to in this prospectus are the property of their respective owners.
Available Information
We file annual, quarterly and other reports, proxy statements and other information with the Securities and Exchange Commission (SEC) under the Exchange Act. We also make available, free of charge on the investor relations portion of our website at investors.couponsinc.com, our annual report on Form 10-K, quarterly reports on Form 10-Q, current reports on Form 8-K, and amendments to those reports filed or furnished pursuant to Section 13(a) or 15(d) of the Exchange Act as soon as reasonably practicable after they are filed electronically with the SEC. You can inspect and copy our reports, proxy statements and other information filed with the SEC at the offices of the SEC’s Public Reference Room located at 100 F Street, NE, Washington D.C. 20549. Please call the SEC at 1-800-SEC-0330 for further information on the operation of Public Reference Rooms. The SEC also maintains an Internet website at http://www.sec.gov/ where you can obtain most of our SEC filings. You can also obtain paper copies of these reports, without charge, by contacting Investor Relations at (650) 605-4600 (option 7).
9
Our operations and financial results are subject to various risks and uncertainties, including those described below, which could adversely affect our business, results of operations, cash flows, financial conditions, and the trading price of our common stock.
Risks Related to Our Business
We have incurred net losses since inception and we may not be able to generate sufficient revenues to achieve or subsequently maintain profitability.
We have incurred net losses of $23.4 million, $11.2 million and $59.2 million in 2014, 2013 and 2012, respectively. We had an accumulated deficit of $192.2 million as of December 31, 2014. We anticipate that our costs and expenses will increase in the foreseeable future as we continue to invest in:
|
● |
sales and marketing; |
|
● |
research and development, including new product development; |
|
● |
our technology infrastructure; |
|
● |
general administration, including legal and accounting expenses related to our growth and continued expenses with respect to being a public company; |
|
● |
efforts to expand into new markets; and |
|
● |
strategic opportunities, including commercial relationships and acquisitions. |
For example, we have incurred and expect to continue to incur expenses developing, improving, integrating and maintaining Retailer iQ, which we launched in the early part of 2014. These efforts may prove more expensive than we currently anticipate, and we may not succeed in increasing our revenues sufficiently to offset these expenses. If we are unable to gain efficiencies in our operating costs, our business could be adversely impacted. We cannot be certain that we will be able to attain or maintain profitability on a quarterly or annual basis. If we are unable to effectively manage these risks and difficulties as we encounter them, our business, financial condition and results of operations may suffer.
We may not maintain our recent revenue growth.
We may not be able to maintain our rate of revenue growth, and we may not be able to generate sufficient revenues to achieve profitability. In addition, historically the growth rate of our business, and as a result, our revenue growth, has varied from quarter-to-quarter and year-to-year, and we expect that variability to continue. For example, our revenue growth was adversely affected in the first half of 2012 because as we scaled our technology infrastructure to support our growth, our technology for securely identifying unique users and devices inadvertently prevented our personalization algorithms from optimally displaying our digital coupons to consumers. In addition, our revenues may fluctuate due to changes in promotional spending budgets of CPGs and retailers and the timing of their promotional spending and we may not always be able to anticipate such fluctuations. For example, our revenue growth was adversely affected in the fourth quarter of 2014 when a few large CPGs did not repeat holiday campaigns that they ran in December 2013 or moved campaigns from Q4 2014 to Q3 2014. Decisions by major CPGs or retailers to delay or reduce their promotional spending or divert spending away from digital promotions, or changes in our fee arrangements with CPGs and retailers, could slow our revenue growth or reduce our revenues. For example, if our arrangements with CPGs required us to receive fees upon the actual redemption of digital coupons on our platform rather than activation as is currently done, our revenue growth and revenues could be harmed. We believe that our continued revenue growth will depend on increasing the number of transactions on our platform, including on Retailer iQ, and, in particular, on our ability to:
|
● |
increase our share of CPG spending on overall coupon and trade promotions, increase the number of brands that are using our platform within each CPG, increase media and advertising spending on our platform, increase our share of retailer spending on coupon codes and maximize the lifetime value of our consumers across all of our products; |
|
● |
further integrate our digital promotions and media solutions into retailers’ in-store and point of sale systems and consumer channels; |
|
● |
grow the number of CPGs and retailers in our current customer base and add new industry segments such as convenience, specialty/franchise retail, restaurants and entertainment; |
|
● |
expand the use by consumers of our newest digital promotion and media offerings and broaden the selection and use of digital coupons; |
10
|
● |
obtain high quality coupons and increase the number of CPG-authorized activations; |
|
● |
expand the number, variety and relevance of digital coupons available on our web, mobile and social channels, as well as those of our CPGs, retailers and network of publishers; |
|
● |
increase the awareness of our brand and earn and preserve our reputation; |
|
● |
hire, integrate and retain talented personnel; |
|
● |
effectively manage growth in our personnel and operations; and |
|
● |
successfully compete with existing and new competitors. |
However, we cannot assure you that we will successfully implement any of these actions. Failure to do so could harm our business and cause our operating results to suffer.
If we are unable to successfully respond to changes in the digital promotions market and continue to grow the market, our business could be harmed.
As consumer demand for digital coupons has increased, promotion spending has shifted from traditional coupons through traditional channels, such as newspapers and direct mail, to digital coupons. However, it is difficult to predict whether the pace of transition from traditional to digital coupons will continue at the same rate and whether the growth of the digital promotions market will continue. In order to expand our business, we must appeal to and attract consumers who historically have used traditional promotions to purchase goods or may prefer alternatives to our offerings, such as those of our competitors. If the demand for digital coupons does not continue to grow as we expect, or if we fail to successfully address this demand, our business will be harmed. For example, the continued growth of our revenues will require increasing the number of brands that are using our platform within each CPG and further integrating such digital promotions with Retailer iQ. If our projections regarding the adoption and usage of Retailer iQ by retailers, CPGs and consumers, does not occur in the second half of fiscal 2015 or is slower than expected, our business, financial condition, results of operations and prospects will be harmed. A variety of factors could slow the adoption of Retailer iQ on this timeline and generally, including insufficient time, resources or funds committed by retailers to the implementation and promotion of Retailer iQ, a retailer’s decision to delay or forego launching Retailer iQ, our inability to monetize enhanced Retailer iQ functionality, and our inability to efficiently integrate Retailer iQ with a retailer’s system. We expect that the market will evolve in ways which may be difficult to predict. It is also possible that digital coupon offerings generally could lose favor with CPGs, retailers or consumers. In the event of these or any other changes to the market, our continued success will depend on our ability to successfully adjust our strategy to meet the changing market dynamics. In addition, we will need to continue to grow demand for our digital promotions platform by CPGs, retailers and consumers. If we are unable to grow or successfully respond to changes in the digital promotions market, our business could be harmed and our results of operations could be negatively impacted.
We expect a number of factors to cause our operating results to fluctuate on a quarterly and annual basis, which may make it difficult to predict our future performance.
Historically, our revenue growth has varied from quarter-to-quarter and year-to-year, and we expect that variability to continue. In addition, our operating costs and expenses have fluctuated in the past, and we anticipate that our costs and expenses will increase over time as we continue to invest in growing our business and incur additional costs of being a public company.
Our operating results could vary significantly from quarter-to-quarter and year-to-year as a result of these and other factors, many of which are outside of our control, and as a result we have a limited ability to forecast the amount of future revenues and expenses, which may adversely affect our ability to predict financial results accurately, and our operating results may vary from quarter-to-quarter and may fall below our estimates or the expectations of public market analysts and investors. Fluctuations in our quarterly operating results may lead analysts to change their long-term models for valuing our common stock, cause us to face short-term liquidity issues, impact our ability to retain or attract key personnel or cause other unanticipated issues, all of which could cause our stock price to decline. As a result of the potential variations in our quarterly revenues and operating results, we believe that quarter-to-quarter comparisons of our revenues and operating results may not be meaningful and the results of any one quarter or historical patterns should not be considered indicative of our future sales activity, expenditure levels or performance.
11
In addition to other factors discussed in this section, factors that may contribute to the variability of our quarterly and annual results include:
|
● |
our ability to continue to grow our revenues by increasing our share of CPG spending and the number of brands using our platform, including Retailer iQ, within each CPG, increasing media and advertising spending on our platform, further integrating with our retailers and increasing the use of retailer coupon codes by consumers, adding new CPGs and retailers to our network and growing our core current customer base and expanding into new industry segments such as convenience, specialty/franchise retail, restaurants and entertainment; |
|
● |
our ability to successfully respond to changes in the digital promotions and media market and continue to grow the market and demand for our platform; |
|
● |
our ability to grow consumer selection and use of our digital promotion offerings and attract new consumers to our platform; |
|
● |
the amount and timing of digital promotions and marketing campaigns by CPGs, which are affected by budget cycles, economic conditions, seasonality and other factors; |
|
● |
the impact of global business or macroeconomic conditions, including the resulting effects on the level of coupon and trade promotion spending by CPGs and spending by consumers; |
|
● |
the impact of competitors or competitive products and services, and our ability to compete in the digital promotions market; |
|
● |
our ability to obtain high quality coupons and increase the number of CPG-authorized activations; |
|
● |
changes in consumer behavior with respect to digital promotions and how consumers access digital coupons and our ability to develop applications that are widely accepted and generate revenues; |
|
● |
the costs of investing in and maintaining and enhancing our technology infrastructure; |
|
● |
the costs of developing new products and solutions and enhancements to our platform; |
|
● |
our ability to manage our growth; |
|
● |
the success of our sales and marketing efforts; |
|
● |
government regulation of e-commerce and m-commerce and requirements to comply with security and privacy laws and regulations affecting our business, and changes in government regulation affecting our business or our becoming subject to new government regulation; |
|
● |
our ability to deal effectively with fraudulent transactions or customer disputes; |
|
● |
the attraction and retention of qualified employees and key personnel; |
|
● |
the effectiveness of our internal controls; and |
|
● |
changes in accounting rules, tax laws or interpretations thereof. |
If we fail to attract and retain CPGs, retailers and publishers and expand our relationships with them, our revenues and business will be harmed.
The success of our business depends in part on our ability to increase our share of CPG spending on overall coupons and trade promotions, increase media and advertising spending on our platform, increase the number of brands that are using our platform within each CPG, increase our share of retailer spending on coupon codes, maximize the lifetime value of our consumers across all of our products, and increase adoption and scale of Retailer iQ. It also depends on our ability to further integrate our digital promotions and media solutions into retailers’ in-store and point of sale systems and consumer channels. In addition, we must acquire new CPGs and retailers in our current customer base and add new industry segments such as convenience, specialty/franchise retail, restaurants and entertainment venues. If CPGs and retailers do not find that offering digital promotions and media and advertising on our platform enables them to reach consumers and sufficiently increase sales with the scale and effectiveness that is compelling to them, CPGs and retailers may not increase their distribution of digital promotions on our platform and media, or they may decrease them or stop offering them altogether, and new CPGs and retailers may decide not to use our platform.
For example, if CPGs decide that utilizing our platform provides a less effective means of connecting with consumers, we may not be able to increase our prices or CPGs may pay us less. Likewise if retailers decide that our platform is less effective at increasing sales to and loyalty of existing and new consumers, retailers may demand a higher
12
percentage of the total proceeds from each digital promotion that is activated or demand minimum guaranteed payments. Furthermore, if existing and new retailers using Retailer iQ do not find that it increases consumer engagement and loyalty, our overall success may be harmed. In addition, we expect to face increased competition, and competitors may accept lower payments from CPGs to attract and acquire new CPGs, or provide retailers and publishers a higher distribution fee than we currently offer to attract and acquire new retailers and publishers. In addition, we may experience attrition in our CPGs, retailers and publishers in the ordinary course of business resulting from several factors, including losses to competitors, changes in CPG budgets, and decisions by CPGs, retailers and publishers to offer digital coupons through their own websites or other channels without using a third-party platform such as ours. If we are unable to retain and expand our relationships with existing CPGs, retailers and publishers or if we fail to attract new CPGs, retailers and publishers to the extent sufficient to grow our business, or if too many CPGs, retailers and publishers are unwilling to offer digital coupons with compelling terms through our platform, we may not increase the number of transactions and marketing campaigns on our platform and our revenues, gross margin and operating results will be adversely affected.
If the distribution fees that we pay as a percentage of our revenues increase, our gross profit and business will be harmed.
When we deliver a digital coupon on a retailer’s website or mobile app or through its loyalty program, or the website or mobile app of a publisher, or through our Retailer iQ platform, we pay a distribution fee to the retailer or publisher. Such fees have increased as a percentage of our revenues in recent periods. If such fees as a percentage of our revenues continue to increase, our cost of revenues as a percentage of revenues could increase and our operating results would be adversely affected.
If we fail to maintain and expand the use by consumers of digital coupons on our platform, our revenues and business will be harmed.
We must continue to maintain and expand the use by consumers of digital coupons in order to increase the attractiveness of our platform to CPGs and retailers and to increase revenues and achieve profitability. If consumers do not perceive that we offer a broad selection of personalized and high quality digital coupons, we may not be able to attract or retain consumers on our platform. Further, if there is increased competition for the trade promotions and marketing budgets of CPGs and retailers, the result could be increased pricing pressure. If we are unable to maintain and expand the use by consumers of digital coupons on our platform and do so to a greater extent than our competitors, CPGs may find that offering digital promotions on our platform does not reach consumers with the scale and effectiveness that is compelling to them. Likewise if retailers find that using our platform, including Retailer iQ, does not increase sales of the promoted products and consumer loyalty to the retailer to the extent they expect, then the revenues we generate may not increase to the extent we expect or may decrease. Either of these would adversely affect our operating results.
We depend in part on third-party advertising agencies as intermediaries, and if we fail to maintain these relationships, our business may be harmed.
A portion of our business is conducted indirectly with third-party advertising agencies acting on behalf of CPGs and retailers. Third-party advertising agencies are instrumental in assisting CPGs and retailers to plan and purchase advertising and promotions, and each third-party advertising agency generally allocates advertising and promotion spend from CPGs and retailers across numerous channels. We do not have exclusive relationships with third-party advertising agencies and we depend in part on third-party agencies to work with us as they embark on marketing campaigns for CPGs and retailers. While in most cases we have developed relationships directly with CPGs and retailers, we nevertheless depend in part on third-party advertising agencies to present to their CPG and retailer clients the merits of our platform. Inaccurate descriptions of our platform by third-party advertising agencies, over whom we have no control, negative recommendations regarding use of our service offerings or failure to mention our platform at all could hurt our business. In addition, if a third-party advertising agency is disappointed with our platform on a particular campaign or generally, we risk losing the business of the CPG or retailer for whom the campaign was run, and of other CPGs and retailers represented by that agency. Since many third-party advertising agencies are affiliated with other third-party agencies in a larger corporate structure, if we fail to maintain good relations with one third-party advertising agency in such an organization, we may lose business from the affiliated third-party advertising agencies as well.
Our sales could be adversely impacted by industry changes relating to the use of third-party advertising agencies. For example, if CPGs or retailers seek to bring their campaigns in-house rather than using an agency, we would need to develop direct relationships with the CPGs or retailers, which we might not be able to do and which could increase our sales and marketing expenses. Moreover, to the extent that we do not have a direct relationship with CPGs or retailers, the value we provide to CPGs and retailers may be attributed to the third-party advertising agency rather than to us, further limiting our ability to develop long-term relationships directly with CPG and retailers. CPGs and retailers may move
13
from one third-party advertising agency to another, and we may lose the underlying business. The presence of third-party advertising agencies as intermediaries between us and the CPGs and retailers thus creates a challenge to building our own brand awareness and affinity with the CPGs and retailers that are the ultimate source of our revenues. In addition, third-party advertising agencies conducting business with us may offer their own digital promotion solutions. As such, these third-party advertising agencies are, or may become, our competitors. If they further develop their own capabilities they may be more likely to offer their own solutions to advertisers, and our ability to compete effectively could be significantly compromised and our business, financial condition and operating results could be adversely affected.
The loss of any significant customer could materially and adversely affect our results of operations and financial condition.
Our business is exposed to risks related to customer concentration, particularly among CPGs. For the year ended December 31, 2014, total revenue from The Procter and Gamble Company accounted for more than 10% of our total revenue. No other customer generated revenues for more than 10% of our total revenue for the year ended December 31, 2014. For the years ended December 31, 2013 and December 31, 2012, no single customer represented more than 10% of our total revenue. The loss of any of our significant customers or deterioration in our relations with any of them could materially and adversely affect our results of operations and financial condition.
Competition presents an ongoing threat to the success of our business.
We expect competition in digital promotions to continue to increase. The market for digital promotions is competitive, fragmented and rapidly changing. We compete against a variety of companies with respect to different aspects of our business, including:
|
● |
traditional offline coupon and discount services, as well as newspapers, magazines and other traditional media companies that provide coupon promotions and discounts on products and services in free standing inserts or other forms, including Valassis Interactive, Inc., News America Marketing Interactive, Inc. and Catalina Marketing Corporation; |
|
● |
providers of digital coupons such as Valassis’ Redplum.com, Catalina Marketing Corporation’s Cellfire and News America Marketing’s SmartSource, companies that offer coupon codes such as RetailMeNot, Inc., Exponential Interactive, Inc.’s TechBargains.com, Savings.com, Inc. and Ebates Performance Marketing, Inc., and companies providing other e-commerce based services that allow consumers to obtain direct or indirect discounts on purchases; |
|
● |
Internet sites that are focused on specific communities or interests that offer coupons or discount arrangements related to such communities or interests; |
|
● |
companies offering online and marketing services to retailers and CPGs, such as MyWebGrocer, Inc. and Wishabi Inc. and |
|
● |
companies offering media services, such as Triad Media Inc. and Rich Relevance, Inc. |
We believe the principal factors that generally determine a company’s competitive advantage in our market include the following:
|
● |
scale and effectiveness of reach in connecting CPGs and retailers to consumers in a digital manner, through web, mobile and other online properties; |
|
● |
ability to attract consumers to use digital coupons delivered by it; |
|
● |
platform security, scalability, reliability and availability; |
|
● |
number of channels by which a company engages with consumers; |
|
● |
integration of products and solutions; |
|
● |
rapid deployment of products and services for customers; |
|
● |
breadth, quality and relevance of the company’s digital coupons; |
|
● |
ability to deliver digital coupons that are widely available and easy to use in consumers’ preferred form; |
|
● |
integration with retailer applications and point of sales systems; |
|
● |
brand recognition; |
14
|
● |
quality of tools, reporting and analytics for planning, development and optimization of promotions; and |
|
● |
breadth and expertise of the company’s sales organization. |
We are subject to potential competition from large, well-established companies which have significantly greater financial, marketing and other resources than we do and have current offerings that may compete with our platform or may choose to offer digital promotions as an add-on to their core business on their own or in partnership with one of our competitors that would directly compete with ours. Many of our larger potential competitors may have the resources to significantly change the nature of the digital promotions industry to their advantage, which could materially disadvantage us. For example, Google, Yahoo!, Microsoft and Facebook and online retailers such as Amazon have highly trafficked industry platforms which they could leverage to distribute digital coupons or other digital promotions that could negatively affect our business. In addition, these potential competitors may be able to respond more quickly than we can to new or emerging technologies and changes in consumer habits. These competitors may engage in more extensive research and development efforts, undertake more far-reaching marketing campaigns and adopt more aggressive pricing policies, which may allow them to attract more consumers and, as a result, more CPGs and retailers, or generate revenues more effectively than we do. Our competitors may offer digital coupons that are similar to the digital coupons we offer or that achieve greater market acceptance than those we offer. We are also subject to potential competition from smaller companies that launch new products and services that we do not offer and that could gain market acceptance.
Our success depends on the effectiveness of our platform in connecting CPGs and retailers with consumers and with attracting consumer use of the digital coupons delivered through our platform. To the extent we fail to provide digital coupons for high quality, relevant products, consumers may become dissatisfied with our platform and decide not to use our digital coupons and elect to use the digital coupons distributed by one of our competitors. As a result of these factors, our CPGs and retailers may not receive the benefits they expect, and CPGs may use the offerings of one of our competitors and retailers may elect to handle coupon codes themselves or exclude us from integrating with their in-store and point of sale systems or consumer channels, and our operating results would be adversely affected.
We also face significant competition for trade promotion and marketing spending. We compete against online and mobile businesses, including those referenced above, and traditional advertising outlets, such as television, radio and print, for trade promotion and marketing spending. In order to grow our revenues and improve our operating results, we must increase our share of CPG spending on digital coupons and media relative to traditional sources and relative to our competitors, many of whom are larger companies that offer more traditional and widely accepted media products.
We also directly and indirectly compete with retailers for consumer traffic. Many retailers market and offer their own digital coupons directly to consumers using their own websites, email newsletters and alerts, mobile applications and social media channels. Our retailers could be more successful than we are at marketing their own digital coupons or could decide to terminate their relationship with us.
We may face competition from companies we do not yet know about. If existing or new companies develop, market or offer competitive digital coupon solutions, acquire one of our existing competitors or form a strategic alliance with one of our competitors, our ability to compete effectively could be significantly compromised and our operating results could be harmed.
If we fail to effectively manage our growth, our business and financial performance may suffer.
We have significantly expanded our operations and anticipate expanding further to pursue our growth strategy. Such expansion increases the complexity of our business and places significant demands on our management, operations, technical performance, financial resources and internal control over financial reporting functions. Continued growth could strain our ability to deliver digital coupons on our platform, develop and improve our operational, financial, legal and management controls, and enhance our reporting systems and procedures. For example, our revenue growth was adversely affected in the first half of 2012 because as we scaled our technology infrastructure to support our growth, our technology for securely identifying unique users and devices inadvertently prevented our personalization algorithms from optimally displaying our digital coupons to consumers. Additionally, our revenue growth was adversely affected in the fourth quarter of 2014 when a few large CPGs did not repeat holiday campaigns that they ran in December 2013 or moved campaigns from Q4 2014 to Q3 2014. Failure to manage our expansion may limit our growth, damage our reputation and negatively affect our financial performance and harm our business.
To effectively manage this growth, we will need to continue to improve our operational, financial and management controls, and our reporting systems and procedures. If we do not effectively manage the growth of our business and operations, the quality and scalability of our platform could suffer.
15
Our current and planned personnel, systems, procedures and controls may not be adequate to support and effectively manage our future operations. We may not be able to hire, train, retain, motivate and manage required personnel. As we continue to grow, we must effectively integrate, develop and motivate a large number of new employees. We intend to continue to expand our research and development, sales and marketing, and general and administrative organizations, and over time, expand our international operations. To attract top talent, we have had to offer, and believe we will need to continue to offer, highly competitive compensation packages before we can validate the productivity of those employees. If we fail to effectively manage our hiring needs and successfully integrate our new hires, our efficiency and ability to meet our forecasts and our employee morale, productivity and retention could suffer, and our business and operating results could be adversely affected.
Providing our products and services to our CPGs, retailers and consumers is costly and we expect our expenses to continue to increase in the future as we grow our business with existing and new CPGs and retailers and develop new products and services that require enhancements to our technology infrastructure. In addition, our operating expenses, such as our sales, marketing and engineering expenses are expected to continue to grow to support our anticipated future growth. As a result of the requirements of being a public company we incur significant legal, accounting and other expenses. Our expenses may grow faster than our revenues, and our expenses may be greater than we anticipate. Managing our growth will require significant expenditures and allocation of valuable management resources. If we fail to achieve the necessary level of efficiency in our organization as it grows, our business, operating results and financial condition would be harmed.
If we do not effectively grow and train our sales team, we may be unable to add new CPGs and retailers or increase sales to our existing CPGs and retailers and our business will be adversely affected.
We continue to be substantially dependent on our sales team to obtain new CPGs and retailers and to drive sales from our existing CPGs and retailers. We believe that there is significant competition for sales personnel with the skills and technical knowledge that we require. Our ability to achieve significant revenue growth will depend, in large part, on our success in recruiting, training, integrating and retaining sufficient numbers of sales personnel to support our growth. New hires require significant training and it may take significant time before they achieve full productivity. Our recent hires and planned hires may not become productive as quickly as we expect, and we may be unable to hire or retain sufficient numbers of qualified individuals in the markets where we do business or plan to do business. In addition, if we continue to grow rapidly, a large percentage of our sales team will be new to the company and our solution. If we are unable to hire and train sufficient numbers of effective sales personnel, or the sales personnel are not successful in obtaining new CPGs and retailers or increasing sales to our existing CPGs and retailers, our business will be adversely affected.
Our sales cycle with new CPGs and retailers is long and unpredictable and may require us to incur expenses before executing a customer agreement, which makes it difficult to project when, if at all, we will obtain new CPGs and retailers and when we will generate additional revenues from those customers.
We market our services and products directly to CPGs and retailers. New CPG and retailer relationships typically take time to obtain and finalize. A significant time period may pass between selection of our services and products by key decision-makers and the signing of a contract. The length of time between the initial sales call and the realization of a final contract is difficult to predict. As a result, it is difficult to predict when we will obtain new CPGs and retailers and when performance and delivery of services will be initiated with these potential CPGs and retailers. As part of our sales cycle, we may incur significant expenses before executing a definitive agreement with a prospective CPG or retailer and before we are able to generate any revenues from such agreement. If conditions in the marketplace generally or with a specific prospective CPG or retailer change negatively, it is possible that no definitive agreement will be executed, and we will be unable to recover any expenses incurred before a definitive agreement is executed, which would in turn have an adverse effect on our business, financial condition and results of operations.
Our business depends on our ability to maintain and scale the network infrastructure necessary to operate our platform, including our websites, mobile applications and Retailer iQ platform, and any significant disruption in service could result in a loss of CPGs, retailers and consumers.
We deliver digital coupons via our platform, including over our websites and mobile applications, as well as through those of our CPGs and retailers and our publishers and other third parties. Our reputation and ability to acquire, retain and serve CPGs and retailers, as well as consumers who use digital coupons or view media on our platform are dependent upon the reliable performance of our platform. As the number of our CPG customers, retailers and consumers and the number of digital promotions and information shared through our platform continue to grow, we will need an increasing amount of network capacity and computing power. Our technology infrastructure is hosted across two data centers in co-location facilities in California and Nevada. In addition, we use two other co-location facilities in California and Virginia to
16
host our Retailer iQ platform. We have spent and expect to continue to spend substantial amounts on data centers and equipment and related network infrastructure to handle the traffic on our platform. The operation of these systems is expensive and complex and could result in operational failures. In the event that the number of transactions or the amount of traffic on our platform grows more quickly than anticipated, we may be required to incur significant additional costs. Interruptions in these systems or service disruptions, whether due to system failures, computer viruses or physical or electronic break-ins, could affect the security or availability of our websites and platform, and prevent CPGs, retailers or consumers from accessing our platform. For example, in 2012, as we scaled our technology infrastructure to support our growth, our technology for securely identifying unique users and devices inadvertently prevented our personalization algorithms from optimally displaying our digital coupons to consumers. A substantial portion of our network infrastructure is hosted by third-party providers. Any disruption in these services or any failure of these providers to handle existing or increased traffic could significantly harm our business. Any financial or other difficulties these providers face may adversely affect our business, and we exercise little control over these providers, which increases our vulnerability to problems with the services they provide. If we do not maintain or expand our network infrastructure successfully or if we experience operational failures, we could lose current and potential CPGs and retailers and consumers, which could harm our operating results and financial condition.
The success and scale of Retailer iQ depends, in part, on the level of commitment and support by retailers.
If retailers do not commit sufficient time, resources and funds towards the marketing of their digital promotions and programs on Retailer iQ, the growth and scale of Retailer iQ and its penetration into the consumer market will be adversely affected. Further, the successful implementation of Retailer iQ requires integration with a retailer’s point of sales system, loyalty programs and consumer channels. These integration efforts require time and effort from both the retailer and ourselves, which also involves our working with third-party systems and solutions, some of whom may be our competitors. We may not be able to integrate and launch Retailer iQ with a retailer’s systems in a timely and efficient manner. If we are unable to successfully implement Retailer iQ, or it is not adopted and supported with sufficient resources by retailers, the success and scale of Retailer iQ will be adversely affected and our revenues and business may suffer.
If we are not successful in responding to changes in consumer behavior and do not develop products and solutions that are widely accepted and generate revenues, our results of operations and business could be adversely affected.
The methods by which consumers access digital coupons are varied and evolving. Our platform has been designed to engage consumers at the critical moments when they are choosing the products they will buy and where they will shop. Consumers can select our digital coupons both online through web and mobile and in-store. In order for us to maintain and increase our revenues, we must be a leading provider of digital coupons in each of the forms by which consumers access them. As consumer behavior in accessing digital coupons changes and new distribution channels emerge, if we do not successfully respond and do not develop products or solutions that are widely accepted and generate revenues we may be unable to retain consumers or attract new consumers and as a result, CPGs and retailers, and our business may suffer.
Consumers are increasingly using mobile devices to access our content, and if we are unsuccessful in expanding the capabilities of our digital coupon solutions for our mobile platforms to allow us to generate net revenues as effectively as our website platforms, our net revenues could decline.
Web usage and the consumption of digital content are increasingly shifting to mobile platforms such as smartphones and other connected devices. The growth of our business depends in part on our ability to drive engagement, activation and shopping behavior for our retailers and CPGs through these new mobile channels. Our success on mobile platforms will be dependent on our interoperability with popular mobile operating systems that we do not control, such as Android, iOS and Windows Mobile, and any changes in such systems that degrade our functionality or give preferential treatment to competitive services could adversely affect usage of our services through mobile devices.
Further, to deliver high quality mobile offerings, it is important that our platform integrates with a range of other mobile technologies, systems, networks and standards that we do not control. We may not be successful in developing relationships with key participants in the mobile industry or in developing products that operate effectively with these technologies, systems, networks or standards. If we fail to achieve success with our mobile applications and mobile website, or if we otherwise fail to deliver effective solutions to CPGs and retailers for mobile platforms and other emerging platforms, our ability to monetize these growth opportunities will be constrained, and our business, financial condition and operating results would be adversely affected.
17
If our websites or those of our publishers fail to rank prominently in unpaid search results from search engines like Google, Yahoo! and Bing, traffic to our websites could decline and our business would be adversely affected.
Our success depends in part on our ability to attract consumers through unpaid Internet search results on search engines like Google, Yahoo! and Bing. The number of consumers we attract to our websites from search engines is due in large part to how and where our websites rank in unpaid search results. These rankings can be affected by a number of factors, many of which are not in our direct control, and they may change frequently. For example, a search engine may change its ranking algorithms, methodologies or design layouts. As a result, links to our websites may not be prominent enough to drive traffic to our websites, and we may not know how or otherwise be in a position to influence the results. In some instances, search engine companies may change these rankings in order to promote their own competing products or services or the products or services of one or more of our competitors. Our websites have experienced fluctuations in search result rankings in the past, and we anticipate fluctuations in the future. In addition, websites must comply with search engine guidelines and policies. These guidelines and policies are complex and may change at any time. If we fail to follow such guidelines and policies properly, search engines may rank our content lower in search results or could remove our content altogether from their index. Any reduction in the number of consumers directed to our websites could reduce the effectiveness of our digital promotions for CPGs and retailers and could adversely impact our business and results of operations.
Factors adversely affecting performance marketing programs and our relationships with performance marketing networks, or the termination of these relationships, may adversely affect our ability to attract and retain business and our coupon codes business.
A portion of our business is based upon consumers using coupon codes in connection with the purchase of goods or services. The commissions we earn for coupon codes accessed through our platform are tracked by performance marketing networks. Third-party performance marketing networks provide CPGs and retailers with affiliate tracking links for revenues attributable to publishers and the ability to distribute digital promotions to multiple publishers. When a consumer executes a purchase on a CPG’s, a retailer’s or a publisher’s website as a result of a performance marketing program, most performance marketing conversion tracking tools credit the most recent link or ad clicked by the consumer prior to that purchase. This practice is generally known as “last-click attribution.” We generate revenues through transactions for which we receive last-click attribution. Risks that may adversely affect our performance marketing programs and our relationships with performance marketing networks include the following, some of which are outside our control:
|
● |
we may not be able to adapt to changes in the way in which CPGs and retailers attribute credit to us in their performance marketing programs, whether it be “first-click attribution” or “multichannel attribution,” which applies weighted values to each of a retailer’s advertisements and tracks how each of those advertisements contributed to a purchase, or otherwise; |
|
● |
we may not receive revenue if consumers makes a purchase from their mobile device as many retailers currently do not recognize affiliate tracking links on their mobile-optimized websites or applications, and tracking mechanisms on mobile websites or applications may not function to allow retailers to properly attribute sales to us; |
|
● |
refund rates for products delivered by CPGs and retailers that may be greater than we estimate; |
|
● |
performance marketing networks may not provide accurate and timely reporting on which we rely, we could fail to properly recognize and collect and report revenues and misstate financial reports, projections and budgets and misdirect our advertising, marketing and other operating efforts for a portion of our business; |
|
● |
we primarily rely on a small number of performance marketing networks in non-exclusive arrangements, the loss of which could adversely affect our coupon codes business; |
|
● |
industry changes relating to the use of performance marketing networks could adversely impact our commission revenues; |
|
● |
to the extent performance marketing networks serve as intermediaries between us and CPGs and retailers, it may create challenges to building our own brand awareness and affinity with CPGs and retailers, and the termination of our relationship with the performance marketing networks would terminate our ability to receive payments from CPGs and retailers we service through that network; and |
|
● |
performance marketing networks may compete with us. |
18
If we fail to continue to obtain high quality coupons and sufficient numbers of CPG-authorized activations available through our platform, our revenue growth or our revenues may be harmed.
We generate revenues as consumers select, or activate, a digital coupon through our platform. Our business model depends upon the quality of digital coupons and the specified number of CPG-authorized activations available, which we do not control. CPGs and retailers have a variety of channels through which to promote their products and services. If CPGs and retailers elect to distribute their digital coupons through other channels or not to promote digital coupons at all, or if our competitors are willing to accept lower prices than we are, our ability to obtain high quality digital coupons and sufficient numbers of CPG-authorized activations available on our platform may be impeded and our business, financial condition and operating results will be adversely affected. If we cannot maintain sufficient digital coupons inventory to offer through our platform, consumers may perceive our service as less relevant, consumer traffic to our websites and those of our publishers will decline and, as a result, CPGs and retailers may decrease their use of our platform to deliver digital coupons and our revenue growth or revenues may be harmed.
Our business relies in part on electronic messaging, including emails and SMS text messages, and any technical, legal or other restrictions on the sending of electronic messages or an inability to timely deliver such communications could harm our business.
Our business is in part dependent upon electronic messaging. We provide emails and mobile alerts and other messages to consumers informing them of the digital coupons on our websites, and we believe these communications help generate a significant portion of our revenues. Because electronic messaging services are important to our business, if we are unable to successfully deliver electronic messages to consumers, if there are legal restrictions on delivering these messages to consumers, or if consumers do not or cannot open our messages, our revenues and profitability could be adversely affected. Changes in how webmail applications or other email management tools organize and prioritize email may result in our emails being delivered or routed to a less prominent location in a consumer’s inbox or viewed as “spam” by consumers and may reduce the likelihood of that consumer opening our emails. Actions taken by third parties that block, impose restrictions on or charge for the delivery of electronic messages could also harm our business. From time to time, Internet service providers or other third parties may block bulk email transmissions or otherwise experience technical difficulties that result in our inability to successfully deliver emails or other messages to consumers.
Changes in laws or regulations that would limit our ability to send such communications or impose additional requirements upon us in connection with sending such communications could also adversely impact our business. We also rely on social networking messaging services to send communications. Changes to these social networking services’ terms of use or terms of service that limit promotional communications, restrictions that would limit our ability or our customers’ ability to send communications through their services, disruptions or downtime experienced by these social networking services or reductions in the use of or engagement with social networking services by customers and potential customers could also harm our business.
We rely on a third-party service for the delivery of daily emails and other forms of electronic communication, and delay or errors in the delivery of such emails or other messaging we send may occur and be beyond our control, which could damage our reputation or harm our business, financial condition and operating results. If we were unable to use our current electronic messaging services, alternate services are available; however, we believe our sales could be impacted for some period as we transition to a new provider, and the new provider may be unable to provide equivalent or satisfactory electronic messaging service. Any disruption or restriction on the distribution of our electronic messages, termination or disruption of our relationship with our messaging service providers, including our third-party service that delivers our daily emails, or any increase in our costs associated with our email and other messaging activities could harm our business.
We are dependent on technology systems and electronic communications networks that are supplied and managed by third parties, which could result in our inability to prevent or respond to disruptions in our services.
Our ability to provide services to consumers depends on our ability to communicate with CPGs, retailers and customers through the public Internet and electronic networks that are owned and operated by third parties. Our products and services also depend on the ability of our users to access the public Internet. In addition, in order to provide services promptly, our computer equipment and network servers must be functional 24 hours per day, which requires access to telecommunications facilities managed by third parties and the availability of electricity, which we do not control. A severe disruption of one or more of these networks, including as a result of utility or third-party system interruptions, could impair our ability to process information, which could impede our ability to provide digital promotions to consumers, harm our reputation, result in a loss of customers or CPGs and retailers and adversely affect our business and operating results.
19
If our security measures are compromised, or if our platform is subject to attacks that degrade or deny the ability of consumers to access our content, CPGs, retailers and consumers may curtail or stop use of our platform.
We deliver digital coupons via our platform and we collect and maintain data about consumers, including personally identifiable information, as well as other confidential or proprietary information. Like all online services, our security measures, and those of our third-party service providers, may not detect or prevent all attempts to hack our systems, denial-of-service attacks, viruses, malicious software, break-ins, phishing attacks, social engineering, security breaches or other attacks and similar disruptions that may jeopardize the security of information stored in or transmitted by our systems or solutions or that we or our third-party service providers otherwise maintain, including payment systems, any of which could lead to interruptions, delays, or website shutdowns, causing loss of critical data or the unauthorized disclosure or use of personally identifiable or other confidential information, or subject us to fines or higher transaction fees or limit or result in the termination of our access to certain payment methods. If we experience compromises to our security that result in performance or availability problems, the complete shutdown of one or more of our websites or the loss or unauthorized disclosure of confidential information, CPGs, retailers, and consumers may lose trust and confidence in us and decrease their use of our platform or stop using our platform entirely.
Because the techniques used to obtain unauthorized access, disable or degrade service or sabotage systems change frequently, often are not recognized until launched against a target and may originate from less regulated or remote areas around the world, we may be unable to proactively address these techniques or to implement adequate preventative measures. In addition, consumer information including email addresses and data on consumer usage of our websites could be hacked, hijacked, altered or otherwise claimed or controlled by unauthorized persons. Also, security breaches can also occur as a result of non-technical issues, including intentional or inadvertent breaches by our employees or by persons with whom we have commercial relationships. Any or all of these issues could negatively impact our reputation and our ability to attract and retain CPGs and retailers as well as consumers or could reduce the frequency with which our platform is used, cause existing or potential CPG or retailer customers to cancel their contracts or subject us to third-party lawsuits, regulatory fines or other action or liability, thereby harming our results of operations.
Failure to deal effectively with fraudulent transactions could harm our business.
Digital coupons are issued in the form of redeemable coupons or coupon codes with unique identifiers. It is possible that third parties may seek to create counterfeit digital coupons or coupon codes in order to fraudulently claim discounts or credits for redemption. While we use advanced anti-fraud technologies, it is possible that individuals will attempt to circumvent our anti-fraud systems using increasingly sophisticated methods or methods that our anti-fraud systems are not prepared to counteract. In addition, our service could be subject to employee fraud or other internal security breaches, and we may be required to reimburse CPGs and retailers for any funds stolen or revenues lost as a result of such breaches. Our CPGs and retailers could also request reimbursement, or stop using digital coupons, if they are affected by buyer fraud or other types of fraud. We may incur significant losses from fraud and counterfeit digital coupons. If our anti-fraud measures do not succeed, our business will suffer.
We are a defendant in a purported class action lawsuit arising out of our initial public offering (“IPO”) and we may be involved in additional litigation in the future.
On March 11, 2015, a purported class action lawsuit alleging violations of federal securities laws was filed in the Superior Court of the State of California, naming us as defendants and certain of our executive officers and directors. Plaintiffs also named as defendants the underwriters in our IPO. The plaintiffs generally allege that our registration statements related to our IPO contained material misstatements and omissions.
The outcomes of litigation are difficult to predict. Plaintiffs may seek recovery of a substantial amount of cash. The monetary and other impact of this action may remain unknown for substantial periods of time. The cost to defend, settle or otherwise resolve this matter may be significant and divert management's attention. We cannot assure you that we will prevail in this lawsuit. If we are ultimately unsuccessful in this matter, we could be required to pay substantial amounts of cash to the other parties. The amount and timing of any of these payments could materially adversely affect our business, operating results and financial condition.
Our business is subject to complex and evolving laws, regulations and industry standards, and unfavorable interpretations of, or changes in, or failure by us to comply with these laws, regulations and industry standards could substantially harm our business and results of operations.
We are subject to a variety of state, local and municipal laws, regulations and industry standards that relate to privacy, electronic communications, data protection, intellectual property, e-commerce, competition, price discrimination,
20
consumer protection, taxation, and the use of promotions. Many of these laws, regulations, and standards are still evolving and being tested in courts and industry standards are still developing. Our business, including our ability to operate and expand, could be adversely affected if legislation, regulations or industry standards are adopted, interpreted or implemented in a manner that is inconsistent with our current business practices and that require changes to these practices or the design of our platform. Existing and future laws, regulations and industry standards could restrict our operations, and our ability to retain or increase our CPGs and retailers and consumers’ use of digital promotions delivered on our platform may be adversely affected and we may not be able to maintain or grow our revenues as anticipated.
If the use of third party cookies is rejected by Internet users, restricted by third parties outside of our control, or otherwise subject to unfavorable regulation, our performance could decline and we could lose customers and revenue.
We use small text files (referred to as "cookies"), placed through an Internet browser on an Internet user's computer and correspond to a data set that we keep on our servers, to gather important data to help deliver our solution. Certain of our cookies, including those that we predominantly use in delivering our solution, are known as "third party" cookies because they are delivered where we do not have a direct relationship with the Internet user. Our cookies collect anonymous information, such as when an Internet user views an advertisement, clicks on an advertisement, or visits one of our advertisers' websites. On mobile devices, we may also obtain location based information about the user's device through our cookies. We use these cookies to achieve our customers' campaign goals, to ensure that the same Internet user does not unintentionally see the same media too frequently, to report aggregate information to our customers regarding the performance of their digital promotions and marketing campaigns, and to detect and prevent fraudulent activity throughout our network. We also use data from cookies to help us decide whether and how much to bid on an opportunity to place an advertisement in a certain Internet location and at a given time in front of a particular Internet user. A lack of data associated with or obtained from cookies may significantly detract from our ability to make decisions about which inventory to purchase for an advertiser's campaign and may undermine the effectiveness of our solution and harm our business.
Cookies may easily be deleted or blocked by Internet users. All of the most commonly used Internet browsers (including Chrome, Firefox, Internet Explorer, and Safari) allow Internet users to prevent cookies from being accepted by their browsers. Internet users can also delete cookies from their computers at any time. Some Internet users also download "ad blocking" software that prevents cookies from being stored on a user's computer. If more Internet users adopt these settings or delete their cookies more frequently than they currently do, our business could be harmed. In addition, the Safari browser blocks third-party cookies by default, the developers of the Firefox browser have announced that a future version of the Firefox browser will also block third-party cookies by default, and other browsers may do so in the future. Unless such default settings in browsers were altered by Internet users to permit the placement of third-party cookies, we would be able to set fewer of our cookies in users’ browsers, which could adversely affect our business. In addition, companies such as Google have publicly disclosed their intention to move away from cookies to another form of persistent unique identifier, or ID, to identify individual Internet users or Internet-connected devices in the bidding process on advertising exchanges. If companies do not use shared IDs across the entire ecosystem, this could have a negative impact on our ability to find the same anonymous user across different web properties, and reduce the effectiveness of our solution.
In addition, in the European Union, or EU, Directive 2009/136/EC, commonly referred to as the "Cookie Directive," directs EU member states to ensure that accessing information on an Internet user's computer, such as through a cookie, is allowed only if the Internet user has appropriately given his or her consent. We may not be able to develop or implement additional tools that compensate for the lack of data associated with cookies. Moreover, even if we are able to do so, such additional tools may be subject to further regulation, time consuming to develop or costly to obtain, and less effective than our current use of cookies.
Failure to comply with federal, state and international privacy and marketing laws, regulations and industry standards, or the expansion of current or the enactment or adoption of new privacy and marketing laws, regulations or industry standards, could adversely affect our business.
We are subject to a variety of federal, state and international laws, regulations and industry standards regarding privacy and marketing, which address the collection, storing, sharing, using, processing, disclosure and protection of personal information as well as the tracking of consumer behavior and other consumer data. Many of these laws, regulations and industry standards are changing and may be subject to differing interpretations, costly to comply with or inconsistent among countries and jurisdictions. For example, the Federal Trade Commission, or the FTC, expects companies like ours to comply with guidelines issued under the Federal Trade Commission Act that govern the collection, use, disclosure, and storage of consumer information, and establish principles relating to notice, consent, access and data
21
integrity and security. Our practices are designed to comply with these guidelines as described in our published privacy policy. We believe our policies and practices comply with applicable privacy guidelines, laws and regulations. However, if our belief is incorrect, or if these guidelines, laws or regulations or their interpretation change or new legislation or regulations are enacted, we may be compelled to provide additional disclosures to our consumers, obtain additional consents from our consumers before collecting, using, or disclosing their information or implement new safeguards to help our consumers manage our use of their information, among other changes.
We have posted privacy policies and descriptions of our practices concerning the collection, use and disclosure of consumer data on our websites and platform. Several Internet companies have incurred penalties for failing to abide by the representations made in their privacy policies or other statements to consumers. In addition, several states have adopted legislation that requires businesses to implement and maintain reasonable security procedures and practices to protect sensitive personal information and nearly all states require businesses to provide notice to consumers in the event of a breach of security measures that compromises certain personally identifiable information about consumers. Various industry standards on privacy have been developed and are expected to continue to develop, which may be adopted by industry participants at any time. We are subject to the terms of our privacy policies and privacy-related obligations to third parties (including voluntary third-party certification bodies such as TRUSTe). We strive to comply with applicable laws, policies, and legal obligations and certain applicable industry standards of conduct relating to privacy and data protection. However, it is possible that these obligations may be interpreted and applied in new ways and/or in a manner that is inconsistent from one jurisdiction to another and may conflict with other rules or our practices or that new regulations could be enacted. Any failure, or perceived failure, by us to comply with our posted privacy policies or with any data-related consent orders, FTC requirements or orders or other federal, state or, as we continue to expand internationally, international privacy or consumer protection-related laws, regulations or self-regulatory principles or other industry standards could result in claims, proceedings or actions against us by governmental entities or others or other liabilities, which could adversely affect our business.
In addition, a failure or perceived failure to comply with such legal requirements and industry standards or with our own privacy policies and practices could result in a loss of consumers using our digital coupons or loss of CPGs and retailers and adversely affect our business. Federal, state and international governmental authorities continue to evaluate the privacy implications inherent in the use of third-party web “cookies” for behavioral advertising. The regulation of these cookies and other current online advertising practices could adversely affect our business. Additionally, if third parties we work with violate applicable laws, our policies or other privacy-related obligations, such violations may also put our consumers’ information at risk and could in turn have an adverse effect on our business. In addition, certain laws impose restrictions on our ability to send electronic communications to consumers. We strive to comply with applicable laws and other legal obligations; however, it is possible that these obligations may be interpreted and applied in new ways and/or in a manner that is inconsistent from one jurisdiction to another.
In addition, various federal, state and, as we continue to expand internationally, foreign legislative and regulatory bodies may expand current or enact new laws and regulations regarding privacy matters. For instance, many foreign countries and governmental bodies have laws and regulations concerning the collection and use of personally identifiable information obtained from their residents or by businesses operating within their jurisdiction, which are often more restrictive than those in the United States. Laws and regulations in these jurisdictions apply broadly to the collection, use, storage, disclosure and security of personally identifiable information that identifies or may be used to identify an individual, such as names, email addresses and, in some jurisdictions, Internet Protocol, or IP, addresses. Although we will aim to comply with those laws and regulations that apply to us, these and other obligations may be modified, they may be interpreted and applied in an inconsistent manner from one jurisdiction to another, and they may conflict with one another, other regulatory requirements or our internal practices. Public scrutiny of Internet privacy and security issues may result in increased regulation and different industry standards and other legal obligations, which could deter or prevent us from delivering digital coupons on our platform consistent with our current business practices and may require changes to these practices or the design of our platform, thereby harming our business.
We expect that there will continue to be new proposed laws, regulations and industry standards concerning privacy, data protection and information security in the United States and other jurisdictions, and we cannot yet determine the impact such future laws, regulations and standards may have on our business. Future laws, regulations, standards and other obligations could, for example, impair our ability to collect or use information that we utilize to provide targeted digital promotions and media to consumers, CPGs and retailers, thereby impairing our ability to maintain and grow our total customers and increase revenues. Future restrictions on the collection, use, sharing or disclosure of our users’ data or additional requirements for express or implied consent of users for the use and disclosure of such information could require us to modify our solutions, possibly in a material manner, and could limit our ability to develop new solutions and features. Any such new laws, regulations, other legal obligations or industry standards, or any changed interpretation of existing laws, regulations or other standards may require us to incur additional costs and restrict our business operations.
22
If our privacy or data security measures fail to comply with current or future laws, regulations, policies, legal obligations or industry standards, we may be subject to litigation, regulatory investigations, fines or other liabilities, as well as negative publicity and a potential loss of business. Moreover, if future laws, regulations, other legal obligations or industry standards, or any changed interpretations of the foregoing limit our users’ or CPGs’ or retailers’ ability to use and share personally identifiable information or our ability to store, process and share personally identifiable information or other data, demand for our solutions could decrease, our costs could increase and our business, financial condition and operating results could be harmed.
We may not be able to adequately protect our intellectual property rights or may be accused of infringing intellectual property rights of third parties.
We regard our trademarks, service marks, copyrights, patents, trade dress, trade secrets, proprietary technology and similar intellectual property as critical to our success, and we rely on trademark, copyright and patent law, trade secret protection and confidentiality and/or license agreements with our employees and others to protect our proprietary rights. Effective intellectual property protection may not be available in every country in which we offer digital promotions. We also may not be able to acquire or maintain appropriate domain names or trademarks in all countries in which we do business. Furthermore, regulations governing domain names may not protect our trademarks and similar proprietary rights. We may be unable to prevent third parties from acquiring and using domain names that are similar to, infringe upon or diminish the value of our trademarks and other proprietary rights. We may be unable to prevent third parties from using and registering our trademarks, or trademarks that are similar to, or diminish the value of, our trademark in some countries.
We may not be able to discover or determine the extent of any unauthorized use of our proprietary rights. Third parties that license our proprietary rights also may take actions that diminish the value of our proprietary rights or reputation. The protection of our intellectual property may require the expenditure of significant financial and managerial resources. For example, from time to time we have identified and shut down websites that have attempted to misappropriate our brand and proprietary rights and sell fraudulent digital coupons. Moreover, the steps we take to protect our intellectual property may not adequately protect our rights or prevent third parties from infringing or misappropriating our proprietary rights. We are currently subject to litigation and disputes related to our intellectual property and service offerings. We may in the future be subject to additional litigation and disputes. The costs of supporting such litigation and disputes are considerable, and there can be no assurances that favorable outcomes will be obtained.
In the past, we have been subject to third-party claims of infringement and we expect to be subject to infringement claims in the future. Such claims, whether or not meritorious, may result in the expenditure of significant financial and managerial resources, injunctions against us or the payment of damages by us. We may need to obtain licenses from third parties who allege that we have infringed their rights, but such licenses may not be available on terms acceptable to us or at all. These risks have been amplified by the increase in third parties whose sole or primary business is to assert such claims.
Failure to protect or enforce our intellectual property rights could harm our business and results of operations.
We regard the protection of our trade secrets, copyrights, trademarks and domain names as critical to our success. In particular, we must maintain, protect and enhance the Coupons.com brand. We pursue the registration of our domain names, trademarks, and service marks in the United States and in certain jurisdictions abroad. We strive to protect our intellectual property rights by relying on federal, state and common law rights, as well as contractual restrictions. We typically enter into confidentiality and invention assignment agreements with our employees and contractors, and confidentiality agreements with parties with whom we conduct business in order to limit access to, and disclosure and use of, our proprietary information. However, these contractual arrangements and the other steps we have taken to protect our intellectual property may not prevent the misappropriation or disclosure of our proprietary information nor deter independent development of similar technologies by others.
Effective trade secret, copyright, trademark and domain name protection is expensive to develop and maintain, both in terms of initial and ongoing registration requirements and expenses and the costs of defending our rights. We are seeking to protect our trademarks and domain names in an increasing number of jurisdictions, a process that is expensive and may not be successful or which we may not pursue in every location. Litigation may be necessary to enforce our intellectual property rights, protect our respective trade secrets or determine the validity and scope of proprietary rights claimed by others. Any litigation of this nature, regardless of outcome or merit, could result in substantial costs and diversion of management and technical resources, any of which could adversely affect our business and operating results. We may incur significant costs in enforcing our trademarks against those who attempt to imitate our Coupons.com brand. If we fail to maintain, protect and enhance our intellectual property rights, our business and operating results may be harmed.
23
Our business depends on a strong brand, and if we are not able to maintain and enhance our brand, or if we receive unfavorable media coverage, our ability to retain and expand our number of CPGs, retailers and consumers will be impaired and our business and operating results will be harmed.
We believe that the brand identity that we have developed has significantly contributed to the success of our business. We also believe that maintaining and enhancing our brands are critical to expanding our base of CPGs, retailers and consumers. Maintaining and enhancing our brand may require us to make substantial investments and these investments may not be successful. If we fail to promote and maintain the Coupons.com brand, or if we incur excessive expenses in this effort, our business would be harmed. We anticipate that, as our market becomes increasingly competitive, maintaining and enhancing our brand may become increasingly difficult and expensive. Maintaining and enhancing our brand will depend on our ability to continue to provide sufficient quantities of reliable, trustworthy and high quality digital coupons, which we may not do successfully.
Unfavorable publicity or consumer perception of our websites, platform, practices or service offerings, or the offerings of our CPGs and retailers, could adversely affect our reputation, resulting in difficulties in recruiting, decreased revenues and a negative impact on the number of CPGs and retailers we feature and our user base, the loyalty of our consumers and the number and variety of digital coupons we offer. As a result, our business could be harmed.
We may be unable to continue to use the domain names that we use in our business, or prevent third parties from acquiring and using domain names that infringe on, are similar to, or otherwise decrease the value of our brand or our trademarks or service marks.
We have registered domain names for our websites that we use in our business, such as Coupons.com. If we lose the ability to use a domain name, whether due to trademark claims, failure to renew the applicable registration, or any other cause, we may be forced to market our products under new domain names, which could cause us substantial harm, or to incur significant expense in order to purchase rights to the domain names in question. In addition, our competitors and others could attempt to capitalize on our brand recognition by using domain names similar to ours. Domain names similar to ours have been registered in the United States and elsewhere. We may be unable to prevent third parties from acquiring and using domain names that infringe on, are similar to, or otherwise decrease the value of our brand or our trademarks or service marks. Protecting and enforcing our rights in our domain names may require litigation, which could result in substantial costs and diversion of management’s attention and harm our business.
Some of our solutions contain open source software, which may pose particular risks to our proprietary software and solutions.
We use open source software in our solutions and will use open source software in the future. From time to time, we may face claims from third parties claiming ownership of, or demanding release of, the open source software and/or derivative works that we developed using such software (which could include our proprietary source code), or otherwise seeking to enforce the terms of the applicable open source license. These claims could result in litigation and could require us to purchase a costly license or cease offering the implicated solutions unless and until we can re-engineer them to avoid infringement. This re-engineering process could require significant additional research and development resources. In addition to risks related to license requirements, use of certain open source software can lead to greater risks than use of third-party commercial software, as open source licensors generally do not provide warranties or controls on the origin of software. Any of these risks could be difficult to eliminate or manage, and, if not addressed, could have a negative effect on our business and operating results.
Indemnity provisions in various agreements potentially expose us to substantial liability for intellectual property infringement and other losses.
Our agreements with CPGs, retailers and other third parties may include indemnification provisions under which we agree to indemnify them for losses suffered or incurred as a result of claims of intellectual property infringement or other liabilities relating to or arising from our products, services or other contractual obligations. The term of these indemnity provisions generally survives termination or expiration of the applicable agreement. Large indemnity payments could harm our business.
Acquisitions, joint ventures and strategic investments could result in operating difficulties, dilution and other harmful consequences.
We expect to evaluate and consider a wide array of potential strategic transactions, including acquisitions and dispositions of businesses, joint ventures, technologies, services, products and other assets and strategic investments. At
24
any given time, we may be engaged in discussions or negotiations with respect to one or more of these types of transactions. Any of these transactions could be material to our financial condition and results of operations. We have limited experience managing acquisitions and integrating acquired businesses. The process of integrating any acquired business may create unforeseen operating difficulties and expenditures and is itself risky. The areas where we may face difficulties include:
|
● |
diversion of management time, as well as a shift of focus from operating the businesses to issues related to integration and administration; |
|
● |
the need to integrate the acquired company’s accounting, management, information, human resource and other administrative systems to permit effective management, and the lack of control if such integration is delayed or not implemented; |
|
● |
retention of key employees from the acquired company and cultural challenges associated with integrating employees from the acquired company into our organization; |
|
● |
the need to implement or improve controls, procedures and policies appropriate for a public company at companies that prior to acquisition had lacked such controls, procedures and policies; |
|
● |
in some cases, the need to transition operations and customers onto our existing platforms; |
|
● |
liability for activities of the acquired company before the acquisition, including violations of laws, rules and regulations, commercial disputes, tax liabilities and other known and unknown liabilities; |
|
● |
write-offs or charges; and |
|
● |
litigation or other claims in connection with the acquired company, including claims from terminated employees, users, former stockholders or other third parties and intellectual property infringement claims. |
Our failure to address these risks or other problems encountered in connection with our past or future acquisitions and investments could cause us to fail to realize the anticipated benefits of any or all of our acquisitions or joint ventures, or we may not realize them in the time frame expected or cause us to incur unanticipated liabilities, and harm our business. Future acquisitions or joint ventures may require us to issue dilutive additional equity securities, spend a substantial portion of our available cash, incur debt or contingent liabilities, amortize expenses related to intangible assets or incur incremental operating expenses or write-offs of goodwill, which could adversely affect our results of operations and harm our business.
If we fail to expand effectively in international markets, our revenues and our business may be harmed.
We currently generate almost all of our revenues from the United States. We also operate to a limited extent in the United Kingdom and continental Europe. Many CPGs and retailers on our platform have global operations and we plan to grow our operations and offerings through expansion in existing international markets and by partnering with our CPGs and retailers to enter new geographies that are important to them. Further expansion into international markets will require management attention and resources and we have limited experience entering new geographic markets. Entering new foreign markets will require us to localize our services to conform to a wide variety of local cultures, business practices, laws and policies. The different commercial and Internet infrastructure in other countries may make it more difficult for us to replicate our business model. In some countries, we will compete with local companies that understand the local market better than we do, and we may not benefit from first-to-market advantages. We may not be successful in expanding into particular international markets or in generating revenues from foreign operations. As we expand internationally, we will be subject to risks of doing business internationally, including the following:
|
● |
competition with strong local competitors and preference for local providers, or foreign companies entering the same markets; |
|
● |
the cost and resources required to localize our platform; |
|
● |
burdens of complying with a wide variety of different laws and regulations, including intellectual property laws and regulation of digital coupon terms, Internet services, privacy and data protection, anti-competition regulations and different liability standards, which may limit or prevent us from offering of our solutions in some jurisdictions or limit our ability to enforce contractual obligations; |
|
● |
differences in how trade promotion spending is allocated; |
|
● |
differences in the way digital coupons and advertising are delivered and how consumers access and use digital coupons; |
|
● |
technology compatibility; |
25
|
● |
difficulties in recruiting and retaining qualified employees and managing foreign operations; |
|
● |
different employee/employer relationships and the existence of workers’ councils and labor unions; |
|
● |
shorter payment cycles, different accounting practices and greater problems in collecting accounts receivable; |
|
● |
higher product return rates; |
|
● |
seasonal reductions in business activity; |
|
● |
adverse tax effects and foreign exchange controls making it difficult to repatriate earnings and cash; and |
|
● |
political and economic instability. |
Changes in the U.S. taxation of international activities may increase our worldwide effective tax rate and harm our financial condition and results of operations. The taxing authorities of the jurisdictions in which we plan to operate may challenge our methodologies for valuing developed technology or intercompany arrangements, including our transfer pricing, or determine that the manner in which we operate our business does not achieve the intended tax consequences, which could increase our worldwide effective tax rate and harm our financial position and results of operations. Significant judgment will be required in evaluating our tax positions and determining our provision for income taxes. During the ordinary course of business, there will be many transactions and calculations for which the ultimate tax determination is uncertain. As we expand our business to operate in numerous taxing jurisdictions, the application of tax laws may be subject to diverging and sometimes conflicting interpretations by tax authorities of these jurisdictions. It is not uncommon for taxing authorities in different countries to have conflicting views. In addition, tax laws are dynamic and subject to change as new laws are passed and new interpretations of the law are issued or applied. In particular, there is uncertainty in relation to the U.S. tax legislation in terms of the future corporate tax rate but also in terms of the U.S. tax consequences of income derived from intellectual property earned overseas in low tax jurisdictions.
Our planned corporate structure and intercompany arrangements will be implemented in a manner we believe is in compliance with current prevailing tax laws. However, the tax benefits which we intend to eventually derive could be undermined if we are unable to adapt the manner in which we operate our business and due to changing tax laws.
Our failure to manage these risks and challenges successfully could materially and adversely affect our business, financial condition and results of operations.
The loss of one or more key members of our management team, or our failure to attract, integrate and retain other highly qualified personnel in the future, could harm our business.
We currently depend on the continued services and performance of the key members of our management team, including Steven R. Boal, our Chief Executive Officer. Mr. Boal is one of our founders and his leadership has played an integral role in our growth. Key institutional knowledge remains with a small group of long-term employees and directors whom we may not be able to retain. The loss of key personnel, including key members of management as well as our marketing, sales, product development and technology personnel, could disrupt our operations and have an adverse effect on our ability to grow our business. Moreover, some of our management are new to our team.
As we become a more mature company, we may find our recruiting and retention efforts more challenging. We are seeking to continue to hire a significant number of personnel, including certain key management personnel. If we do not succeed in attracting, hiring and integrating excellent personnel, or retaining and motivating existing personnel, we may be unable to grow effectively.
We are currently or could be exposed in the future to fluctuations in currency exchange rates and interest rates.
To date, we have generated almost all of our revenues from within the United States. As a result, we currently do not have significant revenues or expenses in our international operations and we do not hedge our foreign currency exchange risk. However, we plan to grow our operations and offerings through expansion in existing international markets and by partnering with our existing CPGs and retailers to enter new geographies that are important to them. For example, we recently opened a research and development facility in Bangalore, India. As we expand our business outside the United States we will face exposure to adverse movements in currency exchange rates. We will be exposed to foreign exchange rate fluctuations as the financial results are translated from the local currency into U.S. dollars upon consolidation. If the U.S. dollar weakens against foreign currencies, the translation of these foreign currency denominated transactions will result in increased revenues, operating expenses and net income. Similarly, if the U.S. dollar strengthens against foreign currencies, the translation of these foreign currency denominated transaction will result in decreased revenues, operating expenses and net income. As exchange rates vary, sales and other operating results, when translated, may differ
26
materially from expectations. Our risks related to currency fluctuations will increase as our international operations become an increasing portion of our business. In addition, we face exposure to fluctuations in interest rates which may impact our investment income unfavorably.
Our business is subject to interruptions, delays or failures resulting from earthquakes, other natural catastrophic events or terrorism.
Our headquarters is located in Mountain View, California. Our current technology infrastructure is hosted across two data centers in co-location facilities in California and Nevada. In addition, we use two other co-location facilities in California and Virginia to host our in-development new point of sale solution. Our services, operations and the data centers from which we provide our services are vulnerable to damage or interruption from earthquakes, fires, floods, power losses, telecommunications failures, terrorist attacks, acts of war, human errors, break-ins and similar events. A significant natural disaster, such as an earthquake, fire or flood, could have a material adverse impact on our business, financial condition and results of operations and our insurance coverage may be insufficient to compensate us for losses that may occur. Acts of terrorism could cause disruptions to the Internet, our business or the economy as a whole. We may not have sufficient protection or recovery plans in certain circumstances, such as natural disasters affecting areas where data centers upon which we rely are located, and our business interruption insurance may be insufficient to compensate us for losses that may occur. Such disruptions could negatively impact our ability to run our websites, which could harm our business.
Our management team has limited experience managing a public company, and regulatory compliance may divert its attention from the day-to-day management of our business.
Our management team has limited experience managing a publicly-traded company and limited experience complying with the increasingly complex laws pertaining to public companies. Our management team may not successfully or efficiently manage our transition to being a public company that will be subject to significant regulatory oversight and reporting obligations under the federal securities laws. In particular, these new obligations will require substantial attention from our senior management and could divert their attention away from the day-to-day management of our business, which could adversely impact our business operations.
Our ability to raise capital in the future may be limited, and our failure to raise capital when needed could prevent us from growing.
We may in the future be required to raise capital through public or private financing or other arrangements. Such financing may not be available on acceptable terms, or at all, and our failure to raise capital when needed could harm our business. Additional equity financing may dilute the interests of our stockholders, and debt financing, if available, may involve restrictive covenants and could reduce our profitability. If we cannot raise funds on acceptable terms, we may not be able to grow our business or respond to competitive pressures.
Our ability to use our net operating losses to offset future taxable income may be subject to certain limitations.
In general, under Section 382 of the U.S. Internal Revenue Code of 1986, as amended, or the Code, and similar state law provisions, a corporation that undergoes an “ownership change” is subject to limitations on its ability to utilize its pre-change net operating losses, or NOLs, to offset future taxable income. If our existing NOLs are subject to limitations arising from ownership changes, our ability to utilize NOLs could be limited by Section 382 of the Code. Future changes in our stock ownership, some of which are outside of our control, also could result in an ownership change under Section 382 of the Code. There is also a risk that our NOLs could expire, or otherwise be unavailable to offset future income tax liabilities due to changes in the law, including regulatory changes, such as suspensions on the use of NOLs or other unforeseen reasons. For these reasons, we may not be able to utilize all of our NOLs, even if we attain profitability.
27
Risks Related to Ownership of our Common Stock
The trading prices of the securities of technology companies have been highly volatile. Accordingly, the market price of our common stock has been, and is likely to continue to be, subject to wide fluctuations and could subject us to litigation.
The price of our stock may change in response to variations in our operating results and also may change in response to other factors, including factors specific to technology companies, many of which are beyond our control. As a result, our stock price may experience significant volatility. Among other factors that could affect our stock price are:
|
● |
the financial projections that we or analysts may choose to provide to the public, any changes in these projections or our failure for any reason to meet these projections; |
|
● |
actual or anticipated changes or fluctuations in our results of operations; |
|
● |
whether our results of operations meet the expectations of securities analysts or investors; |
|
● |
the development and sustainability of an active trading market for our common stock; |
|
● |
price and volume fluctuations in the overall stock market from time to time; |
|
● |
fluctuations in the trading volume of our shares or the size of our public float; |
|
● |
success of competitive products or services; |
|
● |
the public’s response to press releases or other public announcements by us or others, including our filings with the Securities and Exchange Commission, or SEC; |
|
● |
announcements relating to litigation; |
|
● |
speculation about our business in the press or the investment community; |
|
● |
future sales of our common stock by our significant stockholders, officers and directors; |
|
● |
changes in our capital structure, such as future issuances of debt or equity securities; |
|
● |
our entry into new markets; |
|
● |
regulatory developments in the United States or foreign countries; |
|
● |
strategic actions by us or our competitors, such as acquisitions or restructurings; and |
|
● |
changes in accounting principles. |
In addition, the stock market in general has experienced substantial price and volume volatility that is often seemingly unrelated to the operating results of any particular companies. Moreover, if the market for technology stocks or the stock market in general experiences uneven investor confidence, the market price of our common stock could decline for reasons unrelated to our business, operating results or financial condition. The market price for our stock might also decline in reaction to events that affect other companies within, or outside, our industry, even if these events do not directly affect us. Some companies that have experienced volatility in the trading price of their stock have been subject of securities litigation. If we are the subject of such litigation, it could result in substantial costs and a diversion of management’s attention and resources.
Substantial future sales of shares by our stockholders could negatively affect our stock price.
Sales of a substantial number of shares of our common stock in the public market could depress the market price of our common stock and could impair our ability to raise capital through the sale of additional equity securities. We have approximately 81,380,014 shares of common stock outstanding as of December 31, 2014, assuming no exercise of our outstanding options or vesting of our outstanding RSUs.
All of the shares of common stock sold in our IPO are freely tradable without restrictions or further registration under the Securities Act, except for any shares held by our affiliates as defined in Rule 144 under the Securities Act.
Our equity incentive plans allow us to issue, among other things, stock options, restricted stock and restricted stock units and we have filed a registration statement under the Securities Act to cover the issuance of shares upon the exercise or vesting of awards granted under those plans.
28
The concentration of our common stock ownership with our executive officers, directors and affiliates will limit your ability to influence corporate matters.
Our executive officers, directors and owners of 5% or more of our outstanding common stock together own approximately 61.2% of our outstanding common stock, based on the number of shares outstanding as of December 31, 2014. These stockholders therefore have significant influence over management and affairs and over all matters requiring stockholder approval, including the election of directors and significant corporate transactions, such as a merger or other sale of our company or its assets, for the foreseeable future. This concentrated control limits your ability to influence corporate matters and, as a result, we may take actions that our stockholders do not view as beneficial. This ownership could affect the value of your shares of common stock.
If we fail to maintain an effective system of disclosure controls and internal control over financial reporting, our ability to produce timely and accurate financial statements or comply with applicable regulations could be impaired.
As a public company, we are subject to the reporting requirements of the Exchange Act, the Sarbanes-Oxley Act and the rules and regulations of the New York Stock Exchange, or the NYSE. We expect that the requirements of these rules and regulations will continue to increase our legal, accounting and financial compliance costs, make some activities more difficult, time consuming and costly, and place significant strain on our personnel, systems and resources.
The Sarbanes-Oxley Act requires, among other things, that we maintain effective disclosure controls and procedures and internal control over financial reporting. We are continuing to develop and refine our disclosure controls and other procedures that are designed to ensure that information required to be disclosed by us in the reports that we will file with the SEC is recorded, processed, summarized and reported within the time periods specified in SEC rules and forms, and that information required to be disclosed in reports under the Exchange Act is accumulated and communicated to our principal executive and financial officers. We are also continuing to improve our internal control over financial reporting. In order to maintain and improve the effectiveness of our disclosure controls and procedures and internal control over financial reporting, we have expended, and anticipate that we will continue to expend, significant resources, including accounting-related costs and significant management oversight.
Our current controls and any new controls that we develop may become inadequate because of changes in conditions in our business. Further, weaknesses in our disclosure controls or our internal control over financial reporting may be discovered in the future. Any failure to develop or maintain effective controls, or any difficulties encountered in their implementation or improvement, could harm our operating results or cause us to fail to meet our reporting obligations and could result in a restatement of our financial statements for prior periods. Any failure to implement and maintain effective internal control over financial reporting also could adversely affect the results of management evaluations and independent registered public accounting firm audits of our internal control over financial reporting that we will eventually be required to include in our periodic reports that will be filed with the SEC. Ineffective disclosure controls and procedures and internal control over financial reporting could also cause investors to lose confidence in our reported financial and other information, which would likely have a negative effect on the trading price of our common stock. In addition, if we are unable to continue to meet these requirements, we may not be able to remain listed on the NYSE.
We are not currently required to comply with the SEC rules that implement Section 404 of the Sarbanes-Oxley Act, and are therefore not required to make a formal assessment of the effectiveness of our internal control over financial reporting for that purpose. As a public company, we will be required to provide an annual management report on the effectiveness of our internal control over financial reporting commencing with our second annual report on Form 10-K. Our independent registered public accounting firm is not required to audit the effectiveness of our internal control over financial reporting until after we are no longer an “emerging growth company,” as defined in the Jumpstart Our Business Startups Act of 2012, or the JOBS Act. At such time, our independent registered public accounting firm may issue a report that is adverse in the event it concludes that our internal control is not effective.
Any failure to maintain effective disclosure controls and internal control over financial reporting could have a material and adverse effect on our business and operating results, and cause a decline in the price of our common stock.
We are an “emerging growth company” and the reduced disclosure requirements applicable to emerging growth companies may make our common stock less attractive to investors.
We are an “emerging growth company”, as defined in the JOBS Act, and we may take advantage of certain exemptions from various reporting requirements that are applicable to other public companies that are not “emerging growth companies” including, but not limited to, not being required to comply with the auditor attestation requirements of
29
Section 404 of the Sarbanes-Oxley Act, reduced financial disclosure obligations, reduced disclosure obligations regarding executive compensation in our periodic reports and proxy statements, and exemptions from the requirements of holding a nonbinding advisory vote on executive compensation and any golden parachute payments not previously approved. We may take advantage of these provisions for up to five years or such earlier time that we are no longer an “emerging growth company.” We would cease to be an “emerging growth company” upon the earliest to occur of: the last day of the fiscal year in which we have more than $1.0 billion in annual revenues; the date we are deemed a “large accelerated filer” as defined in the Exchange Act; and the last day of the fiscal year ending after the fifth anniversary of our IPO. We may choose to take advantage of some but not all of these reduced reporting burdens. If we take advantage of any of these reduced reporting burdens in future filings, the information that we provide our security holders may be different than you might get from other public companies in which you hold equity interests. We cannot predict if investors will find our common stock less attractive because we may rely on these exemptions. If some investors find our common stock less attractive as a result, there may be a less active trading market for our common stock and our stock price may be more volatile.
If securities analysts do not publish research or if securities analysts or other third parties publish inaccurate or unfavorable research about us, the price of our common stock could decline.
The trading market for our common stock will rely in part on the research and reports that securities analysts and other third parties choose to publish about us. We do not control these analysts or other third parties. The price of our common stock could decline if one or more securities analysts downgrade our common stock or if one or more securities analysts or other third parties publish inaccurate or unfavorable research about us or cease publishing reports about us.
We do not intend to pay dividends for the foreseeable future.
We intend to retain all of our earnings for the foreseeable future to finance the operation and expansion of our business and do not anticipate paying cash dividends on our common stock. The terms of our credit and security agreement also restrict our ability to pay dividends. As a result, you can expect to receive a return on your investment in our common stock only if the market price of the stock increases.
Provisions in our charter documents and under Delaware law could discourage a takeover that stockholders may consider favorable.
Provisions in our certificate of incorporation and by-laws may have the effect of delaying or preventing a change of control or changes in our management. Amongst other things, these provisions:
|
● |
authorize the issuance of “blank check” preferred stock that could be issued by our board of directors to defend against a takeover attempt; |
|
● |
establish a classified board of directors, as a result of which the successors to the directors whose terms have expired will be elected to serve from the time of election and qualification until the third annual meeting following their election; |
|
● |
require that directors only be removed from office for cause and only upon a supermajority stockholder vote; |
|
● |
provide that vacancies on the board of directors, including newly created directorships, may be filled only by a majority vote of directors then in office rather than by stockholders; |
|
● |
prevent stockholders from calling special meetings; and |
|
● |
prohibit stockholder action by written consent, requiring all actions to be taken at a meeting of the stockholders. |
In addition, we are governed by the provisions of Section 203 of the Delaware General Corporation Law, which generally prohibits a Delaware corporation from engaging in a broad range of business combinations with any “interested” stockholder for a period of three years following the date on which the stockholder becomes an “interested” stockholder.
None.
30
Our principal executive offices are located in Mountain View, California, and include four buildings totaling approximately 110,000 square feet under leases expiring from October to December, 2020. We maintain additional leased spaces in Marina Del Rey, California as well as Cincinnati, Ohio, Bangalore, India and London, the United Kingdom. We believe our properties are generally suitable to meet our needs for the foreseeable future. In addition, to the extent we require additional space in the future, we believe that it would be readily available on commercially reasonable terms.
On March 11, 2015, a putative stockholder class action lawsuit was filed against us, the members of our board of directors, certain of our executive officers and the underwriters of our IPO: Nguyen v. Coupons.com Incorporated, Case No. CGC-15-544654 (California Superior Court, San Francisco County). The complaint asserts claims under the Securities Act and seeks unspecified damages and other relief on behalf of a putative class of persons and entities who purchased stock pursuant or traceable to the registration statement and prospectus for our IPO. We intend to defend the litigation vigorously. Based on information currently available, we have determined that an amount or range of probable loss is not reasonably estimable.
In addition, we are a party to litigation and subject to claims incident to the ordinary course of business. Although the results of litigation and claims cannot be predicted with certainty, we currently believe that the final outcome of these matters will not have a material adverse effect on our business, financial condition or results of operations. Regardless of the outcome, litigation can have an adverse impact on our business because of defense and settlement costs, diversion of management resources and other factors.
None.
31
PART II
|
Item 5. |
Market for Registrant’s Common Equity, Related Stockholder Matters and Issuer Purchases of Equity Securities. |
Market Information
Our common stock, $0.00001 par value, began trading on the New York Stock Exchange under the symbol “COUP” on March 7, 2014, the date of our IPO.
The following table sets forth for the indicated periods from the date our common stock commenced trading in connection with our IPO, the high and low closing sales prices of our common stock as reported on the New York Stock Exchange.
|
|
High |
|
|
Low |
|
||
|
Year ended December 31, 2014 |
|
|
|
|
|
|
|
|
First quarter (from March 7, 2014) |
$ |
33.00 |
|
|
$ |
22.71 |
|
|
Second quarter |
$ |
32.67 |
|
|
$ |
15.56 |
|
|
Third quarter |
$ |
26.50 |
|
|
$ |
11.61 |
|
|
Fourth quarter |
$ |
17.97 |
|
|
$ |
11.75 |
|
Holders
As of March 18, 2015, there were 139 holders of record of our common stock, including American Stock Transfer & Trust Company, LLC, which holds shares of our common stock on behalf of an indeterminate number of beneficial owners.
Dividend Policy
We have never declared or paid any dividends on our common stock and do not anticipate that we will pay any dividends to holders of our common stock in the foreseeable future. Instead, we currently plan to retain any earnings to finance the growth of our business. The terms of our credit and security agreement also restrict our ability to pay dividends. Any future determination relating to dividend policy will be made at the discretion of our board of directors and will depend on our financial condition, results of operations and capital requirements as well as other factors deemed relevant by our board of directors.
32
Performance Graph
The following shall not be deemed “filed” for purposes of Section 18 of the Exchange Act, or incorporated by reference into any of our other filings under the Exchange Act or the Securities Act, except to the extent we specifically incorporate it by reference into such filing.
This chart compares the cumulative total return on our common stock with that of the Russell 3000 and the S&P North American Technology Internet Index. The chart assumes $100 was invested at the close of market on March 7, 2014, in our common stock, the Russell 3000 and the S&P North American Technology Internet Index, and assumes the reinvestment of any dividends. The stock price performance on the following graph is not necessarily indicative of future stock price performance.
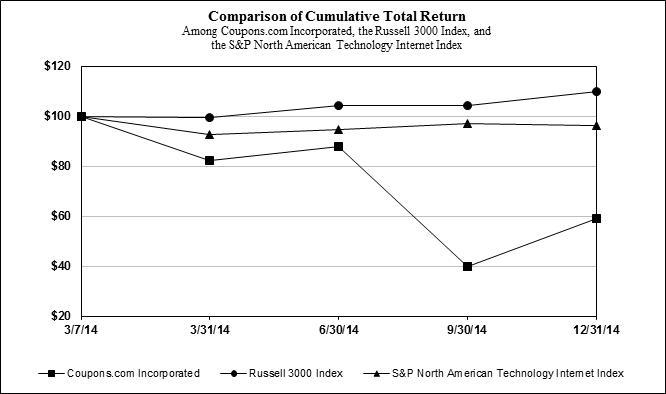
|
|
|
Base |
|
|
INDEXED RETURNS |
|
||||||||||||||
|
|
|
Period |
|
|
Quarter Ending |
|
||||||||||||||
|
Company / Index |
|
3/7/14 |
|
|
3/31/14 |
|
|
6/30/14 |
|
|
9/30/14 |
|
|
12/31/14 |
|
|||||
|
Coupons.com Incorporated |
|
$ |
100 |
|
|
$ |
82 |
|
|
$ |
88 |
|
|
$ |
40 |
|
|
$ |
59 |
|
|
Russell 3000 Index |
|
$ |
100 |
|
|
$ |
99 |
|
|
$ |
104 |
|
|
$ |
104 |
|
|
$ |
110 |
|
|
S&P North American Technology Internet Index |
|
$ |
100 |
|
|
$ |
93 |
|
|
$ |
95 |
|
|
$ |
97 |
|
|
$ |
96 |
|
Unregistered Sales of Equity Securities
Not applicable.
Use of Proceeds from Public Offering of Common Stock
In March 2014, the Company completed its IPO in which it issued and sold 12,075,000 shares of common stock at a public offering price of $16.00 per share. The Company received net proceeds of $179.7 million after deducting underwriting discounts and commissions of $13.5 million, but before deducting offering expenses of $5.4 million.
There has been no material change in the planned use of proceeds from our IPO as described in our final prospectus filed with the SEC on March 7, 2014 pursuant to Rule 424(b) under the Securities Act. Pending the uses described, we maintain the cash received in cash and cash equivalents.
33
|
|
Year Ended December 31, |
|
|||||||||||||||||
|
|
2014 |
|
|
2013 |
|
|
2012 |
|
|
2011 |
|
|
2010 |
|
|||||
|
|
(in thousands, except per share data) |
|
|||||||||||||||||
|
Revenues |
$ |
221,761 |
|
|
$ |
167,892 |
|
|
$ |
112,127 |
|
|
$ |
91,325 |
|
|
$ |
61,406 |
|
|
Costs and expenses: |
|
|
|
|
|
|
|
|
|
|
|
|
|
|
|
|
|
|
|
|
Cost of revenues (1) |
|
86,186 |
|
|
|
52,080 |
|
|
|
41,745 |
|
|
|
27,841 |
|
|
|
18,440 |
|
|
Sales and marketing (1) |
|
78,865 |
|
|
|
61,793 |
|
|
|
63,526 |
|
|
|
44,834 |
|
|
|
30,044 |
|
|
Research and development (1) |
|
49,583 |
|
|
|
40,102 |
|
|
|
40,236 |
|
|
|
21,824 |
|
|
|
10,019 |
|
|
General and administrative (1) |
|
33,392 |
|
|
|
24,232 |
|
|
|
25,999 |
|
|
|
18,996 |
|
|
|
10,723 |
|
|
Change in fair value of contingent consideration |
|
(5,741 |
) |
|
|
— |
|
|
|
— |
|
|
|
— |
|
|
|
— |
|
|
Total costs and expenses |
|
242,285 |
|
|
|
178,207 |
|
|
|
171,506 |
|
|
|
113,495 |
|
|
|
69,226 |
|
|
Loss from operations |
|
(20,524 |
) |
|
|
(10,315 |
) |
|
|
(59,379 |
) |
|
|
(22,170 |
) |
|
|
(7,820 |
) |
|
Interest expense |
|
(922 |
) |
|
|
(953 |
) |
|
|
(212 |
) |
|
|
(698 |
) |
|
|
(157 |
) |
|
Other income (expense), net |
|
(72 |
) |
|
|
19 |
|
|
|
92 |
|
|
|
(220 |
) |
|
|
(3,899 |
) |
|
Loss before income taxes |
|
(21,518 |
) |
|
|
(11,249 |
) |
|
|
(59,499 |
) |
|
|
(23,088 |
) |
|
|
(11,876 |
) |
|
Provision for (benefit from) income taxes |
|
1,926 |
|
|
|
— |
|
|
|
(265 |
) |
|
|
(118 |
) |
|
|
17 |
|
|
Net loss |
$ |
(23,444 |
) |
|
$ |
(11,249 |
) |
|
$ |
(59,234 |
) |
|
$ |
(22,970 |
) |
|
$ |
(11,893 |
) |
|
Deemed dividend to investors in relation to tender offer |
|
— |
|
|
|
— |
|
|
|
— |
|
|
|
6,933 |
|
|
|
— |
|
|
Net loss attributable to common stockholders |
$ |
(23,444 |
) |
|
$ |
(11,249 |
) |
|
$ |
(59,234 |
) |
|
$ |
(29,903 |
) |
|
$ |
(11,893 |
) |
|
Net loss per share attributable to common stockholders, basic and diluted |
$ |
(0.35 |
) |
|
$ |
(0.57 |
) |
|
$ |
(3.72 |
) |
|
$ |
(2.14 |
) |
|
$ |
(1.02 |
) |
|
Weighted-average number of common shares used in computing net loss per share attributable to common stockholders, basic and diluted |
|
67,828 |
|
|
|
19,626 |
|
|
|
15,927 |
|
|
|
13,944 |
|
|
|
11,699 |
|
|
|
|
|
|
|
|
|
|
|
|
|
|
|
|
|
|
|
|
|
|
|
(1) The stock-based compensation expense included above was as follows: |
|
|
|
|
|
|
|
|
|
|
|
|
|
|
|
|
|
|
|
|
|
Year Ended December 31, |
|
|||||||||||||||||
|
|
2014 |
|
|
2013 |
|
|
2012 |
|
|
2011 |
|
|
2010 |
|
|||||
|
|
(in thousands) |
|
|||||||||||||||||
|
Cost of revenues |
$ |
3,086 |
|
|
$ |
300 |
|
|
$ |
378 |
|
|
$ |
295 |
|
|
$ |
44 |
|
|
Sales and marketing |
|
9,464 |
|
|
|
1,492 |
|
|
|
1,880 |
|
|
|
849 |
|
|
|
203 |
|
|
Research and development |
|
11,536 |
|
|
|
1,015 |
|
|
|
1,532 |
|
|
|
962 |
|
|
|
183 |
|
|
General and administrative |
|
11,424 |
|
|
|
2,374 |
|
|
|
1,778 |
|
|
|
2,464 |
|
|
|
1,012 |
|
|
Total stock-based compensation |
$ |
35,510 |
|
|
$ |
5,181 |
|
|
$ |
5,568 |
|
|
$ |
4,570 |
|
|
$ |
1,442 |
|
|
|
Year Ended December 31, |
|
|||||||||||||||||
|
|
2014 |
|
|
2013 |
|
|
2012 |
|
|
2011 |
|
|
2010 |
|
|||||
|
|
(in thousands) |
|
|||||||||||||||||
|
Consolidated Balance Sheet Data: |
|
|
|
|
|
|
|
|
|
|
|
|
|
|
|
|
|
|
|
|
Cash and cash equivalents |
$ |
201,075 |
|
|
$ |
38,972 |
|
|
$ |
58,395 |
|
|
$ |
100,462 |
|
|
$ |
19,732 |
|
|
Working capital |
|
204,837 |
|
|
|
21,420 |
|
|
|
45,423 |
|
|
|
97,108 |
|
|
|
21,987 |
|
|
Property and equipment, net |
|
25,399 |
|
|
|
29,942 |
|
|
|
27,282 |
|
|
|
12,370 |
|
|
|
4,357 |
|
|
Total assets |
|
331,807 |
|
|
|
134,236 |
|
|
|
131,892 |
|
|
|
148,748 |
|
|
|
44,331 |
|
|
Deferred revenues |
|
6,219 |
|
|
|
6,751 |
|
|
|
7,406 |
|
|
|
4,870 |
|
|
|
3,678 |
|
|
Total liabilities |
|
54,919 |
|
|
|
66,220 |
|
|
|
62,012 |
|
|
|
28,125 |
|
|
|
33,477 |
|
|
Debt obligations |
|
7,500 |
|
|
|
23,077 |
|
|
|
14,743 |
|
|
|
— |
|
|
|
16,019 |
|
|
Redeemable convertible preferred stock |
|
— |
|
|
|
270,262 |
|
|
|
270,262 |
|
|
|
270,262 |
|
|
|
79,726 |
|
|
Total stockholder's equity (deficit) |
|
276,888 |
|
|
|
(202,246 |
) |
|
|
(200,382 |
) |
|
|
(149,639 |
) |
|
|
(68,872 |
) |
34
You should read the following discussion and analysis of our financial condition and results of operations in conjunction with the consolidated financial statements and the related notes to consolidated financial statements included elsewhere in this annual report on Form 10-K. In addition to historical financial information, the following discussion contains forward-looking statements that reflect our plans, estimates, beliefs and expectations that involve risks and uncertainties. Our actual results and the timing of events could differ materially from those discussed in these forward-looking statements. Factors that could cause or contribute to these differences include those discussed below and elsewhere in this prospectus, particularly in “Risk Factors” and “Special Note Regarding Forward-Looking Statements.”
Overview
We connect great brands and retailers with consumers delivering digital promotions and media to consumers. Over 2,000 brands from approximately 700 consumer packaged goods companies (“CPGs”) and many of the leading grocery, drug, dollar channel and mass merchandise retailers use our digital platform to engage consumers at the critical moments when they are choosing which products they will buy and where they will shop. We deliver digital coupons, including coupon codes, and media and advertising through our platform. Our platform includes our web, mobile and social channels, as well as those of our CPGs and retailers, and our extensive network of approximately 30,000 publishers that display our coupon and media offerings on their websites and mobile applications.
Our platform distributes digital promotions and media at scale across multiple channels enabling CPGs and retailers to deliver promotions and media to consumers at the point when they are most engaged and likely to make a purchasing decision. Our platform is comprised of promotional channels, including our Digital FSI Network, which is our network of publishers that display our coupons and media offerings, our retail point of sale solutions which includes Retailer iQ, mobile solutions, publishing tools, which enhance the effectiveness of the promotions we offer, and media. Our technology gives CPGs control over the number of coupons distributed and the number of CPG-authorized activations per coupon, which enhances the security of digital coupons.
We generate promotion revenues from digital transactions on our network. Each time a consumer activates a digital coupon on our platform by either printing it for physical redemption at a retailer or saving it to a retailer loyalty account for automatic digital redemption, we are paid a fee that is not dependent on the digital coupon being redeemed. For coupon codes, we are generally paid a fee when a consumer makes a purchase using a coupon code from our platform. We generally pay a distribution fee to retailers or publishers when a consumer activates a digital promotion on their website or mobile app. These distribution fees are included in our cost of revenues. We also generate media revenue through the placement of online advertisements from CPGs and retailers that are displayed on our websites and mobile apps, as well as those of our publishers, retailers and other third parties.
Our CPG customers include many of the leading food, beverage, drug, personal and household product manufacturers. We primarily generate revenue from CPGs through coupons and media offered through our platform and our publisher network. Retailers on our platform include leading grocery, drug, dollar channel and mass market retailers. We also service a broad range of specialty stores, including clothing, electronics, home improvement and many others through which we generate revenue primarily from offering coupon codes through our platform.
Our operating expenses may increase in the future as we continue to invest in research and development to enhance our platform and in sales and marketing to acquire new CPG and retailer customers and increase revenues from our existing customers.
For 2014, 2013 and 2012, our revenues were $221.8 million, $167.9 million and $112.1 million, respectively. Our net loss for 2014, 2013 and 2012 was $23.4 million, $11.2 million and $59.2 million, respectively.
Non- GAAP Financial Measure and Key Operating Metrics
Adjusted EBITDA, a non-GAAP financial measure, is a key metric used by our management and board of directors to understand and evaluate our core operating performance and trends, to prepare and approve our annual budget, to develop short and long-term operational plans, and to determine bonus payouts. In particular, we believe that the exclusion of the expenses eliminated in calculating Adjusted EBITDA can provide a useful measure for period-to-period comparisons of our core business. Additionally, Adjusted EBITDA is a key financial metric used by the compensation committee of our board of directors in connection with the determination of compensation for our executive officers. Accordingly, we believe that Adjusted EBITDA provides useful information to investors and others in understanding and evaluating our operating results in the same manner as our management and board of directors.
35
We define a “transaction” as the distribution of a digital coupon through our platform that generates revenues. We believe our ability to increase the number of transactions using our platform is an important indicator of our ability to grow our revenues.
Adjusted EBITDA and number of transactions for each of the periods presented were as follows:
|
|
Year Ended December 31, |
|
|||||||||
|
|
2014 |
|
|
2013 |
|
|
2012 |
|
|||
|
|
(in thousands) |
|
|||||||||
|
Adjusted EBITDA |
$ |
23,982 |
|
|
$ |
1,725 |
|
|
$ |
(47,255 |
) |
|
Transactions |
|
1,608,082 |
|
|
|
1,311,973 |
|
|
|
916,724 |
|
Our use of adjusted EBITDA has limitations as an analytical tool, and you should not consider it in isolation or as a substitute for analysis of our results as reported under GAAP. Some of these limitations are:
|
· |
although depreciation and amortization are non-cash charges, the assets being depreciated and amortized may have to be replaced in the future, and adjusted EBITDA does not reflect cash capital expenditure requirements for such replacements or for new capital expenditure requirements; |
|
· |
adjusted EBITDA does not reflect changes in, or cash requirements for, our working capital needs; |
|
· |
adjusted EBITDA does not consider the potentially dilutive impact of stock-based compensation; |
|
· |
adjusted EBITDA does not reflect tax payments that may represent a reduction in cash available to us; |
|
· |
adjusted EBITDA also does not include the effects of interest and taxes and excludes changes in fair value of contingent consideration; and |
|
· |
other companies, including companies in our industry, may calculate adjusted EBITDA differently, which reduces its usefulness as a comparative measure. |
A reconciliation of Adjusted EBITDA to net loss, the most directly comparable GAAP financial measure, for each of the periods presented is as follows:
|
|
Year Ended December 31, |
|
|||||||||
|
|
2014 |
|
|
2013 |
|
|
2012 |
|
|||
|
|
(in thousands) |
|
|||||||||
|
Net loss |
$ |
(23,444 |
) |
|
$ |
(11,249 |
) |
|
$ |
(59,234 |
) |
|
Adjustments: |
|
|
|
|
|
|
|
|
|
|
|
|
Interest expense |
|
922 |
|
|
|
953 |
|
|
|
212 |
|
|
Other income (expense), net |
|
72 |
|
|
|
(19 |
) |
|
|
(92 |
) |
|
Provision for income taxes |
|
1,926 |
|
|
|
— |
|
|
|
(265 |
) |
|
Depreciation and amortization |
|
14,737 |
|
|
|
6,859 |
|
|
|
6,556 |
|
|
Stock-based compensation |
|
35,510 |
|
|
|
5,181 |
|
|
|
5,568 |
|
|
Change in fair value of contingent consideration |
|
(5,741 |
) |
|
|
— |
|
|
|
— |
|
|
Total adjustments |
$ |
47,426 |
|
|
$ |
12,974 |
|
|
$ |
11,979 |
|
|
|
|
|
|
|
|
|
|
|
|
|
|
|
Adjusted EBITDA |
$ |
23,982 |
|
|
$ |
1,725 |
|
|
$ |
(47,255 |
) |
This non-GAAP financial measure is not intended to be considered in isolation from, as substitute for, or as superior to, the corresponding financial measure prepared in accordance with GAAP. Because of these and other limitations, Adjusted EBITDA should be considered along with other GAAP based financial performance measures, including various cash flow metrics, net loss, and our other GAAP financial results.
Factors Affecting Our Performance
Obtain high quality coupons and increase the number of CPG-authorized activations. Our growth in revenues will depend upon our ability to continue to obtain high quality coupons and increase the number of CPG-authorized activations available through our platform. If we are unable to obtain high quality coupons and increase the number of CPG-authorized activations, we will not be able to increase the number of transactions and the growth in our revenues or our revenues will be adversely affected.
36
Increasing revenue from CPGs on our platform. Our future revenue growth depends upon our ability to continue to increase revenues from existing CPGs on our platform. This includes increasing our share of CPG spending on overall coupons, media and trade promotions; increasing the number of brands that are using our platform within each CPG; increasing media spending on our platform; and maximizing lifetime value of consumers across all platforms.
Variability in promotional spend by CPGs. Our revenues may fluctuate due to changes in promotional spending budgets of CPGs and retailers and the timing of their promotional spending. Decisions by major CPGs or retailers to delay or reduce their promotional and media spending, move campaigns, or divert spending away from digital promotions or media could slow our revenue growth or reduce our revenues.
Ability to scale Retailer iQ and further integrate with Retailers. Our growth in revenues will depend upon our ability to successfully implement and scale Retailer iQ among retailers. If we are unable to successfully implement Retailer iQ, or it is not adopted and supported with sufficient resources by retailers, the growth in our revenues will be adversely affected. Our future revenue growth is also dependent upon our ability to further integrate digital promotions and media into retailers’ loyalty or point of sale systems and other channels so that CPGs and retailers can more effectively engage consumers and drive their own sales.
Growth of our consumer selection and digital offerings. Our future revenue growth will depend on our ability to innovate and invest in promotion and media solutions, including Retailer iQ, mobile solutions and digital promotion offerings for specialty/franchise retail, including coupon codes, and leverage our reach to consumers and the strength of our platform to broaden the selection and use of coupon codes by consumers.
International Growth and Acquisitions. Our growth in revenues will also depend on our ability to grow our operations and offerings in existing international markets and expand our business through selective acquisitions.
Increase in software amortization expense. During the years ended December 31, 2014, 2013 and 2012, we capitalized $3.6 million, $6.8 million and $16.3 million, respectively, of development costs related to promotions and media technologies, including Retailer iQ. We recognized $7.7 million of amortization expense in cost of revenues related to Retailer iQ during the year ended December 31, 2014. There was no similar amortization expense for the years ended December 31, 2013 and 2012, as Retailer iQ was previously under development. The unamortized capitalized development and enhancement costs related to Retailer iQ were $19.0 million as of December 31, 2014. We expect to amortize the costs over their remaining estimated useful life of three years.
Stock-based compensation expense. We have granted restricted stock units, or RSUs, to certain of our employees and directors. The fair value of these RSUs equals the market value of our common stock on the date of grant. RSUs granted prior to our IPO have a contractual term of seven years and vest upon the satisfaction of both a service condition and a liquidity-event condition. The service condition is satisfied as to 25% of the RSUs on each of the first four anniversaries of the vesting commencement date. The liquidity-event condition is satisfied upon the earlier of (i) six months after the effective date of the IPO or (ii) March 15 of the calendar year following the year in which the IPO was declared effective; and (iii) the time immediately prior to the consummation of a change in control. The vesting condition that was satisfied six months following our IPO did not affect the expense attribution period for the RSUs for which the service condition has been met as of the date of our IPO. This six-month period was not a substantive service condition and, accordingly, beginning on the effectiveness of our IPO in March 2014, we recognized a cumulative stock-based compensation expense for the portion of the RSUs that had met the service condition as of the date of our IPO. We recognized stock-based compensation expense of $29.5 million during the year ended December 31, 2014 associated with RSUs. There was no stock-based compensation expense associated with RSUs during the years ended December 31, 2013 and 2012.
RSUs granted on or after our IPO have similar terms as the RSUs granted prior to the IPO, but are not subject to a liquidity-event condition in order to vest, and the compensation expense is recognized on a straight-line basis over the applicable service period
Components of Our Results of Operations
Revenues
We generate revenues by delivering digital coupons, including coupons and coupon codes, and digital media through our platform. CPGs and retailers choose one or more of our offerings and are charged a fee for each selected offering. Our customers generally submit insertion orders that outline the terms and conditions of a campaign, including the channels through which the campaign will be run, the offerings for each selected channel, the type of content to be
37
delivered, the timeframe of the campaign, the number of authorized activations and the pricing of the campaign. Substantially all of our revenues are generated from sales in the United States.
Coupons. We generate revenues, as consumers select, or activate, a coupon through our platform by either printing it for physical redemption at a retailer or saving it to a retailer loyalty account for automatic digital redemption. In the case of the setup fees, we recognize revenues proportionally, on a per activation basis, using the number of authorized activations per insertion order, commencing on the date of the first coupon activation. For coupons, the pricing is generally determined on a per unit activation basis and revenue recognition is not dependent upon whether our coupons are redeemed. Setup fees charged to customers represent charges for the creation of digital coupons and related activation, tracking and security features. Upfront insertion orders generally include a limit on the number of activations, or times consumers may select a coupon.
Coupon Codes. We generally generate revenues when a consumer makes a purchase using a coupon code from our platform and completion of the order is reported to us. In the same period that we recognize revenues for the delivery of coupon codes, we also estimate and record a reserve, based upon historical experience, to provide for end-user cancelations or product returns which may not be reported until a subsequent date.
Digital Media. Our media services enable CPGs and retailers to distribute digital media to promote their brands and products on our websites, and mobile apps, and through a network of our publishers and non-publisher third parties that display our media offerings on their websites or mobile apps. We charge a fee for these media campaigns, the pricing of which is based on the advertisement size and position. Related fees are billed monthly, based on a per-impressions or a per-click basis.
Cost of Revenues
Cost of revenues includes the costs resulting from distribution fees. If we deliver a digital coupon or media on a retailer’s website or mobile apps or through its loyalty program, or the website or mobile apps of a publisher, we generally pay a distribution fee to the retailer or publisher which is included in our cost of revenues. These costs are expensed as incurred. We generally do not pay a distribution fee for a coupon or code which is offered through the website of the CPG or retailer that is offering the coupon or coupon code. From time to time, we have entered into arrangements pursuant to which we have agreed to the payment of minimum distribution or other service fees that are included in our cost of revenues. Such minimum commitments are less than the amounts we expect to actually pay, and as a result, we do not expect them to have a material impact on our results of operations. Distribution fees as a percent of total revenues were 15%, 15% and 14% during the years ended December 31, 2014, 2013 and 2012. Cost of revenues also includes personnel costs, depreciation and amortization expense of equipment, software and acquired intangible assets incurred on revenue producing technologies, data center costs and third-party service fees. Personnel costs related to costs of revenues include salaries, bonuses, stock-based compensation and employee benefits. These costs are primarily attributable to individuals maintaining our data centers and members of our network operations group, which initiates, sets up and delivers digital promotion and media campaigns. Cost of revenues also includes third-party data center costs. We capitalize costs related to software that is developed or obtained for internal use, including Retailer iQ. Costs incurred in connection with internal software development for revenue producing technologies are capitalized and are amortized in cost of revenues over the internal use software’s useful life. The amortization of these costs begins when the internally developed software is ready for its intended use. We expect our cost of revenues to increase in absolute dollars in future periods as we recognize the amortization of these previously capitalized costs and as we incur additional related costs required to manage and operate Retailer iQ. We began to incur these expenses in the first half of 2014 prior to the recognition of material corresponding revenue.
Although our cost of revenues will increase in absolute dollars as our total revenue increases, we anticipate our cost of revenues other than distribution fees will generally increase at a rate lower than our rate of revenue growth.
Operating Expenses
We classify our operating expenses into three categories: sales and marketing, research and development and general and administrative. Our operating expenses consist primarily of personnel costs and, to a lesser extent, professional fees and rent. Personnel costs for each category of operating expenses generally include salaries, bonuses, stock-based compensation and employee benefits.
Sales and marketing. Our sales and marketing expenses consist primarily of personnel costs (including commissions) and, to a lesser extent, costs associated with professional services, brand marketing, travel, trade shows
38
and marketing materials. We expect sales and marketing expenses to increase in absolute dollars as we hire additional personnel and continue to expand our marketing related programs designed to increase our revenues.
Research and development. Our research and development expenses consist primarily of personnel and related headcount costs and costs of professional services associated with the ongoing development of our technology. Personnel costs include salaries, bonuses, stock-based compensation expense and employee benefit costs. Currently, substantially all of our developers are located in our Mountain View, California headquarters. In January 2015, we opened a research and development center in Bangalore, India and anticipate growing employees there in 2015.
We have historically entered into various long-term technology development and support agreements pursuant to which we utilize third-party software development and related services. We regularly evaluate the costs and benefits of utilizing third-party services versus internal resources and do not believe that our current commitments will result in any material change in the relationship between our costs and revenues. We anticipate that we will decrease our use of third-party services in the future. We believe that continued investment in technology is critical to attaining our strategic objectives, and, as a result, we expect research and development expenses to increase in absolute dollars in future periods.
General and administrative. Our general and administrative expenses consist primarily of personnel costs associated with our executive, finance, legal, human resources, compliance and other administrative personnel, as well as accounting and legal professional services fees and other corporate expenses. We expect general and administrative expenses to increase in absolute dollars in future periods as we continue to invest in corporate infrastructure and incur additional expenses associated with being a public company, including increased legal and accounting costs, investor relations costs, higher insurance premiums and compliance costs associated with Section 404 of the Sarbanes-Oxley Act.
Change in fair value of contingent consideration. The change in fair value of contingent consideration is result of our remeasurement of the contingent consideration liability from the acquisition of the assets of Eckim LLC, or Eckim, in August 2014, which we refer to as the Eckim acquisition.
Interest expense
Interest expense is primarily related to our debt obligations.
Other Income (Expense), Net
Other income (expense), net, includes interest income and foreign exchange gains and losses.
Provision for (Benefit from) Income Taxes
The provision for (benefit from) income taxes for the years ended December 31, 2014, 2013, and 2012 was $1.9 million, $0 and $(265,000), respectively. The provision for income taxes of $1.9 million for the year ended December 31, 2014 was primarily related to the recognition of deferred tax liabilities that arose from the gain we recorded as result of a change in the contingent consideration from the Eckim acquisition. There was no provision or benefit recorded for the year ended December 31, 2013 due to the valuation allowance recorded against substantially all of our deferred tax assets. The benefit from income taxes of $(265,000) for the year ended December 31, 2012 was related to the change in the tax basis versus the carrying amounts of acquired intangibles.
39
Results of Operations
The following tables set forth our consolidated results of operations and our consolidated results of operations as a percentage of revenues for the periods presented.
|
|
Year Ended December 31, |
|
|||||||||||||||||||||
|
|
2014 |
|
|
2013 |
|
|
2012 |
|
|||||||||||||||
|
|
(in thousands, except percentages) |
|
|||||||||||||||||||||
|
Revenues |
$ |
221,761 |
|
|
|
100.0 |
% |
|
$ |
167,892 |
|
|
|
100.0 |
% |
|
$ |
112,127 |
|
|
|
100.0 |
% |
|
Cost of revenues |
|
86,186 |
|
|
|
38.9 |
% |
|
|
52,080 |
|
|
|
31.0 |
% |
|
|
41,745 |
|
|
|
37.2 |
% |
|
Gross profit |
|
135,575 |
|
|
|
61.1 |
% |
|
|
115,812 |
|
|
|
69.0 |
% |
|
|
70,382 |
|
|
|
62.8 |
% |
|
Operating expenses: |
|
|
|
|
|
|
|
|
|
|
|
|
|
|
|
|
|
|
|
|
|
|
|
|
Sales and marketing |
|
78,865 |
|
|
|
35.6 |
% |
|
|
61,793 |
|
|
|
36.8 |
% |
|
|
63,526 |
|
|
|
56.7 |
% |
|
Research and development |
|
49,583 |
|
|
|
22.4 |
% |
|
|
40,102 |
|
|
|
23.9 |
% |
|
|
40,236 |
|
|
|
35.9 |
% |
|
General and administrative |
|
33,392 |
|
|
|
15.1 |
% |
|
|
24,232 |
|
|
|
14.4 |
% |
|
|
25,999 |
|
|
|
23.2 |
% |
|
Change in fair value of contingent consideration |
|
(5,741 |
) |
|
|
(2.6 |
)% |
|
|
— |
|
|
|
— |
% |
|
|
— |
|
|
|
— |
% |
|
Total operating expenses |
|
156,099 |
|
|
|
70.5 |
% |
|
|
126,127 |
|
|
|
75.1 |
% |
|
|
129,761 |
|
|
|
115.8 |
% |
|
Loss from operations |
|
(20,524 |
) |
|
|
(9.4 |
)% |
|
|
(10,315 |
) |
|
|
(6.1 |
)% |
|
|
(59,379 |
) |
|
|
(53.0 |
)% |
|
Interest expense |
|
(922 |
) |
|
|
(0.4 |
)% |
|
|
(953 |
) |
|
|
(0.6 |
)% |
|
|
(212 |
) |
|
|
(0.2 |
)% |
|
Other income (expense), net |
|
(72 |
) |
|
|
(— |
)% |
|
|
19 |
|
|
|
— |
% |
|
|
92 |
|
|
|
0.1 |
% |
|
Loss before income taxes |
|
(21,518 |
) |
|
|
(9.8 |
)% |
|
|
(11,249 |
) |
|
|
(6.7 |
)% |
|
|
(59,499 |
) |
|
|
(53.1 |
)% |
|
Provision for (benefit from) income taxes |
|
1,926 |
|
|
|
0.9 |
% |
|
|
— |
|
|
|
— |
% |
|
|
(265 |
) |
|
|
(0.2 |
)% |
|
Net loss |
$ |
(23,444 |
) |
|
|
(10.7 |
)% |
|
$ |
(11,249 |
) |
|
|
(6.7 |
)% |
|
$ |
(59,234 |
) |
|
|
(52.9 |
)% |
Comparison of the Years Ended December 31, 2014, 2013 and 2012
Revenues
|
|
Year Ended December 31, |
|
|
|
|
|
|
|
|
|
|
Year Ended December 31, |
|
|
|
|
|
|
|
|
|
||||||||||
|
|
2014 |
|
|
2013 |
|
|
$ Change |
|
|
% Change |
|
|
2013 |
|
|
2012 |
|
|
$ Change |
|
|
% Change |
|
||||||||
|
|
(in thousands, except percentages) |
|
|||||||||||||||||||||||||||||
|
Revenues |
$ |
221,761 |
|
|
$ |
167,892 |
|
|
$ |
53,869 |
|
|
|
32 |
% |
|
$ |
167,892 |
|
|
$ |
112,127 |
|
|
$ |
55,765 |
|
|
|
50 |
% |
2014 Compared to 2013
Revenues increased by $53.9 million, or 32%, during 2014 compared to 2013. This increase was primarily attributable to an increase in the number of transactions on our platform during 2014 to 1.6 billion from 1.3 billion during 2013 and to a lesser extent from increases in the number of insertion orders for coupons that also included media placements. The increase in revenue was also driven by an increase in activity from consumers making a purchase using a coupon code from our platform. During 2014, revenues from digital promotion transactions and digital media were 76% and 24% of total revenues, respectively, as compared to 81% and 19% of total revenues, respectively, for 2013. We expect the costs associated with Retailer iQ to continue to increase in the future in absolute dollars as we continue to deploy and scale Retailer iQ across retailers, with a higher increase in cost expected in the second-half of 2015.
2013 Compared to 2012
Revenues increased by $55.8 million, or 50%, during 2013 compared to 2012. This increase was primarily attributable to an increase in the number of transactions during 2013 to 1.3 billion from 0.9 billion during 2012 and to an extent from increases in the number of insertion orders for digital media. The increase in revenue was also driven by an increase in activity from consumers making a purchase using a coupon code from our platform. The size of the increase in the number of transactions was in part due to the recovery of our revenue growth after the first half of 2012. In the first half of 2012, as we scaled our technology infrastructure to support our growth, our technology for securely identifying unique users and devices inadvertently prevented our personalization algorithms from optimally displaying our digital coupons to consumers, which adversely affected our revenue growth. Our revenue growth improved beginning in the third quarter of 2012 once we resolved the issue. During 2013 and 2012, revenues from digital promotion transactions and digital media remained consistent at 81% and 19% of total revenues, respectively.
40
Cost of Revenues and Gross Profit
|
|
Year Ended December 31, |
|
|
|
|
|
|
|
|
|
|
Year Ended December 31, |
|
|
|
|
|
|
|
|
|
||||||||||
|
|
2014 |
|
|
2013 |
|
|
$ Change |
|
|
% Change |
|
|
2013 |
|
|
2012 |
|
|
$ Change |
|
|
% Change |
|
||||||||
|
|
(in thousands, except percentages) |
|
|||||||||||||||||||||||||||||
|
Cost of revenues |
$ |
86,186 |
|
|
$ |
52,080 |
|
|
$ |
34,106 |
|
|
|
65 |
% |
|
$ |
52,080 |
|
|
$ |
41,745 |
|
|
$ |
10,335 |
|
|
|
25 |
% |
|
Gross profit |
|
135,575 |
|
|
|
115,812 |
|
|
|
19,763 |
|
|
|
17 |
% |
|
|
115,812 |
|
|
|
70,382 |
|
|
|
45,430 |
|
|
|
65 |
% |
|
Gross margin |
|
61 |
% |
|
|
69 |
% |
|
|
|
|
|
|
|
|
|
|
69 |
% |
|
|
63 |
% |
|
|
|
|
|
|
|
|
2014 Compared to 2013
Cost of revenues increased by $34.1 million, or 65%, during 2014 compared to 2013. The increase was primarily due to higher distribution fees and third-party service fees, increased costs associated with the deployment of Retailer iQ, and to a lesser extent higher headcount and related expenses. The increases in distribution fees and third-party service fees were related to the increased number of transactions subject to fees completed through our platform. The increases in cost related to Retailer iQ were primarily related to amortization expense and service and support costs incurred as a result of the deployment of Retailer iQ in the first quarter of 2014. The increases in headcount and related costs were primarily due to higher stock-based compensation related to RSUs and to a lesser extent, higher salaries and related costs, partly driven by our IPO. For the year ended December 31, 2014, distribution and third-party service fees increased $13.1 million, costs associated with the deployment of Retailer iQ accounted for an additional $15.5 million, and headcount and related expenses increased $3.8 million, respectively, compared to 2013.
Gross margin for the year ended December 31, 2014 decreased to 61% from 69%, respectively, compared to 2013. This decrease was primarily due to the combined impact from increased costs from Retailer iQ and increased stock-based compensation related to RSUs, partially offset by expense leverage from fixed costs and increases in media revenues.
We expect the costs associated with Retailer iQ to continue to increase in the future in absolute dollars as we continue to deploy and scale Retailer iQ across retailers, with a higher increase in cost expected in the second-half of 2015. We also believe that as the number of transactions on our platform increase, including those in connection with Retailer iQ, our cost of revenues as a percentage of revenues will decrease as we achieve increased operational efficiencies.
2013 Compared to 2012
Cost of revenues increased by $10.3 million, or 25%, during 2013 compared to 2012. This increase was primarily due to an increase in distribution fees of $9.0 million and higher third-party service fees of $1.3 million. The increase in distribution fee costs was related to the increased number of transactions subject to a distribution fee completed through our platform. The higher costs for third-party service fees were due to an increase in the number of promotions that included advertisements subject to a fee completed through our platform.
Gross margin increased to 69% during 2013 from 63% during 2012. The increase in gross margin is primarily due to an increase in the percentage of coupon code transactions and an increase in the number of promotions that included advertisements, offset in part by an increase in the percentage of transactions subject to distribution fees. The increase in gross margin was also partially due to our revenues increasing at a higher rate than the increase in our cost of revenues other than distribution fees. We believe that as the number of transactions increases, we will be able to achieve increased operational efficiencies related to our cost of revenues other than distribution fees.
Sales and Marketing
|
|
Year Ended December 31, |
|
|
|
|
|
|
|
|
|
|
Year Ended December 31, |
|
|
|
|
|
|
|
|
|
||||||||||
|
|
2014 |
|
|
2013 |
|
|
$ Change |
|
|
% Change |
|
|
2013 |
|
|
2012 |
|
|
$ Change |
|
|
% Change |
|
||||||||
|
|
(in thousands, except percentages) |
|
|||||||||||||||||||||||||||||
|
Sales and marketing |
$ |
78,865 |
|
|
$ |
61,793 |
|
|
$ |
17,072 |
|
|
|
28 |
% |
|
$ |
61,793 |
|
|
$ |
63,526 |
|
|
$ |
(1,733 |
) |
|
|
(3 |
)% |
|
Percent of revenues |
|
36 |
% |
|
|
37 |
% |
|
|
|
|
|
|
|
|
|
|
37 |
% |
|
|
57 |
% |
|
|
|
|
|
|
|
|
41
2014 Compared to 2013
Sales and marketing expenses increased $17.1 million, or 28%, during 2014 compared to 2013. The increase was primarily due to headcount and related costs and promotional and advertising costs. The increases in our promotional and advertising costs were required to support our business objectives and the growth in revenues. The increases in our headcount related costs were primarily related to increases in stock-based compensation related to RSUs and to a lesser extent, increased salaries and new hire costs required to support our growth and business objectives, including the initial roll-out of Retailer iQ. For the year ended December 31, 2014, headcount and related costs increased $8.7 million compared to 2013, and promotional and advertising costs increased $7.2 million compared to 2013.
We expect sales and marketing expenses to increase in absolute dollars in future periods as we continue to incur costs to support our growth and business objectives.
2013 Compared to 2012
Sales and marketing expenses decreased $1.7 million, or 3%, during 2013 compared to 2012. This decrease was primarily due to lower promotional advertising costs of $5.9 million, partially offset by higher personnel and related costs of $3.8 million. The decrease in promotional advertising costs was a result of improvements in the effectiveness of our distribution channels, including search engine optimization, email and consumer awareness of our brand as well as improvements in the automation of our sales and marketing functions. The increase in personnel and related costs was primarily driven by higher salaries and related headcount costs attributable to our sales and marketing organizations required to support our growth and new business objectives and higher commission expenses related to the increase in revenues.
Research and Development
|
|
Year Ended December 31, |
|
|
|
|
|
|
|
|
|
|
Year Ended December 31, |
|
|
|
|
|
|
|
|
|
||||||||||
|
|
2014 |
|
|
2013 |
|
|
$ Change |
|
|
% Change |
|
|
2013 |
|
|
2012 |
|
|
$ Change |
|
|
% Change |
|
||||||||
|
|
(in thousands, except percentages) |
|
|||||||||||||||||||||||||||||
|
Research and development |
$ |
49,583 |
|
|
$ |
40,102 |
|
|
$ |
9,481 |
|
|
|
24 |
% |
|
$ |
40,102 |
|
|
$ |
40,236 |
|
|
$ |
(134 |
) |
|
|
0 |
% |
|
Percent of revenues |
|
22 |
% |
|
|
24 |
% |
|
|
|
|
|
|
|
|
|
|
24 |
% |
|
|
36 |
% |
|
|
|
|
|
|
|
|
2014 Compared to 2013
Research and development expenses increased $9.5 million, or 24%, during 2014 compared to 2013. The increase was primarily related to the increased headcount and related costs partially offset by a decrease in research and development support services costs. The increases in headcount related expenses were primarily driven by increased RSU-related stock-based compensation and to a lesser extent higher salaries. We expect our research and development costs to increase moderately as we continue to invest in and grow our business technology objectives. For example, in January 2015 we opened a research and development center in Bangalore, India and anticipate growing employees there in 2015.
For the year ended December 31, 2014, headcount and related costs increased $12.4 million, including increases in stock-based compensation of $10.5 million and were partially offset by a decrease in the costs of our research and development consultation and support services of approximately $2.9 million, compared to 2013.
During the year ended December 31, 2014, we capitalized internal use software development costs related to Retailer iQ of $3.6 million compared to $6.8 million during 2013.
While we anticipate that we will decrease our use of third-party services in the future, we believe that continued investment in technology is critical to attaining our strategic objectives, and, as a result, we expect research and development expenses to increase in absolute dollars in future periods.
2013 Compared to 2012
Research and development expenses decreased $0.1 million, or 0.3%, during 2013 compared to 2012. This decrease was primarily due to lower personnel and related headcount costs of $2.2 million, almost fully offset by
42
increased development and support costs of $2.0 million. The decrease in personnel and headcount costs is primarily due to lower salaries and headcount resulting from a reduction in our internal research and development personnel in the third quarter of 2012. The increase in development and support costs were due to increased costs for software development of $4.8 million, as part of our ongoing investment in the development of our technology, partially offset by reductions in the costs associated with the use of third-party development services.
We capitalized internal use software development costs of $6.8 million and $16.3 million during 2013 and 2012, respectively, related to the development of Retailer iQ.
General and Administrative
|
|
Year Ended December 31, |
|
|
|
|
|
|
|
|
|
|
Year Ended December 31, |
|
|
|
|
|
|
|
|
|
||||||||||
|
|
2014 |
|
|
2013 |
|
|
$ Change |
|
|
% Change |
|
|
2013 |
|
|
2012 |
|
|
$ Change |
|
|
% Change |
|
||||||||
|
|
(in thousands, except percentages) |
|
|||||||||||||||||||||||||||||
|
General and administrative |
$ |
33,392 |
|
|
$ |
24,232 |
|
|
$ |
9,160 |
|
|
|
38 |
% |
|
$ |
24,232 |
|
|
$ |
25,999 |
|
|
$ |
(1,767 |
) |
|
|
(7 |
)% |
|
Percent of revenues |
|
15 |
% |
|
|
14 |
% |
|
|
|
|
|
|
|
|
|
|
14 |
% |
|
|
23 |
% |
|
|
|
|
|
|
|
|
2014 Compared to 2013
General and administrative expenses increased $9.2 million, or 38%, during 2014 compared to 2013. The increase was primarily due to headcount and related costs primarily from higher stock-based compensation and to a lesser extent from higher salaries and new hire costs. The increases in stock-based compensation were primarily related to RSUs. The increases in salaries and new hire costs were required to support our growth as well as to support our activities as we transitioned from a private to a public company. For the year ended December 31, 2014, headcount and related costs increased $12.8 million, including increases in stock-based compensation of $9.1 million, and increases in salaries of $2.2 million compared to 2013.
As a public company, we have incurred and expect to continue to incur significant legal, accounting, regulatory compliance and other costs that we did not incur in the periods prior to our IPO in March 2014. We expect general and administrative expenses to increase in absolute dollars in future periods as we continue to invest in corporate infrastructure and incur additional expenses associated with being a public company, including increased legal and accounting costs, investor relations costs, higher insurance premiums and compliance costs associated with Section 404 of the Sarbanes-Oxley Act.
2013 Compared to 2012
General and administrative expenses decreased $1.8 million, or 7%, during 2013 compared to 2012. This decrease was primarily due to lower legal and outside services of $2.3 million, partially offset by increases in personnel and related headcount costs of $1.1 million.
Change in Fair Value of Contingent Consideration
|
|
Year Ended December 31, |
|
|
|
|
|
|
|
|
|
|
Year Ended December 31, |
|
|
|
|
|
|
|
|
|
||||||||||
|
|
2014 |
|
|
2013 |
|
|
$ Change |
|
|
% Change |
|
|
2013 |
|
|
2012 |
|
|
$ Change |
|
|
% Change |
|
||||||||
|
|
(in thousands, except percentages) |
|
|||||||||||||||||||||||||||||
|
Change in fair value of contingent consideration |
$ |
(5,741 |
) |
|
$ |
— |
|
|
$ |
(5,741 |
) |
|
|
100 |
% |
|
$ |
— |
|
|
$ |
— |
|
|
$ |
— |
|
|
|
100 |
% |
|
Percent of revenues |
|
(2.6 |
)% |
|
|
— |
% |
|
|
|
|
|
|
|
|
|
|
(— |
)% |
|
|
— |
% |
|
|
|
|
|
|
|
|
2014 Compared to 2013
During the year ended December 31, 2014, the Company recorded a gain of $5.7 million resulting from the change in fair value of the contingent consideration from the Eckim acquisition. The change in the fair value of the contingent
43
consideration was primarily driven by the decrease in the likelihood of achieving certain revenue and profit milestones. See Note 3 (Fair Value Measurements) and Note 6 (Acquisition).
2013 Compared to 2012
There was no contingent consideration during each of the years ended December 31, 2013 and 2012.
Interest Expense and Other Income (Expense), Net
|
|
Year Ended December 31, |
|
|
|
|
|
|
|
|
|
|
Year Ended December 31, |
|
|
|
|
|
|
|
|
|
||||||||||
|
|
2014 |
|
|
2013 |
|
|
$ Change |
|
|
% Change |
|
|
2013 |
|
|
2012 |
|
|
$ Change |
|
|
% Change |
|
||||||||
|
|
(in thousands, except percentages) |
|
|||||||||||||||||||||||||||||
|
Interest expense |
$ |
(922 |
) |
|
$ |
(953 |
) |
|
$ |
31 |
|
|
|
(3 |
)% |
|
$ |
(953 |
) |
|
$ |
(212 |
) |
|
$ |
(741 |
) |
|
|
350 |
% |
|
Other income (expense), net |
|
(72 |
) |
|
|
19 |
|
|
|
(91 |
) |
|
|
* |
% |
|
|
19 |
|
|
|
92 |
|
|
|
(73 |
) |
|
|
* |
% |
|
|
$ |
(994 |
) |
|
$ |
(934 |
) |
|
$ |
(60 |
) |
|
|
* |
% |
|
$ |
(934 |
) |
|
$ |
(120 |
) |
|
$ |
(814 |
) |
|
|
* |
% |
|
|
|
* |
Not meaningful. |
2014 Compared to 2013
The increase in interest expense and other income (expense), net for the year ended December 31, 2014 was primarily due to the net effect from lower interest expense in 2014 associated with the early retirement of $15.0 million in borrowings in the third quarter of 2014, offset by increased expenses from charitable contributions.
2013 Compared to 2012
The increase in interest expense and other income (expense), net, primarily relates to increased interest expense during 2013 resulting from borrowings of $15.0 million in the fourth quarter of 2012 and $7.5 million during the third quarter of 2013.
Provision for (benefit from) Income Taxes
|
|
Year Ended December 31, |
|
|
|
|
|
|
|
|
|
|
Year Ended December 31, |
|
|
|
|
|
|
|
|
|
||||||||||
|
|
2014 |
|
|
2013 |
|
|
$ Change |
|
|
% Change |
|
|
2013 |
|
|
2012 |
|
|
$ Change |
|
|
% Change |
|
||||||||
|
|
(in thousands, except percentages) |
|
|||||||||||||||||||||||||||||
|
Provision for (benefit from) income taxes |
$ |
1,926 |
|
|
$ |
— |
|
|
$ |
1,926 |
|
|
|
100 |
% |
|
$ |
— |
|
|
$ |
(265 |
) |
|
$ |
— |
|
|
|
100 |
% |
2014 Compared to 2013
We recorded a provision for income taxes during 2014 as compared with no tax benefit or provision for income taxes in 2013. Our provision for income taxes during 2014 primarily related to the recognition of deferred tax liabilities that arose from the gain the Company recorded from a change in fair value of contingent consideration from the Eckim acquisition.
2013 Compared to 2012
We recorded no benefit or provision for income taxes during 2013 as compared with a tax benefit from income taxes in 2012. Our benefit from income taxes during 2012 was related to a change in tax basis versus carrying amounts of acquired intangible assets.
Liquidity and Capital Resources
As of December 31, 2014, our principal source of liquidity were cash and cash equivalents and marketable securities totaling $201.1 million, which were held for working capital purposes. In the near term, although we intend to continue to manage our operating expenses in line with our existing cash and available financial resources, we anticipate we will incur
44
increased spending in future periods in order to execute our long-term business plan and to support our growth and the costs associated with being a public company. As a public company, we have incurred and expect to continue to incur significant legal, accounting, regulatory compliance and other costs that we did not incur in the periods prior to our IPO. In addition, we may use cash to fund acquisitions or invest in other businesses or technologies.
Prior to 2014, we financed our operations and capital expenditures through private sales of preferred stock, term debt financing, exercise of stock options and cash flows from operations. In addition, we have raised $39.0 million in aggregate principal amount through debt. More recently in March 2014, we completed our IPO in which we issued and sold 12,075,000 shares of common stock at a public offering price of $16.00 per share for which we received proceeds of $179.7 million, which is net of underwriting discounts and commissions of $13.5 million, but before deducting offering expenses of $5.4 million.
As of December 31, 2014, we had available a revolving line of credit facility with a commercial bank that provided for advances of up to $30.0 million (if certain conditions are met) which is based on eligible accounts receivable. As of December 31, 2014, $7.5 million was outstanding on this credit facility and we were in compliance with the financial and non-financial covenants under the credit agreement.
Cash Flows
The following table summarizes our cash flows for the periods presented (in thousands):
|
|
Year Ended December 31, |
|
|||||||||
|
|
2014 |
|
|
2013 |
|
|
2012 |
|
|||
|
Cash flows provided by (used in) operating activities |
$ |
11,458 |
|
|
$ |
(14,158 |
) |
|
$ |
(46,554 |
) |
|
Cash flows used in investing activities |
|
(23,032 |
) |
|
|
(14,485 |
) |
|
|
(12,770 |
) |
|
Cash flows provided by financing activities |
|
173,662 |
|
|
|
9,222 |
|
|
|
17,263 |
|
|
Effects of exchange rates on cash |
|
15 |
|
|
|
(2 |
) |
|
|
(6 |
) |
|
Increase (decrease) in cash and cash equivalents |
$ |
162,103 |
|
|
$ |
(19,423 |
) |
|
$ |
(42,067 |
) |
Operating Activities
Cash provided by (used in) operating activities is primarily influenced by the amount of cash we invest in personnel and infrastructure to support the anticipated growth of our business and the increase in our revenues. Cash used in operating activities has typically been due to our net losses and further increased by changes in our operating assets and liabilities, particularly accounts receivable and accrued liabilities, adjusted for non-cash expense items such as depreciation, amortization and stock-based compensation.
During 2014, cash provided by operating activities amounted to $11.5 million, reflecting our net loss of $23.4 million, offset by net non-cash expenses of $46.8 million, which included depreciation, amortization, stock-based compensation, deferred income taxes, allowance for doubtful accounts, accretion of debt discount, amortization of debt issuance costs and loss on disposal of property and equipment, partially offset by a gain from the change in the fair value of the contingent consideration from the Eckim acquisition. The non-cash expenses increased primarily due to capital expenditures and headcount growth, primarily related to continued investment in our business. The remaining use of cash was from the net change in working capital items, most notably an increase in accounts receivable of $8.9 million due to an increase in billings for media campaigns as well as timing of payments, an increase in prepaid expenses and other current assets of $4.1 million primarily as a result of our prepayment of distribution fees, partially offset by increases in accounts payable and other current liabilities and accrued compensation and benefits of $2.3 million related to the timing of payments.
During 2013, cash used in operating activities amounted to $14.2 million, reflecting our net loss of $11.2 million, offset by non-cash expenses of $12.4 million, which included depreciation, amortization, stock-based compensation, provision for allowance for doubtful accounts, accretion of debt discount and loss on disposal of property and equipment. These non-cash expenses increased primarily due to capital expenditures and headcount growth, primarily related to continued investment in our business. The remaining use of funds was from the net change in working capital items, most notably a decrease in accounts payable and other current liabilities of $0.8 million related to the timing of payments, an increase in accounts receivable of $13.1 million due to an increase in billings for media campaigns as well as timing of payments, an increase in prepaid expenses and other current assets of $3.8 million primarily as a result of our prepayment of distribution fees and offset by an increase in accrued compensation and benefits of $2.4 million related to the timing of compensation payments.
45
Cash used in operating activities in 2012 of $46.6 million was the result of a net loss of $59.2 million, offset by non-cash expenses of $12.3 million, which included depreciation, amortization, accretion of debt discount, loss on disposal of property and equipment, provision for allowance for doubtful accounts, benefit from income taxes and stock-based compensation. These non-cash expenses increased due to capital expenditures and headcount growth, primarily related to continued investment in our business. The remaining effect was from the net change in working capital items, primarily an increase in accounts payable and other current liabilities of $5.4 million and increases in accrued compensation and benefits of $2.1 million, respectively, related to the growth of our operations and the timing of compensation and other general expenses, and increases in deferred revenue of $2.5 million resulting from our revenue growth, offset by an increase in accounts receivable of $10.1 million, which was primarily due to our revenue growth and timing of the receipt of payments.
Investing Activities
During 2014, cash used in investing activities consisted primarily of purchases of property and equipment, including technology hardware and software to support our growth as well as capitalized internal-use software development costs and the net impact from our acquisitions, which included our Eckim acquisition. Purchases of property and equipment may vary from period-to-period due to the timing of the expansion of our operations, the addition of headcount and the development cycles of Retailer iQ. We expect to continue to invest in property and equipment and in the further development and enhancement of our software platform for the foreseeable future. In addition, from time to time, we may consider potential acquisitions that would complement our existing service offerings, enhance our technical capabilities or expand our marketing and sales presence. Any future transaction of this nature could require potentially significant amounts of capital or could require us to issue our stock and dilute existing stockholders.
During 2013, cash used in investing activities consisted primarily of purchases of property and equipment, including technology hardware and software to support our growth as well as capitalized internal-use software development costs. Purchases of property and equipment may vary from period-to-period due to the timing of the expansion of our operations, the addition of headcount and the development cycles of Retailer iQ. We expect to continue to invest in property and equipment and in the further development and enhancement of our software platform for the foreseeable future.
During 2012, cash used in investing activities consisted primarily of capitalized internal-use software development costs for our in-development new point of sale solution as well as purchases of property, equipment and intangible assets, including technology hardware and software to support our growth.
Financing Activities
Historically our financing activities have consisted primarily of net proceeds from the issuance of preferred stock, net borrowings under term debt and a line of credit, and the issuance of shares of common stock upon the exercise of stock options. More recently in March 2014, we completed our IPO in which we issued and sold 12,075,000 shares of common stock at a public offering price of $16.00 per share for which we received proceeds of $179.7 million which is net of underwriting discounts and commissions paid of $13.5 million, but before deducting offering expenses of $5.4 million.
During the year ended December 31, 2014, cash provided by financing activities consisted primarily of $176.5 million in proceeds from our IPO net of payments of offering costs of $3.2 million, proceeds from issuance of common stock of $10.6 million and exercise of a warrant of $1.6 million, partially offset by our repayment of debt obligations from a related party of $15.0 million.
During 2013, cash provided by financing activities amounted to $9.2 million, consisting primarily of $4.2 million in proceeds from the exercise of stock options and warrants, and $7.5 million in net borrowings under our revolving line of credit, partially offset by $2.2 million in cash used for deferred offering costs.
During 2012, cash provided by financing activities amounted to $17.3 million, consisting of $15.0 million in proceeds from borrowings under a term debt agreement and $2.3 million in proceeds from the exercise of stock options.
Off-Balance Sheet Arrangements
We did not have any off-balance sheet arrangements as of December 31, 2014.
46
Contractual Obligations
The following table summarizes our future minimum payments under contractual commitments as of December 31, 2014 (in thousands):
|
|
Payments Due by Period |
|
|||||||||||||||||
|
|
|
|
|
|
|
|
|
|
|
|
|
|
|
|
|
|
More |
|
|
|
|
|
|
|
|
Less Than |
|
|
|
|
|
|
|
|
|
|
Than |
|
||
|
|
Total |
|
|
1 Year |
|
|
1 - 3 Years |
|
|
3 - 5 Years |
|
|
5 Years |
|
|||||
|
Debt obligations (1) |
$ |
7,500 |
|
|
$ |
7,500 |
|
|
$ |
— |
|
|
$ |
— |
|
|
$ |
— |
|
|
Capital leases |
|
161 |
|
|
|
68 |
|
|
|
74 |
|
|
|
19 |
|
|
|
— |
|
|
Operating leases (2) |
|
7,284 |
|
|
|
3,525 |
|
|
|
3,524 |
|
|
|
235 |
|
|
|
— |
|
|
Purchase Obligations (3) |
|
17,920 |
|
|
|
4,750 |
|
|
|
6,700 |
|
|
|
700 |
|
|
|
5,770 |
|
|
Total |
$ |
32,865 |
|
|
$ |
15,843 |
|
|
$ |
10,298 |
|
|
$ |
954 |
|
|
$ |
5,770 |
|
|
(1) |
In September 2013, we entered into a credit and security agreement with Wells Fargo Bank. As of December 31, 2014, $7.5 million was outstanding under the revolving line of credit and interest was 2.375%. |
|
(2) |
We lease various office facilities, including our corporate headquarters in Mountain View, California and various sales offices, under operating lease agreements that expire through July 2018. The terms of the lease agreements provide for rental payments on a graduated basis. We recognize rent expense on a straight-line basis over the lease periods. |
|
(3) |
We have an unconditional purchase commitment for the years 2015 to 2034 in the amount of $7.5 million for marketing arrangements relating to the purchase of a 20-year suite license for a professional sports team which we use for sales and marketing purposes. |
The contractual commitment amounts in the table above are associated with agreements that are enforceable and legally binding. Obligations under contracts that we can cancel without a significant penalty are not included in the table above.
Wells Fargo Credit and Security Agreement
In September 2013, we entered into a credit and security agreement with Wells Fargo Bank, to establish an accounts receivable based revolving line of credit. The proceeds received from the credit agreement may be used for general corporate and working capital purposes, permitted acquisitions or permitted investments. The maximum amount available for borrowing under the revolving line of credit is the lesser of $25 million (which can be increased to $30 million if certain conditions are met) or an amount equal to 85% of certain eligible accounts, which excludes accounts that have aged over 60 days from the original due date (but not to exceed 120 days from the original invoice date), including accounts in which 25% of the total account is aged over such time periods, and certain other accounts, including, without limitation, governmental, intercompany, employee and certain foreign accounts. The revolving line of credit has a maturity date of September 30, 2016 and may be repaid and redrawn at any time prior to the maturity date, at which time all advances are due and payable. In May 2014, the Company entered into an amendment, which revised the applicable margin from 2.75% to 2.00% per annum and the financial reporting intervals from monthly to quarterly reporting. Interest was 2.375% as of December 31, 2014. As of December 31, 2014, $7.5 million was outstanding under the revolving line of credit. Borrowings under the credit agreement have priority in repayment to all of our other outstanding debt. Borrowings under the credit agreement are secured by substantially all of our assets, including our intellectual property. We may repay drawn amounts and reborrow under the revolving line of credit at any time and from time to time until the maturity date, without premium or penalty; provided, however, that any reduction or termination of the maximum amount available for borrowing under the revolving line of credit before the second anniversary of the closing date of the credit agreement is subject to a certain prepayment or termination fee, as applicable.
As of December 31, 2014, we were in compliance with the financial and non-financial covenants under the credit agreement. We are required to maintain financial covenants with the credit agreement as follows:
|
· |
minimum liquidity of $15.0 million at all times; and |
|
· |
minimum excess availability under the credit line of $2.5 million at all times, which limits our ability to draw the full amount of the credit line without Wells Fargo’s consent. |
47
The terms of the credit agreement also require us to comply with other customary non-financial covenants. The operating and financial restrictions and covenants in the credit agreement, as well as any future financing agreements that we may enter into, may restrict our ability to finance our operations, engage in, expand or otherwise pursue our business activities and strategies.
Critical Accounting Policies and Estimates
Our consolidated financial statements are prepared in accordance with U.S. generally accepted accounting principles. The preparation of these consolidated financial statements requires us to make estimates and assumptions that affect the reported amounts of assets, liabilities, revenues, expenses and related disclosures. We evaluate our estimates and assumptions on an ongoing basis. Our estimates are based on historical experience and various other assumptions that we believe to be reasonable under the circumstances. Our actual results could differ from these estimates.
We believe that the assumptions and estimates associated with internal-use software development costs, revenue recognition, stock-based compensation and income taxes have the greatest potential impact on our consolidated financial statements. Therefore, we consider these to be our critical accounting policies and estimates. For further information on all of our significant accounting policies, see the notes to our consolidated financial statements.
Internal-Use Software Development Costs
In accordance with authoritative guidance, we begin to capitalize our costs to develop software when preliminary development efforts are successfully completed, management has authorized and committed project funding, and it is probable that the project will be completed and the software will be used as intended. These costs are amortized on a straight-line basis over the estimated useful life of the related asset, generally estimated to be three years. Costs incurred prior to meeting these criteria together with costs incurred for training and maintenance are expensed as incurred and recorded in research and development expense on our consolidated statements of operations. Costs incurred for enhancements that are expected to result in additional features or functionality are capitalized and expensed over the estimated useful life of the enhancements, generally three years.
Revenue Recognition
We recognize revenues primarily from the set-up and activation of coupons and coupons codes, and digital media services when all four of the following criteria are met:
|
· |
Persuasive evidence of an arrangement exists; |
|
· |
Delivery has occurred or a service has been provided; |
|
· |
Customer fees are fixed or determinable; and |
|
· |
Collection is reasonably assured. |
Coupons. We generate revenues, as consumers select, or activate, a coupon through our platform by either printing it for physical redemption at a retailer or saving it to a retailer loyalty account for automatic digital redemption. In the case of the setup fees, we recognize revenues proportionally, on a per activation basis, using the number of authorized activations per insertion order, commencing on the date of the first coupon activation. For coupons, the pricing is generally determined on a per unit activation basis and may include fees for the creation and setup of the digital coupons.
Coupon Codes. We generate revenues when a consumer makes a purchase using a coupon code from our platform and completion of the order is reported to us. In the same period that we recognize revenues for the delivery of coupon codes, we also estimate and record a reserve, based upon historical experience, to provide for end-user cancelations or product returns which may not be reported until a subsequent date.
Digital Media. Our media services enable CPGs and retailers to distribute digital media and advertising to promote their brands and products on our websites, and mobile apps, and through those of our affiliate publishers and non-publisher third parties. We charge a fee for these media campaigns, the pricing of which is based on the advertisement size and position. Related fees are billed monthly, based on a per impressions or a per click basis.
48
We do not offer rights of refund of previously paid or delivered amounts, rebates, rights of return or price protection. In all instances, we limit the amount of revenue recognized to the amounts for which we have the right to bill our customers.
Gross versus Net Revenue Reporting
In the normal course of business and through our distribution network, we deliver digital coupons and media on retailers’ websites, through retailers’ loyalty programs, and on the websites of digital publishers. In these situations, we generally pay a distribution fee to the retailers or digital publishers which is included in our cost of revenues. The determination of whether revenues should be reported on a gross or net basis is based on our assessment of whether we are the principal or an agent in the transaction. In determining whether we are the principal or an agent, we follow the accounting guidance for principal-agent considerations. Because we are the primary obligor and are responsible for (i) fulfilling the digital coupon and media delivery, (ii) establishing the selling prices for delivery of the digital coupons and media, and (iii) performing all billing and collection activities including retaining credit risk, we have concluded that we are the principal in these arrangements, and therefore report revenues and cost of revenues on a gross basis.
Multiple-element Arrangements
For arrangements with multiple-deliverables, we determine whether each of the individual deliverables qualify as a separate unit of accounting. In order to treat deliverables in a multiple element arrangement as a separate unit of accounting, the deliverable must have standalone value upon delivery.
We allocate the arrangement fee to all the deliverables (separate units of accounting) using the relative selling price method in accordance with the selling price hierarchy, which includes vendor-specific objective evidence (“VSOE”) if available, third-party evidence (“TPE”), if VSOE is not available and best estimate of selling price (“BESP”), if neither VSOE nor TPE is available. VSOE and TPE do currently not exist for any of our deliverables. Accordingly, for arrangements with multiple deliverables that can be separated into different units of accounting, we allocate the arrangement fee to the separate units of accounting based on BESP. We determine BESP for deliverables by considering multiple factors, including, but not limited to, prices we charge for similar offerings, market conditions, competitive landscape and pricing practices. We limit the amount of allocable arrangement consideration to amounts that are fixed or determinable and that are not contingent on future performance or future deliverables.
Stock-based Compensation
We account for stock-based compensation using the fair value method, which requires us to measure the stock-based compensation based on the grant-date fair value of the awards and recognize the compensation expense over the requisite service period. We recognize compensation expense, net of estimated forfeitures. Equity awards issued to nonemployees are recorded at fair value on their measurement date and are subject to adjustment each period as the awards vest.
The fair value of each stock option award is estimated on the grant date using the Black-Scholes option-pricing model. The fair value of RSUs equals the market value of our common stock on the date of grant. Our option-pricing model requires the input of highly subjective assumptions, including the fair value of the underlying common stock, the expected term of the option, the expected volatility of the price of our common stock, risk-free interest rates, and the expected dividend yield of our common stock.
Income Taxes
We account for our income taxes using the liability method. Deferred tax assets and liabilities are recognized for the expected tax consequences of temporary differences between the tax bases of assets and liabilities and their reported amounts using enacted tax rates in effect for the year the differences are expected to reverse. In evaluating our ability to recover our deferred tax assets we consider all available positive and negative evidence including our past operating results, the existence of cumulative losses in past fiscal years, and our forecast of future taxable income in the jurisdictions.
We have placed a valuation allowance on the U.S. deferred tax assets and non-U.S. deferred tax assets, because realization of these tax benefits through future taxable income does not meet the more-likely-than-not threshold.
49
We account for uncertainty in income taxes using a two-step approach to recognizing and measuring uncertain tax positions. The first step is to evaluate the tax position for recognition by determining if the weight of available evidence indicates that it is more likely than not that the position will be sustained on audit, including resolution of related appeals or litigation processes, if any. The second step is to measure the tax benefit as the largest amount that is more than 50% likely of being realized upon settlement.
Recently Issued and Adopted Accounting Pronouncements
In August 2014, the FASB issued new guidance related to the disclosures around going concern. The new standard provides guidance around management's responsibility to evaluate whether there is substantial doubt about an entity's ability to continue as a going concern and to provide related footnote disclosures. The new standard is effective for fiscal years, and interim periods within those fiscal years, beginning after December 15, 2016. Early adoption is permitted. The adoption of this standard is not expected to have a material impact on the Company's financial statements.
In May 2014, the FASB amended the existing accounting standards for revenue recognition. The amendments are based on the principle that revenue should be recognized to depict the transfer of promised goods or services to customers in an amount that reflects the consideration to which the entity expects to be entitled in exchange for those goods or services. We are required to adopt the amendments in the first quarter of 2017. Early adoption is not permitted. The amendments may be applied retrospectively to each prior period presented or retrospectively with the cumulative effect recognized as of the date of initial application. We are currently evaluating the impact of these amendments.
We have operations both within the United States and internationally, and we are exposed to market risks in the ordinary course of our business. These risks include primarily interest rate, foreign exchange risks and inflation. We do not hold or issue financial instruments for trading purposes.
Interest Rate Fluctuation Risk
Our cash and cash equivalents consist of cash and money market funds. Our borrowings under debt obligations and capital lease obligations are generally at fixed interest rates.
The primary objective of our investment activities is to preserve principal while maximizing income without significantly increasing risk. Because our cash and cash equivalents have a relatively short maturity, our portfolio’s fair value is relatively insensitive to interest rate changes. We do not believe that an increase or decrease in interest rates of 100 basis points would have a material effect on our operating results or financial condition. In future periods, we will continue to evaluate our investment policy in order to ensure that we continue to meet our overall objectives.
Foreign Currency Exchange Risk
We have limited foreign currency risks related to our revenues and operating expenses denominated in currencies other than the U.S. dollar, principally the British Pound Sterling and the Euro. The volatility of exchange rates depends on many factors that we cannot forecast with reliable accuracy. Although we have experienced and will continue to experience fluctuations in our net income (loss) as a result of transaction gains (losses) related to revaluing certain cash balances, trade accounts receivable balances and intercompany balances that are denominated in currencies other than the U.S. dollar, we believe such a change will not have a material impact on our results of operations. In the event our foreign sales and expenses increase, our operating results may be more greatly affected by fluctuations in the exchange rates of the currencies in which we do business. At this time we do not, but we may in the future, enter into derivatives or other financial instruments in an attempt to hedge our foreign currency exchange risk. It is difficult to predict the impact hedging activities would have on our results of operations.
Inflation Risk
We do not believe that inflation has had a material effect on our business, financial condition or results of operations. If our costs were to become subject to significant inflationary pressures, we may not be able to fully offset such higher costs through price increases. Our inability or failure to do so could harm our business, financial condition and results of operations.
50
Financial Statements
INDEX TO CONSOLIDATED FINANCIAL STATEMENTS
|
|
54 |
|
|
|
|
|
|
Consolidated Financial Statements: |
|
|
|
|
|
|
|
|
55 |
|
|
|
|
|
|
|
56 |
|
|
|
|
|
|
|
57 |
|
|
|
|
|
|
Consolidated Statements of Redeemable Convertible Preferred Stock and Stockholders’ Equity (Deficit) |
|
58 |
|
|
|
|
|
|
59 |
|
|
|
|
|
|
|
60 |
51
Report of Independent Registered Public Accounting Firm
The Board of Directors and Stockholders of Coupons.com Incorporated
We have audited the accompanying consolidated balance sheets of Coupons.com Incorporated as of December 31, 2014 and 2013, and the related consolidated statements of operations, comprehensive loss, redeemable convertible preferred stock and stockholders’ equity (deficit) and cash flows for each of the three years in the period ended December 31, 2014. These financial statements are the responsibility of the Company’s management. Our responsibility is to express an opinion on these financial statements based on our audits.
We conducted our audits in accordance with the standards of the Public Company Accounting Oversight Board (United States). Those standards require that we plan and perform the audit to obtain reasonable assurance about whether the financial statements are free of material misstatement. We were not engaged to perform an audit of the Company’s internal control over financial reporting. Our audits included consideration of internal control over financial reporting as a basis for designing audit procedures that are appropriate in the circumstances, but not for the purpose of expressing an opinion on the effectiveness of the Company’s internal control over financial reporting. Accordingly, we express no such opinion. An audit also includes examining, on a test basis, evidence supporting the amounts and disclosures in the financial statements, assessing the accounting principles used and significant estimates made by management, and evaluating the overall financial statement presentation. We believe that our audits provide a reasonable basis for our opinion.
In our opinion, the financial statements referred to above present fairly, in all material respects, the consolidated financial position of Coupons.com Incorporated at December 31, 2014 and 2013, and the consolidated results of its operations and its cash flows for each of the three years in the period ended December 31, 2014, in conformity with U.S. generally accepted accounting principles.
/s/ Ernst & Young LLP
San Jose, California
March 19, 2015
54
COUPONS.COM INCORPORATED
(in thousands, except share and per share data)
|
|
December 31, |
|
|||||
|
|
2014 |
|
|
2013 |
|
||
|
Assets |
|
|
|
|
|
|
|
|
Current assets: |
|
|
|
|
|
|
|
|
Cash and cash equivalents |
$ |
201,075 |
|
|
$ |
38,972 |
|
|
Accounts receivable, net of allowance for doubtful accounts of $408 and $332 at December 31, 2014 and 2013, respectively |
|
51,061 |
|
|
|
42,185 |
|
|
Prefunded coupons cash deposits |
|
740 |
|
|
|
920 |
|
|
Deferred tax assets |
|
457 |
|
|
|
— |
|
|
Prepaid expenses and other current assets |
|
2,972 |
|
|
|
3,100 |
|
|
Total current assets |
|
256,305 |
|
|
|
85,177 |
|
|
Property and equipment, net |
|
25,399 |
|
|
|
29,942 |
|
|
Intangible assets, net |
|
11,818 |
|
|
|
1,813 |
|
|
Goodwill |
|
29,277 |
|
|
|
9,887 |
|
|
Deferred tax assets |
|
— |
|
|
|
195 |
|
|
Other assets |
|
9,008 |
|
|
|
7,222 |
|
|
Total assets |
$ |
331,807 |
|
|
$ |
134,236 |
|
|
Liabilities, Redeemable Convertible Preferred Stock and Stockholders’ Equity (Deficit) |
|
|
|
|
|
|
|
|
Current liabilities: |
|
|
|
|
|
|
|
|
Accounts payable |
$ |
6,358 |
|
|
$ |
5,589 |
|
|
Accrued compensation and benefits |
|
14,861 |
|
|
|
13,721 |
|
|
Other current liabilities |
|
15,790 |
|
|
|
13,699 |
|
|
Prefunded coupons cash obligations |
|
740 |
|
|
|
920 |
|
|
Deferred revenues |
|
6,219 |
|
|
|
6,751 |
|
|
Debt obligations |
|
7,500 |
|
|
|
7,500 |
|
|
Debt obligations, related party |
|
— |
|
|
|
15,577 |
|
|
Total current liabilities |
|
51,468 |
|
|
|
63,757 |
|
|
Other non-current liabilities |
|
89 |
|
|
|
1,046 |
|
|
Deferred rent |
|
738 |
|
|
|
1,222 |
|
|
Deferred tax liabilities |
|
2,624 |
|
|
|
195 |
|
|
Total liabilities |
|
54,919 |
|
|
|
66,220 |
|
|
Commitments and contingencies (Note 14) |
|
|
|
|
|
|
|
|
Redeemable convertible preferred stock, $0.00001 par value—no shares authorized, issued and outstanding, and aggregate liquidation preference of $0 at December 31, 2014; 50,437,000 shares authorized and 41,529,721 shares issued and outstanding, and aggregate liquidation preference of $282,990 at December 31, 2013 |
|
— |
|
|
|
270,262 |
|
|
Stockholders’ equity (deficit): |
|
|
|
|
|
|
|
|
Preferred stock, $0.00001 par value—10,000,000 shares authorized and no shares issued or outstanding at December 31, 2014; no shares authorized, issued or outstanding at December 31, 2013 |
|
— |
|
|
|
— |
|
|
Common stock, $0.00001 par value—250,000,000 shares authorized and 86,224,920 shares issued and 81,380,014 outstanding at December 31, 2014; 96,000,000 shares authorized and 25,934,206 shares issued and 21,089,300 outstanding at December 31, 2013 |
|
1 |
|
|
|
— |
|
|
Additional paid-in capital |
|
531,018 |
|
|
|
28,403 |
|
|
Treasury stock, at cost |
|
(61,935 |
) |
|
|
(61,935 |
) |
|
Accumulated other comprehensive income (loss) |
|
(1 |
) |
|
|
37 |
|
|
Accumulated deficit |
|
(192,195 |
) |
|
|
(168,751 |
) |
|
Total stockholders’ equity (deficit) |
|
276,888 |
|
|
|
(202,246 |
) |
|
Total liabilities, redeemable convertible preferred stock and stockholders’ equity (deficit) |
$ |
331,807 |
|
|
$ |
134,236 |
|
See Accompanying Notes to Consolidated Financial Statements
55
COUPONS.COM INCORPORATED
CONSOLIDATED STATEMENTS OF OPERATIONS
(in thousands, except per share data)
|
|
Year Ended December 31, |
|
|||||||||
|
|
2014 |
|
|
2013 |
|
|
2012 |
|
|||
|
Revenues |
$ |
221,761 |
|
|
$ |
167,892 |
|
|
$ |
112,127 |
|
|
Costs and expenses: |
|
|
|
|
|
|
|
|
|
|
|
|
Cost of revenues |
|
86,186 |
|
|
|
52,080 |
|
|
|
41,745 |
|
|
Sales and marketing |
|
78,865 |
|
|
|
61,793 |
|
|
|
63,526 |
|
|
Research and development |
|
49,583 |
|
|
|
40,102 |
|
|
|
40,236 |
|
|
General and administrative |
|
33,392 |
|
|
|
24,232 |
|
|
|
25,999 |
|
|
Change in fair value of contingent consideration |
|
(5,741 |
) |
|
|
— |
|
|
|
— |
|
|
Total costs and expenses |
|
242,285 |
|
|
|
178,207 |
|
|
|
171,506 |
|
|
Loss from operations |
|
(20,524 |
) |
|
|
(10,315 |
) |
|
|
(59,379 |
) |
|
Interest expense |
|
(922 |
) |
|
|
(953 |
) |
|
|
(212 |
) |
|
Other income (expense), net |
|
(72 |
) |
|
|
19 |
|
|
|
92 |
|
|
Loss before income taxes |
|
(21,518 |
) |
|
|
(11,249 |
) |
|
|
(59,499 |
) |
|
Provision for (benefit from) income taxes |
|
1,926 |
|
|
|
— |
|
|
|
(265 |
) |
|
Net loss |
$ |
(23,444 |
) |
|
$ |
(11,249 |
) |
|
$ |
(59,234 |
) |
|
|
|
|
|
|
|
|
|
|
|
|
|
|
Net loss per share attributable to common stockholders,basic and diluted |
$ |
(0.35 |
) |
|
$ |
(0.57 |
) |
|
$ |
(3.72 |
) |
|
Weighted-average number of common shares used in computing net loss per share attributable to common stockholders, basic and diluted |
|
67,828 |
|
|
|
19,626 |
|
|
|
15,927 |
|
See Accompanying Notes to Consolidated Financial Statements
56
COUPONS.COM INCORPORATED
CONSOLIDATED STATEMENTS OF COMPREHENSIVE LOSS
(in thousands)
|
|
Year Ended December 31, |
|
|||||||||
|
|
2014 |
|
|
2013 |
|
|
2012 |
|
|||
|
Net loss |
$ |
(23,444 |
) |
|
$ |
(11,249 |
) |
|
$ |
(59,234 |
) |
|
Other comprehensive income (loss): |
|
|
|
|
|
|
|
|
|
|
|
|
Foreign currency translation adjustments |
|
(38 |
) |
|
|
(3 |
) |
|
|
40 |
|
|
Comprehensive loss |
$ |
(23,482 |
) |
|
$ |
(11,252 |
) |
|
$ |
(59,194 |
) |
See Accompanying Notes to Consolidated Financial Statements
57
COUPONS.COM INCORPORATED
CONSOLIDATED STATEMENTS OF REDEEMABLE CONVERTIBLE PREFERRED STOCK
AND STOCKHOLDERS’ EQUITY (DEFICIT)
(in thousands, except share data)
|
|
|
|
|
|
|
|
|
|
|
|
|
|
|
|
|
|
|
|
|
|
|
|
|
|
Accumulated |
|
|
|
|
|
|
Total |
|
|||||||
|
|
Redeemable Convertible |
|
|
|
|
|
|
|
|
|
|
|
Additional |
|
|
|
|
|
|
|
|
|
|
Other |
|
|
|
|
|
|
Stockholders' |
|
||||||||
|
|
Preferred Stock |
|
|
|
Common Stock |
|
|
Paid-In |
|
|
Treasury Stock |
|
|
Comprehensive |
|
|
Accumulated |
|
|
Equity |
|
|||||||||||||||||||
|
|
Shares |
|
|
Amount |
|
|
|
Shares |
|
|
Amount |
|
|
Capital |
|
|
Shares |
|
|
Amount |
|
|
Income (Loss) |
|
|
Deficit |
|
|
(Deficit) |
|
||||||||||
|
Balance as of December 31, 2011 |
|
41,529,721 |
|
|
$ |
270,262 |
|
|
|
|
15,258,048 |
|
|
$ |
— |
|
|
$ |
10,564 |
|
|
|
4,844,906 |
|
|
$ |
(61,935 |
) |
|
$ |
— |
|
|
$ |
(98,268 |
) |
|
$ |
(149,639 |
) |
|
Exercise of employee stock options |
|
— |
|
|
|
— |
|
|
|
|
3,205,478 |
|
|
|
— |
|
|
|
2,309 |
|
|
|
— |
|
|
|
— |
|
|
|
— |
|
|
|
— |
|
|
|
2,309 |
|
|
Vesting of early exercised stock options |
|
— |
|
|
|
— |
|
|
|
|
— |
|
|
|
— |
|
|
|
118 |
|
|
|
— |
|
|
|
— |
|
|
|
— |
|
|
|
— |
|
|
|
118 |
|
|
Issuance of warrant |
|
— |
|
|
|
— |
|
|
|
|
— |
|
|
|
— |
|
|
|
456 |
|
|
|
— |
|
|
|
— |
|
|
|
— |
|
|
|
— |
|
|
|
456 |
|
|
Stock-based compensation |
|
— |
|
|
|
— |
|
|
|
|
— |
|
|
|
— |
|
|
|
5,568 |
|
|
|
— |
|
|
|
— |
|
|
|
— |
|
|
|
— |
|
|
|
5,568 |
|
|
Other comprehensive income |
|
— |
|
|
|
— |
|
|
|
|
— |
|
|
|
— |
|
|
|
— |
|
|
|
— |
|
|
|
— |
|
|
|
40 |
|
|
|
— |
|
|
|
40 |
|
|
Net loss |
|
— |
|
|
|
— |
|
|
|
|
— |
|
|
|
— |
|
|
|
— |
|
|
|
— |
|
|
|
— |
|
|
|
— |
|
|
|
(59,234 |
) |
|
|
(59,234 |
) |
|
Balance as of December 31, 2012 |
|
41,529,721 |
|
|
|
270,262 |
|
|
|
|
18,463,526 |
|
|
|
— |
|
|
|
19,015 |
|
|
|
4,844,906 |
|
|
|
(61,935 |
) |
|
|
40 |
|
|
|
(157,502 |
) |
|
|
(200,382 |
) |
|
Exercise of employee stock options |
|
— |
|
|
|
— |
|
|
|
|
2,328,229 |
|
|
|
— |
|
|
|
3,661 |
|
|
|
— |
|
|
|
— |
|
|
|
— |
|
|
|
— |
|
|
|
3,661 |
|
|
Vesting of early exercised stock options |
|
— |
|
|
|
— |
|
|
|
|
— |
|
|
|
— |
|
|
|
48 |
|
|
|
— |
|
|
|
— |
|
|
|
— |
|
|
|
— |
|
|
|
48 |
|
|
Stock-based compensation |
|
— |
|
|
|
— |
|
|
|
|
— |
|
|
|
— |
|
|
|
5,181 |
|
|
|
— |
|
|
|
— |
|
|
|
— |
|
|
|
— |
|
|
|
5,181 |
|
|
Exercise of warrant |
|
— |
|
|
|
— |
|
|
|
|
297,545 |
|
|
|
— |
|
|
|
498 |
|
|
|
— |
|
|
|
— |
|
|
|
— |
|
|
|
— |
|
|
|
498 |
|
|
Other comprehensive loss |
|
— |
|
|
|
— |
|
|
|
|
— |
|
|
|
— |
|
|
|
— |
|
|
|
— |
|
|
|
— |
|
|
|
(3 |
) |
|
|
— |
|
|
|
(3 |
) |
|
Net loss |
|
— |
|
|
|
— |
|
|
|
|
— |
|
|
|
— |
|
|
|
— |
|
|
|
— |
|
|
|
— |
|
|
|
— |
|
|
|
(11,249 |
) |
|
|
(11,249 |
) |
|
Balance as of December 31, 2013 |
|
41,529,721 |
|
|
$ |
270,262 |
|
|
|
|
21,089,300 |
|
|
$ |
— |
|
|
$ |
28,403 |
|
|
|
4,844,906 |
|
|
$ |
(61,935 |
) |
|
$ |
37 |
|
|
$ |
(168,751 |
) |
|
$ |
(202,246 |
) |
|
Exercise of employee stock options |
|
— |
|
|
|
— |
|
|
|
|
3,149,166 |
|
|
|
— |
|
|
|
8,244 |
|
|
|
— |
|
|
|
— |
|
|
|
— |
|
|
|
— |
|
|
|
8,244 |
|
|
Vesting of restricted stock units |
|
— |
|
|
|
— |
|
|
|
|
1,913,724 |
|
|
|
— |
|
|
|
— |
|
|
|
— |
|
|
|
— |
|
|
|
— |
|
|
|
— |
|
|
|
— |
|
|
Issuance of common stock, stock purchase plan |
|
|
|
|
|
|
|
|
|
|
172,277 |
|
|
|
|
|
|
|
2,343 |
|
|
|
— |
|
|
|
— |
|
|
|
— |
|
|
|
— |
|
|
|
2,343 |
|
|
Exercise of warrant |
|
— |
|
|
|
— |
|
|
|
|
400,000 |
|
|
|
— |
|
|
|
1,610 |
|
|
|
— |
|
|
|
— |
|
|
|
— |
|
|
|
— |
|
|
|
1,610 |
|
|
Issuance of common stock, acquisition |
|
— |
|
|
|
— |
|
|
|
|
1,000,040 |
|
|
|
— |
|
|
|
10,050 |
|
|
|
— |
|
|
|
— |
|
|
|
— |
|
|
|
— |
|
|
|
10,050 |
|
|
Issuance of common stock from initial public offering, net of offering costs |
|
— |
|
|
|
— |
|
|
|
|
12,075,000 |
|
|
|
— |
|
|
|
174,305 |
|
|
|
— |
|
|
|
— |
|
|
|
— |
|
|
|
— |
|
|
|
174,305 |
|
|
Conversion of preferred stock to common stock |
|
(41,529,721 |
) |
|
|
(270,262 |
) |
|
|
|
41,580,507 |
|
|
|
1 |
|
|
|
270,261 |
|
|
|
— |
|
|
|
— |
|
|
|
— |
|
|
|
— |
|
|
|
270,262 |
|
|
Stock-based compensation |
|
— |
|
|
|
— |
|
|
|
|
— |
|
|
|
— |
|
|
|
35,802 |
|
|
|
— |
|
|
|
— |
|
|
|
— |
|
|
|
— |
|
|
|
35,802 |
|
|
Other comprehensive loss |
|
— |
|
|
|
— |
|
|
|
|
— |
|
|
|
— |
|
|
|
— |
|
|
|
— |
|
|
|
— |
|
|
|
(38 |
) |
|
|
— |
|
|
|
(38 |
) |
|
Net loss |
|
— |
|
|
|
— |
|
|
|
|
— |
|
|
|
— |
|
|
|
— |
|
|
|
— |
|
|
|
— |
|
|
|
— |
|
|
|
(23,444 |
) |
|
|
(23,444 |
) |
|
Balance as of December 31, 2014 |
|
— |
|
|
$ |
— |
|
|
|
|
81,380,014 |
|
|
$ |
1 |
|
|
$ |
531,018 |
|
|
|
4,844,906 |
|
|
$ |
(61,935 |
) |
|
$ |
(1 |
) |
|
$ |
(192,195 |
) |
|
$ |
276,888 |
|
See Accompanying Notes to Consolidated Financial Statements
58
COUPONS.COM INCORPORATED
CONSOLIDATED STATEMENTS OF CASH FLOWS
(in thousands)
|
|
Year Ended December 31, |
|
|||||||||
|
|
2014 |
|
|
2013 |
|
|
2012 |
|
|||
|
Cash flows from operating activities: |
|
|
|
|
|
|
|
|
|
|
|
|
Net loss |
$ |
(23,444 |
) |
|
$ |
(11,249 |
) |
|
$ |
(59,234 |
) |
|
Adjustments to reconcile net loss to net cash provided by (used in) operating activities: |
|
|
|
|
|
|
|
|
|
|
|
|
Depreciation and amortization |
|
14,737 |
|
|
|
6,859 |
|
|
|
6,556 |
|
|
Stock-based compensation |
|
35,510 |
|
|
|
5,181 |
|
|
|
5,568 |
|
|
Accretion of debt discount |
|
173 |
|
|
|
228 |
|
|
|
55 |
|
|
Amortization of debt issuance cost |
|
77 |
|
|
|
19 |
|
|
|
— |
|
|
Loss on disposal of property and equipment |
|
9 |
|
|
|
1 |
|
|
|
75 |
|
|
Allowance for doubtful accounts |
|
136 |
|
|
|
155 |
|
|
|
312 |
|
|
Deferred income taxes |
|
1,923 |
|
|
|
— |
|
|
|
(234 |
) |
|
Change in fair value of contingent consideration |
|
(5,741 |
) |
|
|
— |
|
|
|
— |
|
|
Changes in operating assets and liabilities: |
|
|
|
|
|
|
|
|
|
|
|
|
Accounts receivable |
|
(8,863 |
) |
|
|
(13,129 |
) |
|
|
(10,117 |
) |
|
Prepaid expenses and other current assets |
|
(4,086 |
) |
|
|
(3,780 |
) |
|
|
352 |
|
|
Accounts payable and other current liabilities |
|
1,155 |
|
|
|
(790 |
) |
|
|
5,386 |
|
|
Accrued compensation and benefits |
|
1,104 |
|
|
|
2,402 |
|
|
|
2,069 |
|
|
Deferred revenues |
|
(490 |
) |
|
|
(680 |
) |
|
|
2,513 |
|
|
Other |
|
(742 |
) |
|
|
625 |
|
|
|
145 |
|
|
Net cash provided by (used in) operating activities |
|
11,458 |
|
|
|
(14,158 |
) |
|
|
(46,554 |
) |
|
|
|
|
|
|
|
|
|
|
|
|
|
|
Cash flows from investing activities: |
|
|
|
|
|
|
|
|
|
|
|
|
Purchases of property and equipment |
|
(9,580 |
) |
|
|
(14,474 |
) |
|
|
(11,700 |
) |
|
Acquisitions, net of cash acquired |
|
(13,341 |
) |
|
|
— |
|
|
|
— |
|
|
Purchases of intangible assets |
|
(111 |
) |
|
|
(11 |
) |
|
|
(1,045 |
) |
|
Other |
|
— |
|
|
|
— |
|
|
|
(25 |
) |
|
Net cash used in investing activities |
|
(23,032 |
) |
|
|
(14,485 |
) |
|
|
(12,770 |
) |
|
|
|
|
|
|
|
|
|
|
|
|
|
|
Cash flows from financing activities: |
|
|
|
|
|
|
|
|
|
|
|
|
Proceeds from issuance of common stock |
|
10,585 |
|
|
|
3,661 |
|
|
|
2,309 |
|
|
Proceeds from initial public offering, net of offering costs |
|
176,525 |
|
|
|
— |
|
|
|
— |
|
|
Exercise of warrant |
|
1,610 |
|
|
|
498 |
|
|
|
— |
|
|
Proceeds from issuance of debt obligation, related party |
|
— |
|
|
|
— |
|
|
|
15,000 |
|
|
Net borrowings under revolving line of credit |
|
— |
|
|
|
7,500 |
|
|
|
— |
|
|
Repayment of debt obligations, related party |
|
(15,000 |
) |
|
|
— |
|
|
|
— |
|
|
Principal payments on capital lease obligations |
|
(58 |
) |
|
|
(40 |
) |
|
|
(46 |
) |
|
Payment of deferred offering costs |
|
— |
|
|
|
(2,220 |
) |
|
|
— |
|
|
Other |
|
— |
|
|
|
(177 |
) |
|
|
— |
|
|
Net cash provided by financing activities |
|
173,662 |
|
|
|
9,222 |
|
|
|
17,263 |
|
|
Effect of exchange rates on cash and cash equivalents |
|
15 |
|
|
|
(2 |
) |
|
|
(6 |
) |
|
Net increase (decrease) in cash and cash equivalents |
|
162,103 |
|
|
|
(19,423 |
) |
|
|
(42,067 |
) |
|
Cash and cash equivalents at beginning of period |
|
38,972 |
|
|
|
58,395 |
|
|
|
100,462 |
|
|
Cash and cash equivalents at end of period |
$ |
201,075 |
|
|
$ |
38,972 |
|
|
$ |
58,395 |
|
|
|
|
|
|
|
|
|
|
|
|
|
|
|
Supplemental disclosures of cash flow information |
|
|
|
|
|
|
|
|
|
|
|
|
Cash paid for income taxes |
$ |
— |
|
|
$ |
— |
|
|
$ |
44 |
|
|
Cash paid for interest |
|
1,448 |
|
|
|
56 |
|
|
|
11 |
|
|
Supplemental disclosures of noncash investing and financing activities |
|
|
|
|
|
|
|
|
|
|
|
|
Vesting of early exercised stock options |
— |
|
|
|
48 |
|
|
|
118 |
|
|
|
Issuance of warrant |
— |
|
|
— |
|
|
|
456 |
|
||
|
Issuance of common stock, acquisition |
|
10,050 |
|
|
— |
|
|
— |
|
||
|
Property and equipment acquired under capital leases |
|
97 |
|
|
|
91 |
|
|
— |
|
|
|
Property and equipment in accounts payable and accrued liabilities |
|
1,657 |
|
|
|
3,298 |
|
|
|
9,126 |
|
See Accompanying Notes to Consolidated Financial Statements
59
COUPONS.COM INCORPORATED
Notes to Consolidated Financial Statements
1. Background
Description of Business
Coupons.com Incorporated (the “Company”) connects great brands and retailers with consumers by delivering digital promotions and media to consumers. Many brands from leading consumer packaged goods companies (“CPGs”) and many of the leading grocery, drug, dollar channel and mass merchandise retailers use the Company’s digital platform to engage consumers at the critical moments when they are choosing which products they will buy and where they will shop. The Company delivers digital coupons, including coupon codes, and media through its platform. The Company’s platform includes web, mobile and social channels, as well as those of the Company’s CPGs, retailers and its extensive network of publishers that display the Company’s coupon and media offerings on their websites and mobile applications. Consumers select coupons by either printing them for physical redemption at retailers or saving them to retailer loyalty accounts for automatic digital redemption.
Initial Public Offering
In March 2014, the Company completed its initial public offering (“IPO”) in which it issued and sold 12,075,000 shares of common stock at a public offering price of $16.00 per share. The Company received net proceeds of $179.7 million after deducting underwriting discounts and commissions of $13.5 million, but before deducting offering expenses of $5.4 million. Upon the closing of the initial public offering, all of the Company’s outstanding redeemable convertible preferred stock converted into 41,580,507 shares of common stock. Additionally, the Company recognized stock-based compensation expense of $29.5 million during the year ended December 31, 2014 associated with restricted stock units (“RSUs”). See Note 2 (Summary of Significant Accounting Policies: Stock-based Compensation).
2. Summary of Significant Accounting Policies
Basis of Presentation and Consolidation
The accompanying consolidated financial statements have been prepared in accordance with U.S. generally accepted accounting principles (“U.S. GAAP”). The Company’s consolidated financial statements include the accounts of the Company and its wholly-owned subsidiaries. All significant intercompany transactions and balances have been eliminated. Certain prior period balances have been reclassified to conform to the current period's presentation.
Use of Estimates
The preparation of financial statements in conformity with U.S. GAAP requires management to make estimates and assumptions that affect the reported amounts of assets and liabilities and disclosure of contingent liabilities at the date of the financial statements as well as the reported amounts of revenues and expenses during the reporting period. Actual results may differ from the Company’s estimates, and such differences may be material to the accompanying consolidated financial statements.
Reverse Stock Split
On February 6, 2014, the Company’s Board approved, and on February 19, 2014 the Company effected, a 2.5-for-1 reverse stock split of its common stock and preferred stock. All share and per share information for all periods presented has been adjusted to reflect the effect of such reverse stock split.
Cash and Cash Equivalents
The Company considers all highly liquid investments with original maturities of three months or less at the time of purchase to be cash equivalents.
Accounts Receivable and Allowance for Doubtful Accounts
Accounts receivable are recorded at invoiced amounts and do not bear interest. The Company generally does not require collateral and performs ongoing credit evaluations of its customers and maintains allowances for potential credit losses. The Company maintains an allowance for doubtful accounts based upon the expected collectability of its accounts receivable. The allowance is determined based upon specific account identification. The expectation of collectability is
60
based on the Company’s review of credit profiles of customers, contractual terms and conditions, current economic trends, and historical payment experience. When the Company determines that the amounts are uncollectible, the Company writes them off against the allowance for doubtful accounts.
Prefunded Coupons Cash Deposits and Obligations
Prefunded coupons cash deposits are funded by certain product manufacturers or agencies in advance of a related couponing program when the Company has contractually accepted the role of providing a coupon clearing service on behalf of those product manufacturers or agencies. Upon receiving a prefunded coupons cash deposit, the Company records the deposit along with a related prefunded coupons cash obligations. When related couponing payouts are made, both the prefunded coupons cash deposits and its prefunded coupons cash obligations are reduced. Any funds remaining from the related couponing program are returned to the advertisers or agencies.
Property and Equipment, Net
Property and equipment, net, are stated at cost less accumulated depreciation and amortization. Depreciation and amortization are computed using the straight-line method over the estimated useful lives of the assets, which are three years for computer equipment and software and five years for all other asset categories except leasehold improvements, which are amortized over the shorter of the lease term or the expected useful life of the improvements. Equipment leased under capital leases is amortized over the shorter of the lease term or the asset’s estimated useful life.
Internal-Use Software Development Costs
Costs incurred for computer software developed or obtained for internal use, the Company begins to capitalize its costs to develop software when preliminary development efforts are successfully completed, management has authorized and committed project funding, and it is probable that the project will be completed and the software will be used as intended. These costs are amortized to cost of revenues over the estimated useful life of the related asset, generally estimated to be three years. Costs incurred prior to meeting these criteria together with costs incurred for training and maintenance are expensed as incurred and recorded in research and development expense on the Company’s consolidated statements of operations.
Leases
Leases meeting certain criteria are accounted for as capital leases. The imputed interest is included in interest expense in the accompanying consolidated statements of operations, and the capitalized value is amortized as part of the Company’s property and equipment, net. Obligations under capital leases are reduced by lease payments, net of imputed interest. All other leases are accounted for as operating leases. When an operating lease contains a predetermined fixed escalation of the minimum rent, or if tenant allowances have been received, the related rent expense is recognized on a straight-line basis over the term of the lease, with the difference between the recognized rent expense and amounts payable under the lease recorded as deferred rent liability.
Business Combinations
The Company accounts for acquisitions of entities that include inputs and processes and have the ability to create outputs as business combinations. Under the acquisition method of accounting, the total consideration is allocated to the tangible and identifiable intangible assets acquired and liabilities assumed based on their estimated fair values at the acquisition dates. The excess of the consideration transferred over those fair values is recorded as goodwill. During the measurement period, which may be up to one year from the acquisition date, the Company may record adjustments to the assets acquired and liabilities assumed with the corresponding offset to goodwill. Acquisition related costs are not considered part of the consideration, and are expensed as general and administrative expense as incurred.
Goodwill and Intangible Assets, Net
Intangible assets with a finite life are amortized over their estimated useful lives. Goodwill is tested for impairment at least annually, and more frequently upon the occurrence of certain events. The Company completes its annual impairment test during the fourth quarter of each year. There was no impairment of goodwill for the years ended December 31, 2014, 2013 and 2012.
61
Impairment of Long-Lived Assets
Long-lived assets are reviewed for impairment whenever events or changes in circumstances indicate that the carrying amount of such assets may not be recoverable. Recoverability of assets to be held and used is measured first by a comparison of the carrying amount of an asset to future undiscounted net cash flows expected to be generated by the asset. If such assets are considered to be impaired, an impairment loss would be recognized when the carrying amount of the asset exceeds the fair value of the asset. The Company has not recognized any impairment of long-lived assets for the years ended December 31, 2014, 2013 and 2012.
Fair Value of Financial Instruments
The carrying values of the Company’s financial instruments, including cash equivalents, accounts receivable, prefunded coupons cash deposits, accounts payable, accrued compensation and benefits, other current liabilities and prefunded coupons cash obligations, approximate fair value due to their short-term nature. Debt obligations are stated at the carrying value as the stated interest rates approximate market rates available to the Company. The Company records money market funds and contingent consideration at fair value. See Note 3 (Fair Value Measurements).
Revenue Recognition
The Company derives revenues primarily from the set-up and activation of coupons and coupons codes, and digital media services.
The Company recognizes revenue when all four of the following criteria are met:
|
· |
Persuasive evidence of an arrangement exists; |
|
· |
Delivery has occurred or a service has been provided; |
|
· |
Customer fees are fixed or determinable; and |
|
· |
Collection is reasonably assured. |
Coupons - The Company generates revenue, as consumers select, or activate, a coupon through its platform by either printing it for physical redemption at a retailer or saving it to a retailer loyalty account for automatic digital redemption. In the case of the setup fees, the Company recognizes revenue proportionally, on a per activation basis, using the number of authorized activations per insertion order, commencing on the date of the first coupon activation. For coupons, the pricing is generally determined on a per unit activation basis and includes fees for the creation and setup of the digital coupons.
Coupon Codes - The Company generates revenue when a consumer makes a purchase using a coupon code from its platform and completion of the order is reported to the Company. In the same period that the Company recognizes revenue for the delivery of coupon codes, the Company also estimates and records a reserve, based upon historical experience, to provide for end-user cancelations or product returns which may not be reported until a subsequent date.
Digital Media - The Company’s media services enable CPGs and retailers to deliver digital media and advertising to promote their brands and products on the Company’s websites and mobile apps, and through the Company’s affiliate publishers and non-publisher third parties. The Company charges a fee for these media campaigns, the pricing of which is based on the advertisement size and position. Related fees are billed monthly, based on a per impressions or a per click basis.
The Company does not offer rights of refund of previously paid or delivered amounts, rebates, rights of return or price protection. In all instances, the Company limits the amount of revenue recognized to the amounts for which it have the right to bill its’ customers.
Gross versus Net Revenue Reporting
In the normal course of business and through its distribution network, the Company delivers digital coupons and media on retailers’ websites, through retailers’ loyalty programs, and on the websites of digital publishers. In these situations, the Company generally pays a distribution fee to the retailers or publishers which is included in the Company’s cost of revenues. The determination of whether revenues should be reported on a gross or net basis is based on an assessment of whether the Company is acting as the principal or an agent in the transaction. In determining whether the Company is the principal or an agent, the Company follows the accounting guidance for principal-agent considerations.
62
Because the Company is the primary obligor and is responsible for (i) fulfilling the digital coupon and media delivery, (ii) establishing the selling prices for delivery of the digital coupons and media, and (iii) performing all billing and collection activities including retaining credit risk, the Company has concluded that it is the principal in these arrangements and therefore the Company reports revenues and cost of revenues on a gross basis.
Multiple-element Arrangements
For arrangements with multiple-deliverables, the Company determines whether each of the individual deliverables qualify as a separate unit of accounting. In order to treat deliverables in a multiple element arrangement as a separate unit of accounting, the deliverable must have standalone value upon delivery.
The Company allocates the arrangement fee to all the deliverables (separate units of accounting) using the relative selling price method in accordance with the selling price hierarchy, which includes vendor-specific objective evidence (“VSOE”) if available, third-party evidence (“TPE”) if VSOE is not available and best estimate of selling price (“BESP”) if neither VSOE nor TPE is available. VSOE and TPE do currently not exist for any of the Company’s deliverables. Accordingly, for arrangements with multiple deliverables that can be separated into different units of accounting, the Company allocates the arrangement fee to the separate units of accounting based on BESP. The Company determines BESP for deliverables by considering multiple factors, including, but not limited to, prices it charges for similar offerings, market conditions, competitive landscape and pricing practices. The Company limits the amount of allocable arrangement consideration to amounts that are fixed or determinable and that are not contingent on future performance or future deliverables.
Deferred Revenues
Deferred revenues consist of coupon setup fees and activation fees that are expected to be recognized upon coupon activations, which generally occurs within the next 12 months.
Cost of Revenues
Cost of revenues consist primarily of distribution fees, third-party data center costs, personnel costs and depreciation and amortization expense. Distribution fees consist of payments to partners within the Company’s network for their digital coupon publishing services. Personnel costs include salaries, bonuses, stock-based awards and employee benefits. The personnel costs are primarily attributable to individuals maintaining the Company’s data centers and operations, which initiate, sets up and deliver digital coupon media campaigns. Depreciation and amortization expense includes depreciation of data center equipment and amortization of capitalized internal use software.
Research and Development Expense
The Company expenses the cost of research and development as incurred. Research and development expense consists primarily of personnel and related headcount costs and costs of professional services associated with the ongoing development of the Company’s technology.
Stock-based Compensation
The Company accounts for stock-based compensation using the fair value method, which requires the Company to measure the stock-based compensation based on the grant-date fair value of the awards and recognize the compensation expense over the requisite service period. The Company recognizes compensation expense net of estimated forfeitures. Equity awards issued to nonemployees are recorded at fair value on their measurement date and are subject to adjustment each period as the awards vest.
The fair value of RSUs equals the market value of the Company’s common stock on the date of grant. RSUs granted prior to the Company’s IPO have a contractual term of seven years and vest upon the satisfaction of both a service condition and a liquidity-event condition. The service condition is satisfied as to 25% of the RSUs on each of the first four anniversaries of the vesting commencement date. The liquidity-event condition is satisfied upon the earlier of (i) six months after the effective date of the IPO or (ii) March 15 of the calendar year following the year in which the IPO was declared effective; and (iii) the time immediately prior to the consummation of a change in control. The vesting condition that was satisfied six months following the Company’s IPO did not affect the expense attribution period for the RSUs for which the service condition has been met as of the date of the Company’s IPO. This six-month period was not a substantive service condition and, accordingly, beginning on the effectiveness of the Company’s IPO in March 2014, the
63
Company recognized a cumulative stock-based compensation expense for the portion of the RSUs that had met the service condition as of the date of the Company’s IPO. The Company recognized stock-based compensation expense of $29.5 million during the year ended December 31, 2014 associated with RSUs.
RSUs granted on or after the Company’s IPO have similar terms as the RSUs granted prior to the Company’s IPO, but are not subject to a liquidity-event condition in order to vest, and the compensation expense is recognized on a straight-line basis over the applicable service period.
Advertising Expense
Advertising costs are expensed when incurred and are included in sales and marketing expense on the accompanying consolidated statements of operations. The Company incurred $830,000, $1,917,000 and $7,404,000 of advertising costs during the years ended December 31, 2014, 2013 and 2012, respectively. Advertising costs consist primarily of online marketing costs, such as sponsored search, advertising on social networking sites, e-mail marketing campaigns, loyalty programs, and affiliate programs.
Income Taxes
The Company accounts for income taxes in accordance with authoritative guidance, which requires the use of the liability method. Under this method, deferred income tax assets and liabilities are determined based upon the difference between the consolidated financial statement carrying amounts and the tax basis of assets and liabilities and are measured using the enacted tax rate expected to apply to taxable income in the years in which the differences are expected to reverse. A valuation allowance is provided when it is more likely than not that the deferred tax assets will not be realized.
The Company recognizes liabilities for uncertain tax positions based upon a two-step process. To the extent a tax position does not meet a more-likely-than-not level of certainty, no benefit is recognized in the consolidated financial statements. If a position meets the more-likely-than-not level of certainty, it is recognized in the consolidated financial statements at the largest amount that has a greater than 50% likelihood of being realized upon ultimate settlement. The Company accounts for any applicable interest and penalties as a component of income tax expense.
Foreign Currency
Foreign currency denominated assets and liabilities of foreign subsidiaries, where the local currency is the functional currency, are translated into U.S. dollars using the exchange rates in effect at the balance sheet dates, and income and expenses are translated using average exchange rates during the period. The resulting foreign currency translation adjustments are recorded in accumulated other comprehensive income (loss).
Gains and losses from foreign currency transactions are included in other income (expense), net in the accompanying consolidated statements of operations. Foreign currency transaction gains (losses) were immaterial for all the periods presented in the accompanying consolidated financial statements.
Other Comprehensive Income (Loss)
Other comprehensive income (loss) consists of foreign currency translation adjustments.
Net Loss per Share Attributable to Common Stockholders
The Company computes its basic and diluted net loss per share attributable to common stockholders using the two-class method required for companies with participating securities. The Company’s basic net loss per share attributable to common stockholders is computed by dividing the net loss attributable to common stockholders by the weighted-average number of shares of common stock outstanding during the period, less the weighted average unvested common stock subject to repurchase. The diluted net income per share attributable to common stockholders is computed by giving effect to all potentially dilutive common shares equivalents outstanding during the period. The effects of options to purchase common stock, redeemable convertible preferred stock, RSUs, restricted stock awards (“RSAs”) and common stock warrants are excluded from the computation of diluted net loss per share attributable to common stockholders because their effect is antidilutive.
64
Segments
The Company’s chief operating decision maker, who is the Chief Executive Officer, reviews the Company’s financial information presented on a consolidated basis for purposes of allocating resources and evaluating our financial performance. There are no segment managers who are held accountable by the chief operating decision maker, or anyone else, for operations, operating results, and planning for levels or components below the consolidated unit level. Accordingly, the Company has determined that it operates in a single reporting segment.
Concentration of Credit Risk
Financial instruments that potentially subject the Company to concentrations of credit risk consist primarily of cash and cash equivalents and accounts receivable. For cash and cash equivalents, the Company is exposed to credit risk in the event of default by the financial institutions to the extent of the amounts recorded on the accompanying consolidated balance sheets. Credit risk with respect to accounts receivable is dispersed due to the large number of customers. The Company does not require collateral for accounts receivable.
Recently Issued Accounting Pronouncements
In August 2014, the FASB issued new guidance related to the disclosures around going concern. The new standard provides guidance around management's responsibility to evaluate whether there is substantial doubt about an entity's ability to continue as a going concern and to provide related footnote disclosures. The new standard is effective for fiscal years, and interim periods within those fiscal years, beginning after December 15, 2016. Early adoption is permitted. The adoption of this standard is not expected to have a material impact on the Company's financial statements.
In May 2014, the FASB amended the existing accounting standards for revenue recognition. The amendments are based on the principle that revenue should be recognized to depict the transfer of promised goods or services to customers in an amount that reflects the consideration to which the entity expects to be entitled in exchange for those goods or services. The Company is required to adopt the amendments in the first quarter of 2017. Early adoption is not permitted. The amendments may be applied retrospectively to each prior period presented or retrospectively with the cumulative effect recognized as of the date of initial application. The Company is currently evaluating the impact of these amendments.
3. Fair Value Measurements
The fair value is defined as the price that would be received to sell an asset or paid to transfer a liability in an orderly transaction between market participants at the measurement date. Fair value is estimated by applying the following hierarchy, which prioritizes the inputs used to measure fair value into three levels and bases the categorization within the hierarchy upon the lowest level of input that is available and significant to the fair value measurement:
Level 1—Quoted prices in active markets for identical assets or liabilities.
Level 2—Observable inputs other than quoted prices in active markets for identical assets and liabilities, quoted prices for identical or similar assets or liabilities in inactive markets, or other inputs that are observable or can be corroborated by observable market data for substantially the full term of the assets or liabilities.
Level 3—Inputs that are generally unobservable and typically reflect management’s estimate of assumptions that market participants would use in pricing the asset or liability.
65
The Company’s fair value hierarchy for its financial assets and liabilities that are measured at fair value on a recurring basis are as follows (in thousands):
|
|
December 31, 2014 |
|
|||||||||||||
|
|
Level 1 |
|
|
Level 2 |
|
|
Level 3 |
|
|
Total |
|
||||
|
Assets: |
|
|
|
|
|
|
|
|
|
|
|
|
|
|
|
|
Money market funds (1) |
$ |
14,928 |
|
|
$ |
— |
|
|
$ |
— |
|
|
$ |
14,928 |
|
|
Total |
$ |
14,928 |
|
|
$ |
— |
|
|
$ |
— |
|
|
$ |
14,928 |
|
|
Liabilities: |
|
|
|
|
|
|
|
|
|
|
|
|
|
|
|
|
Contingent consideration (2) |
$ |
— |
|
|
$ |
— |
|
|
$ |
1,048 |
|
|
$ |
1,048 |
|
|
Total |
$ |
— |
|
|
$ |
— |
|
|
$ |
1,048 |
|
|
$ |
1,048 |
|
|
|
|
|
|
|
|
|
|
|
|
|
|
|
|
|
|
|
(1) Included in cash and cash equivalents |
|
|
|
|
|
|
|
|
|
|
|
|
|
|
|
|
(2) Included in other current liabilities |
|
|
|
|
|
|
|
|
|
|
|
|
|
|
|
|
|
|
|
|
|
|
|
|
|
|
|
|
|
|
|
|
|
|
December 31, 2013 |
|
|||||||||||||
|
|
Level 1 |
|
|
Level 2 |
|
|
Level 3 |
|
|
Total |
|
||||
|
Assets: |
|
|
|
|
|
|
|
|
|
|
|
|
|
|
|
|
Money market funds (1) |
$ |
14,918 |
|
|
$ |
— |
|
|
$ |
— |
|
|
$ |
14,918 |
|
|
Total |
$ |
14,918 |
|
|
$ |
— |
|
|
$ |
— |
|
|
$ |
14,918 |
|
|
|
|
|
|
|
|
|
|
|
|
|
|
|
|
|
|
|
(1) Included in cash and cash equivalents |
|
|
|
|
|
|
|
|
|
|
|
|
|
|
|
The valuation technique used to measure the fair value of money market funds included using quoted prices in active markets for identical assets or liabilities.
The fair value of contingent consideration was estimated using a Monte Carlo simulation and was based on significant inputs not observable in the market, thus classified as a Level 3 instrument. The inputs include the Company’s stock price, maximum earn-out shares, historical and projected financial results of Eckim, LLC. (“Eckim”), historical volatility of the Company's stock price and risk-free interest rate. See Note 6 (Acquisitions).
The following table represents the change in the contingent consideration (in thousands):
|
|
|
|
|
|
|
|
Level 3 |
|
|
|
Balance as of December 31, 2013 |
|
|
|
|
|
|
$ |
— |
|
|
Acquisition date fair value measurement |
|
|
|
|
|
|
|
6,789 |
|
|
Change in fair value |
|
|
|
|
|
|
|
(5,741 |
) |
|
Balance as of December 31, 2014 |
|
|
|
|
|
|
$ |
1,048 |
|
For the year ended December 31, 2014, the Company recorded a gain of $5,741,000 due to the change in fair value of the contingent consideration. The change in fair value of the contingent consideration during the period was primarily driven by the decrease in the likelihood of achieving the revenue and profit milestones. Gains and losses as a result of the changes in the fair value of the contingent consideration are included as a component of operations in the accompanying consolidated statements of operations.
4. Allowance for Doubtful Accounts
The summary of activities in the allowance for doubtful accounts is as follows (in thousands):
|
|
Year Ended December 31, |
|
|||||||||
|
|
2014 |
|
|
2013 |
|
|
2012 |
|
|||
|
Balance at beginning of period |
$ |
332 |
|
|
$ |
270 |
|
|
$ |
228 |
|
|
Bad debt expense |
|
136 |
|
|
|
155 |
|
|
|
312 |
|
|
Recoveries (write-offs), net |
|
(60 |
) |
|
|
(93 |
) |
|
|
(270 |
) |
|
Balance at end of period |
$ |
408 |
|
|
$ |
332 |
|
|
$ |
270 |
|
66
5. Balance Sheet Components
Property and Equipment, Net
Property and equipment consist of the following (in thousands):
|
|
December 31, |
|
|||||
|
|
2014 |
|
|
2013 |
|
||
|
Computer equipment |
$ |
17,325 |
|
|
$ |
15,172 |
|
|
Software |
|
30,791 |
|
|
|
5,294 |
|
|
Furniture and fixtures |
|
1,645 |
|
|
|
1,611 |
|
|
Leasehold improvements |
|
2,393 |
|
|
|
2,211 |
|
|
Total |
|
52,154 |
|
|
|
24,288 |
|
|
Accumulated depreciation and amortization |
|
(28,783 |
) |
|
|
(17,491 |
) |
|
Projects in process |
|
2,028 |
|
|
|
23,145 |
|
|
Property and equipment, net |
$ |
25,399 |
|
|
$ |
29,942 |
|
Depreciation and amortization expense of property and equipment was $12,771,000, $5,923,000 and $5,838,000 for the years ended December 31, 2014, 2013 and 2012, respectively. Total depreciation and amortization expense includes computer and other equipment acquired under capital leases of $80,000, $65,000 and $64,000 for the years ended December 31, 2014, 2013 and 2012, respectively. During the years ended December 31, 2014, 2013 and 2012, the Company disposed of equipment with an original cost of $1,480,000, $127,000 and $183,000, resulting in a loss on disposal of $9,000, $1,000 and $75,000 for the years ended December 31, 2014, 2013 and 2012, respectively.
In 2012, the Company commenced the development of Retailer iQ. During the years ended December 31, 2014 and 2013, the Company capitalized $3,552,000 and $6,857,000, respectively, of development costs related to the new platform. The Company recognized $7,697,000 of amortization expense in cost of revenues during the year ended December 31, 2014. During the years ended December 31, 2013 and 2012 there was no amortization expense, as the new software platform was under development. The unamortized capitalized development and enhancement costs related to the new platform was $19,000,000 and $23,145,000 as of December 31, 2014 and 2013, respectively.
During the years ended December 31, 2014 and 2013, the Company capitalized $16,000 and $0, respectively, of other capitalized software development costs unrelated to the new point of sale solution. The Company recognized amortization expense of $106,000, $165,000 and $324,000 for the years ended December 31, 2014, 2013 and 2012, respectively. The unamortized other capitalized software development costs was $79,000 and $169,000 as of December 31, 2014 and 2013, respectively.
Accrued Compensation and Benefits
Accrued compensation and benefits consist of the following (in thousands):
|
|
December 31, |
|
|||||
|
|
2014 |
|
|
2013 |
|
||
|
Bonus |
$ |
6,909 |
|
|
$ |
5,949 |
|
|
Payroll and related expenses |
|
2,067 |
|
|
|
1,131 |
|
|
Commissions |
|
3,458 |
|
|
|
4,297 |
|
|
Vacation |
|
2,427 |
|
|
|
2,344 |
|
|
Accrued compensation and benefits |
$ |
14,861 |
|
|
$ |
13,721 |
|
67
Other Current Liabilities
Other current liabilities consist of the following (in thousands):
|
|
December 31, |
|
|||||
|
|
2014 |
|
|
2013 |
|
||
|
Legal and professional fees |
$ |
1,699 |
|
|
$ |
1,742 |
|
|
Marketing expenses |
|
3,415 |
|
|
|
1,492 |
|
|
Distribution fees |
|
5,805 |
|
|
|
5,628 |
|
|
Accrued property and equipment |
|
687 |
|
|
|
1,252 |
|
|
Deferred rent |
|
536 |
|
|
|
453 |
|
|
Contingent consideration |
|
1,048 |
|
|
|
— |
|
|
Other |
|
2,600 |
|
|
|
3,132 |
|
|
Other current liabilities |
$ |
15,790 |
|
|
$ |
13,699 |
|
6. Acquisitions
The Company completed the following business combinations during the year ended December 31, 2014:
|
· |
On October 10, 2014, the Company entered into an asset purchase agreement with Padopolis, Inc. (“Padopolis”), a digital catalog publishing company. Total purchase price for Padopolis was $1,700,000 in cash. |
|
· |
On August 4, 2014, the Company entered into an asset purchase agreement with Eckim, a company specializing in search engine performance marketing. The total acquisition consideration of $19,289,000 consisted of $12,500,000 in cash and $6,789,000 in contingent consideration. The contingent consideration consists of shares of the Company’s common stock. The contingently issuable shares are contingent on Eckim achieving certain revenue and profit milestones by December 31, 2015. The contingent consideration shares are issuable on or before April 30, 2016 and are also subject to earlier issuance under certain event. The Company estimated the fair value of the contingent consideration using a Monte Carlo simulation. |
|
· |
On January 2, 2014, the Company acquired all the outstanding shares of Yub, Inc. (“Yub”), a company that allows consumers to link digital offers and promotions to payment cards for savings when they use the cards for in-store purchases. The total acquisition consideration of $10,050,000, which consisted of 1,000,040 shares of the Company’s common stock, was based on the fair value of the Company’s common stock of $10.05 per share. |
The acquisitions provide the Company with customer and vendor relationships, developed technologies, domain names, patents and enhanced workforce. The fair values of identifiable intangible assets were determined using discounted cash flow models. The excess of the consideration paid over the fair value of the net tangible assets and identifiable intangible assets acquired is recorded as goodwill. The goodwill is attributable to expected synergies from combined operations and the acquired companies’ knowhow.
Assets acquired and liabilities assumed were recorded at their fair values as of the respective acquisition dates. The following table summarizes the consideration paid for each acquisition and the related fair values of the assets acquired and liabilities assumed (in thousands):
|
|
Purchase Consideration |
|
|
Net Tangible Assets Acquired/ (Liabilities Assumed) |
|
|
Identifiable Intangible Assets |
|
|
Goodwill |
|
|
Goodwill Deductible for Taxes |
|
(2) Acquisition Related Expenses |
|
|||||
|
Padopolis |
$ |
1,700 |
|
|
$ |
— |
|
|
$ |
896 |
|
|
$ |
804 |
|
|
Deductible |
|
$ |
166 |
|
|
Eckim |
|
19,289 |
|
|
|
— |
|
|
|
8,636 |
|
|
|
10,653 |
|
|
(1) Deductible |
|
|
288 |
|
|
Yub |
|
10,050 |
|
|
|
(241 |
) |
|
|
2,320 |
|
|
|
7,971 |
|
|
Not Deductible |
|
|
376 |
|
|
|
$ |
31,039 |
|
|
$ |
(241 |
) |
|
$ |
11,852 |
|
|
$ |
19,428 |
|
|
|
|
$ |
830 |
|
|
|
|
|
|
|
|
|
|
|
|
|
|
|
|
|
|
|
|
|
|
|
|
|
(1) Subject to final settlement of the contingent consideration |
|
|
|
|
|
|
|
|
|
|
|
|
|
|
|
|
|
|
|
|
|
|
(2) Expensed as general and administrative |
|
|
|
|
|
|
|
|
|
|
|
|
|
|
|
|
|
|
|
|
|
68
The following table sets forth each component of identifiable intangible assets acquired in connection with the acquisitions: (in thousands):
|
|
Padopolis |
|
|
Eckim |
|
|
Yub |
|
|
Total |
|
|
Estimated Useful Life (in Years) |
|
|||||
|
Customer relationships |
$ |
184 |
|
|
$ |
4,752 |
|
|
$ |
176 |
|
|
$ |
5,112 |
|
|
|
5 |
|
|
Vendor relationships |
|
— |
|
|
|
— |
|
|
|
890 |
|
|
|
890 |
|
|
|
4 |
|
|
Developed technologies |
|
596 |
|
|
|
2,233 |
|
|
|
692 |
|
|
|
3,521 |
|
|
|
5 |
|
|
Domain names |
|
116 |
|
|
|
1,651 |
|
|
|
487 |
|
|
|
2,254 |
|
|
|
5 |
|
|
Patents |
|
— |
|
|
|
— |
|
|
|
75 |
|
|
|
75 |
|
|
|
5 |
|
|
Total identifiable intangible assets |
$ |
896 |
|
|
$ |
8,636 |
|
|
$ |
2,320 |
|
|
$ |
11,852 |
|
|
|
|
|
The financial results of the acquired companies are included in the Company’s consolidated statements of operations from their respective acquisition dates and were insignificant to the Company’s operating results. The pro forma impact of these acquisitions on consolidated revenues, income (loss) from operations and net loss was not material.
7. Goodwill and Intangible Assets
Goodwill represents the excess of the consideration paid over the fair value of the net tangible and identifiable intangible assets acquired in a business combination. The changes in the carrying value of goodwill are as follows (in thousands):
|
|
Goodwill |
|
|
|
Balance as of December 31, 2012 |
$ |
9,874 |
|
|
Acquisitions |
|
— |
|
|
Foreign currency translation |
|
13 |
|
|
Balance as of December 31, 2013 |
|
9,887 |
|
|
Acquisitions of Padapolis, Eckim and Yub |
|
19,428 |
|
|
Foreign currency translation |
|
(38 |
) |
|
Balance as of December 31, 2014 |
$ |
29,277 |
|
Intangible assets consist of the following (in thousands):
|
|
December 31, 2014 Gross |
|
|
Accumulated Amortization |
|
|
Foreign Currency Translation |
|
|
December 31, 2014 Net |
|
|
Weighted Average Amortization Period (Years) |
||||
|
Domain names |
$ |
4,968 |
|
|
$ |
(2,836 |
) |
|
$ |
— |
|
|
$ |
2,132 |
|
|
4 |
|
Patents |
|
1,050 |
|
|
|
(570 |
) |
|
|
— |
|
|
|
480 |
|
|
6 |
|
Customer relationships |
|
7,164 |
|
|
|
(1,978 |
) |
|
|
21 |
|
|
|
5,207 |
|
|
4 |
|
Vendor relationships |
|
890 |
|
|
|
(223 |
) |
|
|
— |
|
|
|
667 |
|
|
3 |
|
Developed technologies |
|
4,117 |
|
|
|
(834 |
) |
|
|
— |
|
|
|
3,283 |
|
|
5 |
|
Trade names |
|
167 |
|
|
|
(121 |
) |
|
|
3 |
|
|
|
49 |
|
|
2 |
|
|
$ |
18,356 |
|
|
$ |
(6,562 |
) |
|
$ |
24 |
|
|
$ |
11,818 |
|
|
4 |
69
|
|
December 31, 2013 Gross |
|
|
Accumulated Amortization |
|
|
Foreign Currency Translation |
|
|
December 31, 2013 Net |
|
|
Weighted Average Amortization Period (Years) |
||||
|
Domain names |
$ |
2,638 |
|
|
$ |
(2,376 |
) |
|
$ |
— |
|
|
$ |
262 |
|
|
1 |
|
Patents |
|
900 |
|
|
|
(470 |
) |
|
|
— |
|
|
|
430 |
|
|
7 |
|
Customer relationships |
|
2,052 |
|
|
|
(1,239 |
) |
|
|
51 |
|
|
|
864 |
|
|
3 |
|
Developed technologies |
|
596 |
|
|
|
(420 |
) |
|
|
— |
|
|
|
176 |
|
|
3 |
|
Trade names |
|
167 |
|
|
|
(91 |
) |
|
|
5 |
|
|
|
81 |
|
|
3 |
|
|
$ |
6,353 |
|
|
$ |
(4,596 |
) |
|
$ |
56 |
|
|
$ |
1,813 |
|
|
4 |
Amortization expense related to intangible assets subject to amortization was $1,966,000, $936,000 and $718,000 for the years ended December 31, 2014, 2013 and 2012, respectively. Estimated amortization expense related to intangible assets is as follows (in thousands):
|
|
Total |
|
|
|
2015 |
$ |
2,974 |
|
|
2016 |
|
2,799 |
|
|
2017 |
|
2,482 |
|
|
2018 |
|
2,244 |
|
|
2019 |
|
1,213 |
|
|
2020 and beyond |
|
106 |
|
|
Total estimated amortization expense |
$ |
11,818 |
|
8. Debt Obligations
2013 Credit and Security Agreement
In September 2013, the Company entered into an agreement with a commercial bank to establish an accounts receivable based revolving line of credit. The maximum amount available for borrowing under the revolving credit facility is the lesser of $25,000,000 (which can be increased to $30,000,000 if certain conditions are met) or an amount equal to 85% of certain eligible accounts, which excludes accounts that are over 60 days outstanding from the original due date. The revolving line of credit has a maturity date of September 30, 2016 and may be repaid and redrawn at any time prior to the maturity date. Interest is charged at a floating interest rate based on the daily three month LIBOR, plus an applicable margin. In May 2014, the Company entered into an amendment, which revised the applicable margin from 2.75% to 2.00% per annum and the financial reporting intervals from monthly to quarterly reporting. Interest was 2.375% at December 31, 2014. The Company is also required to pay a commitment fee on the unused portion of the revolving credit facility equal to 0.25% per annum. As of December 31, 2014 and 2013, $7,500,000 was outstanding under the revolving line of credit. The revolving credit facility is secured by substantially all of the Company’s assets, and is subject to certain financial and non-financial covenants, including financial reporting. As of December 31, 2014, the Company was in compliance with the financial and non-financial covenants under the credit and security agreement.
2012 Note Payable, Related Party
In October 2012, the Company borrowed $15,000,000 from one of its stockholders by entering into a subordinated note arrangement. The note was subordinated to other senior debt. The note had a stated interest rate of 4.00% per annum, and the principal and accrued interest were due in a lump-sum payment on October 5, 2014. Accrued interest related to the related party debt obligation was included in debt obligations, related party on the accompanying consolidated balance sheets. The note was repaid in August 2014.
In connection with the note, the Company issued a warrant to purchase 400,000 shares of Company’s common stock at an exercise price of $4.03 per share. In February 2014, the warrant to purchase 400,000 shares of common stock was exercised.
70
9. Stock-based Compensation
2013 Equity Incentive Plan
In October 2013, the Company adopted the 2013 Equity Incentive Plan (the “2013 Plan”), which became effective in March 2014 and serves as the successor to the Company’s 2006 Stock Plan (the “2006 Plan”). Pursuant to the 2013 Plan, 4,000,000 shares of common stock were initially reserved for grant, plus (1) any shares that were reserved and available for issuance under the 2006 Plan at the time the 2013 Plan became effective, and (2) any shares that become available upon forfeiture or repurchase by the Company under the 2006 Plan and 2000 Plan.
Under the 2013 Plan, the Company may grant stock options, stock appreciation rights, restricted stock and restricted stock units, performance shares and units to employees, directors and consultants. The shares available will be increased at the beginning of each year by lesser of (i) 4% of outstanding common stock on the last day of the immediately preceding year, or (ii) such number determined by the board of directors. Under the 2013 Plan, both the ISOs and NSOs are granted at a price per share not less than 100% of the fair market value on the effective date of the grant. The board of directors determines the vesting period for each option award on the grant date, and the options generally expire 10 years from the grant date or such shorter term as may be determined by the board of directors.
Stock Options
The fair value of each option was estimated on the date of grant for the periods presented using the following assumptions:
|
|
Year Ended December 31, |
|
|||||||||
|
|
2014 |
|
|
2013 |
|
|
2012 |
|
|||
|
Expected life (in years) |
|
6.08 |
|
|
|
6.08 |
|
|
|
6.08 |
|
|
Risk-free interest rate |
2.33% |
|
|
1.09% to 1.69% |
|
|
1.02% to 1.11% |
|
|||
|
Volatility |
|
55% |
|
|
51% to 53% |
|
|
|
49% |
|
|
|
Dividend yield |
— |
|
|
— |
|
|
— |
|
|||
The weighted-average grant-date fair value of options granted was $8.60, $3.05 and $2.55 per share during the years ended December 31, 2014, 2013 and 2012, respectively.
Restricted Stock Units
The fair value of RSUs equals the market value of the Company’s common stock on the date of grant. The RSUs are excluded from issued and outstanding shares until they are vested.
71
A summary of the Company’s stock option and RSUs award activity under the Plans is as follows:
|
|
|
|
|
|
Options Outstanding |
|
|
RSUs Outstanding |
|
||||||||||||||||||
|
|
Shares Available for Grant |
|
|
Number of Shares |
|
|
Weighted Average Exercise Price |
|
|
Weighted Average Remaining Contractual Term (Years) |
|
|
Aggregate Intrinsic Value (in thousands) |
|
|
Number of Shares |
|
|
Weighted Average Grant Date Fair Value |
|
|||||||
|
Balance as of December 31, 2011 |
|
8,735,836 |
|
|
|
15,376,023 |
|
|
$ |
2.64 |
|
|
|
7.21 |
|
|
|
|
|
|
|
630,000 |
|
|
$ |
7.93 |
|
|
Options granted |
|
(1,339,571 |
) |
|
|
1,339,571 |
|
|
|
5.38 |
|
|
|
|
|
|
|
|
|
|
|
|
|
|
|
|
|
|
Options exercised |
|
— |
|
|
|
(3,205,478 |
) |
|
|
0.72 |
|
|
|
|
|
|
$ |
12,117 |
|
|
|
|
|
|
|
|
|
|
Options canceled or expired |
|
1,120,498 |
|
|
|
(1,136,470 |
) |
|
|
5.19 |
|
|
|
|
|
|
|
|
|
|
|
|
|
|
|
|
|
|
RSUs granted |
|
(2,295,239 |
) |
|
|
|
|
|
|
|
|
|
|
|
|
|
|
|
|
|
|
2,295,239 |
|
|
|
5.05 |
|
|
RSUs canceled or Expired |
|
419,750 |
|
|
|
|
|
|
|
|
|
|
|
|
|
|
|
|
|
|
|
(419,750 |
) |
|
|
6.14 |
|
|
Balance as of December 31, 2012 |
|
6,641,274 |
|
|
|
12,373,646 |
|
|
|
3.20 |
|
|
|
6.81 |
|
|
|
16,550 |
|
|
|
2,505,489 |
|
|
|
5.59 |
|
|
Options granted |
|
(3,709,567 |
) |
|
|
3,709,567 |
|
|
|
12.14 |
|
|
|
|
|
|
|
|
|
|
|
|
|
|
|
|
|
|
Options exercised |
|
|
|
|
|
(2,328,229 |
) |
|
|
4.57 |
|
|
|
|
|
|
|
9,626 |
|
|
|
|
|
|
|
|
|
|
Options canceled or expired |
|
1,119,277 |
|
|
|
(1,119,277 |
) |
|
|
6.03 |
|
|
|
|
|
|
|
|
|
|
|
|
|
|
|
|
|
|
RSUs granted |
|
(2,530,542 |
) |
|
|
|
|
|
|
|
|
|
|
|
|
|
|
|
|
|
|
2,530,542 |
|
|
|
5.54 |
|
|
RSUs canceled or Expired |
|
514,840 |
|
|
|
|
|
|
|
|
|
|
|
|
|
|
|
|
|
|
|
(514,840 |
) |
|
|
5.33 |
|
|
Balance as of December 31, 2013 |
|
2,035,282 |
|
|
|
12,635,707 |
|
|
|
5.87 |
|
|
|
7.02 |
|
|
|
68,944 |
|
|
|
4,521,191 |
|
|
|
5.59 |
|
|
Increase in shares authorized |
|
4,000,000 |
|
|
|
|
|
|
|
|
|
|
|
|
|
|
|
|
|
|
|
|
|
|
|
|
|
|
Options granted |
|
(46,875 |
) |
|
|
46,875 |
|
|
|
16.00 |
|
|
|
|
|
|
|
|
|
|
|
|
|
|
|
|
|
|
Options exercised |
|
— |
|
|
|
(3,149,166 |
) |
|
|
2.62 |
|
|
|
|
|
|
|
33,704 |
|
|
|
|
|
|
|
|
|
|
Options canceled or expired |
|
38,653 |
|
|
|
(38,653 |
) |
|
|
6.20 |
|
|
|
|
|
|
|
|
|
|
|
|
|
|
|
|
|
|
RSUs granted |
|
(4,796,559 |
) |
|
|
|
|
|
|
|
|
|
|
|
|
|
|
|
|
|
|
4,796,559 |
|
|
|
16.49 |
|
|
RSUs released |
|
— |
|
|
|
|
|
|
|
|
|
|
|
|
|
|
|
|
|
|
|
(1,913,724 |
) |
|
|
5.66 |
|
|
RSUs canceled or expired |
|
594,611 |
|
|
|
|
|
|
|
|
|
|
|
|
|
|
|
|
|
|
|
(594,611 |
) |
|
|
10.12 |
|
|
Balance as of December 31, 2014 |
|
1,825,112 |
|
|
|
9,494,763 |
|
|
|
7.00 |
|
|
|
6.57 |
|
|
|
107,913 |
|
|
|
6,809,415 |
|
|
|
12.66 |
|
|
Vested and expected to vest as of December 31, 2014 |
|
|
|
|
|
9,046,740 |
|
|
|
6.73 |
|
|
|
6.48 |
|
|
|
104,819 |
|
|
|
|
|
|
|
|
|
|
Vested and exercisable as of December 31, 2014 |
|
|
|
|
|
6,769,271 |
|
|
|
4.76 |
|
|
|
5.81 |
|
|
|
89,516 |
|
|
|
|
|
|
|
|
|
The aggregate intrinsic value disclosed in the table above is based on the difference between the exercise price of the options and the fair value of the Company’s common stock.
The aggregate total fair value of shares vested during the years ended December 31, 2014, 2013 and 2012 was $5,749,000, $5,130,000 and $5,739,000, respectively.
Additional information for options outstanding and exercisable as of December 31, 2014 is as follows:
|
|
|
|
|
Options Outstanding |
|
|
Options Exercisable |
|
||||||||||||||
|
|
|
|
|
|
|
|
|
Weighted Average |
|
|
Weighted |
|
|
|
|
|
|
Weighted |
|
|||
|
|
|
|
|
|
|
|
|
Remaining |
|
|
Average |
|
|
|
|
|
|
Average |
|
|||
|
|
|
|
|
Number of |
|
|
Contractual Term |
|
|
Exercise |
|
|
Number of |
|
|
Exercise |
|
|||||
|
Exercise Prices |
|
|
Shares |
|
|
(Years) |
|
|
Price |
|
|
Shares |
|
|
Price |
|
||||||
|
$ 0.14 - $ 0.28 |
|
|
|
1,722,439 |
|
|
|
3.40 |
|
|
$ |
0.21 |
|
|
|
1,722,439 |
|
|
$ |
0.21 |
|
|
|
$ 0.37 - $ 0.46 |
|
|
|
65,333 |
|
|
|
4.67 |
|
|
|
0.38 |
|
|
|
65,333 |
|
|
|
0.38 |
|
|
|
$ 3.67 - $ 5.74 |
|
|
|
4,332,200 |
|
|
|
6.43 |
|
|
|
4.03 |
|
|
|
3,660,356 |
|
|
|
3.95 |
|
|
|
$ 8.64 - $16.26 |
|
|
|
2,574,791 |
|
|
|
8.27 |
|
|
|
11.10 |
|
|
|
1,104,477 |
|
|
|
10.82 |
|
|
|
|
$25.00 |
|
|
|
800,000 |
|
|
|
8.87 |
|
|
|
25.00 |
|
|
|
216,666 |
|
|
|
25.00 |
|
|
|
|
|
|
|
9,494,763 |
|
|
|
|
|
|
|
|
|
|
|
6,769,271 |
|
|
|
|
|
Employee Stock Purchase Plan
The Company’s Board of Directors adopted the 2014 Employee Stock Purchase Plan (“ESPP”), which became effective in March 2014, pursuant to which 1,200,000 shares of common stock was reserved for future issuance. In addition, ESPP provides for annual increases in the number of shares available for issuance on the first day of each year equal to the least of (i) 0.5% of the outstanding shares of common stock on the last day of the immediately preceding year, (ii) 400,000 shares or (iii) such other amount as may be determined by the board of directors. Eligible employees can enroll and elect to contribute up to 15% of their base compensation through payroll withholdings in each offering period, subject to certain limitations. Each offering period is six months in duration, with the exception of the initial offering
72
period which commenced in March 2014 and ended in November 2014. The purchase price of the stock is the lower of 85% of the fair market value on (a) the first day of the offering period or (b) the purchase date.
The fair value of the option feature is estimated using the Black-Scholes model for the period presented based on the following assumptions:
|
|
Year Ended December 31, 2014 |
|
Expected life (in years) |
0.49 to 0.62 |
|
Risk-free interest rate |
0.07% to 0.08% |
|
Volatility |
55% to 70% |
|
Dividend yield |
— |
172,277 shares of common stock was issued under the ESPP in November 2014. As of December 31, 2014, 1,027,723 shares are available for issuance under the ESPP.
Stock-based Compensation Expense
The following table sets forth the total stock-based compensation expense resulting from stock options, RSUs ,and ESPP included in the Company’s consolidated statements of operations (in thousands):
|
|
Year Ended December 31, |
|
|||||||||
|
|
2014 |
|
|
2013 |
|
|
2012 |
|
|||
|
Cost of revenues |
$ |
3,086 |
|
|
$ |
300 |
|
|
$ |
378 |
|
|
Sales and marketing |
|
9,464 |
|
|
|
1,492 |
|
|
|
1,880 |
|
|
Research and development |
|
11,536 |
|
|
|
1,015 |
|
|
|
1,532 |
|
|
General and administrative |
|
11,424 |
|
|
|
2,374 |
|
|
|
1,778 |
|
|
Total stock-based compensation expense |
$ |
35,510 |
|
|
$ |
5,181 |
|
|
$ |
5,568 |
|
As of December 31, 2014, there was $61,964,000 unrecognized stock-based compensation expense (net of estimated forfeitures), of which $7,281,000 is related to stock options and ESPP and $54,683,000 is related to RSUs. The total unrecognized stock-based compensation expense related to stock options and ESPP as of December 31, 2014 will be amortized over a weighted-average period of 2.4 years. The total unrecognized stock-based compensation expense related to RSUs as of December 31, 2014 will be amortized over a weighted-average period of 3.2 years.
The amount of stock-based compensation cost capitalized in property and equipment, net on the accompanying consolidated balance sheets was immaterial for all periods presented.
10. Redeemable Convertible Preferred Stock
Immediately prior to the completion of the Company’s IPO in March 2014, all of the Company’s outstanding redeemable convertible preferred stock automatically converted into 41,580,507 shares of common stock, therefore no shares of redeemable convertible preferred stock was outstanding following the closing of the Company’s IPO.
As the deemed liquidation preference was not solely within the control of the Company, the redeemable convertible preferred stock was presented outside of stockholders’ equity (deficit) on the accompanying consolidated balance sheets.
11. Stockholders’ Equity (Deficit)
Amended and Restated Certificate of Incorporation
In March 2014, the Company filed an amended and restated certificate of incorporation, which became effective immediately following the completion of the Company’s IPO. Under the restated certificate of incorporation, the authorized capital stock consists of 250,000,000 shares of common stock and 10,000,000 shares of preferred stock.
Common Stock. The rights, preferences and privileges of the holders of common stock are subject to the rights of the holders of shares of any series of preferred stock which the Company may issue in the future. Subject to the foregoing, for as long as such stock is outstanding, the holders of common stock are entitled to receive ratably any dividends as may be declared by the board of directors out of funds legally available for dividends. Holders of common
73
stock are entitled to one vote per share on any matter to be voted upon by stockholders. The amended and restated certificate of incorporation establishes a classified board of directors that is divided into three classes with staggered three year terms. Only the directors in one class will be subject to election at each annual meeting of stockholders, with the directors in other classes continuing for the remainder of their three year terms. Upon liquidation, dissolution or winding-up, the assets legally available for distribution to the Company’s stockholders would be distributable ratably among the holders of common stock and any participating preferred stock outstanding at that time, subject to prior satisfaction of all outstanding debt and liabilities and the preferential rights of and the payment of liquidation preferences, if any, on any outstanding shares of preferred stock.
Preferred Stock. The board of directors is authorized to issue undesignated preferred stock in one or more series without stockholder approval and to determine for each such series of preferred stock the voting powers, designations, preferences, and special rights, qualifications, limitations, or restrictions as permitted by law, in each case without further vote of action by the stockholders. The board of directors can also increase or decrease the number of shares of any series of preferred stock, but not below the number of shares of that series then outstanding, without any further vote or action by the stockholders. The board of directors may authorize the issuance of preferred stock with voting or conversion rights that could adversely affect the voting power or other rights of the holders of common stock.
Amendment. The amendment of the provisions in the restated certificate requires approval by holders of at least 66 2/3% of the Company’s outstanding capital stock entitled to vote generally in the election of directors.
Common Stock Subject to Repurchase
The Company’s equity plan allows certain employees to exercise options prior to vesting. The Company has the right to repurchase any issued but unvested common shares upon termination of service of an employee, at the original purchase price. The consideration received by the Company upon exercise of an unvested option is considered to be a deposit of the exercise price, and the related dollar amount is recorded as a liability. This liability is reclassified to stockholders’ equity (deficit) on a ratable basis as the award vests. During the years ended December 31, 2014 and 2013, $0 and $48,000 of the liability was reclassified to stockholders’ equity (deficit), respectively. The Company had no liability at December 31, 2014 and 2013 related to unvested exercised options.
12. Income Taxes
The components of the Company’s loss before provision for (benefit from) income taxes were as follows (in thousands):
|
|
Year Ended December 31, |
|
|||||||||
|
|
2014 |
|
|
2013 |
|
|
2012 |
|
|||
|
Domestic |
$ |
(20,753 |
) |
|
$ |
(9,972 |
) |
|
$ |
(58,101 |
) |
|
Foreign |
|
(765 |
) |
|
|
(1,277 |
) |
|
|
(1,398 |
) |
|
Total |
$ |
(21,518 |
) |
|
$ |
(11,249 |
) |
|
$ |
(59,499 |
) |
The components of the provision for (benefit from) income taxes are as follows (in thousands):
|
|
Year Ended December 31, |
|
|||||||||
|
|
2014 |
|
|
2013 |
|
|
2012 |
|
|||
|
Current: |
|
|
|
|
|
|
|
|
|
|
|
|
Federal |
$ |
— |
|
|
$ |
— |
|
|
$ |
— |
|
|
State |
|
3 |
|
|
|
— |
|
|
|
(31 |
) |
|
Foreign |
|
— |
|
|
|
— |
|
|
|
— |
|
|
Total current income tax expense (benefit) |
|
3 |
|
|
|
— |
|
|
|
(31 |
) |
|
Deferred: |
|
|
|
|
|
|
|
|
|
|
|
|
Federal |
|
1,764 |
|
|
|
— |
|
|
|
— |
|
|
State |
|
159 |
|
|
|
— |
|
|
|
— |
|
|
Foreign |
|
— |
|
|
|
— |
|
|
|
(234 |
) |
|
Total deferred income tax expense (benefit) |
|
1,923 |
|
|
|
— |
|
|
|
(234 |
) |
|
Total |
$ |
1,926 |
|
|
$ |
— |
|
|
$ |
(265 |
) |
74
A reconciliation of the federal statutory income tax rate to the Company’s effective tax rate is as follows:
|
|
Year Ended December 31, |
|
|||||||||
|
|
2014 |
|
|
2013 |
|
|
2012 |
|
|||
|
Federal tax |
|
(34.00 |
%) |
|
|
(34.00 |
%) |
|
|
(34.00 |
%) |
|
State income tax, net of federal tax benefit |
|
0.54 |
% |
|
|
0.05 |
% |
|
|
(0.45 |
%) |
|
Valuation allowance, net |
|
36.09 |
% |
|
|
18.70 |
% |
|
|
31.47 |
% |
|
Stock-based compensation |
|
3.10 |
% |
|
|
10.12 |
% |
|
|
1.44 |
% |
|
Foreign income taxes at other than U.S. rates |
|
1.21 |
% |
|
|
3.86 |
% |
|
|
— |
|
|
Other |
|
2.01 |
% |
|
|
1.27 |
% |
|
|
1.10 |
% |
|
Effective tax rate |
|
8.95 |
% |
|
|
(0.00 |
%) |
|
|
(0.44 |
%) |
The Company recorded a provision for (benefit from) income taxes of $1,926,000, $0 and ($265,000) for the years ended December 31, 2014, 2013 and 2012, respectively. The provision for income taxes in 2014 was related to the recognition of deferred tax liabilities that arose from the gain the Company recorded as a result of a change in the fair value of contingent consideration from the Eckim acquisition. The tax benefit from income taxes in 2012 was related to the recognition of the deferred tax liabilities that arose from intangible assets acquired from an acquisition. The state tax tax benefit in 2012 related to certain gross receipt-based state tax payments or refunds required in specific jurisdictions. The difference between the Company’s benefit for income taxes computed at the federal statutory rate and the amounts presented in the accompanying statements of operations is primarily due to the full valuation allowance recorded against deferred tax assets.
The components of the Company’s deferred tax assets and liabilities are as follows (in thousands):
|
|
Year Ended December 31, |
|
|||||
|
|
2014 |
|
|
2013 |
|
||
|
Deferred tax assets: |
|
|
|
|
|
|
|
|
Credits and net operating loss carryforward |
$ |
57,524 |
|
|
$ |
58,644 |
|
|
Accrued compensation |
|
3,441 |
|
|
|
3,006 |
|
|
Deferred revenues |
|
113 |
|
|
|
163 |
|
|
Stock based compensation |
|
9,420 |
|
|
|
2,055 |
|
|
Property and equipment |
|
906 |
|
|
|
517 |
|
|
Other deferred tax assets |
|
1,605 |
|
|
|
854 |
|
|
Total deferred tax assets |
|
73,009 |
|
|
|
65,239 |
|
|
Valuation allowance |
|
(67,450 |
) |
|
|
(58,842 |
) |
|
|
|
|
|
|
|
|
|
|
Deferred tax liabilities: |
|
|
|
|
|
|
|
|
Basis difference on purchased intangible assets |
|
(5,603 |
) |
|
|
(6,397 |
) |
|
Other deferred tax liabilities |
|
(2,123 |
) |
|
|
— |
|
|
Total deferred tax liabilities |
|
(7,726 |
) |
|
|
(6,397 |
) |
|
Net deferred tax assets (liabilities) |
$ |
(2,167 |
) |
|
$ |
— |
|
Other deferred tax assets and liabilities are primarily comprised of the tax effects of accounts receivable reserves, sales allowances and change in fair value of contingent consideration. As of December 31, 2014 and 2013, the Company had deferred tax assets of $73,009,000 and $65,239,000, respectively. The Company also had deferred tax liabilities of $7,726,000 and $6,397,000 as of December 31, 2014 and 2013, respectively. Realization of the deferred tax assets is dependent upon the generation of future taxable income, if any, the amount and timing of which is uncertain. Based on the available objective evidence, and historical operating performance, management believes that it is more likely than not that the Company’s deferred tax assets are not realizable. Accordingly, the net deferred tax assets have been fully offset with a valuation allowance. The net valuation allowance increased by approximately $8,608,000 and $3,242,000 for the years ended December 31, 2014 and 2013, respectively.
As of December 31, 2014, the Company had federal net operating loss carryforwards of approximately $198,576,000, which will begin to expire in 2019. The Company also had state net operating loss carryforwards of approximately $181,526,000, which will begin to expire in 2016. Federal net operating loss carryforwards of $54,985,000 and $15,601,000 at December 31, 2014 and 2013, respectively, represent deductions from stock-based compensation for which a benefit would be recorded in additional paid-in capital when it reduces income taxes payable. As of December 31, 2014, the Company has research credit carryforwards for federal income tax purposes of approximately $397,000 which
75
will begin to expire in the year 2033. The Company also had state net research credit carryforwards for income tax purposes of approximately $416,000 which can be carried forward indefinitely.
A reconciliation of the gross unrecognized tax benefit is as follows (in thousands):
|
|
Year Ended December 31, |
|
|||||
|
|
2014 |
|
|
2013 |
|
||
|
Unrecognized tax benefit - beginning balance |
$ |
813 |
|
|
$ |
285 |
|
|
Increases for tax positions taken in prior years |
|
553 |
|
|
|
271 |
|
|
Increases for tax positions taken in current year |
|
— |
|
|
|
257 |
|
|
Unrecognized tax benefit - ending balance |
$ |
1,366 |
|
|
$ |
813 |
|
As of December 31, 2014, the Company has $1,366,000 of unrecognized tax benefits. If realized, these unrecognized tax benefits would not impact the Company’s effective tax rate as these tax benefits would be offset by changes in the Company’s valuation allowance. The Company does not believe there will be any material changes in its unrecognized tax benefits over the next twelve months.
The Company’s policy is to recognize interest and penalties related to income tax matters in income tax expense. As of December 31, 2014 and 2013, the Company had no accrued interest or penalties related to uncertain tax positions. Due to the Company’s historical loss position, all tax years from inception through December 31, 2014 remain open due to unutilized net operating losses.
Utilization of the net operating loss carryforwards and credits may be subject to a substantial annual limitation due to the ownership change limitations provided by the Internal Revenue Code of 1986, as amended, and similar state provisions. The annual limitation may result in the expiration of net operating losses and credits before their utilization.
13. Net Income (Loss) per Share
Net Loss per Share Attributable to Common Stockholders
The computation of the Company’s basic and diluted net loss per share attributable to common stockholders is as follows (in thousands, except per share data):
|
|
Year Ended December 31, |
|
|||||||||
|
|
2014 |
|
|
2013 |
|
|
2012 |
|
|||
|
Net loss |
$ |
(23,444 |
) |
|
$ |
(11,249 |
) |
|
$ |
(59,234 |
) |
|
|
|
|
|
|
|
|
|
|
|
|
|
|
Weighted-average number of common shares used in computing net loss per share attributable to common stockholders, basic and diluted |
|
67,828 |
|
|
|
19,626 |
|
|
|
15,927 |
|
|
|
|
|
|
|
|
|
|
|
|
|
|
|
Net loss per share attributable to common stockholders, basic and diluted |
$ |
(0.35 |
) |
|
$ |
(0.57 |
) |
|
$ |
(3.72 |
) |
The outstanding common equivalent shares excluded from the computation of the diluted net loss per share attributable to common stockholders for the periods presented because including them would have been antidilutive are as follows (in thousands):
|
|
Year Ended December 31, |
|
|||||||||
|
|
2014 |
|
|
2013 |
|
|
2012 |
|
|||
|
Redeemable convertible preferred stock |
|
— |
|
|
|
41,581 |
|
|
|
41,581 |
|
|
Stock options and ESPP |
|
9,587 |
|
|
|
11,938 |
|
|
|
15,505 |
|
|
Restricted stock awards |
|
— |
|
|
|
— |
|
|
|
— |
|
|
Restricted stock units |
|
6,809 |
|
|
|
3,680 |
|
|
|
2,108 |
|
|
Warrants |
|
— |
|
|
|
544 |
|
|
|
393 |
|
|
|
|
16,396 |
|
|
|
57,743 |
|
|
|
59,587 |
|
76
14. Commitments and Contingencies
Leases
The Company leases office space under noncancelable operating leases with lease terms ranging from one to five years. Additionally, the Company leases certain equipment under noncancelable operating leases at its facilities and its leased data center operations.
Rent expense was $2,736,000, $2,658,000 and $2,421,000 for the years ended December 31, 2014, 2013 and 2012, respectively.
Aggregate Future Contractual Obligations and Lease Commitments
As of December 31, 2014, the Company’s unconditional purchase commitments and minimum payments under its noncancelable operating and capital leases are as follows (in thousands):
|
|
Operating Leases |
|
|
Capital Leases |
|
||
|
2015 |
$ |
3,525 |
|
|
$ |
68 |
|
|
2016 |
|
3,352 |
|
|
|
52 |
|
|
2017 |
|
172 |
|
|
|
22 |
|
|
2018 |
|
126 |
|
|
|
18 |
|
|
2019 |
|
109 |
|
|
|
1 |
|
|
2020 and thereafter |
|
— |
|
|
|
— |
|
|
Total minimum payments |
$ |
7,284 |
|
|
$ |
161 |
|
|
|
|
|
|
|
|
|
|
|
Less: Amount representing interest |
|
|
|
|
|
11 |
|
|
Present value of capital lease obligations |
|
|
|
|
|
150 |
|
|
Less: Current portion |
|
|
|
|
|
62 |
|
|
Capital lease obligation, net of current portion |
|
|
|
|
$ |
88 |
|
Other Future Commitments
The Company has long-term commitments for the years 2015 to 2034 in the amount of $7,520,000 for marketing arrangements.
The Company entered into service agreements under which the Company is obligated to prepay non-refundable payments up to $19,250,000 over three years or earlier upon achievement of certain milestones. As of December 31, 2014, the Company made payments of $8,850,000. The prepayments will be recognized as cost of revenues over the related service period. The unamortized balance are included in other assets on the accompanying consolidated balance sheets.
Indemnification
In the normal course of business, to facilitate transactions related to the Company’s operations, the Company indemnifies certain parties, including CPGs, advertising agencies and other third parties. The Company has agreed to hold certain parties harmless against losses arising from claims of intellectual property infringement or other liabilities relating to or arising from our products, services or other contractual infringement. The term of these indemnity provisions generally survive termination or expiration of the applicable agreement. To date, the Company has not recorded any liabilities related to these agreements.
77
Litigation
In the ordinary course of business, the Company may be involved in lawsuits, claims, investigations, and proceedings consisting of intellectual property, commercial, employment, and other matters. The Company will record a provision for these claims when it is both probable that a liability has been incurred and the amount of the loss, or a range of the potential loss, can be reasonably estimated. These provisions are reviewed regularly and adjusted to reflect the impacts of negotiations, settlements, rulings, advice of legal counsel, and other information or events pertaining to a particular case. In the event that one or more of these matters were to result in a claim against the Company, an adverse outcome, including a judgment or settlement, may cause a material adverse effect on the Company’s future business, operating results, or financial condition.
The Company believes that liabilities associated with any claims are not probable and any reasonably possible range of losses cannot be estimated at this time, therefore the Company has not recorded any accrual for claims as of December 31, 2014 and 2013.
15. Employee Benefit Plan
The Company maintains a defined-contribution plan that is intended to qualify under Section 401(k) of the Internal Revenue Code. The 401(k) plan provides retirement benefits for eligible employees. Eligible employees may elect to contribute to the 401(k) plan. The Company provides a match of up to the lesser of 3% of each employee’s annual salary or $6,000, which vests fully after four years of continuous employment. The Company’s matching contribution expense was $1,466,000, $1,312,000 and $1,287,000 for the years ended December 31, 2014, 2013 and 2012, respectively.
16. Concentrations
Customers with an accounts receivable balance of 10% or greater of the total accounts receivable are as follows:
|
|
|
December 31, |
|
|||||
|
|
|
2014 |
|
|
2013 |
|
||
|
Customer A |
|
|
19 |
% |
|
|
11 |
% |
|
|
|
|
|
|
|
|
|
|
|
|
|
|
|
|
|
|
|
|
Customers with 10% or more of revenues during the periods presented are as follows:
|
|
|
December 31, |
|
|||||||
|
|
|
2014 |
|
|
2013 |
|
2012 |
|
||
|
Customer A |
|
|
14 |
% |
|
* |
|
* |
|
|
|
|
|
|
|
|
|
|
|
|
|
|
|
* Less than 10% |
|
|
|
|
|
|
|
|
|
|
17. Information About Geographic Areas
Revenues generated outside of the United States were insignificant for all periods presented. Additionally, as the Company’s assets are primarily located in the United States, information regarding geographical location is not presented, as such amounts are immaterial to these consolidated financial statements taken as a whole.
18. Subsequent Events
Stock Repurchase Program
In February 2015, the Company’s Board of Directors authorized the repurchase of up to $50,000,000 of the Company’s common stock through February 2016.
Class Action Lawsuit
On March 11, 2015, a purported class action lawsuit alleging violations of federal securities laws was filed in the Superior Court of the State of California, naming us as defendants and certain of our executive officers and directors. Plaintiffs also name as defendants the underwriters in our initial public offering. The plaintiffs generally allege that our
78
registration statements related to our initial public offering contained material misstatements and omissions. The plaintiffs seek unspecified monetary damages and other relief. We intend to file a motion to dismiss the complaint.
Supplementary Data
The following tables set forth our quarterly unaudited consolidated statements of operations for each of the eight quarters in the years ended December 31, 2014 and 2013 (in thousands, except per share data):
|
|
Three Months Ended |
|
|||||||||||||||||||||||||||||
|
|
Dec 31, |
|
|
Sep 30, |
|
|
Jun 30, |
|
|
Mar 31, |
|
|
Dec 31, |
|
|
Sep 30, |
|
|
Jun 30, |
|
|
Mar 31, |
|
||||||||
|
|
2014 |
|
|
2014 |
|
|
2014 |
|
|
2014 |
|
|
2013 |
|
|
2013 |
|
|
2013 |
|
|
2013 |
|
||||||||
|
Revenues |
$ |
60,001 |
|
|
$ |
58,544 |
|
|
$ |
51,715 |
|
|
$ |
51,501 |
|
|
$ |
52,597 |
|
|
$ |
39,716 |
|
|
$ |
39,089 |
|
|
$ |
36,490 |
|
|
Cost of revenues |
|
21,722 |
|
|
|
23,061 |
|
|
|
20,884 |
|
|
|
20,519 |
|
|
|
14,235 |
|
|
|
12,111 |
|
|
|
12,933 |
|
|
|
12,801 |
|
|
Gross profit |
|
38,279 |
|
|
|
35,483 |
|
|
|
30,831 |
|
|
|
30,982 |
|
|
|
38,362 |
|
|
|
27,605 |
|
|
|
26,156 |
|
|
|
23,689 |
|
|
Operating expenses: |
|
|
|
|
|
|
|
|
|
|
|
|
|
|
|
|
|
|
|
|
|
|
|
|
|
|
|
|
|
|
|
|
Sales and marketing |
|
22,686 |
|
|
|
19,047 |
|
|
|
17,621 |
|
|
|
19,511 |
|
|
|
18,219 |
|
|
|
14,504 |
|
|
|
14,167 |
|
|
|
14,903 |
|
|
Research and development |
|
10,984 |
|
|
|
11,351 |
|
|
|
10,981 |
|
|
|
16,267 |
|
|
|
9,979 |
|
|
|
9,519 |
|
|
|
9,651 |
|
|
|
10,953 |
|
|
General and administrative |
|
8,085 |
|
|
|
7,400 |
|
|
|
8,857 |
|
|
|
9,050 |
|
|
|
8,320 |
|
|
|
5,014 |
|
|
|
5,002 |
|
|
|
5,896 |
|
|
Change in fair value of contingent consideration |
|
(2,935 |
) |
|
|
(2,806 |
) |
|
|
— |
|
|
|
— |
|
|
|
— |
|
|
|
— |
|
|
|
— |
|
|
|
— |
|
|
Total operating expenses |
|
38,820 |
|
|
|
34,992 |
|
|
|
37,459 |
|
|
|
44,828 |
|
|
|
36,518 |
|
|
|
29,037 |
|
|
|
28,820 |
|
|
|
31,752 |
|
|
Income (loss) from operations |
|
(541 |
) |
|
|
491 |
|
|
|
(6,628 |
) |
|
|
(13,846 |
) |
|
|
1,844 |
|
|
|
(1,432 |
) |
|
|
(2,664 |
) |
|
|
(8,063 |
) |
|
Interest expense |
|
(79 |
) |
|
|
(241 |
) |
|
|
(300 |
) |
|
|
(302 |
) |
|
|
(307 |
) |
|
|
(211 |
) |
|
|
(229 |
) |
|
|
(206 |
) |
|
Other income (expense), net |
|
16 |
|
|
|
19 |
|
|
|
31 |
|
|
|
(138 |
) |
|
|
(15 |
) |
|
|
— |
|
|
|
5 |
|
|
|
29 |
|
|
Income (loss) before income taxes |
|
(604 |
) |
|
|
269 |
|
|
|
(6,897 |
) |
|
|
(14,286 |
) |
|
|
1,522 |
|
|
|
(1,643 |
) |
|
|
(2,888 |
) |
|
|
(8,240 |
) |
|
Provision for (benefit from) income taxes |
|
1,119 |
|
|
|
1,051 |
|
|
|
— |
|
|
|
(244 |
) |
|
|
— |
|
|
|
— |
|
|
|
— |
|
|
|
— |
|
|
Net income (loss) |
$ |
(1,723 |
) |
|
$ |
(782 |
) |
|
$ |
(6,897 |
) |
|
$ |
(14,042 |
) |
|
$ |
1,522 |
|
|
$ |
(1,643 |
) |
|
$ |
(2,888 |
) |
|
$ |
(8,240 |
) |
|
Less: net income attributable to participating stockholders |
|
— |
|
|
|
— |
|
|
|
— |
|
|
|
— |
|
|
|
1,522 |
|
|
|
— |
|
|
|
— |
|
|
|
— |
|
|
Net income (loss) attributable to common stockholders |
$ |
(1,723 |
) |
|
$ |
(782 |
) |
|
$ |
(6,897 |
) |
|
$ |
(14,042 |
) |
|
$ |
— |
|
|
$ |
(1,643 |
) |
|
$ |
(2,888 |
) |
|
$ |
(8,240 |
) |
|
Net income (loss) per share attributable to common stockholders, basic and diluted |
$ |
(0.02 |
) |
|
$ |
(0.01 |
) |
|
$ |
(0.09 |
) |
|
$ |
(0.41 |
) |
|
$ |
— |
|
|
$ |
(0.03 |
) |
|
$ |
(0.06 |
) |
|
$ |
(0.18 |
) |
|
Weighted-average shares used in computing net income (loss) per share, basic and diluted |
|
80,543 |
|
|
|
78,065 |
|
|
|
77,549 |
|
|
|
34,535 |
|
|
|
20,899 |
|
|
|
50,809 |
|
|
|
47,258 |
|
|
|
45,852 |
|
None.
Evaluation of Disclosure Controls and Procedures
The phrase “disclosure controls and procedures” refers to controls and procedures designed to ensure that information required to be disclosed in our reports filed or submitted under the Exchange Act, such as this Annual Report on Form 10-K, is recorded, processed, summarized and reported within the time periods specified in the rules and forms of the U.S. Securities and Exchange Commission (SEC). Disclosure controls and procedures are also designed to ensure that such information is accumulated and communicated to our management, including our CEO and CFO, as appropriate to allow timely decisions regarding required disclosure.
Our management, under the supervision and with the participation of our chief executive officer (CEO) and chief financial officer (CFO), evaluated the effectiveness of the design and operation of our disclosure controls and procedures (as defined in Rules 13a- 15(e) and 15d- 15(e) under the Exchange Act, as of the end of the period covered by this Annual Report on Form 10-K. Based upon such evaluation, our CEO and CFO concluded that as of December 31, 2014, our disclosure controls and procedures were effective to provide reasonable assurance that information we are required to disclose in reports that we file or submit under the Exchange Act is recorded, processed, summarized, and reported within the time periods specified by the SEC, and that such information is accumulated and communicated to our management, including our CEO and CFO, as appropriate, to allow timely decisions regarding required disclosure.
Changes in Internal Control over Financial Reporting
There were no changes in our internal control over financial reporting identified in management’s evaluation pursuant to Rules 13a-15(d) or 15d-15(d) of the Exchange Act during the fourth quarter of 2014 that materially affected, or are reasonably likely to materially affect, our internal control over financial reporting.
79
Exception from Management’s Report on Internal Control over Financial Reporting
This Annual Report on Form 10-K does not include a report of management’s assessment regarding internal control over financial reporting or an attestation report of our independent registered public accounting firm due to a transition period established by the rules of the SEC for newly public companies.
Limitations on Effectiveness of Controls and Procedures
In designing and evaluating the disclosure controls and procedures, management recognizes that any controls and procedures, no matter how well designed and operated, can provide only reasonable assurance of achieving the desired control objectives. In addition, the design of disclosure controls and procedures must reflect the fact that there are resource constraints and that management is required to apply judgment in evaluating the benefits of possible controls and procedures relative to their costs.
None.
80
PART III
The information called for by this item will be set forth in our Proxy Statement for the Annual Meeting of Stockholders to be filed with the SEC within 120 days after the end of the fiscal year ended December 31, 2014 and is incorporated herein by reference.
Our board of directors has adopted a code of business conduct and ethics that applies to all of our employees, officers and directors, including our Chief Executive Officer, Chief Financial Officer and other executive and senior financial officers. The full text of our code of business conduct and ethics is posted on the investor relations page on our website which is located at http://investor.couponsinc.com. We will post any amendments to our code of business conduct and ethics, or waivers of its requirements, on our website.
The information called for by this item will be set forth in our Proxy Statement and is incorporated herein by reference.
|
Item 12. |
SECURITY OWNERSHIP OF CERTAIN BENEFICIAL OWNERS AND MANAGEMENT AND RELATED STOCKHOLDER MATTERS |
The information required by this item will be set forth in our Proxy Statement and is incorporated herein by reference.
The information, if any, required by this item will be set forth in our Proxy Statement and is incorporated herein by reference.
The information required by this item will be set forth in our Proxy Statement and is incorporated herein by reference.
81
PART IV
Documents filed as part of this report are as follows:
|
1. |
Consolidated Financial Statements |
Our consolidated financial statements are listed in the “Index To Consolidated Financial Statements” in Part II, Item 8 of this Annual Report on Form 10-K.
|
2. |
Financial Statement Schedules |
Financial statement schedules have been omitted because they are not applicable or the required information has been provided in the consolidated financial statements or in the notes thereto of this Annual Report on Form 10-K.
|
3. |
Exhibits |
The exhibits listed in the accompanying “Index to Exhibits” are filed or incorporated by reference as part of this report.
82
SIGNATURES
Pursuant to the requirements of Section 13 or 15(d) of the Securities Exchange Act of 1934, as amended, the Registrant has duly caused this Report to be signed on its behalf by the undersigned, thereunto duly authorized.
|
|
|
Coupons.com Incorporated |
||
|
|
|
|
|
|
|
Date: March 19, 2015 |
|
By: |
|
/s/ Steven R. Boal |
|
|
|
|
|
Steven R. Boal |
|
|
|
|
|
President and Chief Executive Officer |
POWER OF ATTORNEY
KNOW ALL PERSONS BY THESE PRESENTS, that each person whose signature appears below constitutes and appoints Steven R. Boal and Richard Hornstein, jointly and severally, his attorney-in-fact, each with the full power of substitution, for such person, in any and all capacities, to sign any and all amendments to this Annual Report on Form 10-K, and to file the same, with all exhibits thereto and other documents in connection therewith, with the Securities and Exchange Commission, granting unto said attorney-in-fact and agent full power and authority to do and perform each and every act and thing requisite and necessary to be done in connection therewith, as fully to all intents and purposes as he might do or could do in person hereby ratifying and confirming all that each of said attorneys-in-fact and agents, or his substitute, may do or cause to be done by virtue hereof.
Pursuant to the requirements of the Securities Exchange Act of 1934, as amended, this Report has been signed below by the following persons on behalf of the Registrant in the capacities and on the dates indicated.
|
Name |
|
Title |
|
Date |
|
|
|
|
|
|
|
/s/ Steven R. Boal |
|
President, Chief Executive Officer and Director (Principal Executive Officer) |
|
March 19, 2015 |
|
Steven R. Boal |
|
|
|
|
|
|
|
|
|
|
|
/s/ Mir Aamir |
|
Chief Financial Officer and Chief Operating Officer (Principal Financial Officer and Principal Accounting Officer) |
|
March 19, 2015 |
|
Mir Aamir |
|
|
|
|
|
|
|
|
|
|
|
/s/ Michael Walsh |
|
Chief Security Officer, Head of Research & Development and Director |
|
March 19, 2015 |
|
Michael Walsh |
|
|
|
|
|
|
|
|
|
|
|
/s/ Andrew Jody Gessow |
|
Director |
|
March 19, 2015 |
|
Andrew Jody Gessow |
|
|
|
|
|
|
|
|
|
|
|
/s/ Dawn Lepore |
|
Director |
|
March 19, 2015 |
|
Dawn Lepore |
|
|
|
|
|
|
|
|
|
|
|
/s/ David E. Siminoff |
|
Director |
|
March 19, 2015 |
|
David E. Siminoff |
|
|
|
|
|
|
|
|
|
|
83
Exhibit Index
|
|
|
|
|
Incorporated by Reference |
||||||||
|
Exhibit |
|
Exhibit Description |
|
Form |
|
File No. |
|
Exhibit |
|
Filing |
|
Filed |
|
|
|
|
|
|
|
|
|
|
|
|
|
|
|
3.1 |
|
Amended and Restated Certificate of Incorporation of the Registrant. |
|
S-1/A |
|
333-193692 |
|
3.4 |
|
2/25/2014 |
|
|
|
|
|
|
|
|
|
|
|
|
|
|
|
|
|
3.2 |
|
Amended and Restated Bylaws of the Registrant. |
|
S-1/A |
|
333-193692 |
|
3.5 |
|
2/14/2014 |
|
|
|
|
|
|
|
|
|
|
|
|
|
|
|
|
|
4.1 |
|
Form of Registrant’s Common Stock certificate. |
|
S-1/A |
|
333-193692 |
|
4.1 |
|
2/25/2014 |
|
|
|
|
|
|
|
|
|
|
|
|
|
|
|
|
|
4.2 |
|
Eighth Amended and Restated Investors’ Rights Agreement among the Registrant and certain holders of its capital stock, dated June 1, 2011. |
|
S-1 |
|
333-193692 |
|
4.2 |
|
1/31/2014 |
|
|
|
|
|
|
|
|
|
|
|
|
|
|
|
|
|
10.1† |
|
Form of Indemnification Agreement for directors and officers. |
|
S-1/A |
|
333-193692 |
|
10.1 |
|
2/14/2014 |
|
|
|
|
|
|
|
|
|
|
|
|
|
|
|
|
|
10.2† |
|
2000 Stock Plan, as amended, and forms of agreement thereunder. |
|
S-1 |
|
333-193692 |
|
10.2 |
|
1/31/2014 |
|
|
|
|
|
|
|
|
|
|
|
|
|
|
|
|
|
10.3† |
|
2006 Stock Plan, as amended, and forms of agreement thereunder. |
|
S-1 |
|
333-193692 |
|
10.3 |
|
1/31/2014 |
|
|
|
|
|
|
|
|
|
|
|
|
|
|
|
|
|
10.4† |
|
2013 Equity Incentive Plan. |
|
S-1 |
|
333-193692 |
|
10.4 |
|
1/31/2014 |
|
|
|
|
|
|
|
|
|
|
|
|
|
|
|
|
|
10.5† |
|
2013 Employee Stock Purchase Plan. |
|
S-1 |
|
333-193692 |
|
10.5 |
|
1/31/2014 |
|
|
|
|
|
|
|
|
|
|
|
|
|
|
|
|
|
10.6† |
|
Employment Offer Letter between the Registrant and Mir Aamir, dated February 18, 2014. |
|
S-1/A |
|
333-193692 |
|
10.6 |
|
2/25/2014 |
|
|
|
|
|
|
|
|
|
|
|
|
|
|
|
|
|
10.7† |
|
Employment Offer Letter between the Registrant and Richard Hornstein, dated February 4, 2014. |
|
S-1/A |
|
333-193692 |
|
10.7 |
|
2/25/2014 |
|
|
|
|
|
|
|
|
|
|
|
|
|
|
|
|
|
10.8† |
|
Employment Offer Letter between the Registrant and Shachar Torem, dated February 10, 2014. |
|
S-1/A |
|
333-193692 |
|
10.8 |
|
2/25/2014 |
|
|
|
|
|
|
|
|
|
|
|
|
|
|
|
|
|
10.9 |
|
Secured Promissory Note, dated October 5, 2012, payable to Spieker Living Trust UAD 3/12/2002 in the original principal amount of $15,000,000. |
|
S-1 |
|
333-193692 |
|
10.10 |
|
1/31/2014 |
|
|
|
|
|
|
|
|
|
|
|
|
|
|
|
|
|
10.10 |
|
Credit and Security Agreement, by and between the Registrant and Wells Fargo Bank, National Association, dated September 30, 2013. |
|
S-1 |
|
333-193692 |
|
10.11 |
|
1/31/2014 |
|
|
|
|
|
|
|
|
|
|
|
|
|
|
|
|
|
10.11 |
|
Patent and Trademark Security Agreement, by and between the Registrant and Wells Fargo Bank, National Association, dated September 30, 2013. |
|
S-1 |
|
333-193692 |
|
10.12 |
|
1/31/2014 |
|
|
|
|
|
|
|
|
|
|
|
|
|
|
|
|
|
10.12 |
|
Collateral Pledge Agreement, by the Registrant to Wells Fargo Bank, National Association, dated September 30, 2013. |
|
S-1 |
|
333-193692 |
|
10.13 |
|
1/31/2014 |
|
|
|
|
|
|
|
|
|
|
|
|
|
|
|
|
|
10.13 |
|
Lease Agreement by and between the Registrant and 400 Logue LLC, successor in interest to MSCP Logue, LLC, successor in interest to Divco West Real Estate Services, Inc., dated August 11, 2006. |
|
S-1 |
|
333-193692 |
|
10.14 |
|
1/31/2014 |
|
|
|
|
|
|
|
|
|
|
|
|
|
|
|
|
|
10.14 |
|
Amendment No. 1 to Lease Agreement by and between the Registrant and 400 Logue LLC, successor in interest to MSCP Logue, LLC, dated March 19, 2009. |
|
S-1 |
|
333-193692 |
|
10.15 |
|
1/31/2014 |
|
|
|
|
|
|
|
|
|
|
|
|
|
|
|
|
|
10.15 |
|
Amendment No. 2 to Lease Agreement by and between the Registrant and 400 Logue LLC, dated February 25, 2015. |
|
|
|
|
|
|
|
|
|
X |
|
|
|
|
|
|
|
|
|
|
|
|
|
|
|
10.16 |
|
Office Lease Mountain View Technology Park by and between Registrant and BP MV Technology Park LLC., dated December 22, 2010. |
|
S-1 |
|
333-193692 |
|
10.16 |
|
1/31/2014 |
|
|
|
|
|
|
|
|
|
|
|
|
|
|
|
|
84
|
|
|
|
|
Incorporated by Reference |
||||||||
|
Exhibit |
|
Exhibit Description |
|
Form |
|
File No. |
|
Exhibit |
|
Filing |
|
Filed |
|
|
|
|
|
|
|
|
|
|
|
|
|
|
|
10.17 |
|
Amendment No. 1 to Office Lease Mountain View Technology Park by and between Registrant and BP MV Technology Park LLC., dated May 31, 2012. |
|
S-1 |
|
333-193692 |
|
10.17 |
|
1/31/2014 |
|
|
|
|
|
|
|
|
|
|
|
|
|
|
|
|
|
21.1 |
|
List of Subsidiaries of Registrant. |
|
|
|
|
|
|
|
|
|
X |
|
|
|
|
|
|
|
|
|
|
|
|
|
|
|
23.1 |
|
Consent of Independent Registered Public Accounting Firm. |
|
|
|
|
|
|
|
|
|
X |
|
|
|
|
|
|
|
|
|
|
|
|
|
|
|
24.1 |
|
Power of Attorney (Included on the signature page to this report). |
|
|
|
|
|
|
|
|
|
X |
|
|
|
|
|
|
|
|
|
|
|
|
|
|
|
31.1 |
|
Certification of Chief Executive Officer pursuant to Rule 13a-14(a) or Rule 15d-14(a) of the Securities Exchange Act of 1934, as adopted pursuant to Section 302 of The Sarbanes-Oxley Act of 2002. |
|
|
|
|
|
|
|
|
|
X |
|
|
|
|
|
|
|
|
|
|
|
|
|
|
|
31.2 |
|
Certification of Chief Financial Officer pursuant to Rule 13a-14(a) or Rule 15d-14(a) of the Securities Exchange Act of 1934, as adopted pursuant to Section 302 of The Sarbanes-Oxley Act of 2002. |
|
|
|
|
|
|
|
|
|
X |
|
|
|
|
|
|
|
|
|
|
|
|
|
|
|
32.1* |
|
Certification of Chief Executive Officer pursuant to Rule 13a014(b) or Rule 15d-14(b) of the Securities Exchange Act of 1934 and 18 U.S.C. Section 1350 as adopted pursuant to Section 906 of The Sarbanes-Oxley Act of 2002. |
|
|
|
|
|
|
|
|
|
X |
|
|
|
|
|
|
|
|
|
|
|
|
|
|
|
32.2* |
|
Certification of Chief Financial Officer pursuant to Rule 13a014(b) or Rule 15d-14(b) of the Securities Exchange Act of 1934 and 18 U.S.C. Section 1350 as adopted pursuant to Section 906 of The Sarbanes-Oxley Act of 2002. |
|
|
|
|
|
|
|
|
|
X |
|
|
|
|
|
|
|
|
|
|
|
|
|
|
|
101.INS |
|
XBRL Instance Document |
|
|
|
|
|
|
|
|
|
X |
|
|
|
|
|
|
|
|
|
|
|
|
|
|
|
101.SCH |
|
XBRL Taxonomy Extension Schema Document |
|
|
|
|
|
|
|
|
|
X |
|
|
|
|
|
|
|
|
|
|
|
|
|
|
|
101.CAL |
|
XBRL Taxonomy Extension Calculation Linkbase Document |
|
|
|
|
|
|
|
|
|
X |
|
|
|
|
|
|
|
|
|
|
|
|
|
|
|
101.DEF |
|
XBRL Taxonomy Extension Definition Linkbase Document |
|
|
|
|
|
|
|
|
|
X |
|
|
|
|
|
|
|
|
|
|
|
|
|
|
|
101.LAB |
|
XBRL Taxonomy Extension Label Linkbase Document |
|
|
|
|
|
|
|
|
|
X |
|
|
|
|
|
|
|
|
|
|
|
|
|
|
|
101.PRE |
|
XBRL Taxonomy Extension Presentation Linkbase Document |
|
|
|
|
|
|
|
|
|
X |
|
† |
Indicates a management contract or compensatory plan or arrangement. |
|
* |
The certifications attached as Exhibit 32.1 and 32.2 that accompany this Annual Report on Form 10-K are not deemed filed with the Securities and Exchange Commission and are not to be incorporated by reference into any filing of Coupons.com under the Securities Act of 1933, as amended, or the Securities Exchange Act of 1934, as amended, whether made before or after the date of this Form 10-K, irrespective of any general incorporation language contained in such filing. |
85