Attached files
| file | filename |
|---|---|
| 8-K - 8-K - VIAVI SOLUTIONS INC. | viavq1fy168k.htm |
| EX-99.1 - EXHIBIT 99.1 - VIAVI SOLUTIONS INC. | viavq1fy16earningsrelease1.htm |

Fiscal 1Q 2016 Earnings Call Supplementary Slides November 2, 2015
2© 2015 Viavi Solutions Inc. Cautionary Language Concerning Forward-Looking Statements This presentation contains forward-looking statements under Section 27A of the Securities Act of 1934. Forward-looking statements are all statements we make other than those dealing specifically with historical matters. These forward-looking statements include, among other things, financial guidance. Please refer to the Company’s filings with the Securities and Exchange Commission, including the our annual report on Form 10-K filed August 25, 2015 for additional factors that could cause actual results to materially differ from current expectations. The forward-looking statements included in this presentation are valid only as of today’s date except where otherwise noted. Viavi Solutions Inc. undertakes no obligation to update these statements. This presentation and the Q&A that follows includes non-GAAP financial measures which complement the Company’s preliminary consolidated GAAP financial statements. These non-GAAP financial measures are not intended to supersede or replace the Company’s preliminary GAAP financials. We provide a detailed reconciliation of preliminary GAAP results to the non-GAAP results in the “Preliminary Reconciliation of GAAP Measures to Non-GAAP Measures” schedule in our earnings release issued today. The news release is located in the Investor Relations section of our web site at www.viavisolutions.com.
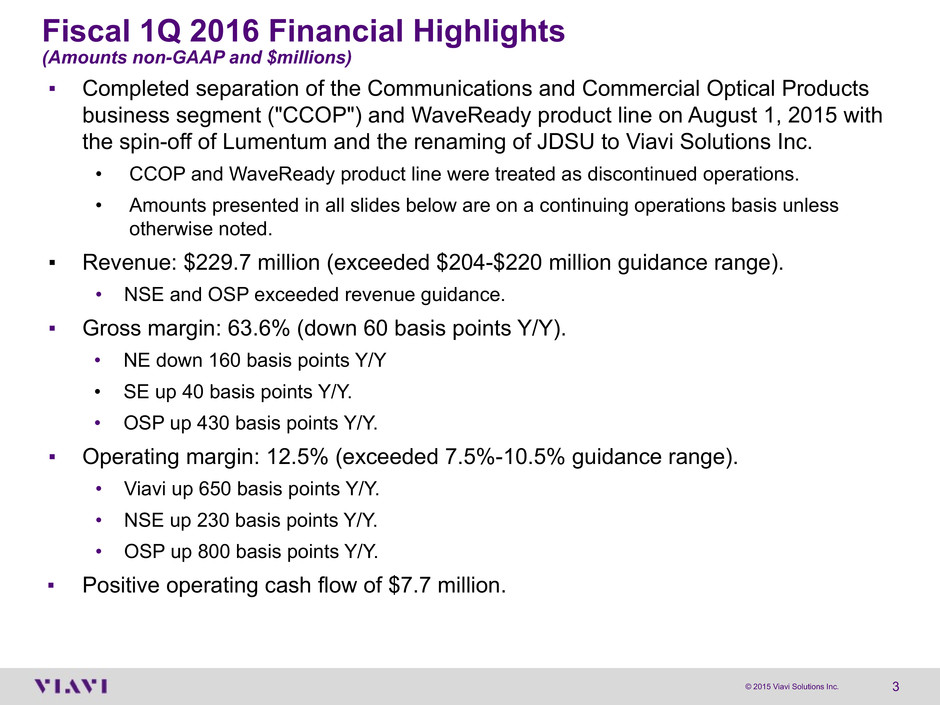
3© 2015 Viavi Solutions Inc. Fiscal 1Q 2016 Financial Highlights (Amounts non-GAAP and $millions) ▪ Completed separation of the Communications and Commercial Optical Products business segment ("CCOP") and WaveReady product line on August 1, 2015 with the spin-off of Lumentum and the renaming of JDSU to Viavi Solutions Inc. • CCOP and WaveReady product line were treated as discontinued operations. • Amounts presented in all slides below are on a continuing operations basis unless otherwise noted. ▪ Revenue: $229.7 million (exceeded $204-$220 million guidance range). • NSE and OSP exceeded revenue guidance. ▪ Gross margin: 63.6% (down 60 basis points Y/Y). • NE down 160 basis points Y/Y • SE up 40 basis points Y/Y. • OSP up 430 basis points Y/Y. ▪ Operating margin: 12.5% (exceeded 7.5%-10.5% guidance range). • Viavi up 650 basis points Y/Y. • NSE up 230 basis points Y/Y. • OSP up 800 basis points Y/Y. ▪ Positive operating cash flow of $7.7 million.
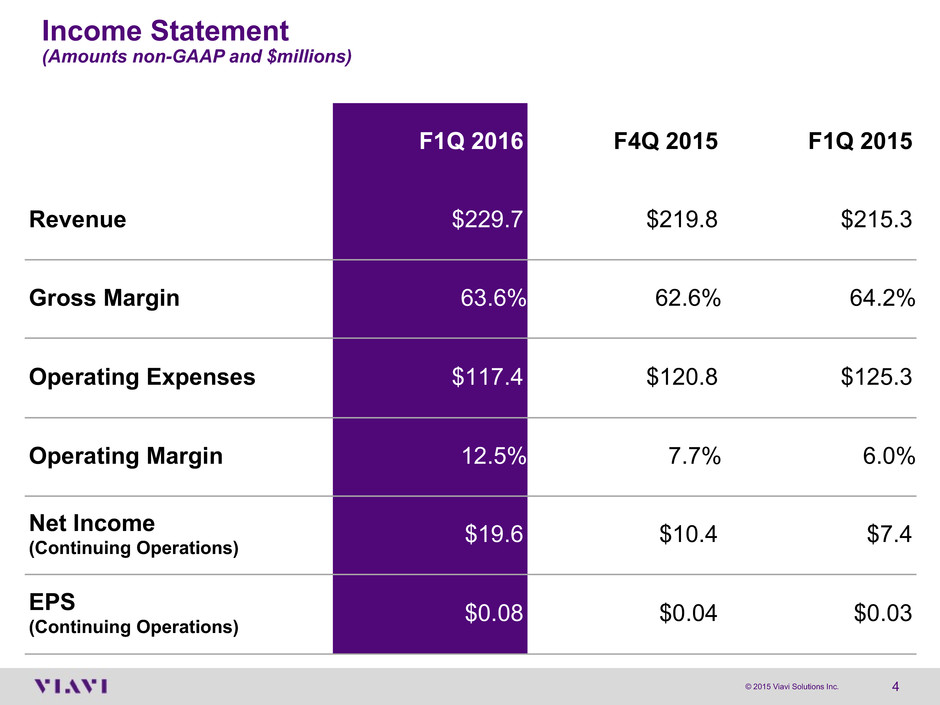
4© 2015 Viavi Solutions Inc. Income Statement (Amounts non-GAAP and $millions) F1Q 2016 F4Q 2015 F1Q 2015 Revenue $229.7 $219.8 $215.3 Gross Margin 63.6% 62.6% 64.2% Operating Expenses $117.4 $120.8 $125.3 Operating Margin 12.5% 7.7% 6.0% Net Income (Continuing Operations) $19.6 $10.4 $7.4 EPS (Continuing Operations) $0.08 $0.04 $0.03
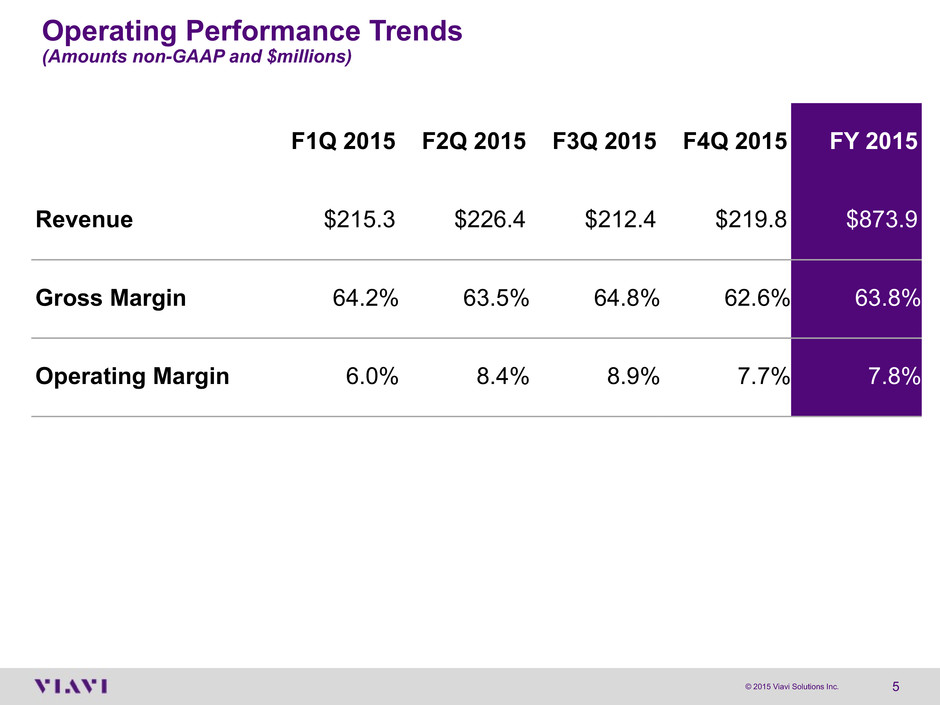
5© 2015 Viavi Solutions Inc. Operating Performance Trends (Amounts non-GAAP and $millions) F1Q 2015 F2Q 2015 F3Q 2015 F4Q 2015 FY 2015 Revenue $215.3 $226.4 $212.4 $219.8 $873.9 Gross Margin 64.2% 63.5% 64.8% 62.6% 63.8% Operating Margin 6.0% 8.4% 8.9% 7.7% 7.8%
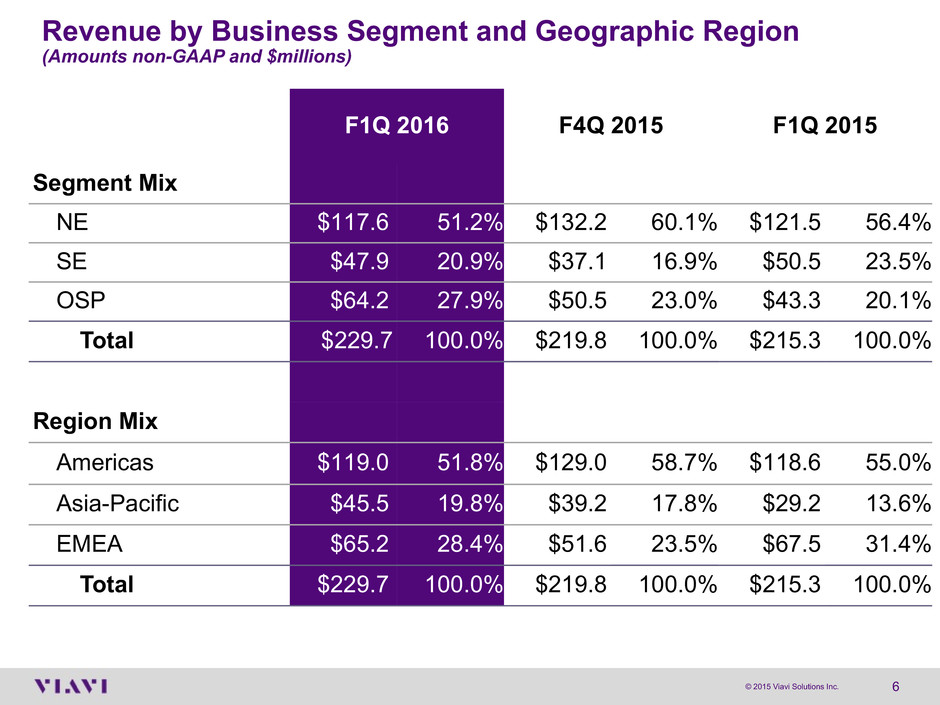
6© 2015 Viavi Solutions Inc. Revenue by Business Segment and Geographic Region (Amounts non-GAAP and $millions) F1Q 2016 F4Q 2015 F1Q 2015 Segment Mix NE $117.6 51.2% $132.2 60.1% $121.5 56.4% SE $47.9 20.9% $37.1 16.9% $50.5 23.5% OSP $64.2 27.9% $50.5 23.0% $43.3 20.1% Total $229.7 100.0% $219.8 100.0% $215.3 100.0% Region Mix Americas $119.0 51.8% $129.0 58.7% $118.6 55.0% Asia-Pacific $45.5 19.8% $39.2 17.8% $29.2 13.6% EMEA $65.2 28.4% $51.6 23.5% $67.5 31.4% Total $229.7 100.0% $219.8 100.0% $215.3 100.0%

7© 2015 Viavi Solutions Inc. Business Segment Results (Amounts non-GAAP and $millions) F1Q 2016 F4Q 2015 F1Q 2015 Revenue NE $117.6 $132.2 $121.5 SE $47.9 $37.1 $50.5 OSP $64.2 $50.5 $43.3 Total $229.7 $219.8 $215.3 Gross Margin NE 64.4% 65.0 % 66.0 % SE 69.7% 63.6 % 69.3 % OSP 57.6% 55.8 % 53.3 % Total 63.6% 62.6 % 64.2 % Operating Margin NSE 1.5% (1.5)% (0.8)% OSP 41.0% 38.4 % 33.0 % Total 12.5% 7.7 % 6.0 %
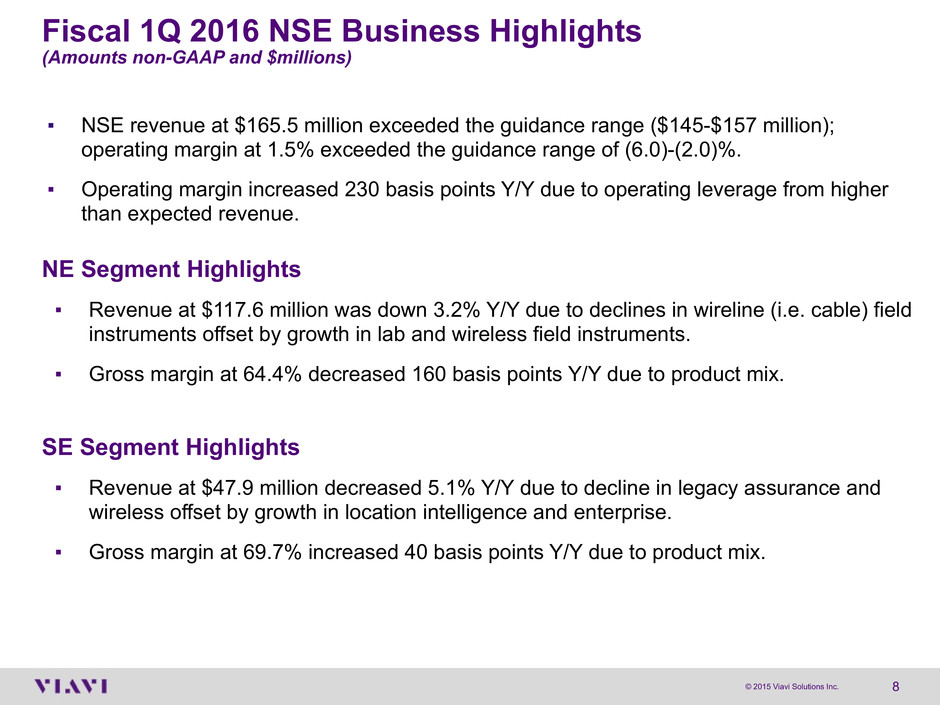
8© 2015 Viavi Solutions Inc. Fiscal 1Q 2016 NSE Business Highlights (Amounts non-GAAP and $millions) NE Segment Highlights ▪ Revenue at $117.6 million was down 3.2% Y/Y due to declines in wireline (i.e. cable) field instruments offset by growth in lab and wireless field instruments. ▪ Gross margin at 64.4% decreased 160 basis points Y/Y due to product mix. SE Segment Highlights ▪ Revenue at $47.9 million decreased 5.1% Y/Y due to decline in legacy assurance and wireless offset by growth in location intelligence and enterprise. ▪ Gross margin at 69.7% increased 40 basis points Y/Y due to product mix. ▪ NSE revenue at $165.5 million exceeded the guidance range ($145-$157 million); operating margin at 1.5% exceeded the guidance range of (6.0)-(2.0)%. ▪ Operating margin increased 230 basis points Y/Y due to operating leverage from higher than expected revenue.

9© 2015 Viavi Solutions Inc. Fiscal 1Q 2016 Segment Highlights - OSP (Amounts non-GAAP and $millions) ▪ Revenue at $64.2 million exceeded the guidance range ($59-$63 million); operating margin at 41.0% was at the high-end of the guidance range (39.0%-41.0%). ▪ Revenue up 48.3% Y/Y on higher anti-counterfeiting revenue driven by increased bank- note printing volume and uptick in the government business. ▪ Gross margin at 57.6% increased 430 basis points Y/Y due to favorable product mix with higher anti-counterfeiting revenue. ▪ Operating margin increased 800 basis points Y/Y due to higher gross margin drop- through on higher revenue.
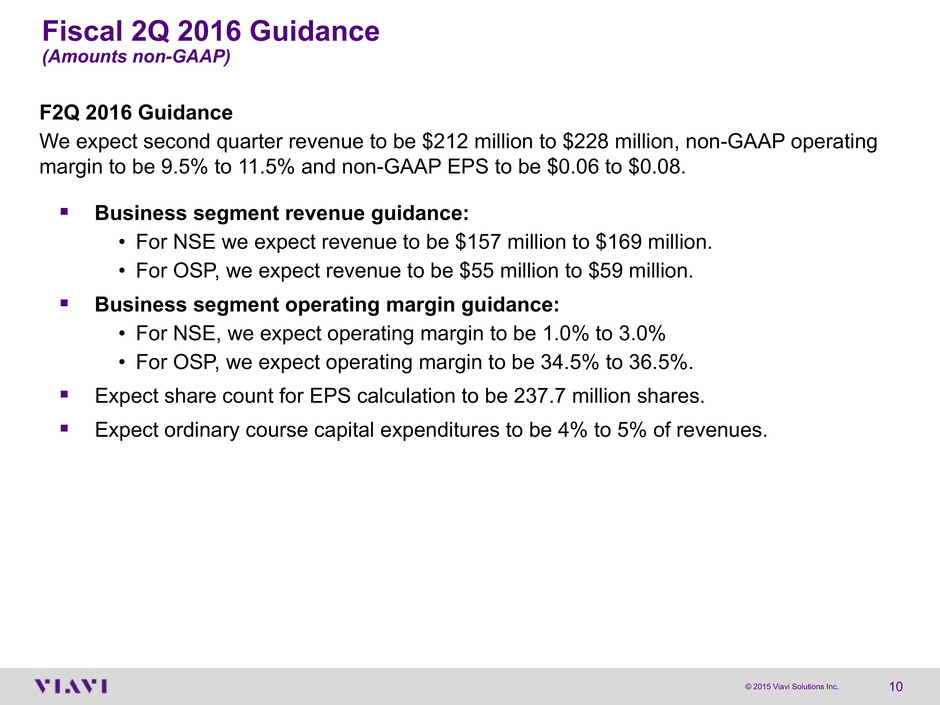
10© 2015 Viavi Solutions Inc. F2Q 2016 Guidance We expect second quarter revenue to be $212 million to $228 million, non-GAAP operating margin to be 9.5% to 11.5% and non-GAAP EPS to be $0.06 to $0.08. ▪ Business segment revenue guidance: • For NSE we expect revenue to be $157 million to $169 million. • For OSP, we expect revenue to be $55 million to $59 million. ▪ Business segment operating margin guidance: • For NSE, we expect operating margin to be 1.0% to 3.0% • For OSP, we expect operating margin to be 34.5% to 36.5%. ▪ Expect share count for EPS calculation to be 237.7 million shares. ▪ Expect ordinary course capital expenditures to be 4% to 5% of revenues. Fiscal 2Q 2016 Guidance (Amounts non-GAAP)

11© 2015 Viavi Solutions Inc. Upcoming Investor Events Nov 17, 2015 Viavi 2015 Annual Shareholders Meeting Milpitas, CA Nov 18, 2015 UBS Global Technology Conference San Francisco, CA Dec 10, 2015 William Blair Optical Bus Tour Milpitas, CA

12 Appendix
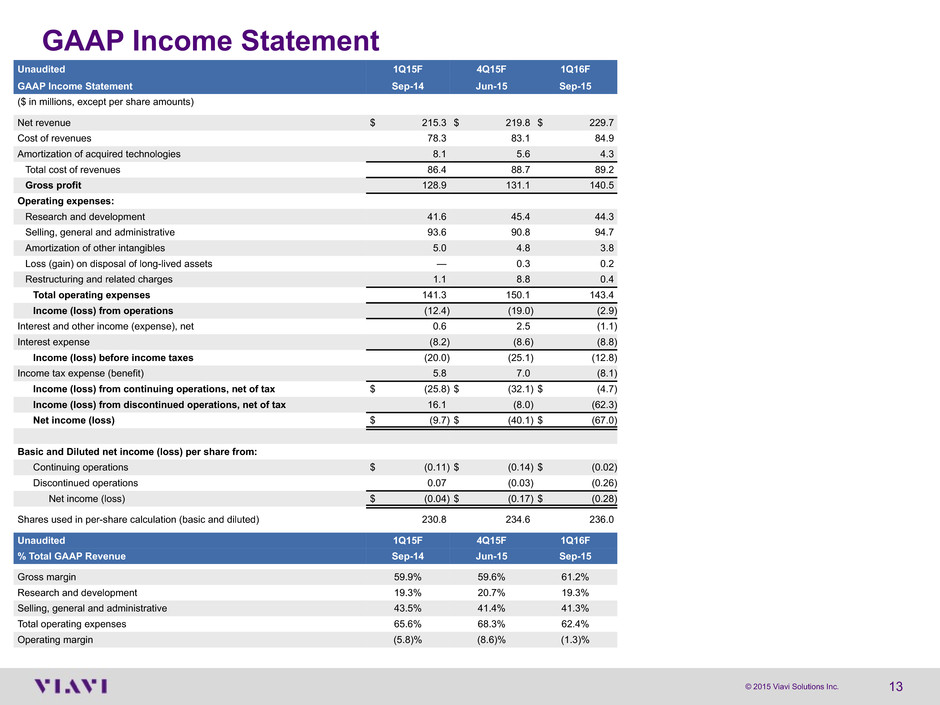
13© 2015 Viavi Solutions Inc. GAAP Income Statement Unaudited 1Q15F 4Q15F 1Q16F GAAP Income Statement Sep-14 Jun-15 Sep-15 ($ in millions, except per share amounts) Net revenue $ 215.3 $ 219.8 $ 229.7 Cost of revenues 78.3 83.1 84.9 Amortization of acquired technologies 8.1 5.6 4.3 Total cost of revenues 86.4 88.7 89.2 Gross profit 128.9 131.1 140.5 Operating expenses: Research and development 41.6 45.4 44.3 Selling, general and administrative 93.6 90.8 94.7 Amortization of other intangibles 5.0 4.8 3.8 Loss (gain) on disposal of long-lived assets — 0.3 0.2 Restructuring and related charges 1.1 8.8 0.4 Total operating expenses 141.3 150.1 143.4 Income (loss) from operations (12.4) (19.0) (2.9) Interest and other income (expense), net 0.6 2.5 (1.1) Interest expense (8.2) (8.6) (8.8) Income (loss) before income taxes (20.0) (25.1) (12.8) Income tax expense (benefit) 5.8 7.0 (8.1) Income (loss) from continuing operations, net of tax $ (25.8) $ (32.1) $ (4.7) Income (loss) from discontinued operations, net of tax 16.1 (8.0) (62.3) Net income (loss) $ (9.7) $ (40.1) $ (67.0) Basic and Diluted net income (loss) per share from: Continuing operations $ (0.11) $ (0.14) $ (0.02) Discontinued operations 0.07 (0.03) (0.26) Net income (loss) $ (0.04) $ (0.17) $ (0.28) Shares used in per-share calculation (basic and diluted) 230.8 234.6 236.0 Unaudited 1Q15F 4Q15F 1Q16F % Total GAAP Revenue Sep-14 Jun-15 Sep-15 Gross margin 59.9% 59.6% 61.2% Research and development 19.3% 20.7% 19.3% Selling, general and administrative 43.5% 41.4% 41.3% Total operating expenses 65.6% 68.3% 62.4% Operating margin (5.8)% (8.6)% (1.3)%

14© 2015 Viavi Solutions Inc. Non-GAAP Income Statement Unaudited 1Q15F 4Q15F 1Q16F Non-GAAP Income Statement Sep-14 Jun-15 Sep-15 ($ in millions, except per share amounts) Net revenue $ 215.3 $ 219.8 $ 229.7 Cost of revenues 77.0 82.1 83.6 Gross profit 138.3 137.7 146.1 Operating expenses: Research and development 39.7 41.5 40.2 Selling, general and administrative 85.6 79.3 77.2 Total operating expenses 125.3 120.8 117.4 Income from operations 13.0 16.9 28.7 Interest and other income (expense), net (1.3) (1.8) (3.4) Income (loss) before income taxes 11.7 15.1 25.3 Income tax expense (benefit) 4.3 4.7 5.7 Net income (loss) $ 7.4 $ 10.4 $ 19.6 Earnings (loss) per share, basic $ 0.03 $ 0.04 $ 0.08 Earnings (loss) per share, diluted $ 0.03 $ 0.04 $ 0.08 Shares used in per-share calculation (basic) 230.8 234.6 236.0 Shares used in per-share calculation (diluted) 233.3 237.5 238.7 Unaudited 1Q15F 4Q15F 1Q16F % Total Non-GAAP Revenue Sep-14 Jun-15 Sep-15 Gross margin 64.2% 62.6% 63.6% Research and development 18.4% 18.9% 17.5% Selling, general and administrative 39.8% 36.1% 33.6% Total operating expenses 58.2% 55.0% 51.1% Operating margin 6.0% 7.7% 12.5% Unaudited 1Q15F 4Q15F 1Q16F Net Income GAAP to Non-GAAP Reconciliation Sep-14 Jun-15 Sep-15 GAAP net income (loss) $ (9.7) $ (40.1) $ (67.0) Stock-based compensation 10.5 11.7 16.0 Amortization of intangibles 13.1 10.4 8.1 Loss (gain) on disposal of long-lived assets — 0.3 0.2 Restructuring and related charges 1.1 8.8 0.4 Other charges related to non-recurring activities 0.7 4.7 6.9 Interest and other income — (2.2) — Non-cash interest expense 6.3 6.5 6.5 Gain, loss or impairment of investments — — — Discontinued operations, net of tax (16.1) 8.0 62.3 Income taxes 1.5 2.3 (13.8) Non-GAAP net income $ 7.4 $ 10.4 $ 19.6
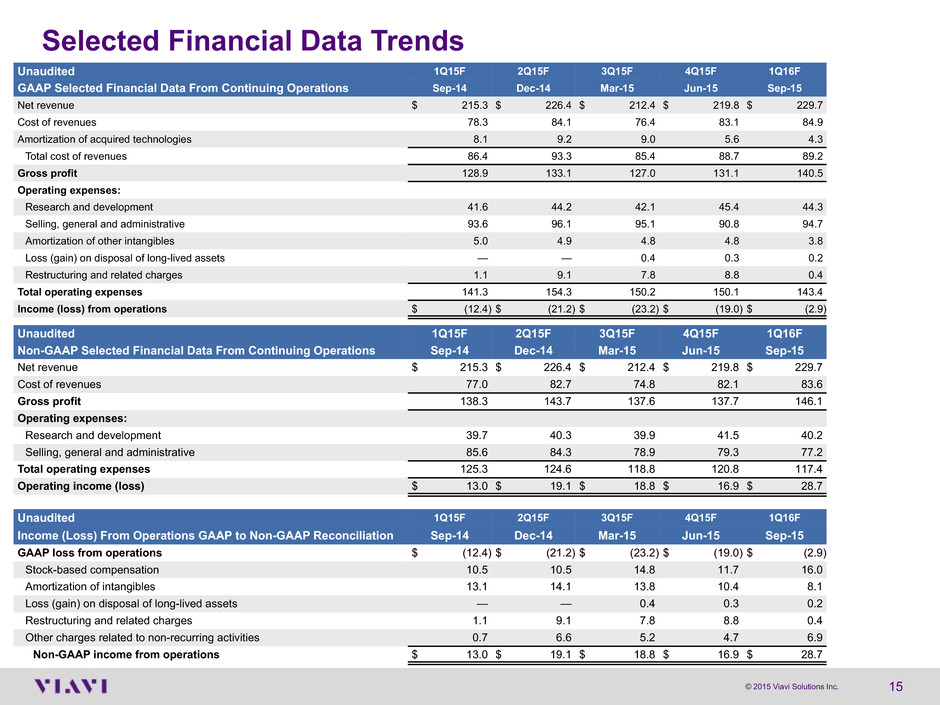
15© 2015 Viavi Solutions Inc. Selected Financial Data Trends Unaudited 1Q15F 2Q15F 3Q15F 4Q15F 1Q16F GAAP Selected Financial Data From Continuing Operations Sep-14 Dec-14 Mar-15 Jun-15 Sep-15 Net revenue $ 215.3 $ 226.4 $ 212.4 $ 219.8 $ 229.7 Cost of revenues 78.3 84.1 76.4 83.1 84.9 Amortization of acquired technologies 8.1 9.2 9.0 5.6 4.3 Total cost of revenues 86.4 93.3 85.4 88.7 89.2 Gross profit 128.9 133.1 127.0 131.1 140.5 Operating expenses: Research and development 41.6 44.2 42.1 45.4 44.3 Selling, general and administrative 93.6 96.1 95.1 90.8 94.7 Amortization of other intangibles 5.0 4.9 4.8 4.8 3.8 Loss (gain) on disposal of long-lived assets — — 0.4 0.3 0.2 Restructuring and related charges 1.1 9.1 7.8 8.8 0.4 Total operating expenses 141.3 154.3 150.2 150.1 143.4 Income (loss) from operations $ (12.4) $ (21.2) $ (23.2) $ (19.0) $ (2.9) Unaudited 1Q15F 2Q15F 3Q15F 4Q15F 1Q16F Non-GAAP Selected Financial Data From Continuing Operations Sep-14 Dec-14 Mar-15 Jun-15 Sep-15 Net revenue $ 215.3 $ 226.4 $ 212.4 $ 219.8 $ 229.7 Cost of revenues 77.0 82.7 74.8 82.1 83.6 Gross profit 138.3 143.7 137.6 137.7 146.1 Operating expenses: Research and development 39.7 40.3 39.9 41.5 40.2 Selling, general and administrative 85.6 84.3 78.9 79.3 77.2 Total operating expenses 125.3 124.6 118.8 120.8 117.4 Operating income (loss) $ 13.0 $ 19.1 $ 18.8 $ 16.9 $ 28.7 Unaudited 1Q15F 2Q15F 3Q15F 4Q15F 1Q16F Income (Loss) From Operations GAAP to Non-GAAP Reconciliation Sep-14 Dec-14 Mar-15 Jun-15 Sep-15 GAAP loss from operations $ (12.4) $ (21.2) $ (23.2) $ (19.0) $ (2.9) Stock-based compensation 10.5 10.5 14.8 11.7 16.0 Amortization of intangibles 13.1 14.1 13.8 10.4 8.1 Loss (gain) on disposal of long-lived assets — — 0.4 0.3 0.2 Restructuring and related charges 1.1 9.1 7.8 8.8 0.4 Other charges related to non-recurring activities 0.7 6.6 5.2 4.7 6.9 Non-GAAP income from operations $ 13.0 $ 19.1 $ 18.8 $ 16.9 $ 28.7
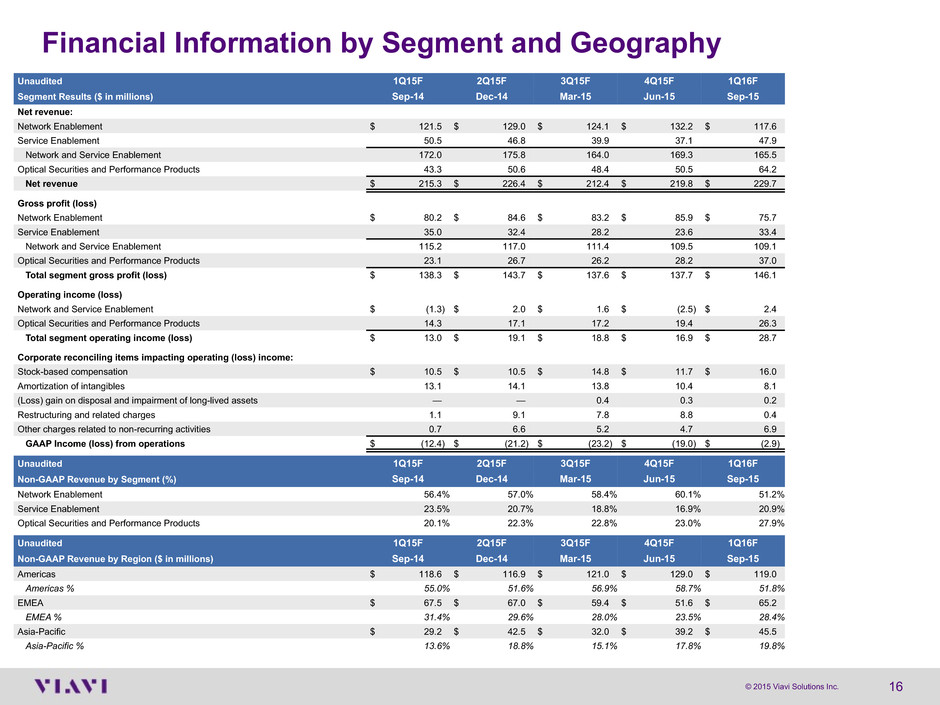
16© 2015 Viavi Solutions Inc. Financial Information by Segment and Geography Unaudited 1Q15F 2Q15F 3Q15F 4Q15F 1Q16F Segment Results ($ in millions) Sep-14 Dec-14 Mar-15 Jun-15 Sep-15 Net revenue: Network Enablement $ 121.5 $ 129.0 $ 124.1 $ 132.2 $ 117.6 Service Enablement 50.5 46.8 39.9 37.1 47.9 Network and Service Enablement 172.0 175.8 164.0 169.3 165.5 Optical Securities and Performance Products 43.3 50.6 48.4 50.5 64.2 Net revenue $ 215.3 $ 226.4 $ 212.4 $ 219.8 $ 229.7 Gross profit (loss) Network Enablement $ 80.2 $ 84.6 $ 83.2 $ 85.9 $ 75.7 Service Enablement 35.0 32.4 28.2 23.6 33.4 Network and Service Enablement 115.2 117.0 111.4 109.5 109.1 Optical Securities and Performance Products 23.1 26.7 26.2 28.2 37.0 Total segment gross profit (loss) $ 138.3 $ 143.7 $ 137.6 $ 137.7 $ 146.1 Operating income (loss) Network and Service Enablement $ (1.3) $ 2.0 $ 1.6 $ (2.5) $ 2.4 Optical Securities and Performance Products 14.3 17.1 17.2 19.4 26.3 Total segment operating income (loss) $ 13.0 $ 19.1 $ 18.8 $ 16.9 $ 28.7 Corporate reconciling items impacting operating (loss) income: Stock-based compensation $ 10.5 $ 10.5 $ 14.8 $ 11.7 $ 16.0 Amortization of intangibles 13.1 14.1 13.8 10.4 8.1 (Loss) gain on disposal and impairment of long-lived assets — — 0.4 0.3 0.2 Restructuring and related charges 1.1 9.1 7.8 8.8 0.4 Other charges related to non-recurring activities 0.7 6.6 5.2 4.7 6.9 GAAP Income (loss) from operations $ (12.4) $ (21.2) $ (23.2) $ (19.0) $ (2.9) Unaudited 1Q15F 2Q15F 3Q15F 4Q15F 1Q16F Non-GAAP Revenue by Segment (%) Sep-14 Dec-14 Mar-15 Jun-15 Sep-15 Network Enablement 56.4% 57.0% 58.4% 60.1% 51.2% Service Enablement 23.5% 20.7% 18.8% 16.9% 20.9% Optical Securities and Performance Products 20.1% 22.3% 22.8% 23.0% 27.9% Unaudited 1Q15F 2Q15F 3Q15F 4Q15F 1Q16F Non-GAAP Revenue by Region ($ in millions) Sep-14 Dec-14 Mar-15 Jun-15 Sep-15 Americas $ 118.6 $ 116.9 $ 121.0 $ 129.0 $ 119.0 Americas % 55.0% 51.6% 56.9% 58.7% 51.8% EMEA $ 67.5 $ 67.0 $ 59.4 $ 51.6 $ 65.2 EMEA % 31.4% 29.6% 28.0% 23.5% 28.4% Asia-Pacific $ 29.2 $ 42.5 $ 32.0 $ 39.2 $ 45.5 Asia-Pacific % 13.6% 18.8% 15.1% 17.8% 19.8%
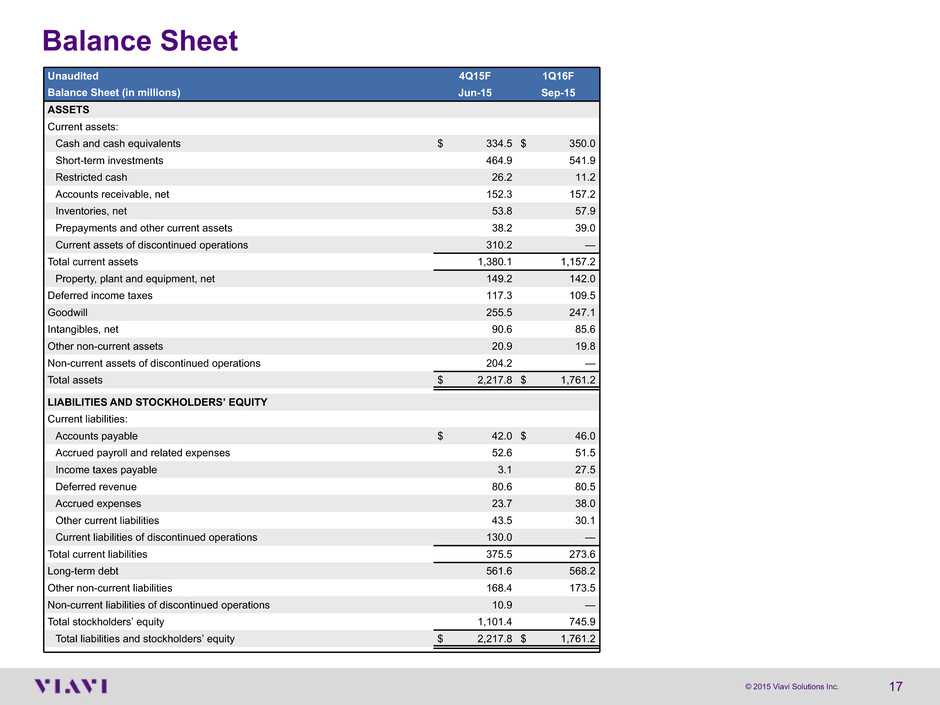
17© 2015 Viavi Solutions Inc. Balance Sheet Unaudited 4Q15F 1Q16F Balance Sheet (in millions) Jun-15 Sep-15 ASSETS Current assets: Cash and cash equivalents $ 334.5 $ 350.0 Short-term investments 464.9 541.9 Restricted cash 26.2 11.2 Accounts receivable, net 152.3 157.2 Inventories, net 53.8 57.9 Prepayments and other current assets 38.2 39.0 Current assets of discontinued operations 310.2 — Total current assets 1,380.1 1,157.2 Property, plant and equipment, net 149.2 142.0 Deferred income taxes 117.3 109.5 Goodwill 255.5 247.1 Intangibles, net 90.6 85.6 Other non-current assets 20.9 19.8 Non-current assets of discontinued operations 204.2 — Total assets $ 2,217.8 $ 1,761.2 LIABILITIES AND STOCKHOLDERS’ EQUITY Current liabilities: Accounts payable $ 42.0 $ 46.0 Accrued payroll and related expenses 52.6 51.5 Income taxes payable 3.1 27.5 Deferred revenue 80.6 80.5 Accrued expenses 23.7 38.0 Other current liabilities 43.5 30.1 Current liabilities of discontinued operations 130.0 — Total current liabilities 375.5 273.6 Long-term debt 561.6 568.2 Other non-current liabilities 168.4 173.5 Non-current liabilities of discontinued operations 10.9 — Total stockholders’ equity 1,101.4 745.9 Total liabilities and stockholders’ equity $ 2,217.8 $ 1,761.2
