Attached files
Table of Contents
UNITED STATES
SECURITIES AND EXCHANGE COMMISSION
Washington, D.C. 20549
Form 10-K
(Mark One)
| þ | ANNUAL REPORT PURSUANT TO SECTION 13 OR 15(d) OF THE SECURITIES EXCHANGE ACT OF 1934 |
| For the fiscal year ended July 3, 2010 |
| OR |
| ¨ | TRANSITION REPORT PURSUANT TO SECTION 13 OR 15(d) OF THE SECURITIES EXCHANGE ACT OF 1934 |
| For the transition period from to |
Commission File Number 0-22874
JDS UNIPHASE CORPORATION
(Exact name of Registrant as specified in its charter)
| Delaware | 94-2579683 | |
| (State or other jurisdiction of incorporation or organization) | (I.R.S. Employer Identification Number) |
430 North McCarthy Boulevard, Milpitas, California 95035
(Address of principal executive offices including Zip code)
(408) 546-5000
(Registrant’s telephone number, including area code)
Securities registered pursuant to Section 12(b) of the Act:
Common Stock, par value of $0.001 per share
Preferred Stock Purchase Rights
(Title of Class)
Securities registered pursuant to Section 12(g) of the Act:
None
Indicate by check mark if the registrant is a well-known seasoned issuer, as defined in Rule 405 of the Securities Act. Yes x No ¨
Indicate by check mark if the registrant is not required to file reports pursuant to Section 13 or 15(d) of the Act. Yes ¨ No x
Indicate by check mark whether the Registrant (1) has filed all reports required to be filed by Section 13 or 15(d) of the Securities Exchange Act of 1934 during the preceding 12 months (or for such shorter period that the Registrant was required to file such reports), and (2) has been subject to such filing requirements for the past 90 days. Yes x No ¨
Indicate by check mark whether the registrant has submitted electronically and posted on its corporate Web site, if any, every Interactive Data File required to be submitted and posted pursuant to Rule 405 of Regulation S-T during the preceding 12 months (or for such shorter period that the registrant was required to submit and post such files). Yes ¨ No ¨
Indicate by check mark if disclosure of delinquent filers pursuant to Item 405 of Regulation S-K is not contained herein, and will not be contained to the best of the Registrant’s knowledge, in definitive proxy or information statements incorporated by reference in Part III of this Form 10-K or any amendment to this Form 10-K. ¨
Indicate by check mark whether the registrant is a large accelerated filer, an accelerated filer, or a non-accelerated filer. See definition of “accelerated filer and large accelerated filer” in Rule 12b-2 of the Exchange Act. (Check one):
| Large accelerated filer x | Accelerated filer ¨ | Non-accelerated filer ¨ |
Indicate by check mark whether the registrant is a shell company (as defined in Rule 12b-2 of the Exchange Act). Yes ¨ No x
As of January 2, 2010 the aggregate market value of the voting stock held by non-affiliates of the Registrant was approximately $1.8 billion, based upon the closing sale prices of the common stock as reported on the NASDAQ National Market. Shares of common stock held by executive officers and directors have been excluded from this calculation because such persons may be deemed to be affiliates. This determination of affiliate status is not necessarily a conclusive determination for other purposes.
As of July 30, 2010, the Registrant had 221,589,218 shares of common stock outstanding, including 4,323,590 exchangeable shares of JDS Uniphase Canada Ltd. Each exchangeable share is exchangeable at any time into common stock on a one-for-one basis, entitles a holder to dividend and other rights economically equivalent to those of the common stock, and through a voting trust, votes at meetings of stockholders of the Registrant.
Documents Incorporated by Reference: Portions of the Registrant’s Notice of Annual Meeting of stockholders and Proxy Statement to be filed pursuant to Regulation 14A within 120 days after Registrant’s fiscal year end of July 3, 2010 are incorporated by reference into Part III of this Report.
Table of Contents
2
Table of Contents
FORWARD-LOOKING STATEMENTS
Statements contained in this Annual Report on Form 10-K which are not historical facts are forward-looking statements within the meaning of Section 21E of the Securities Exchange Act of 1934, as amended. A forward-looking statement may contain words such as “anticipates that,” “believes,” “can impact,” “continue to,” “estimates,” “expects to,” “intends,” “may,” “plans,” “potential,” “projects,” “to be,” “will be,” “will continue to be,” “continuing,” “ongoing,” or the negative thereof or other comparable terminology regarding beliefs, plans, expectations or intentions regarding the future. Forward-looking statements include statements regarding: our expectations regarding an increase in consumer demand for real-time, interactive visual and audio experiences; our beliefs regarding bandwidth growth over optical networks; our belief that we are well positioned to benefit from industry trends; our plan to expand opportunities in emerging geographies and through channel marketing; our strategy to operate as a Company comprised of a portfolio of businesses with a focus on optical and broadband innovation; our expectation that the growing demand for network capacity will encourage the adoption of communications and commercial optical products across the telecom sector; our belief that an increase in network capacity will increase the demand for optical products in the storage and enterprise sectors; our belief that the deployment of fiber closer to the end user increases the availability of high-bandwidth services and will result in increased demand on the metro and long-haul networks; our plan to continue to enable our customers to build systems for Agile Optical Networks (“AON”); our expectation that the Company will continue to play a vital role in the broadband and optical innovation that enables breakthrough solutions for essential high-tech industries; our belief that we are well positioned to migrate from fixed to reconfigurable dense wavelength division multiplexer (“DWDM”) architectures and networks; our belief that increasing deployments of broadband access, the expansion of IP-based services, and the need to reduce deployment time and cost should result in increased demand for communications test and measurement instruments, systems, software and services; our expectation that the Company’s Communications Test and Measurement business unit will continue to improve profitability; our belief that we have the broadest range of wire line products and solutions available in the communications test and measurement industry; our belief that our broad portfolio of test and measurement solutions position the Company well to benefit from these improvements; our plan to continue to leverage our unique intellectual property, including leading expertise in optics, light management and material technology to develop solutions that provide unique advantages for our customers; our belief in the increasing demand for high quality lasers for a variety of markets; our belief that the Company is well positioned to benefit from the demand for quality compact lasers; our plan to accelerate new customer applications enabled by using lasers coupled with high performance photonic power photovoltaic converters to provide power over fiber; our belief that the Company is a pioneer in the emerging market of photonic power; our plan to continue to help customers make their existing networks more flexible and agile by designing agility into our products at the photonic level; our objective to continue to be a leading supplier for all markets and industries we serve and the strategies we plan to pursue to achieve such objective; our commitment to invest organically through acquisitions and partnerships in new technologies, products and services; our commitment to the ongoing evaluation of strategic opportunities and the acquisition of additional products, technologies or businesses; our belief that we strengthened our business model by expanding our addressable market, customer base and expertise, diversifying our product portfolio and fortifying our core businesses through acquisitions as well as other organic initiatives; our plans to leverage the technologies, distribution relationships, products and services gained as a result of acquisitions; our belief that our acquisitions create new opportunities for the acquired products due to JDSU’s direct sales and service organization serving the largest telecommunications and cable service providers worldwide; our plan to continue to strengthen our partnerships with contract manufacturers for our telecommunications, data communications and laser products; our intention to continue to centralize many administrative functions such as information technology, human resources and finance; our devotion of substantial resources to research and development in order to develop new and enhanced products to serve our markets and segments; our intention to establish at least two sources of supply for raw materials whenever possible; our intention not to broadly license our intellectual property rights; our belief that we have good employee relations; our expectation that seasonable demand fluctuations will cause significant, periodic variations in our financial results for our Communications Test and Measurement segment; our desire to expand our markets and customer base, improve the profitability of our product portfolio and
3
Table of Contents
improve time to revenue in our Advanced Optical Technologies segment and commercial lasers business and efforts to effect such changes; our efforts to reduce our cost structure; the impact of restructuring and related charges on our results of operations and cash flows; our efforts to divert resources from new product research and development and other functions to assist with difficulties related to execution capabilities and customer relations; our continued experiences with product failures; our intention to continue to develop new product lines and improve the business for existing ones; our expectation that the introduction of new products will continue to incur higher start-up costs and increased yield and product quality risk among other issues; our expectations regarding our future growth; our continued reliance on a limited number of customers for a significant portion of our revenues; our expectation that we will continue to experience strain on our supply chain and periodic supplier problems; our belief that we must maintain a substantial commitment to innovation and product differentiation, as well as significantly reduce cost structure to remain competitive in future business climates; our intention to continue to address the need to develop new products through acquisitions of other companies and technologies; our efforts to continue to recruit key personnel; our expectations that net revenue from international customers outside of North America will continue to account for a significant portion of our total revenue; our expectation regarding the expansion of our research and development activities in China; our expectation of the need to respond to and our intention to respond to intellectual property infringement claims in the course of our business operations from our competitors; our belief that our existing properties, including both owned and leased sites, are in good condition and suitable for the conduct of our business; our belief that our existing facilities are adequate to meet our immediate needs; our belief that various critical accounting policies are affected by significant estimates, assumptions and judgments used in the preparation of our consolidated financial statements; our belief that using a combination of historical and market-based implied volatility from traded options on Company common stock is a better indicator of expected volatility and future stock price trends than relying solely on historical volatility; our anticipation that cash dividends will not be paid in the foreseeable future; our commitment to enabling broadband and optical innovation in the communications and commercial markets; our expectation that high customer concentration, attendant pricing pressure, and other effects on our communications markets will remain for the foreseeable future; our efforts to expand our products, customers and distribution channels for several of our core competencies; our expectations that seasonality in the Communications Test and Measurement segment will continue for the foreseeable future; our expectation that the adoption of certain accounting pronouncements will not have a material adverse effect on our financial statements; our estimates for costs associated with our restructuring plans; our assumptions related to pension and postretirement benefits; our expectation that we will continue to encounter a number of industry and market structural risks and uncertainties that will limit our business climate and market visibility; the continued North American assembly transitions; our belief that investment in research and development (“R&D”) is critical to attaining our strategic objectives; our continued efforts to reduce total operating spending; our intention to continue to address our selling, general and administrative (“SG&A”) expenses and reduce these expenses as and when opportunities arise; our expectations regarding future SG&A expenses; our expectation that none of the non-core SG&A expenses will have a material adverse impact on our financial condition; our expectation that the zero coupon convertible notes will be retired within one year; our efforts to take advantage of opportunities to reduce costs through targeted, customer-driven restructuring events; our expectation that payments related to severance benefits will be paid off by the third quarter of fiscal 2013 and that payments related to lease costs will be paid by the fourth quarter of fiscal 2012; our plan to pay the lease costs associated with the Ottawa facility by the third quarter of fiscal 2018; our belief that we have provided adequate amounts for adjustments that may result from tax audits; our estimates for additional required investment in research and development in connection with our acquisitions; our expectation that our acquisitions will strengthen the Company’s position in the related markets and help grow our business in various regions; our belief that our existing cash balances and investments will be sufficient to meet our liquidity and capital spending requirements at least through the next 12 months; our expectation that gains and losses on derivatives will be offset by re-measurement gains and losses on the foreign currency dominated assets and liabilities; our ability to mitigate credit risk and marketability risk of our portfolio of investments; our intention to maintain a sufficient safety stock of products and to maintain ongoing communications with suppliers to guard against interruptions or cessation of supply; the expectation for the deductibility of goodwill associated with our acquisitions; our estimates for associated restructuring and non-recurring charges; our estimate that no
4
Table of Contents
additional taxes would have to be provided if the earnings were repatriated back to the U.S.; our belief that certain jurisdictions in which we received tax benefits attributable to the release of valuation allowances will generate future income; our expectation that the Full Value Awards will vest over one to four years; our expectation to amortize $12.1 million of unrecognized stock-based compensation cost related to stock option activity over a period of 2.0 years; our expectation to amortize $0.1 million of stock based compensation expense related to the employee stock purchase plan (“ESPP”) in the first quarter of fiscal 2011; our expectation to amortize $32.8 million of estimated stock based compensation expense related to Full Value Awards over an estimated amortization period of 2.1 years; our expectation that the required contribution to the Company’s pension plans in fiscal 2011 will be $0.3 million; our expectation to close $138.1 million in obligations to purchase inventory and other commitments within one year; our estimate that the Company’s potential tax liability related to a Texas franchise tax audit will be from zero to $36.5 million, plus interest and penalties; and our belief that resolving claims that arise in the ordinary course of our business will not have a material adverse impact on our financial position or results of operations.
Management cautions that forward-looking statements are subject to risks and uncertainties that could cause our actual results to differ materially from those projected in such forward-looking statements. These forward-looking statements involve risks and uncertainties that could cause actual results to differ materially from those projected, including, without limitation, the following: incorrect assumptions regarding the basis for consumer demands; an unexpected decreased in the availability of broadband networks; our inability to successfully capitalize on our position in the market, industry trends and strategic opportunities; inability to successfully operate as a portfolio of businesses solely with a focus on optical and broadband innovation; inability to meet marketplace demands for communications and commercial optical products; inability to accurately assess the demand on the metro and long-haul networks into which high-bandwidth services feed; inability to support our customer growth in building systems for AONs; our inability to assess the feasibility of certain innovations and the impact that such innovations might have on high-tech industries; licensing issues related to our intellectual property; broader product offering of competitors; inaccuracies regarding the direction of the market to migrate from fixed to reconfigurable DWDM architectures and networks; inability to accurately assess the market demand for communications test and measurement instruments, systems, software and services; difficulties associated with limiting and predicting costs in the Communications Test and Measurement business unit; inaccurate assumptions regarding the optical industry; inability to accurately predict the demand for high-quality lasers in various commercial markets; inability to quickly introduce customer applications into the marketplace to meet customer demands for commercial lasers; inaccuracies regarding the Company’s position in the photonic power market; inaccurate assumptions regarding the importance of agility and flexibility to our current customers; our inability to invest in new technologies; inaccuracies regarding promising markets and our ability to focus the company’s resources towards developing products for potentially promising markets; unanticipated SG&A expenses and inaccuracies as to the impact of SG&A expenses on the Company’s financial condition; inaccurate assumptions regarding the viability of certain product lines; unanticipated difficulties associated with the centralization of administrative functions; inability to timely and effectively develop, manufacture and market our new products, or enhance our existing products; our inability to accurately and timely complete valuation analyses in connection with our acquisitions; our limited ability to perceive or predict market trends; decreases in our product portfolio and revenues; inaccuracies regarding our employee relations and inability to maintain a steady workforce; loss of a significant customer eliminating a significant portion of our future revenues; dependence on fewer customers limiting our ability to increase our profitability; unrealized customer and market penetration resulting from our recent acquisitions; inability to effectively execute programs related to our investments and partnerships; failure to reduce manufacturing costs through restructuring efforts; inability to accurately predict the volatility of future stock trends; introduction of new accounting pronouncements; lack of resources set aside for investment in R&D; inaccurate assessment of our tax liability as a result of acquisitions and tax audits; greater than anticipated tax exposure; unforeseen damage and repairs to the Company’s leased and owned properties; need to expand or decrease the size of our existing facilities; excessive costs associated with defending various claims and suits brought against the Company and its directors; unexpected impairment of goodwill associated with our acquisitions; delays in bringing products to market due to development problems; excessively high costs in the
5
Table of Contents
future related to enhancing our existing systems; significant changes in customer preferences; the possibility that competitors will introduce products faster than us; unanticipated difficulties in building close working relationships with manufacturers; our inability to establish relationships with alternative suppliers of raw materials; growth in our business placing unexpected strains on our resources; international expansion beyond the capacities of our current properties; loss of key personnel to competitors and an inability to effectively recruit replacements; inherent uncertainty surrounding the litigation process and the fact that litigation could result in substantial cost and diversion of our management’s attention; inability to obtain new orders from major customers; substantial technological changes in the Communications Test and Measurement solutions market; the timing of orders; difficulties in assessing the impact of accounting changes on financial statements; incorrect estimates, assumptions and judgments used in preparing the Company’s consolidated financial statements; inaccuracies in categorizing equipment for accounting purposes; inaccuracies related to the assumptions used in assessing the Company’s option-price; market rejection of new products; inaccuracies of the strength of various acquisitions on improving the Company’s position within various markets; inability to accurately predict when various products acquired during our acquisitions will be fully developed and completed; inaccurate assumptions or estimates associated with severance and lease payments; inability to accurately assess additional tax expenses due to repatriation of certain earnings in China; inability to accurately assess future income attributable to tax benefits; inability to predict the vesting period of the Company’s Full Value Awards; difficulty in estimating the amortization period of stock based compensation expense of stock option activity and our ESPP; inability to accurately predict the amount of money the Company must contribute to its pension plans as legally mandated; inability to deliver inventory and collect payments due under purchase orders; and other factors set forth in “Risk Factors” and elsewhere herein. Further, our future business, financial condition and results of operations could differ materially from those anticipated by such forward-looking statements and are subject to risks and uncertainties including the risks set forth above and in Part I, Item 1A “Risk Factors” set forth in this Form 10-K. Moreover, neither we assume nor any other person assumes responsibility for the accuracy and completeness of the forward-looking statements. Forward-looking statements are made only as of the date of this Report and subsequent facts or circumstances may contradict, obviate, undermine or otherwise fail to support or substantiate such statements. We are under no duty to update any of the forward-looking statements after the date of this Form 10-K to conform such statements to actual results or to changes in our expectations.
6
Table of Contents
PART I
General
Overview
JDS Uniphase Corporation (“JDSU”) is a leading provider of communications test and measurement solutions and optical products for telecommunications service providers, wireless operators, cable operators, and network equipment manufacturers. JDSU is also a leading provider of optical solutions for biomedical and environmental instrumentation, semiconductor processing, aerospace and defense, brand authentication, display systems, and custom color product differentiation applications.
To serve its markets, JDSU operates in the following business segments: Communications Test and Measurement (“CommTest”), which accounted for approximately 47% of net revenue in fiscal 2010; Communications and Commercial Optical Products (“CCOP”), which accounted for approximately 37% of net revenue in fiscal 2010; and Advanced Optical Technologies (“AOT”), which accounted for approximately 16% of net revenue in fiscal 2010.
Industry Trends
The trends that drive the broadband communications industry are key drivers for our communications test and measurement and our communications and commercial optical products businesses. Demand for high-bandwidth communications is increasing, powered by the growing number of broadband users worldwide and the greater reliance on high-bandwidth capabilities in our daily lives. For example, video and music downloads, IPTV, gaming, and other on-line interactive applications are growing rapidly. Optical networks are being extended closer to the end user with FTTx networks, where fiber may terminate at the home, the premise, the curb, or the node. Mobile data traffic also is increasing as cell phones and other mobile devices continue to proliferate with increasingly sophisticated audio, photo, video, email and Internet capabilities. The resulting traffic, in turn, cascades through the network, including the core that depends on optical technology. JDSU is well-positioned to continue to benefit from these industry trends due to its leadership in the broadband test and measurement and optical networking markets.
In addition to communications, optical technologies are increasingly applied to solve complex problems in other industries. For example, our high-precision lasers enable the trend toward smaller integrated circuits for use in today’s compact consumer electronics, the classification and sorting of biological cells using induced fluorescence, and deoxyribonucleic acid (“DNA”) sequencing through the appropriate application of monochromatic light. Also, our optically variable pigment, holographic, and microtaggant technologies protect global brands, including medicines, electronics, and government documents, including currency and high security credentials against counterfeiting. Precision optical coatings are used for high performance applications in aerospace, entertainment and biomedical instrumentation.
Sales and Marketing
JDSU markets its products to telecommunications and cable television service providers, network equipment manufacturers, OEMs, distributors and strategic partners worldwide. Each business segment has a dedicated sales force that communicates directly with customers’ executive, technical, manufacturing and purchasing personnel as needed to determine design, performance, and cost requirements. In addition, all business segments are working to expand opportunities in emerging geographic markets and through alternate channels of distribution.
A high level of support is necessary to develop and maintain long-term relationships with our customers. JDSU engages the customer at the design-in phase and continues to build the relationship as customer needs change and develop. Service and support are provided through JDSU offices and those of its partners worldwide.
7
Table of Contents
Additional Information
JDSU was incorporated in California in 1979 and reincorporated in Delaware in 1993. JDSU is the product of several significant mergers and acquisitions including, among others, the combination of Uniphase Corporation and JDS FITEL in 1999, and the acquisition of Acterna, Inc. in 2005. Our strategy is to operate as a company comprised of a portfolio of business with a focus on optical and broadband innovation.
We are subject to the information requirements of the Securities Exchange Act of 1934, or the Exchange Act. Therefore, we file periodic reports, proxy statements and other information with the Securities and Exchange Commission (“SEC”). Such reports, proxy statements and other information may be obtained by visiting the Public Reference Room of the SEC at 100 F Street, NE, Washington, DC 20549 or by calling the SEC at 1-800-SEC-0330, by sending an electronic message to the SEC at publicinfo@sec.gov or by sending a fax to the SEC at 1-202-777-1027. In addition, the SEC maintains a website (www.sec.gov) that contains reports, proxy and information statements, and other information regarding issuers that file electronically with the SEC. We also post all SEC filings on our website at www.jdsu.com/investors as soon as reasonably practicable after they are electronically filed or furnished to the SEC.
Business Segments
During the second quarter of fiscal year 2009, JDSU changed the reporting structure to combine the former All Others, Commercial Lasers business segment with the Optical Communications business segment and formed a new business segment, Communications and Commercial Optical Products. As a result, there are three reportable segments, Communications Test and Measurement, Communications and Commercial Optical Products, and Advanced Optical Technologies, as of July 3, 2010. Each segment has its own engineering, manufacturing, sales, and marketing groups to better serve customers and respond quickly to the market needs. In addition, our business segments share common corporate services that provide capital, infrastructure, resources, and functional support, allowing them to focus on core technological strengths to compete and innovate in their markets.
Communications Test and Measurement
The Communications Test and Measurement business segment products and services enable the design, deployment, and maintenance of communication equipment and networks, as well as ensure the quality of services delivered to the end customer. These products and services provide solutions that help accelerate the deployment of new services and lower operating expenses while improving performance and reliability. Included in the product portfolio are test tools, platforms, solutions, and services for optical transport networks, DSL services, data networks, wireless test, cable networks, FTTx networks, digital video broadcast, and fiber characterization. JDSU also provides protocol test solutions for the development and field deployment of storage and storage-network technologies.
The May 1, 2010 acquisition of Network Solutions Division business from Agilent expands JDSU’s product and service offering with an end-to-end wireless test portfolio for lab, field services, and service assurance applications. These products and services include drive test, protocol analyzers and network diagnostics, and service assurance.
Market
JDSU provides instruments, service assurance systems and services for communications network operators and equipment manufacturers that deliver and/or operate broadband/IP networks (cable, fixed and mobile) deploying triple- and quad-play services (voice, video, data, and wireless). JDSU test solutions address the needs of lab and production, which includes research, development and manufacture of network equipment; field service for fixed and wireless networks, including triple-play deployments for cable, telecom, FTTx, and home
8
Table of Contents
networking; and service assurance, which includes monitoring and maintaining quality of experience (“QoE”) for Ethernet and IP services, including cable, wireless and fixed/telecom networks. JDSU also provides protocol test solutions for the development and field deployment of storage and storage-network technologies.
Customers
JDSU customers for communications test and measurement solutions include the world’s largest communications service providers, communications equipment manufacturers, government organizations, and large corporate customers. These include major telecom and cable operators such as AT&T, Bell Canada, British Telecom, China Telecom, Comcast, Deutsche Telecom, France Telecom, TalkTalk, Telefonica, Telmex, TimeWarner, Verizon and many others. JDSU test and measurement customers also include many of the network equipment manufacturers served by our communications and commercial optical products group, including Alcatel-Lucent, Ciena, Cisco Systems, Fujitsu, Huawei, and Motorola. JDSU test and measurement customers also include chip and infrastructure vendors, storage device manufacturers, storage network and switch vendors, and deployed private enterprise customers. Storage-segment customers include Brocade, Cisco Systems, EMC, Hewlett-Packard, and IBM.
Trends
As content providers in the communications industry are developing new business models to expand their distribution capabilities, they are increasingly adopting on-line channels for rich broadband content such as music, gaming, video programming, and movies. Telecommunications and cable service providers are, in turn, planning to increase their revenues and profitability by expanding the capabilities of their IP packet-based networks to increase their network capacity and to deliver sophisticated levels of quality of service required to meet the service requirements of the content providers and the consumers.
Telecommunications, cable television, satellite, and wireless service providers are competing with each other to offer content providers and consumers the ability to carry virtually any type of content via bundled services. With more applications and content available, potential benefits for service providers include increased average revenue per user (“ARPU”) and less customer turnover due to better service quality, thus increasing profitability and long-term competitive advantage. As a result, many providers are developing consolidated network architectures intended to enable a triple-play (integrated voice, data and video services) offering from a single provider rather than three separate services from three separate providers over three separate networks.
Growth in the number of worldwide mobile subscribers and expansion of bandwidth intensive mobile applications continues to drive significant network investment. As a result, mobile providers are upgrading the core fiber network, re-engineering backhaul of mobile traffic from cell towers, and rolling out next generation wireless access technologies including 3G and 4G/Long Term Evolution (“LTE”).
Additionally, the proliferation of new and higher bandwidth services, including video-based content such as news, movies, and gaming, is generating strong growth in demand for network capacity and bandwidth rates, which in turn drives demand for many types of networking, access and transport systems.
Increasing deployments of broadband access, the expansion of IP-based services, and the need to reduce deployment time and cost should result in demand for communications test and measurement instruments, systems, software, and services. These communications test and measurement solutions support the rapid deployment of new services, increase customer satisfaction by helping technicians complete installation and repair work quickly and correctly, and lower operating expenses by automating and improving network installation, maintenance, and management processes. Our broad portfolio of test and measurement solutions positions us well to benefit from these developments.
9
Table of Contents
Strategy
The JDSU Communications Test and Measurement business segment plans to improve profitability by providing communications test and management solutions that address the business challenges of network operators and communications equipment manufacturers. Its focus is to enable network operators to accelerate deployment of new services, improve service quality, reduce customer churn, and lower network operating expenses.
Competition
JDSU competes against various companies, including Agilent, Anritsu, Exfo, Spirent, Sunrise, and VeEX. While JDSU faces multiple competitors for each of its product families, it continues to have the broadest portfolio of wireline and wireless products and solutions available in the communications test and measurement industry.
Offerings
JDSU provides the industry’s most expansive set of communications-focused test and measurement solutions. This portfolio provides end-to-end test support across wireline and wireless communications networks, including the core, metro, access, and home networking environments. JDSU is a leader in the test and measurement market and has an installed base of hundreds of thousands of test instruments and systems deployed in communications networks around the world. Our test and measurement product portfolio includes:
Instruments
JDSU provides devices that perform various communications test and monitoring functions. Designed to be mobile, these products assist service provider technicians in assessing the performance of network elements and segments or verifying the integrity of the information being transmitted across the network. These instruments incorporate high levels of intelligence and have user interfaces that are designed to simplify operation and minimize training. JDSU test instruments also include those used by network equipment manufacturers (“NEMs”) in the design and manufacture of next-generation network equipment. Thorough testing by NEMs plays a critical role in producing the components and equipment that are the building blocks of network infrastructure.
Software
JDSU provides software products and custom software development services to its customers. Software products address applications for network capacity management, test operations support systems and workflow solutions. Software services are provided to customize software applications and to interface JDSU software to customer operations support systems.
Solutions
JDSU solutions typically consist of integrated hardware and software components that reside in communication networks, such as service assurance solutions. Using an integrated test and management system, JDSU customers are able to analyze a variety of network elements, transmission technologies and protocols from a single console, simplifying the process of deploying, provisioning and managing network equipment and services. From a centralized location, technicians can access the test systems within the network and perform simultaneous test and monitoring functions on one or more elements, either manually or automatically. These capabilities allow network operators to initiate service to new customers faster, decrease the need for technicians to make on-site service calls, help to make necessary repairs faster and, as a result, provide higher quality and more reliable services.
10
Table of Contents
Services
JDSU offers a range of product support and professional services geared to comprehensively address its customers’ requirements. These services include repair, calibration, software support services and technical assistance for its products. JDSU also offers product and technology training as well as consulting services. JDSU professional services, provided in conjunction with system integration projects, include project management installation and implementation.
Communications and Commercial Optical Products
The Communications and Commercial Optical Products (“CCOP”) business segment provides optical communications products used by network equipment manufacturers for telecommunications and enterprise data communications. These products enable the transmission and transport of video, audio and text data over high-capacity fiber optic cables. Transmission products primarily consist of optical transceivers, optical transponders, and their supporting components such as modulators and source lasers, including innovative products such as vertical-cavity surface-emitting lasers (VCSELs). Transport products primarily consist of amplifiers and reconfigurable optical add/drop multiplexers (ROADMs) and their supporting components such as pump lasers, passive devices, and array waveguides (AWGs). In fact, today’s most advanced optical networks are built on our transport and transmission components, modules and subsystems.
This business segment also provides lasers employed in a wide variety of OEM applications. JDSU laser products serve customers in markets and applications such as biotechnology, graphics and imaging, remote sensing, and materials processing and precision machining such as micro via drilling in printed circuit boards, wafer singulation, and solar cell scribing. These products include diode, direct-diode, diode-pumped solid-state, fiber, and gas lasers.
In addition, our photovoltaics (PV) products include concentrated photovoltaic (CPV) cells and receivers for generating energy from sunlight, as well as fiber optic-based systems for delivering and measuring electrical power.
Market
The CCOP business segment participates in the optical communications, laser, and photovoltaic markets.
JDSU optical communications products include a wide range of components, modules, and subsystems to support and maintain customers in our two market segments: telecommunications, including carrier networks for access (local), metro (intracity), long-haul (city-to-city and worldwide), and submarine (undersea) networks; and enterprise data communications, including storage access networks (SANs), local area networks (LANs), and Ethernet wide-area networks (WANs).
The JDSU portfolio of laser products includes components and subsystems used in a wide variety of original equipment manufacturer (OEM) applications that range in output power from milliwatts to kilowatts and include ultraviolet (UV), visible, and infrared (IR) wavelengths. JDSU supports customers for applications such as biotechnology, graphics and imaging, remote sensing, materials processing and other precision machining.
The photovoltaic business unit provides photonic power for a range of remote sensing applications, including to the electric power industry for measuring power transmission. It is also applying its technology to develop high efficiency concentrated photovoltaic cells for the generation of electric power from solar radiation.
Customers
CCOP serves optical communications equipment manufacturers such as Alcatel-Lucent, Ciena, Cisco Systems, Ericsson, Fujitsu, Hewlett-Packard, Huawei, IBM, Nokia Siemens Networks, and Tellabs, and OEM
11
Table of Contents
laser customers such as ASML, Beckman Coulter, Becton Dickinson, Disco, Electro Scientific Industries, and Han’s Laser. Customers for Photovoltaic Products include Amplifier Research, ETS-Lindgren, Nanjing Xinning Optoelectronics Automation, Siemens and SolFocus.
Trends
The business cycle notwithstanding, long term trends suggest growing opportunity for CCOP. These trends are discussed, by market, below:
Optical Communications: To remain competitive, network operators worldwide must offer broader suites of digital services. To do this, they are migrating to Internet protocol (IP) networks, which effectively deliver triple-play services while lowering capital and operating costs of DWDM (dense wavelength division multiplexing) networks. In data communications, demand for broadband is driven by the growing needs of intracompany LAN and intercompany WAN networks. The growing demand for capacity encourages the adoption of optical communications products across the telecom sector, including long-haul, metro (core and access), cable television (CATV), submarine, and FTTx networks, where fiber may terminate at the home, the premise, the curb, or the node. It also increases demand for optical products in the storage and enterprise sectors, including LAN, SAN and WAN.
New, bandwidth-intensive applications can result in sudden and severe changes in demand–essentially anywhere on the network. Increasing agility in optical networks by employing ROADMs, tunable transponders, and other agile optical products, provides an effective way to respond to unpredictable bandwidth demands and manage expenses. With more agile optical networks, a service provider can add capacity by using remote management applications rather than by dispatching technicians to perform manual operations in the field.
In addition, the high-end routers, switches, and cross-connect equipment that must handle legacy and IP traffic, are becoming increasingly complex in order to meet higher bandwidth, scalability, speed, and reliability needs. Products must provide higher levels of functionality and performance in compact designs that must also meet requirements for emissions, cost, and reduced power consumption.
Deployment of fiber closer to the end user increases the availability of high-bandwidth services and should result in increased demand on the metro and long-haul networks into which these services feed. The dynamically reconfigurable nature of today’s agile networks enables lower operating costs and other competitive advantages, allowing service providers to more flexibly use and scale network capacity, streamline service provisioning, accelerate rerouting around points of failure, and modify network topology through simple point-and-click network management systems.
JDSU is a leading provider of the optical products mentioned above to support the trends in this market. JDSU innovation, particularly in the area of photonic integrated circuits, which can replace many discrete components with a single photonic chip, is resulting in products that have more functionality, are smaller, require less power, and are more cost-effective. For example, the tunable XFP transceiver is 85% smaller than previous tunable models. Higher levels of integration have also led to development of the Super Transport Blade, which delivers all transport functions in a single, integrated platform, essentially replacing three blades with one.
JDSU, with its innovative optical communications and flexible, cost-effective transport portfolio, is positioned to be the supplier of choice for next-generation networks.
Lasers: As technology advances, high-tech and other vital industries increasingly turn to lasers when they need more precision, higher productivity, energy efficient or “green” alternatives for problems that can not be solved by mechanical, electronic or other means. For example, lasers have been used for years to help achieve the scale and precision needed in semiconductor processing. In biotech applications, lasers have been instrumental for advances (and new standard procedures) in cytology, hematology, genome sequencing, and crime scene investigations, among others. The long term trends in these industries should lead to increased demand for lasers.
12
Table of Contents
In addition, demand continues for electronic products, as well as products and components in other industries, to offer greater functionality while becoming smaller, lighter, and less expensive. Product designs that achieve this are requiring precise micromachining and materials processing, such as micro bending, soldering and welding–especially for plastics. At the scale and processing speed needed, lasers are replacing mature mechanical tools such as drills for tiny holes or “vias” in printed circuit boards and saws and scribes for singulating silicon wafers, resulting in greater precision and productivity. As these trends continue, we believe that manufacturers and industries will increase their reliance on lasers in order to maintain or increase their competitiveness.
There is an increasing trend toward energy efficiency and “green” industry. Industries are using lasers to develop products that are smaller and lighter, and increase productivity and yield, thereby lowering their energy consumption. More directly, this trend has provided for significant growth in the solar power market segment and applications for lasers used in the production of solar panels.
JDSU is well-positioned with key OEM providers of laser solutions to these industries. We continue to develop our laser portfolio to offer smaller and more cost-effective products designed specifically for the performance, integration, reliability and support needs of our OEM customers.
Photonic Power and Photovoltaics: The trend toward lighter, cleaner, efficient solutions has lead to opportunities for photonics in a variety of applications. The use of photonic power for remote sensors solves the problem of electromagnetic interference (“EMI”), radio frequency (“RF”) and other interference associated with the use of electrical power. The need for clean energy is fueling a strong increase in demand for concentrated photovoltaic power. JDSU proprietary technology already in use for powering remote sensors has led to high efficiency products applicable to electric power generation from solar energy.
Strategy
JDSU delivers value to its customers though innovation, partnership and vision.
In optical communications we are focused on technology leadership, cost leadership, and functional integration. We will continue to align the latest technologies with world-class, scalable manufacturing and operations to drive the next phase of optical communications with highly integrated technologies that are faster, more agile, and more reliable, making us a valuable business and technology partner for NEMs.
In the laser markets, JDSU works to establish long-term business partnerships with its OEM customers. Leveraging established manufacturing, engineering, telecommunications, and photonics expertise, JDSU delivers products that meet cost-of-ownership and reliability needs while delivering on volume production demands.
And in Photonic Power and Photovoltaics, JDSU is developing best-in-class performance technology applicable to the nascent, fast-growing solar power market.
Competition
JDSU competes against numerous public and private companies in its CCOP markets. A partial list of public company competitors providing optical communications includes Oclaro, Finisar, Fujitsu, Furukawa Electric, Opnext, Oplink Communications, and Sumitomo Electric. JDSU competitors in the laser market include Coherent, IPG Photonics, Rofin-Sinar, CVI-Melles, and the Spectra-Physics division of Newport Corporation. JDSU competes against Spectrolab and Emcore in the photovoltaic market.
In addition to these established companies, JDSU faces significant and focused competition from other companies and emerging startups. While each of its product families has multiple competitors, JDSU has a broad range of products and leading technologies that are aligned with industry trends and the needs of its customers.
13
Table of Contents
Offerings
CCOP serves the optical communications, laser, and photovoltaic markets.
Optical Communications
JDSU optical communications offerings address two market segments—telecommunications and enterprise data communications. In addition to a full selection of active and passive components, JDSU offers increasing levels of functionality and integration in modules, circuit packs, and subsystems for transmission, amplification, wavelength management, and more. Our optical communications product offerings include:
In the telecommunications market segment, we offer transmission and transport solutions for the synchronous optical network (“SONET”), synchronous digital hierarchy (“SDH”) and wavelength division multiplexer (“WDM”) applications. Transmission products transmit and receive signals, such as our tunable transponder, transceiver, and transmitter modules. JDSU also offers transmission components for the previously mentioned products, which include active components like our tunable lasers, detectors/receivers, and modulators.
JDSU transport products provide switching, routing and conditioning of signals such as our ROADMs and optical amplifiers. We also provide components for transport, including passive components such as our attenuators, circulators, couplers/splitters/WDMs, gain flattening filters, hybrid interleavers, multiplexer/demultiplexers polarization components, switches, and wavelength lockers.
Industry-leading innovation led to the Super Transport Blade, which integrates all major optical transport functions (wavelength switching, preamplification, postamplification, and monitoring) into a single-slot blade. This all-in-one solution reduces the size, cost, and power requirements of optical components, incorporates nano wavelength selective switch (WSS) technology, and enables greater chassis density and smaller footprint.
In the enterprise data communications market segment, which relies on storing and moving vast amounts of data, JDSU offers transmission products, such as our optical transceivers for Fibre Channel and Gigabit Ethernet applications. JDSU transceivers are also used in Ethernet connections for servers, routers, hubs, and switches for Internet and e-mail services.
JDSU integrated fiber optic transceivers provide a high-speed, serial electrical interface for connecting processors, switches, and peripherals. They are available in hot-pluggable or pin-through-hole versions with a small footprint for use in compact system designs. This allows manufacturers to double the density of transceivers on a board compared to conventional designs
For higher data transfer rates of 40 and 100G, JDSU offers vertical-cavity surface-emitting lasers (VCSELs). VCSELs reduce power consumption, heat, electromagnetic interference (EMI), and cost while increasing speed, reliability, and link distance. Our compact arrays offer an innovative solution for the LANs, SANs, broadband Internet, and metro-area network applications that currently depend on high-end routers, switches, and cross-connect equipment to handle legacy and IP traffic.
Lasers
Our broad range of products includes diode-pumped solid-state, fiber, diode, direct-diode, and gas lasers such as argon-ion and helium-neon (HeNe) lasers:
Diode-pumped solid-state and fiber lasers that provide excellent beam quality, low noise, and exceptional reliability are used in biotechnology, graphics and imaging, remote sensing, materials processing, and precision machining applications.
14
Table of Contents
Diode and direct-diode lasers address a wide variety of applications, including laser pumping, thermal exposure, illumination, ophthalmology, image recording, printing, plastic welding, and selective soldering.
Gas lasers such as argon-ion and helium-neon lasers provide a stable, low-cost and reliable solution over a wide range of operating conditions, making them well suited for complex, high-resolution OEM applications such as flow cytometry, DNA sequencing, graphics and imaging, and semiconductor inspection.
Photonic power and photovoltaics
Photonic power is an innovative power-over-fiber delivery system that converts optical power to electrical power. Since it is delivered over nonconducting fiber optic cable, it is not affected by RF or EMI, is lighter, generates less heat, is spark-free, and can be used to drive sensors, gauges, actuators, low-power communications devices, and other electronic devices.
JDSU capabilities in converting optical power to electrical power are now being applied to the solar energy market. Multijunction concentrated photovoltaic (CPV) cells generate power under concentrated sunlight. JDSU has developed CPV cells to be available both as chips and in receiver assemblies, for generating solar power.
Advanced Optical Technologies
The Advanced Optical Technologies (“AOT”) business segment leverages its core technology strengths of optics and materials science to manage light and color effects. With decades of experience in optical coating and holographic technology, AOT develops innovative solutions that meet the needs of a variety of markets—from counterfeit protection to space exploration.
Market
Our AOT segment spans several markets. Its multilayer product security technologies provide overt and covert product verification for protection against diversion, brand erosion, and lost revenue due to counterfeiting. These technologies safeguard high security government documents as well as brands in the transaction card, pharmaceutical, consumer electronics, printing/imaging supplies, and fast-moving consumer good industries through innovative optically variable pigment, holographic, and microtaggant technologies.
AOT also produces precise, high-performance, optical thin-film coatings for a variety of applications in government and aerospace, biomedical, consumer electronics, telecommunications, office automation, and other markets. These applications include night-vision goggles, satellite solar covers, medical instrumentation, optical communications components, fax machines, computer-driven projectors, 3D cinema and event lighting.
In addition, we offer custom color solutions for product finishes and decorative packaging that can be applied to a wide variety of substrates. These include innovative optically-based color-shifting and other solutions that provide product enhancement for brands in the pharmaceutical, automotive, consumer electronics, sports apparel, and fast-moving consumer goods industries.
Customers
The AOT business segment serves customers such as Dolby, Kingston, Lockheed Martin, Northrup Grumman, Pan Pacific, and SICPA. JDSU technology is used to protect the currencies of China, the European Union, the United States, and other governments around the world. Leading pharmaceutical companies worldwide also use JDSU solutions to protect their brands, as do major issuers of transaction cards. JDSU custom color product differentiation and brand enhancement solutions are used by customers such as DuPont.
15
Table of Contents
Trends
Product integrity is a worldwide, multibillion dollar issue that poses consumer health and safety risks, corporate liability, devaluation of brand image, weakening of brand loyalty, and lost revenues. Favored targets include pharmaceuticals, imaging supplies, apparel, automotive parts, consumer electronics, and electronic media. Other issues, such as product diversion, where distributors divert products intended for lower-priced markets to higher-priced markets, increasingly require brand protection. The spread of counterfeiting can be attributed to using the Internet to facilitate distribution, a ready availability of low-cost, high-quality printing equipment to reproduce product packaging, the elimination of international trade barriers, and an increasingly mobile global society.
JDSU technology has become a worldwide standard for currency protection. Meanwhile, the need to protect high-value documents and offer solutions for authenticating personal, identification, and financial documents is also growing. Our authentication products can be combined to offer multilayer solutions for creating effective security programs that combine secure authentication, flexible aesthetics, and ease of application.
Demand for optical solutions to solve complex problems extends to the aerospace, defense and medical/environmental instrumentation markets, which require customized, high-precision coated products and optical components that selectively absorb, transmit or reflect light to meet the performance requirements of sophisticated systems. Our custom optics products offer an array advanced technologies and precision optics—from the ultraviolet to the far infrared portion of the light spectrum. Most products are custom optical filters, on either a simple or complex irregular shape, that require from one to several hundred layers to create the coating.
Another challenge is the need to differentiate products in order to build brands. Global competition and an increasing range of product offerings are driving designers to look for innovative ways to increase the aesthetic value of their products and make them stand out. Our custom color solutions are used in coatings and packaging to create unique and striking visual effects.
Strategy
The AOT business segment develops technologies that differentiate and effectively protect valuable brands via a secure, flexible, aesthetically striking optical platform. It also strives to supply the highest-quality, best-in-class optical components and assemblies with innovative thin-film coating processes that help customers protect and/or differentiate their products. JDSU will continue to leverage its intellectual property and leading expertise in optics, light management and material technology to develop solutions that provide a unique advantage to customers.
Competition
In these markets, JDSU faces competition from providers of special-effect pigments, like Merck KGA, from manufacturers of security holograms including Kurz, De La Rue and OpSec; from Japanese coating companies such as Nidek, Toppan, and Toray; from display-component companies such as Asahi, Fuji Photo-Optical, Nikon, and Nitto Optical; and from optics companies such as Barr Associates and Deposition Sciences.
Offerings
AOT consists of the Authentication Solutions Group (“ASG”), which has offerings for brand protection and document authentication; the Custom Optics Product Group (“COPG”), which offers optical thin-film coatings for a range of markets; and the Flex Products Group, which offers custom color solutions, currency protection, printing services, as well as solar window films.
16
Table of Contents
Brand Protection
To strengthen brand integrity, many corporate brand owners are introducing overt protective measures in packaging that provides consumers and/or inspection personnel with the ability to quickly determine product authenticity by visually detecting a color effect on the package. Covert solutions provide an additional layer of protection that cannot be seen or detected without a visual aid.
JDSU offers both overt and covert solutions for security, including SecureShift® light interference technology (which allows inks or plastics to exhibit different colors and visual effects from different viewing angles), holographic technology, and Charms™ microstructured taggants. Applications include transaction cards, pharmaceuticals, imaging supplies, electronics, computer, and other consumer goods. JDSU offers these solutions in a wide range of choices by incorporating them into printing inks, product labels, and product packaging.
Document authentication
JDSU optically variable pigment (“OVP®” ) technology, which produces color-shifting and other optical effects, and our holographic technologies, are used to combat forgery and counterfeiting, protect against alteration of data, and allows for immediate authentication of high-value documents. JDSU works closely with its customers to design these solutions to meet their specific needs for passports, personal identification, and other government and secure documents.
Custom Optics
Optical thin-film coatings are submicroscopic (nanometer to micrometer) layers of materials, such as silicon and magnesium fluoride, that are applied to the surface of a substrate, including glass, plastic or metal. Thin-film coatings control the behavior of light to produce effects such as reflection, refraction, absorption, abrasion resistance, antiglare, oxygen and/or moisture transmission, and electrical conductivity for a variety of applications:
Aerospace and defense: JDSU provides customized optics for solar cell coverglass, thermal control mirror technology, and optical sensors for aerospace applications. JDSU thin-film optics products can be found on spacecraft and satellites. In addition, JDSU supplies filters used in military applications such as infrared night vision goggles and electronic countermeasures.
Consumer and commercial electronics: JDSU manufactures and sells coated optics for use in home and business display systems and 3D entertainment systems. These products include bandpass filters, mirrors, polarization compensators, heater panels and other coated optics, and assemblies. Products for the automation market include photo receptors and mirrors for photocopiers, scanners, computer-driven projectors, and facsimile machines.
Instrumentation and lighting: JDSU provides multicavity and linear variable optical filters on a variety of substrates for applications including gas monitoring and analysis, thermal imaging, smart munitions, fire detection, spectroscopy, and pollution monitoring. These filters are also used in biomedical applications, semiconductor test systems, and test and measurement equipment. JDSU also provides advanced optical filters used to create dramatic lighting effects and rich, saturated color in intelligent lighting systems for entertainment and architectural lighting.
Custom Color Solutions
For product differentiation and brand enhancement, JDSU provides custom color solutions for a variety of applications using our ChromaFlair® and SpectraFlair® pigments to create color effects that emphasize body contours, create dynamic environments, or enhance products in motion. These pigments are added to paints, plastics, or textiles for products and packaging.
17
Table of Contents
Our line of custom color products uses proprietary manufacturing processes and light interference or diffractive technology to provide specific color characteristics that can be designed to meet the needs of individual products, brands or markets. The products create a durable finish with striking color properties for automotive, consumer electronics, and other applications.
The design process is critical to delivering custom color solutions that meet the needs of specific customers, markets and brands. JDSU color specialists, Color Lab, and prototyping capabilities help customers overcome color design challenges during the design stage.
Currency Protection
Our OVP technology for overt security technology has become a standard used by governments worldwide for currency protection. OVP provides a color-shifting effect that enables positive, easy visual verification and deters counterfeiting.
Printing Services
Proprietary printing processes and a cGMP-compliant environment deliver solutions for labels, closures, hang tags, and flexible packaging for authentication and custom color solutions. In addition, JDSU provides high quality flexographic and gravure printing for labels for retail and apparel, healthcare, food and beverage, automotive, consumer goods and personal care.
Corporate Strategy
Our objective is to continue to be a leading provider for all markets and industries we serve. In support of our business segments, we are pursuing a corporate strategy that we believe will best position us for future opportunities. The key elements of our corporate strategy include:
| • | Enabling our customers’ innovation in broadband and optical markets |
We remain committed to working closely with our customers from initial product design and manufacturing through to solution deployment and training. We strive to engage with our customers at the early stages of development to provide them with the most innovative and timely products and services and ensure our technology direction is aligned with their emerging requirements. Our sales, customer support, product marketing, and development efforts are organized to maximize effectiveness in our customer interactions.
| • | Continue to strengthen our balance sheet |
JDSU will take continued actions that will strengthen our balance sheet and provide financial support for market leadership and business expansion efforts. Fundamental to this strategy has been our ability to continue to generate positive cash flow through improved profitability, reduced inventory levels and reduced days sales outstanding (“DSOs”). These and other actions, such as focusing on businesses that meet our success criteria, and exiting others, will keep JDSU financially strong.
| • | Build a lean and scalable business |
We remain committed to streamlining our manufacturing operations and reducing costs by using contract manufacturers where appropriate and consolidating to reduce our footprint and total fixed costs. As a result, we are moving from a fixed cost model to a variable one that is efficient, highly scalable, and capable of consistently meeting our customers’ quality and performance requirements. In addition, our shared corporate functions model cost-effectively provides our business segments with the centralized strength and depth of a larger company, while allowing each segment to remain focused and responsive to its own market needs.
18
Table of Contents
| • | Invest in profitable, market-based innovation |
Based on current and anticipated demand, we will continue to invest in R&D and through acquisitions and partnerships in new technologies, products and services that offer our customers increased efficiency, higher performance, improved functionality, and/or higher levels of integration. In fiscal 2010, we continued to invest in product development in line with our profitability and growth objectives. The acquisition of the Storage Network Tools business from Finisar in fiscal 2010 establishes JDSU as the worldwide leader in storage area network (SAN) protocol test tools, software, and services. In addition, the acquisition of the Network Solutions Division business from Agilent in fiscal 2010 enables JDSU to offer the market’s only end-to-end wireless test portfolio and leading position for network verification and deployment of LTE/4G technologies to support increased bandwidth demand for mobile users.
| • | Expand our global market presence |
Long term, we expect higher rates of growth internationally than we do domestically, with the highest rates of growth in our Asia/Pacific, Latin America, and Eastern Europe regions. Therefore, we are developing products, sales, marketing and customer support to meet the specific needs in these regions in order to serve these customers better.
Although we expect to successfully implement our strategy, internal and/or external factors could impact our ability to meet any, or all, of our objectives. Some of these factors are discussed under “Risk Factors.”
Acquisitions
As part of our strategy, we are committed to the ongoing evaluation of strategic opportunities and, where appropriate, the acquisition of additional products, technologies or businesses that are complementary to, or broaden the markets for our products. We believe we have strengthened our business model by expanding our addressable market, customer base, and expertise, diversifying our product portfolio, and fortifying our core businesses through acquisition as well as through organic initiatives.
In May 2010, we completed the acquisition of the Network Solutions Division (“NSD”) of Agilent Technologies, Inc. (“Agilent”), where we acquired certain assets and assumed certain liabilities of NSD, for a total purchase price consideration of approximately $163.8 million.
In July 2009, we completed the acquisition of the Storage Network Tools business (“SNT”) of Finisar Corporation. Under the terms of the agreement, we acquired SNT for approximately $40.7 million.
In February 2008, we completed the acquisition of American Bank Note Holographics Inc. (“ABNH”), a public company. ABNH is a market leader in the origination, production and marketing of holograms for security applications and the leading supplier of optical security devices for the transaction card market and is included in our Advanced Optical Technologies segment.
In January 2008, we completed the acquisition of certain assets of the fiber optics division of Westover Scientific Inc. (“Westover”). Westover is a leading provider of fiber optic inspection and cleaning solutions, which complements our existing fiber field and lab and production test portfolio and is included in our Communications Test and Measurement segment.
Please refer to “Note 4. Mergers and Acquisitions” of Notes to Consolidated Financial Statements under Item 8 of this Annual Report on Form 10-K for further discussion of the acquisitions completed during fiscal 2010, 2009 and 2008.
19
Table of Contents
Restructuring Programs and Divestitures
Since fiscal 2006, we have significantly consolidated the manufacturing of our products based on core competencies, cost efficiency, and alternative manufacturers, where appropriate. Among other things, we continue to strengthen our partnerships with contract manufacturers. We completed the process of centralizing in–house manufacturing from North America primarily pertaining to the CCOP segment product lines to a third party owned lower-cost facility in Shenzhen, China during fiscal 2009. With regard to the Lasers business, we completed the transition to a lower cost contract manufacturer in fiscal 2010. During fiscal 2009 and 2010, we also restructured and reorganized our Communications Test and Measurement segment to improve the efficiency of the research and development organization by reducing/rationalizing headcount, moving significant work to less expensive offshore contractors, and consolidating and centralizing similar functions to fewer sites designed to improve leverage. Additionally, we continue to centralize many administrative functions such as information technology, human resources, and finance to take advantage of common processes and controls, and economies of scale.
We may not be successful in our manufacturing strategy, and there are many risks to be addressed as described in the “Risk Factors” section.
Please refer to Management’s Discussion and Analysis of Financial Condition and Results of Operations under Item 7 and the Notes to the Consolidated Financial Statements under Item 8 of this Annual Report on Form 10-K for further discussion on these charges.
Research and Development
During fiscal 2010, 2009, and 2008, we incurred research and development expenses of $174.9 million, $167.1 million, and $184.3 million, respectively. The number of employees engaged in research and development was approximately 1,400 as of July 3, 2010, 900 as of June 27, 2009, and 1,100 as of June 28, 2008.
We devote substantial resources to research and development to develop new and enhanced products to serve our markets. Once the design of a product is complete, our engineering efforts shift to enhancing both the performance of that product and our ability to manufacture it in volume and at lower cost.
In our Communications Test and Measurement segment, the addressable markets include portable instruments for telcom, cable, and wireless Field Service personnel, systems and software used in Operations Centers, and instruments used in the design and production of network equipment deployed in telcom, cable, and wireless networks. We have increased our focus on test and monitoring for wireless applications, IP-based service delivery, and service assurance to address the required changes in network architecture as they relate to our target market. At the same time, we maintain our capability to continue to serve all major network architectures and protocols.
In our Communications and Commercial Optical Products segment, we are increasing our focus on the most promising markets while maintaining our capability to provide products throughout the network. We are increasing our emphasis on the next generation Agile Optical Networks (“AON”) components and modules, such as ROADMs and tunable devices needed for long-haul, metro, access, local area network, storage area network, and enterprise markets. We are also responding to our customers’ requests for higher levels of integration, including the integration of optics, electronics and software in our modules, subsystems, and circuit packs. We are providing optical technology for gesture recognition systems that enable the control of technology by natural body gestures instead of using a remote, mouse, or other device. Emerging gesture recognition systems simplify the way that people interact with technology, and are initially being used in applications for home entertainment and computing. In addition, our Communications and Commercial Optical Products and Advanced Optical Technologies segments have been working together to develop concentrated photovoltaic cells for the solar market aimed at large commercial and utility scale installations. We continue to develop new product offerings in
20
Table of Contents
both solid state and fiber lasers that take advantage of technologies and components developed within our Communications and Commercial Optical Products segment. All these developments are targeted to serve customers engaging in biotechnology, graphics and imaging, remote sensing, and materials processing and precision micromachining markets.
In our Advanced Optical Technologies segment, our research and development efforts concentrate on developing more innovative solutions for our markets. We are advancing our 3D technology development efforts for both cinema and home entertainment. The team is also responding to customer demand in burgeoning gesture recognition markets. Our Advanced Optical Technology segment continues to advance light interference micro-flakes, color separation and birefringent filters, holographic images, components and assemblies for optical systems.
Manufacturing
As of July 3, 2010 our major manufacturing facilities were located in the United States, China, France, and Germany. Additionally, our significant contract manufacturing partners were located in China, Mexico, Singapore and Thailand.
Sources and Availability of Raw Materials
JDSU uses various suppliers and contract manufacturers to supply parts and components for the manufacture and support of multiple product lines. Although our intention is to establish at least two sources of supply for materials whenever possible, for some certain components we do have sole or limited source supply arrangements. We may not be able to procure these components from alternative sources at acceptable prices within reasonable time; therefore the loss or interruption of such arrangements could have an impact on our ability to deliver certain products on a timely basis.
JDSU will continue initiatives to reduce cost and risk of production interruptions and shortages of components by: (1) selecting and qualifying alternative sources of supplies for key components whenever possible, and (2) maintaining an appropriate safety stock of key components.
Patents and Proprietary Rights
Intellectual property rights that apply to our various products include patents, trade secrets, and trademarks. We do not intend to broadly license our intellectual property rights unless we can obtain adequate consideration or enter into acceptable patent cross-license agreements. As of July 3, 2010, we owned 1,512 U.S. patents and 525 foreign patents, and we are processing over a thousand pending applications throughout the world.
Backlog
Backlog consists of purchase orders for products for which we have assigned shipment dates within the following 12 months. As of July 3, 2010 our back log was approximately $457 million as compared to $220 million at June 27, 2009. Because of possible changes in product delivery schedules and cancellation of product orders and because our sales often reflect orders shipped in the same quarter in which they are received, our backlog at any particular date is not necessarily indicative of actual revenue or the level of orders for any succeeding period.
Employees
We employed approximately 4,700 employees as of July 3, 2010, as compared to approximately 4,000 and 6,800 as of June 27, 2009 and June 28, 2008, respectively. Our workforce as of July 3, 2010 included approximately 1,700 employees in manufacturing, 1,400 employees in research and development, 500 employees
21
Table of Contents
in general and administrative functions, and 1,100 employees in sales and marketing. The increase in our workforce was primarily due to the acquisition of the Network Solutions Division of Agilent Technologies, Inc. in fiscal 2010, refer to “Note 4. Mergers and Acquisitions” for further details.
We consider our employee relations generally to be good. Similar to other technology companies, particularly those in Silicon Valley, we rely upon our ability to use stock options, Full Value Awards, and other forms of stock-based compensation as key components of our executive and employee compensation structure. “Full Value Awards” refer to Restricted Stock, Restricted Stock Units, Performance Units and Performance Shares that are granted with the exercise price equal to zero and are converted to shares immediately upon vesting. Historically, these components have been critical to our ability to retain important personnel and offer competitive compensation packages. Without these components, we would be required to significantly increase cash compensation levels (or develop alternative compensation structures) to retain our key employees.
We incurred net losses of $61.8 million, $909.5 million, and $40.3 million in fiscal years 2010, 2009 and 2008, respectively. As a portfolio company, comprised of many product lines, with diverse operating metrics and markets, our profit performance in a particular period is generally a function of both revenue and product mix factors. For example, our product portfolio has a broad gross margin range. Moreover, the profit contribution of each of our business segments currently varies materially. Additionally, for the last several years, we have undergone multiple manufacturing, facility, organizational and product line transitions. We expect some of these activities to continue for the foreseeable future. These activities are costly and impair our profitability objectives while ongoing. Specific factors that may undermine our financial objectives include, among others:
| • | uncertain future telecom carrier and cable operator capital and R&D spending levels, which particularly affects our Communications and Commercial Optical Products and Communications Test and Measurement segments; |
| • | adverse changes to our product mix, both fundamentally (resulting from new product transitions, the declining profitability of certain legacy products and the termination of certain formerly higher margin products, among other things) and due to quarterly demand fluctuations; |
| • | intense pricing pressure across our product lines (due to competitive forces, increasingly from Asia, and to a highly concentrated customer base for many of our product lines), which continues to offset many of the cost improvements we are realizing quarter over quarter; |
| • | availability and cost of components for our products, particularly in our Communications and Commercial Optical Products segment; |
| • | increasing commoditization of previously differentiated products, and the attendant negative effect on average selling prices and profit margins, particularly in our Communications and Commercial Optical Products segment; |
| • | execution challenges, which limit revenue opportunities and harm profitability, market opportunities and customer relations; |
| • | revenue declines associated, periodically, with terminated or divested product lines; |
| • | redundant costs related to periodic transitioning of manufacturing to low cost locations; |
| • | ongoing costs associated with organizational transitions, consolidations and restructurings, which are expected to continue in the nearer term; |
| • | continuing high levels of selling, general and administrative, (“SG&A”) expenses; and |
| • | seasonal fluctuations in revenue from our Communications Test and Measurement segment, which is the largest of our business segments. |
22
Table of Contents
Taken together, these factors limit our ability to predict future profitability levels and to achieve our long-term profitability objectives. While some of these factors may diminish over time as we improve our cost structure and focus on enhancing our product mix, several factors, such as continuous pricing pressure, increasing Asia-based competition, increasing commoditization of previously-differentiated products, a highly concentrated customer base for many of our product lines and seasonal Communications Test and Measurement segment revenue fluctuations, are likely to remain endemic to our businesses. If we fail to achieve profitability expectations, the price of our debt and equity securities, as well as our business and financial condition, may be adversely impacted.
Our operating results may be adversely affected by unfavorable economic and market conditions.
Economic conditions worldwide have from time to time contributed to slowdowns in the technology industry at large, as well as to the specific segments and markets in which we operate. When combined with ongoing customer consolidation activity and periodic manufacturing and inventory initiatives, the current worldwide economic downturn, including but not limited to the effects of deteriorating credit markets, could lead to reduced demand from our customers and increased price competition for our products, increased risk of excess and obsolete inventories and higher overhead costs as a percentage of revenue. The worldwide economic downturn may further negatively impact our operations by affecting the solvency of our customers, the solvency of our key suppliers or the ability of our customers to obtain credit to finance purchases of our products. If the global economy and credit markets deteriorate and our future sales decline, our financial condition and results of operations could be adversely impacted.
In addition, we have significant intangible assets and long-lived assets recorded on our balance sheet. We will continue to evaluate the recoverability of the carrying amount of our goodwill and intangible assets on an ongoing basis, and we may incur substantial impairment charges, which would adversely affect our financial results. There can be no assurance that the outcome of such reviews in the future will not result in substantial impairment charges. Impairment assessment inherently involves judgment as to assumptions about expected future cash flows and the impact of market conditions on those assumptions. Future events and changing market conditions may impact our assumptions as to prices, costs, holding periods or other factors that may result in changes in our estimates of future cash flows. Although we believe the assumptions we used in testing for impairment are reasonable, significant changes in any one of our assumptions could produce a significantly different result. If, in any period, our stock price decreases to the point where the fair value of the Company, as determined by our market capitalization, is less than our book value, this too could indicate a potential impairment and we may be required to record an impairment charge in that period.
We have continuing concerns regarding the manufacture, quality and distribution of our products. These concerns are heightened with new product offerings and when overall demand increases.
Our success depends upon our ability to deliver both our current product offerings and new products and technologies on time and at acceptable cost to our customers. The markets for our products are characterized by rapid technological change, frequent new product introductions, substantial capital investment, changes in customer requirements and evolving industry. Our future performance will depend on the successful development, introduction and market acceptance of new and enhanced products that address these changes as well as current and potential customer requirements. As a technology company, we also constantly encounter quality, volume and cost concerns. The following factors are potential contributors to our concerns:
| • | our continuing cost reduction programs, which include site and organization consolidations, asset divestitures, product transfers to contract manufacturers and employee reductions, require the re-establishment and re-qualification by our customers of complex manufacturing lines, as well as modifications to systems, planning and operational infrastructure. During this process, we have experienced, and continue to experience additional costs, delays in re-establishing volume production levels, planning difficulties, inventory issues, factory absorption concerns, and systems integration problems; |
23
Table of Contents
| • | increases in demand for certain of our products, in the midst of our cost reduction programs, are straining our execution abilities as well as those of our suppliers, as we are experiencing periodic and varying capacity, workforce and materials constraints, enhanced by the impact of our ongoing product and operational transfers; |
| • | variability of manufacturing yields caused by difficulties in the manufacturing process, the effects from a shift in product mix, changes in product specifications and the introduction of new product lines. These difficulties can reduce yields or disrupt production and thereby increase our manufacturing costs and adversely affect our margin; |
| • | the possibility of incurring significant costs to correct defective products (despite rigorous testing for quality both by our customers and by us), which could include lost future sales of the affected product and other products, and potentially severe customer relations problems, litigation and damage to our reputation; |
| • | our dependence on a limited number of vendors, often small and specialized, for raw materials, packages and standard components. Our business and results of operations have been, and could continue to be adversely affected by this dependency. Specific concerns we periodically encounter with our suppliers include stoppages or delays of supply, insufficient vendor resources to supply our requirements, substitution of more expensive or less reliable products, receipt of defective parts or contaminated materials, increases in the price of supplies, and an inability to obtain reduced pricing from our suppliers in response to competitive pressures; and |
| • | new product programs and introductions, which due to their changing product specifications and customer requirements, unanticipated engineering complexities, difficulties in reallocating resources and overcoming resource limitations and with their increased complexity, expose us to yield and product risk internally and with our materials suppliers. |
These factors have caused considerable strain on our execution capabilities and customer relations. We have and could continue to see (a) periodic difficulty responding to customer delivery expectations for some of our products, (b) yield and quality problems, particularly with some of our new products and higher volume products, and (c) additional funds and other resources to respond to these execution challenges. We are also, in the short-term, diverting resources from new product research and development and other functions to assist with resolving these matters. If we do not improve our performance in all of these areas, our operating results will be harmed, the commercial viability of new products may be challenged and our customers may choose to reduce their purchases of our products and purchase additional products from our competitors.
We rely on a limited number of customers for a significant portion of sales.
We believe that we will continue to rely upon a limited number of customers for a significant portion of our revenues for each period for the foreseeable future and any failure by us to capture a significant share of these customers could materially harm our business. Dependence on a limited number of customers exposes us to the risk that order reductions from any one customer can have a material adverse effect on periodic revenue. Further, to the extent that our direct communications equipment manufacturer customer base and their customer base, the service providers, consolidates, we will have increased dependence on fewer customers who may be able to exert increased pressure on our prices and contractual terms in general. Customer consolidation activity and periodic manufacturing and inventory initiatives could also create the potential for pauses in customer demand for our products as a consequence of their new decision frameworks and periods of operational streamlining.
Also, we have a strategic alliance with SICPA, our principal customer for our light interference microflakes that are used to, among other things, provide security features in currency. Under a license and supply agreement, we rely exclusively on SICPA to market and sell one of these product lines, OVP, for document authentication applications worldwide. The agreement requires SICPA to purchase minimum quantities of these pigments over the term of the agreement. If SICPA fails to purchase these quantities, as and when required by the agreement,
24
Table of Contents
for any reason, our business and operating results (including, among other things, our revenue and gross margin) will be harmed, at least in the short-term. In the long-term, we may be unable to find a substitute marketing and sales partner or develop these capabilities ourselves.
Risks in strategic transactions.
Our strategy continues to include periodic acquisitions and divestitures of businesses and technologies. Strategic transactions of this nature involve numerous risks, including the following:
| • | difficulties and costs in integrating or disintegrating the operations, technologies, products, IT and other systems, facilities, and personnel of the affected businesses; |
| • | inadequate internal control procedures and disclosure controls to comply with the requirements of Section 404 of the Sarbanes-Oxley Act of 2002, or poor integration of a target company’s or businesses’ procedures and controls; |
| • | diversion of management’s attention from normal daily operations of the business; |
| • | potential difficulties in completing projects associated with in-process research and development; |
| • | difficulties in entering markets in which we have no or limited direct prior experience and where competitors in such markets have stronger market positions; |
| • | projecting and obtaining or providing sufficient transition services for an appropriate period of time and cost in the case of acquisitions or divestitures of product lines, assets, or discrete businesses; |
| • | insufficient net revenue to offset increased expenses associated with acquisitions; |
| • | potential loss of key employees of the acquired companies; and |
| • | difficulty in forecasting revenues and margins. |
Acquisitions may also cause us to:
| • | issue common stock that would dilute our current shareholders’ percentage ownership; |
| • | assume liabilities, some of which may be unknown at the time of such acquisitions; |
| • | record goodwill and non-amortizable intangible assets that will be subject to impairment testing and potential periodic impairment charges; |
| • | incur amortization expenses related to certain intangible assets; or |
| • | acquire, assume, or become subject to litigation. |
Certain of our non-communications related products are subject to governmental and industry regulations, certifications and approvals.
The commercialization of certain of the products we design, manufacture and distribute through our AOT and Communications and Commercial Optical Products segments may be more costly due to required government approval and industry acceptance processes. Development of applications for our light interference and diffractive microflakes may require significant testing that could delay our sales. For example, certain uses in cosmetics may be regulated by the Food and Drug Administration, which has extensive and lengthy approval processes. Durability testing by the automobile industry of our decorative microflakes used with automotive paints can take up to three years. If we change a product for any reason, including technological changes or changes in the manufacturing process, prior approvals or certifications may be invalid and we may need to go through the approval process again. If we are unable to obtain these or other government or industry certifications in a timely manner, or at all, our operating results could be adversely affected.
25
Table of Contents
We face risks related to our international operations and revenue.
Our customers are located throughout the world. In addition, we have significant offshore operations and operations outside North America, including product development, manufacturing, sales and customer support operations.
In particular, as a result of our efforts to reduce costs, we have expanded our use of contract manufacturers in Shenzhen, China. Looking ahead we expect to expand our research and development activities in China. Our ability to operate in China may be adversely affected by changes in Chinese laws and regulations, such as those relating to taxation, import and export tariffs, environmental regulations, land use rights, intellectual property and other matters, which laws and regulations remain highly underdeveloped and subject to change, with little or no prior notice, for political or other reasons.
Our international presence exposes us to certain risks, including the following:
| • | currency fluctuations; |
| • | our ability to comply with customs, import/export and other trade compliance regulations of the countries in which we do business, together with any unexpected changes in such regulations; |
| • | difficulties in establishing and enforcing our intellectual property rights; |
| • | tariffs and other trade barriers; |
| • | political, legal and economic instability in foreign markets, particularly in those markets in which we maintain manufacturing and product development facilities; |
| • | difficulties in staffing and management; |
| • | language and cultural barriers; |
| • | seasonal reductions in business activities in the countries where our international customers are located; |
| • | integration of foreign operations; |
| • | longer payment cycles; |
| • | difficulties in management of foreign distributors; and |
| • | potential adverse tax consequences. |
Net revenue from customers outside the Americas accounted for 51%, 55% and 48% of our total net revenue for fiscal 2010, 2009 and 2008, respectively. We expect that net revenue from customers outside North America will continue to account for a significant portion of our total net revenue. Lower sales levels that typically occur during the summer months in Europe and some other overseas markets may materially and adversely affect our business. In addition, the revenues we derive from many of our customers depend on international sales and consequently further expose us to the risks associated with such international sales.
Our business and operations would be adversely impacted in the event of a failure of our information technology infrastructure.
We rely upon the capacity, reliability and security of our information technology hardware and software infrastructure and our ability to expand and update this infrastructure in response to our changing needs. We are constantly updating our information technology infrastructure. For example, we are currently implementing a global Oracle system rollout to improve system integration and performance. Any failure to manage, expand and update our information technology infrastructure or any failure in the operation of this infrastructure could harm our business.
26
Table of Contents
Despite our implementation of security measures, our systems are vulnerable to damages from computer viruses, natural disasters, unauthorized access and other similar disruptions. Any system failure, accident or security breach could result in disruptions to our operations. To the extent that any disruptions or security breach results in a loss or damage to our data, or in inappropriate disclosure of confidential information, it could harm our business. In addition, we may be required to incur significant costs to protect against damage caused by these disruptions or security breaches in the future.
Failure to maintain effective internal controls may adversely affect our stock price. Out-of-period adjustments could require us to restate previously issued financial statements.
Effective internal controls are necessary for us to provide reliable financial reports and to effectively prevent fraud. The SEC, as directed by Section 404 of the Sarbanes-Oxley Act of 2002, adopted rules requiring public companies to include a report by management on the effectiveness of the Company’s internal control over financial reporting in their annual reports on Form 10-K. In addition, our independent registered public accounting firm must report on the effectiveness of the internal control over financial reporting. Although we review our internal control over financial reporting in order to ensure compliance with the Section 404 requirements, if we or our independent registered public accounting firm is not satisfied with our internal control over financial reporting or the level at which these controls are documented, designed, operated or reviewed, or if our independent registered public accounting firm interprets the requirements, rules and/or regulations differently from our interpretation, then they may issue a report that is qualified. This could result in an adverse reaction in the financial marketplace due to a loss of investor confidence in the reliability of our financial statements, which ultimately could negatively impact our stock price.
In addition, we have in the past recorded, and may in the future record, “out-of-period” adjustments to our financial statements. In making such adjustments we apply the analytical framework of Staff Accounting Bulletin No. 99, “Materiality”, (“SAB 99”) to determine whether the effect of any out-of-period adjustment to our financial statements is material and whether such adjustments, individually or in the aggregate, would require us to restate our financial statements for previous periods. Under SAB 99, companies are required to apply quantitative and qualitative factors to determine the "materiality" of particular adjustments. We have recorded out-of-period adjustments in the past and in each instance determined that such adjustments were not material to the period in which the error originated or was corrected. In the future we may identify further out-of-period adjustments impacting our interim or annual financial statements. Depending upon the complete qualitative and quantitative analysis, this could result in our having to restate previously issued financial statements.
We sold $475 million of senior convertible notes in 2003 and $425 million of senior convertible notes in 2006, which may cause our reported earnings per share to be more volatile because of the conversion contingency features of these notes.
We issued $475 million of indebtedness in October 2003 and $425 million of indebtedness in May and June, 2006 in the form of senior convertible notes. As of July 3, 2010, $325.2 million of these notes remained outstanding. The issuance of these notes substantially increased our principal payment obligations and we may not have enough cash to repay the notes when due. The degree to which we are leveraged could materially and adversely affect our ability to successfully obtain financing for working capital, acquisitions or other purposes and could make us more vulnerable to industry downturns and competitive pressures. In addition, the holders of those notes are entitled to convert those notes into shares of our common stock or a combination of cash and shares of common stock under certain circumstances which would cause dilution to our existing stockholders and lower our reported per share earnings.
27
Table of Contents
If we have insufficient proprietary rights or if we fail to protect those we have, our business would be materially harmed.
Our intellectual property rights may not be adequate to protect our products or product roadmaps.
We seek to protect our products and our product roadmaps in part by developing and/or securing proprietary rights relating to those products, including patents, trade secrets, know-how and continuing technological innovation. The steps taken by us to protect our intellectual property may not adequately prevent misappropriation or ensure that others will not develop competitive technologies or products. Other companies may be investigating or developing other technologies that are similar to our own. It is possible that patents may not be issued from any application pending or filed by us and, if patents do issue, the claims allowed may not be sufficiently broad to deter or prohibit others from making, using or selling similar products. We do not own patents in every country in which we sell or distribute our products, and thus others may be able to offer identical products in countries in which we do not have intellectual property protection. In addition, the laws of some territories in which our products are or may be developed, manufactured or sold, including Europe, Asia-Pacific or Latin America, may not protect our products and intellectual property rights to the same extent as the laws of the United States.
Any patents issued to us may be challenged, invalidated or circumvented, and recent Supreme Court precedent may make it easier to invalidate some of our patents than in the past. Additionally, we are currently a licensee in all of our operating segments for a number of third-party technologies, software and intellectual property rights from academic institutions, our competitors and others, and are required to pay royalties to these licensors for the use thereof. Unless we are able to obtain such licenses on commercially reasonable terms, patents or other intellectual property held by others could inhibit our development of new products, impede the sale of some of our current products, substantially increase the cost to provide these products to our customers, and could have a significant adverse impact on our operating results. In the past, licenses generally have been available to us where third-party technology was necessary or useful for the development or production of our products. In the future licenses to third-party technology may not be available on commercially reasonable terms, if at all.
Our products may be subject to claims that they infringe the intellectual property rights of others.
Lawsuits and allegations of patent infringement and violation of other intellectual property rights occur in our industry on a regular basis. We have received in the past, and anticipate that we will receive in the future, notices from third parties claiming that our products infringe third-party proprietary rights. Over the past few years there has been a marked increase in the number and potential severity of third party patent infringement claims, primarily from two distinct sources. First, large technology companies, including some of our customers and competitors, are seeking to monetize their patent portfolios and have developed large internal organizations that have approached us with demands to enter license agreements. Second, numerous patent-holding companies, entities that do not make or sell products (often referred to as “patent trolls”), have claimed that our products infringe upon their proprietary rights. In addition, our markets are extremely competitive and we expect to experience intellectual property infringement disputes with our competitors from time to time. We will continue to respond to these claims in the course of our business operations. In the past, the settlement and disposition of these disputes has not had a material adverse impact on our business or financial condition, however this may not be the case in the future. Further, the litigation or settlement of these matters, regardless of the merit of the claims, could result in significant expense to us and divert the efforts of our technical and management personnel, whether or not we are successful. If we are unsuccessful, we could be required to expend significant resources to develop non-infringing technology or to obtain licenses to the technology that is the subject of the litigation. We may not be successful in such development, or such licenses may not be available on terms acceptable to us, if at all. Without such a license, we could be enjoined from future sales of the infringing product or products, which could adversely affect our revenues and operating results.
28
Table of Contents
The use of open source software in our products, as well as those of our suppliers, manufacturers and customers, may expose us to additional risks and harm our intellectual property position.
Certain of the software and/or firmware that we use and distribute (as well as that of our suppliers, manufacturers and customers) may be derived from, or contain, so-called “open source” software that is generally made available to the public by its authors and/or other third parties. Such open source software is often made available under licenses which impose obligations in the event the software or derivative works thereof are distributed or re-distributed. These obligations may require us to make source code for the derivative works available to the public, and/or license such derivative works under a particular type of license, rather than the forms of license customarily used to protect our own software products. While we believe we have complied with our obligations under the various applicable licenses for open source software, in the event that a court rules that these licenses are unenforceable, or in the event the copyright holder of any open source software were to successfully establish in court that we had not complied with the terms of a license for a particular work, we could be required to release the source code of that work to the public and/or stop distribution of that work. Additionally, open source licenses are subject to occasional revision. In the event future iterations of open source software are made available under a revised license, such license revisions may adversely affect our ability to use such future iterations.
We face certain litigation risks that could harm our business.
We have had numerous lawsuits filed against us asserting various claims. The results of complex legal proceedings are difficult to predict. Moreover, many of the complaints filed against us do not specify the amount of damages that plaintiffs seek, and we therefore are unable to estimate the possible range of damages that might be incurred should these lawsuits be resolved against us. While we are unable to estimate the potential damages arising from such lawsuits, certain of them assert types of claims that, if resolved against us, could give rise to substantial damages. Thus, an unfavorable outcome or settlement of one or more of these lawsuits could have a material adverse effect on our financial condition, liquidity and results of operations. Even if these lawsuits are not resolved against us, the uncertainty and expense associated with unresolved lawsuits could seriously harm our business, financial condition and reputation. Litigation is costly, time-consuming and disruptive to normal business operations. The costs of defending these lawsuits, particularly the securities class actions and stockholder derivative actions, have been significant, will continue to be costly and may not be covered by our insurance policies. The defense of these lawsuits could also result in continued diversion of our management’s time and attention away from business operations, which could harm our business. For additional information regarding certain of the lawsuits in which we are involved, see the “Legal Proceedings” portion of this report.
We may be subject to environmental liabilities which could increase our expenses and harm our operating results.
We are subject to various federal, state and foreign laws and regulations governing the environment, including those governing pollution and protection of human health and the environment and, recently, those restricting the presence of certain substances in electronic products and holding producers of those products financially responsible for the collection, treatment, recycling and disposal of certain products. Such laws and regulations have been passed in several jurisdictions in which we operate. We will need to ensure that we comply with such laws and regulations as they are enacted, as well as all environmental laws and regulations, and as appropriate or required, that our component suppliers also timely comply with such laws and regulations. If we fail to timely comply with such laws, we could face sanctions for such noncompliance, and our customers further may refuse to purchase our products, which would have a materially adverse effect on our business, financial condition and results of operations.
With respect to compliance with environmental laws and regulations in general, we have incurred and in the future could incur substantial costs for the cleanup of contaminated properties, either those we own or operate or to which we have sent wastes in the past, or to comply with such environmental laws and regulations; further, we
29
Table of Contents
could be subject to disruptions to our operations and logistics as a result of such clean-up or compliance obligations. In addition, if we were found to be in violation of these laws, we could be subject to governmental fines and liability for damages resulting from such violations. If we have to make significant capital expenditures to comply with environmental laws, or if we are subject to significant expenditures in connection with a violation of these laws, our financial condition or operating results could be adversely impacted.
Our rights plan and some anti-takeover provisions contained in our charter and under Delaware laws could hinder a takeover attempt.
Some provisions contained in our rights plan may have the effect of discouraging a third party from making an acquisition proposal for us and may thereby inhibit a change in control. We are also subject to the provisions of Section 203 of the Delaware General Corporation Law prohibiting, under some circumstances, publicly-held Delaware corporations from engaging in business combinations with some stockholders for a specified period of time without the approval of the holders of substantially all of our outstanding voting stock. Such provisions could delay or impede the removal of incumbent directors and could make more difficult a merger, tender offer or proxy contest involving us, even if such events could be beneficial, in the short-term, to the interests of the stockholders. In addition, such provisions could limit the price that some investors might be willing to pay in the future for shares of our common stock. Our certificate of incorporation and bylaws contain provisions relating to the limitations of liability and indemnification of our directors and officers, dividing our board of directors into three classes of directors serving three-year terms and providing that our stockholders can take action only at a duly called annual or special meeting of stockholders. These provisions also may have the effect of deterring hostile takeovers or delaying changes in control or management of us.
Changes in laws, regulations and financial accounting standards may affect our reported results of operations
Changes in accounting regulations and standards, such as increased use of fair value measures and the potential requirement that U.S. registrants prepare financial statements in accordance with International Financial Reporting Standards (“IFRS”), can have a significant effect on our results. New pronouncements and varying interpretations of pronouncements have occurred in the past and are likely to occur in the future as a result of recent Congressional and regulatory actions. New laws, regulations and accounting standards, as well as the questioning of, or changes to, currently accepted accounting practices in the technology industry may adversely affect our financial results.
| ITEM 1B. | UNRESOLVED STAFF COMMENTS |
None.
We own and lease various properties in the United States and in 25 other countries around the world. We use the properties for executive and administrative offices, data centers, product development offices, customer service offices, and manufacturing facilities. Our corporate headquarters of approximately 180,110 square feet is located in Milpitas, California. As of July 3, 2010, our leased and owned properties provided us with aggregate square footage of approximately 2.2 million and 0.4 million, respectively. The only large owned site is Germany. Larger leased sites include properties located in Canada, United States, France, and China. We believe that our existing properties, including both owned and leased sites, are in good condition and suitable for the conduct of our business.
From time to time we consider various alternatives related to our long-term facilities needs. While we believe our existing facilities are adequate to meet our immediate needs, it may become necessary to lease, acquire, or sell additional or alternative space to accommodate any future business needs.
30
Table of Contents
The material set forth in Note 21 of our Notes to Consolidated Financial Statements in this Annual Report on Form 10-K is incorporated herein by reference.
31
Table of Contents
PART II
| ITEM 5. | MARKET FOR REGISTRANT’S COMMON EQUITY, RELATED STOCKHOLDER MATTERS AND ISSUER PURCHASES OF EQUITY SECURITIES |
Our common stock is traded on the NASDAQ Stock Market under the symbol “JDSU” and our exchangeable shares of JDS Uniphase Canada Ltd. are traded on the Toronto Stock Exchange under the symbol “JDU.” Holders of exchangeable shares may tender their holdings for common stock on a one-for-one basis at any time. As of July 30, 2010, we had 221,589,218 shares of common stock outstanding, including 4,323,590 exchangeable shares. The closing price on July 30, 2010 was $10.85 for the common stock and Canadian $11.21 for the exchangeable shares. The following table summarizes the high and low closing sales prices for our common stock as reported on the NASDAQ Stock Market during fiscal 2010 and 2009.
| High | Low | |||||
| Fiscal 2010: |
||||||
| Fourth Quarter |
$ | 13.82 | $ | 9.67 | ||
| Third Quarter |
12.57 | 7.86 | ||||
| Second Quarter |
8.51 | 5.52 | ||||
| First Quarter |
7.90 | 4.85 | ||||
| Fiscal 2009: |
||||||
| Fourth Quarter |
$ | 6.22 | $ | 3.25 | ||
| Third Quarter |
5.25 | 2.21 | ||||
| Second Quarter |
8.47 | 2.21 | ||||
| First Quarter |
11.90 | 8.26 | ||||
As of July 30, 2010, we had 4,423 holders of record of our common stock and exchangeable shares. We have not paid cash dividends on our common stock and do not anticipate paying cash dividends in the foreseeable future.
Stock Repurchase Program
On May 15, 2008, the Company’s Board of Directors authorized the Company to repurchase up to $200 million of its common stock through open market or private transactions during a two year period ending May 14, 2010. During the three months ended June 28, 2008, the Company repurchased approximately 9.6 million shares of common stock in open market purchases at an average price of $11.76 per share. The total purchase price of $113.2 million was reflected as a decrease to common stock based on the stated par value per share with the remainder to accumulated deficit. All common shares repurchased under this program have been cancelled and retired.
During the first quarter of fiscal 2009, the Company repurchased approximately 7.6 million shares of common stock in open market purchases at an average price of $11.40 per share, completing the $200 million share repurchase program authorized by the Company’s Board of Directors on May 15, 2008. The total purchase price of $86.8 million was reflected as a decrease to common stock based on the stated par value per share with the remainder to accumulated deficit.
32
Table of Contents
STOCK PERFORMANCE GRAPH
The information contained in the following graph shall not be deemed to be “soliciting material” or to be “filed” with the Securities and Exchange Commission, nor shall such information be incorporated by reference into any future filing under the Securities Act of 1933, as amended, or the 1934 Securities Exchange Act, as amended, except to the extent that the Company specifically incorporates it by reference in such filing.
The following graph and table set forth the Company’s total cumulative Stockholder return of an investment of $100 in June 2005 and ending June 2010 in: (i) the Company’s Common Stock, (ii) the S&P 500 Index, (iii) the NASDAQ Stock Market (U.S.) Index and, (iv) the NASDAQ Telecommunications Index. Historical stock price performance is not necessarily indicative of future stock price performance.
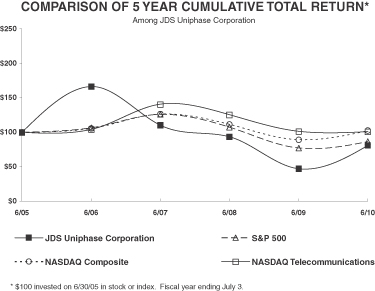
| 6/05 | 6/06 | 6/07 | 6/08 | 6/09 | 6/10 | |||||||
| JDS Uniphase Corporation |
100.00 | 166.45 | 110.44 | 93.42 | 47.04 | 80.92 | ||||||
| S&P 500 |
100.00 | 106.62 | 126.19 | 107.44 | 77.17 | 86.52 | ||||||
| NASDAQ Composite |
100.00 | 105.60 | 126.56 | 111.47 | 89.21 | 102.54 | ||||||
| NASDAQ Telecommunications |
100.00 | 104.36 | 140.83 | 125.51 | 101.57 | 101.17 |
33
Table of Contents
ITEM 6. SELECTED FINANCIAL DATA
This table sets forth selected financial data of JDSU, in millions, except share and per share amounts, for the periods indicated. This data should be read in conjunction with and is qualified by reference to “Management’s Discussion and Analysis of Financial Condition and Results of Operations” included in Item 7 of this Annual Report on Form 10-K and our audited consolidated financial statements, including the notes thereto and our independent registered public accounting firm’s report thereon and the other financial information included in Item 8 of this Form 10-K. The selected data in this section are not intended to replace the consolidated financial statements included in this report.
| Years Ended | ||||||||||||||||||||
| July 3, 2010(3)(5) |
June 27, 2009(3)(4) |
June 28, 2008(3)(4) |
June 30, 2007(3)(4) |
July 1, 2006(3)(4) |
||||||||||||||||
| Consolidated Statement of Operations Data: |
||||||||||||||||||||
| Net revenue |
$ | 1,363.9 | $ | 1,283.3 | $ | 1,512.0 | $ | 1,378.4 | $ | 1,184.8 | ||||||||||
| Gross profit |
547.1 | 486.6 | 579.6 | 459.5 | 327.3 | |||||||||||||||
| Amortization of other intangibles |
27.8 | 27.0 | 30.0 | 26.8 | 24.4 | |||||||||||||||
| Acquired in-process research and development |
— | — | — | 5.1 | 20.3 | |||||||||||||||
| Impairment of goodwill |
— | 741.7 | 37.0 | — | 22.4 | |||||||||||||||
| (Gain) loss on disposal and impairment of long-lived assets |
(2.0 | ) | 13.2 | 6.7 | 7.8 | 5.6 | ||||||||||||||
| Restructuring and related charges |
17.7 | 38.5 | 6.7 | 14.7 | 35.0 | |||||||||||||||
| Total operating expense |
601.3 | 1,386.5 | 713.8 | 581.4 | 579.2 | |||||||||||||||
| Loss from operations |
(54.2 | ) | (899.9 | ) | (134.2 | ) | (121.9 | ) | (251.9 | ) | ||||||||||
| Loss from continuing operations |
(59.7 | ) | (906.2 | ) | (41.5 | ) | (46.3 | ) | (157.2 | ) | ||||||||||
| Net loss |
(61.8 | ) | (909.5 | ) | (40.3 | ) | (43.7 | ) | (153.3 | ) | ||||||||||
| Loss from continuing operations per share—basic and diluted |
(0.27 | ) | (4.20 | ) | (0.19 | ) | (0.22 | ) | (0.76 | ) | ||||||||||
| Net loss per share—basic and diluted |
(0.28 | ) | (4.22 | ) | (0.18 | ) | (0.21 | ) | (0.74 | ) | ||||||||||
| Years Ended | ||||||||||||||||||||
| July 3, 2010(3)(5) |
June 27, 2009(2)(3)(4) |
June 28, 2008(1)(3)(4) |
June 30, 2007(3)(4) |
July 1, 2006(3)(4) |
||||||||||||||||
| Consolidated Balance Sheet Data: |
||||||||||||||||||||
| Cash, cash equivalents, short-term investments, and restricted cash |
$ | 600.1 | $ | 695.5 | $ | 884.7 | $ | 1,142.7 | $ | 1,238.6 | ||||||||||
| Working capital |
723.7 | 797.9 | 983.8 | 1,313.2 | 1,381.9 | |||||||||||||||
| Total assets |
1,703.6 | 1,668.1 | 2,904.6 | 3,021.6 | 3,061.7 | |||||||||||||||
| Long-term obligations |
444.0 | 423.7 | 524.8 | 803.6 | 902.7 | |||||||||||||||
| Total stockholders’ equity |
908.7 | 934.5 | 1,934.5 | 1,871.1 | 1,736.6 | |||||||||||||||
| (1) | Cash and working capital balances declined in fiscal 2008 primarily due to $400.7 million of repurchases of debt and common stock, offset by cash from operations of $197.2 million. |
| (2) | Cash and working capital balances declined in fiscal 2009 primarily due to $226.0 million of repurchases of debt and common stock, offset by cash from operations of $107.4 million. |
| (3) | Effective June 28, 2009, the first day of fiscal 2010, we adopted authoritative guidance which applies to convertible debt securities that, upon conversion, may be settled by the issuer fully or partially in cash. As a result, we have retrospectively applied this guidance to all past periods presented. |
| (4) | On September 4, 2009, we sold certain non-core assets related to our wholly owned subsidiary da Vinci Systems LLC (“da Vinci”). As a result, the operations of da Vinci have been presented as discontinued operations for all periods presented. |
| (5) | On May 1, 2010, we acquired the Network Solutions Division (“NSD”) of Agilent Technologies, Inc. (“Agilent”) in a transaction accounted for as a purchase. The Consolidated Statement of Operations for fiscal 2010 included the results of operations from NSD subsequent to May 1, 2010 and the Consolidated Balance Sheet as of July 3, 2010 included NSD’s financial position. |
34
Table of Contents
| ITEM 7. | MANAGEMENT’S DISCUSSION AND ANALYSIS OF FINANCIAL CONDITION AND RESULTS OF OPERATIONS |
Our Industries and Developments
JDS Uniphase Corporation (JDSU) is a leading provider of communications test and measurement solutions and optical products for telecommunications service providers, cable operators, and network equipment manufacturers. JDSU also provides laser components and subsystems for a broad range of applications, including solid-state, direct diode, fiber and gas lasers. JDSU is also a leading provider of optical solutions for biomedical and environmental instrumentation, semiconductor processing, aerospace and defense, brand authentication, visual display, and custom color product differentiation applications.
To serve its markets, JDSU operates in the following business segments: Communications Test and Measurement, Communications and Commercial Optical Products, and Advanced Optical Technologies.
Communications Test and Measurement
The Communications Test and Measurement business segment provides instruments, solutions, and services for communications network operators and equipment manufacturers that deliver and/or operate broadband/IP networks (cable, fixed, and mobile) and deploy triple- and quad-play (voice, video, data, and wireless) services.
JDSU solutions help accelerate the deployment of new services, lower operating expenses, reduce customer turnover, and increase productivity across each critical phase of the network lifecycle including research and development, production, deployment, and service assurance. JDSU enables the effective management of services, such as voice over Internet protocol (VoIP) and Internet protocol TV (IPTV), by providing visibility into the end-user experience and also by providing repair, calibration, instrument management, and other services to aid its customers in the rapid deployment and repair of networks and services.
JDSU test solutions address lab and production (capacity expansion, 40G/100G), field service (triple-play deployments for cable, telecom, FTTx, and home networking), wireless (drive test, protocol test), and service assurance (quality of experience [“QoE”] for Ethernet and IP services over cable, wireless, and fixed/telecom networks). JDSU also provides protocol test solutions for the development and field deployment of storage and storage-network technologies.
JDSU test and measurement customers include the world’s largest communications service providers, communications equipment manufacturers, and government organizations. These include major telecom service providers, wireless operators and cable operators including AT&T, Bell Canada, British Telecom, China Telecom, Comcast, Deutsche Telecom, France Telecom, TalkTalk, Telefonica, Telmex, TimeWarner, and Verizon. Network equipment manufacturing customers include Alcatel-Lucent, Ciena, Cisco Systems, Fujitsu, Huawei, and Motorola. Customers in the storage group are chip and infrastructure vendors, storage device manufacturers, storage network and switch vendors, and deployed private enterprise customers. Storage group customers include Brocade, Cisco Systems, EMC, Hewlett-Packard, and IBM.
Communications and Commercial Optical Products
The Communications and Commercial Optical Products (CCOP) business segment is a leading provider of products and technologies used in the optical communications and commercial laser markets.
CCOP optical communications products include a wide range of components, modules, subsystems, and solutions for two markets: telecommunications, including access (local), metro (intracity), long-haul (city-to-city and worldwide), and submarine (undersea) networks; and, enterprise data communications including storage access networks (SANs), local area networks (LANs), and Ethernet wide-area networks (WANs). The products enable the transmission and transport of video, audio, and text data over high-capacity, fiber-optic cables.
35
Table of Contents
Transmission products primarily consist of optical transceivers, optical transponders, and their supporting components such as modulators and source lasers including vertical-cavity surface-emitting lasers (VCSELs). Transport products primarily consist of amplifiers, ROADMs, and Super Transport Blades, and their supporting components such as 980 nanometer (nm) pumps, passive devices, and array waveguides (AWGs).
CCOP laser products serve a wide variety of original equipment manufacturer (OEM) applications from low- to high-power output and with ultraviolet (UV), visible, and IR wavelengths. The broad portfolio addresses the needs of laser clients in applications such as micromachining, materials processing, bioinstrumentation, consumer electronics, graphics, medical/dental, and optical pumping. Core laser technologies include continuous-wave (cw), q-switched, and mode-locked lasers addressing application needs from cw to megahertz repetition rates. Laser products include diode, direct-diode, diode-pumped solid-state (DPSS), fiber and gas lasers.
CCOP provides two lines of photovoltaic products. Concentrated photovoltaic (CPV) cell products convert light into electrical energy, enabling high-efficiency multijunction solar cells and receiver assemblies. Photonic Power (PP) products transport energy over optical fiber, enabling electromagnetic- and radio-interference-free power and data transmission for remote sensors such as high-voltage line current monitors.
Today’s most advanced optical networks are built with JDSU transport and transmission components, modules, and subsystems. Customers for Optical Communications products include network equipment manufacturers such as Alcatel-Lucent, Ciena, Cisco Systems, Ericsson, Fujitsu, Hewlett-Packard, Huawei, IBM, Nokia Siemens Networks, and Tellabs. Customers for JDSU Commercial Lasers include ASML, Beckman Coulter, Becton Dickinson, Disco, Electro Scientific Industries, and Han’s Laser. Customers for Photovoltaic Products include Amplifier Research, ETS-Lindgren, Nanjing Xinning Optoelectronics Automation, Siemens and SolFocus.
Advanced Optical Technologies
The Advanced Optical Technologies (AOT) business segment leverages its core technology strengths in optics and materials science to manage light and/or color effects for a wide variety of markets—from product security to space exploration. AOT consists of the Authentication Solutions group, the Custom Optics Products group, and the Flex Products group.
The Authentication Solutions group provides multilayer authentication solutions that include overt, covert, forensic, and digital technologies for protection from product and document counterfeiting and tampering. These solutions, many of which leverage AOT color-shifting and holographic technologies, safeguard brands in the secure document, transaction card, pharmaceutical, consumer electronics, printing/imaging supplies, licensing, and fast-moving consumer goods industries.
The Custom Optics group produces precise, high-performance, optical thin-film coatings for a variety of applications in government and aerospace, biomedical, display, office automation, entertainment, and other emerging markets. These applications include night-vision goggles, satellite solar covers, medical instrumentation, information displays, office equipment, computer-driven projectors, and 3D cinema.
The Flex Products group includes custom color solutions, a product line of unique solutions for product finishes and a wide variety of decorative packaging. These include innovative, optically-based, light-management solutions that provide product enhancement for brands in the pharmaceutical, automotive, consumer electronics, and fast-moving consumer goods industries. The group’s high-end printing services produce labels for a wide variety of commercial and industrial products, and its color-shifting pigments protect the currencies of more than 90 countries including China, the European Union, and the United States.
The AOT business segment serves customers such as Dolby, Kingston, Lockheed Martin, Northrup Grumman, Pan Pacific, and SICPA. Also, leading issuers of transaction cards and pharmaceutical companies worldwide use AOT business segment solutions to protect their brands.
36
Table of Contents
Overview
| • | Net revenue in fiscal 2010 increased 6%, or $80.6 million, to $1,363.9 million from $1,283.3 million in fiscal 2009. Net revenue in fiscal 2010 consisted of $652.2 million, or approximately 47% of net revenue, from Communications Test and Measurement, $499.3 million, or approximately 37% of net revenue, from Communications and Commercial Optical Products, and $221.9 million, or approximately 16% of net revenue, from Advanced Optical Technologies. Communications Test and Measurement net revenue excludes $9.5 million of fair value adjustment to acquisition related deferred revenue. |
| • | Gross profit in fiscal 2010 increased to 40% from 38% in fiscal 2009. The increase in gross margin was primarily related to lower infrastructure costs as the result of the numerous restructuring activities that were initiated in fiscal 2009 that took full effect in fiscal 2010. |
| • | Our combined research and development (“R&D”) and selling, general and administrative (“SG&A”) expenses decreased $8.3 million to $557.8 million from $566.1 million in fiscal 2009, and as a percent of net revenue, decreased to 41% in fiscal 2010 from 44% in fiscal 2009. The decrease is primarily due to cost reduction initiatives to re-align our cost structure to the reduced demand levels resulting from the general economic slowdown. |
| • | There was no impairment of goodwill in fiscal 2010, compared to $741.7 million in fiscal 2009, due to the strengthening of market conditions on our forecasts and a sustained, significant increase in our market capitalization to a level higher than our net book value. |
| • | On May 1, 2010, we acquired the Network Solutions Division (“NSD”) of Agilent Technologies, Inc. (“Agilent”) in a transaction accounted for as a purchase. The Consolidated Statement of Operations for fiscal 2010 included the results of operations from NSD subsequent to May 1, 2010 and the Consolidated Balance Sheet as of July 3, 2010 included NSD’s financial position. |
Recent Accounting Pronouncements
In April 2010, the FASB issued authoritative guidance clarifying that share-based payment award with an exercise price denominated in the currency of a market in which a substantial portion of the entity’s equity shares trades should not be considered to contain a condition that is not a market, performance, or service condition. Therefore, an entity would not classify such an award as a liability if it otherwise qualifies as equity. The guidance is effective for us beginning in the first quarter of fiscal 2012. We do not anticipate that the adoption of this statement will have a material impact on our consolidated financial statements.
In March 2010, the FASB issued authoritative guidance amending existing guidance surrounding the consolidation of variable interest entities (“VIE”) to require an enterprise to qualitatively assess the determination of the primary beneficiary of a VIE based on whether the entity a) has the power to direct the activities of a VIE that most significantly impact the entity’s economic performance and b) has the obligation to absorb losses of the entity or the right to receive benefits from the entity that could potentially be significant to the VIE. The guidance also requires an ongoing reconsideration of the primary beneficiary, and amends the events that trigger a reassessment of whether an entity is a VIE. Enhanced disclosures are also required to provide information about an enterprise’s involvement in a VIE. This guidance is effective for us beginning in the first quarter of fiscal 2011. We are currently evaluating the potential impact, if any, of the adoption of this guidance on our consolidated financial statements.
In September 2009, the FASB issued authoritative guidance that applies to revenue arrangements with multiple deliverables and provides another alternative for determining the selling price of deliverables. In addition, the residual method of allocating arrangement consideration is no longer permitted under this guidance. The guidance is effective for us beginning in the first quarter of fiscal 2011. We are currently finalizing the assessment of the impact of the adoption of this guidance on our consolidated financial statements.
37
Table of Contents
In September 2009, the FASB issued authoritative guidance which removes non-software components of tangible products and certain software components of tangible products from the scope of existing software revenue guidance, resulting in the recognition of revenue similar to that for other tangible products. It also requires expanded qualitative and quantitative disclosures. The guidance is effective for us beginning in the first quarter of fiscal 2011. We are currently evaluating the potential impact, if any, of the adoption of this guidance on our consolidated financial statements.
Critical Accounting Policies and Estimates
The preparation of our consolidated financial statements in conformity with accounting principles generally accepted in the United States requires us to make estimates and judgments that affect the reported amounts of assets and liabilities, net revenue and expenses, and the related disclosures. We base our estimates on historical experience, our knowledge of economic and market factors and various other assumptions that we believe to be reasonable under the circumstances. Estimates and judgments used in the preparation of our financial statements are, by their nature, uncertain and unpredictable, and depend upon, among other things, many factors outside of our control, such as demand for our products and economic conditions. Accordingly, our estimates and judgments may prove to be incorrect and actual results may differ, perhaps significantly, from these estimates under different estimates, assumptions or conditions. We believe the following critical accounting policies are affected by significant estimates, assumptions and judgments used in the preparation of our consolidated financial statements.
Revenue Recognition
We recognize revenue when it is realized or realizable and earned. We consider revenue realized or realizable and earned when it has persuasive evidence of an arrangement, delivery has occurred, the sales price is fixed or determinable, and collectibility is reasonably assured. Delivery does not occur until products have been shipped or services have been provided to the client, risk of loss has transferred to the client and client acceptance has been obtained, client acceptance provisions have lapsed, or we have objective evidence that the criteria specified in the client acceptance provisions have been satisfied. In situations where a formal acceptance is required but the acceptance only relates to whether the product meets its published specifications, revenue is generally recognized upon shipment provided all other revenue recognition criteria are met. The sales price is not considered to be fixed or determinable until all contingencies related to the sale have been resolved.
We reduce revenue for rebates and other similar allowances. Revenue is recognized only if these estimates can be reliably determined. We base our estimates on historical results taking into consideration the type of client, the type of transaction and the specifics of each arrangement.
In addition to the aforementioned general policies, the following are the specific revenue recognition policies for multiple-element arrangements and for each major category of revenue.
Hardware
Revenue from hardware sales is generally recognized when the product is shipped to the customer and when there are no unfulfilled company obligations that affect the customer’s final acceptance of the arrangement. Any cost of warranties and remaining obligations that are inconsequential or perfunctory are accrued when the corresponding revenue is recognized. Revenue from rentals and operating leases is recognized on a straight-line basis over the term of the rental or lease.
Multiple-Element Arrangements
We enter into multiple-element revenue arrangements, which may include any combination of hardware, software and services. Certain of our networking and communications products are integrated with software that is not considered more than incidental to the functionality of the equipment. We believe that this equipment is
38
Table of Contents
not considered software related and would therefore be excluded from the scope of the authoritative guidance on software revenue recognition. Accordingly, we allocate the fair value of the equipment when sold with software according to the authoritative guidance on revenue arrangements with multiple deliverables. The value of the arrangement, less the allocated hardware is then considered within the scope of the authoritative guidance for software revenue recognition.
To the extent that a deliverable(s) in a multiple-element arrangement is subject to specific guidance (for example, software that is subject to the authoritative guidance on software revenue recognition) on whether and/or how to separate multiple-deliverable arrangements into separate units of accounting (separability) and how to allocate value among those separate units of accounting (allocation), that deliverable(s) is accounted for in accordance with such specific guidance. A multiple-element arrangement is separated into more than one unit of accounting if all of the following criteria are met:
| • | The delivered item(s) has value to the client on a standalone basis. |
| • | There is objective and reliable evidence of the fair value of the undelivered item(s). |
| • | If the arrangement includes a general right of return relative to the delivered item(s), delivery or performance of the undelivered item(s) is considered probable and substantially in the control of us. |
If these criteria are not met, revenue is deferred until the earlier of when such criteria are met or when the last undelivered element is delivered. If there is objective and reliable evidence of fair value for all units of accounting in an arrangement, the arrangement consideration is allocated to the separate units of accounting based on each unit's relative fair value. There may be cases, however, in which there is objective and reliable evidence of fair value of the undelivered item(s) but no such evidence for the delivered item(s). In those cases, the residual method is used to allocate the arrangement consideration. Under the residual method, the amount of consideration allocated to the delivered item(s) equals the total arrangement consideration less the aggregate fair value of the undelivered item(s). The revenue policies described below are then applied to each unit of accounting, as applicable.
Services
Revenue from services and system maintenance is typically recognized on a straight-line basis over the term of the contract. Revenue from time and material contracts is recognized at the contractual rates as labor hours are delivered and direct expenses are incurred. Revenue related to extended warranty and product maintenance contracts is deferred and recognized on a straight-line basis over the delivery period. We also generate service revenue from hardware repairs and calibrations which is recognized as revenue upon completion of the service.
Software
Revenue from perpetually licensed software is recognized at the inception of the license term. Revenue from maintenance, unspecified upgrades and technical support is recognized over the period such items are delivered. In multiple-element revenue arrangements that include software that is more than incidental to the products or services as a whole (software multiple-element arrangements), software and software-related elements are accounted for in accordance with the following policies. Software-related elements include software products and services as well as any non-software deliverable(s) for which a software deliverable is essential to its functionality.
A software multiple-element arrangement is separated into more than one unit of accounting if all of the following criteria are met:
| • | The functionality of the delivered element(s) is not dependent on the undelivered element(s). |
| • | There is vendor-specific objective evidence (VSOE) of fair value of the undelivered element(s). |
| • | Delivery of the delivered element(s) represents the culmination of the earnings process for that element(s). |
39
Table of Contents
If these criteria are not met, the revenue is deferred until the earlier of when such criteria are met or when the last undelivered element is delivered. If there is VSOE for all units of accounting in an arrangement, the arrangement consideration is allocated to the separate units of accounting based on each unit's relative VSOE. There may be cases, however, in which there is VSOE of the undelivered item(s) but no such evidence for the delivered item(s). In these cases, the residual method is used to allocate the arrangement consideration. Under the residual method, the amount of consideration allocated to the delivered item(s) equals the total arrangement consideration less the aggregate VSOE of the undelivered elements. Our assessment of VSOE for each undelivered element is primarily determined via contract specific substantive renewal rates. Changes to the elements in an arrangement and our ability to establish vendor-specific objective evidence for those elements could affect the timing of the revenue recognition.
Allowances for Doubtful Accounts
We perform credit evaluations of our customers’ financial condition. We maintain allowances for doubtful accounts for estimated losses resulting from the inability of our customers to make required payments. We record our bad debt expenses as selling, general and administrative expenses. When we become aware that a specific customer is unable to meet its financial obligations to us, for example, as a result of bankruptcy or deterioration in the customer’s operating results or financial position, we record a specific allowance to reflect the level of credit risk in the customer’s outstanding receivable balance. In addition, we record additional allowances based on certain percentages of our aged receivable balances. These percentages are determined by a variety of factors including, but not limited to, current economic trends, historical payment and bad debt write-off experience. We are not able to predict changes in the financial condition of our customers, and if circumstances related to our customers deteriorate, our estimates of the recoverability of our trade receivables could be materially affected and we may be required to record additional allowances. Alternatively, if we provide more allowances than we need, we may reverse a portion of such provisions in future periods based on our actual collection experience.
Stock-based Compensation
We estimate the fair value of equity awards granted using the Black-Scholes-Merton option-pricing formula and a single option award approach. This option-pricing model requires the input of highly subjective assumptions, including the option’s expected life and the price volatility of the underlying stock. The expected stock price volatility assumption was determined using a combination of historical and implied volatility of our common stock. We believe that using a combination of historical and market-based implied volatility from traded options on JDSU common stock is a better indicator of expected volatility and future stock price trends than relying solely on historical volatility. In addition, we are required to estimate the expected forfeiture rate and only recognize expense for those shares expected to vest. When estimating forfeitures, we consider voluntary termination behavior as well as future workforce reduction programs. Estimated forfeiture rates are trued-up to actual forfeiture as the stock-based awards vest. The total fair value of the equity awards, net of forfeiture, is recorded on a straight-line basis (except for performance based Full Value Awards and options with market conditions which are amortized based upon graded vesting method) over the requisite service periods of the awards, which is generally the vesting period.
Inventory Valuation
We assess the value of our inventory on a quarterly basis and write-down those inventories which are obsolete or in excess of our forecasted usage to their estimated realizable value. Our estimates of realizable value are based upon our analysis and assumptions including, but not limited to, forecasted sales levels by product, expected product lifecycle, product development plans and future demand requirements. Our marketing department plays a key role in our excess review process by providing updated sales forecasts, managing product rollovers and working with manufacturing to maximize recovery of excess inventory. If actual market conditions are less favorable than our forecasts or actual demand from our customers is lower than our estimates, we may be
40
Table of Contents
required to record additional inventory write-downs. If actual market conditions are more favorable than anticipated, inventory previously written down may be sold, resulting in lower cost of sales and higher income from operations than expected in that period.
Goodwill Valuation
We test goodwill for possible impairment on an annual basis in our fourth quarter and at any other time if events occur or circumstances indicate that the carrying amount of goodwill may not be recoverable. Circumstances that could trigger an impairment test include but are not limited to: a significant adverse change in the business climate or legal factors; an adverse action or assessment by a regulator; unanticipated competition; loss of key personnel; the likelihood that a reporting unit or significant portion of a reporting unit will be sold or otherwise disposed; results of testing for recoverability of a significant asset group within a reporting unit; and recognition of a goodwill impairment loss in the financial statements of a subsidiary that is a component of a reporting unit.
Application of the goodwill impairment test requires judgments. They include the identification of the reporting units, assigning assets and liabilities to reporting units, assigning goodwill to reporting units, determining the fair value of each reporting unit, forecasting of future operating results used in the preparation of the estimated future cash flows, including forecasted revenues and costs, timing of overall market growth and our percentage of that market, discount rates and growth rates in terminal values.
Long-lived Asset Valuation (Property, Plant and Equipment and Intangible Assets)
Long-lived assets held and used
We test long-lived assets or asset groups for recoverability when events or changes in circumstances indicate that their carrying amounts may not be recoverable. Circumstances which could trigger a review include, but are not limited to: significant decreases in the market price of the asset; significant adverse changes in the business climate or legal factors; accumulation of costs significantly in excess of the amount originally expected for the acquisition or construction of the asset; current period cash flow or operating losses combined with a history of losses or a forecast of continuing losses associated with the use of the asset; and current expectation that the asset will more likely than not be sold or disposed of significantly before the end of its estimated useful life.
Recoverability is assessed based on the carrying amounts of the asset and its fair value which is generally determined based on the sum of the undiscounted cash flows expected to result from the use and the eventual disposal of the asset, as well as specific appraisals in certain instances. An impairment loss is recognized when the carrying amount is not recoverable and exceeds fair value.
Long-lived assets held for sale
We classify long-lived assets as held for sale when certain criteria are met, including: management’s commitment to a plan to sell the assets; the availability of the assets for immediate sale in their present condition; whether an active program to locate buyers and other actions to sell the assets has been initiated; whether the sale of the assets is probable and their transfer is expected to qualify for recognition as a completed sale within one year; whether the assets are being marketed at reasonable prices in relation to their fair value; and how unlikely it is that significant changes will be made to the plan to sell the assets. Long-lived assets held for sale are classified as other current assets in the Consolidated Balance Sheets.
We measure long-lived assets to be disposed of by sale at the lower of carrying amounts or fair value less cost to sell. Fair value is determined using quoted market prices or the anticipated cash flows discounted at a rate commensurate with the risk involved.
41
Table of Contents
Income Taxes
In accordance with the authoritative guidance on accounting for income taxes, we recognize income taxes using an asset and liability approach. This approach requires the recognition of taxes payable or refundable for the current year and deferred tax liabilities and assets for the future tax consequences of events that have been recognized in our consolidated financial statements or tax returns. The measurement of current and deferred taxes is based on provisions of the enacted tax law and the effects of future changes in tax laws or rates are not anticipated.
The authoritative guidance provides for recognition of deferred tax assets if the realization of such deferred tax assets is more likely than not to occur. With the exception of certain international jurisdictions, we have determined that at this time it is more likely than not that deferred tax assets attributable to the remaining jurisdictions will not be realized, primarily due to uncertainties related to our ability to utilize our net operating loss carryforwards before they expire based on our recent years history of losses. Accordingly, we have established a valuation allowance for such deferred tax assets. If there is a change in our ability to realize our deferred tax assets, then our tax provision may decrease in the period in which we determine that realization is more likely than not.
The authoritative guidance on accounting for uncertainty in income taxes clarifies the accounting for uncertainty in income taxes recognized in an entity's financial statements and prescribes the recognition threshold and measurement attributes for financial statement recognition and measurement of a tax position taken or expected to be taken in a tax return. Additionally, it provides guidance on recognition, classification, and disclosure of tax positions.
We are subject to income tax audits by the respective tax authorities in all of the jurisdictions in which we operate. The determination of tax liabilities in each of these jurisdictions requires the interpretation and application of complex and sometimes uncertain tax laws and regulations. We recognize liabilities based on our estimate of whether, and the extent to which, additional tax liabilities are more likely than not. If we ultimately determine that the payment of such a liability is not necessary, then we reverse the liability and recognize a tax benefit during the period in which the determination is made that the liability is no longer necessary.
The recognition and measurement of current taxes payable or refundable and deferred tax assets and liabilities requires that we make certain estimates and judgments. Changes to these estimates or a change in judgment may have a material impact on our tax provision in a future period.
Warranty Accrual
We provide reserves for the estimated costs of product warranties at the time revenue is recognized. We estimate the costs of our warranty obligations based on our historical experience of known product failure rates, use of materials to repair or replace defective products and service delivery costs incurred in correcting product failures. In addition, from time to time, specific warranty accruals may be made if unforeseen technical problems arise. Should our actual experience relative to these factors differ from our estimates, we may be required to record additional warranty reserves. Alternatively, if we provide more reserves than we need, we may reverse a portion of such provisions in future periods.
Restructuring Accrual
In accordance with authoritative guidance on accounting for costs associated with exit or disposal activities, generally costs associated with restructuring activities are recognized when they are incurred. However, in the case of leases, the expense is estimated and accrued when the property is vacated. Given the significance of, and the timing of the execution of such activities, this process is complex and involves periodic reassessments of estimates made at the time the original decisions were made, including evaluating real estate market conditions
42
Table of Contents
for expected vacancy periods and sub-lease rents. A liability for post-employment benefits for workforce reductions related to restructuring activities is recorded when payment is probable, the amount is reasonably estimable, and the obligation relates to rights that have vested or accumulated. We continually evaluate the adequacy of the remaining liabilities under our restructuring initiatives. Although we believe that these estimates accurately reflect the costs of our restructuring plans, actual results may differ, thereby requiring us to record additional provisions or reverse a portion of such provisions.
Pension and Other Postretirement Benefits
The funded status of our retirement-related benefit plans is recognized in the Consolidated Balance Sheets. The funded status is measured as the difference between the fair value of plan assets and the benefit obligation at fiscal year end, the measurement date. For defined benefit pension plans, the benefit obligation is the projected benefit obligation (“PBO”) and for the nonpension postretirement benefit plan the benefit obligation is the accumulated postretirement benefit obligation (“APBO”). The PBO represents the actuarial present value of benefits expected to be paid upon retirement. The APBO represents the actuarial present value of postretirement benefits attributed to employee services already rendered. The fair value of plan assets represents the current market value of cumulative company contributions made to an irrevocable trust fund, held for the sole benefit of participants, which are invested by the trust fund. Underfunded plans, with the benefit obligation exceeding the fair value of plan assets, are aggregated and recorded as a retirement and nonpension postretirement benefit obligation equal to this excess. The current portion of the retirement-related benefit obligation represents the actuarial present value of benefits payable in the next 12 months in excess of the fair value of plan assets, measured on a plan-by-plan basis. This liability is recorded in other current liabilities in the Consolidated Balance Sheets.
(Gains) losses and prior service cost (credit) not recognized as a component of net periodic pension cost (income) in the Consolidated Statement of Operations as they arise are recognized as a component of accumulated other comprehensive income in the Consolidated Balances Sheets, net of tax. Those (gains) losses and prior service cost (credit) are subsequently recognized as a component of net periodic pension period cost (income) pursuant to the recognition and amortization provisions of applicable accounting standards. (Gains) losses arise as a result of differences between actual experience and assumptions or as a result of changes in actuarial assumptions. Prior service cost (credit) represents the cost of benefit improvements attributable to prior service granted in plan amendments.
Net periodic pension cost (income) is recorded in the Consolidated Statement of Operations and includes service cost, interest cost, expected return on plan assets, amortization of prior service cost and (gains) losses previously recognized as a component of accumulated other comprehensive income. Service cost represents the actuarial present value of participant benefits earned in the current year. Interest cost represents the time value of money cost associated with the passage of time. Certain events, such as changes in employee base, plan amendments and changes in actuarial assumptions, result in a change in the benefit obligation and the corresponding change in other comprehensive income. The result of these events is amortized as a component of net periodic cost (income) over the service lives of the participants, provided such amounts exceed thresholds which are based upon the benefit obligation or the value of plan assets.
The measurement of the benefit obligation and net periodic pension cost (income) is based on our estimates and actuarial valuations provided by third-party actuaries which are approved by our management. These valuations reflect the terms of the plans and use participant-specific information such as compensation, age and years of service, as well as certain assumptions, including estimates of discount rates, expected return on plan assets, rate of compensation increases, and mortality rates. While we believe that our assumptions are appropriate, significant differences in our actual experience or significant changes in our assumptions that may be required under new legislation, or accounting pronouncements, or otherwise may materially affect our pension and other post-retirement obligations and our future expense.
43
Table of Contents
Loss Contingencies
We are subject to the possibility of various loss contingencies arising in the ordinary course of business. We consider the likelihood of loss or impairment of an asset or the incurrence of a liability, as well as our ability to reasonably estimate the amount of loss in determining loss contingencies. An estimated loss is accrued when it is probable that an asset has been impaired or a liability has been incurred and the amount of loss can be reasonably estimated. We regularly evaluate current information available to us to determine whether such accruals should be adjusted and whether new accruals are required.
Out of Period Adjustments
In fiscal 2010, no out of period adjustments were identified or recorded.
In fiscal 2009, we recorded adjustments primarily related to cost of sales, operating expenses, and certain balance sheet accounts. These adjustments resulted in additional net loss of $0.6 million recorded in current fiscal year. As a result of these adjustments, the operating loss for fiscal 2009 increased by $0.6 million. There was no impact on net loss per share in fiscal 2009 from these adjustments.
In fiscal 2008, we recorded adjustments primarily related to revenue, cost of sales, operating expenses, income tax expense, and certain balance sheet accounts. These adjustments resulted in additional net income of $2.1 million recorded in fiscal 2008. As a result of these adjustments, the operating loss for fiscal 2008 decreased by $3.1 million and was partially offset by $1.0 million related to tax provision adjustments. There was a positive impact on net loss of $0.01 per share in fiscal 2008 from these adjustments.
Management and the Audit Committee believe that such amounts are not material to the current and previously reported financial statements.
44
Table of Contents
Results of Operations
The results of operations for the current period are not necessarily indicative of results to be expected for future years. The following table sets forth the components of our Consolidated Statements of Operations as a percentage of net revenue:
| Years Ended | |||||||||
| July 3, 2010 |
June 27, 2009 |
June 28, 2008 |
|||||||
| Net revenue |
100 | % | 100 | % | 100 | % | |||
| Cost of sales |
56 | 58 | 58 | ||||||
| Amortization of acquired technologies |
4 | 4 | 4 | ||||||
| Impairment of acquired developed technologies |
— | — | — | ||||||
| Gross profit |
40 | 38 | 38 | ||||||
| Operating expenses: |
|||||||||
| Research and development |
13 | 13 | 12 | ||||||
| Selling, general and administrative |
28 | 31 | 30 | ||||||
| Amortization of other intangibles |
2 | 2 | 2 | ||||||
| Acquired in-process research and development |
— | — | — | ||||||
| Impairment of goodwill |
— | 58 | 2 | ||||||
| Gain (loss) on disposal and impairment of long-lived assets |
— | 1 | 1 | ||||||
| Restructuring and related charges |
1 | 3 | — | ||||||
| Total operating expenses |
44 | 108 | 47 | ||||||
| Loss from operations |
(4 | ) | (70 | ) | (9 | ) | |||
| Interest and other income (expense), net |
1 | 3 | 8 | ||||||
| Interest expense |
(2 | ) | (2 | ) | (2 | ) | |||
| Impairment of investments |
— | (2 | ) | — | |||||
| Gain on sale of investments |
1 | — | — | ||||||
| Loss from continuing operations before income taxes |
(4 | ) | (71 | ) | (3 | ) | |||
| Provision of (benefit for) income taxes |
— | — | — | ||||||
| Loss from continuing operations, net of tax |
(4 | ) | (71 | ) | (3 | ) | |||
| Loss from discontinued operations, net of tax |
(1 | ) | — | — | |||||
| Net loss |
(5 | )% | (71 | )% | (3 | )% | |||
45
Table of Contents
Financial Data for Fiscal 2010, 2009, and 2008
The following table summarizes selected Consolidated Statement of Operations items (in millions, except for percentages):
| 2010 | 2009 | Change | Percentage Change |
2009 | 2008 | Change | Percentage Change |
|||||||||||||||||||||||
| Net revenue |
$ | 1,363.9 | $ | 1,283.3 | $ | 80.6 | 6 | % | $ | 1,283.3 | $ | 1,512.0 | $ | (228.7 | ) | -15 | % | |||||||||||||
| Gross profit |
547.1 | 486.6 | 60.5 | 12 | % | 486.6 | 579.6 | (93.0 | ) | -16 | % | |||||||||||||||||||
| Percentage of net revenue |
40 | % | 38 | % | 38 | % | 38 | % | ||||||||||||||||||||||
| Research and development |
174.9 | 167.1 | 7.8 | 5 | % | 167.1 | 184.3 | (17.2 | ) | -9 | % | |||||||||||||||||||
| Percentage of net revenue |
13 | % | 13 | % | 13 | % | 12 | % | ||||||||||||||||||||||
| Selling, general and administrative |
382.9 | 399.0 | (16.1 | ) | -4 | % | 399.0 | 449.1 | (50.1 | ) | -11 | % | ||||||||||||||||||
| Percentage of net revenue |
28 | % | 31 | % | 31 | % | 30 | % | ||||||||||||||||||||||
| Amortization of intangibles |
78.4 | 75.9 | 2.5 | 3 | % | 75.9 | 79.3 | (3.4 | ) | -4 | % | |||||||||||||||||||
| Percentage of net revenue |
6 | % | 6 | % | 6 | % | 6 | % | ||||||||||||||||||||||
| Impairment of goodwill |
— | 741.7 | (741.7 | ) | -100 | % | 741.7 | 37.0 | 704.7 | N/A | ||||||||||||||||||||
| Percentage of net revenue |
— | 58 | % | 58 | % | 2 | % | |||||||||||||||||||||||
| Gain (loss) on disposal and impairment of long-lived assets |
(2.0 | ) | 18.1 | (20.1 | ) | -111 | % | 18.1 | 10.7 | 7.4 | 69 | % | ||||||||||||||||||
| Percentage of net revenue |
0 | % | 1 | % | 1 | % | 1 | % | ||||||||||||||||||||||
| Restructuring and related charges |
17.7 | 38.5 | (20.8 | ) | -54 | % | 38.5 | 6.7 | 31.8 | 475 | % | |||||||||||||||||||
| Percentage of net revenue |
1 | % | 3 | % | 3 | % | 0 | % | ||||||||||||||||||||||
Net Revenue
Net revenue in fiscal 2010 increased 6%, or $80.6 million, to $1,363.9 million from $1,283.3 million in fiscal 2009. The increase is primarily due to upturn in the global economy. Communications Test and Measurement revenue increased $48.9 million largely due to the acquisition of SNT in July and NSD in May, contributing $34.4 million and $8.9 million, respectively, in revenue for fiscal 2010. Communications and Commercial Optical Products revenue increased $18.2 million due to a rebound in our Pluggables, High Powered Lasers, Commercial Lasers and Amplifiers product lines Advanced Optical Technologies segment increased $13.5 million due to higher demand for 3D cinema and Currency products, partially offsetting the increase was lower transaction card revenue.
Net revenue in fiscal 2009 decreased 15%, or $228.7 million, to $1,283.3 million from $1,512.0 million in fiscal 2008. The decrease is primarily due to reduced demand in our Communications and Commercial Optical Products and Communications Test and Measurement segments due to the general economic slowdown. Communications and Commercial Optical Products revenue were down $133.0 million as a result of the end of life of some of the low margin product offerings year over year as well as market softness for some of our end of life products, which impacted volume/price or both, and slowness in the system deployments of our customers. Additionally, the decline in the semiconductor market in North America combined with a major reduction in volume from a key customer in Asia in the second half of fiscal 2009, and bankruptcy of a major North American customer further reduced year over year revenues. Revenue in our Communications Test and Measurement segment decreased $97.6 million compared to prior year, primarily driven by budget freeze and decreased capital spending from key customers as a result of the general economic slowdown. Revenue in our Advanced Optical
46
Table of Contents
Technologies segment increased $1.9 million compared to prior year resulting from the acquisition of ABNH during the previous fiscal year. This increase was partially offset by decreases in demand for certain other products due to reduction in new currency roll outs and the decline in credit card issuances experienced in fiscal 2009.
Going forward, we expect to continue to encounter a number of industry and market structural risks and uncertainties that will affect our business climate and market visibility, and consequently, our ability to predict future revenue, profitability and general financial performance, and that could create quarter over quarter variability in one or more of our financial measures. These structural risks and uncertainties include: (a) continuing general limited visibility across many of our product lines exacerbated by the current credit and financial market uncertainty, as well as the migration to vendor managed inventory programs; (b) quarter-over-quarter product mix fluctuations, which can materially impact profitability measures due to the broad gross margin range across our portfolio; (c) consolidation of our customer base, which, in the shorter term limits demand visibility, and, in the longer term, could reduce our business potential; (d) average selling prices continue to decline across our businesses; (e) our Communications Test and Measurement business is notable for seasonality and a significant level of in-quarter book-and-ship business, further limiting our forecasting abilities; (f) we are currently engaged in various product and manufacturing transfers, site consolidations and product discontinuances, which has caused and may cause short term disruptions; and (g) the ability of our suppliers and contract manufacturers to meet production and delivery requirements to our forecasted demand.
Our program of North American assembly manufacturing transitions will continue, but until completed, these activities will continue to present additional supply chain and product delivery disruption risks, yield and quality concerns and increased cost risks. These risks, while expected to diminish over the next several quarters, also currently limit our ability to predict future revenue, profitability and general financial performance.
We operate primarily in three geographic regions: Americas, Europe and Asia. The following table presents net revenue by geographic regions (in millions):
| Years Ended | |||||||||
| July 3, 2010 |
June 27, 2009 |
June 28, 2008 | |||||||
| Net revenue: |
|||||||||
| Americas |
$ | 662.0 | $ | 580.5 | $ | 785.0 | |||
| Europe |
374.6 | 402.1 | 436.0 | ||||||
| Asia-Pacific |
327.3 | 300.7 | 291.0 | ||||||
| Total net revenue |
$ | 1,363.9 | $ | 1,283.3 | $ | 1,512.0 | |||
Net revenue from customers outside the Americas represented 51%, 55%, and 48% of net revenue for the fiscal years ended 2010, 2009, and 2008, respectively. Net revenue was assigned to geographic regions based on the customers’ shipment locations. We expect revenue from international customers to continue to be an important part of our overall net revenue and an increasing focus for net revenue growth.
During fiscal 2010, 2009, and 2008, no one single customer accounted for more than 10% of net revenue.
Gross Profit
Gross profit in fiscal 2010 increased 12%, or $60.5 million, to $547.1 million from $486.6 million in fiscal 2009. As a percentage of revenue, gross profit increased by 2% to 40% from 38% in fiscal 2009. The increase is primarily came from our Communications and Commercial Optical Productions as a result of cost reductions and containment, increased absorption and product mix improvement within the segment. The increase is partially offset by the decrease in gross margin in the Communications Test and Measurement segment, primarily due to product mix and overall pricing pressure on large strategic transactions.
47
Table of Contents
Gross profit in fiscal 2009 decreased 16%, or $93.0 million, to $486.6 million from $579.6 million in fiscal 2008. As a percentage of revenue, gross profit remained consistent at 38%. The decrease is primarily due to reduced demand in our Communications and Commercial Optical Products and Communications Test and Measurement segments due to the general economic slowdown, although we have been largely able to maintain our margin percentage due to a focus on higher margin products, cost containment, and the end of life of less profitable product lines. Gross profit in our Advanced Optical Technologies segment increased resulting from the acquisition of ABNH during last fiscal year and lower depreciation expense and manufacturing spending. This increase was partially offset by the general economic slowdown.
As discussed in more detail under “Net Revenue” above, we sell products in certain markets that are consolidating, undergoing product, architectural and business model transitions, have high customer concentrations, are highly competitive, are price sensitive and are affected by customer seasonal and mix variant buying patterns. These factors along with our continuing ongoing product and manufacturing transitions, certain suppliers’ constraints, and factory utilization and execution issues, and certain geographic risks, could have an impact, resulting in quarterly variability of our gross profit.
In addition to the risks and uncertainties discussed under “Net Revenue” above, we face additional risks and uncertainties, associated with new product introductions that could impair future gross profits. New product programs and introductions, which due to their large scale restricted field testing and lack of production manufacturers with their increased complexity, have incurred and are expected to continue to incur relatively higher start-up costs and increased yield and product quality risk. Issues associated with some of these products have negatively impacted and could continue to negatively impact our gross profit.
Research and Development (“R&D”)
R&D expense in fiscal 2010 increased 5%, or $7.8 million, to $174.9 million from $167.1 million in fiscal 2009. The increase is primarily a result of higher labor and benefits costs due to fewer shutdowns and increased bonuses. Additionally, R&D headcount increased through the acquisition of SNT and NSD in the current year. Total R&D headcount increased from 949 in fiscal 2009 to 1,348 in fiscal 2010. As a percentage of revenue, R&D expense remained at 13% in both fiscal 2009 and 2010.
R&D expense in fiscal 2009 decreased 9%, or $17.2 million, to $167.1 million from $184.3 million in fiscal 2008. The decrease is primarily as a result of cost reduction initiatives implemented, with the majority concentrated in North America and Europe, to align expense levels to the reduced demand levels due to economic slowdown, offset by increased investment in the Authentication Solutions business unit. As a percentage of revenue, R&D expense increased from 12% in fiscal 2008 to 13% in fiscal 2009.
We believe that investments in R&D are critical to attaining our strategic objectives. Historically, we have devoted significant engineering resources to assist with production, quality and delivery challenges which can impact our new product development activities. Despite our continued efforts to reduce total operating expenses, there can be no assurance that our R&D expenses will continue to remain at the current level. In addition, there can be no assurance that such expenditures will be successful or that improved processes or commercial products, at acceptable volumes and pricing, will result from our investment in R&D.
Selling, General and Administrative (“SG&A”)
SG&A expense in fiscal 2010 decreased 4%, or $16.1 million, to $382.9 million from $399.0 million in fiscal 2009. The decrease is primarily due to cost reduction initiatives across the Company that were implemented in late 2009 but took full effect in fiscal 2010. These initiatives included reductions in consulting, headcount, recruitment and other outside services. The reductions in costs from these initiatives were partially offset by an increase in performance based employee compensation, which was implemented again in fiscal 2010. As a percentage of revenue, SG&A expenses decreased from 31% in fiscal 2009 to 28% in fiscal 2010.
48
Table of Contents
SG&A expense in fiscal 2009 decreased 11%, or $50.1 million, to $399.0 million from $449.1 million in the fiscal 2008. The decrease is primarily due to decreased selling expense resulting from the reduced revenues. Further decreases resulted from cost reduction initiatives across the Company, including reductions in consulting, performance based employee compensation, 14% decrease in headcount, recruitment and other outside services, offset by upgrades to the company’s ERP system. Also, fiscal 2008 included the one-time expense related to legal settlement with Northrop Grumman Guidance and Electronics Company (previously named Litton Systems, Inc.) totalling $20 million. As a percentage of revenue, SG&A expenses increased from 30% in fiscal 2008 to 31% in fiscal 2009.
We intend to continue to aggressively address our SG&A expenses and reduce these expenses as and when opportunities are identified. We have, in the recent past, experienced and expect to continue to experience in the future, certain non-core expenses, such as litigation and dispute related settlements and expenses, as well as mergers and acquisitions related expenses, which could increase our SG&A expenses, and impair our profitability, in any particular quarter. We are also increasing SG&A expenses in the near term to complete the integration of recent acquisitions, particularly with respect to business infrastructure and systems matters. None of these non-core expenses, however, is expected to have a material adverse impact on our financial condition. There can be no assurance that our SG&A expense will decline in the future or that, more importantly, we will develop a cost structure (including our SG&A expense), which will result in profitability under current and expected revenue levels.
Amortization of Other Intangibles
Amortization of other intangibles for fiscal year 2010 increased 3%, or $2.5 million, to $78.4 million from $75.9 million in fiscal 2009.
Amortization of other intangibles for fiscal 2009 decreased 4%, or $3.4 million, to $75.9 million from $79.3 million in the fiscal 2008.
The other intangibles balance is adjusted quarterly to record the effect of currency translation adjustments.
Acquired In-Process Research and Development (“IPR&D”)
In accordance with authoritative guidance, we recognize IPR&D at fair value as of the acquisition date, and subsequently account for it as an indefinite-lived intangible asset until completion or abandonment of the associated research and development efforts. During fiscal 2010, we acquired IPR&D through the acquisitions of SNT and NSD. Please refer to “Note 4. Mergers and Acquisitions” for further details.
We did not incur material IPR&D costs in fiscal 2009 and 2008.
Impairment of Goodwill
We test for impairment of goodwill on an annual basis in the fourth quarter and at any other time if events occur or circumstances indicate that the carrying amount of goodwill may not be recoverable.
In fiscal 2010, we performed our annual impairment analysis noting the fair value of each reporting unit was significantly above its carrying amount. As a result, we did not record any impairment charges. Refer to “Note 8. Goodwill” for further details.
In fiscal 2009, due to the impact of weakening market conditions on our forecasts and a sustained, significant decline in our market capitalization, we recorded a $741.7 million goodwill impairment affecting all reporting units except for the Flex Product Group (“Flex”). The total impairment of $741.7 million consisted of $448.2 million related to the da Vinci reporting unit (“da Vinci”) and Communications Test and Measurement
49
Table of Contents
reporting unit (“CommTest”) within the Communications Test and Measurement segment, $233.5 million related to the Communications and Commercial Optical Products reporting unit (“CCOP”) within the CCOP segment, $39.1 million related to the Authentication Solution Group (“ASG”) reporting unit within the Advanced Optical Technologies segment (“AOT”), and $20.9 million related to the Custom Optics Product Group reporting unit (“COPG”) within the AOT segment. See “Note 8. Goodwill” of our Notes to Consolidated Financial Statements.
In fiscal 2008, we recorded a $24.5 million goodwill impairment related to the Authentication Solution Group (“ASG”) (formerly ABNH, the business we acquired in February 2008) reporting unit within the Advanced Optical Technologies segment and a $12.5 million goodwill impairment related to the da Vinci reporting unit within the Communications Test and Measurement segment. The impairment for the ASG was the result of lower than expected demand for transaction card products due to trouble in the U.S. Banking industry. The impairment for da Vinci was the result of delayed product introduction and acceptance of next generation color and image enhancement products. As part of our annual impairment analysis as of May 1, 2008, under the first step of the authoritative accounting guidance, the fair value of ASG and da Vinci was determined. Based on that analysis, we concluded that the carrying amounts of ASG and da Vinci exceeded their fair value. We performed the second step analysis to determine the amount of goodwill impairment.
(Gain) Loss on Disposal and Impairment of Long-Lived Assets
During fiscal 2010, 2009 and 2008, we recorded ($2.0) million, $18.1 million and $10.7 million, respectively, of (gain) loss on disposal and impairments in the carrying value of our long-lived assets in accordance with the authoritative accounting guidance regarding impairment or disposal of long-lived assets.
The following table summarizes the components of the impairment of intangibles and gain/loss on long-lived assets (in millions):
| Years Ended | ||||||||||||
| July 3, 2010 |
June 27, 2009 |
June 28, 2008 |
||||||||||
| (Gain) Loss on Disposal and Impairment of Long-Lived Assets: |
||||||||||||
| Assets held and used |
$ | — | $ | 7.7 | $ | 8.8 | ||||||
| Assets held for sale |
— | 7.4 | — | |||||||||
| (Gain) loss on the sale of assets |
(0.1 | ) | (1.2 | ) | (1.4 | ) | ||||||
| Long-lived assets to be disposed of other than sale |
(1.9 | ) | 4.2 | 3.3 | ||||||||
| Total (gain) loss on disposal and impairment of long-lived assets |
$ | (2.0 | ) | $ | 18.1 | $ | 10.7 | |||||
Fiscal 2010
Sale of Assets:
During fiscal 2010, we recorded a gain of $0.1 million for the sale of assets.
Asset Disposal Other than Sale:
During fiscal 2010, we recorded a gain of $1.9 million for the disposal of assets other than sale primarily related to cash receipts from Sanmina-SCI on leasehold improvements related to the sale of Shenzhen facilities in fiscal 2009 that had previously been written-off, partially offset by accelerated depreciation.
Fiscal 2009
Assets Held and Used:
During fiscal 2009, we recorded an impairment charge of $7.7 million for certain intangible assets related to our da Vinci business due to weakening market conditions. Out of this total, $4.9 million and $2.8 million were recorded in cost of sale and operating expenses, respectively.
50
Table of Contents
Assets Held for Sale:
In February 2009 we entered into a definitive agreement to sell certain assets and liabilities related to manufacturing operations in Shenzhen, China (the “Disposal group”) to Sanmina-SCI and one of its subsidiaries (“the Buyer”). The related sale closed in the fourth quarter of fiscal 2009 on March 29, 2009. The Disposal group was historically part of the Communication and Commercial Optical Products Segment. Concurrently, the Company entered into an agreement where the Buyer would manufacture and supply certain of the Company’s products.
The Company recorded a loss of $7.4 million in connection with the sale of Shenzhen facilities in fiscal 2009. The loss was calculated as follows (in millions):
| Gross proceeds |
$ | 30.0 | ||
| Less: adjustment for inter-company payment |
(5.4 | ) | ||
| Less: carrying value of assets |
(30.8 | ) | ||
| Less selling costs |
(1.2 | ) | ||
| Loss |
$ | (7.4 | ) | |
The loss is recorded in the Consolidated Statements of Operations as a component of Loss and impairment of long-lived assets.
Sale of Assets:
During fiscal 2009, we recorded a gain of $1.2 million for the sale of assets.
Asset Disposal Other than Sale:
During fiscal 2009, we recorded a charge of $4.2 million for the disposal of assets other than sale primarily related to accelerated depreciation of Micralyne, Louisville, and Picolight sites.
Fiscal 2008
Assets Held and Used
During fiscal 2008, we recorded an impairment charge of $0.4 million for certain assets related to the Company’s Santa Rosa, California facility and in the fourth quarter recorded impairment charges of $8.4 million for certain intangible assets related to its da Vinci business. Out of this total, $4.0 million and $4.4 million were recorded in cost of sale and operating expenses, respectively.
Sale of Assets
During fiscal 2008, we recorded a gain of $1.4 million for the sale and disposal of assets.
Assets to be Disposed of Other Than Sale
During fiscal 2008, we recorded a loss of $3.3 million for the disposal of assets related to Singapore and Ottawa facilities.
51
Table of Contents
Restructuring and Related Charges
We continue to take advantage of opportunities to further reduce costs through targeted restructuring events intended to consolidate and rationalize the manufacturing of our products based on core competencies and cost efficiencies, together with the need to align the business in response to the market conditions. We expect to recognize estimated annual cost savings of $28.8 million in fiscal 2011 as a result of the restructuring activities. See “Note 12. Restructuring and Related Charges” for more detail.
During fiscal 2010, we recorded $17.7 million in restructuring and related charges. The charges were primarily a result of the following: (i) $7.1 million for severance and benefits primarily in the Communications Test and Measurement segment which relates to the sale of certain non-core assets, the expansion of the Europe, Middle East, and Africa (“EMEA”) sales force from a primarily direct customer-only team to include a channel partners-oriented sales force, and the implementation of the EMEA early retirement program. We expect these activities to be completed by the fourth quarter of fiscal 2012. We also restructured and reorganized our Communications Test and Measurement segment to improve the efficiency of the research and development organization by reducing/rationalizing headcount, transitioning research and development investment to lower cost locations, and consolidating and centralizing similar functions to fewer sites designed to improve leverage. These activities were completed by the end of the fourth quarter of fiscal 2010; (ii) $8.5 million for manufacturing transfer cost primarily in the Communications and Commercial Optical Products segment, which were the result of a production site closure in California, the consolidation of Lasers manufacturing operations at a contract manufacturer in Asia, the transfer of certain production processes into existing sites in California, and the reduction in force of our manufacturing support organization across all sites. We completed these activities by the end of the third quarter of fiscal 2010; and (iii) $2.1 million for charges for restructured leases primarily in the Communications Test and Measurement segment, which were the result of our continued efforts to reduce and consolidate manufacturing locations. We reduced our total headcount by 129 employees, comprised of 43 in manufacturing, 43 in research and development, and 43 in selling, general and administrative functions. Of these notified employees, 107 were located in North America, 12 were located in Europe, three were located in Latin America, and seven were located in Asia. As of July 3, 2010, 111 of these employees have been terminated. Payments related to severance and benefits are expected to be paid by the first quarter of fiscal 2011. Payments related to lease costs are expected to be paid by the second quarter of 2014.
During fiscal 2009, we recorded $38.5 million in restructuring and related charges. The charges were primarily a result of the following: (i) $25.9 million for severance and benefits primarily in the Communications Test and Measurement and the Communications and Commercial Optical Product segment. The Communications Test and Measurement segment restructured and reorganized to improve the efficiency of the research and development organization. The strategy included reducing/rationalizing headcount, transitioning research and development investment to lower cost locations, and consolidating and centralizing similar functions to fewer sites designed to improve leverage. We completed these activities by the end of the fourth quarter of fiscal 2010. Additionally, we implemented a restructuring plan for our Germany site to significantly change the overall cost structure and complexity of the site, and to align the cost of the site more with market demand. Activities included outsourcing of manufacturing to a contract manufacturer and other initiatives to reduce the overall complexity of processes and the organization. We expect these activities to be completed by the end of the second quarter of fiscal 2012. The Communications and Commercial Optical Products segment outsourced its manufacturing capability at the Shenzhen facility to Sanmina-SCI, which was completed in the third quarter of fiscal 2009; (ii) $7.9 million for manufacturing transfer costs primarily in the Communications and Commercial Optical Products segment, which were the result of simplifying our operating model by reducing its manufacturing costs. A majority of these charges were due to (a) the closure of sites in Colorado and California and the related transfer of certain production processes into existing sites in California, which we completed by the end of the fourth quarter of fiscal 2010, (b) the transition of our North American manufacturing to Asia related to certain products, which we expect to complete by the end of the first quarter of fiscal 2011, and (c) the consolidation and relocation of a portion of its Lasers manufacturing operations to a contract manufacturer, which we completed by the end of the second quarter of fiscal 2010; and (iii) $4.7 million for lease costs primarily in the Communications Test and Measurement segment as we vacated the office space to reduce operating costs and improve synergies by consolidating the
52
Table of Contents
operations into the existing Ottawa, Canada site. We reduced our total headcount by 2,814 employees, comprised of 2,453 in manufacturing, 130 in research and development, and 231 in selling, general and administrative functions. Of these notified employees, 602 were located in North America, 109 were located in Europe, and 2,103 were located in Asia. As of July 3, 2010, 2,727 of these employees have been terminated. Payments related to severance and benefits are expected to be paid by the third quarter of fiscal 2016. Payments related to lease costs are expected to be paid by the fourth quarter of 2014.
During fiscal 2008, we recorded $6.7 million in restructuring and related charges. The charges were primarily a result of the following: (i) $6.2 million for severance and benefits primarily in the Communications Test and Measurement segment, which were the result of a reduction in labor force to better streamline the segment and to scale the business to a lower expense level to improve profitability. We completed these activities by the end of the fourth quarter of fiscal 2010; (ii) $0.2 million for manufacturing transfer cost primarily in the Communications and Commercial Optical Products segment, which were the result of a reduction in force in the Lasers Sales and Marketing organization initiated in the second fiscal quarter of 2008 and completed in the third quarter of fiscal 2008 and a reduction in force in our manufacturing operations organization related to obsolescing certain low margin product offerings initiated in the first quarter of fiscal 2008 and completed in the third quarter of fiscal 2008; and (iii) $0.3 million for lease costs for additional restructured space primarily in the Communications and Commercial Optical Products segment related to the consolidation of research & development space at our Colorado site initiated and completed in the fourth quarter of fiscal 2008. We reduced our headcount by 159 employees, comprised of 95 in manufacturing, 25 in research and development, and 39 in selling, general and administrative functions. Of these notified employees, 114 were located in North America, 15 were located in Europe, 1 was located in Latin America, and 29 were located in Asia. As of July 3, 2010, 149 of these employees have been terminated. Payments related to severance and benefits are expected to be paid by the third quarter of fiscal 2013 and payments related to lease costs are expected to be paid by the fourth quarter of fiscal 2012. In addition during fiscal 2008, the Company also recorded a lease exit charge, net of assumed sub-lease income, of $5.4 million related to the Ottawa facility that was included in selling, general and administrative expenses. The payments related to these lease costs are expected to be paid by the third quarter of fiscal 2018.
Our ability to generate sublease income, as well as our ability to terminate lease obligations at the amounts estimated, is highly dependent upon the economic conditions, particularly commercial real estate market conditions in certain geographies, at the time we negotiate the lease termination and sublease arrangements with third parties as well as the performances by such third parties of their respective obligations. While the amount we have accrued represents the best estimate of the remaining obligations we expect to incur in connection with these plans, estimates are subject to change. Routine adjustments are required and may be required in the future as conditions and facts change through the implementation period. Our restructuring obligations are net of sublease income or lease settlement estimates of approximately $5.1 million. If adverse macroeconomic conditions continue, particularly as they pertain to the commercial real estate market, or if, for any reason, tenants under subleases fail to perform their obligations, we may be required to reduce estimated future sublease income and adjust the estimated amounts of future settlement agreements, and accordingly, increase estimated cost to exit certain facilities. Amounts related to the lease expense, net of anticipated sublease proceeds, will be paid over the respective lease terms through fiscal 2018.
Interest and Other Income (Expense), Net
During fiscal 2010, interest and other income (expense), net decreased by $23.9 million, from $33.5 million in fiscal 2009 to $9.6 million in fiscal 2010. The decrease primarily relates to the gain on repurchase and redemption of Convertible Debt of $17.0 million recognized in fiscal 2009. Additionally, interest income was $6.3 million, a decrease of $12.7 million from $19.0 million compared to the same period a year ago resulting from lower average cash balances and lower interest rates in the current period. The decrease is partially offset by $3.4 million of gains recorded in fiscal 2010 related to the distribution of proceeds from a class action settlement with Nortel compared to none in fiscal 2009.
53
Table of Contents
During fiscal 2009, interest and other income (expense), net decreased by $86.6 million, from $120.1 million in fiscal 2008 to $33.5 million in fiscal 2009. The decrease was primarily due to gains related to the distribution of proceeds from a class action settlement with Nortel of $61.6 million in fiscal 2008 compared to none in fiscal 2009, and the reduction in interest income of $29.1 million due to lower interest rates and lower invested cash balances in fiscal 2009; partially offset by an increase in gains on repurchase and redemption of Convertible Debt of $5.9 million. See “Note 5. Balance sheet and Other Details” for more information.
Interest Expense
During fiscal 2010, interest expense decreased by $1.2 million, from $25.5 million in fiscal 2009 to $24.3 million in fiscal 2010. The decrease was primarily due to decreased amortization of the Zero and 1% coupon convertible notes resulting from previous buybacks.
During fiscal 2009, interest expense decreased by $1.9 million, from $27.4 million in fiscal 2008 to $25.5 million in fiscal 2009. The decrease was primarily due to decreased amortization of the Zero and 1% coupon convertible notes resulting from the buybacks during fiscal 2009.
Impairment of Investments
During fiscal 2010, we recorded an impairment charge of investments of $1.4 million. During fiscal 2009, we recorded an impairment charge of investments of $18.4 million, primarily due to the impairment of $13.0 million recorded in the second quarter of fiscal 2009 related to a long-term equity investment due to the significant weakening in market conditions at that time.
In April 2009, the existing authoritative guidance on determining whether impairment for investments in debt securities is other-than-temporary was amended. Effective in the fourth quarter of fiscal 2009, if a debt security’s market value is below amortized cost and the Company either intends to sell the security or it is more likely than not that the Company will be required to sell the security before its anticipated recovery, the Company records an other-than-temporary impairment charge to investment income (loss) for the entire amount of the impairment. For the remaining debt securities, if an other-than-temporary impairment exists, the Company separates the other-than-temporary impairment into the portion of the loss related to credit factors, or the credit loss portion, and the portion of the loss that is not related to credit factors, or the noncredit loss portion. The credit loss portion is the difference between the amortized cost of the security and the Company’s best estimate of the present value of the cash flows expected to be collected from the debt security. The noncredit loss portion is the residual amount of the other-than-temporary impairment. The credit loss portion is recorded as a charge to earnings (loss), and the noncredit loss portion is recorded as a separate component of other comprehensive income (loss). Prior to the fourth quarter of fiscal 2009, the entire other-than-temporary impairment charge was recognized in earnings (loss) for all debt securities.
When calculating the present value of expected cash flows to determine the credit loss portion of the other-than-temporary impairment, the Company estimates the amount and timing of projected cash flows, the probability of default and the timing and amount of recoveries on a security-by-security basis. These calculations use inputs primarily based on observable market data, such as credit default swap spreads, historical default and recovery statistics, rating agency data, credit ratings and other data relevant to analyzing the collectability of the security. The amortized cost basis of a debt security is adjusted for any credit loss portion of the impairment recorded to earnings.
As a result of our adoption of the aforementioned amended authoritative guidance in the fourth quarter of fiscal 2009, we reviewed all debt securities and all the conditions described above did not exist, except for one of the debt securities. As a result, we recorded a one-time adjustment to reclassify the $1.3 million non-credit portion of the $2.2 million other-than-temporary impairment loss recognized in the previous period related to one of its securities from accumulated deficit to accumulated other comprehensive income.
54
Table of Contents
Gain on Sale of Investments
During fiscal 2010, we recorded net gains on sale of investments of $13.3 million, primarily due to the sale of 1,606,850 shares of common stock in Fabrinet Inc. (“Fabrinet”), in connection with their initial public offering, receiving net proceeds of $14.9 million or $9.30 per share, after deduction of 7% of underwriting fees, on June 30, 2010. These shares of common stock had a carrying value of $1.00 per share. As of July 3, 2010, we still owned 393,150 shares of Fabrinet’s common stock that was previously reported as a long-term investment at a carrying cost of $1.00 per share. Since our management subsequently sold the remaining shares in the first quarter of fiscal 2011, we reported the investment in Fabrinet as a short-term available-for-sale investment held at a fair value of $10.76 per share as of July 3, 2010 and recorded an unrealized gain of approximately $3.8 million in accumulated other comprehensive income.
During fiscal 2009, we recorded net gains on sale of investments of $1.8 million. The fair value of our marketable equity securities at June 27, 2009 was zero. See “Note 7. Investments” for more details.
Provision (Benefit) for Income Tax
Fiscal 2010 Tax Expense
We recorded an income tax expense of $2.5 million for fiscal 2010. The expected tax benefit derived by applying the federal statutory rate to our loss before income taxes for fiscal 2010 differed from the income tax expense recorded primarily due to a net increase in our valuation allowance related to the increase in domestic and foreign tax net operating losses sustained during the fiscal year.
Based on a jurisdiction by jurisdiction review of anticipated future income and due to the continued economic uncertainty in the industry, management has determined that in most of our jurisdictions, it is more likely than not that our net deferred tax assets will not be realized in those jurisdictions. During fiscal 2010, the valuation allowance for deferred tax assets increased by $26.0 million. The increase was primarily due to domestic and foreign tax net operating losses sustained during the fiscal year, offset by utilization and expiration of domestic and foreign net operating losses.
We are currently subject to various federal, state and foreign audits by taxing authorities. We believe that adequate amounts have been provided for any adjustments that may result from these examinations.
Fiscal 2009 Tax Expense
We recorded an income tax benefit of $2.3 million for fiscal 2009. The expected tax benefit derived by applying the federal statutory rate to our loss before income taxes for fiscal 2009 differed from the income tax benefit recorded primarily due to non-deductible acquisition-related goodwill charges, the federal enactment of the refundable research credit, and a net increase in our valuation allowance related to the increase in domestic and foreign tax net operating losses sustained during the fiscal year.
During fiscal 2009, Congress enacted the Housing Assistance Tax Act of 2008, which was signed by the President on July 30, 2008, and extended by the American Recovery and Reinvestment Act of 2009, which was signed by the President on February 17, 2009. The Act provides that a taxpayer may elect to forego bonus depreciation on certain additions of qualified eligible property purchased and placed in service between April 1, 2008 and December 31, 2009 and, in turn, claim a refundable credit for a portion of its unused AMT and research credits. We recognized a tax benefit of $5.5 million in fiscal 2009 attributable to the utilization of our refundable research credits.
Based on a jurisdiction by jurisdiction review of anticipated future income and due to the continued economic uncertainty in the industry, management has determined that in most of our jurisdictions it is more likely than not that our net deferred tax assets will not be realized in those jurisdictions. During fiscal 2009, the
55
Table of Contents
valuation allowance for deferred tax assets increased by $24.1 million. The increase was primarily due to domestic and foreign tax net operating losses sustained during the fiscal year, offset by utilization and expiration of domestic and foreign net operating losses.
We are currently subject to various federal, state and foreign audits by taxing authorities. We believe that adequate amounts have been provided for any adjustments that may result from these examinations.
Fiscal 2008 Tax Expense
We recorded an income tax expense of $2.4 million for fiscal 2008. The expected tax benefit derived by applying the federal statutory rate to our loss before income taxes for fiscal 2008 differed from the income tax expense recorded primarily due to non-deductible acquisition-related charges, a net increase in our valuation allowance related to the increase in domestic and foreign tax net operating losses sustained during the fiscal year, the recognition of $8.7 million of uncertain tax benefits relating to the expiration of a statute of limitations in a non-U.S. jurisdiction, establishment of a valuation allowance against $2.7 million of deferred tax assets in a foreign jurisdiction, and the recognition a net $1.0 million of foreign jurisdiction research tax credits. Also, we received a favorable IRS ruling to treat one of our subsidiaries as a disregarded entity which resulted in the recognition of a $1.3 million tax benefit.
During fiscal 2008, China adopted transitional rules regarding the 2007 Unified Enterprise Income Tax Law which took effect on January 1, 2008. Pursuant to the transitional rules of the new law, an 18% statutory tax rate applies for the 2008 calendar year and increases each year until calendar year 2012 when it reaches a 25% statutory rate. The measurement of our deferred taxes in China has been calculated taking into account the new transition rules.
Based on a jurisdiction by jurisdiction review of anticipated future income and due to the continued economic uncertainty in the industry, management has determined that in most of our jurisdictions it is more likely than not that our net deferred tax assets will not be realized and we have recorded deferred tax assets as of June 28, 2008 only to the extent of certain offsetting deferred tax liabilities in those jurisdictions. During fiscal 2008, the valuation allowance for deferred tax assets decreased by $25.4 million. The decrease was primarily due to increase to deferred tax liabilities resulting from acquired intangibles. The decrease was partially offset by the increase domestic and foreign tax net operating losses sustained during the fiscal year.
We are currently subject to various federal, state and foreign audits by taxing authorities. We believe that adequate amounts have been provided for any adjustments that may result from these examinations.
Discontinued Operations
On September 4, 2009, we sold certain non-core assets related to our wholly owned subsidiary da Vinci Systems LLC (“da Vinci”). Da Vinci represented a separate component of the Communications Test and Measurement segment and is considered as discontinued operations for financial reporting purposes. The sale generated total gross proceeds of $2.5 million and a gain of $0.2 million, which was recognized in the first fiscal quarter of 2010. We transferred net liabilities of $0.1 million, which comprised of $1.0 million in net property plant and equipment, $1.0 million in deferred revenue, and $0.1 million in warranty reserve. Net revenue for fiscal 2010, 2009, and 2008 were $0.8 million, $11.1 million, and $18.1 million, respectively. Net loss for fiscal 2010 was $(2.3) million, primarily due to inventory write-downs. Net loss for fiscal 2009 was ($3.3) million. Net income for fiscal 2008 was $1.2 million. Total loss from discontinued operations for fiscal 2010 and 2009 were ($2.1) million and ($3.3) million, respectively. Total gain from discontinued operations fiscal 2008 was $1.2 million. There is no tax effect associated with this transaction.
56
Table of Contents
Operating Segment Information (dollars in millions)
| 2010 | 2009 | Change | Percentage Change |
2009 | 2008 | Change | Percentage Change |
|||||||||||||||||||||
| Communications Test and |
||||||||||||||||||||||||||||
| Net Revenue |
$ | 642.7 | $ | 593.8 | $ | 48.9 | 8 | % | $ | 593.8 | $ | 691.4 | $ | (97.6 | ) | -14 | % | |||||||||||
| Operating income |
81.5 | 86.4 | (4.9 | ) | -6 | % | 86.4 | 116.0 | (29.6 | ) | -26 | % | ||||||||||||||||
| Communications and |
||||||||||||||||||||||||||||
| Net Revenue |
499.3 | 481.1 | 18.2 | 4 | % | 481.1 | 614.1 | (133.0 | ) | -22 | % | |||||||||||||||||
| Operating income (loss) |
33.4 | (8.6 | ) | 42.0 | N/A | (8.6 | ) | 20.3 | (28.9 | ) | -142 | % | ||||||||||||||||
| Advanced Optical Technologies |
||||||||||||||||||||||||||||
| Net Revenue |
221.9 | 208.4 | 13.5 | 6 | % | 208.4 | 206.5 | 1.9 | 1 | % | ||||||||||||||||||
| Operating income |
82.5 | 80.3 | 2.2 | 3 | % | 80.3 | 76.8 | 3.5 | 5 | % | ||||||||||||||||||
Communications Test and Measurement:
The increase in Communications Test and Measurement net revenue between fiscal 2010 and fiscal 2009 was mainly related to the SNT and NSD acquisitions, which contributed $34.4 million and $8.9 million, respectively, to revenue in fiscal 2010, combined with improvement in macro-economic conditions during the second half of year. Operating income increased due to increased revenue from the acquisitions and continued focus on expense management.
The decrease in Communications Test and Measurement net revenue between fiscal 2009 and fiscal 2008 was mainly related to reduced sales as a result of the general economic slowdown. Operating income decreased due to reduced gross profits resulting from the reduced revenues, partially offset by decreased operating expense from sales commissions on lower bookings and continued efforts to manage our operating expense levels.
Communications and Commercial Optical Products:
The increase in CCOP net revenue between fiscal 2010 and 2009 was due to a rebound in our ROADMs, Pluggables, High Powered Lasers, Commercial Lasers and Amplifiers product lines. Operating income increased year over year due in large part to lower infrastructure costs as the result of the numerous restructuring activities that were initiated in fiscal 2009 that took full effect in fiscal 2010, as well the effects of moving to the contract manufacturing model for the full year.
The decrease in CCOP net revenue between fiscal 2009 and fiscal 2008 was mainly related to reduced sales as a result of the general economic slowdown. Operating income decreased due to reduced gross profits resulting from the reduced revenues, partially offset by decreased operating expense from sales commissions on lower bookings and continued efforts to manage our operating expense levels.
Advanced Optical Technologies:
The increase in Advanced Optical Technologies net revenue between fiscal 2010 and fiscal 2009 was primarily due to greater demand in Currency, 3D and Office Automation product markets. Operating income improved as a result of higher revenue and gross profit which was partially offset by increased operating expenses.
The increase in Advanced Optical Technologies net revenue between fiscal 2009 and fiscal 2008 was primarily due to the acquisition of ABNH in the last fiscal year, offset by reduced sales in the other business units. The increase in operating income for Advanced Optical Technologies reflects increased revenue and successful cost reduction initiatives.
57
Table of Contents
Liquidity and Capital Resources
Our investments of surplus cash are made in accordance with an investment policy approved by the Audit Committee of our Board of Directors. In general, our investment policy requires that securities purchased be rated A-1/P-1, A/A2 or better. Securities that are downgraded subsequent to purchase are evaluated and may be sold or held at management’s discretion. No security may have an effective maturity that exceeds 37 months, and the average duration of our holdings may not exceed 18 months. At any time, no more than 5% of the investment portfolio may be concentrated in a single issuer other than the U.S. government or U.S. agencies. Our investments in debt securities and marketable equity securities are primarily classified as available-for-sale investments or trading securities and are recorded at fair value. The cost of securities sold is based on the specific identification method. Unrealized gains and losses on available-for-sale investments are reported as a separate component of stockholders’ equity. We did not hold any investments in auction rate securities, mortgage backed securities, collateralized debt obligations, or variable rate demand notes at July 3, 2010 and virtually all debt securities held were of investment grade (at least BBB-/Baa3). As of July 3, 2010, approximately 81% of our cash, cash equivalents, and short-term investments were held in the U.S.
As of July 3, 2010, the majority of our investments of surplus cash have maturities of 90 days or less and are of high credit quality. Nevertheless, widening of market credit spreads and bid-ask spreads has impacted both pricing and liquidity of certain investment securities that we own. Although we intend to hold these investments to maturity, in the event that we are required to sell any of these securities under adverse market conditions, losses could be recognized on such sales. During fiscal year 2010, we recognized $1.4 million of investment losses and can provide no assurances that the value or the liquidity of our other investments will not also be impacted by adverse conditions in the financial markets. In addition, we maintain cash balances in operating accounts that are with third party financial institutions. These balances in the U.S. may exceed the Federal Deposit Insurance Corporation (“FDIC”) insurance limits. While we monitor the cash balances in our operating accounts and adjust the cash balances as appropriate, these cash balances could be impacted if the underlying financial institutions fail.
Fiscal 2010
We had a combined balance of cash and cash equivalents, short-term investments and restricted cash of $600.1 million at July 3, 2010, a decrease of $95.4 million from June 27, 2009. Significant inflows included $119.2 million provided by operating activities, $14.9 million from the sale of our Fabrinet investment, and $9.6 million from the exercise of stock options and the issuance of stock under employee stock plans. Significant outflows included $207.3 million of cash used in acquisitions and $41.4 million for purchases of property, plant and equipment. Cash and cash equivalents increased by $53.3 million in fiscal 2010, primarily due to the above-referenced items and sales and maturities of investments in excess of purchases of $181.5 million.
Operating activities provided $119.2 million of cash during fiscal 2010, resulting from our net loss adjusted for non-cash items such as depreciation, amortization, and various gains and losses of $117.3 million, together with changes in operating assets and liabilities that provided $1.9 million related primarily to a decrease in inventory of $22.2 million, an increase in accounts payable of $20.8 million, a decrease in other current assets of $16.4 million, an increase in accrued payroll and related of $11.7 million and an increase of $6.2 million in other accrued liability offset by an increase in accounts receivable of $61.4 million due to increase in sales and a decrease in income taxes payable of $9.5 million.
Cash used by investing activities was $65.4 million during fiscal 2010, primarily due to $207.3 million of cash used for acquisitions, net of cash acquired and $41.4 million used for purchases of property and equipment offset by $196.4 million from sales and maturities of investments in excess of purchases, including $14.9 million from the sale of our Fabrinet investment.
Our financing activities provided cash of $1.0 million, primarily related to proceeds from the exercise of stock options and issuance of stock under employee stock plans of $9.6 million offset by the payments of debt and capital lease obligations of $8.6 million.
58
Table of Contents
Fiscal 2009
We had a combined balance of cash and cash equivalents, short-term investments and restricted cash of $695.5 million at June 27, 2009, a decrease of $189.2 million from June 28, 2008. Significant inflows included $107.4 million provided by operating activities, $8.7 million (net) primarily from the sale of our Shenzhen facility to Sanmina, and $5.2 million from the exercise of stock options and the issuance of stock under employee stock plans. Significant outflows included $139.2 million of cash used to repurchase a portion of the company’s Senior Convertible Notes, $86.8 million of cash used to repurchase JDSU’s common stock, $54.7 million for purchases of property, plant and equipment and $12.5 million of cash used in acquisitions. Cash and cash equivalents increased by $21.3 million in fiscal 2009, primarily due to the above-referenced items and sales and maturities of investments in excess of purchases of $201.5 million.
Operating activities provided $107.4 million of cash during fiscal 2009, resulting from our net loss adjusted for non-cash items such as depreciation, amortization, and various gains and losses, of $64.4 million, together with changes in operating assets and liabilities that provided $43.0 million related primarily to a decrease in accounts receivable of $110.9 million due to reduced sales and improved collection efforts and a decrease in inventories of $15.4 million, offset by a decrease in the FIN48 tax liability of $18.1 million, a decrease in other accrued liability of $16.0 million, an increase in other current assets of $13.3 million, and a decrease in accounts payable of $12.6 million.
Cash provided by investing activities was $140.8 million during fiscal 2009, primarily due to $201.5 million from sales and maturities of investments in excess of purchases, $8.7 million (net) primarily from the sale of our Shenzhen facility and $2.3 million of proceeds from the sale of assets. Partially offsetting these sources of cash were $54.7 million used for purchases of property and equipment, and $12.5 million of cash used for acquisitions, net of cash acquired.
Our financing activities used cash of $220.9 million, primarily related to $139.2 million used to repurchase a portion of the company’s Senior Convertible Notes, and $86.8 million used to repurchase common stock, offset by proceeds from the exercise of stock options and issuance of stock under employee stock plans of $5.2 million. See “Note 11. Convertible Debt and Letters of Credit” of our Notes to Consolidated Financial Statements for additional information regarding debt financing.
During fiscal 2009, the Company repurchased approximately 7.6 million shares of common stock in open market purchases at an average price of $11.40 per share, completing the $200 million share repurchase program authorized by the Company’s Board of Directors on May 15, 2008. The total purchase price of $86.8 million was reflected as a decrease to common stock based on the stated par value per share with the remainder to accumulated deficit.
Fiscal 2008
We had a combined balance of cash and cash equivalents, short-term investments and restricted cash of $884.7 million at June 28, 2008, a decrease of $258.0 million from June 30, 2007. Significant inflows included $197.2 million provided by operating activities, $32.2 million from a sales-leaseback transaction and $15.8 million from the exercise of stock options and the issuance of stock under employee stock plans. Significant outflows included $113.2 million of cash used to repurchase JDSU’s common stock, $287.5 million of cash used to repurchase a portion of the company’s Zero Coupon Senior Convertible Notes, $51.7 million for purchases of property, plant and equipment and $59.9 million of cash used in acquisitions. Cash and cash equivalents decreased by $97.3 million in fiscal 2008, primarily due to the above-referenced items and sales and maturities of investments in excess of purchases of $177.5 million.
Operating activities provided $197.2 million of cash during fiscal 2008, resulting from our net loss adjusted for non-cash items such as depreciation, amortization, and various gains and losses, of $180.0 million, together
59
Table of Contents
with changes in operating assets and liabilities that provided $17.2 million related primarily to a decrease in inventories of $30.4 million and an increase in accounts payable of $9.6 million, offset by an increase in net accounts receivable of $23.0 million.
Cash provided by investing activities was $53.4 million during fiscal 2008, primarily due to $177.5 million from sales and maturities of investments in excess of purchases, and $3.6 million of proceeds from the sale of assets. Partially offsetting these sources of cash were $51.7 million used for purchases of property and equipment, and $59.9 million of cash used for acquisitions, net of cash acquired.
Our financing activities used cash of $353.0 million, primarily related to $287.5 million used to repurchase a portion of the company’s Zero Coupon Senior Convertible Notes, and $113.2 million used to repurchase common stock, offset by proceeds from a sales-leaseback transaction of $32.2 million and the exercise of stock options and issuance of stock under employee stock plans of $15.8 million. See “Note 11. Convertible Debt and Letters of Credit” of our Notes to Consolidated Financial Statements for additional information regarding debt financing.
On May 15, 2008, the Company’s Board of Directors authorized the Company to repurchase up to $200 million of its common stock through open market or private transactions during a two year period ending May 14, 2010. During the three months ended June 28, 2008, the Company repurchased approximately 9.6 million shares of common stock in open market purchases at an average price of $11.76 per share. The total purchase price of $113.2 million was reflected as a decrease to common stock based on the stated par value per share with the remainder to accumulated deficit. All common shares repurchased under this program have been cancelled and retired.
Contractual Obligations
The following summarizes our contractual obligations at July 3, 2010, and the effect such obligations are expected to have on our liquidity and cash flow over the next five years (in millions):
| Payments due by period | |||||||||||||||
| Total | Less than 1 year |
1-3 years |
3-5 years |
More than 5 years | |||||||||||
| Contractual Obligations |
|||||||||||||||
| Asset retirement obligations—expected cash payments |
$ | 7.9 | $ | 0.5 | $ | 1.4 | $ | 4.2 | $ | 1.8 | |||||
| Long-Term Debt: (1) |
|||||||||||||||
| Zero Coupon Senior Convertible Notes |
0.2 | 0.2 | — | — | — | ||||||||||
| 1% Senior Convertible Notes (4) |
325.0 | — | 325.0 | — | — | ||||||||||
| Estimated Interest Payments on Debts |
9.3 | 3.2 | 6.1 | — | — | ||||||||||
| Purchase obligations (2) |
138.1 | 138.1 | — | — | — | ||||||||||
| Operating lease obligations (2) |
99.9 | 21.2 | 38.2 | 22.3 | 18.2 | ||||||||||
| Capital lease obligations (2) |
0.8 | 0.8 | — | — | — | ||||||||||
| Pension and postretirement benefit payments (3) |
77.1 | 4.8 | 9.2 | 9.6 | 53.5 | ||||||||||
| Other non-current liabilities |
1.1 | 0.4 | 0.3 | 0.0 | 0.4 | ||||||||||
| Total |
$ | 659.4 | $ | 169.2 | $ | 380.2 | $ | 36.1 | $ | 73.9 | |||||
| (1) | See “Note 11. Convertible Debt and Letters of Credit” for more information. |
| (2) | See “Note 18. Commitments and Contingencies” for more information. |
| (3) | See “Note 16. Employee Benefit Plans” for more information. |
| (4) | The 1% Senior Convertible Notes have a legal final maturity in May, 2026 but are expected to be retired in May 2013 pursuant to put/call provisions contained in the indenture. |
60
Table of Contents
As of July 3, 2010, operating lease obligations of $9.3 million in connection with our restructuring program were accrued in our Consolidated Balance Sheet. Operating lease obligations of $4.9 million were included in the “Restructuring accrual” and $4.4 million was accrued in “Other non-current liabilities.”
Purchase obligations represent legally-binding commitments to purchase inventory and other commitments made in the normal course of business to meet operational requirements.
As of July 3, 2010, other non-current liabilities primarily represent other long-term employment related obligations.
As we are unable to reasonably predict the timing of settlement of liabilities related to unrecognized tax benefits, the table does not include $31.0 million of such liabilities recorded on our consolidated balance sheet as of July 3, 2010.
Off-Balance Sheet Arrangements
We do not have any off-balance sheet arrangements, as such term is defined in rules promulgated by the Securities and Exchange Commission, that have or are reasonably likely to have a current or future effect on our financial condition, changes in financial condition, revenues or expenses, results of operations, liquidity, capital expenditures or capital resources that are material to investors.
Acquisitions
As part of our strategy, we are committed to the ongoing evaluation of strategic opportunities and, where appropriate, the acquisition of additional products, technologies or businesses that are complementary to, or broaden the markets for our products. We believe we strengthened our business model by expanding our addressable market, customer base, and expertise, diversifying our product portfolio, and fortifying our core businesses through acquisition as well as through organic initiatives.
In May 2010, we completed the acquisition of the Network Solutions Division (“NSD”) of Agilent Technologies, Inc. (“Agilent”), where we acquired certain assets and assumed certain liabilities of NSD, for a total purchase price consideration of approximately $163.8 million.
In July 2009, we completed the acquisition of the Storage Network Tools business of Finisar Corporation. Under the terms of the agreement, we acquired the Storage Network Tools business for approximately $40.7 million.
In February 2008, we completed the acquisition of American Bank Note Holographics Inc. (“ABNH”), a public company, for approximately 8.7 million shares of the Company’s common stock with a market value of $110.3 million at the measurement date and $19.5 million in cash, including $1.2 million of direct transaction costs incurred in connection with the acquisition. We also assumed ABNH’s employee outstanding stock options at close, valued at $11.4 million at the measurement date. ABNH is a market leader in the origination, production and marketing of holograms for security applications and the leading supplier of optical security devices for the transaction card market and is included in our Advanced Optical Technologies segment.
In January 2008, we completed the acquisition of certain assets of the fiber optics division of Westover Scientific Inc. (“Westover”) for approximately $51.5 million in cash, including $0.8 million of direct transaction costs incurred in connection with the acquisition. Westover is a leading provider of fiber optic inspection and cleaning solutions, which complements our existing fiber field and lab and production test portfolio and is included in our Communications Test and Measurement segment.
Please refer to “Note 4. Mergers and Acquisitions” of our Notes to Consolidated Financial Statements.
61
Table of Contents
Employee Stock Options
Our stock option and Full Value Award program is a broad-based, long-term retention program that is intended to attract and retain employees and align stockholder and employee interests. As of July 3, 2010, we have available for issuance 10.0 million shares of common stock for grant primarily under our Amended and Restated 2003 Equity Incentive Plan (the “2003 Plan”) and 2005 Acquisition Equity Incentive Plan (the “2005 Plan”). The exercise price for the options is equal to the fair market value of the underlying stock at the date of grant. Options generally become exercisable over a four-year or three-year period and, if not exercised, expire from five to ten years post grant date. The majority of our employees participate in our stock option program. “Full Value Awards” refer to Restricted Stock, Restricted Stock Units, Performance Units and Performance Shares that are granted with the exercise price equal to zero and are converted to shares immediately upon vesting. These Full Value Awards are performance based, time based, or a combination of performance and time based and are expected to vest over one to five years except with respect to awards with performance conditions, such conditions are achieved on a different timeline. The fair value of the Full Value Awards is based on the closing market price of our common stock on the date of award. See “Note 15. Stock-Based Compensation” for more detail.
Pension and Other Postretirement Benefits
As a result of acquiring Acterna in August 2005 and NSD in May 2010, we sponsor pension plans for certain past and present employees in the UK and Germany. JDSU also is responsible for the nonpension postretirement benefit obligation of a previously acquired subsidiary. Most of these plans have been closed to new participants and no additional service costs are being accrued, except for the plans assumed during fiscal 2010 in connection with the NSD acquisition. The UK plan is partially funded and the German plans, which were initially established as “pay-as-you-go” plans, are unfunded. The authoritative guidance of pension and other postretirement benefits requires the recognition of the funded status of the pension plans and nonpension postretirement benefit plans (retirement-related benefit plans) as an asset or a liability in the Consolidated Statement of Financial Position. The authoritative guidance also requires the recognition of changes in that funded status in the year in which they occur through the Gains and (losses) not affecting retained earnings, net of tax, and the recognition of previously unrecognized gains/(losses), prior service costs/(credits) and transition assets as a component of Accumulated gains and (losses) not affecting retained earnings in the Consolidated Statement of Stockholders’ Equity. The funded status of a retirement plan is the difference between the projected benefit obligation and the fair value of its plan assets. The projected benefit obligation is the actuarial present value of all benefits attributed by the plan’s benefit formula to employee service. At July 3, 2010, our pension plans were under funded by $80.5 million since the projected benefit obligation exceeded the fair value of its plan assets. Similarly, we had accrued $0.8 million related to our non-pension postretirement benefit plan.
Because the plans have received limited funding in the past, we anticipate future annual outlays related to the plans will approximate estimated future benefit payments. These future benefit payments have been estimated based on the same actuarial assumptions used to measure our projected benefit obligation and currently are forecasted to range between $4.4 million and $4.8 million per annum. In addition, during fiscal 2009 the UK pension plan made lump-sum cash payments of approximately $3.1 million to deferred pensioners who elected to transfer out of the plan.
During fiscal 2010 and fiscal 2009, we contributed GBP 0.2 million and GBP 0.2 million or approximately $0.3 million and $0.3 million, respectively, to our UK pension plan. These contributions allowed the Company to comply with regulatory funding requirements.
A key actuarial assumption is the discount rate. Changes in the discount rate impact the interest cost component of the net periodic benefit cost calculation and, due to the fact that the accumulated benefit obligation (“ABO”) is calculated on a net present value basis, changes in the discount rate will also impact the current ABO. Decreases in the discount rate will generally increase pre-tax cost, recognized expense and the ABO. Increases in
62
Table of Contents
the discount rate tend to have the opposite effect. We estimate a 50 basis point decrease or increase in the discount rate would cause a corresponding increase or decrease, respectively, in the ABO of approximately $6.0 million based upon July 3, 2010 data.
In estimating the expected return on plan assets, we consider historical returns on plan assets, adjusted for forward-looking considerations, inflation assumptions and the impact of the active management of the plan’s invested assets. While it is not possible to accurately predict future rate movements, we believe our current assumptions are appropriate. Please refer to “Note 16. Employee Benefit Plans” of Notes to Consolidated Financial Statements under Item 8 of this Annual Report on Form 10-K for further discussion.
Liquidity and Capital Resources Requirement
We believe that our existing cash balances and investments will be sufficient to meet our liquidity and capital spending requirements at least through the next 12 months. However, possible investments in or acquisitions of complementary businesses, products or technologies may require the use of additional cash or financing prior to such time. We have in past periods consumed, and in the future we may consume, portions of our cash reserves to fund our operations. The amounts consumed to date, together with the amounts currently anticipated to be spent, are not expected to materially impair our financial condition. However, we may need to expend additional, currently unanticipated, cash reserves to fund our operations. Our liquidity could be negatively affected by a decline in demand for our products, which are subject to rapid technological changes, or a reduction of capital expenditures by telecommunications carriers.
63
Table of Contents
| ITEM 7A. | QUANTITATIVE AND QUALITATIVE DISCLOSURES ABOUT MARKET RISK |
Foreign Exchange Risk
We utilize foreign exchange forward contracts and other instruments, including option contracts, to hedge foreign currency risk associated with foreign currency denominated assets and liabilities, primarily short-term certain intercompany receivables and payables. Our foreign exchange forward contracts and other instruments are accounted for as derivatives whereby the fair value of the contracts are reflected as other current assets or other current liabilities and the associated gains and losses are reflected in Interest and other income (loss) in the Consolidated Statements of Operations. Our hedging programs reduce, but do not eliminate, the impact of currency exchange rate movements. The gains and losses on those derivatives are expected to be offset by re-measurement gains and losses on the foreign currency denominated assets and liabilities.
The following table provides information about our foreign currency forward and option contracts outstanding as of July 3, 2010. The forward contracts, most with a term of less than 120 days, were transacted near month end; therefore, the fair value of the contracts is approximately zero.
| (in millions) |
Contract Amount (Local Currency) |
Contract Amount (USD) |
Fair Value at July 3, 2010 (USD) | |||||
| Canadian Dollar (contracts to buy CAD / sell USD) |
CAD 37.2 | $ | 35.0 | $ | — | |||
| Chinese Renmimbi (contracts to buy CNY / sell USD) |
CNY 39.4 | 5.8 | — | |||||
| British Pound (contracts to buy GBP / sell USD) |
GBP 0.8 | 1.2 | — | |||||
| Euro (contracts to buy EUR / sell USD) |
EUR 13.7 | 16.8 | — | |||||
| Hong Kong Dollar (contracts to sell HKD / buy USD) |
HKD 121.4 | 15.6 | — | |||||
| Singapore Dollar (contracts to sell SGD / buy USD) |
SGD 32.5 | 23.3 | — | |||||
| Mexican Peso (contracts to buy MXN / sell USD) |
MXN 48.6 | 3.8 | — | |||||
| Australian Dollar (contracts to sell AUD / buy USD) |
AUD 8.8 | 7.4 | — | |||||
| Brazilian Real (contracts to sell BRL / buy USD) |
BRL 2.6 | 1.4 | — | |||||
| Japanese Yen (contracts to sell JPY / buy USD) |
JPY 573.2 | 6.5 | — | |||||
| Total USD notional amount of outstanding Foreign Exchange Contracts |
$ | 116.8 | ||||||
| Net unrealized gain (loss) on derivative financial instruments |
$ | — | ||||||
The counterparties to these hedging transactions are creditworthy multinational banks. The risk of counterparty nonperformance associated with these contracts is not considered to be material. Notwithstanding our efforts to mitigate some foreign exchange risks, we do not hedge all of our foreign currency exposures, and there can be no assurances that our mitigating activities related to the exposures that we do hedge will adequately protect us against the risks associated with foreign currency fluctuations.
Investments
We maintain an investment portfolio in a variety of financial instruments, including, but not limited to, U.S. government and agency bonds, corporate obligations, money market funds, asset-backed securities, and other investment-grade securities. The majority of these investments pay a fixed rate of interest. The securities in the investment portfolio are subject to market price risk due to changes in interest rates, perceived issuer creditworthiness, marketability, and other factors. These investments are generally classified as available-for-sale and, consequently, are recorded on our Consolidated Balance Sheets at fair value with unrealized gains or losses reported as a separate component of stockholders’ equity.
Investments in both fixed-rate and floating-rate interest earning instruments carry a degree of interest rate risk. The fair market values of our fixed-rate securities decline if interest rates rise, while floating-rate securities
64
Table of Contents
may produce less income than expected if interest rates fall. Due in part to these factors, our future investment income may be less than expectations because of changes in interest rates or we may suffer losses in principal if we sell securities that have experienced a decline in market value because of changes in interest rates.
The following tables (in millions) present the hypothetical changes in fair value in the available-for-sale debt instruments held at July 3, 2010 and June 27, 2009 that are sensitive to changes in interest rates. These instruments are not leveraged or hedged and are held for purposes other than trading. Investments in money market funds and similar investment funds that seek to maintain a constant net asset value per unit of investment are not considered to be subject to market price risk and are not included in this sensitivity analysis. The modeling technique used measures the change in fair values arising from selected potential changes in interest rates. Market changes reflect immediate hypothetical parallel shifts in the yield curve of plus or minus 50 basis points (“BPS”), 100 BPS, and 150 BPS over a 12-month horizon. Beginning fair values represent the market value, excluding accrued interest and dividends at July 3, 2010 and June 27, 2009.
| Valuation of Securities Given an Interest Rate Decrease of “X” BPS |
Fair Value as of July 3, 2010 |
Valuation of Securities Given an Interest Rate Increase of “X” BPS | |||||||||||||||||||
| 150 BPS |
100 BPS |
50 BPS |
50 BPS |
100 BPS |
150 BPS | ||||||||||||||||
| U.S. treasuries |
$ | 28 | $ | 27 | $ | 27 | $ | 27 | $ | 27 | $ | 27 | $ | 27 | |||||||
| U.S. agencies |
48 | 48 | 48 | 47 | 47 | 47 | 46 | ||||||||||||||
| Foreign agencies |
3 | 3 | 3 | 3 | 3 | 3 | 3 | ||||||||||||||
| Municipals |
2 | 2 | 2 | 2 | 1 | 1 | 1 | ||||||||||||||
| Asset-backed securities |
29 | 29 | 29 | 29 | 29 | 29 | 29 | ||||||||||||||
| Corporate securities |
130 | 130 | 129 | 129 | 129 | 128 | 128 | ||||||||||||||
| Total |
$ | 240 | $ | 239 | $ | 238 | $ | 237 | $ | 236 | $ | 235 | $ | 234 | |||||||
| Valuation of Securities Given an Interest Rate Decrease of “X” BPS |
Fair Value as of June 27, 2009 |
Valuation of Securities Given an Interest Rate Increase of “X” BPS | |||||||||||||||||||
| 150 BPS |
100 BPS |
50 BPS |
50 BPS |
100 BPS |
150 BPS | ||||||||||||||||
| U.S. treasuries |
$ | 44 | $ | 44 | $ | 44 | $ | 44 | $ | 44 | $ | 44 | $ | 44 | |||||||
| U.S. agencies |
163 | 163 | 163 | 162 | 162 | 162 | 162 | ||||||||||||||
| Municipals |
1 | 1 | 1 | 1 | 1 | 1 | 1 | ||||||||||||||
| Asset-backed securities |
58 | 57 | 57 | 57 | 57 | 57 | 57 | ||||||||||||||
| Corporate securities |
190 | 190 | 190 | 190 | 190 | 189 | 189 | ||||||||||||||
| Total |
$ | 456 | $ | 455 | $ | 455 | $ | 454 | $ | 454 | $ | 453 | $ | 453 | |||||||
We seek to mitigate the credit risk of our portfolio of fixed-income securities by holding only high-quality, investment-grade obligations with effective maturities of 37 months or less. We also seek to mitigate marketability risk by holding only highly liquid securities with active secondary or resale markets. However, the investments may decline in value or marketability due to changes in perceived credit quality or changes in market conditions.
65
Table of Contents
Long-term Debt
The fair market value of the Zero Coupon Senior Convertible Notes and the 1% Senior Convertible Notes (“Convertible Notes”) is subject to interest rate and market price risk due to the convertible feature of the notes and other factors. Generally the fair market value of fixed interest rate debt will increase as interest rates fall and decrease as interest rates rise. The fair market value of the notes may also increase as the market price of JDSU stock rises and decrease as the market price of the stock falls. Interest rate and market value changes affect the fair market value of the notes but do not impact our financial position, cash flows or results of operations. Based on quoted market prices, as of July 3, 2010 and June 27, 2009, the fair market value of the 1% Senior Convertible Notes was approximately $289.7 million and $238.9 million, respectively, and the fair market value of the Zero Coupon Senior Convertible Notes was approximately $0.2 million and $0.2 million, respectively. The fair values of Convertible Notes are based on quoted prices in active markets. Changes in fair market value reflect both the change in the market price of the notes and the impact of the partial repurchase of the Zero Coupon Senior Convertible Notes during fiscal year 2010. For additional information, see “Note 11. Convertible Debt and Letters of Credit”.
66
Table of Contents
ITEM 8. FINANCIAL STATEMENTS AND SUPPLEMENTARY DATA
REPORT OF INDEPENDENT REGISTERED PUBLIC ACCOUNTING FIRM
To the Board of Directors and Stockholders of JDS Uniphase Corporation:
In our opinion, the consolidated financial statements listed in the index appearing under Item 15(a)(1) present fairly, in all material respects, the financial position of JDS Uniphase Corporation and its subsidiaries at July 3, 2010 and June 27, 2009, and the results of their operations and their cash flows for each of the three years in the period ended July 3, 2010 in conformity with accounting principles generally accepted in the United States of America. Also in our opinion, the Company maintained, in all material respects, effective internal control over financial reporting as of July 3, 2010, based on criteria established in Internal Control—Integrated Framework issued by the Committee of Sponsoring Organizations of the Treadway Commission (COSO). The Company's management is responsible for these financial statements, for maintaining effective internal control over financial reporting and for its assessment of the effectiveness of internal control over financial reporting, included in Management's Report on Internal Control over Financial Reporting. Our responsibility is to express opinions on these financial statements and on the Company's internal control over financial reporting based on our integrated audits. We conducted our audits in accordance with the standards of the Public Company Accounting Oversight Board (United States). Those standards require that we plan and perform the audits to obtain reasonable assurance about whether the financial statements are free of material misstatement and whether effective internal control over financial reporting was maintained in all material respects. Our audits of the financial statements included examining, on a test basis, evidence supporting the amounts and disclosures in the financial statements, assessing the accounting principles used and significant estimates made by management, and evaluating the overall financial statement presentation. Our audit of internal control over financial reporting included obtaining an understanding of internal control over financial reporting, assessing the risk that a material weakness exists, and testing and evaluating the design and operating effectiveness of internal control based on the assessed risk. Our audits also included performing such other procedures as we considered necessary in the circumstances. We believe that our audits provide a reasonable basis for our opinions.
As discussed in Note 3 to the consolidated financial statements, effective June 28, 2009, the Company changed the manner in which it accounts for convertible debt instruments that may be settled by the investor fully or partially in cash.
A company’s internal control over financial reporting is a process designed to provide reasonable assurance regarding the reliability of financial reporting and the preparation of financial statements for external purposes in accordance with generally accepted accounting principles. A company’s internal control over financial reporting includes those policies and procedures that (i) pertain to the maintenance of records that, in reasonable detail, accurately and fairly reflect the transactions and dispositions of the assets of the company; (ii) provide reasonable assurance that transactions are recorded as necessary to permit preparation of financial statements in accordance with generally accepted accounting principles, and that receipts and expenditures of the company are being made only in accordance with authorizations of management and directors of the company; and (iii) provide reasonable assurance regarding prevention or timely detection of unauthorized acquisition, use, or disposition of the company’s assets that could have a material effect on the financial statements.
Because of its inherent limitations, internal control over financial reporting may not prevent or detect misstatements. Also, projections of any evaluation of effectiveness to future periods are subject to the risk that controls may become inadequate because of changes in conditions, or that the degree of compliance with the policies or procedures may deteriorate.
As described in Management's Report on Internal Control over Financial Reporting, management has excluded Network Solutions Division (“NSD”) from its assessment of internal control over financial reporting as of July 3, 2010 because it was acquired by the Company in a purchase business combination during fiscal 2010. We have also excluded NSD from our audit of internal control over financial reporting. NSD is a wholly-owned subsidiary whose total assets and total revenues represent $182.2 million and $8.9 million, respectively, of the related consolidated financial statement amounts as of and for the year ended July 3, 2010.
/s/ PRICEWATERHOUSECOOPERS LLP
San Jose, California
August 31, 2010
67
Table of Contents
CONSOLIDATED STATEMENTS OF OPERATIONS
(in millions, except per share data)
| Years Ended | ||||||||||||
| July 3, 2010 |
June 27, 2009 |
June 28, 2008 |
||||||||||
| Net revenue |
$ | 1,363.9 | $ | 1,283.3 | $ | 1,512.0 | ||||||
| Cost of sales |
766.2 | 742.9 | 879.1 | |||||||||
| Amortization of acquired technologies |
50.6 | 48.9 | 49.3 | |||||||||
| Impairment of acquired developed technologies |
— | 4.9 | 4.0 | |||||||||
| Gross profit |
547.1 | 486.6 | 579.6 | |||||||||
| Operating expenses: |
||||||||||||
| Research and development |
174.9 | 167.1 | 184.3 | |||||||||
| Selling, general and administrative |
382.9 | 399.0 | 449.1 | |||||||||
| Amortization of other intangibles |
27.8 | 27.0 | 30.0 | |||||||||
| Impairment of goodwill |
— | 741.7 | 37.0 | |||||||||
| (Gain) loss on disposal and impairment of long-lived assets |
(2.0 | ) | 13.2 | 6.7 | ||||||||
| Restructuring and related charges |
17.7 | 38.5 | 6.7 | |||||||||
| Total operating expenses |
601.3 | 1,386.5 | 713.8 | |||||||||
| Loss from operations |
(54.2 | ) | (899.9 | ) | (134.2 | ) | ||||||
| Interest and other income (expense), net |
9.6 | 33.5 | 120.1 | |||||||||
| Interest expense |
(24.3 | ) | (25.5 | ) | (27.4 | ) | ||||||
| Impairment of investments |
(1.4 | ) | (18.4 | ) | — | |||||||
| Gain on sale of investments |
13.1 | 1.8 | 2.4 | |||||||||
| Loss from continuing operations before income taxes |
(57.2 | ) | (908.5 | ) | (39.1 | ) | ||||||
| Provision of (benefit for) income taxes |
2.5 | (2.3 | ) | 2.4 | ||||||||
| Loss from continuing operations, net of tax |
(59.7 | ) | (906.2 | ) | (41.5 | ) | ||||||
| (Loss) gain from discontinued operations, net of tax |
(2.1 | ) | (3.3 | ) | 1.2 | |||||||
| Net loss |
$ | (61.8 | ) | $ | (909.5 | ) | $ | (40.3 | ) | |||
| Net loss per share—basic and diluted |
||||||||||||
| Continuing operations |
$ | (0.27 | ) | $ | (4.20 | ) | $ | (0.19 | ) | |||
| Discontinued operations |
(0.01 | ) | (0.02 | ) | 0.01 | |||||||
| Net loss |
$ | (0.28 | ) | $ | (4.22 | ) | $ | (0.18 | ) | |||
| Shares used in per share calculation—basic and diluted |
218.9 | 215.6 | 223.8 | |||||||||
See accompanying notes to consolidated financial statements.
68
Table of Contents
CONSOLIDATED BALANCE SHEETS
(in millions, except share and par value data)
| July 3, 2010 |
June 27, 2009 |
|||||||
| ASSETS |
||||||||
| Current assets: |
||||||||
| Cash and cash equivalents |
$ | 340.2 | $ | 286.9 | ||||
| Short-term investments |
227.4 | 398.3 | ||||||
| Restricted cash |
32.5 | 10.3 | ||||||
| Accounts receivable, less reserves and allowances of $3.0 at July 3, 2010 and $2.4 at June 27, 2009 |
271.8 | 187.3 | ||||||
| Inventories, net |
125.7 | 144.8 | ||||||
| Refundable income taxes |
4.0 | 14.4 | ||||||
| Other current assets |
73.0 | 65.8 | ||||||
| Total current assets |
1,074.6 | 1,107.8 | ||||||
| Property, plant and equipment, net |
183.0 | 191.1 | ||||||
| Deferred income taxes |
3.2 | 5.7 | ||||||
| Goodwill |
66.0 | 8.3 | ||||||
| Other intangibles, net |
357.4 | 322.6 | ||||||
| Long-term investments |
5.1 | 15.1 | ||||||
| Other non-current assets |
14.3 | 17.5 | ||||||
| Total assets |
$ | 1,703.6 | $ | 1,668.1 | ||||
| LIABILITIES AND STOCKHOLDERS’ EQUITY |
||||||||
| Current liabilities: |
||||||||
| Accounts payable |
$ | 137.4 | $ | 106.6 | ||||
| Current portion of long-term debt |
0.2 | 0.2 | ||||||
| Accrued payroll and related expenses |
62.9 | 45.7 | ||||||
| Income taxes payable |
19.8 | 20.3 | ||||||
| Deferred income taxes |
2.1 | 5.6 | ||||||
| Restructuring accrual |
7.1 | 16.6 | ||||||
| Warranty accrual |
7.3 | 7.3 | ||||||
| Accrued expenses |
47.7 | 56.0 | ||||||
| Other current liabilities |
66.4 | 51.6 | ||||||
| Total current liabilities |
350.9 | 309.9 | ||||||
| Long-term debt |
267.1 | 249.9 | ||||||
| Other non-current liabilities |
176.9 | 173.8 | ||||||
| Commitments and contingencies (Note 18, 20, and 21) |
||||||||
| Stockholders’ equity: |
||||||||
| Preferred Stock, $0.001 par value: Authorized shares: 1,000,000 |
— | — | ||||||
| Common Stock, $0.001 par value: |
||||||||
| Authorized shares: 1,000,000,000 |
0.2 | 0.2 | ||||||
| Issued and outstanding shares: 221,127,151 at July 3, 2010 and 216,971,017 at June 27, 2009 |
||||||||
| Additional paid-in capital |
69,574.0 | 69,530.5 | ||||||
| Accumulated deficit |
(68,680.6 | ) | (68,618.8 | ) | ||||
| Accumulated other comprehensive income |
15.1 | 22.6 | ||||||
| Total stockholders’ equity |
908.7 | 934.5 | ||||||
| Total liabilities and stockholders’ equity |
$ | 1,703.6 | $ | 1,668.1 | ||||
See accompanying notes to consolidated financial statements.
69
Table of Contents
CONSOLIDATED STATEMENTS OF CASH FLOWS
(in millions)
| Years Ended | ||||||||||||
| July 3, 2010 |
June 27, 2009 |
June 28, 2008 |
||||||||||
| OPERATING ACTIVITIES: |
||||||||||||
| Net loss |
$ | (61.8 | ) | $ | (909.5 | ) | $ | (40.3 | ) | |||
| Adjustments to reconcile net loss to net cash provided by operating activities: |
||||||||||||
| Depreciation expense |
58.3 | 68.5 | 65.2 | |||||||||
| Asset retirement obligations and deferred rent expenses |
(7.1 | ) | 0.1 | 0.5 | ||||||||
| Amortization expense |
78.4 | 75.9 | 79.3 | |||||||||
| Amortization of stock-based compensation expense |
43.1 | 50.6 | 49.3 | |||||||||
| Amortization of debt issuance costs and debt discount |
17.9 | 19.0 | 20.9 | |||||||||
| Non-cash changes in short term investments |
2.9 | 2.2 | (3.6 | ) | ||||||||
| Impairment of intangibles and (gain) loss on disposal of long-lived assets |
(1.3 | ) | 18.1 | 10.7 | ||||||||
| Impairment of goodwill |
— | 741.7 | 37.0 | |||||||||
| Gain on sale of investments, net |
(13.1 | ) | (1.8 | ) | (2.3 | ) | ||||||
| Impairment of investments |
1.4 | 18.4 | — | |||||||||
| Change in equity investments |
(2.0 | ) | 0.9 | (1.2 | ) | |||||||
| Gain on repurchase of debt |
— | (17.0 | ) | (11.1 | ) | |||||||
| Non-cash portion of Nortel settlement |
— | — | (24.0 | ) | ||||||||
| Allowance for doubtful accounts |
0.6 | (2.7 | ) | (0.4 | ) | |||||||
| Changes in operating assets and liabilities, net of impact of acquisitions of businesses and dispositions of assets: |
||||||||||||
| Accounts receivable |
(61.4 | ) | 110.9 | (23.0 | ) | |||||||
| Inventories |
22.2 | 15.4 | 30.4 | |||||||||
| Other current assets |
16.4 | (13.3 | ) | (3.4 | ) | |||||||
| Accounts payable |
20.8 | (12.6 | ) | 9.6 | ||||||||
| Income taxes payable |
(9.5 | ) | 4.9 | (11.2 | ) | |||||||
| Deferred taxes, net |
(4.5 | ) | 1.3 | (1.2 | ) | |||||||
| Accrued payroll and related expenses |
11.7 | (11.3 | ) | (6.5 | ) | |||||||
| Other |
6.2 | (52.3 | ) | 22.5 | ||||||||
| Net cash provided by operating activities |
119.2 | 107.4 | 197.2 | |||||||||
| INVESTING ACTIVITIES: |
||||||||||||
| Purchases of available-for-sale investments |
(427.1 | ) | (543.6 | ) | (753.1 | ) | ||||||
| Maturities and sales of investments |
623.5 | 745.1 | 930.6 | |||||||||
| Changes in restricted cash |
(21.1 | ) | (1.2 | ) | (7.1 | ) | ||||||
| Acquisitions, net of cash acquired |
(207.3 | ) | (12.5 | ) | (59.9 | ) | ||||||
| Purchases of long term investments |
(0.5 | ) | (4.0 | ) | (9.0 | ) | ||||||
| Proceeds received from divestiture of business, net of selling costs |
2.0 | — | — | |||||||||
| Acquisition of property and equipment |
(41.4 | ) | (54.7 | ) | (51.7 | ) | ||||||
| Proceeds from sale of assets, net of selling costs |
1.0 | 2.3 | 3.6 | |||||||||
| Proceeds from sale of subsidiary |
3.5 | 8.7 | — | |||||||||
| Other assets |
2.0 | 0.7 | — | |||||||||
| Net cash provided by (used in) investing activities |
(65.4 | ) | 140.8 | 53.4 | ||||||||
| FINANCING ACTIVITIES: |
||||||||||||
| Payments on debt and capital lease obligations |
(8.6 | ) | (0.4 | ) | (0.3 | ) | ||||||
| Repayment of debt |
— | (139.2 | ) | (287.5 | ) | |||||||
| Proceeds from finance lease |
— | 0.3 | 32.2 | |||||||||
| Repurchase of common stock |
— | (86.8 | ) | (113.2 | ) | |||||||
| Proceeds from exercise of employee stock options and employee stock purchase plan |
9.6 | 5.2 | 15.8 | |||||||||
| Net cash provided by (used in) financing activities |
1.0 | (220.9 | ) | (353.0 | ) | |||||||
| Effect of exchange rates on cash and cash equivalents |
(1.5 | ) | (6.0 | ) | 5.1 | |||||||
| Increase (decrease) in cash and cash equivalents |
53.3 | 21.3 | (97.3 | ) | ||||||||
| Cash and cash equivalents at beginning of period |
286.9 | 265.6 | 362.9 | |||||||||
| Cash and cash equivalents at end of period |
$ | 340.2 | $ | 286.9 | $ | 265.6 | ||||||
| Supplemental disclosure of cash flow information: |
||||||||||||
| Cash paid for interest |
$ | 6.1 | $ | 6.5 | $ | 6.6 | ||||||
| Cash paid for taxes |
9.6 | 12.9 | 8.5 | |||||||||
| Cash received for tax refunds |
10.5 | 1.2 | 2.5 | |||||||||
| Non-cash transactions: |
||||||||||||
| Common stock issued in connection with acquisitions |
— | — | 121.6 | |||||||||
| Purchase of software licenses |
— | 11.1 | — | |||||||||
See accompanying notes to consolidated financial statements.
70
Table of Contents
CONSOLIDATED STATEMENTS OF STOCKHOLDERS’ EQUITY
(in millions)
| Common Stock | Additional Paid-In Capital |
Accumulated Deficit |
Accumulated Other Comprehensive Income |
Total | ||||||||||||||||||
| Shares | Amount | |||||||||||||||||||||
| Balance at June 30, 2007 |
219.0 | $ | 0.2 | $ | 69,298.7 | (a) | $ | (67,470.3 | )(b) | $ | 42.5 | $ | 1,871.1 | |||||||||
| Net loss |
— | — | — | (40.3 | )(c) | — | (40.3 | ) | ||||||||||||||
| Change in net unrealized gains on available-for-sale investments |
— | — | — | — | (0.6 | ) | (0.6 | ) | ||||||||||||||
| Foreign currency translation adjustment |
— | — | — | — | 28.5 | 28.5 | ||||||||||||||||
| Defined benefit obligation, net of tax |
— | — | — | — | 7.5 | 7.5 | ||||||||||||||||
| Comprehensive loss |
— | — | — | — | — | (4.9 | ) | |||||||||||||||
| Shares issued under employee stock plans, net of tax effects |
2.1 | — | 15.8 | — | — | 15.8 | ||||||||||||||||
| Repurchase of common stock |
(9.6 | ) | — | — | (113.1 | ) | — | (113.1 | ) | |||||||||||||
| Stock-based compensation |
0.8 | — | 44.0 | — | — | 44.0 | ||||||||||||||||
| Shares issued for Picolight acquisition |
1.0 | — | (0.1 | ) | — | — | (0.1 | ) | ||||||||||||||
| Shares issued for ABNH acquisition |
8.7 | — | 121.7 | — | — | 121.7 | ||||||||||||||||
| Balance at June 28, 2008 |
222.0 | 0.2 | 69,480.1 | (67,623.7 | ) | 77.9 | 1,934.5 | |||||||||||||||
| Net loss |
— | — | — | (909.5 | )(d) | — | (909.5 | ) | ||||||||||||||
| Change in net unrealized gains on available-for-sale investments |
— | — | — | — | (0.4 | ) | (0.4 | ) | ||||||||||||||
| Foreign currency translation adjustment |
— | — | — | — | (52.8 | ) | (52.8 | ) | ||||||||||||||
| Defined benefit obligation, net of tax |
— | — | — | — | (0.8 | ) | (0.8 | ) | ||||||||||||||
| Comprehensive loss |
— | — | — | — | (963.5 | ) | ||||||||||||||||
| Shares issued under employee stock plans, net of tax effects |
0.9 | — | 5.2 | — | — | 5.2 | ||||||||||||||||
| Repurchase of common stock |
(7.6 | ) | — | — | (86.9 | ) | — | (86.9 | ) | |||||||||||||
| Stock-based compensation |
1.7 | — | 45.2 | — | — | 45.2 | ||||||||||||||||
| Noncredit portion of losses related to investment securities |
— | — | — | 1.3 | (1.3 | ) | — | |||||||||||||||
| Balance at June 27, 2009 |
217.0 | 0.2 | 69,530.5 | (68,618.8 | ) | 22.6 | 934.5 | |||||||||||||||
| Net loss |
— | — | — | (61.8 | ) | — | (61.8 | ) | ||||||||||||||
| Change in net unrealized gains on available-for-sale investments |
— | — | — | — | 6.2 | 6.2 | ||||||||||||||||
| Foreign currency translation adjustment |
— | — | — | — | (4.6 | ) | (4.6 | ) | ||||||||||||||
| Defined benefit obligation, net of tax |
— | — | — | — | (9.1 | ) | (9.1 | ) | ||||||||||||||
| Comprehensive loss |
— | — | — | — | (69.3 | ) | ||||||||||||||||
| Shares issued under employee stock plans, net of tax effects |
2.1 | — | 9.7 | — | — | 9.7 | ||||||||||||||||
| Stock-based compensation |
2.0 | — | 33.8 | — | — | 33.8 | ||||||||||||||||
| Balance at July 3, 2010 |
221.1 | $ | 0.2 | $ | 69,574.0 | $ | (68,680.6 | ) | $ | 15.1 | $ | 908.7 | ||||||||||
| (a) | Additional paid-in capital as of June 30, 2007 increased by $155.1 million due to the reclassification of the $158.5 million equity component from Long-term debt, offset by the equity issuance cost of $3.4 million. Refer to Note 3 for further details. |
| (b) | Accumulated deficit as of June 30, 2007 increased by $19.5 million due to the increase of interest expense resulted from the amortization of discount on 1% Senior Convertible Notes. See Note 3 for more information. |
| (c) | Accumulated deficit as of June 28, 2008 increased by $18.6 million due to the increase of interest expense resulted from the amortization of discount on 1% Senior Convertible Notes. See Note 3 for more information. |
| (d) | Accumulated deficit as of June 27, 2009 increased by $43.1 million due to the increase of interest expense resulted from the amortization of discount on 1% Senior Convertible Notes. See Note 3 for more information. |
See accompanying notes to consolidated financial statements.
71
Table of Contents
NOTES TO CONSOLIDATED FINANCIAL STATEMENTS
Note 1. Description of Business and Summary of Significant Accounting Policies
Description of Business
JDS Uniphase Corporation (“JDSU”) is a leading provider of communications test and measurement solutions and optical products for telecommunications service providers, wireless operators, cable operators, and network equipment manufacturers. JDSU is also a leading provider of optical solutions for biomedical and environmental instrumentation, semiconductor processing, aerospace and defense, brand authentication, display systems, and custom color product differentiation applications.
Fiscal Years
The Company utilizes a 52-53 week fiscal year ending on the Saturday closest to June 30th. The Company’s fiscal 2010 ended on July 3, 2010 and was a 53 week year. The Company’s fiscal 2009 and fiscal 2008 ended on June 27, 2009 and June 28, 2008, and were 52 week years.
Principles of Consolidation
The consolidated financial statements have been prepared in accordance with accounting principles generally accepted in the United States and include the Company and its wholly-owned subsidiaries. All inter-company accounts and transactions have been eliminated.
Out of Period Adjustments
In fiscal 2010, no out of period adjustments were identified or recorded.
In fiscal 2009, we recorded adjustments primarily related to cost of sales, operating expenses, and certain balance sheet accounts. These adjustments resulted in additional net loss of $0.6 million recorded in the current fiscal year. As a result of these adjustments, the operating loss for fiscal 2009 increased by $0.6 million. There was no impact on net loss per share in fiscal 2009 from these adjustments.
In fiscal 2008, the Company recorded adjustments primarily related to revenue, cost of sales, operating expenses, income tax expense, and certain balance sheet accounts. These adjustments resulted in additional net income of $2.1 million recorded in fiscal 2008. As a result of these adjustments, the operating loss for fiscal 2008 decreased by $3.1 million and was partially offset by $1.0 million related to tax provision adjustments. There was a positive impact on net loss of $0.01 per share in fiscal 2008 from these adjustments.
Management and the Audit Committee believe that such amounts are not material to the current and previously reported financial statements.
Use of Estimates
The preparation of the Company’s consolidated financial statements in conformity with accounting principles generally accepted in the United States of America requires management to make estimates and assumptions that affect the reported amount of assets and liabilities at the date of the financial statements and the reported amount of net revenue and expenses during the period. The Company bases estimates on historical experience and on various assumptions about the future that are believed to be reasonable based on available information. The Company’s reported financial position or results of operations may be materially different under different conditions or when using different estimates and assumptions, particularly with respect to significant accounting policies, which are discussed below. In the event that estimates or assumptions prove to differ from actual results, adjustments are made in subsequent periods to reflect more current information.
72
Table of Contents
JDS UNIPHASE CORPORATION
NOTES TO CONSOLIDATED FINANCIAL STATEMENTS—(Continued)
Cash and Cash Equivalents
The Company considers highly liquid instruments such as treasury bills, commercial paper and money market instruments with original maturities of 90 days or less at the time of purchase to be cash equivalents.
Restricted Cash
At July 3, 2010 and June 27, 2009, the Company’s restricted cash balances were $32.5 million and $10.3 million, respectively. They primarily include interest-bearing investments in bank certificates of deposit and money market funds which act as collateral supporting the issuance of letters of credit and performance bonds for the benefit of third parties.
Investments
The Company’s investments in debt securities and marketable equity securities are primarily classified as available-for-sale investments or trading securities and are recorded at fair value. The cost of securities sold is based on the specific identification method. Unrealized gains and losses on available-for-sale investments, net of tax, are reported as a separate component of stockholders’ equity. Gains or losses on trading securities resulting from changes in fair value are recognized currently in earnings. The Company’s short-term investments include securities with stated maturities of longer than twelve months which are classified as current assets as they are highly liquid and available to support current operations. The Company also has certain minority investments in privately held companies. These investments are generally carried at cost and are generally classified as long-term investments.
The Company periodically reviews these investments for impairment. Effective in the fourth quarter of fiscal 2009, if a debt security’s market value is below amortized cost and the Company either intends to sell the security or it is more likely than not that the Company will be required to sell the security before its anticipated recovery, the Company records an other-than-temporary impairment charge to investment income (loss) for the entire amount of the impairment. For the remaining debt securities, if an other-than-temporary impairment exists, the Company separates the other-than-temporary impairment into the portion of the loss related to credit factors, or the credit loss portion, and the portion of the loss that is not related to credit factors, or the noncredit loss portion. The credit loss portion is the difference between the amortized cost of the security and the Company’s best estimate of the present value of the cash flows expected to be collected from the debt security. The noncredit loss portion is the residual amount of the other-than-temporary impairment. The credit loss portion is recorded as a charge to earnings (loss), and the noncredit loss portion is recorded as a separate component of other comprehensive income (loss).
Fair Value of Financial Instruments
The carrying amounts of certain of the Company’s financial instruments, including cash and cash equivalents, accounts receivable, accounts payable, accrued compensation and other accrued liabilities, approximate fair value because of their short maturities. Estimates of fair value of fixed-income securities are based on third party, market-based pricing sources which the company believes to be reliable. These estimates represent the third parties’ good faith opinion as to what a buyer in the marketplace would pay for a security in a current sale. For instruments that are not actively traded, estimates may be based on current treasury yields adjusted by an estimated market credit spread for the specific instrument. The use of different valuation methodologies or market assumptions could have a material impact on estimated fair value amounts. Fair value for investments in public companies is determined using quoted market prices for those securities. Fair value for investments in privately held companies is estimated based upon one or more of the following: Assessment of the
73
Table of Contents
JDS UNIPHASE CORPORATION
NOTES TO CONSOLIDATED FINANCIAL STATEMENTS—(Continued)
investees’ historical and forecasted financial condition; operating results and cash flows; the values of recent rounds of financing; or quoted market prices of comparable public companies. The fair market value of the Company’s Senior Convertible Notes fluctuates with interest rates and with the market price of the stock, but does not affect the carrying value of the debt on the balance sheet, which remains at the par value of $1,000 per bond. Refer to the Company’s “Note 11. Convertible Debt and Letters of Credit” for more detail.
Inventories
Inventory is valued at standard cost, which approximates actual cost computed on a first-in, first-out basis, not in excess of net realizable market value. The Company assesses the valuation on a quarterly basis and writes down the value for estimated excess and obsolete inventory based upon estimates of future demand, including warranty requirements.
Property, Plant and Equipment
Property, plant and equipment are stated at cost. Depreciation is computed by the straight-line method over the following estimated useful lives of the assets: 5 to 40 years for building and improvements, 2 to 10 years for machinery and equipment, and 2 to 5 years for furniture, fixtures and office equipment. Leasehold improvements are amortized by the straight-line method over the shorter of the estimated useful lives of the assets or the term of the lease.
Costs related to software acquired, developed or modified solely to meet the Company’s internal requirements and for which there are no substantive plans to market are capitalized in accordance with the authoritative guidance on accounting for the costs of computer software developed or obtained for internal use. Costs incurred after the preliminary planning stage of the project and after management has authorized and committed funds to the project are capitalized. Costs capitalized for computer software developed or obtained for internal use are included in Property, Plant and Equipment on the Consolidated Balance Sheets.
Goodwill
Goodwill represents the excess of the purchase price of an acquired enterprise or assets over the fair value of the identifiable assets acquired and liabilities assumed. The Company tests for impairment of goodwill on an annual basis in the fourth quarter and at any other time if events occur or circumstances indicate that the carrying amount of goodwill may not be recoverable. See “Note 8. Goodwill” for more detail.
Circumstances that could trigger an impairment test include, but are not limited to: a significant adverse change in the business climate or legal factors; an adverse action or assessment by a regulator; unanticipated competition; loss of key personnel; the likelihood that a reporting unit or significant portion of a reporting unit will be sold or otherwise disposed; results of testing for recoverability of a significant asset group within a reporting unit; or recognition of a goodwill impairment loss in the financial statements of a subsidiary that is a component of a reporting unit.
If the carrying amount of the reporting unit goodwill exceeds the implied fair value of that goodwill, an impairment loss is recorded in the Statement of Operations as “Impairment of goodwill”. Measurement of the fair value of a reporting unit is based on one or more of the following fair value measures including: amounts at which the unit as a whole could be bought or sold in a current transaction between willing parties; using present value techniques of estimated future cash flows; or using valuation techniques based on multiples of earnings or revenue, or a similar performance measure.
74
Table of Contents
JDS UNIPHASE CORPORATION
NOTES TO CONSOLIDATED FINANCIAL STATEMENTS—(Continued)
Other Intangible Assets
Other intangible assets consist primarily of intellectual property acquired and purchased intangible assets. Purchased intangible assets primarily include acquired developed technologies (developed and core technology), proprietary know-how, trade secrets, trademarks and trade names, and customer base. Other intangible assets are amortized using the straight-line method over estimated useful lives ranging from 1 to 16 years.
Impairment or disposal of long-lived assets (plant and equipment and other intangible assets)
Long-lived assets held and used
The Company tests long-lived assets or asset groups for recoverability when events or changes in circumstances indicate that their carrying amount may not be recoverable. Circumstances which could trigger a review include, but are not limited to: significant decreases in the market price of the asset; significant adverse changes in the business climate or legal factors; accumulation of costs significantly in excess of the amount originally expected for the acquisition or construction of the asset; current period cash flow or operating losses combined with a history of losses or a forecast of continuing losses associated with the use of the asset; or current expectation that the asset will more likely than not be sold or disposed significantly before the end of its estimated useful life. See “Note 10. (Gain) Loss on Disposal and Impairment of Long-Lived Assets” for more detail.
Recoverability is assessed based on the carrying amount of the asset and its fair value which is generally determined based on the sum of the undiscounted cash flows expected to result from the use and the eventual disposal of the asset, as well as specific appraisal in certain instances. An impairment loss is recognized in the Statement of Operations as “Impairment of intangibles and loss on long-lived assets” when the carrying amount is not recoverable and exceeds fair value.
Long-lived assets held for sale
Long-lived assets are classified as held for sale when certain criteria are met, which include: management commitment to a plan to sell the assets; the availability of the assets for immediate sale in their present condition; an active program to locate buyers and other actions to sell the assets has been initiated; whether the sale of the assets is probable and their transfer is expected to qualify for recognition as a completed sale within one year; whether the assets are being marketed at reasonable prices in relation to their fair value; and how unlikely it is that significant changes will be made to the plan to sell the assets. See “Note 10. (Gain) Loss on Disposal and Impairment of Long-Lived Assets” for more detail.
The Company measures long-lived assets to be disposed of by sale at the lower of carrying amount or fair value less cost to sell. Fair value is determined using quoted market prices or the anticipated cash flows discounted at a rate commensurate with the risk involved.
Pension and Other Postretirement Benefits
The funded status of our retirement-related benefit plans is recognized in the Consolidated Balance Sheets. The funded status is measured as the difference between the fair value of plan assets and the benefit obligation at fiscal year end, the measurement date. For defined benefit pension plans, the benefit obligation is the projected benefit obligation (PBO) and for the nonpension postretirement benefit plan the benefit obligation is the accumulated postretirement benefit obligation (APBO). The PBO represents the actuarial present value of benefits expected to be paid upon retirement. The APBO represents the actuarial present value of postretirement benefits attributed to employee services already rendered. The fair value of plan assets represents the current market value of cumulative company contributions made to an irrevocable trust fund, held for the sole benefit of
75
Table of Contents
JDS UNIPHASE CORPORATION
NOTES TO CONSOLIDATED FINANCIAL STATEMENTS—(Continued)
participants, which are invested by the trust fund. Underfunded plans, with the benefit obligation exceeding the fair value of plan assets, are aggregated and recorded as a retirement and nonpension postretirement benefit obligation equal to this excess. The current portion of the retirement-related benefit obligation represents the actuarial present value of benefits payable in the next 12 months in excess of the fair value of plan assets, measured on a plan-by-plan basis. This liability is recorded in other current liabilities in the Consolidated Balance Sheets.
(Gains) losses and prior service cost (credit) not recognized as a component of net periodic pension cost (income) in the Consolidated Statement of Operations as they arise are recognized as a component of accumulated other comprehensive income in the Consolidated Balances Sheets, net of tax. Those (gains) losses and prior service cost (credit) are subsequently recognized as a component of net periodic pension period cost (income) pursuant to the recognition and amortization provisions of applicable accounting standards. (Gains) losses arise as a result of differences between actual experience and assumptions or as a result of changes in actuarial assumptions. Prior service cost (credit) represents the cost of benefit improvements attributable to prior service granted in plan amendments.
Net periodic pension cost (income) is recorded in the Consolidated Statement of Operations and includes service cost, interest cost, expected return on plan assets, amortization of prior service cost and (gains) losses previously recognized as a component of accumulated other comprehensive income. Service cost represents the actuarial present value of participant benefits earned in the current year. Interest cost represents the time value of money cost associated with the passage of time. Certain events, such as changes in employee base, plan amendments and changes in actuarial assumptions, result in a change in the benefit obligation and the corresponding change in other comprehensive income. The result of these events is amortized as a component of net periodic cost (income) over the service lives of the participants, provided such amounts exceed thresholds which are based upon the benefit obligation or the value of plan assets.
The measurement of the benefit obligation and net periodic pension cost (income) is based on our estimates and actuarial valuations provided by third-party actuaries which are approved by our management. These valuations reflect the terms of the plans and use participant-specific information such as compensation, age and years of service, as well as certain assumptions, including estimates of discount rates, expected return on plan assets, rate of compensation increases, and mortality rates. While we believe that our assumptions are appropriate, significant differences in our actual experience or significant changes in our assumptions that may be required under new legislation, or accounting pronouncements, or otherwise may materially affect our pension and other post-retirement obligations and our future expense.
Concentration of Credit and Other Risks and Allowance for Doubtful Accounts
Financial instruments that potentially subject the Company to concentrations of credit risk consist primarily of cash equivalents, investments and trade receivables. The Company’s cash equivalents and short-term investments are held in safekeeping by large, creditworthy financial institutions. The Company invests its excess cash primarily in U.S. government and agency bonds, corporate obligations, money market funds, asset-backed securities, and other investment-grade securities. The Company has established guidelines relative to credit ratings, diversification and maturities that seek to maintain safety and liquidity.
The Company performs credit evaluations of its customers’ financial condition and generally does not require collateral from its customers. These evaluations require significant judgment and are based on a variety of factors including, but not limited to, current economic trends, historical payment, bad debt write-off experience, and financial review of the customer.
76
Table of Contents
JDS UNIPHASE CORPORATION
NOTES TO CONSOLIDATED FINANCIAL STATEMENTS—(Continued)
The Company maintains an allowance for doubtful accounts for estimated losses resulting from the inability of its customers to make required payments. When the Company becomes aware that a specific customer is unable to meet its financial obligations, the Company records a specific allowance to reflect the level of credit risk in the customer’s outstanding receivable balance. In addition, the Company records additional allowances based on certain percentages of aged receivable balances. The Company classifies bad debt expenses as selling, general and administrative expenses.
The Company is not able to predict changes in the financial stability of its customers. Any material change in the financial status of any one or a group of customers could have a material adverse effect on the Company’s results of operations and financial condition. Although such losses have been within management’s expectations to date, there can be no assurance that such allowances will continue to be adequate. The Company has significant trade receivables concentrated in the telecommunications industry. While the Company’s allowance for doubtful accounts balance is based on historical loss experience along with anticipated economic trends, unanticipated financial instability in the telecommunication’s industry could lead to higher than anticipated losses. No one customer accounted for greater than 10% of accounts receivables or revenue for the periods presented.
The Company depends on a limited number of contract manufacturers, subcontractors, and suppliers for raw materials, packages and standard components. The Company generally purchases these single or limited source products through standard purchase orders or one-year supply agreements and has no long-term guaranteed supply agreements with such vendors. While the Company seeks to maintain a sufficient safety stock of such products and maintains ongoing communications with its suppliers to guard against interruptions or cessation of supply, the Company’s business and results of operations could be adversely affected by a stoppage or delay of supply, substitution of more expensive or less reliable products, receipt of defective parts or contaminated materials, increases in the price of such supplies, or the Company’s inability to obtain reduced pricing from its suppliers in response to competitive pressures.
The Company generally uses a rolling twelve month forecast based on anticipated product orders, customer forecasts, product order history and backlog to determine its material requirements. Lead times for the parts and components that the Company orders vary significantly and depend on factors such as the specific supplier, contract terms and demand for a component at a given time. If the forecast does not meet actual demand, the Company may have excess or shortfalls of some materials and components, as well as excess inventory purchase commitments. The Company could experience reduced or delayed product shipments or incur additional inventory write-downs and cancellation charges or penalties, which would increase costs and could have a material adverse impact on the Company’s results of operations.
Foreign Currency Forward Contracts
The Company conducts its business and sells its products directly to customers primarily in North America, Europe and Asia. In the normal course of business, the Company’s financial position is routinely subject to market risks associated with foreign currency rate fluctuations due to balance sheet positions in foreign currencies. The Company evaluates foreign exchange risks and utilizes foreign currency forward contracts to reduce such risks. The foreign currency forward contracts generally expire within 120 days. The change in fair value of these foreign currency forward contracts is recorded as income or loss in the Company’s Consolidated Statements of Operations as a component of interest and other income (loss). Such changes, net of changes in the values of the hedged exposures, were not material during any of the periods presented.
77
Table of Contents
JDS UNIPHASE CORPORATION
NOTES TO CONSOLIDATED FINANCIAL STATEMENTS—(Continued)
Foreign Currency Translation
Assets and liabilities of non-U.S. subsidiaries that operate in a local currency environment, where that local currency is the functional currency, are translated into U.S. dollars at exchange rates in effect at the balance sheet date, with the resulting translation adjustments directly recorded to a separate component of accumulated other comprehensive income. Income and expense accounts are translated at the prior month balance sheet exchange rates.
Revenue Recognition
The Company recognizes revenue when it is realized or realizable and earned. The Company considers revenue realized or realizable and earned when it has persuasive evidence of an arrangement, delivery has occurred, the sales price is fixed or determinable, and collectibility is reasonably assured. Delivery does not occur until products have been shipped or services have been provided to the client, risk of loss has transferred to the client and client acceptance has been obtained, client acceptance provisions have lapsed, or the Company has objective evidence that the criteria specified in the client acceptance provisions have been satisfied. In situations where a formal acceptance is required but the acceptance only relates to whether the product meets its published specifications, revenue is generally recognized upon shipment provided all other revenue recognition criteria are met. The sales price is not considered to be fixed or determinable until all contingencies related to the sale have been resolved.
The Company reduces revenue for rebates and other similar allowances. Revenue is recognized only if these estimates can be reasonably and reliably determined. The Company bases its estimates on historical results taking into consideration the type of client, the type of transaction and the specifics of each arrangement.
In addition to the aforementioned general policies, the following are the specific revenue recognition policies for multiple-element arrangements and for each major category of revenue.
Hardware
Revenue from hardware sales is generally recognized when the product is shipped to the customer and when there are no unfulfilled company obligations that affect the customer’s final acceptance of the arrangement. Any cost of warranties and remaining obligations that are inconsequential or perfunctory are accrued when the corresponding revenue is recognized. Revenue from rentals and operating leases is recognized on a straight-line basis over the term of the rental or lease.
Multiple-Element Arrangements
The Company enters into multiple-element revenue arrangements, which may include any combination of hardware, software and services. Certain of the Company’s networking and communications products are integrated with software that is not considered more than incidental to the functionality of the equipment. The Company believes that this equipment is not considered software related and would therefore be excluded from the scope of the authoritative guidance on software revenue recognition. Accordingly, the Company allocates the fair value of the equipment when sold with software according to the authoritative guidance on revenue arrangements with multiple deliverables. The value of the arrangement, less the allocated hardware is then considered within the scope of the authoritative guidance for software revenue recognition.
To the extent that a deliverable(s) in a multiple-element arrangement is subject to specific guidance (for example, software that is subject to the authoritative guidance on software revenue recognition) on whether and/or how to separate multiple-deliverable arrangements into separate units of accounting (separability) and how to
78
Table of Contents
JDS UNIPHASE CORPORATION
NOTES TO CONSOLIDATED FINANCIAL STATEMENTS—(Continued)
allocate value among those separate units of accounting (allocation), that deliverable(s) is accounted for in accordance with such specific guidance. A multiple-element arrangement is separated into more than one unit of accounting if all of the following criteria are met:
| • | The delivered item(s) has value to the client on a standalone basis. |
| • | There is objective and reliable evidence of the fair value of the undelivered item(s). |
| • | If the arrangement includes a general right of return relative to the delivered item(s), delivery or performance of the undelivered item(s) is considered probable and substantially in the control of the Company. |
If these criteria are not met, revenue is deferred until the earlier of when such criteria are met or when the last undelivered element is delivered. If there is objective and reliable evidence of fair value for all units of accounting in an arrangement, the arrangement consideration is allocated to the separate units of accounting based on each unit's relative fair value. There may be cases, however, in which there is objective and reliable evidence of fair value of the undelivered item(s) but no such evidence for the delivered item(s). In those cases, the residual method is used to allocate the arrangement consideration. Under the residual method, the amount of consideration allocated to the delivered item(s) equals the total arrangement consideration less the aggregate fair value of the undelivered item(s). The revenue policies described below are then applied to each unit of accounting, as applicable.
Services
Revenue from services and system maintenance is typically recognized on a straight-line basis over the term of the contract. Revenue from time and material contracts is recognized at the contractual rates as labor hours are delivered and direct expenses are incurred. Revenue related to extended warranty and product maintenance contracts is deferred and recognized on a straight-line basis over the delivery period. The Company also generates service revenue from hardware repairs and calibrations which is recognized as revenue upon completion of the service.
Software
Revenue from perpetually licensed software is recognized at the inception of the license term. Revenue from maintenance, unspecified upgrades and technical support is recognized over the period such items are delivered. In multiple-element revenue arrangements that include software that is more than incidental to the products or services as a whole (software multiple-element arrangements), software and software-related elements are accounted for in accordance with the following policies. Software-related elements include software products and services as well as any non-software deliverable(s) for which a software deliverable is essential to its functionality.
A software multiple-element arrangement is separated into more than one unit of accounting if all of the following criteria are met:
| • | The functionality of the delivered element(s) is not dependent on the undelivered element(s). |
| • | There is vendor-specific objective evidence (“VSOE”) of fair value of the undelivered element(s). |
| • | Delivery of the delivered element(s) represents the culmination of the earnings process for that element(s). |
79
Table of Contents
JDS UNIPHASE CORPORATION
NOTES TO CONSOLIDATED FINANCIAL STATEMENTS—(Continued)
If these criteria are not met, the revenue is deferred until the earlier of when such criteria are met or when the last undelivered element is delivered. If there is VSOE for all units of accounting in an arrangement, the arrangement consideration is allocated to the separate units of accounting based on each unit's relative VSOE. There may be cases, however, in which there is VSOE of the undelivered item(s) but no such evidence for the delivered item(s). In these cases, the residual method is used to allocate the arrangement consideration. Under the residual method, the amount of consideration allocated to the delivered item(s) equals the total arrangement consideration less the aggregate VSOE of the undelivered elements. The Company limits its assessment of VSOE for each undelivered element is primarily determined via contract specific substantive renewal rates. Changes to the elements in an arrangement and the Company’s ability to establish vendor-specific objective evidence for those elements could affect the timing of the revenue recognition.
Warranty
The Company provides reserves for the estimated costs of product warranties at the time revenue is recognized. It estimates the costs of its warranty obligations based on its historical experience of known product failure rates, use of materials to repair or replace defective products and service delivery costs incurred in correcting product failures. In addition, from time to time, specific warranty accruals may be made if unforeseen technical problems arise. Should the actual experience relative to these factors differ from the estimates, the Company may be required to record additional warranty reserves. Alternatively, if the Company provides more reserves than it needs, it may reverse a portion of such provisions in future periods.
Shipping and Handling Costs
The Company records costs related to shipping and handling of revenue in cost of sales for all periods presented.
Advertising Expense
The Company expenses advertising costs as incurred. Advertising costs totalled $1.5 million, $2.4 million, and $2.4 million in fiscal 2010, 2009, and 2008, respectively.
Research and Development (“R&D”) Expense
Costs related to research and development, which primarily consists of labor and benefits, supplies, facilities, consulting, and outside service fees, are charged to expense as incurred, except as follows: capitalization of material software development costs begins when a product’s technological feasibility has been established in accordance with the authoritative accounting guidance. To date, the period between achieving technological feasibility, which the Company has defined as the establishment of a working model, and which typically occurs when beta testing commences, and the general availability of such software has been very short. Accordingly, software development costs have been expensed as incurred.
Stock-Based Compensation
The Company estimates the fair value of equity awards granted using the Black-Scholes-Merton option-pricing formula and a single option award approach. This option-pricing model requires the input of highly subjective assumptions, including the option’s expected life and the price volatility of the underlying stock. The expected stock price volatility assumption is determined using a combination of historical and implied volatility of our common stock. The Company believes that using a combination of historical and market-based implied volatility from traded options on JDSU common stock is a better indicator of expected volatility and future stock
80
Table of Contents
JDS UNIPHASE CORPORATION
NOTES TO CONSOLIDATED FINANCIAL STATEMENTS—(Continued)
price trends than relying solely on historical volatility. In addition, the Company is required to estimate the expected forfeiture rate and only recognize expense for those shares expected to vest. When estimating forfeitures, the Company considers voluntary termination behavior as well as future workforce reduction programs. Estimated forfeiture rates are trued-up to actual forfeiture as the stock-based awards vest. The total fair value of the equity awards, net of forfeiture, is recorded on a straight-line basis (except for performance based Full Value Awards and options with market conditions which are amortized based upon graded vesting method) over the requisite service periods of the awards, which is generally the vesting period.
Comprehensive Loss
The Company’s accumulated other comprehensive loss consists of the accumulated net unrealized gains or losses on available-for-sale investments, foreign currency translation adjustments, and pension liability. At July 3, 2010 and June 27, 2009, the Company had a balance of net unrealized gain of $0.7 million and net unrealized loss of $4.2 million, respectively, on available-for-sale investments. At July 3, 2010 and June 27, 2009, the Company had $7.9 million and $12.5 million, respectively, of foreign currency translation gains.
The components of comprehensive loss, net of tax, were as follows (in millions):
| Years Ended | ||||||||||||
| July 3, 2010 |
June 27, 2009 |
June 28, 2008 |
||||||||||
| Net loss |
$ | (61.8 | ) | $ | (909.5 | ) | $ | (40.3 | ) | |||
| Other comprehensive (loss) income: |
||||||||||||
| Net change in unrealized gains (losses) on investments, net of tax |
6.2 | (0.4 | ) | (0.6 | ) | |||||||
| Net change in cumulative translation adjustment, net of tax |
(4.6 | ) | (52.8 | ) | 28.5 | |||||||
| Net change in defined benefit obligation, net of tax |
(9.1 | ) | (0.8 | ) | 7.5 | |||||||
| Net change in other comprehensive (loss) income |
(7.5 | ) | (54.0 | ) | 35.4 | |||||||
| Comprehensive loss |
$ | (69.3 | ) | $ | (963.5 | ) | $ | (4.9 | ) | |||
At July 3, 2010 and June 27, 2009, balances for the components of accumulated other comprehensive income were as follows (in millions):
| Years Ended | |||||||
| July 3, 2010 |
June 27, 2009 |
||||||
| Unrealized gains (losses) on investments |
$ | 0.7 | $ | (4.2 | ) | ||
| Noncredit portion of losses related to investment securities |
— | (1.3 | ) | ||||
| Foreign currency translation gains |
7.9 | 12.5 | |||||
| Defined benefit obligation, net of tax |
6.5 | 15.6 | |||||
| Accumulated other comprehensive income |
$ | 15.1 | $ | 22.6 | |||
In April 2009, the Financial Accounting Standard Board (“FASB”) amended the existing guidance on determining whether an impairment for investments in debt securities is other-than-temporary. The new guidance was effective for the Company’s fourth quarter of fiscal 2009 and at June 27, 2009, resulted in a net pre-tax decrease to accumulated deficit and a corresponding increase to accumulated other comprehensive income of $1.3 million for the portion of other-than-temporary impairments recorded in earnings in a previous period on one of the securities in the Company’s portfolio that are related to factors other than credit and would not have been required to be recognized in earnings had the new guidance been effective for those periods.
81
Table of Contents
JDS UNIPHASE CORPORATION
NOTES TO CONSOLIDATED FINANCIAL STATEMENTS—(Continued)
Income Taxes
In accordance with the authoritative guidance on accounting for income taxes, the Company recognizes income taxes using an asset and liability approach. This approach requires the recognition of taxes payable or refundable for the current year and deferred tax liabilities and assets for the future tax consequences of events that have been recognized in its consolidated financial statements or tax returns. The measurement of current and deferred taxes is based on provisions of the enacted tax law and the effects of future changes in tax laws or rates are not anticipated.
The authoritative guidance provides for recognition of deferred tax assets if the realization of such deferred tax assets is more likely than not to occur. With the exception of certain international jurisdictions, the Company has determined that at this time it is more likely than not that deferred tax assets attributable to the remaining jurisdictions will not be realized, primarily due to uncertainties related to its ability to utilize its net operating loss carryforwards before they expire based on its recent years history of losses. Accordingly, the Company has established a valuation allowance for such deferred tax assets. If there is a change in the Company’s ability to realize its deferred tax assets, then its tax provision may decrease in the period in which it determines that realization is more likely than not.
The authoritative guidance on accounting for uncertainty in income taxes clarifies the accounting for uncertainty in income taxes recognized in an entity's financial statements and prescribes the recognition threshold and measurement attributes for financial statement recognition and measurement of a tax position taken or expected to be taken in a tax return. Additionally, it provides guidance on recognition, classification, and disclosure of tax positions.
The Company is subject to income tax audits by the respective tax authorities in all of the jurisdictions in which it operates. The determination of tax liabilities in each of these jurisdictions requires the interpretation and application of complex and sometimes uncertain tax laws and regulations. The Company recognizes liabilities based on its estimate of whether, and the extent to which, additional tax liabilities are more likely than not. If the Company ultimately determines that the payment of such a liability is not necessary, then it reverses the liability and recognizes a tax benefit during the period in which the determination is made that the liability is no longer necessary.
The recognition and measurement of current taxes payable or refundable and deferred tax assets and liabilities requires that the Company make certain estimates and judgments. Changes to these estimates or a change in judgment may have a material impact on the Company’s tax provision in a future period.
Restructuring Accrual
In accordance with authoritative guidance on accounting for costs associated with exit or disposal activities, generally costs associated with restructuring activities are recognized when they are incurred. However, in the case of leases, the expense is estimated and accrued when the property is vacated. Given the significance of, and the timing of the execution of such activities, this process is complex and involves periodic reassessments of estimates made at the time the original decisions were made, including evaluating real estate market conditions for expected vacancy periods and sub-lease rents. A liability for post-employment benefits for workforce reductions related to restructuring activities is recorded when payment is probable, the amount is reasonably estimable, and the obligation relates to rights that have vested or accumulated. The Company continually evaluates the adequacy of the remaining liabilities under its restructuring initiatives. Although the Company believes that these estimates accurately reflect the costs of its restructuring plans, actual results may differ, thereby requiring the Company to record additional provisions or reverse a portion of such provisions.
82
Table of Contents
JDS UNIPHASE CORPORATION
NOTES TO CONSOLIDATED FINANCIAL STATEMENTS—(Continued)
Loss Contingencies
The Company is subject to the possibility of various loss contingencies arising in the ordinary course of business. The Company considers the likelihood of loss or impairment of an asset or the incurrence of a liability, as well as its ability to reasonably estimate the amount of loss in determining loss contingencies. An estimated loss is accrued when it is probable that an asset has been impaired or a liability has been incurred and the amount of loss can be reasonably estimated. The Company regularly evaluates current information available to determine whether such accruals should be adjusted and whether new accruals are required.
Net Loss Per Share
The following table sets forth the computation of basic and diluted net loss per share (in millions, except per share data):
| Years Ended | ||||||||||||
| July 3, 2010 |
June 27, 2009 |
June 28, 2008 |
||||||||||
| Numerator: |
||||||||||||
| Net loss |
$ | (61.8 | ) | $ | (909.5 | ) | $ | (40.3 | ) | |||
| Denominator: |
||||||||||||
| Weighted-average number of common shares outstanding |
218.9 | 215.6 | 223.8 | |||||||||
| Net loss per share—basic and diluted |
$ | (0.28 | ) | $ | (4.22 | ) | $ | (0.18 | ) | |||
As the Company incurred net losses for the years ended 2010, 2009, and 2008, potential dilutive securities from stock options, employee stock purchase plan (“ESPP”), Full Value Awards, and Zero Coupon Senior Convertible Notes have been excluded from the diluted net loss per share computations as their effect was deemed anti-dilutive.
The following table sets forth the weighted average potentially dilutive securities excluded from the computation because their effect would have been anti-dilutive (in millions):
| Years Ended | ||||||
| July 3, 2010 |
June 27, 2009 |
June 28, 2008 | ||||
| Stock options and ESPP |
12.4 | 15.5 | 16.7 | |||
| Restricted shares and stock units |
6.4 | 7.7 | 3.0 | |||
| Zero coupon senior convertible notes |
— | 0.8 | 5.5 | |||
| 1% senior convertible notes |
10.7 | 12.4 | 14.0 | |||
| Total potentially dilutive securities |
29.5 | 36.4 | 39.2 | |||
Asset Retirement Obligations
Asset retirement obligations (“ARO”) are legal obligations associated with the retirement of long-lived assets. These liabilities are initially recorded at fair value and the related asset retirement costs are capitalized by increasing the carrying amount of the related assets by the same amount as the liability. Asset retirement costs are subsequently depreciated over the useful lives of the related assets. Subsequent to initial recognition, the
83
Table of Contents
JDS UNIPHASE CORPORATION
NOTES TO CONSOLIDATED FINANCIAL STATEMENTS—(Continued)
Company records period-to-period changes in the ARO liability resulting from the passage of time and revisions to either the timing or the amount of the original estimate of undiscounted cash flows. The Company derecognizes ARO liabilities when the related obligations are settled. At July 3, 2010 and June 27, 2009, $0.5 million and $7.3 million of ARO was included in the Consolidated Balance Sheets in “Other current liabilities” and the remainder of $7.4 million and $6.6 million was included in “Other non-current liabilities”.
| (in millions) |
Balance at Beginning of Period |
Liabilities Incurred |
Liabilities Settled |
Accretion Expense |
Revisions to Estimates |
Balance at End of Period | |||||||||
| Asset Retirement Obligations: |
|||||||||||||||
| Year ended July 3, 2010 |
$ | 13.9 | 0.7 | (7.2 | ) | 0.5 | — | $ | 7.9 | ||||||
| Year ended June 27, 2009 |
$ | 13.1 | 0.4 | (0.4 | ) | 0.5 | 0.3 | $ | 13.9 | ||||||
Note 2. Recent Accounting Pronouncements
In April 2010, the FASB issued authoritative guidance clarifying that share-based payment award with an exercise price denominated in the currency of a market in which a substantial portion of the entity’s equity shares trades should not be considered to contain a condition that is not a market, performance, or service condition. Therefore, an entity would not classify such an award as a liability if it otherwise qualifies as equity. The guidance is effective for us beginning in the first quarter of fiscal 2012. The Company does not anticipate that the adoption of this statement will have a material impact on its consolidated financial statements.
In March 2010, the FASB issued authoritative guidance amending existing guidance surrounding the consolidation of variable interest entities (“VIE”) to require an enterprise to qualitatively assess the determination of the primary beneficiary of a VIE based on whether the entity a) has the power to direct the activities of a VIE that most significantly impact the entity’s economic performance and b) has the obligation to absorb losses of the entity or the right to receive benefits from the entity that could potentially be significant to the VIE. The guidance also requires an ongoing reconsideration of the primary beneficiary, and amends the events that trigger a reassessment of whether an entity is a VIE. Enhanced disclosures are also required to provide information about an enterprise’s involvement in a VIE. This guidance is effective for the Company beginning in the first quarter of fiscal 2011. The Company is currently evaluating the potential impact, if any, of the adoption of this guidance on its consolidated financial statements.
In September 2009, the FASB issued authoritative guidance that applies to revenue arrangements with multiple deliverables and provides another alternative for determining the selling price of deliverables. In addition, the residual method of allocating arrangement consideration is no longer permitted under this guidance. The guidance is effective for the Company beginning in the first quarter of fiscal 2011. The Company is currently finalizing the assessment of the impact of the adoption of this guidance on its consolidated financial statements.
In September 2009, the FASB issued authoritative guidance which removes non-software components of tangible products and certain software components of tangible products from the scope of existing software revenue guidance, resulting in the recognition of revenue similar to that for other tangible products. It also requires expanded qualitative and quantitative disclosures. The guidance is effective for the Company beginning in the first quarter of fiscal 2011. The Company is currently evaluating the potential impact, if any, of the adoption of this guidance on its consolidated financial statements.
Note 3. Revision to Prior Period Financial Statements
In May 2008, the FASB issued authoritative guidance which applies to convertible debt securities that, upon conversion, may be settled by the issuer fully or partially in cash. The guidance was effective for fiscal years
84
Table of Contents
JDS UNIPHASE CORPORATION
NOTES TO CONSOLIDATED FINANCIAL STATEMENTS—(Continued)
(and interim periods within those fiscal years) beginning after December 15, 2008 and was to be applied retrospectively to all past periods presented—even if the instrument has matured, converted, or otherwise been extinguished as of the effective date of this guidance. The Company has adopted this guidance in the first quarter of fiscal 2010.
The Company’s adoption of this guidance affects its 1% Senior Convertible Notes due 2026 (“Convertible Notes”). This guidance requires the issuer of convertible debt instruments to separately account for the liability (debt) and equity (conversion option) components of such instruments and retrospectively adjust the financial statements for all periods presented. The fair value of liability component is determined based on the market rate for similar debt instruments without the conversion feature and the residual between the proceeds and the fair value of liability component is recorded as equity at the time of issuance. Additionally transactions cost are allocated using the same percentage as the liability and equity components. As a result, Total stockholders’ equity as of June 27, 2009 increased by $73.9 million, which included an increase in Additional paid-in capital by $155.1 million, offset by a decrease in Accumulated deficit by $81.2 million, and Long-term debt as of June 27, 2009 decreased by $75.1 million.
The Company’s adoption of this guidance results in higher interest expense for fiscal 2006 through fiscal 2013, assuming the holders will require JDSU to repurchase the Convertible Notes at a cash price equal to 100% of the principal amount plus accrued and unpaid interest on May 15, 2013, the earliest date when the holders can exercise such right and a lower gain on repurchase of the Convertible Notes in fiscal 2009. The impact to net loss in fiscal 2008 and 2009 is as follows:
| For the Fiscal Years Ended | ||||||||
| 2009 | 2008 | |||||||
| (in millions, except per share data) |
||||||||
| Increase in net loss |
$ | 43.1 | (a) | $ | 18.6 | (b) | ||
| Increase in net loss per share: |
||||||||
| Basic and diluted |
$ | 0.20 | $ | 0.08 | ||||
| Shares used to compute per share amounts: |
||||||||
| Basic and diluted |
215.6 | 223.8 | ||||||
| (a) | The total increase in net loss was due to the decrease in gain on debt repurchase of $25.3 million and the increase in interest expense of $17.8 million resulted from the amortization of discount on 1% Senior Convertible Notes. |
| (b) | The total increase in net loss was due to the increase in interest expense resulted from the amortization of discount on 1% Senior Convertible Notes. |
On September 4, 2009 the Company sold certain non-core assets related to its wholly owned subsidiary da Vinci Systems LLC (“da Vinci”). As a result, the operations of da Vinci have been presented as discontinued operations for all periods presented. See “Note 22. Discontinued Operations”.
85
Table of Contents
JDS UNIPHASE CORPORATION
NOTES TO CONSOLIDATED FINANCIAL STATEMENTS—(Continued)
The following table presents the effect of these retrospective adjustments to certain line items on the Company’s Consolidated Balance Sheet as of June 27, 2009:
| June 27, 2009 As Previously Reported(a) |
Adjustments | June 27, 2009 As Revised |
||||||||||
| (in millions, except share and per share data) |
||||||||||||
| ASSETS |
||||||||||||
| Other current assets |
$ | 66.2 | $ | (0.4 | )(b) | $ | 65.8 | |||||
| Deferred income taxes |
6.2 | (0.5 | )(c) | 5.7 | ||||||||
| Other non-current assets |
18.3 | (0.8 | )(d) | 17.5 | ||||||||
| Total assets |
$ | 1,669.8 | $ | (1.7 | ) | $ | 1,668.1 | |||||
| LIABILITIES AND STOCKHOLDERS’ EQUITY |
||||||||||||
| Long-term debt |
$ | 325.0 | $ | (75.1 | )(e) | $ | 249.9 | |||||
| Other non-current liabilities |
174.3 | (0.5 | )(f) | 173.8 | ||||||||
| Commitments and contingencies (Note 17, 19, and 20) |
— | — | — | |||||||||
| Stockholders’ equity: |
||||||||||||
| Preferred Stock, $0.001 par value: Authorized shares: 1,000,000 |
— | — | — | |||||||||
| Common Stock, $0.001 par value: |
||||||||||||
| Authorized shares: 1,000,000,000 |
0.2 | — | 0.2 | |||||||||
| Issued and outstanding shares: 216,971,017 at June 27, 2009 and 221,977,736 at June 28, 2008 |
||||||||||||
| Additional paid-in capital |
69,375.4 | 155.1 | (g) | 69,530.5 | ||||||||
| Accumulated deficit |
(68,537.6 | ) | (81.2 | )(h) | (68,618.8 | ) | ||||||
| Total stockholders’ equity |
860.6 | 73.9 | 934.5 | |||||||||
| Total liabilities and stockholders’ equity |
$ | 1,669.8 | $ | (1.7 | ) | $ | 1,668.1 | |||||
| (a) | As reported in the Company's Form 10-K for the fiscal year ended June 27, 2009. |
| (b) | Other current assets as of June 27, 2009 decreased by $0.4 million mainly due to a retrospective adjustment of debt issuance cost related to the 1% Senior Convertible Notes. |
| (c) | Deferred income taxes as of June 27, 2009 decreased by $0.5 million due to a retrospective adjustment of deferred tax assets upon the adoption of the authoritative guidance. |
| (d) | Other non-current assets as of June 27, 2009 decreased by $0.8 million mainly due to a retrospective adjustment of debt issuance cost related to the 1% Senior Convertible Notes. |
| (e) | Long-term debt as of June 27, 2009 decreased by $75.1 million due to the reclassification of the $158.5 million equity component to Additional paid-in capital, offset by $57.7 million accretion of interest resulted from amortization of debt discount, and $25.7 million adjustment related to the repurchases of 1% Senior Convertible Notes. |
| (f) | Other non-current liabilities as of June 27, 2009 decreased by $0.5 million due to a retrospective adjustment of deferred tax liability upon the adoption of the authoritative guidance. |
| (g) | Additional paid-in capital as of June 27, 2009 increased by $155.1 million due to the reclassification of the $158.5 million equity component from Long-term debt, offset by the equity issuance cost of $3.4 million. |
| (h) | Accumulated deficit as of June 27, 2009 increased by $81.2 million due to the increase of interest expense by $57.7 million and decrease in gain on debt repurchase by $25.3 million, offset by a decrease in amortization of debt issuance cost of $1.8 million. |
86
Table of Contents
JDS UNIPHASE CORPORATION
NOTES TO CONSOLIDATED FINANCIAL STATEMENTS—(Continued)
The following tables presents the effect of these adjustments to the Company’s Consolidated Statement of Operations for the years ended June 28, 2008 and June 27, 2009:
| Year Ended June 28, 2008 | ||||||||||||||||
| As Previously Reported(a) |
Adjustments related to 1% Senior Coupon Notes |
Adjustments related to Discontinued Operations (Note 22) |
As Revised | |||||||||||||
| (In millions, except per share data) | ||||||||||||||||
| Net revenue |
$ | 1,530.1 | $ | — | $ | (18.1 | ) | $ | 1,512.0 | |||||||
| Cost of sales |
885.5 | — | (6.4 | ) | 879.1 | |||||||||||
| Amortization of acquired technologies |
49.3 | — | — | 49.3 | ||||||||||||
| Impairment of acquired developed technologies |
4.0 | — | — | 4.0 | ||||||||||||
| Gross profit |
591.3 | — | (11.7 | ) | 579.6 | |||||||||||
| Operating expenses: |
||||||||||||||||
| Research and development |
188.1 | — | (3.7 | ) | 184.4 | |||||||||||
| Selling, general and administrative |
455.8 | — | (6.8 | ) | 449.0 | |||||||||||
| Amortization of other intangibles |
30.0 | — | — | 30.0 | ||||||||||||
| Impairment of goodwill |
37.0 | — | — | 37.0 | ||||||||||||
| Loss and impairment of long-lived assets |
6.7 | — | — | 6.7 | ||||||||||||
| Restructuring and related charges |
6.7 | — | — | 6.7 | ||||||||||||
| Total operating expenses |
724.3 | — | (10.5 | ) | 713.8 | |||||||||||
| Loss from operations |
(133.0 | ) | — | (1.2 | ) | (134.2 | ) | |||||||||
| Interest and other income |
120.1 | — | — | 120.1 | ||||||||||||
| Interest expense |
(8.8 | ) | (18.6 | ) | — | (27.4 | ) | |||||||||
| Gain on sale of investments |
2.4 | — | — | 2.4 | ||||||||||||
| Impairment of investments |
— | — | — | — | ||||||||||||
| Loss from continuing operations before income taxes |
(19.3 | ) | (18.6 | ) | (1.2 | ) | (39.1 | ) | ||||||||
| Provision of income taxes |
2.4 | — | — | 2.4 | ||||||||||||
| Loss from continuing operations, net of tax |
(21.7 | ) | (18.6 | ) | (1.2 | ) | (41.5 | ) | ||||||||
| Gain from discontinued operations, net of tax |
— | — | 1.2 | 1.2 | ||||||||||||
| Net loss |
$ | (21.7 | ) | $ | (18.6 | ) | $ | — | $ | (40.3 | ) | |||||
| (a) | As reported in the Company’s Form 10-K for the year ended June 28, 2008. |
87
Table of Contents
JDS UNIPHASE CORPORATION
NOTES TO CONSOLIDATED FINANCIAL STATEMENTS—(Continued)
| Year Ended June 27, 2009 | ||||||||||||||||
| As Previously Reported(a) |
Adjustments related to 1% Senior Coupon Notes |
Adjustments related to Discontinued Operations (Note 22) |
As Revised | |||||||||||||
| (In millions, except per share data) | ||||||||||||||||
| Net revenue |
$ | 1,294.4 | $ | — | $ | (11.1 | ) | $ | 1,283.3 | |||||||
| Cost of sales |
748.5 | — | (5.6 | ) | 742.9 | |||||||||||
| Amortization of acquired technologies |
48.9 | — | — | 48.9 | ||||||||||||
| Impairment of acquired developed technologies |
4.9 | — | — | 4.9 | ||||||||||||
| Gross profit |
492.1 | — | (5.5 | ) | 486.6 | |||||||||||
| Operating expenses: |
||||||||||||||||
| Research and development |
170.1 | — | (3.0 | ) | 167.1 | |||||||||||
| Selling, general and administrative |
404.6 | — | (5.6 | ) | 399.0 | |||||||||||
| Amortization of other intangibles |
27.0 | — | — | 27.0 | ||||||||||||
| Impairment of goodwill |
741.7 | — | — | 741.7 | ||||||||||||
| Loss and impairment of long-lived assets |
13.2 | — | — | 13.2 | ||||||||||||
| Restructuring and related charges |
38.7 | — | (0.2 | ) | 38.5 | |||||||||||
| Total operating expenses |
1,395.3 | — | (8.8 | ) | 1,386.5 | |||||||||||
| Loss from operations |
(903.2 | ) | — | 3.3 | (899.9 | ) | ||||||||||
| Interest and other income |
58.8 | (25.3 | ) | — | 33.5 | |||||||||||
| Interest expense |
(7.7 | ) | (17.8 | ) | — | (25.5 | ) | |||||||||
| Gain on sale of investments |
1.8 | — | — | 1.8 | ||||||||||||
| Impairment of investments |
(18.4 | ) | — | — | (18.4 | ) | ||||||||||
| Loss from continuing operations before income taxes |
(868.7 | ) | (43.1 | ) | 3.3 | (908.5 | ) | |||||||||
| (Benefit) for income taxes |
(2.3 | ) | — | — | (2.3 | ) | ||||||||||
| Loss from continuing operations, net of tax |
(866.4 | ) | (43.1 | ) | 3.3 | (906.2 | ) | |||||||||
| Loss from discontinued operations, net of tax |
— | — | (3.3 | ) | (3.3 | ) | ||||||||||
| Net loss |
$ | (866.4 | ) | $ | (43.1 | ) | $ | — | $ | (909.5 | ) | |||||
| (a) | As reported in the Company’s Form 10-K for the year ended June 27, 2009. |
Note 4. Mergers and Acquisitions
Fiscal 2010 Acquisitions
Network Solutions Division of Agilent Technologies, Inc. (“NSD”)
In May 2010, the Company purchased NSD from Agilent Technologies, Inc. for a total purchase price consideration of approximately $163.8 million. NSD is included in the Company’s Communications Test and Measurement segment.
The acquisition significantly expands the Company’s communications test position, including the emerging market for Long Term Evolution (“LTE”)/4G solutions required by the dozens of wireless service providers and network equipment, manufacturers upgrading to this next-generation technology. LTE will provide much higher bandwidth to support mobile data and video applications on handsets, notebooks, portable readers, and gaming devices, amongst others.
88
Table of Contents
JDS UNIPHASE CORPORATION
NOTES TO CONSOLIDATED FINANCIAL STATEMENTS—(Continued)
The Company adopted the new authoritative guidance on business combinations during the first quarter of fiscal 2010 and the acquisition was accounted for in accordance with this guidance; therefore, the tangible and intangible assets acquired and liabilities assumed were recorded at fair value on the acquisition date.
A portion of the purchase price was allocated to developed product technology and IPR&D. They were identified and valued through an analysis of data provided by NSD concerning developmental products, their stage of development, the time and resources needed to complete them, target markets, their expected income generating ability and associated risks. The Income Approach, which is based on the premise that the value of an asset is the present value of its future earning capacity, was the primary valuation technique employed. Discount rates of 17% and 23% were applied to developed product technology and IPR&D, respectively.
Developed product technology, which includes products that are already technologically feasible, is primarily comprised of a portfolio of service assurance systems, network protocol test systems, and drive test systems.
Developmental projects that had not reached technological feasibility are recognized as identifiable intangible assets in accordance with authoritative accounting guidance. The principal project at the acquisition date relates to developing a network probe. This technology would enable network operators to more comprehensively sample data from the network. The Company incurred post-acquisition cost of approximately $0.8 million during fiscal 2010 for the project and estimates that additional investment of approximately $6.8 million in research and development will be required. The Company expects to complete the project by the end of the first quarter of fiscal 2012.
The purchase price was allocated as follows (in millions):
| Net tangible assets acquired |
$ | 28.3 | |
| Intangible assets acquired: |
|||
| Developed technology |
42.7 | ||
| Customer relationships |
30.8 | ||
| In-process research and development |
9.8 | ||
| Customer backlog |
5.8 | ||
| Goodwill |
46.4 | ||
| Total purchase price |
$ | 163.8 | |
The following table summarizes the components of the tangible assets acquired at fair value (in millions):
| Accounts receivable |
$ | 27.2 | ||
| Inventories |
4.7 | |||
| Property and equipment |
4.8 | |||
| Accounts payable |
(4.8 | ) | ||
| Deferred revenue |
(6.3 | ) | ||
| Other assets and liabilities, net |
2.7 | |||
| Net tangible assets acquired |
$ | 28.3 | ||
The acquired intangible assets, except for in-process research and development (IPR&D), are being amortized over their estimated useful lives, which are presented in the table below:
| Developed technology |
5 years | |
| Customer relationships |
5 to 9 years | |
| Customer backlog |
1 to 2 years |
89
Table of Contents
JDS UNIPHASE CORPORATION
NOTES TO CONSOLIDATED FINANCIAL STATEMENTS—(Continued)
In accordance with authoritative guidance, the Company recognizes IPR&D at fair value as of the acquisition date, and subsequently accounts for it as an indefinite-lived intangible asset until completion or abandonment of the associated research and development efforts. IPR&D is tested for impairment during the period it is considered an indefinite lived asset.
Goodwill, which represents the excess of the purchase price over the fair value of net tangible and identified intangible assets acquired, is not being amortized but is reviewed annually for impairment, or more frequently if impairment indicators arise, in accordance with authoritative guidance. In part, goodwill reflected the competitive advantages the Company expected to realize from NSD’s standing in the communications test industry. Goodwill has been assigned to the Communications Test and Measurement segment and is expected to be deductible for tax purposes.
In accordance with authoritative guidance, the Company expensed $3.2 million of acquisition-related costs incurred as Selling, general and administrative expenses in the Company’s consolidated statements of operations for the year ended July 3, 2010.
NSD’s results of operations have been included in the Company’s consolidated financial statements subsequent to the date of acquisition. The financial information in the table below summarizes the results of operations of the Company and NSD, on a pro forma basis, as though the companies have been combined as of the beginning of each of the years presented:
| (in millions, except per share data) |
July 3, 2010 |
June 27, 2009 |
||||
| Pro forma net revenue |
1,497.5 | 1,464.4 | ||||
| Pro forma net loss |
(79.1 | ) | (926.4 | ) | ||
| Pro Forma net loss per share—basic and diluted |
(0.36 | ) | (4.30 | ) |
The unaudited, proforma financial information is presented for informational purposes only and is not indicative of the results of operations that would have been achieved if the acquisition had taken place at the beginning of each of the periods presented.
Storage Network Tools Business of Finisar Corporation (“SNT”)
In July 2009, the Company purchased the Storage Network Tools business of Finisar Corporation (“SNT”) for approximately $40.7 million in cash. SNT is included in JDSU’s Communications Test and Measurement segment.
SNT is one of the world’s leading providers of storage area network (SAN) protocol test tools, software and services. By acquiring SNT, the Company entered the storage protocol test market, expanded its lab test market presence and facilitated product innovation addressing Fibre Channel over Ethernet and other emerging SAN test market opportunities.
The Company adopted the new authoritative guidance on business combinations during the first quarter of fiscal 2010 and the acquisition was accounted for in accordance with this guidance; therefore, the tangible and intangible assets acquired and liabilities assumed were recorded at fair value on the acquisition date.
90
Table of Contents
JDS UNIPHASE CORPORATION
NOTES TO CONSOLIDATED FINANCIAL STATEMENTS—(Continued)
The purchase price was allocated as follows (in millions):
| Net tangible assets acquired |
$ | 1.8 | |
| Intangible assets acquired: |
|||
| Developed technology |
16.2 | ||
| Customer relationships |
10.0 | ||
| In-process research and development |
1.5 | ||
| Other |
1.3 | ||
| Goodwill |
9.9 | ||
| Total purchase price |
$ | 40.7 | |
The following table summarizes the components of the tangible assets acquired at fair value (in millions):
| Inventories |
$ | 1.5 | ||
| Property and equipment |
0.6 | |||
| Deferred revenue |
(0.1 | ) | ||
| Other assets and liabilities, net |
(0.2 | ) | ||
| Net tangible assets acquired |
$ | 1.8 | ||
The acquired intangible assets, except for in-process research and development (IPR&D), are being amortized over their estimated useful lives, which are presented in the table below:
| Developed technology |
5 years | |
| Customer relationships |
6 years | |
| Trademark/tradename |
5 years | |
| Internally used software |
3 years |
In accordance with authoritative guidance, the Company recognizes IPR&D at fair value as of the acquisition date, and subsequently accounts for it as an indefinite-lived intangible asset until completion or abandonment of the associated research and development efforts. IPR&D is tested for impairment during the period it is considered an indefinite lived asset.
Goodwill, which represents the excess of the purchase price over the fair value of net tangible and identified intangible assets acquired, is not being amortized but is reviewed annually for impairment, or more frequently if impairment indicators arise, in accordance with authoritative guidance. In part, goodwill reflected the competitive advantages the Company expected to realize from SNT’s standing in the storage protocol test industry. Goodwill has been assigned to the Communications Test and Measurement segment and is expected to be deductible for tax purposes.
In accordance with authoritative guidance, the Company expensed $0.4 million of acquisition-related costs incurred as Selling, general and administrative expenses in the Company’s consolidated statements of operations for the quarter ended October 3, 2009.
SNT’s results of operations have been included in the Company’s consolidated financial statements subsequent to the date of acquisition. Pro forma results of operations have not been presented because the effect of the acquisition was not material to prior period financial statements.
91
Table of Contents
JDS UNIPHASE CORPORATION
NOTES TO CONSOLIDATED FINANCIAL STATEMENTS—(Continued)
Fiscal 2008 Acquisitions
American Bank Note Holographics, Inc. (“ABNH”)
In February 2008, the Company purchased ABNH, a public company, for approximately 8.7 million shares of the Company’s common stock with a market value of $110.3 million at the measurement date and $19.5 million in cash, including $1.2 million of direct transaction costs incurred in connection with the acquisition. JDSU also assumed ABNH’s employee outstanding stock options at close, valued at $11.4 million at the measurement date.
ABNH is a market leader in the origination, production and marketing of holograms for security applications and the leading supplier of optical security devices for the transaction card market and is included in JDSU’s Advanced Optical Technologies segment.
The transaction was accounted for as a purchase in accordance with authoritative guidance effective at the time; therefore, the tangible and intangible assets acquired and liabilities assumed were recorded at fair value on the acquisition date.
The purchase price was allocated as follows (in millions):
| Net tangible assets acquired |
$ | 23.5 | |
| Intangible assets acquired: |
|||
| Transaction card customer relationships |
35.5 | ||
| Secure government relationships |
1.8 | ||
| Proprietary know-how and trade secret |
15.4 | ||
| Trademark/tradename |
0.3 | ||
| Goodwill |
65.9 | ||
| Total purchase price |
$ | 142.4 | |
The following table summarizes the components of the tangible assets acquired at fair value (in millions):
| Cash |
$ | 17.0 | ||
| Accounts receivable |
4.1 | |||
| Inventories |
7.3 | |||
| Property and equipment |
5.3 | |||
| Other assets and liabilities, net |
(10.2 | ) | ||
| Net tangible assets acquired |
$ | 23.5 | ||
The acquired intangible assets are being amortized over their estimated useful lives, which are presented in the table below:
| Transaction card customer relationships |
11-16 years | |
| Secure government relationships |
9 years | |
| Proprietary know-how and trade secret |
4 years | |
| Trademark/tradename |
9 years |
Goodwill, which represents the excess of the purchase price over the fair value of tangible and identified intangible assets acquired, is not being amortized but is reviewed annually for impairment, or more frequently if
92
Table of Contents
JDS UNIPHASE CORPORATION
NOTES TO CONSOLIDATED FINANCIAL STATEMENTS—(Continued)
impairment indicators arise, in accordance with authoritative guidance. In part, goodwill reflected the competitive advantages the Company expected to realize from ABNH’s standing in the optical security industry. Goodwill has been assigned to the Advanced Optical Technologies segment and is not expected to be deductible for tax purposes. See “Note 8. Goodwill” for more details related to ABNH impairment in fiscal 2008 and fiscal 2009.
Westover Scientific Inc. (“Westover”)
In January 2008, the Company purchased Westover’s Fiber Optic Division for approximately $51.5 million in cash, including $0.8 million of direct transaction costs incurred in connection with the acquisition.
The fiber division of Westover is a leading provider of fiber optic inspection and cleaning solutions. Westover’s products complement JDSU’s existing fiber field and lab and production test portfolio and is included in the Communications Test and Measurement segment.
The transaction was accounted for as a purchase in accordance with authoritative guidance effective at the time; therefore, the tangible and intangible assets acquired and liabilities assumed were recorded at fair value on the acquisition date.
The purchase price was allocated as follows (in millions):
| Net tangible assets acquired |
$ | 1.5 | |
| Intangible assets acquired: |
|||
| Developed technology |
21.7 | ||
| Customer relationships |
2.0 | ||
| Other |
0.5 | ||
| Goodwill |
25.8 | ||
| Total purchase price |
$ | 51.5 | |
The following table summarizes the components of the tangible assets acquired at fair value (in millions):
| Inventories |
$ | 1.6 | ||
| Property and equipment |
0.1 | |||
| Other assets and liabilities, net |
(0.2 | ) | ||
| Net tangible assets acquired |
$ | 1.5 | ||
The acquired intangible assets are being amortized over their estimated useful lives, which are presented in the table below:
| Developed technology |
6-12 years | |
| Customer relationships |
1-3 years | |
| Tradename |
5 years | |
| Customer backlog |
0.5 year |
Goodwill, which represents the excess of the purchase price over the fair value of tangible and identified intangible assets acquired, is not being amortized but is reviewed annually for impairment, or more frequently if impairment indicators arise, in accordance with authoritative guidance. In part, goodwill reflected the competitive advantages the Company expected to realize from Westover’s standing in the fiber optic inspection and cleaning solution industry. Goodwill has been assigned to the Communications Test and Measurement segment and is not expected to be deductible for tax purposes.
93
Table of Contents
JDS UNIPHASE CORPORATION
NOTES TO CONSOLIDATED FINANCIAL STATEMENTS—(Continued)
Westover’s results of operations have been included in the Company’s consolidated financial statements subsequent to the date of acquisition.
The former shareholders of Westover made certain representations and warranties to the Company and agreed to indemnify the Company against damages which might arise from a breach of those undertakings. As security for this indemnification obligation of the former Westover shareholders, JDSU retained approximately $5.2 million of the cash consideration, which was released on the twelve month anniversary of the acquisition date. This cash consideration has been included in the purchase consideration in the preliminary purchase price allocation.
The Company was obligated to pay contingent cash consideration of up to $7.0 million if certain revenue targets were achieved during the 3 years from acquisition date through January 31, 2010. All three phases of the revenue targets were met and thus, the consideration were fully paid and increased the recorded value of goodwill. The Company impaired the full amount of the increased goodwill relating to the first two phases, in the amount of $6.0 million, in fiscal 2009 as a result of its goodwill impairment review. See “Note 8. Goodwill” for more details.
Note 5. Balance Sheet and Other Details
Accounts Receivable Reserves and Allowances
The components of account receivable reserves and allowances were as follows (in millions):
| Years Ended | ||||||
| July 3, 2010 |
June 27, 2009 | |||||
| Allowance for doubtful accounts |
$ | 2.6 | $ | 2.3 | ||
| Allowance for sales returns and other |
0.4 | 0.1 | ||||
| Total accounts receivable reserves and allowances |
$ | 3.0 | $ | 2.4 | ||
The activities and balances for allowance for doubtful accounts are as follows (in millions):
| Balance at Beginning of Period |
Charged to Costs and Expenses |
Deduction(1) | Balance at End of Period | ||||||||||
| Allowance for doubtful accounts: |
|||||||||||||
| Year ended July 3, 2010 |
$ | 2.3 | $ | 1.2 | $ | (0.9 | ) | $ | 2.6 | ||||
| Year ended June 27, 2009 |
4.7 | 2.7 | (5.1 | ) | 2.3 | ||||||||
| Year ended June 28, 2008 |
4.8 | 0.3 | (0.4 | ) | 4.7 | ||||||||
| (1) | Write-offs of uncollectible accounts, net of recoveries. |
Inventories
Inventories are stated at the lower of cost or market, and include material, labor, and manufacturing overhead costs. The components of inventories were as follows (in millions):
| Years Ended | ||||||
| July 3, 2010 |
June 27, 2009 | |||||
| Deferred cost of sales |
$ | 17.0 | $ | 11.5 | ||
| Finished goods |
43.7 | 52.3 | ||||
| Work in process |
25.4 | 33.6 | ||||
| Raw materials and purchased parts |
39.6 | 47.4 | ||||
| Total inventories |
$ | 125.7 | $ | 144.8 | ||
94
Table of Contents
JDS UNIPHASE CORPORATION
NOTES TO CONSOLIDATED FINANCIAL STATEMENTS—(Continued)
During fiscal 2010, 2009, and 2008, the Company recorded write-downs of inventories of $14.6 million, $12.9 million, and $24.6 million respectively.
The Company also sold previously written-down inventories of $10.4 million, $13.8 million, and $17.2 million during fiscal 2010, 2009, and 2008, respectively. In addition, the Company has an active scrap program and typically disposes of inventory that has been written down through the use of scrap dealers or physical disposal/destruction. During fiscal 2010, 2009, and 2008, the Company scrapped $5.8 million, $38.5 million, and $31.2 million of previously written-down inventory, respectively.
The inventory write-downs were predominantly the result of changes in forecasted customer demand and technological changes in the Company’s products. The majority of the inventory written down consisted of raw material and finished goods. The major elements of the written down raw material consists of components and items that had not entered into production. The finished goods inventory includes the cost of raw material inputs, labor, and overhead.
The Company operates in markets with relatively few customers and has historically experienced variability in product demand driven by the buying behavior of these customers. In addition, the Company’s products utilize long-lead time parts which are available from a limited set of vendors. The combined effects of a limited customer base, variability of demand among the customer base and significant long-lead time or single sourced materials has historically contributed to significant inventory write-downs. The Company routinely reviews inventory for usage potential, including fulfilment of customer warranty obligations and spare part requirements. The Company writes down to zero the value of excess and obsolete (“E&O”) inventory that is not expected to be consumed through operations generally within 12 months. Excess is written down to zero value in large part due to the Company’s history of changes in customer demand and inherent product obsolescence concerns.
For any written down inventory items retained, the Company evaluates the future realizable value of inventories and impact on gross margins, taking into consideration product life cycles, technological and product changes, demand visibility and other market conditions. The Company believes its current process for writing down inventory appropriately balances the risk in the marketplace with a fair representation of the realizable value of the Company’s inventory.
Property, Plant and Equipment, Net
The components of property, plant and equipment, net were as follows (in millions):
| Years Ended | ||||||||
| July 3, 2010 |
June 27, 2009 |
|||||||
| Land |
$ | 17.0 | $ | 17.1 | ||||
| Buildings and improvements |
35.2 | 39.2 | ||||||
| Machinery and equipment |
295.5 | 289.9 | ||||||
| Furniture, fixtures, software and office equipment |
146.2 | 133.1 | ||||||
| Leasehold improvements |
57.7 | 57.6 | ||||||
| Construction in progress |
25.0 | 25.6 | ||||||
| 576.6 | 562.5 | |||||||
| Less: Accumulated depreciation |
(393.6 | ) | (371.4 | ) | ||||
| Property, plant and equipment, net |
$ | 183.0 | $ | 191.1 | ||||
95
Table of Contents
JDS UNIPHASE CORPORATION
NOTES TO CONSOLIDATED FINANCIAL STATEMENTS—(Continued)
At July 3, 2010, property, plant and equipment, net included $20.0 million in land and buildings related to the Santa Rosa sale and leaseback transactions accounted for under the financing method. See “Note 6. Financing Obligation” for more detail.
During fiscal 2010, 2009, and 2008, the Company recorded $58.3 million, $68.5 million, and $65.2 million, respectively, of depreciation expense.
During fiscal 2010, the Company recorded a gain of $2.0 million primarily related to the disposal of assets other than sale, see “Note 10. (Gain) Loss on Disposal and Impairment of Long-Lived Assets” for more details. During fiscal 2009 and 2008, the Company recorded $10.4 million and $3.6 million, respectively, of impairments in the carrying value of property, plant and equipment primarily as a result of impairment analyses or the write-off of disposed fixed assets, excluding asset write-downs associated with restructuring activities.
During fiscal 2009, the Company capitalized approximately $11.1 million of cost incurred for the purchase of perpetual software licenses, in accordance with the authoritative guidance on accounting for the costs of computer software developed or obtained for internal use. The Company also entered into a 3-year payment plan agreement (“PPA”) with the supplier. Under this PPA, payments are on a quarterly basis starting the first quarter of fiscal 2010; therefore, this purchase is accounted for as a non-cash investing activity in the statement of cash flows.
Other Current Assets
The components of other current assets were as follows (in millions):
| Years Ended | ||||||
| July 3, 2010 |
June 27, 2009 | |||||
| Prepaid assets |
$ | 42.5 | $ | 25.9 | ||
| Deferred income tax |
1.8 | 0.7 | ||||
| Other receivables |
21.8 | 35.0 | ||||
| Other current assets |
6.9 | 4.2 | ||||
| Total other current assets |
$ | 73.0 | $ | 65.8 | ||
Other Non-Current Assets
The components of other non-current assets were as follows (in millions):
| Years Ended | ||||||
| July 3, 2010 |
June 27, 2009 | |||||
| Deposits |
$ | 2.0 | $ | 3.1 | ||
| Deferred financing costs |
1.4 | 2.1 | ||||
| Other |
10.9 | 12.3 | ||||
| Total other non-current assets |
$ | 14.3 | $ | 17.5 | ||
96
Table of Contents
JDS UNIPHASE CORPORATION
NOTES TO CONSOLIDATED FINANCIAL STATEMENTS—(Continued)
Other Current Liabilities
The components of other current liabilities were as follows (in millions):
| Years Ended | ||||||
| July 3, 2010 |
June 27, 2009 | |||||
| Deferred revenue |
$ | 45.3 | $ | 21.9 | ||
| Acquisition holdbacks and other related liabilities |
0.3 | 2.7 | ||||
| Deferred compensation plan |
5.2 | 4.9 | ||||
| VAT liabilities |
4.6 | 4.6 | ||||
| Other |
11.0 | 17.5 | ||||
| Total other current liabilities |
$ | 66.4 | $ | 51.6 | ||
Other Non-Current Liabilities
The components of other non-current liabilities were as follows (in millions):
| Years Ended | ||||||
| July 3, 2009 |
June 27, 2009 | |||||
| Pension accrual and post employment benefits |
$ | 77.1 | $ | 74.0 | ||
| Deferred taxes |
8.5 | 12.0 | ||||
| Restructuring accrual |
6.7 | 5.4 | ||||
| Financing obligation |
30.2 | 30.8 | ||||
| Non-current income taxes payable |
14.1 | 17.4 | ||||
| Asset retirement obligations |
7.4 | 6.6 | ||||
| Long-term notes payable |
3.7 | 7.2 | ||||
| Other |
29.2 | 20.4 | ||||
| Total other non-current liabilities |
$ | 176.9 | $ | 173.8 | ||
Interest and other income (loss)
The components of interest and other income were as follows (in millions):
| Years Ended | ||||||||||||
| July 3, 2010 |
June 27, 2009 |
June 28, 2008 |
||||||||||
| Interest income |
$ | 6.3 | $ | 19.0 | $ | 48.1 | ||||||
| Foreign exchange (losses) gains, net |
(0.7 | ) | 1.1 | 2.7 | ||||||||
| Proceeds from Nortel class action settlement (1) |
3.4 | — | 61.6 | |||||||||
| Gains on repurchase of Convertible Notes |
— | 17.0 | 11.1 | |||||||||
| Gain (loss) on equity investments |
2.0 | (0.9 | ) | 1.2 | ||||||||
| Other expense |
(1.4 | ) | (2.7 | ) | (4.6 | ) | ||||||
| Total interest and other income |
$ | 9.6 | $ | 33.5 | $ | 120.1 | ||||||
| (1) | In February 2001, the Company received approximately 65.7 million shares of Nortel Networks Corporation (“Nortel”) common stock in connection with the sale of its Zurich, Switzerland subsidiary to Nortel. |
97
Table of Contents
JDS UNIPHASE CORPORATION
NOTES TO CONSOLIDATED FINANCIAL STATEMENTS—(Continued)
| Beginning in February 2001 Nortel has been involved with two class action lawsuits on behalf of persons who purchased Common Shares or call options on Common Shares or wrote (sold) put options on Common Shares during the period from October 24, 2000 through February 15, 2001 (“Nortel I Action”) in which the Company was an eligible class member, and on behalf of persons who purchased Common Shares or call options on Common Shares or wrote (sold) put options on Common Shares during the period from April 24, 2003 through April 27, 2004 (“Nortel II Action”). The Company began selling its Nortel common stock in 2001 and had sold all of its holdings by July 2005. |
In December 2007, the Company was notified by the settlement administrator that its Proof of Claim and Release submitted in relation to the case had been accepted. The distribution of cash and common shares to participants in the settlement was approved by the U.S. District Court for the Southern District of New York, the Ontario Superior Court, the Quebec Superior Court and the British Columbia Supreme Court in March and April of 2008. As a result, the Company received approximately $37.6 million in cash and 2,901,372 shares of Nortel common stock with a market value of approximately $24.6 million during the fourth quarter of fiscal year 2008. The shares were sold on the open market in the same quarter for approximately $24.0 million (net of commission) in cash.
Note 6. Financing Obligation
Santa Rosa
On August 21, 2007, the Company entered into a sale and lease back of certain buildings and land in Santa Rosa, California. The Company sold approximately 45 acres of land, 13 buildings with approximately 492,000 rentable square feet, a building pad, and parking areas. The Company leased back 7 buildings with approximately 286,000 rentable square feet. The net cash proceeds received from the transaction were $32.2 million. The lease terms range from a five year lease with a one year renewal option to a ten year lease with two five year renewal options.
The Company has an ongoing obligation to remediate an environmental matter required by the North Coast Regional Water Quality Control Board which existed at the time of sale. Concurrent with the sale and lease back, the Company has issued an irrevocable letter of credit for $3.8 million as security for the remediation of the environmental matter that remains in effect until the issuance of a notice of no further action letter from the North Coast Regional Water Quality Control Board. In addition, the lease agreement for one building included an option to purchase at fair market value, at the end of the lease term. Due to these various forms of continuing involvement the transaction was recorded under the financing method in accordance with the authoritative accounting guidance for leases and real estate sales.
Accordingly, the value of the buildings and land will remain on the Company's books and the buildings will continue to be depreciated over their remaining useful lives. The proceeds received have been recorded as a financing obligation and a portion of the lease payments are recorded as a decrease to the financing obligation and a portion is recognized as interest expense. Imputed rental income from the buildings sold but not leased back is recorded as a reduction in the financing obligation.
The guarantee of up to $3.8 million was accounted for in accordance with authoritative accounting guidance for guarantees. The present value of the guarantee approximates the liability of $0.5 million which was included in Other non-current liabilities as of June 3, 2010.
As of July 3, 2010, $0.6 million was included in Other current liabilities, and $30.2 million was included in Other non-current liabilities. As of June 27, 2009, $0.5 million was included in Other current liabilities, and $30.9 million was included in Other non-current liabilities.
98
Table of Contents
JDS UNIPHASE CORPORATION
NOTES TO CONSOLIDATED FINANCIAL STATEMENTS—(Continued)
The lease payments due under the agreement reset to fair market rental rates upon the Company’s execution of the renewal options.
Payment Plan Agreement—Software Licenses
During fiscal 2009, the Company capitalized approximately $11.1 million of cost incurred for the purchase of perpetual software licenses, in accordance with the authoritative accounting guidance. The Company also entered into a three-year payment plan agreement (“PPA”) with the supplier. Under this PPA, payments are made on a quarterly basis starting the first quarter of fiscal 2010. The principal portion of the payment is accounted for as a financing activity and the remaining interest portion is accounted for as an operating activity in the statement of cash flows.
As of July 3, 2010, future minimum financing payments of the Santa Rosa leases and Software Licenses PPA are as follows (in millions):
| Fiscal Years |
|||
| 2011 |
$ | 9.7 | |
| 2012 |
6.6 | ||
| 2013 |
2.6 | ||
| 2014 |
2.6 | ||
| 2015 |
2.7 | ||
| Thereafter |
6.1 | ||
| Total |
$ | 30.3 | |
Note 7. Investments and Fair Value Measurements
Available-For-Sale Investments
The Company’s investments in marketable debt and equity securities were primarily classified as available-for-sale investments.
At July 3, 2010, the Company’s available-for-sale investments were as follows (in millions):
| Amortized Cost / Carrying Cost |
Gross Unrealized Gains |
Gross Unrealized Losses |
Estimated Fair Value | ||||||||||
| Debt investments: |
|||||||||||||
| U.S. treasuries |
$ | 27.1 | $ | 0.1 | $ | — | $ | 27.2 | |||||
| Agencies |
|||||||||||||
| U.S. |
47.0 | 0.4 | — | 47.4 | |||||||||
| Foreign |
2.9 | 2.9 | |||||||||||
| Municipal bonds & sovereign debt instruments |
1.5 | — | — | 1.5 | |||||||||
| Asset-backed securities |
30.1 | — | (1.1 | ) | 29.0 | ||||||||
| Corporate securities |
128.8 | 2.0 | (0.1 | ) | 130.7 | ||||||||
| Total debt investments |
237.4 | 2.5 | (1.2 | ) | 238.7 | ||||||||
| Money market instruments and funds |
318.3 | — | — | 318.3 | |||||||||
| Marketable equity investments |
0.4 | 3.8 | — | 4.2 | |||||||||
| Total available-for-sale investments |
$ | 556.1 | $ | 6.3 | $ | (1.2 | ) | $ | 561.2 | ||||
99
Table of Contents
JDS UNIPHASE CORPORATION
NOTES TO CONSOLIDATED FINANCIAL STATEMENTS—(Continued)
Of the total estimated fair value, $327.0 million was classified as cash and cash equivalents and restricted cash, $222.5 million was classified as short-term investments, $5.1 million was classified as long- term investments, and $6.6 million was classified as other non-current assets. An additional $4.9 million of short-term investments representing assets of a deferred compensation plan were classified as trading securities.
At July 3, 2010, the Company’s gross unrealized losses on available-for-sale investments, aggregated by type of investment instrument were as follows (in millions):
| Less than 12 Months |
Greater than 12 Months |
Total | |||||||
| Asset-backed securities |
$ | — | $ | 1.1 | $ | 1.1 | |||
| Corporate securities |
0.1 | — | 0.1 | ||||||
| Total gross unrealized losses |
$ | 0.1 | $ | 1.1 | $ | 1.2 | |||
At July 3, 2010, the Company’s short-term investments classified as trading securities were $4.9 million. Trading securities are reported at fair value, with gains or losses resulting from changes in fair value recognized in net income (loss).
At July 3, 2010, contractual maturities of the Company’s debt investments from available-for-sale investments and trading securities were as follows (in millions):
| Amortized Cost |
Estimated Fair Value | |||||
| Amounts maturing in less than 1 year |
$ | 141.0 | $ | 142.5 | ||
| Amounts maturing in 1 – 5 years |
92.4 | 93.2 | ||||
| Amounts maturing more than 5 years |
4.8 | 3.8 | ||||
| Total debt investments |
$ | 238.2 | $ | 239.5 | ||
At June 27, 2009, the Company’s available-for-sale investments were as follows (in millions):
| Amortized Cost / Carrying Cost |
Gross Unrealized Gains |
Gross Unrealized Losses |
Estimated Fair Value | ||||||||||
| Debt investments: |
|||||||||||||
| U.S. treasuries |
$ | 44.2 | $ | 0.1 | $ | — | $ | 44.3 | |||||
| U.S. agencies |
161.6 | 0.4 | — | 162.0 | |||||||||
| Municipal bonds & sovereign debt instruments |
1.1 | — | — | 1.1 | |||||||||
| Asset-backed securities |
60.3 | 0.6 | (3.7 | ) | 57.2 | ||||||||
| Corporate securities |
189.7 | 2.0 | (0.4 | ) | 191.3 | ||||||||
| Total debt investments |
456.9 | 3.1 | (4.1 | ) | 455.9 | ||||||||
| Money market instruments and funds |
201.2 | — | — | 201.2 | |||||||||
| Total available-for-sale investments |
$ | 658.1 | $ | 3.1 | $ | (4.1 | ) | $ | 657.1 | ||||
Of the total estimated fair value, $243.4 million was classified as cash and cash equivalents and restricted cash, $393.4 million was classified as short-term investments, $7.7 million was classified as other non-current assets, and $12.6 million was classified as long-term investments. An additional $4.9 million of short-term investments representing assets of a deferred compensation plan were classified as trading securities.
100
Table of Contents
JDS UNIPHASE CORPORATION
NOTES TO CONSOLIDATED FINANCIAL STATEMENTS—(Continued)
The Company performed an impairment review of its investment portfolio quarterly. In April 2009, the Financial Accounting Standards Board (“FASB”) amended the existing authoritative guidance on determining whether impairment for investments in debt securities is other-than-temporary. Effective in the fourth quarter of fiscal 2009, if the debt security’s market value is below amortized cost and the Company either intends to sell the security or it is more likely than not that the Company will be required to sell the security before its anticipated recovery, the Company records an other-than-temporary impairment charge to investment income (loss) for the entire amount of the impairment. For the remaining debt securities, if an other-than-temporary impairment exists, the Company separates the other-than-temporary impairment into the portion of the loss related to credit factors, or the credit loss portion, and the portion of the loss that is not related to credit factors, or the noncredit loss portion. The credit loss portion is the difference between the amortized cost of the security and the Company’s best estimate of the present value of the cash flows expected to be collected from the debt security. The noncredit loss portion is the residual amount of the other-than-temporary impairment. The credit loss portion is recorded as a charge to earnings (loss), and the noncredit loss portion is recorded as a separate component of other comprehensive income (loss). Prior to the fourth quarter of fiscal 2009, the entire other-than-temporary impairment charge was recognized in net income (loss) for all debt securities.
When calculating the present value of expected cash flows to determine the credit loss portion of the other-than-temporary impairment, the Company estimates the amount and timing of projected cash flows, the probability of default and the timing and amount of recoveries on a security-by-security basis. These calculations use inputs primarily based on observable market data, such as credit default swap spreads, historical default and recovery statistics, rating agency data, credit ratings and other data relevant to analyzing the collectability of the security. The amortized cost basis of a debt security is adjusted for any credit loss portion of the impairment recorded to earnings.
As a result of its adoption of this guidance in the fourth quarter of fiscal 2009, the Company reviewed all debt securities and all the conditions described above did not exist, except for one of the debt securities. As a result, the Company recorded a one-time adjustment to reclassify the $1.3 million noncredit portion of the $2.2 million other-than-temporary impairment loss recognized in the previous period related to one of its securities from accumulated deficit to accumulated other comprehensive income. The $1.3 million one-time adjustment was excluded from the gross unrealized losses table presented below.
During fiscal 2009, based on the quarterly impairment reviews performed and having considered the authoritative guidance on determining whether impairment for investments in debt securities is other-than-temporary, the Company recorded $18.4 million, net of other-than-temporary impairment in earnings, primarily consisting of $13.0 million related to a long-term privately held equity security, approximately $3.2 million of investment losses due to the bankruptcy of Lehman Brothers, and $0.9 million of losses resulted from changes in credit spreads related to an asset-backed security due to the significant weakening in market conditions at the time.
At June 27, 2009, the Company’s gross unrealized losses on available-for-sale investments, aggregated by type of investment instrument were as follows (in millions):
| Less than 12 Months |
Greater than 12 Months |
Total | |||||||
| Asset-backed securities |
$ | 0.6 | $ | 3.1 | $ | 3.7 | |||
| Corporate securities |
— | 0.4 | 0.4 | ||||||
| Total gross unrealized losses |
$ | 0.6 | $ | 3.5 | $ | 4.1 | |||
At June 27, 2009, the Company’s short-term investments classified as trading securities were $4.9 million. Trading securities are reported at fair value, with gains or losses resulting from changes in fair value recognized in net income (loss).
101
Table of Contents
JDS UNIPHASE CORPORATION
NOTES TO CONSOLIDATED FINANCIAL STATEMENTS—(Continued)
At June 27, 2009, contractual maturities of the Company’s debt investments from available-for-sale investments and trading securities were as follows (in millions):
| Amortized Cost |
Estimated Fair Value | |||||
| Amounts maturing in less than 1 year |
$ | 386.5 | $ | 388.2 | ||
| Amounts maturing in 1 – 5 years |
62.9 | 63.2 | ||||
| Amounts maturing more than 5 years |
8.2 | 5.1 | ||||
| Total debt investments |
$ | 457.6 | $ | 456.5 | ||
Marketable Equity Investments
During fiscal 2010, we recorded net gains on sale of investments of $13.3 million, primarily due to the sale of 1,606,850 shares of common stock in Fabrinet Inc. (“Fabrinet”), in connection with their initial public offering, receiving net proceeds of $14.9 million or $9.30 per share, after deduction of 7% of underwriting fees, on June 30, 2010. These shares of common stock had a carrying value of $1.00 per share. As of July 3, 2010, we owned 393,150 shares of Fabrinet’s common stock that was previously reported as a long-term investment at a carrying cost of $1.00 per share. Since our management subsequently sold the remaining shares in the first quarter of fiscal 2011, we reported the investment in Fabrinet as a short-term available-for-sale investment held at a fair value of $10.76 per share as of July 3, 2010 and recorded an unrealized gain of approximately $3.8 million in accumulated other comprehensive income.
During fiscal 2009, the Company recorded net gains on sale of investments of $1.8 million. The fair value of the Company’s marketable equity securities at June 27, 2009 was zero.
Long-Term Investments
The components of the Company’s long-term investment were as follows (in millions):
| Years Ended | ||||||
| July 3, 2010 |
June 27, 2009 | |||||
| Available-for-sale debt securities |
$ | 5.1 | $ | 12.6 | ||
| Non-marketable cost method investments |
0.0 | 2.5 | ||||
| Non-marketable equity method investments |
— | — | ||||
| Total long-term investments |
$ | 5.1 | $ | 15.1 | ||
102
Table of Contents
JDS UNIPHASE CORPORATION
NOTES TO CONSOLIDATED FINANCIAL STATEMENTS—(Continued)
Fair Value Measurements
Assets measured at fair value at July 3, 2010 are summarized below (in millions):
| Fair value measurement as of July 3, 2010 | |||||||||
| Total | Quoted Prices in
Active Markets for Identical Assets (Level 1) |
Significant
Other Observable Inputs (Level 2) | |||||||
| Assets: |
|||||||||
| Fixed income available for sale securities |
|||||||||
| U.S. treasuries |
$ | 27.2 | $ | 27.2 | $ | — | |||
| Agencies |
|||||||||
| U.S. |
47.4 | 37.5 | 9.9 | ||||||
| Foreign |
2.9 | — | 2.9 | ||||||
| Municipals |
1.5 | — | 1.5 | ||||||
| Asset-backed securities |
29.0 | — | 29.0 | ||||||
| Corporate securities |
130.7 | — | 130.7 | ||||||
| Total fixed income available for sale securities |
238.7 | 64.7 | 174.0 | ||||||
| Money market funds |
318.3 | 279.2 | 39.1 | ||||||
| Marketable Equity Investments |
4.2 | 4.2 | — | ||||||
| Trading securities |
4.9 | 4.9 | — | ||||||
| Total assets (1) |
$ | 566.1 | $ | 353.0 | $ | 213.1 | |||
| (1) | $294.5 million included in cash and cash equivalents, $227.4 million in short-term investments, $39.1 million in restricted cash, and $5.1 million in long-term investments on the Company’s consolidated balance sheet. |
During the fiscal year ended July 3, 2010, the Company recorded $2.8 million in cash receipts from the Reserve Fund. The Company holds no Level 3 instruments as of July 3, 2010.
Assets measured at fair value at June 27, 2009 are summarized below (in millions):
| Fair value measurement as of June 27, 2009 | ||||||||||||
| Total | Quoted Prices in Active Markets for Identical Assets (Level 1) |
Significant Other Observable Inputs (Level 2) |
Significant Unobservable Inputs (Level 3) | |||||||||
| Assets: |
||||||||||||
| Fixed income available for sale securities |
||||||||||||
| U.S. treasuries |
$ | 44.3 | $ | 24.3 | $ | 20.0 | $ | — | ||||
| U.S. agencies |
162.0 | 52.9 | 109.1 | — | ||||||||
| Municipals |
1.1 | — | 1.1 | — | ||||||||
| Asset-backed securities |
57.2 | — | 57.2 | — | ||||||||
| Corporate securities |
191.3 | — | 191.3 | — | ||||||||
| Total fixed income available for sale securities |
455.9 | 77.2 | 378.7 | — | ||||||||
| Money market funds |
201.2 | 180.4 | 18.0 | 2.8 | ||||||||
| Trading securities |
4.9 | 4.9 | — | — | ||||||||
| Total assets (1) |
$ | 662.0 | $ | 262.5 | $ | 396.7 | $ | 2.8 | ||||
| (1) | $233.1 million included in cash and cash equivalents, $398.3 million in short-term investments, $18.0 million in restricted cash, and $12.6 million in long-term investments on the Company’s consolidated balance sheet. |
103
Table of Contents
JDS UNIPHASE CORPORATION
NOTES TO CONSOLIDATED FINANCIAL STATEMENTS—(Continued)
The Company measures its cash equivalents and marketable securities at fair value, which does not materially differ from the carrying values of these instruments in the financial statements.
Fair value is defined as the exit price, or the amount that would be received to sell an asset or paid to transfer a liability in an orderly transaction between market participants as of the measurement date. There is an established hierarchy for inputs used in measuring fair value that maximizes the use of observable inputs and minimizes the use of unobservable inputs by requiring the most observable inputs be used when available. Observable inputs are inputs market participants would use in valuing the asset or liability and are developed based on market data obtained from sources independent of the Company. Unobservable inputs are inputs that reflect the assumptions about the factors that market participants would use in valuing the asset or liability.
The Company’s cash and investment instruments are classified within Level 1 or Level 2 of the fair value hierarchy based on quoted prices, broker or dealer quotations, or alternative pricing sources with reasonable levels of price transparency.
| • | Level 1 includes financial instruments for which quoted market prices for identical instruments are available in active markets. Level 1 assets of the Company include money market funds and U.S. Treasury and Agency securities as they are traded in active markets with sufficient volume and frequency of transactions. |
| • | Level 2 includes financial instruments for which the valuations are based on quoted prices for similar assets or liabilities, quoted prices in markets that are not active, or other inputs that are observable or can be corroborated by observable data for substantially the full term of the assets or liabilities. Level 2 instruments of the Company include certain U.S. and foreign government securities, commercial paper, corporate and municipal bonds and notes, asset-backed securities, money market funds, and foreign currency forward contracts. To estimate their fair value, the Company utilizes pricing models based on market data. The significant inputs for the valuation model usually include benchmark yields, reported trades, broker and dealer quotes, issuer spreads, two-sided markets, benchmark securities, bids, offers and reference data, and industry and economic events. |
| • | Level 3 includes financial instruments for which fair value is derived from valuation based on inputs that are unobservable and significant to the overall fair value measurement. |
The bond parity derivatives related to the convertible notes are classified within Level 1 because they are valued using quoted market prices in active markets. The fair value of the derivatives is approximately zero.
The following tables provide a summary of changes in fair value of the Company’s Level 3 financial assets as of July 3, 2010 and June 27, 2009 (in millions):
| The Reserve Fund |
||||
| Balance as of June 27, 2009 |
$ | 2.8 | ||
| Cash receipt from The Reserve Fund |
(2.8 | ) | ||
| Balance as of July 3, 2010 |
$ | — | ||
104
Table of Contents
JDS UNIPHASE CORPORATION
NOTES TO CONSOLIDATED FINANCIAL STATEMENTS—(Continued)
| Total | The Reserve Fund |
Lehman Brothers securities |
||||||||||
| Balance as of June 28, 2008 |
$ | — | $ | — | $ | — | ||||||
| Transfer from Level 1 |
36.6 | 33.9 | 2.7 | |||||||||
| Other-than-temporary impairment recorded |
(3.2 | ) | (0.5 | ) | (2.7 | ) | ||||||
| Cash receipt from The Reserve Fund |
(30.6 | ) | (30.6 | ) | — | |||||||
| Balance as of June 27, 2009 |
$ | 2.8 | $ | 2.8 | $ | 0.0 | ||||||
Level 3 includes financial instruments for which fair value is derived from valuations based on inputs that are unobservable and significant to the overall fair value measurement. Level 3 assets of the Company as of June 27, 2009, consisted of an investment in the Reserve Primary Money Market Fund (the “Reserve Fund”).
During the fiscal year ended July 27, 2009, the Company recorded $30.6 million in cash receipts from the Reserve Fund. The Company held $2.8 million Level 3 instruments as of June 27, 2009. During the fiscal year ended July 3, 2010, the Company recorded $2.8 million in cash receipts from the reserve fund. As of July 3, 2010, the Company does not hold any Level 3 instruments.
Note 8. Goodwill
Goodwill
The following table presents the changes in goodwill allocated to the reportable segments (in millions):
| Communications & Commercial Optical Products |
Communications Test & Measurement |
Advanced Optical Technologies |
All Other, Commercial Lasers |
Total | ||||||||||||||||
| Balance as of June 28, 2008 |
$ | 201.9 | $ | 494.2 | $ | 68.3 | $ | 31.8 | $ | 796.2 | ||||||||||
| Reclassification due to change in business segments |
29.9 | — | — | (29.9 | ) | — | ||||||||||||||
| Impairment charges |
(233.5 | ) | (448.2 | ) | (60.0 | ) | — | (741.7 | ) | |||||||||||
| Purchase price adjustment related to the achievement of milestones (*) |
— | 6.0 | — | — | 6.0 | |||||||||||||||
| Translation adjustment |
— | (51.8 | ) | — | — | (51.8 | ) | |||||||||||||
| Other purchase price adjustment |
1.7 | (0.2 | ) | 0.0 | (1.9 | ) | (0.4 | ) | ||||||||||||
| Balance as of June 27, 2009 |
— | — | 8.3 | — | 8.3 | |||||||||||||||
| Goodwill from SNT Acquisition (*) |
— | 9.9 | — | — | 9.9 | |||||||||||||||
| Goodwill from NSD Acquisition (*) |
— | 46.4 | — | — | 46.4 | |||||||||||||||
| Purchase price adjustment related to the achievement of milestones (*) |
— | 1.0 | — | — | 1.0 | |||||||||||||||
| Other purchase price adjustment |
— | 0.4 | — | — | 0.4 | |||||||||||||||
| Balance as of July 3, 2010 |
$ | — | $ | 57.7 | $ | 8.3 | $ | — | $ | 66.0 | ||||||||||
| * | See “Note 4. Mergers and Acquisitions” of the Notes to Consolidated Financial Statements for detail. |
Gross goodwill and accumulated impairment balances for the Optical Communications segment were $5,079.7 million and ($4,877.8) million as of June 28, 2008, respectively.
Gross goodwill and accumulated impairment balances for the Communications, Test, and Measurement segment were $529.1 million and ($34.9) million as of June 28, 2008, respectively.
105
Table of Contents
JDS UNIPHASE CORPORATION
NOTES TO CONSOLIDATED FINANCIAL STATEMENTS—(Continued)
Gross goodwill and accumulated impairment balances for the Advanced Optical Technologies segment were $92.8 million and ($24.5) million as of June 28, 2008, respectively.
Gross goodwill for All Other, Commercial Lasers segment was $31.8 million as of June 28, 2008, with no accumulated impairment.
The following table presents gross goodwill and accumulated impairment balances for the fiscal years ended July 3, 2010, and June 27, 2009 (in millions):
| Years Ended | ||||||||
| July 3, 2010 |
June 27, 2009 |
|||||||
| Gross goodwill balance |
$ | 5,744.9 | $ | 5,687.2 | ||||
| Accumulated impairment losses |
(5,678.9 | ) | (5,678.9 | ) | ||||
| Net goodwill balance |
$ | 66.0 | $ | 8.3 | ||||
During the second quarter of fiscal year 2009, the Company changed its reporting structure to combine the All Others, Commercial Lasers business segment with the Optical Communications business segment and formed a new business segment, Communications and Commercial Optical Products. As a result, there were three reportable segments, Communications Test and Measurement, Communications and Commercial Optical Products, and Advanced Optical Technologies, as of July 3, 2010, and June 27, 2009.
Impairment of Goodwill
Fiscal 2010:
The Company reviews goodwill for impairment annually during the fourth quarter of the fiscal year or more frequently if events or circumstances indicate that an impairment loss may have occurred. No triggering events were noted during the interim periods and thus, the Company reviewed goodwill for impairment during the fourth quarter.
Under the first step of the authoritative guidance for impairment testing, the fair value of the reporting units was determined based on a combination of the income approach, which estimates the fair value based on the future discounted cash flows, and the market approach, which estimates the fair value based on comparable market prices. Under the income approach, the Company assumed a cash flow period of 10 years, long-term annual growth rates of 5.0% to 9.9%, a discount rate of 14.3% and terminal value growth rate of 5%. Based on the first step of the analysis, the Company determined that the fair value of each reporting unit is significantly above its carrying amount. As such, the Company was not required to perform the second step analysis on any reporting unit to determine the amount of the impairment loss. The Company recorded no impairment charge in accordance with its annual impairment test.
Fiscal 2009:
In the second quarter of fiscal 2009, in connection with the impact of weakening market conditions on the Company’s forecasts and a sustained, significant decline in the market capitalization to a level lower than the net book value of the Company, the Company concluded that triggering events existed and were required to test long-lived assets and goodwill for impairment.
106
Table of Contents
JDS UNIPHASE CORPORATION
NOTES TO CONSOLIDATED FINANCIAL STATEMENTS—(Continued)
Under the corresponding authoritative guidance, the Company’s long-lived assets and liabilities are grouped at the lowest level for which there is identifiable cash flow. Goodwill is tested for impairment at a reporting unit level. The Company has determined that, based on its cashflow structure, organizational structure and the financial information that is provided to and reviewed by management and the Board of Directors, its long-lived asset groups and reporting units are: Communications Test & Measurement (excluding da Vinci) (“CommTest”), da Vinci, Communications and Commercial Optical Products (“CCOP”), Custom Optics Product Group (“COPG”), Authentication Solutions Group (“ASG”), and Flex Product Group (“Flex”).
In according with authoritative guidance, the Company estimated the future net undiscounted cash flows expected to be generated from the use of the long-lived asset groups and their eventual disposal and then compared the estimated undiscounted cash flows to the carrying amount of the long-lived asset groups. The cashflow period was based on the remaining useful lives of the primary asset in each long-lived asset group which ranges from 5 to 13 years. The result of the analysis indicated that the estimated undiscounted cash flows exceed the carrying amount of the long-lived asset groups, the long-lived asset groups are recoverable; therefore, an impairment does not exist, except for da Vinci. As a result of the test, the Company recorded da Vinci’s long-lived asset impairment charge of $7.7 million which approximates the full amount of the intangible assets associated with this asset group in the second quarter of fiscal year 2009.
Under the first step of the authoritative guidance for impairment testing , the income approach, which estimates the fair value based on the future discounted cash flows, and the market approach, which estimates the fair value based on comparable market prices, are considered. The fair value of the reporting units was determined based on the income approach and then compared to the results of the market approach for reasonableness. The Company assumed a cash flow period of 10 years, long-term annual growth rates of 4.1% to 20.5%, discount rates of 19.2% to 31.7% and terminal value growth rates of 4% to 5%. The discount rates are higher than the ones used in the last annual impairment test due to the increase in the inherent risks in the CommTest and CCOP products market that the Company serves. The Company believes that the assumptions and rates used in the interim impairment test are reasonable, but they are judgmental, and variations in any of the assumptions or rates could result in materially different calculations of impairment amounts. The sum of the fair values of the reporting units was reconciled to the Company’s current market capitalization plus an estimated control premium. Based on the first step of the analysis, the Company determined that the carrying amounts of all reporting units, except Flex, were in excess of their fair value. The result of the preliminary analysis indicated that there would be no remaining implied value attributable to goodwill in its COPG reporting unit within the AOT segment and its CCOP reporting unit within the CCOP segment. Accordingly, the Company wrote off all $254.4 million of goodwill associated with these reporting units in fiscal year 2009. The Company was required to perform the second step analysis on CommTest and ASG reporting units to determine the amount of the impairment loss.
Under the second step, the implied fair value of goodwill requires valuation of a reporting unit’s tangible and intangible assets and liabilities in a manner similar to the allocation of purchase price in a business combination. If the carrying value of a reporting unit’s goodwill exceeds its implied fair value, goodwill is deemed impaired and is written down to the extent of the difference. As a result, the Company impaired the value of its goodwill by $487.3 million on CommTest and ASG reporting units in fiscal year 2009. For CommTest and ASG, the second step goodwill impairment test estimate assumed the carrying value of assets approximated their fair value. With regard to CommTest reporting unit, the goodwill impairment charge of $448.2 million approximated the difference between the reporting unit’s fair value and its carrying value. With regard to ASG reporting unit, the goodwill impairment charge of $39.1 million approximated the full amount of the goodwill associated with this reporting unit.
107
Table of Contents
JDS UNIPHASE CORPORATION
NOTES TO CONSOLIDATED FINANCIAL STATEMENTS—(Continued)
Fiscal 2008:
Under the first step of the authoritative guidance for impairment testing, the fair value of the reporting units was determined based on a combination of the income approach, which estimates the fair value based on the future discounted cash flows, and the market approach, which estimates the fair value based on comparable market prices. Under the income approach, the Company assumed a cash flow period of 10 years, long-term annual growth rates of 5% to 19%, a discount rate of 12.9% to 16.1% and terminal value growth rates of 4% to 6%. Based on the first step of the analysis, the Company determined that the carrying amount of its da Vinci and Authentication Solutions reporting units within the Communications Test and Measurement and AOT segments, respectively, were in excess of their fair value. As such, the Company was required to perform the second step analysis on those reporting units to determine the amount of the impairment loss.
As the result of the annual impairment test, the Company recorded a $12.5 million goodwill impairment related to the da Vinci reporting unit within the Communications Test and Measurement segment. The impairment for da Vinci was the result of delayed product introduction and acceptance of next generation color and image enhancement products. See “Note 9 Acquired Developed Technology and Other Intangibles” for details regarding the impairment of intangibles for da Vinci. The Company also recorded a $24.5 million goodwill impairment related to the Authentication Solution Group (“ASG”) (formerly ABNH, the business we acquired in February 2008) reporting unit within the Advanced Optical Technologies segment. The impairment for the ASG was the result of lower than expected demand for transaction card products due to trouble in the U.S. Banking industry.
Note 9. Acquired Developed Technology and Other Intangibles
The following tables present details of the Company’s acquired developed technology and other intangibles (in millions):
| As of July 3, 2010: |
Gross Carrying Amount |
Accumulated Amortization |
Net | |||||||
| Acquired developed technology |
$ | 517.4 | $ | (288.0 | ) | $ | 229.4 | |||
| Other |
275.5 | (158.7 | ) | 116.8 | ||||||
| Total intangibles subject to amortiztaion |
792.9 | (446.7 | ) | 346.2 | ||||||
| Indefinite life intangibles |
11.3 | — | 11.3 | |||||||
| Total intangibles |
$ | 804.2 | $ | (446.7 | ) | $ | 357.5 | |||
| As of June 27, 2009: |
Gross Carrying Amount |
Accumulated Amortization |
Net | |||||||
| Acquired developed technology |
$ | 458.5 | $ | (238.7 | ) | $ | 219.8 | |||
| Other |
241.1 | (138.3 | ) | 102.8 | ||||||
| Total intangibles |
$ | 699.6 | $ | (377.0 | ) | $ | 322.6 | |||
Other intangibles consists of patents, trademarks, trade names, proprietary know-how and trade secrets, customer and secure government relationships, customer backlog, and non-competition agreements.
108
Table of Contents
JDS UNIPHASE CORPORATION
NOTES TO CONSOLIDATED FINANCIAL STATEMENTS—(Continued)
During fiscal 2010, 2009, and 2008, the Company recorded $78.4 million, $75.9 million, and $79.3 million, respectively, of amortization related to acquired developed technology and other intangibles. The following table presents details of the Company’s amortization (in millions):
| Years Ended | |||||||||
| July 3, 2010 |
June 27, 2009 |
June 28, 2008 | |||||||
| Cost of sales |
$ | 50.6 | $ | 48.9 | $ | 49.3 | |||
| Operating expense |
27.8 | 27.0 | 30.0 | ||||||
| Total |
$ | 78.4 | $ | 75.9 | $ | 79.3 | |||
During fiscal 2010, 2009, and 2008, the Company recorded zero, $7.7 million, and $8.4 million, respectively, of impairments in the carrying value of acquired developed technology and other intangibles as a result of impairment analyses performed in accordance with authoritative guidance.
Based on the carrying amount of other intangibles as of July 3, 2010, and assuming no future impairment of the underlying assets, the estimated future amortization is as follows (in millions):
| Years Ended July 3, |
|||
| 2011 |
$ | 86.4 | |
| 2012 |
81.3 | ||
| 2013 |
64.6 | ||
| 2014 |
39.6 | ||
| 2015 |
32.3 | ||
| Thereafter |
42.0 | ||
| Total amortization |
$ | 346.2 | |
Note 10. (Gain) Loss on Disposal and Impairment of Long-Lived Assets
During fiscal 2010, 2009, and 2008, the Company recorded ($2.0) million, $18.1 million, and $10.7 million, respectively, of (gain) loss on disposal and impairments in the carrying value of long-lived assets in accordance with the authoritative accounting guidance regarding impairment or disposal of long-lived assets. The carrying values of assets held for sale at July 3, 2010 and June 27, 2009 were both zero. The following table summarizes the components of the impairments and gain/losses of long-lived assets (in millions):
| Years Ended | ||||||||||||
| July 3, 2010 |
June 27, 2009 |
June 28, 2008 |
||||||||||
| (Gain) Loss on Disposal and Impairment of Long-Lived Assets: |
||||||||||||
| Assets held and used |
$ | — | $ | 7.7 | $ | 8.8 | ||||||
| Assets held for sale |
— | 7.4 | — | |||||||||
| (Gain) loss on the sale of assets |
(0.1 | ) | (1.2 | ) | (1.4 | ) | ||||||
| Long-lived assets to be disposed of other than sale |
(1.9 | ) | 4.2 | 3.3 | ||||||||
| Total (gain) loss on disposal and impairment of long-lived assets |
$ | (2.0 | ) | $ | 18.1 | $ | 10.7 | |||||
109
Table of Contents
JDS UNIPHASE CORPORATION
NOTES TO CONSOLIDATED FINANCIAL STATEMENTS—(Continued)
Fiscal 2010
Sale of Assets:
During fiscal 2010, the Company recorded a gain of $0.1 million for the sale of assets.
Asset Disposal Other than Sale:
During fiscal 2010, the Company recorded a gain of $1.9 million for the disposal of assets other than sale primarily related to cash receipts from Sanmina-SCI on leasehold improvements related to the sale of Shenzhen facilities in fiscal 2009 that had previously been written-off, partially offset by accelerated depreciation.
Fiscal 2009
Assets Held and Used:
During fiscal 2009, the Company recorded an impairment charge of $7.7 million for certain intangible assets related to its da Vinci business. Out of this total, $4.9 million and $2.8 million were recorded in cost of sale and operating expenses, respectively. See “Note 9. Acquired Developed Technology and Other Intangibles” for more detail.
Assets Held for Sale:
In February 2009 the Company entered into a definitive agreement to sell certain assets and liabilities related to manufacturing operations in Shenzhen, China (the “Disposal group”) to Sanmina-SCI and one of its subsidiaries (“the Buyer”). The related sale closed in the fourth quarter of fiscal 2009 on March 29, 2009. The Disposal group was historically part of the Communication and Commercial Optical Products Segment. Concurrently, the Company entered into an agreement where the Buyer would manufacture and supply certain of the Company’s products.
The Company recorded a loss of $7.4 million in connection with the sale of Shenzhen facilities in fiscal 2009. The loss was calculated as follows (in millions):
| Gross proceeds |
$ | 30.0 | ||
| Less: adjustment for inter-company payment |
(5.4 | ) | ||
| Less: carrying value of assets |
(30.8 | ) | ||
| Less selling costs |
(1.2 | ) | ||
| Loss |
$ | (7.4 | ) | |
The loss is recorded in the Consolidated Statements of Operations as a component of Loss and impairment of long-lived assets.
Sale of Assets:
During fiscal 2009, we recorded a gain of $1.2 million for the sale of assets.
Asset Disposal Other than Sale:
During fiscal 2009, we recorded a charge of $4.2 million for the disposal of assets other than sale primarily related to accelerated depreciation of Micralyne, Louisville, and Picolight sites.
110
Table of Contents
JDS UNIPHASE CORPORATION
NOTES TO CONSOLIDATED FINANCIAL STATEMENTS—(Continued)
Fiscal 2008
Assets Held and Used
During fiscal 2008, the Company recorded an impairment charge of $0.4 million for certain assets related to the Company’s Santa Rosa, California facility and in the fourth quarter recorded impairment charges of $8.4 million for certain intangible assets related to its da Vinci business. Out of this total, $4.0 million and $4.4 million were recorded in cost of sale and operating expenses, respectively.
Sale of Assets
During fiscal 2008, the Company recorded a gain of $1.4 million for the sale and disposal of assets.
Assets to be Disposed of Other Than Sale
During fiscal 2008, the Company recorded a loss of $3.3 million for the disposal of assets related to its Singapore and Ottawa facilities.
Note 11. Convertible Debt and Letters of Credit
The following table presents details of the Company’s long-term debt as of July 3, 2010 and June 27, 2009 (in millions):
| Years Ended | ||||||||
| July 3, 2010 |
June 27, 2009 |
|||||||
| 1% senior convertible notes |
$ | 267.1 | $ | 249.9 | ||||
| Zero coupon senior convertible notes |
0.2 | 0.2 | ||||||
| Total convertible debt |
267.3 | 250.1 | ||||||
| Less: current portion |
(0.2 | ) | (0.2 | ) | ||||
| Total long-term debt |
$ | 267.1 | $ | 249.9 | ||||
Based on quoted market prices, as of July 3, 2010 and June 27, 2009, the fair market value of the 1% Senior Convertible Notes was approximately $289.7 million and $238.9 million, respectively, and the fair market value of the Zero Coupon Senior Convertible Notes was approximately $0.2 million and $0.2 million, respectively. The fair values of Convertible Notes are based on quoted prices in active markets. Changes in fair market value reflect the change in the market price of the notes.
The Company was in compliance with all debt covenants as of July 3, 2010.
1% Senior Convertible Notes
On June 5, 2006, the Company completed an offering of $425 million aggregate principal amount of 1% Senior Convertible Notes due 2026. Proceeds from the notes amounted to $415.9 million after issuance costs. The notes bear interest at a rate of 1.00% per year and are convertible into a combination of cash and shares of the Company’s common stock at a conversion price of $30.30 per share. Interest on the notes is payable semi-annually in arrears on May 15 and November 15 of each year, beginning on November 15, 2006. The notes mature on May 15, 2026.
111
Table of Contents
JDS UNIPHASE CORPORATION
NOTES TO CONSOLIDATED FINANCIAL STATEMENTS—(Continued)
Pursuant to the indenture, holders of the notes may require the Company to purchase all or a portion of the notes on each of May 15, 2013, May 15, 2016 and May 15, 2021 at a price equal to 100% of the principal amount of the notes to be purchased plus any accrued and unpaid interest to, but excluding, the purchase date. In addition, upon certain fundamental changes, holders may require the Company to purchase for cash the notes at a price equal to 100% of the principal amount of the notes to be purchased plus any accrued and unpaid interest to, but excluding, the purchase date. The Company may not redeem the notes before May 20, 2013. On or after that date, the Company may redeem all or part of the notes for cash at 100% of the principal amount of the notes to be redeemed, plus accrued and unpaid interest to, but excluding, the redemption date.
Effective the first quarter of fiscal 2010, the Company adopted new authoritative guidance which applies to convertible debt securities that, upon conversion, may be settled by the issuer fully or partially in cash and retrospectively adjusted financial statements for all periods presented. See “Note 3. Revision to Prior Period Financial Statements” for details.
The Company calculated the carrying value of the liability component at issuance as the present value of its cash flows using a discount rate of 8.1%, based on the 7-year swap rate plus credit spread as of the issuance date. The credit spread for JDSU is based on the historical average “yield to worst” rate for BB-rated issuers. The carrying value of the liability component was determined to be $266.5 million. The equity component, or debt discount, of the notes was determined to be $158.5 million. The debt discount is being amortized using the effective interest rate of 8.1% over the period from issuance date through May 15, 2013 as a non-cash charge to interest expense. As of July 3, 2010, the remaining term of the 1% Senior Convertible Notes is 2.9 years.
The $9.1 million of costs incurred in connection with the issuance of the notes were capitalized and bifurcated into debt issuance cost of $5.7 million and equity issuance cost of $3.4 million. The debt issuance cost is being amortized to interest expense using the effective interest method from issuance date through May 15, 2013. As of July 3, 2010, the unamortized portion of the debt issuance cost related to the notes is $2.1 million and is included in Other current assets and Other non-current assets on the Consolidated Balance Sheets.
The following table presents the carrying amounts of the liability and equity components:
| July 3, 2010 |
June 27, 2009 |
|||||||
| (In millions) | ||||||||
| Carrying amount of equity component, net of equity issuance cost |
$ | 155.1 | $ | 155.1 | ||||
| Principal amount of 1% Senior Coupon Notes |
$ | 325.0 | $ | 325.0 | ||||
| Unamortized discount of liability component |
(57.9 | ) | (75.1 | ) | ||||
| Carrying amount of liability component |
$ | 267.1 | $ | 249.9 | ||||
The following table presents the interest expense for the contractual interest and the amortization of debt discount:
| Years Ended | ||||||||
| July 3, 2010 |
June 27, 2009 |
|||||||
| (In millions) | ||||||||
| Effective interest rate |
8.1 | % | 8.1 | % | ||||
| Interest expense-contractual interest |
$ | 3.3 | $ | 3.7 | ||||
| Interest expense-amortization of debt discount |
17.2 | 18.3 | ||||||
112
Table of Contents
JDS UNIPHASE CORPORATION
NOTES TO CONSOLIDATED FINANCIAL STATEMENTS—(Continued)
Zero Coupon Senior Convertible Notes
On October 31, 2003, the Company completed the sale of $475.0 million aggregate principal amount of Zero Coupon Senior Convertible Notes due in 2010. Proceeds from the notes amounted to $462.3 million after issuance costs. The notes do not bear interest and are convertible into the Company’s common stock at a conversion price of $39.52 per share. The Company has the right to redeem the notes beginning November 15, 2008. Holders of the notes may require the Company to repurchase the notes on November 15, 2008. As of April 3, 2010, the zero coupon convertible notes are classified as current based on the Company’s expectation that they will be retired within one year.
Based on the stated terms, the Zero Coupon Senior Convertible Notes are not within the scope of the new authoritative guidance which applies to convertible debt securities that, upon conversion, may be settled by the issuer fully or partially in cash.
Between March 2007 and March 2009, the Company repurchased or redeemed $474.8 million aggregate principal amount of the notes for $455.1 million in cash. In connection with the repurchase, a gain of $19.7 million was recognized in interest and other income (loss), net of the write-off of debt issuance costs. After giving effect to the repurchase, the total amount of Zero Coupon Senior Convertible Notes outstanding as of July 3, 2010 was $0.2 million. The repurchase effectively reduced the number of conversion shares potentially issuable in relation to the Zero Coupon Notes by approximately 12.0 million from 12.0 million to 4,656.
The $12.7 million of costs incurred in connection with issuance of the Notes were capitalized and amortized to interest expense on a straight-line basis over a five year period ended December 27, 2008.
Outstanding Letters of Credit
As of July 3, 2010, the Company had 14 standby letters of credit totalling $38.2 million.
Note 12. Restructuring and Related Charges
The Company continues to take advantage of opportunities to further reduce costs through targeted restructuring events intended to consolidate the Company and rationalize the manufacturing of its products based on core competencies and cost efficiencies, together with the need to align the business in response to the market conditions. As of July 3, 2010, the Company’s total restructuring accrual was $13.8 million.
During fiscal 2010, the Company recorded $17.7 million in restructuring and related charges. The charges were primarily a result of the following: (i) $7.1 million for severance and benefits primarily in the Communications Test and Measurement segment which relates to the sale of certain non-core assets, the expansion of the Europe, Middle East, and Africa (“EMEA”) sales force from a primarily direct customer-only team to include a channel partners-oriented sales force, and the implementation of the EMEA early retirement program. The Company expects these activities to be completed by the end of the fourth quarter of fiscal 2012. The Company also restructured and reorganized the Communications Test and Measurement segment to improve the efficiency of the research and development organization by reducing/rationalizing headcount, transitioning research and development investment to lower cost locations, and consolidating and centralizing similar functions to fewer sites designed to improve leverage. These activities were completed by the end of the fourth quarter of fiscal 2010; (ii) $8.5 million for manufacturing transfer cost primarily in the Communications and Commercial Optical Products segment, which were the result of a production site closure in California, the consolidation of Lasers manufacturing operations at a contract manufacturer in Asia, the transfer of certain production processes into existing sites in California, and the reduction in force of the Company’s manufacturing
113
Table of Contents
JDS UNIPHASE CORPORATION
NOTES TO CONSOLIDATED FINANCIAL STATEMENTS—(Continued)
support organization across all sites. The Company completed these activities by the end of the third quarter of fiscal 2010; and (iii) $2.1 million for charges for restructured leases primarily in the Communications Test and Measurement segment, which were the result of the Company’s continued efforts to reduce and consolidate manufacturing locations. The Company reduced its headcount by 129 employees, comprised of 43 in manufacturing, 43 in research and development, and 43 in selling, general and administrative functions. Of these notified employees, 107 were located in North America, 12 were located in Europe, three were located in Latin America, and seven were located in Asia. As of July 3, 2010, 111 of these employees have been terminated. Payments related to severance and benefits are expected to be paid by the first quarter of fiscal 2011. Payments related to lease costs are expected to be paid by the second quarter of 2014.
During fiscal 2009, the Company recorded $38.5 million in restructuring and related charges. The charges were primarily a result of the following: (i) $25.9 million for severance and benefits primarily in the Communications Test and Measurement and the Communications and Commercial Optical Product segment. The Communications Test and Measurement segment restructured and reorganized to improve the efficiency of the research and development organization. The strategy included reducing/rationalizing headcount, transitioning research and development investment to lower cost locations, and consolidating and centralizing similar functions to fewer sites designed to improve leverage. The Company completed these activities by the end of the fourth quarter of fiscal 2010. Additionally, the Company implemented a restructuring plan for its Germany site to significantly change the overall cost structure and complexity of the site, and to align the cost of the site more with market demand. Activities included outsourcing of manufacturing to a contract manufacturer and other initiatives to reduce the overall complexity of processes and the organization. The Company expects these activities to be completed by the end of the second quarter of fiscal 2012. The Communications and Commercial Optical Products segment outsourced its manufacturing capability at the Shenzhen facility to Sanmina-SCI, which was completed in the third quarter of fiscal 2009; (ii) $7.9 million for manufacturing transfer costs primarily in the Communications and Commercial Optical Products segment, which were the result of simplifying the operating model by reducing its manufacturing costs. A majority of these charges were due to (a) the closure of sites in Colorado and California and the related transfer of certain production processes into existing sites in California, The Company completed these activities by the end of the fourth quarter of fiscal 2010, (b) the transition of the North American manufacturing to Asia related to certain products, which the Company expects to complete by the end of the first quarter of fiscal 2011, and (c) the consolidation and relocation of a portion of its Lasers manufacturing operations to a contract manufacturer, which the Company completed by the end of the second quarter of fiscal 2010; and (iii) $4.7 million for lease costs primarily in the Communications Test and Measurement segment as the Company vacated the office space to reduce operating costs and improve synergies by consolidating the operations into the existing Ottawa, Canada site. The Company reduced its headcount by 2,814 employees, comprised of 2,453 in manufacturing, 130 in research and development, and 231 in selling, general and administrative functions. Of these notified employees, 602 were located in North America, 109 were located in Europe, and 2,103 were located in Asia. As of July 3, 2010, 2,727 of these employees have been terminated. Payments related to severance and benefits are expected to be paid by the third quarter of fiscal 2016. Payments related to lease costs are expected to be paid by the fourth quarter of 2014.
During fiscal 2008, the Company recorded $6.7 million in restructuring and related charges. The charges were primarily a result of the following: (i) $6.2 million for severance and benefits primarily in the Communications Test and Measurement segment, which were the result of a reduction in labor force to better streamline the segment and to scale the business to a lower expense level to improve profitability. The Company completed these activities by the end of the fourth quarter of fiscal 2010; (ii) $0.2 million for manufacturing transfer cost primarily in the Communications and Commercial Optical Products segment, which were the result of a reduction in force in the Lasers Sales and Marketing organization initiated in the second fiscal quarter of 2008 and completed in the third quarter of fiscal 2008 and a reduction in force in the manufacturing operations organization related to obsolescing certain low margin product offerings initiated in the first quarter of fiscal
114
Table of Contents
JDS UNIPHASE CORPORATION
NOTES TO CONSOLIDATED FINANCIAL STATEMENTS—(Continued)
2008 and completed in the third quarter of fiscal 2008; and (iii) $0.3 million for lease costs for additional restructured space primarily in the Communications and Commercial Optical Products segment related to the consolidation of research & development space at the Colorado site initiated and completed in the fourth quarter of fiscal 2008. The Company reduced it headcount by 159 employees, comprised of 95 in manufacturing, 25 in research and development, and 39 in selling, general and administrative functions. Of these notified employees, 114 were located in North America, 15 were located in Europe, 1 was located in Latin America, and 29 were located in Asia. As of July 3, 2010, 149 of these employees have been terminated. Payments related to severance and benefits are expected to be paid by the third quarter of fiscal 2013 and payments related to lease costs are expected to be paid by the fourth quarter of fiscal 2012. In addition during fiscal 2008, the Company also recorded a lease exit charge, net of assumed sub-lease income, of $5.4 million related to the Ottawa facility that was included in selling, general and administrative expenses. The payments related to these lease costs are expected to be paid by the third quarter of fiscal 2018.
The following table summarizes the various restructuring plans (in millions):
| Workforce Reduction |
Facilities and Equipment |
Lease Costs |
Total | Other Lease Exit Costs |
||||||||||||||||
| Accrual balance as of June 30, 2007 |
$ | 4.4 | $ | — | $ | 9.1 | $ | 13.5 | $ | — | ||||||||||
| Restructuring and related charges |
6.2 | 0.2 | 0.3 | 6.7 | — | |||||||||||||||
| Adjustment from non-restructuring accounts |
— | — | — | — | 5.4 | |||||||||||||||
| Cash payments |
(6.5 | ) | (0.2 | ) | (2.3 | ) | (9.0 | ) | — | |||||||||||
| Amount charged to goodwill |
0.3 | — | — | 0.3 | 0.6 | |||||||||||||||
| Accrual balance as of June 28, 2008 |
4.4 | — | 7.1 | 11.5 | 6.0 | |||||||||||||||
| Restructuring and related charges |
26.1 | 7.9 | 4.7 | 38.7 | (0.5 | ) | ||||||||||||||
| Adjustment from non-restructuring accounts |
(2.7 | ) | — | 0.5 | (2.2 | ) | — | |||||||||||||
| Cash payments |
(15.6 | ) | (7.9 | ) | (3.2 | ) | (26.7 | ) | (0.4 | ) | ||||||||||
| Amount charged to intangible assets |
0.7 | — | — | 0.7 | — | |||||||||||||||
| Accrual balance as of June 27, 2009 |
12.9 | — | 9.1 | 22.0 | 5.1 | |||||||||||||||
| Restructuring and related charges |
6.9 | 8.5 | 2.5 | 17.9 | 1.7 | |||||||||||||||
| Adjustment from non-restructuring accounts |
(0.4 | ) | — | 7.0 | 6.6 | — | ||||||||||||||
| Cash payments |
(14.9 | ) | (8.5 | ) | (9.3 | ) | (32.7 | ) | (0.7 | ) | ||||||||||
| Accrual balance as of July 3, 2010 |
$ | 4.5 | $ | — | $ | 9.3 | $ | 13.8 | $ | 6.1 | ||||||||||
The total restructuring accrual is disclosed in the Company’s Consolidated Balance Sheets as follows (in millions):
| Years Ended | ||||||
| July 3, 2010 |
June 27, 2009 | |||||
| Current |
$ | 7.1 | $ | 16.6 | ||
| Non-current |
6.7 | 5.4 | ||||
| Total |
$ | 13.8 | $ | 22.0 | ||
The non-current portion of the restructuring accrual is included as a component of “Other non-current liabilities” in the Company’s Consolidated Balance Sheets. In addition, restructuring expenses are not allocated to the reporting segments level.
115
Table of Contents
JDS UNIPHASE CORPORATION
NOTES TO CONSOLIDATED FINANCIAL STATEMENTS—(Continued)
Other lease exit costs are included in other liabilities as follows (in millions):
| Years Ended | ||||||
| July 3, 2010 |
June 27, 2009 | |||||
| Current |
$ | 0.7 | $ | 1.0 | ||
| Non-current |
5.4 | 4.1 | ||||
| Total |
$ | 6.1 | $ | 5.1 | ||
Note 13. Income Taxes
The Company’s loss before income taxes consisted of the following (in millions):
| Years Ended | ||||||||||||
| July 3, 2010 |
June 27, 2009 |
June 28, 2008 |
||||||||||
| Domestic |
$ | (65.6 | ) | $ | (657.6 | ) | $ | (13.8 | ) | |||
| Foreign |
6.3 | (211.1 | ) | (5.5 | ) | |||||||
| Loss before income taxes |
$ | (59.3 | ) | $ | (868.7 | ) | $ | (19.3 | ) | |||
The Company’s income tax expense (benefit) consisted of the following (in millions):
| Years Ended | ||||||||||||
| July 3, 2010 |
June 27, 2009 |
June 28, 2008 |
||||||||||
| Federal: |
||||||||||||
| Current |
$ | (0.4 | ) | $ | (5.5 | ) | $ | — | ||||
| Deferred |
0.4 | (2.2 | ) | 0.8 | ||||||||
| — | (7.7 | ) | 0.8 | |||||||||
| State: |
||||||||||||
| Current |
(0.1 | ) | (0.5 | ) | 1.0 | |||||||
| Deferred |
— | (0.3 | ) | (0.9 | ) | |||||||
| (0.1 | ) | (0.8 | ) | 0.1 | ||||||||
| Foreign: |
||||||||||||
| Current |
7.1 | 10.0 | 0.4 | |||||||||
| Deferred |
(4.5 | ) | (3.8 | ) | 1.1 | |||||||
| 2.6 | 6.2 | 1.5 | ||||||||||
| Total income tax expense (benefit) |
$ | 2.5 | $ | (2.3 | ) | $ | 2.4 | |||||
The federal current tax benefit primarily relates to the refund attributable to the Company’s unused research credits. The federal deferred tax expense primarily relates to the amortization of tax deductible goodwill. The foreign current expense primarily relates to the Company’s profitable operations in certain foreign jurisdictions. The foreign deferred tax benefit primarily relates to the amortization of foreign intangibles.
There was no material tax benefit associated with exercise of stock options for the fiscal years ended July 3, 2010, June 27, 2009, and June 28, 2008.
116
Table of Contents
JDS UNIPHASE CORPORATION
NOTES TO CONSOLIDATED FINANCIAL STATEMENTS—(Continued)
A reconciliation of the Company’s income tax expense (benefit) at the federal statutory rate to the income tax expense (benefit) at the effective tax rate is as follows (in millions):
| Years Ended | ||||||||||||
| July 3, 2010 |
June 27, 2009 |
June 28, 2008 |
||||||||||
| Income tax benefit computed at federal statutory rate |
$ | (20.8 | ) | $ | (303.6 | ) | $ | (6.7 | ) | |||
| Foreign rate differential |
(1.0 | ) | 0.3 | (1.1 | ) | |||||||
| Reduction of goodwill |
— | 212.2 | 12.9 | |||||||||
| Valuation allowance |
24.1 | 86.7 | 0.6 | |||||||||
| Reversal of previously accrued taxes |
(1.3 | ) | (0.4 | ) | (4.1 | ) | ||||||
| Withholding tax |
1.0 | 2.5 | 2.7 | |||||||||
| Tax credits |
(1.0 | ) | (6.1 | ) | (1.0 | ) | ||||||
| Other |
1.5 | 6.1 | (0.9 | ) | ||||||||
| Income tax expense (benefit) |
$ | 2.5 | $ | (2.3 | ) | $ | 2.4 | |||||
The components of the Company’s net deferred taxes consisted of the following (in millions):
| Years Ended | ||||||||||||
| July 3, 2010 |
June 27, 2009 |
June 28, 2008 |
||||||||||
| Gross deferred tax assets: |
||||||||||||
| Tax credit carryforwards |
$ | 158.4 | $ | 153.6 | $ | 156.6 | ||||||
| Net operating loss carryforwards |
2,334.1 | 2,312.1 | 2,311.2 | |||||||||
| Inventories |
18.1 | 15.2 | 13.7 | |||||||||
| Accruals and reserves |
27.1 | 17.5 | 26.5 | |||||||||
| Other |
92.5 | 103.5 | 87.9 | |||||||||
| Acquisition-related items |
186.3 | 220.2 | 205.8 | |||||||||
| Gross deferred tax assets |
2,816.5 | 2,822.1 | 2,801.7 | |||||||||
| Valuation allowance |
(2,702.6 | ) | (2,676.6 | ) | (2,652.5 | ) | ||||||
| Deferred tax assets |
113.9 | 145.5 | 149.2 | |||||||||
| Gross deferred tax liabilities: |
||||||||||||
| Acquisition-related items |
(86.3 | ) | (111.2 | ) | (145.7 | ) | ||||||
| Undistributed foreign earnings |
(4.0 | ) | (29.7 | ) | (19.6 | ) | ||||||
| Other |
(29.2 | ) | (15.7 | ) | (2.0 | ) | ||||||
| Deferred tax liabilities |
(119.5 | ) | (156.6 | ) | (167.3 | ) | ||||||
| Total net deferred tax liabilities |
$ | (5.6 | ) | $ | (11.1 | ) | $ | (18.1 | ) | |||
As of July 3, 2010, the Company had federal, state and foreign tax net operating loss carryforwards of $5,838.9 million, $2,574.2 million and $804.8 million, respectively, and federal, state and foreign research and other tax credit carryforwards of $62.0 million, $33.4 million and $62.9 million, respectively. Of this amount, approximately $20.9 million when realized will be credited to additional paid-in capital. The Company’s policy is to account for the utilization of tax attributes under a with-and-without approach. The tax net operating loss and tax credit carryforwards will expire at various dates through 2030 if not utilized. Utilization of the tax net operating losses may be subject to a substantial annual limitation due to the ownership change limitations provided by the Internal Revenue Code and similar state and foreign provisions. Loss carryforward limitations may result in the expiration or reduced utilization of a portion of the Company’s net operating losses.
117
Table of Contents
JDS UNIPHASE CORPORATION
NOTES TO CONSOLIDATED FINANCIAL STATEMENTS—(Continued)
U.S. income and foreign withholding taxes associated with the repatriation of earnings of foreign subsidiaries have not been provided on $95.1 million of undistributed earnings for certain foreign subsidiaries. The Company intends to reinvest these earnings indefinitely outside of the United States. The Company estimates that an additional $2.8 million of U.S. income or foreign withholding taxes would have to be provided if these earnings were repatriated back to the U.S.
The valuation allowance increased by $26.0 million in fiscal 2010, increased by $24.1 million in fiscal 2009, and decreased by $25.4 million in fiscal 2008. The increase during fiscal 2010 was primarily due to increases in domestic and foreign tax net operating losses sustained during the year, offset by utilization of foreign net operating losses. The increase during fiscal 2009 was primarily due to increases in domestic and foreign tax net operating losses sustained during the year, offset by utilization and expiration of domestic and foreign net operating losses. The decrease during fiscal 2008 was primarily due to the increase of the deferred tax liabilities resulting from acquired intangibles which was partially offset by an increase in domestic and foreign tax net operating losses sustained during the fiscal year.
Approximately $514.7 million of the valuation allowance as of July 3, 2010 was attributable to pre-fiscal 2006 windfall stock option deductions, the benefit of which will be credited to paid-in-capital if and when realized through a reduction in income tax payable. Beginning with fiscal 2006, the Company began to track the windfall stock option deductions off-balance sheet. If and when realized, the tax benefit associated with those deductions will be credited to additional paid-in-capital.
During fiscal 2009, Congress enacted the Housing Assistance Tax Act of 2008, which was signed by the President on July 30, 2008, and extended by the American Recovery and Reinvestment Act of 2009, which was signed by the President on February 17, 2009. The Act provides that a taxpayer may elect to forego bonus depreciation on certain additions of qualified eligible property purchased and placed in service between April 1, 2008 and December 31, 2009 and, in turn, claim a refundable credit for a portion of its unused AMT and research credits. We recognized a tax benefit of $5.5 million in fiscal 2009 attributable to the utilization of our refundable research credits.
During fiscal 2008, China adopted transitional rules regarding the 2007 Unified Enterprise Income Tax Law which took effect on January 1, 2008. Pursuant to the transitional rules of the new law, an 18% statutory tax rate applies for the 2008 calendar year and increases each year until calendar year 2012 when it reaches a 25% statutory rate. The measurement of the Company’s deferred taxes in China has been calculated taking into account the new transition rules.
118
Table of Contents
JDS UNIPHASE CORPORATION
NOTES TO CONSOLIDATED FINANCIAL STATEMENTS—(Continued)
A reconciliation of unrecognized tax benefits between July 1 2007 through July 3, 2010 is as follows (in millions):
| Balance at July 1, 2007 |
$ | 76.4 | ||
| Additions based on the tax positions related to the current year |
3.0 | |||
| Additions based on the tax positions related to the prior year |
0.5 | |||
| Reductions for lapse of statute of limitations |
(8.7 | ) | ||
| Additions due to foreign currency rate fluctuation |
0.7 | |||
| Balance at June 28, 2008 |
71.9 | |||
| Additions based on the tax positions related to the current year |
2.5 | |||
| Additions based on the tax positions related to the prior year |
0.3 | |||
| Reductions for lapse of statute of limitations |
(0.5 | ) | ||
| Reductions due to foreign currency rate fluctuation |
(4.9 | ) | ||
| Balance at June 27, 2009 |
69.3 | |||
| Additions based on the tax positions related to the current year |
1.1 | |||
| Reductions for lapse of statute of limitations |
(7.3 | ) | ||
| Additions due to foreign currency rate fluctuation |
2.7 | |||
| Reductions based on the tax positions related to the prior year |
(0.6 | ) | ||
| Balance at July 3, 2010 |
$ | 65.2 | ||
The liabilities for unrecognized tax benefits relate primarily to the allocations of revenue and costs among the Company’s global operations. In addition, utilization of the Company’s tax net operating losses may be subject to a substantial annual limitation due to the ownership change limitations provided by the Internal Revenue Code and similar state and foreign provisions. As a result, loss carryforward limitations may result in the expiration or reduced utilization of a portion of the Company’s net operating losses.
Included in the balance of unrecognized tax benefits at July 3, 2010 are $4.6 million of tax benefits that, if recognized, would impact the effective tax rate. Also included in the balance of unrecognized tax benefits at July 3, 2010 are $60.6 million of tax benefits that, if recognized, would result in adjustments to the valuation allowance.
The Company’s policy is to recognize accrued interest and penalties related to unrecognized tax benefits within the income tax provision. The amount of interest and penalties accrued as of July 3, 2010 and July 27, 2009 was approximately $26.4 million and $27.4 million, respectively. During fiscal 2010, the Company’s accrued interest and penalties was reduced by $1.0 million primarily because of the lapse of statute of limitations and foreign currency rate fluctuations. Due to the uncertainties related to current examinations in various jurisdictions, other changes could occur in the amount of unrecognized tax benefits during the next twelve months which the Company is unable to estimate at this time.
The following table summarizes the Company’s major tax jurisdictions and the tax years that remain subject to examination by such jurisdictions as of July 3, 2010:
| Tax Jurisdictions |
Tax Years | |
| United States |
2006 and onward | |
| Canada |
2003 and onward | |
| China |
2005 and onward | |
| France |
2005 and onward | |
| Germany |
2004 and onward |
119
Table of Contents
JDS UNIPHASE CORPORATION
NOTES TO CONSOLIDATED FINANCIAL STATEMENTS—(Continued)
Note 14. Stockholders’ Equity
Preferred Stock
In February 2003, the Company amended and restated its Stockholder Rights Agreement and currently each share of the Company’s outstanding common stock is associated with one right. Each right entitles stockholders to purchase 1/100,000 share of the Company’s Series B Preferred Stock at an exercise price of $21.00. The rights only become exercisable in certain limited circumstances following the tenth day after a person or group announces an acquisition of or tender offers for 15% or more of the Company’s common stock. For a limited period of time following the announcement of any such acquisition or offer, the rights are redeemable by the Company at a price of $0.01 per right. If the rights are not redeemed, each right will then entitle the holder to purchase common stock having the value of twice the then-current exercise price. For a limited period of time after the exercisability of the rights, each right, at the discretion of the Company’s Board of Directors, may be exchanged for either 1/100,000 share of Series B Preferred Stock or one share of common stock per right. The rights expire on June 22, 2013.
The Company’s Board of Directors has the authority to issue up to 499,999 shares of undesignated preferred stock and to determine the powers, preferences and rights and the qualifications, limitations or restrictions granted to or imposed upon any wholly unissued shares of undesignated preferred stock and to fix the number of shares constituting any series and the designation of such series, without the consent of the Company’s stockholders. The preferred stock could be issued with voting, liquidation, dividend and other rights superior to those of the holders of common stock. The issuance of Series B Preferred Stock or any preferred stock subsequently issued by the Company’s Board of Directors, under some circumstances, could have the effect of delaying, deferring or preventing a change in control.
Exchangeable Shares of JDS Uniphase Canada Ltd.
On June 30, 1999, in connection with the merger with JDS FITEL, JDS Uniphase Canada Ltd., a subsidiary of the Company, adopted an Exchangeable Share Rights Plan (the “Exchangeable Rights Plan”) substantially equivalent to the Company’s Rights Agreement. Under the Exchangeable Rights Plan, each exchangeable share issued has an associated right (an “Exchangeable Share Right”) entitling the holder of such Exchangeable Share Right to acquire additional exchangeable shares on terms and conditions substantially the same as the terms and conditions upon which a holder of shares of common stock is entitled to acquire either 1/1,000 share of the Company’s Series B Preferred Stock or, in certain circumstances, shares of common stock under the Company’s Rights Agreement. The definitions of beneficial ownership, the calculation of percentage ownership and the number of shares outstanding and related provisions of the Company’s Rights Agreement and the Exchangeable Rights Plan apply, as appropriate, to shares of common stock and exchangeable shares as though they were the same security. The Exchangeable Share Rights are intended to have characteristics essentially equivalent in economic effect to the Rights granted under the Company’s Rights Agreement. The Company has the right to force conversion of the exchangeable shares in fiscal 2014.
Stock Repurchase Program
On May 15, 2008, the Company’s Board of Directors authorized the Company to repurchase up to $200 million of its common stock through open market or private transactions during a two year period ending May 14, 2010. During fiscal 2009, the Company repurchased approximately 7.6 million shares of common stock in open market purchases at an average price of $11.40 per share. The total purchase price of $86.8 million was reflected as a decrease to common stock based on the stated par value per share with the remainder to accumulated deficit. During fiscal 2008, the Company repurchased approximately 9.6 million shares of common
120
Table of Contents
JDS UNIPHASE CORPORATION
NOTES TO CONSOLIDATED FINANCIAL STATEMENTS—(Continued)
stock in open market purchases at an average price of $11.76 per share. The total purchase price of $113.2 million was reflected as a decrease to common stock based on the stated par value per share with the remainder to accumulated deficit. All common shares repurchased under this program have been cancelled and retired.
Note 15. Stock-Based Compensation
Stock-Based Benefit Plans
Stock Option Plans
As of July 3, 2010, the Company had 22.2 million shares of stock options and Full Value Awards (as defined below) issued and outstanding to employees and directors under the Company’s 2005 Acquisition Equity Incentive Plan (the “2005 Plan”), Amended and Restated 2003 Equity Incentive Plan (the “2003 Plan”), and various other plans the Company assumed through acquisitions. The exercise price for stock options is equal to the fair value of the underlying stock at the date of grant. Options generally become exercisable over a four-year period and, if not exercised, expire from five to ten years after the date of grant.
On November 14, 2006, the Company’s shareholders approved an amendment and restatement of the 2003 Plan, under which (1) 12,500,000 shares of Common Stock were added to the pool of shares reserved for issuance under the 2003 Plan and (2) all future grants of “Full Value Awards” (as defined below) will reduce the share reserve by one and one-half shares for each share subject to such Awards. On November 12, 2008, the Company’s shareholders approved the following amendments to the 2003 Equity Incentive Plan. The first amendment increased the number of shares that may be issued under 2003 Equity Plan by 12,000,000. The second amendment increased the maximum number of shares granted to any employee in any fiscal year to 1,000,000.
On August 17, 2005, the Company’s Board of Directors adopted and approved the Flexible Stock Incentive—2005 Plan (the “2005 Plan”). Pursuant to Section 3(a) of the 2005 Plan, and in accordance with the registration requirements of the Securities Act of 1933, the Company registered 16.0 million shares, which have been reserved for issuance under the 2005 Plan. The adoption and approval of the 2005 Plan did not affect any of the options granted under the Flexible Stock Incentive—Amended and Restated 1993 Plan which was adopted in fiscal 1993, as amended, and currently outstanding, all of which remain exercisable in accordance with their terms. On May 2, 2010, the Company’s Board of Directors approved to increase the 2005 Acquisition Equity Incentive Plan by 800,000 shares.
As of July 3, 2010, 10.0 million shares of common stock, primarily under the 2003 Plan and the 2005 Plan, were available for grant.
Employee Stock Purchase Plans
In June 1998, the Company adopted the JDS Uniphase Corporation 1998 Employee Stock Purchase Plan, as amended (the “1998 Purchase Plan”). The 1998 Purchase Plan, which became effective August 1, 1998, provides eligible employees with the opportunity to acquire an ownership interest in the Company through periodic payroll deductions and provides a discounted purchase price as well as a look-back period. The 1998 Purchase Plan is structured as a qualified employee stock purchase plan under Section 423 of the Internal Revenue Code of 1986. However, the 1998 Purchase Plan is not intended to be a qualified pension, profit sharing or stock bonus plan under Section 401(a) of the Internal Revenue Code of 1986 and is not subject to the provisions of the
121
Table of Contents
JDS UNIPHASE CORPORATION
NOTES TO CONSOLIDATED FINANCIAL STATEMENTS—(Continued)
Employee Retirement Income Security Act of 1974. The 1998 Purchase Plan will terminate upon the earlier of August 1, 2018 or the date on which all shares available for issuance have been sold. Of the 50.0 million shares authorized to be issued under the 1998 Purchase Plan, 7.8 million shares remained available for issuance as of July 3, 2010.
Effective with the purchase period that began on February 1, 2006, the 1998 Purchase Plan was modified to provide a 5% discount and a six month look-back period. Previously, the 1998 Purchase Plan had provided a 15% discount and up to a two year look-back period.
Full Value Awards
“Full Value Awards” refer to Restricted Stock, Restricted Stock Units, Deferred Stock Units, Performance Units, and Performance Shares that are granted with the exercise price equal to zero and are converted to shares immediately upon vesting. These Full Value Awards are performance based, time based, or a combination of performance and time based and expected to vest over one to four years. The fair value of the Full Value Awards is based on the closing market price of the Company’s common stock on the date of award.
Stock-Based Compensation Expense
Stock-based compensation cost is measured at grant date, based on the fair value of the award, and recognized in expense over the requisite service period. The Company has elected to adopt the alternative transition method provided in the guidance for calculating the tax effects of stock-based compensation. The alternative transition method includes simplified methods to establish the beginning balance of the additional paid-in capital pool (APIC pool) related to the tax effects of employee stock-based compensation, and to determine the subsequent impact on the APIC pool and Consolidated Statements of Cash Flows of the tax effects of employee stock-based compensation awards that are outstanding upon adoption of the authoritative guidance governing the accounting and reporting of share-based payments of stock-based awards.
As required by the authoritative guidance, management has made an estimate of expected forfeitures and is recognizing compensation costs only for those equity awards expected to vest. The impact on the Company’s results of operations of recording stock-based compensation by function for fiscal years 2010, 2009, and 2008 was as follows (in millions):
| Years Ended | |||||||||
| July 3, 2010 |
June 27, 2009 |
June 28, 2008 | |||||||
| Cost of sales |
$ | 5.3 | $ | 6.7 | $ | 5.3 | |||
| Research and development |
8.8 | 9.1 | 10.2 | ||||||
| Selling, general and administrative |
29.0 | 34.8 | 33.8 | ||||||
| $ | 43.1 | $ | 50.6 | $ | 49.3 | ||||
Approximately $1.1 million of stock-based compensation was capitalized to inventory at July 3, 2010.
Stock Option Activity
The weighted average exercise price of options granted during the year ended July 3, 2010 was $6.13 per share, and the weighted average fair value of options granted during fiscal 2010 was $2.96 per share. The total intrinsic value of options exercised during the year ended July 3, 2010 was $6.3 million. In connection with these
122
Table of Contents
JDS UNIPHASE CORPORATION
NOTES TO CONSOLIDATED FINANCIAL STATEMENTS—(Continued)
exercises, the tax benefit realized by the Company was immaterial due to the fact that the Company has no material benefit in foreign jurisdictions and a full valuation allowance on its domestic deferred tax assets.
The Company issues new shares of common stock upon exercise of stock options. All new hire stock option grants vest over four years with 25% vesting on the first anniversary of the date of grant and 6.25% vesting every quarter thereafter. Focal stock option grants vest over three or four years with various vesting schedules. During fiscal 2009, the Company started granting performance-based options with market conditions (“the market-condition options”) to named executives. The market-condition options are amortized based upon the graded vesting method.
As of July 3, 2010, $12.1 million of unrecognized stock-based compensation cost related to stock options remains to be amortized. That cost is expected to be recognized over an estimated amortization period of 2.0 years.
The following is a summary of options activities (amount in millions except per share amounts):
| Options Outstanding | ||||||
| Number Of Shares |
Weighted-Average Exercise Price | |||||
| Balance as of June 30, 2007 |
19.6 | $ | 73.65 | |||
| Granted |
1.6 | 5.80 | ||||
| Exercised |
(1.6 | ) | 6.30 | |||
| Forfeited |
(1.1 | ) | 17.74 | |||
| Canceled |
(3.4 | ) | 167.41 | |||
| Balance as of June 28, 2008 |
15.1 | 56.71 | ||||
| Granted |
5.0 | 3.62 | ||||
| Exercised |
— | — | ||||
| Forfeited |
(0.9 | ) | 15.99 | |||
| Canceled |
(2.4 | ) | 123.17 | |||
| Balance as of June 27, 2009 |
16.8 | 33.65 | ||||
| Granted |
5.2 | 6.13 | ||||
| Exercised |
(1.1 | ) | 4.56 | |||
| Forfeited |
(1.1 | ) | 6.37 | |||
| Canceled |
(3.0 | ) | 74.57 | |||
| Balance as of July 3, 2010 |
16.8 | $ | 21.54 | |||
123
Table of Contents
JDS UNIPHASE CORPORATION
NOTES TO CONSOLIDATED FINANCIAL STATEMENTS—(Continued)
The following table summarizes significant ranges of outstanding and exercisable options as of July 3, 2010:
| Options Outstanding | Options Exercisable | |||||||||||||||||||
| Range of Exercise Prices |
Number of Shares |
Weighted Average Remaining Contractual Life (in years) |
Weighted Average Exercise Price |
Aggregate Intrinsic Value (‘000) |
Number of Shares |
Weighted Average Remaining Contractual Life (in years) |
Weighted Average Exercise Price |
Aggregate Intrinsic Value (‘000) | ||||||||||||
| $ 0.00 — 10.00 |
8,029,734 | 6.9 | $ | 4.93 | $ | 38,242 | 641,778 | 6.3 | $ | 3.72 | $ | 3,829 | ||||||||
| 10.01 — 20.00 |
3,485,266 | 3.6 | 13.80 | — | 3,078,178 | 3.3 | 13.94 | — | ||||||||||||
| 20.01 — 30.00 |
4,030,556 | 2.8 | 23.43 | — | 4,024,657 | 2.8 | 23.43 | — | ||||||||||||
| 30.01 — 100.00 |
958,573 | 1.7 | 34.62 | — | 958,573 | 1.7 | 34.62 | — | ||||||||||||
| 100.01 — 200.00 |
— | — | — | — | — | — | — | — | ||||||||||||
| 200.01 — 700.00 |
247,237 | 0.3 | 545.64 | — | 247,237 | 0.3 | 545.64 | — | ||||||||||||
| 700.01 — 1,200.00 |
13,239 | 0.2 | 820.40 | — | 13,239 | 0.2 | 820.40 | — | ||||||||||||
| 16,764,605 | — | — | $ | 38,242 | 8,963,662 | — | — | $ | 3,829 | |||||||||||
The aggregate intrinsic value in the table above represents the total pretax intrinsic value, based on the Company’s closing stock price of $9.69 as of July 3, 2010, which would have been received by the option holders had all option holders exercised their options as of that date. The total number of in-the-money options exercisable as of July 3, 2010 was 0.6 million. As Full Value Awards are exercised immediately upon vesting, there were none exercisable as of July 3, 2010.
Employee Stock Purchase Plan (“ESPP”) Activity
The compensation expense in connection with the Company’s employee stock purchase plan for the year ended July 3, 2010 was $0.8 million. The expense related to the plan is recorded on a straight-line basis over the relevant subscription period.
The following table summarizes the shares issued and the fair market value at purchase date, pursuant to the Company’s employee stock purchase plan during the year ended July 3, 2010:
| Purchase date |
January 29, 2010 |
July 31, 2009 | ||||
| Shares Issued |
457,713 | 552,959 | ||||
| Fair market value at purchase date |
$ | 7.86 | $ | 3.99 | ||
As of July 3, 2010, $0.1 million of unrecognized stock-based compensation cost related to ESPP remains to be amortized. That cost is expected to be recognized through the first quarter of fiscal 2011.
Full Value Awards
During the year ended July 3, 2010, the Compensation Committee of the Company’s Board of Directors approved the grant of 2.9 million Full Value Awards to the Company’s Board of Directors and employees. Time based Full Value Awards are amortized on a straight-line basis over the probable vesting periods. Performance based Full Value Awards are amortized based upon the graded vesting method. During fiscal years 2010, 2009, and 2008, the Company recorded $26.2 million, $32.6 million, and $29.9 million of such compensation expenses, respectively.
124
Table of Contents
JDS UNIPHASE CORPORATION
NOTES TO CONSOLIDATED FINANCIAL STATEMENTS—(Continued)
As of July 3, 2010, $32.8 million of unrecognized stock-based compensation cost related to Full Value Awards remains to be amortized. That cost is expected to be recognized over an estimated amortization period of 2.1 years.
A summary of the status of the Company’s nonvested Full Value Awards as of July 3, 2010 and changes during the same period is presented below (amount in millions, except per share amounts):
| Full Value Awards | ||||||||||||
| Performance shares |
Non- performance shares |
Total number of shares |
Weighted-average grant-dated fair value | |||||||||
| Nonvested at June 30, 2007 |
1.0 | 3.4 | 4.4 | $ | 14.53 | |||||||
| Awards granted |
0.2 | 4.5 | 4.7 | 12.87 | ||||||||
| Awards vested |
— | (1.4 | ) | (1.4 | ) | 15.27 | ||||||
| Awards forfeited |
(0.2 | ) | (0.5 | ) | (0.7 | ) | 15.72 | |||||
| Nonvested at June 28, 2008 |
1.0 | 6.0 | 7.0 | 13.14 | ||||||||
| Awards granted |
0.6 | 2.7 | 3.3 | 5.14 | ||||||||
| Awards vested |
(0.5 | ) | (2.1 | ) | (2.6 | ) | 12.65 | |||||
| Awards forfeited |
(0.4 | ) | (0.9 | ) | (1.3 | ) | 12.63 | |||||
| Nonvested at June 27, 2009 |
0.7 | 5.7 | 6.4 | 9.38 | ||||||||
| Awards granted |
0.1 | 2.8 | 2.9 | 8.41 | ||||||||
| Awards vested |
(0.4 | ) | (2.5 | ) | (2.9 | ) | 10.05 | |||||
| Awards forfeited |
(0.1 | ) | (0.9 | ) | (1.0 | ) | 9.47 | |||||
| Nonvested at July 3, 2010 |
0.3 | 5.1 | 5.4 | 8.49 | ||||||||
Full Value Awards are converted into shares upon vesting. Shares equivalent in value to the minimum withholding taxes liability on the vested shares are withheld by the Company for the payment.
Valuation Assumptions
The Company estimates the fair value of stock options using a Black-Scholes-Merton (BSM) valuation model. The fair value is estimated on the date of grant using the BSM option valuation model with the following weighted-average assumptions:
| Employee Stock Option Plans | Employee Stock Purchase Plans | |||||||||||||||||
| 2010 | 2009 | 2008 | 2010 | 2009 | 2008 | |||||||||||||
| Expected term (in years) |
4.69 | 4.68 | 4.30 | 0.50 | 0.50 | 0.50 | ||||||||||||
| Expected volatility |
56 | % | 73 | % | 45 | % | 64 | % | 47 | % | 46 | % | ||||||
| Risk-free interest rate |
2.37 | % | 1.80 | % | 4.49 | % | 0.34 | % | 1.97 | % | 3.36 | % | ||||||
| Dividend yield |
0.00 | % | 0.00 | % | 0.00 | % | 0.00 | % | 0.00 | % | 0.00 | % | ||||||
Expected Term: The Company’s expected term represents the period that the Company’s stock-based awards are expected to be outstanding and was determined based on historical experience of similar awards, giving consideration to the contractual terms of the stock-based awards, vesting schedules and expectations of future employee behavior.
Expected Volatility: The Company determined that a combination of the implied volatility of its traded options and historical volatility of its stock price based on the expected term of the equity instrument most appropriately reflects market expectation of future volatility. Implied volatility is based on traded options of the Company’s common stock with a remaining maturity of six months or greater.
125
Table of Contents
JDS UNIPHASE CORPORATION
NOTES TO CONSOLIDATED FINANCIAL STATEMENTS—(Continued)
Risk-Free Interest Rate: The Company bases the risk-free interest rate used in the BSM valuation method on the implied yield currently available on U.S. Treasury zero-coupon issues with an equivalent remaining term. Where the expected term of the Company’s stock-based awards do not correspond with the terms for which interest rates are quoted, the Company performed a straight-line interpolation to determine the rate from the available maturities.
Expected Dividend: The BSM valuation model calls for a single expected dividend yield as an input. The Company has not paid and does not anticipate paying any dividends in the near future.
Estimated Pre-vesting Forfeitures: When estimating forfeitures, the Company considers voluntary termination behavior as well as future workforce reduction programs. Estimated forfeiture rates are trued-up to actual forfeiture results as the stock-based awards vest.
Note 16. Employee Benefit Plans
Employee 401(k) Plans
The Company sponsors the JDS Uniphase Corporation Employee 401(k) Retirement Plan (the “401(k) Plan”), a Defined Contribution Plan under ERISA, which provides retirement benefits for its eligible employees through tax deferred salary deductions. The 401(k) Plan allows employees to contribute up to 50% of their annual compensation, with such contributions limited to $16,500 in calendar year 2010 as set by the Internal Revenue Service.
Effective January 1, 2007, the Plan provided for a 100% match of employees’ contributions up to the first 3% of annual compensation and 50% match on the next 2% of compensation. Effective January 1, 2009, through the remainder of fiscal 2009, there was no Company match. Effective April 2010, the Company restored employer matching contributions to all eligible participants who have completed 180 days of service with JDSU. All matching contributions are made in cash and vest immediately. The Company’s matching contributions to the 401(k) Plan were $4.3 million, $2.6 million, and $6.6 million in fiscal 2010, 2009, and 2008, respectively.
The Company also provides a non-qualified retirement plan for the benefit of certain eligible employees in the U.S. This plan is designed to permit employee deferral of a portion of salaries in excess of certain tax limits and deferral of bonuses. This plan’s assets are designated as trading securities in the Company’s Consolidated Balance Sheets. See “Note 7. Investments” for more detail.
Employee Defined Benefit Plans
The Company sponsors qualified and non-qualified pension plans for certain past and present employees in the UK and Germany. The Company also is responsible for the nonpension postretirement benefit obligation of a previously acquired subsidiary. Most of the plans have been closed to new participants and no additional service costs are being accrued, except for the plans assumed during fiscal 2010 in connection with the NSD acquisition. Benefits are generally based upon years of service and compensation or stated amounts for each year of service. As of July 3, 2010 the UK plan was partially funded while the other plans were unfunded. The Company’s policy for funded plans is to make contributions equal to or greater than the requirements prescribed by law or regulation. The Company anticipates making a contribution of approximately $0.3 million during fiscal 2011. For unfunded plans, the Company pays the postretirement benefits when due. Future estimated benefit payments are summarized below. No other required contributions to defined benefit plans are expected in fiscal 2011.
126
Table of Contents
JDS UNIPHASE CORPORATION
NOTES TO CONSOLIDATED FINANCIAL STATEMENTS—(Continued)
The Company accounts for its obligations under these pension plans in accordance with authoritative guidance which requires the Company to record its obligation to the participants, as well as the corresponding net periodic cost. The Company determines its obligation to the participants and its net periodic cost principally using actuarial valuations provided by third-party actuaries. The obligation the Company records in its Consolidated Balance Sheets is reflective of the total projected benefit obligation (“PBO”) and the fair value of plan assets.
Effective June 30, 2007, the Company adopted authoritative guidance which requires recognition of the funded status of each defined benefit pension plan and nonpension postretirement benefit plan on the Company’s balance sheet. The impact of adopting the guidance due to previously unrecognized actuarial gains and losses and prior service costs or credits is recognized as a component of Accumulated other comprehensive income (net of tax) in Stockholders’ equity.
The following table presents the components of the net periodic cost for the pension and benefits plans (in millions):
| Pension Benefits | Other Post Retirement Benefit Plans | ||||||||||||||||||||||
| 2010 | 2009 | 2008 | 2010 | 2009 | 2008 | ||||||||||||||||||
| Service cost |
$ | 0.1 | $ | — | $ | — | $ | — | $ | — | $ | — | |||||||||||
| Interest cost |
5.7 | 5.8 | 6.2 | — | 0.1 | 0.1 | |||||||||||||||||
| Expected return on plan assets |
(1.1 | ) | (1.4 | ) | (1.5 | ) | — | — | — | ||||||||||||||
| Recognized actuarial gains |
(0.8 | ) | (0.5 | ) | (0.1 | ) | — | (0.1 | ) | (0.1 | ) | ||||||||||||
| Net periodic benefit cost |
$ | 3.9 | $ | 3.9 | $ | 4.6 | $ | — | $ | — | $ | — | |||||||||||
The Company’s accumulated other comprehensive income includes unrealized net actuarial loss/(gain). The amount expected to be recognized in net periodic benefit cost during fiscal 2011 is zero.
127
Table of Contents
JDS UNIPHASE CORPORATION
NOTES TO CONSOLIDATED FINANCIAL STATEMENTS—(Continued)
The changes in the benefit obligations and plan assets of the pension and benefits plans were (in millions):
| Pension Benefits | Other Post Retirement Benefit Plans |
|||||||||||||||
| 2010 | 2009 | 2010 | 2009 | |||||||||||||
| Change in benefit obligation: |
||||||||||||||||
| Benefit obligation at beginning of year |
$ | 97.1 | $ | 113.7 | $ | 0.8 | $ | 0.8 | ||||||||
| Service cost |
0.1 | — | — | — | ||||||||||||
| Interest cost |
5.7 | 5.8 | — | 0.1 | ||||||||||||
| Actuarial (gains)/losses |
11.3 | (1.3 | ) | — | (0.1 | ) | ||||||||||
| Acquisitions |
3.2 | — | ||||||||||||||
| Benefits paid |
(4.6 | ) | (7.7 | ) | — | — | ||||||||||
| Plan amendment and curtailment |
— | — | — | — | ||||||||||||
| Foreign exchange impact |
(12.9 | ) | (13.4 | ) | — | — | ||||||||||
| Benefit obligation at end of year |
$ | 99.9 | $ | 97.1 | $ | 0.8 | $ | 0.8 | ||||||||
| Change in plan assets: |
||||||||||||||||
| Fair value of plan assets at beginning of year |
$ | 19.4 | $ | 28.3 | $ | — | $ | — | ||||||||
| Actual return on plan assets |
2.2 | (1.0 | ) | — | — | |||||||||||
| Acquisitions |
— | — | ||||||||||||||
| Employer contributions |
4.3 | 4.5 | — | — | ||||||||||||
| Benefits paid |
(4.6 | ) | (7.7 | ) | — | — | ||||||||||
| Foreign exchange impact |
(1.9 | ) | (4.7 | ) | — | — | ||||||||||
| Fair value of plan assets at end of year |
$ | 19.4 | $ | 19.4 | $ | — | $ | — | ||||||||
| Funded status |
$ | (80.5 | ) | $ | (77.7 | ) | $ | (0.8 | ) | $ | (0.8 | ) | ||||
| Accumulated benefit obligation |
$ | 99.4 | $ | 97.1 | ||||||||||||
| Pension Benefits | Other Post Retirement Benefit Plans | |||||||||||
| 2010 | 2009 | 2010 | 2009 | |||||||||
| Amount recognized in the Consolidated Balance Sheet at end of year |
||||||||||||
| Current liabilities |
$ | 4.2 | $ | 4.5 | $ | — | $ | — | ||||
| Non-current liabilities |
76.3 | 73.2 | 0.8 | 0.8 | ||||||||
| Net amount recognized at end of year |
$ | 80.5 | $ | 77.7 | $ | 0.8 | $ | 0.8 | ||||
| Amount recognized in Accumulated Other Comprehensive Income at end of year |
||||||||||||
| Actuarial gains, net of tax |
$ | 6.5 | $ | 15.6 | $ | — | $ | — | ||||
| Net amount recognized at end of year |
$ | 6.5 | $ | 15.6 | $ | — | $ | — | ||||
| Other changes in plan assets and benefit obligations recognized in Other Comprehensive Loss |
||||||||||||
| Net actuarial (gains)/losses |
$ | 8.4 | $ | 0.2 | $ | — | $ | — | ||||
| Amortization of accumulated net actuarial gains/(losses) |
0.7 | 0.5 | — | — | ||||||||
| Total recognized in Other comprehensive loss |
$ | 9.1 | $ | 0.7 | $ | — | $ | — | ||||
128
Table of Contents
JDS UNIPHASE CORPORATION
NOTES TO CONSOLIDATED FINANCIAL STATEMENTS—(Continued)
During fiscal 2010 and fiscal 2009, the Company contributed GBP 0.2 million and GBP 0.2 million or approximately $0.3 million and $0.3 million, respectively, to its UK pension plan. These contributions allowed the Company to comply with regulatory funding requirements.
From April 8 through May 23, 2008, the UK pension plan offered lump-sum cash payments to deferred pensioners opting to transfer out of the plan. Deferred pensioners are plan beneficiaries not yet drawing pension benefits. Deferred pensioners transferring out of the plan surrendered the right to receive future pension payments. Initially, 55 deferred pensioners accepted the transfer out offer and were expected to receive total lump-sum cash payments of approximately GBP 2.2 million or $4.4 million from pension assets during fiscal 2009. In fiscal 2008, the Company accounted for the transfer out offer as a settlement and recorded a gain of $46,000 in its Consolidated Statement of Operations. The Company made lump-sum payments in fiscal 2009 of approximately GBP 1.9 million or $3.1 million to 41 deferred pensioners. Five deferred pensioners subsequently withdrew from the transfer out offer and the payments for the remaining 9 deferred pensioners were pending due to non-completion of the necessary transfer documents as of July 3, 2010 .
Assumptions
Underlying both the calculation of the PBO and net periodic cost are actuarial valuations. These valuations use participant-specific information such as salary, age, years of service, and assumptions about interest rates, compensation increases and other factors. At a minimum, the Company evaluates these assumptions annually and makes changes as necessary.
The discount rate reflects the estimated rate at which the pension benefits could be effectively settled. In developing the discount rate, the Company considered the yield available on an appropriate AA corporate bond index, adjusted to reflect the term of the scheme’s liabilities as well as a yield curve model developed by the Company’s actuaries.
The expected return on assets was estimated by using the weighted average of the real expected long term return ( net of inflation) on the relevant classes of assets based on the target asset mix and adding the chosen inflation assumption.
Weighted average assumptions used to determine net periodic cost and benefit obligation are as follows:
| Pension Benefits | Other Post Retirement Benefit Plans | |||||||||||||||||
| 2010 | 2009 | 2008 | 2010 | 2009 | 2008 | |||||||||||||
| Weighted-average assumptions used to determine net periodic cost for the year ended July 3: |
||||||||||||||||||
| Discount rate |
4.80 | % | 6.00 | % | 6.00 | % | 5.75 | % | 6.00 | % | 5.50 | % | ||||||
| Expected long-term return on plan assets |
6.00 | 5.98 | 6.50 | — | — | — | ||||||||||||
| Rate of compensation increase |
1.75 | 2.00 | 2.25 | — | — | — | ||||||||||||
| Weighted-average assumptions used to determine benefit obligation at July 3: |
||||||||||||||||||
| Discount rate |
4.80 | % | 6.00 | % | 6.00 | % | 5.75 | % | 6.00 | % | 5.50 | % | ||||||
| Rate of compensation increase |
1.75 | 2.00 | 2.25 | — | — | — | ||||||||||||
129
Table of Contents
JDS UNIPHASE CORPORATION
NOTES TO CONSOLIDATED FINANCIAL STATEMENTS—(Continued)
Investment Policies and Strategies
The Company’s investment objectives for its funded pension plan are to ensure that there are sufficient assets available to pay out members’ benefits as and when they arise and that should the plan be discontinued at any point in time there would be sufficient assets to met the discontinuance liabilities. To achieve the objectives, the trustees of the plan are responsible for regularly monitoring the funding position and managing the risk by investing in assets expected to outperform the increase in value of the liabilities in the long term and by investing in a diversified portfolio of assets in order to minimize volatility in the funding position. The trustees invest in a range of frequently traded funds ( “pooled funds” ) rather than direct holdings in individual securities to maintain liquidity, achieve diversification and reduce the potential for risk concentration. The funded plan assets are managed by professional third-party investment managers.
For the Company’s funded pension plan, the percentage of asset allocations at year end of fiscal 2010 and 2009, by asset category, were as follows:
| Percentage of Plan Assets at | ||||||||
| Asset category |
Target allocation % |
July 3,
2010 |
June 27,
2009 |
|||||
| Equities |
36-44 | 37 | % | 27 | % | |||
| Bonds |
45-55 | 53 | 73 | |||||
| Other (1) |
8-12 | 10 | — | |||||
| Total |
100 | % | 100 | % | ||||
| (1) | Of the 10% in the “other” category, 0.5% relates to cash, the remainder to the diversified growth fund. |
Fair Value Measurement of Plan Assets
The following table sets forth the plan’s assets at fair value as of July 3, 2010.
| Fair value measurement as of July 3, 2010 |
|||||||||
| Total | Quoted Prices in
Active Markets for Identical Assets (Level 1) |
Significant Other Observable Inputs (Level 2) | |||||||
| Assets: |
|||||||||
| Global equity |
$ | 7.1 | $ | 7.1 | $ | — | |||
| Fixed income |
10.3 | 10.3 | — | ||||||
| Other |
1.9 | — | $ | 1.9 | |||||
| Cash |
0.1 | 0.1 | $ | — | |||||
| Total assets |
$ | 19.4 | $ | 17.5 | $ | 1.9 | |||
Global equity consists primarily of index funds that invest approximately 60% in UK equities as represented by the FTSE All-Share Index and 40% in overseas equities as represented by the appropriate sub-divisions of FTSE All-World Index. The underlying securities of the funds are valued at quoted prices reported in the active markets in which the individual securities are traded,
Fixed income consists primarily of funds that invest in index-linked Gilts (over 5 year) and sterling-denominated investment grade corporate bonds. These government and corporate bonds are valued at quoted prices reported in the active markets for identical assets.
130
Table of Contents
JDS UNIPHASE CORPORATION
NOTES TO CONSOLIDATED FINANCIAL STATEMENTS—(Continued)
Other consists of the diversified growth fund that invests in the private equity passive fund, the global real estate index fund, the infrastructure index fund, the high yield bond fund, and the UK property fund. The underlying assets are valued at quoted prices for similar assets or quoted prices in markets that are not active.
Future Benefit Payments
The following table reflects the total expected benefit payments to defined benefit pension plan participants. These payments have been estimated based on the same assumptions used to measure the Company’s PBO at year end and include benefits attributable to estimated future compensation increases.
| (in millions) |
Pension Benefits | Other Post Retirement Benefit Plans | ||||
| 2011 |
$ | 4.8 | $ | — | ||
| 2012 |
4.4 | 0.1 | ||||
| 2013 |
4.7 | — | ||||
| 2014 |
4.8 | — | ||||
| 2015 |
4.7 | 0.1 | ||||
| 2016 and Thereafter |
52.9 | 0.6 | ||||
| Total |
$ | 76.3 | $ | 0.8 | ||
Note 17. Related Party Transactions
Fabrinet Inc. (“Fabrinet”)
During fiscal 2010, Fabrinet Inc., a publicly held contract manufacturing company in which the Company has an available-for-sale investment, was both a customer and supplier. The purchases and sales of items between the Company and Fabrinet have been evaluated for accounting under the authoritative guidance on consideration given by a vendor to a customer or a reseller of the vendor’s products. Based on this evaluation, the Company determined that there is an identifiable benefit that was sufficiently separable from the customer’s purchase of the Company’s products and the fair value of that benefit was reasonably estimable in relation to sales to other third parties.
During fiscal 2010, we sold 1,606,850 shares of common stock in Fabrinet Inc. (“Fabrinet”), in connection with their initial public offering, recording net gains on the sale of the investment of $13.3 million. As of July 3, 2010 we still owned 393,150 shares of Fabrinet’s common stock that was previously reported as a long-term investment at a carrying cost of $1.00 per share. Since our management subsequently sold the remaining shares in the first quarter of fiscal 2011, we reported the investment in Fabrinet as a short-term available-for-sale investment held at a fair value of $10.76 per share as of July 3, 2010 and recorded an unrealized gain of approximately $3.8 million in accumulated other comprehensive income.
Harmonic Inc. (“Harmonic”)
As of July 3, 2010, the Chairman of JDSU’s Audit Committee was also a member of the Board of Directors of Harmonic, a publicly held company which designs, manufactures and sells systems and software that enable network operators to provide a range of interactive and advanced digital services. Harmonic is a customer of the Company. Related party balances with Harmonic are immaterial for all periods presented below.
KLA-Tencor Corporation (“KLA-Tencor”)
As of July 3, 2010, one member of the Board of Directors of JDSU was also a member of the Board of Directors of KLA-Tencor, a publicly held company which provides process control and yield management solutions for the semiconductor manufacturing. KLA-Tencor is a customer of the Company.
131
Table of Contents
JDS UNIPHASE CORPORATION
NOTES TO CONSOLIDATED FINANCIAL STATEMENTS—(Continued)
Micralyne, Inc. (“Micralyne”)
Micralyne Inc., a privately held manufacturer of microfabricated and MEMS (Micro-Electro-Mechanical-Systems) based products in which the Company has a long-term investment, is a supplier of the Company. As of June 27, 2009, the carrying value of the Company’s investment in Micralyne was $0.5 million. During fiscal 2010, the company recorded an other-than-temporary impairment of $0.5 million due to concern about Micralyne’s ability to continue as a going concern. As of July 3, 2010, the carrying value of the investment was zero.
Transactions and balances with the Company’s related parties were as follows (in millions):
| Years Ended | Years Ended | ||||||||||||||||
| July 3, 2010 |
June 27, 2009 |
June 28, 2008 |
July 3, 2010 |
June 27, 2009 | |||||||||||||
| Sales: |
Accounts Receivable: |
||||||||||||||||
| Fabrinet * |
10.3 | $ | 12.1 | $ | 18.4 | Fabrinet |
$ | 3.5 | $ | 3.3 | |||||||
| KLA-Tencor |
2.6 | 5.0 | 5.3 | KLA-Tencor |
0.3 | 0.7 | |||||||||||
| Micralyne |
— | — | — | Micralyne |
— | — | |||||||||||
| $ | 12.9 | $ | 17.1 | $ | 23.7 | $ | 3.8 | $ | 4.0 | ||||||||
| Purchases: |
Accounts Payable: |
||||||||||||||||
| Fabrinet |
$ | 78.3 | $ | 78.5 | $ | 96.5 | Fabrinet |
$ | 21.1 | $ | 10.2 | ||||||
| KLA-Tencor |
— | — | — | KLA-Tencor |
— | — | |||||||||||
| Micralyne |
— | 2.8 | 1.3 | Micralyne |
— | — | |||||||||||
| $ | 78.3 | $ | 81.3 | $ | 97.8 | $ | 21.1 | $ | 10.2 | ||||||||
| * | Sales are related to sale of inventory |
Note 18. Commitments and Contingencies
Operating Leases
The Company leases facilities under operating lease agreements that expire at various dates through fiscal 2022. As of July 3, 2010, future minimum annual lease payments under non-cancellable operating leases were as follows (in millions):
| 2011 |
$ | 21.2 | |
| 2012 |
20.8 | ||
| 2013 |
17.4 | ||
| 2014 |
12.3 | ||
| 2015 |
10.0 | ||
| Thereafter |
18.2 | ||
| Total minimum operating lease payments |
$ | 99.9 | |
Included in the future minimum lease payments table above is $9.3 million related to lease commitments in connection with the Company’s restructuring activities. See “Note 12. Restructuring and Related Charges” for more detail.
The aggregate future minimum rentals to be received under non-cancellable subleases totalled $2.4 million as of July 3, 2010. Rental expense relating to building and equipment was $20.1 million, $27.5 million, and $26.3 million in fiscal 2010, 2009, and 2008, respectively.
132
Table of Contents
JDS UNIPHASE CORPORATION
NOTES TO CONSOLIDATED FINANCIAL STATEMENTS—(Continued)
Capital Leases
As of July 3, 2010, the Company had one building lease in Beijing, China that was classified as a capital lease. As of July 3, 2010, the gross carrying amount of the building was $8.2 million and total accumulated amortization expense was $7.6 million. Amortization expense related to the building was included as part of the Company’s total depreciation expense. The building lease bears an interest rate of 5.2%.
The following table presents the future minimum lease payments under the capital leases together with the present value of the minimum lease payments as of July 3, 2010 (in millions):
| 2011 |
$ | 0.8 | |
| 2012 |
— | ||
| 2013 |
— | ||
| 2014 |
— | ||
| 2015 |
— | ||
| Thereafter |
— | ||
| Total minimum capital lease payments |
0.8 | ||
| Less: Amount representing interest |
— | ||
| Present value of minimum capital lease payments |
$ | 0.8 | |
Purchase Obligations
Purchase obligations of $138.1 million as of July 3, 2010, represent legally-binding commitments to purchase inventory and other commitments made in the normal course of business to meet operational requirements. Although open purchase orders are considered enforceable and legally binding, the terms generally allow us the option to cancel, reschedule and adjust our requirements based on our business needs prior to the delivery of goods or performance of services. Obligations to purchase inventory and other commitments are generally expected to be fulfilled within one year.
Tax Matters
The Company has been subject to a Texas franchise tax audit related to allocated taxable surplus capital for Texas report years 2001, 2002, 2003, 2004, 2005 and 2006. While the Company believes that it is reasonably possible this audit may result in additional tax liabilities, based on currently available information, the Company believes the ultimate outcome of this audit will not have a material adverse effect on the Company’s financial position, cash flows or overall trends in results of operations. There is the possibility of a material adverse effect on the Company’s financial position, cash flows or overall trends in results of operations for the period in which this matter is ultimately resolved, if it is resolved unfavorably, or in the period in which an unfavorable outcome becomes probable. The range of the potential total tax liability related to these matters is estimated to be from $0 million to $36.5 million, plus interest and penalties.
Note 19. Operating Segments and Geographic Information
The Company evaluates its reportable segments in accordance with the authoritative guidance on segment reporting. The Company’s Chief Executive Officer, Thomas Waechter, is the Company’s Chief Operating Decision Maker (CODM) pursuant to the guidance. The CODM allocates resources to the segments based on their business prospects, competitive factors, net revenue, and operating results. During the second quarter of
133
Table of Contents
JDS UNIPHASE CORPORATION
NOTES TO CONSOLIDATED FINANCIAL STATEMENTS—(Continued)
fiscal year 2009, the Company changed its reporting structure to combine the All Others, Commercial Lasers business segment with the Optical Communications business segment to form a new business segment: Communications and Commercial Optical Products. For fiscal 2008, net revenue of $87.2 million and operating loss of $0.5 million of the former All Others, Commercial Lasers segment were included in the Communications and Commercial Optical Products segment.
The Company is a leading provider of communications test and measurement solutions and optical products for telecommunications service providers, cable operators, and network equipment manufacturers. JDSU technologies also enable broadband and optical innovation in many essential industries such as biomedical and environmental instrumentation, semiconductor processing, aerospace and defense, and brand protection. In addition, our optical coatings are used in visual display and decorative product differentiation applications. The major segments the Company serves are:
| (i) | Communications Test and Measurement Business Segment: |
The Communications Test and Measurement segment supplies instruments, solutions, and services to enable the design, deployment, and maintenance of communication equipment and networks as well as to ensure the quality of services delivered to the end customer. These solutions accelerate the deployment of new products and services that lower operating expenses while improving performance and reliability. Included in the product portfolio are test tools, platforms, solutions, and services for optical transport networks, xDSL services, data networks, wireless test, cable networks, FTTx networks, digital video broadcast, fiber characterization, and storage networks.
| (ii) | Communications and Commercial Optical Products Business Segment: |
The Communications and Commercial Optical Products segment provides components, modules, subsystems, and solutions used by communications equipment providers for telecommunications and enterprise data communications. These products enable the transmission of video, audio, and text data over high-capacity, fiber-optic cables. The product portfolio includes transmitters, receivers, amplifiers, ROADMs, optical transceivers, multiplexers and demultiplexers, switches, optical-performance monitors and couplers, splitters, and circulators.
This segment also provides a broad laser portfolio that addresses the needs of OEM clients for applications such as micromachining, materials processing, bioinstrumentation, consumer electronics, graphics, medical/dental, and optical pumping. JDSU products include diode, direct-diode, diode-pumped solid-state, fiber, and gas lasers. Additionally, the segment’s photovoltaics (PV) products include concentrated photovoltaic (CPV) cells and receivers for generating energy from sunlight as well as fiber-optic-based systems for delivering and measuring electrical power.
| (iii) | Advanced Optical Technologies Business Segment: |
The Advanced Optical Technologies segment provides innovative optical solutions for security and brand-differentiation applications and thin film coatings for a range of public- and private-sector markets. These products enhance and manage the behavior of light by using its reflection, absorption, and transmission properties to achieve specific effects such as high reflectivity, antiglare, and spectral filtering. Specific product applications include computer-driven projectors, intelligent lighting systems, office equipment, security products, and decorative surface treatments. Advanced Optical Technologies also provides multilayer product-security solutions for a number of markets. These solutions deliver overt, covert, forensic and digital product and document verification for protection against counterfeiting and tampering.
134
Table of Contents
JDS UNIPHASE CORPORATION
NOTES TO CONSOLIDATED FINANCIAL STATEMENTS—(Continued)
The accounting policies of the reportable segments are the same as those described in the summary of significant accounting policies. The Company evaluates segment performance based on operating income (loss) excluding infrequent or unusual items.
The amounts shown as Corporate consist of certain unallocated corporate-level operating expenses. In addition, the Company does not allocate restructuring and related charges, income taxes, or non-operating income and expenses to its segments.
Information on reportable segments is as follows (in millions):
| Years Ended | ||||||||||||
| July 3, 2010 |
June 27, 2009 |
June 28, 2008 |
||||||||||
| Net revenue: |
||||||||||||
| Communications Test and Measurement |
$ | 652.2 | $ | 595.1 | $ | 692.6 | ||||||
| Communications and Commercial Optical Products |
499.3 | 481.1 | 614.1 | |||||||||
| Advanced Optical Technologies |
221.9 | 208.4 | 206.5 | |||||||||
| Deferred revenue related to purchase accounting adjustment |
(9.5 | ) | (1.3 | ) | (1.2 | ) | ||||||
| Net revenue |
$ | 1,363.9 | $ | 1,283.3 | $ | 1,512.0 | ||||||
| Operating income (loss): |
||||||||||||
| Communications Test and Measurement |
$ | 81.5 | $ | 86.4 | $ | 116.0 | ||||||
| Communications and Commercial Optical Products |
33.4 | (8.6 | ) | 20.3 | ||||||||
| Advanced Optical Technologies |
82.5 | 80.3 | 76.8 | |||||||||
| Corporate |
(100.0 | ) | (127.8 | ) | (136.5 | ) | ||||||
| Total segment operating income |
97.4 | 30.3 | 76.6 | |||||||||
| Unallocated amounts: |
||||||||||||
| Stock based compensation |
(43.1 | ) | (50.6 | ) | (49.3 | ) | ||||||
| Acquisition-related charges and amortization of intangibles |
(88.0 | ) | (82.1 | ) | (158.0 | ) | ||||||
| Impairment of goodwill |
— | (741.7 | ) | 37.0 | ||||||||
| Gain (loss) on disposal and impairment of long-lived assets |
2.0 | (13.2 | ) | (10.7 | ) | |||||||
| Restructuring and related charges |
(17.7 | ) | (38.5 | ) | (6.7 | ) | ||||||
| Realignment and other charges |
(4.8 | ) | (4.1 | ) | (23.0 | ) | ||||||
| Interest and other income (expense), net |
9.6 | 33.5 | 120.1 | |||||||||
| Interest expense |
(24.3 | ) | (25.5 | ) | (27.5 | ) | ||||||
| Gain on sale of investments |
13.1 | 1.8 | 2.4 | |||||||||
| Impairment of investments |
(1.4 | ) | (18.4 | ) | — | |||||||
| Loss before income taxes |
$ | (57.2 | ) | $ | (908.5 | ) | $ | (39.1 | ) | |||
135
Table of Contents
JDS UNIPHASE CORPORATION
NOTES TO CONSOLIDATED FINANCIAL STATEMENTS—(Continued)
The Company operates primarily in three geographic regions: Americas, Europe and Asia-Pacific. The following table presents net revenue and identifiable assets by geographic regions (in millions):
| Years Ended | ||||||
| July 3, 2010 |
June 27, 2009 | |||||
| Net revenue: |
||||||
| Americas |
$ | 662.0 | $ | 580.5 | ||
| Europe |
374.6 | 402.1 | ||||
| Asia-Pacific |
327.3 | 300.7 | ||||
| Total net revenue |
$ | 1,363.9 | $ | 1,283.3 | ||
Net revenue was assigned to geographic regions based on the customers’ shipment locations. Long-lived assets, namely net property, plant and equipment were identified based on the operations in the corresponding geographic areas.
| Years Ended | ||||||
| July 3, 2010 |
June 27, 2009 | |||||
| Property, plant and equipment, net |
||||||
| United States |
$ | 107.8 | $ | 112.7 | ||
| Other Americas |
10.9 | 10.4 | ||||
| China |
30.1 | 28.6 | ||||
| Other Asia-Pacific |
13.5 | 16.5 | ||||
| Germany |
14.8 | 17.6 | ||||
| Other Europe |
5.9 | 5.3 | ||||
| Total long-lived assets |
$ | 183.0 | $ | 191.1 | ||
During fiscal 2010, 2009, and 2008, no customer accounted for more than 10% of net revenue.
Note 20. Guarantees
In accordance with authoritative guidance which requires that upon issuance of a guarantee, the guarantor must recognize a liability for the fair value of the obligation it assumes under that guarantee. In addition, disclosures about the guarantees that an entity has issued, including a tabular reconciliation of the changes of the entity’s product warranty liabilities, are required.
Product Warranties
In general, the Company offers a three-month to one-year warranty for most of its products. For certain products and our customers, the Company provides a two to seven-year warranty. The Company provides reserves for the estimated costs of product warranties at the time revenue is recognized. The Company estimates the costs of its warranty obligations based on its historical experience of known product failure rates, use of materials to repair or replace defective products and service delivery costs incurred in correcting product failures. In addition, from time to time, specific warranty accruals may be made if unforeseen technical problems arise with specific products. The Company periodically assesses the adequacy of its recorded warranty liabilities and adjusts the amounts as necessary.
136
Table of Contents
JDS UNIPHASE CORPORATION
NOTES TO CONSOLIDATED FINANCIAL STATEMENTS—(Continued)
The following table presents the changes in the Company’s warranty reserve during 2010 and 2009 (in millions):
| 2010 | 2009 | |||||||
| Balance as of beginning of year |
$ | 7.3 | $ | 10.1 | ||||
| Provision for warranty |
7.7 | 5.6 | ||||||
| Utilization of reserve |
(2.3 | ) | (2.7 | ) | ||||
| Adjustments related to pre-existing warranties (including changes in estimates) |
(5.4 | ) | (5.7 | ) | ||||
| Balance as of end of year |
$ | 7.3 | $ | 7.3 | ||||
Other Guarantees
The Company from time to time enters into certain types of contracts that contingently require the Company to indemnify parties against third-party claims. These contracts primarily relate to: (i) divestiture agreements, under which the Company may provide customary indemnifications to purchasers of the Company’s businesses or assets; (ii) certain real estate leases, under which the Company may be required to indemnify property owners for environmental and other liabilities, and other claims arising from the Company’s use of the applicable premises; and (iii) certain agreements with the Company’s officers, directors and employees, under which the Company may be required to indemnify such persons for liabilities arising out of their employment relationship.
The terms of such obligations vary. Generally, a maximum obligation is not explicitly stated. Because the obligated amounts of these types of agreements often are not explicitly stated, the overall maximum amount of the obligations cannot be reasonably estimated. Historically, the Company has not been obligated to make significant payments for these obligations, and no liabilities have been recorded for these obligations on its balance sheet as of July 3, 2010 and June 27, 2009.
Note 21. Legal Proceedings
Pending Litigation
The ERISA Actions:
A consolidated action entitled In re JDS Uniphase Corporation ERISA Litigation, Case No. C-03-4743 WWS (MEJ), is pending in the District Court for the Northern District of California against the Company, certain of its former and current officers and directors, and certain other current and former JDSU employees on behalf of a purported class of participants in the 401(k) Plans of the Company and Optical Coating Laboratory, Inc. and the Plans themselves. On October 31, 2005, Plaintiffs filed an amended complaint. The amended complaint alleges that Defendants violated the Employee Retirement Income Security Act by breaching their fiduciary duties to the Plans and the Plans’ participants. The amended complaint alleges a purported class period from February 4, 2000, to the present and seeks an unspecified amount of damages, restitution, a constructive trust, and other equitable remedies. Certain individual Defendants’ motion to dismiss portions of the amended complaint was granted with prejudice on June 15, 2006.
Plaintiffs filed a second amended complaint on June 30, 2006. Defendants answered the complaint on July 6, 2006, and JDSU asserted counterclaims for breach of contract. The Court dismissed those counterclaims on September 11, 2006. On December 15, 2006, defendants moved for summary judgment on the ground that the named plaintiffs lacked standing. On the same day, plaintiffs moved for class certification. On April 24, 2007, the Court denied defendants’ motion for summary judgment as to plaintiff Douglas Pettit, deferred ruling on the motion for summary judgment as to plaintiff Eric Carey, and deferred ruling on plaintiffs’ motion for class
137
Table of Contents
JDS UNIPHASE CORPORATION
NOTES TO CONSOLIDATED FINANCIAL STATEMENTS—(Continued)
certification. Both sides have taken discovery. Following the verdict for defendants in In re JDS Uniphase Corporation Securities Litigation, a securities class action based on allegations similar to those in the ERISA action, the court in the ERISA action vacated all existing deadlines, set a schedule for briefing a summary judgment motion based on collateral estoppel issues, and stayed discovery pending resolution of that motion. By Order dated April 17, 2008, the Court modified the briefing schedule for JDSU’s summary judgment motion and ordered the parties to engage in mediation. Defendants moved for summary judgment on collateral estoppel issues on May 2, 2008. The parties participated in mediation on October 10, 2008, and reached an agreement in principle to resolve all claims. On March 3, 2009, the parties signed a Memorandum of Understanding reflecting the terms of their agreement. The parties continue to work on documents necessary to complete the settlement and have exchanged drafts. On September 15, 2009, the parties executed a settlement agreement resolving all claims, subject to the Court’s approval. In light of the settlement agreement, the Court denied JDSU’s summary judgment motion without prejudice. On October 15, 2009, plaintiffs moved for preliminary approval of the proposed settlement. On November 17, 2009, the Court granted that motion, preliminarily certified a settlement class, ordered plaintiffs to publish and mail notice of the proposed settlement to class members by February 21, 2010, ordered plaintiffs to move for final approval of the proposed settlement by April 15, 2010, and scheduled a fairness hearing on the proposed settlement for April 22, 2010. At the April 22, 2010 hearing, the Court approved the proposed settlement. The Court entered a written order granting final approval of the settlement agreement on May 4, 2010. The settlement agreement provides for payment of $3 million to the plaintiff class, which will be funded by the Company’s insurance carrier. The time to appeal the May 4, 2010 order has expired with no appeal having been filed.
The Company is also subject to a variety of other claims and suits that arise from time to time in the ordinary course of our business. While management currently believes that resolving claims against the Company, individually or in aggregate, will not have a material adverse impact on its financial position, results of operations or statement of cash flows, these matters are subject to inherent uncertainties and management’s view of these matters may change in the future. Were an unfavorable final outcome to occur, there exists the possibility of a material adverse impact on the Company’s financial position, results of operations or statement of cash flows for the period in which the effect becomes reasonably estimable.
Note 22. Discontinued Operations
On September 4, 2009, the Company sold certain non-core assets related to its wholly owned subsidiary da Vinci Systems LLC (“da Vinci”). Da Vinci represented a separate component of the Communications Test and Measurement segment and is considered as discontinued operations for financial reporting purposes. The sale generated total gross proceeds of $2.5 million and a gain of $0.2 million, which was recognized in the first fiscal quarter of 2010. The Company transferred net liabilities of $0.1 million, which comprised of $1.0 million in net property plant and equipment, $1.0 million in deferred revenue, and $0.1 million in warranty reserve. Net revenue for fiscal 2010, 2009, and 2008 were $0.8 million, $11.1 million, and $18.1 million, respectively. Net loss for fiscal 2010 was $(2.3) million, primarily due to inventory write-downs. Net loss for fiscal 2009 was ($3.3) million. Net income for fiscal 2008 was $1.2 million. Total loss from discontinued operations for fiscal 2010 and 2009 were ($2.1) million and ($3.3) million, respectively. Total gain from discontinued operations fiscal 2008 was $1.2 million. There is no tax effect associated with this transaction.
138
Table of Contents
JDS UNIPHASE CORPORATION
NOTES TO CONSOLIDATED FINANCIAL STATEMENTS—(Continued)
Note 23. Quarterly Financial Information (Unaudited)
The following table presents the Company’s quarterly consolidated statements of operations for fiscal 2010 and 2009 (in millions, except per share data):
| July 3, 2010 |
April 3, 2010 |
January 2, 2010 |
October 3, 2010 |
June
27, 2009(2)(6) |
March 28, 2009 (2)(3)(6) |
December 27, 2008(2)(3)(6) |
September 27, 2008(6) |
|||||||||||||||||||||||||
| Net revenue |
$ | 390.9 | $ | 332.3 | $ | 342.9 | $ | 297.8 | $ | 273.2 | $ | 279.1 | $ | 353.8 | $ | 377.2 | ||||||||||||||||
| Cost of sales |
217.5 | 188.1 | 192.2 | 168.4 | 160.4 | 164.7 | 201.7 | 216.1 | ||||||||||||||||||||||||
| Amortization of acquired technologies |
13.5 | 12.3 | 12.5 | 12.3 | 11.5 | 13.0 | 11.9 | 12.5 | ||||||||||||||||||||||||
| Impairment of acquired technologies |
— | — | — | — | — | — | 4.9 | — | ||||||||||||||||||||||||
| Gross profit |
159.9 | 131.9 | 138.2 | 117.1 | 101.3 | 101.4 | 135.3 | 148.6 | ||||||||||||||||||||||||
| Operating expenses: |
||||||||||||||||||||||||||||||||
| Research and development |
51.4 | 42.2 | 41.5 | 39.8 | 38.8 | 41.9 | 42.1 | 44.3 | ||||||||||||||||||||||||
| Selling, general and administrative |
103.7 | 92.3 | 94.7 | 92.2 | 92.1 | 92.6 | 103.7 | 110.6 | ||||||||||||||||||||||||
| Amortization of other intangibles |
8.0 | 6.3 | 6.5 | 7.0 | 6.3 | 6.7 | 6.9 | 7.1 | ||||||||||||||||||||||||
| Impairment of goodwill |
— | — | — | — | 4.8 | 45.0 | 691.9 | — | ||||||||||||||||||||||||
| (Gain) loss on disposal and impairment of long-lived assets (4) |
(3.5 | ) | 0.5 | 0.5 | 0.5 | 1.1 | 7.0 | 4.9 | 0.2 | |||||||||||||||||||||||
| Restructuring and related charges |
3.4 | 1.2 | 8.0 | 5.1 | 18.3 | 11.0 | 6.6 | 2.6 | ||||||||||||||||||||||||
| Total operating expenses |
163.0 | 142.5 | 151.2 | 144.6 | 161.4 | 204.2 | 856.1 | 164.8 | ||||||||||||||||||||||||
| Income (loss) from operations |
(3.1 | ) | (10.6 | ) | (13.0 | ) | (27.5 | ) | (60.1 | ) | (102.8 | ) | (720.8 | ) | (16.2 | ) | ||||||||||||||||
| Interest and other income (expense), net |
(0.2 | ) | 4.3 | 2.3 | 3.2 | 2.2 | 9.7 | 16.2 | 5.4 | |||||||||||||||||||||||
| Interest expense |
(6.2 | ) | (5.9 | ) | (6.3 | ) | (5.9 | ) | (5.7 | ) | (5.9 | ) | (7.0 | ) | (6.9 | ) | ||||||||||||||||
| Impairment of investments |
(0.2 | ) | (0.6 | ) | (0.6 | ) | — | — | (2.2 | ) | (13.0 | ) | (3.2 | ) | ||||||||||||||||||
| Gain (loss) on sale of investments (5) |
13.2 | (0.2 | ) | (0.1 | ) | 0.2 | (0.1 | ) | 0.3 | 0.6 | 1.0 | |||||||||||||||||||||
| Income (loss) before income taxes, net |
3.5 | (13.0 | ) | (17.7 | ) | (30.0 | ) | (63.7 | ) | (100.9 | ) | (724.0 | ) | (19.9 | ) | |||||||||||||||||
| Income tax expense (benefit) |
1.8 | (1.7 | ) | 1.7 | 0.7 | (1.0 | ) | (0.6 | ) | (1.7 | ) | 1.0 | ||||||||||||||||||||
| Loss from continuing operations net of tax |
1.7 | (11.3 | ) | (19.4 | ) | (30.7 | ) | (62.7 | ) | (100.3 | ) | (722.3 | ) | (20.9 | ) | |||||||||||||||||
| Loss from discontinued operations, net of tax |
(0.2 | ) | (0.6 | ) | (0.1 | ) | (1.2 | ) | (0.9 | ) | (1.4 | ) | (0.6 | ) | (0.4 | ) | ||||||||||||||||
| Net income (loss) |
$ | 1.5 | $ | (11.9 | ) | $ | (19.5 | ) | $ | (31.9 | ) | $ | (63.6 | ) | $ | (101.7 | ) | $ | (722.9 | ) | $ | (21.3 | ) | |||||||||
| Net income (loss) per share—basic (1) |
$ | 0.01 | $ | (0.05 | ) | $ | (0.09 | ) | $ | (0.15 | ) | $ | (0.29 | ) | $ | (0.47 | ) | $ | (3.36 | ) | $ | (0.10 | ) | |||||||||
| Net income (loss) per share—diluted (1) |
$ | 0.01 | $ | (0.05 | ) | $ | (0.09 | ) | $ | (0.15 | ) | $ | (0.29 | ) | $ | (0.47 | ) | $ | (3.36 | ) | $ | (0.10 | ) | |||||||||
| Shares used in per share calculation—basic |
220.4 | 219.4 | 218.3 | 217.5 | 216.1 | 215.6 | 215.1 | 215.4 | ||||||||||||||||||||||||
| Shares used in per share calculation—diluted |
227.6 | 219.4 | 218.3 | 217.5 | 216.1 | 215.6 | 215.1 | 215.4 | ||||||||||||||||||||||||
| (1) | Net income (loss) per share is computed independently for each of the quarters presented. Therefore, the sum of the quarterly net loss per share does not equal the annual net loss per share. |
139
Table of Contents
JDS UNIPHASE CORPORATION
NOTES TO CONSOLIDATED FINANCIAL STATEMENTS—(Continued)
| (2) | For the quarterly periods ended December 27, 2008, March 28, 2009, and June 27, 2009, the Company recorded a total of $741.7 million of goodwill impairment affecting all reporting units except Flex Product Group within the AOT segment, and also recorded impairment charges of $7.7 million for intangible assets related to da Vinci within the CommTest segment. |
| (3) | For the quarterly periods ended December 27, 2008 and March 28, 2009, interest and other income includes gains on repurchases of Convertible Notes of $9.5 million and $7.5 million, respectively. |
| (4) | For the quarterly period ended July 3, 2010, gain of long-lived asset includes gain on sale of leasehold improvement of $3.5 million relating to the sale of Shenzhen facilities in fiscal 2009, where the Company collected the cash from the Buyer in the current quarter as a result of the Buyer entering into a lease extension with the landlord. |
| (5) | For the quarterly period ended July 3, 2010, the Company sold 1,606,850 shares of Fabrinet’s common stocks at $10.00 per share in connection with the initial public offering of Fabrinet and realized a gain of $13.3 million. |
| (6) | Includes retrospective application for adoption of new accounting guidance for convertible debt securities that, upon conversion, may be settled by the issuer fully or partially in cash and the sale of da Vinci, which has been presented as discontinued operations for all periods presented. |
140
Table of Contents
| ITEM 9. | CHANGES IN AND DISAGREEMENTS WITH ACCOUNTANTS ON ACCOUNTING AND FINANCIAL DISCLOSURE |
None.
ITEM 9A. CONTROLS AND PROCEDURES
(a) EVALUATION OF DISCLOSURE CONTROLS AND PROCEDURES
Based on the evaluation of our disclosure controls and procedures (as defined in the Rules 13a-15(e) and 15d-15(e) under the Securities Exchange Act of 1934, or the Exchange Act) required by Exchange Act Rules 13a-15(b) or 15d-15(b), our chief executive officer and our chief financial officer have concluded that as of the end of the period covered by this report, our disclosure controls and procedures were effective.
(b) MANAGEMENT’S REPORT ON INTERNAL CONTROL OVER FINANCIAL REPORTING
Our management is responsible for establishing and maintaining adequate internal control over financial reporting. Our management, including our chief executive officer and chief financial officer, conducted an evaluation of the effectiveness of our internal control over financial reporting based on the framework in Internal Control—Integrated Framework issued by the Committee of Sponsoring Organizations of the Treadway Commission. Based on its evaluation under the framework in Internal Control—Integrated Framework, our management concluded that our internal control over financial reporting was effective as of July 3, 2010. The Company’s internal control over financial reporting as of July 3, 2010 has been audited by PricewaterhouseCoopers LLP, an independent registered public accounting firm, as stated in their report which appears in this Annual Report on Form 10-K under Item 8.
Our management’s evaluation excluded the Network Solutions Division (“NSD) of Agilent Technologies, Inc., from which we acquired certain assets on May 1, 2010. At May 1, 2010, NSD had total assets of $182.2 million. For the year ended July 3, 2010, our Consolidated Statement of Income included total revenue associated with NSD of $8.9 million. In accordance with guidance issued by the SEC, companies are allowed to exclude acquisitions from their assessment of internal controls over financial reporting during the first year subsequent to the acquisition while integrating the acquired operations.
(c) CHANGES IN INTERNAL CONTROL OVER FINANCIAL REPORTING
There were no changes in our internal control over financial reporting as defined in Exchange Act Rule 13a-15(f) that occurred during our most recently completed fiscal quarter that have materially affected, or are reasonably likely to materially affect, our internal control over financial reporting.
None.
141
Table of Contents
PART III
| ITEM 10. | DIRECTORS, EXECUTIVE OFFICERS AND CORPORATE GOVERNANCE |
Information regarding the Company’s executive officers and directors required by this Item is incorporated by reference to the section entitled “Proposal One—Elections of Directors” in the Company’s Definitive Proxy Statement in connection with the 2010 Annual Meeting of Stockholders (the “Proxy Statement”), which will be filed with the Securities and Exchange Commission within 120 days after the fiscal year ended July 3, 2010. Information required by Item 405 of Regulation S-K is incorporated by reference to the section entitled “Section 16(a) Beneficial Ownership Reporting Compliance” in the Proxy Statement.
The Company has adopted a code of ethics entitled “JDS Uniphase’s Code of Business Conduct,” which is applicable to all employees, officers and directors of the Company. The full text of the JDS Uniphase Corporate Code of Conduct is included under the Company’s Corporate Governance information available at the Company’s website at www.jdsu.com.
| ITEM 11. | EXECUTIVE COMPENSATION |
Information required by this Item is incorporated by reference to the sections entitled “Executive Compensation,” “Compensation Discussion and Analysis,” “Director Compensation,” and “Compensation Committee Report” in the Proxy Statement.
| ITEM 12. | SECURITY OWNERSHIP OF CERTAIN BENEFICIAL OWNERS AND MANAGEMENT AND RELATED STOCKHOLDER MATTERS |
Information regarding security ownership of certain beneficial owners and management is incorporated by reference to the section entitled “Security Ownership of Certain Beneficial Owners and Management” in the Proxy Statement.
Information regarding the Company’s stockholder approved and non-approved equity compensation plans is incorporated by reference to the section entitled “Equity Compensation Plans” in the Proxy Statement.
| ITEM 13. | CERTAIN RELATIONSHIPS AND RELATED TRANSACTIONS, AND DIRECTOR INDEPENDENCE |
Information required by this Item is incorporated by reference to the sections entitled “Certain Relationships and Related Transactions” and “Compensation Committee Interlocks and Insider Participation” under the “Corporate Governance” heading in the Proxy Statement.
| ITEM 14. | PRINCIPAL ACCOUNTING FEES AND SERVICES |
Information required by this item is incorporated by reference to the section entitled “Audit and Non-Audit Fees” in the Proxy Statement.
142
Table of Contents
PART IV
| ITEM 15. | EXHIBITS, FINANCIAL STATEMENT SCHEDULES |
| (a) | The following items are filed as part of this Annual Report on Form 10-K: |
| 1. | Financial Statements: |
| 2. | Financial Statement Schedules: |
All financial statement schedules have been omitted because the required information is not present in amounts sufficient to require submission of the schedule, not applicable, or because the required information is included in the Consolidated Financial Statements or Notes thereto.
| 3. | Exhibits: |
See Item 15(b)
| (b) | Exhibits: |
| Exhibit Number |
Exhibit Description | |
| 3.1(34) | Second Restated Certificate of Incorporation. | |
| 3.2(2) | Certificate of Designation of the Series A Preferred Stock. | |
| 3.3(3) | Certificate of Designation of the Series B Preferred Stock. | |
| 3.4(4) | Certificate of Designation of the Special Voting Stock. | |
| 3.5(23) | Amended and Restated Bylaws of JDS Uniphase Corporation. | |
| 4.1(5) | Exchangeable Share Provisions attaching to the Exchangeable Shares of JDS Uniphase Canada Ltd. (Formerly 3506967 Canada Inc.). | |
| 4.2(6) | Voting and Exchange Trust Agreement between JDS Uniphase, JDS Uniphase Canada Ltd. and CIBC Mellon Trust Company. | |
| 4.3(7) | Exchangeable Share Support Agreement between JDS Uniphase, JDS Uniphase Canada Ltd. and JDS Uniphase Nova Scotia Company. | |
| 4.4(8) | Registration Rights Agreement between JDS Uniphase, JDS Uniphase Canada Ltd. and The Furukawa Electric Co., Ltd. | |
| 4.5(9) | Fifth Amended and Restated Rights Agreement between JDS Uniphase and American Stock Transfer & Trust Company. | |
143
Table of Contents
| 4.6(17) | Amended and Restated Rights Agreement between JDS Uniphase Canada Ltd. and CIBC Mellon Trust Company (Amended and Restated as of February 6, 2003). | |
| 4.7(19) | Indenture dated October 31, 2003. | |
| 4.8(24) | Registration Rights Agreement between JDS Uniphase, Morgan Stanley & Co., Inc, Goldman Sachs & Co. and CIBC World Markets Corp. | |
| 4.9(25) | Indenture dated May 17, 2006. | |
| 4.10(26) | Registration Rights Agreement between JDS Uniphase, J. P. Morgan Securities Inc. and Merrill Lynch, Pierce, Fenner & Smith Incorporated. | |
| 10.1(10) | Support Agreement between Uniphase Corporation, 3506967 Canada Inc., The Furukawa Electric Company, Ltd., and JDS FITEL Inc. | |
| 10.2(11) | Amended and Restated 1993 Flexible Stock Incentive Plan (Amended and Restated as of November 9, 2001). | |
| 10.3(12) | Amended and Restated 1998 Employee Stock Purchase Plan (Amended and Restated as of June 22, 2009). | |
| 10.4(13) | Amended and Restated 1999 Canadian Employee Stock Purchase Plan (Amended and Restated as of July 31, 2002). | |
| 10.5(14) | 2005 Acquisition Equity Incentive Plan. | |
| 10.6(20) | 2005 Acquisition Equity Incentive Plan Form of Stock Option Award Agreement. | |
| 10.7(21) | 2005 Acquisition Equity Incentive Plan Form of Restricted Stock Unit Award Agreement. | |
| 10.8(15) | 2008 Change of Control Benefit Plan. | |
| 10.9(16) | Indemnification Agreement for Kevin J. Kennedy. | |
| 10.10(18) | Amended and Restated 2003 Equity Incentive Plan. | |
| 10.11(27) | Indemnification Agreement for Richard E. Belluzzo. | |
| 10.12(28) | Promotion Letter for Alan Lowe. | |
| 10.13(29) | Indemnification Agreement for Harold L. Covert. | |
| 10.14(30) | Indemnification Agreement for Masood Jabbar. | |
| 10.15(22) | Indemnification Agreement for Penelope A. Herscher. | |
| 10.16(31) | Employment Agreement for Thomas Waechter. | |
| 10.17(33) | Form of Deferred Stock Unit Award Agreement. | |
| 10.18(32) | Transition Agreement for Kevin J. Kennedy. | |
| 10.19(35) | Consulting Agreement for Kevin J. Kennedy. | |
| 10.20(1) | 2003 Equity Incentive Plan Form of Stock Option Award Agreement (for the U.S.). | |
| 10.21(1) | 2003 Equity Incentive Plan Form of Stock Option Award Agreement (for China). | |
| 10.22(1) | 2003 Equity Incentive Plan Form of Stock Option Award Agreement (for France). | |
| 10.23(1) | 2003 Equity Incentive Plan Form of Stock Option Award Agreement (for the Rest of World). | |
| 10.24(1) | 2003 Equity Incentive Plan Form of Restricted Stock Unit Award Agreement (for the U.S.). | |
144
Table of Contents
| 10.25(1) | 2003 Equity Incentive Plan Form of Restricted Stock Unit Award Agreement (for China). | |
| 10.26(1) | 2003 Equity Incentive Plan Form of Restricted Stock Unit Award Agreement (for France). | |
| 10.27(1) | 2003 Equity Incentive Plan Form of Restricted Stock Unit Award Agreement (for the Rest of World). | |
| 21.1(1) | Subsidiaries of JDS Uniphase Corporation. | |
| 23.1(1) | Consent of Independent Registered Public Accounting Firm (PricewaterhouseCoopers LLP). | |
| 31.1(1) | Certification of the Chief Executive Officer pursuant to Section 302 of the Sarbanes-Oxley Act of 2002. | |
| 31.2(1) | Certification of the Chief Financial Officer pursuant to Section 302 of the Sarbanes-Oxley Act of 2002. | |
| 32.1(1) | Certification of the Chief Executive Officer pursuant to Section 906 of the Sarbanes-Oxley Act of 2002. | |
| 32.2(1) | Certification of the Chief Financial Officer pursuant to Section 906 of the Sarbanes-Oxley Act of 2002. | |
| (1) | Filed herewith. |
| (2) | Incorporated by reference to Exhibit 10.3 of the Company’s Current Report on Form 8-K filed June 24, 1998. |
| (3) | Incorporated by reference to Exhibit 3(i)(d) of the Company’s Annual Report on Form 10-K filed September 28, 1998. |
| (4) | Incorporated by reference to Exhibit 4.1 of the Company’s Registration Statement on Form S-3 filed July 14, 1999. |
| (5) | Incorporated by reference to the Company’s definitive Proxy Statement on Schedule 14A filed June 2, 1999. |
| (6) | Incorporated by reference to Exhibit 4.2 of the Company’s Annual Report on Form 10-K filed September 1, 1999. |
| (7) | Incorporated by reference to Exhibit 4.3 of the Company’s Annual Report on Form 10-K filed September 1, 1999. |
| (8) | Incorporated by reference to Exhibit 4.5 of the Company’s Annual Report on Form 10-K filed September 1, 1999. |
| (9) | Incorporated by reference to Exhibit 1 of the Company’s Registration Statement on Form 8-A12G/A filed February 18, 2003. |
| (10) | Incorporated by reference to Exhibit 10.23 of the Company’s Annual Report on Form 10-K filed September 1, 1999. |
| (11) | Incorporated by reference to Exhibit 10.1 of the Company’s Quarterly Report on Form 10-Q filed February 11, 2002. |
| (12) | Incorporated by reference to Appendix A of the Company’s Definitive Proxy Statement on Schedule 14A filed September 28, 2007. |
| (13) | Incorporated by reference to Exhibit 10.4 of the Company’s Annual Report on Form 10-K filed September 17, 2002. |
| (14) | Incorporated by reference to Exhibit 99.1 of the Company’s Current Report on Form 8-K filed August 23, 2005. |
145
Table of Contents
| (15) | Incorporated by reference to Exhibit 10.19 of the Company’s Current report on Form 8-K filed September 3, 2008. |
| (16) | Incorporated by reference to Exhibit 10.11 of the Company’s Annual Report on Form 10-K filed September 24, 2003. |
| (17) | Incorporated by reference to Exhibit 10.7 of the Company’s Annual Report on Form 10-K filed September 24, 2003. |
| (18) | Incorporated by reference to the Company’s definitive Proxy Statement on Schedule 14A filed September 26, 2008. |
| (19) | Incorporated by reference to Exhibit 4.7 of the Company’s Registration Statement on Form S-3 filed November 14, 2003. |
| (20) | Incorporated by reference to Exhibit 10.6 of the Company’s Annual Report on Form 10-K filed September 30, 2005. |
| (21) | Incorporated by reference to Exhibit 10.7 of the Company’s Annual Report on Form 10-K filed September 30, 2005. |
| (22) | Incorporated by reference to Exhibit 10.19 of the Company’s Current Report on Form 8-K filed July 21, 2008. |
| (23) | Incorporated by reference to Exhibit 3.5 of the Company’s Current Report on Form 8-K filed November 13, 2009. |
| (24) | Incorporated by reference to Exhibit 4.8 of the Company’s Registration Statement on Form S-3 filed November 14, 2003. |
| (25) | Incorporated by reference to Exhibit 4.9 of the Company’s Current Report on Form 8-K filed May 19, 2006. |
| (26) | Incorporated by reference to Exhibit 4.1 of the Company’s Current Report on Form 8-K filed May 19, 2006. |
| (27) | Incorporated by reference to Exhibit 99.1 of the Company’s Current Report on Form 8-K filed March 2, 2005. |
| (28) | Incorporated by reference to Exhibit 10.22 of the Company’s Quarterly Report on Form 10-Q filed November 10, 2009. |
| (29) | Incorporated by reference to Exhibit 10.18 of the Company’s Current Report on Form 8-K filed January 20, 2006. |
| (30) | Incorporated by reference to Exhibit 10.19 of the Company’s Current Report on Form 8-K filed March 2, 2006. |
| (31) | Incorporated by reference to Exhibit 10.25 of the Company’s Current Report on Form 8-K filed December 18, 2008. |
| (32) | Incorporated by reference to Exhibit 10.23 of the Company’s Current Report on Form 8-K filed December 11, 2008. |
| (33) | Incorporated by reference to Exhibit 10.18 of the Company’s Current Report on Form 8-K filed October 9, 2007. |
| (34) | Incorporated by reference to Exhibit 3.1 of the Company’s Annual Report on Form 10-K/A filed August 28, 2008. |
| (35) | Incorporated by reference to Exhibit 10.24 of the Company’s Current Report on Form 8-K filed December 11, 2008. |
| (c) | See Item 15(a) 2. |
146
Table of Contents
Pursuant to the requirements of Section 13 or 15(d) of the Securities Exchange Act of 1934, the Registrant has duly caused this report on Form 10-K to be signed on its behalf by the undersigned, thereunto duly authorized.
| Date: August 31, 2010 |
JDS UNIPHASE CORPORATION | |||||
| By: | /s/ DAVID VELLEQUETTE | |||||
| David Vellequette Executive Vice President and Chief Financial Officer (Principal Financial and Accounting Officer) | ||||||
Pursuant to the requirements of the Securities Exchange Act of 1934, this Annual Report on Form 10-K has been signed below by the following persons on behalf of the Registrant and in the capacities and on the dates indicated.
| Signature |
Title |
Date | ||
| /s/ THOMAS WAECHTER Thomas Waechter |
Chief Executive Officer (Principal Executive Officer) | August 31, 2010 | ||
| /s/ DAVID VELLEQUETTE David Vellequette |
Executive Vice President and Chief Financial Officer (Principal Financial and Accounting Officer) | August 31, 2010 | ||
| /s/ RICHARD BELLUZZO Richard Belluzzo |
Director | August 31, 2010 | ||
| /s/ HAROLD L. COVERT Harold L. Covert |
Director | August 31, 2010 | ||
| /s/ BRUCE D. DAY Bruce D. Day |
Director | August 31, 2010 | ||
| /s/ PENELOPE HERSCHER Penny Herscher |
Director | August 31, 2010 | ||
| /s/ MASOOD JABBAR Masood Jabbar |
Director | August 31, 2010 | ||
| /s/ MARTIN A. KAPLAN Martin A. Kaplan |
Chairman | August 31, 2010 | ||
| /s/ RICHARD T. LIEBHABER Richard T. Liebhaber |
Director | August 31, 2010 | ||
| /s/ CASIMIR S. SKRZYPCZAK Casimir S. Skrzypczak |
Director | August 31, 2010 | ||
| /s/ KEVIN KENNEDY Kevin Kennedy |
Director | August 31, 2010 | ||
147