Attached files
| file | filename |
|---|---|
| EX-99.1 - EX-99.1 - AVNET INC | avt-20151029ex99105e4cf.htm |
| 8-K - 8-K - AVNET INC | avt-20151029x8k.htm |
Avnet, Inc. Q1 Fiscal Year 2016
$ in millions - except per share data
October 29, 2015
CFO Review of Fiscal 2016 First Quarter Results
|
|
|
Q1' FY15 |
Q4' FY15 |
Q1' FY16 |
Y/Y Chg |
Seq. Chg |
||||||||||
|
Sales |
|
$ |
6,839.6 |
|
$ |
6,796.3 |
|
$ |
6,969.7 |
|
$ |
130.1 |
|
$ |
173.4 |
|
|
Gross Profit |
|
$ |
795.5 |
|
$ |
785.8 |
|
$ |
791.5 |
|
$ |
(4.0) |
|
$ |
5.7 |
|
|
GP Margin |
|
|
11.6 |
% |
|
11.6 |
% |
|
11.4 |
% |
|
(27) |
bps |
|
(20) |
bps |
|
|
|
|
|
|
|
|
|
|
|
|
|
|
|
|
|
|
|
GAAP SG&A Expenses |
|
$ |
583.9 |
|
$ |
561.6 |
|
$ |
558.6 |
|
$ |
(25.4) |
|
$ |
(3.0) |
|
|
Adjusted Operating Expenses (1) |
|
$ |
571.7 |
|
$ |
542.0 |
|
$ |
551.1 |
|
$ |
(20.7) |
|
$ |
9.1 |
|
|
Adjusted Operating Expenses as % of Sales (1) |
|
|
8.4 |
% |
|
8.0 |
% |
|
7.9 |
% |
|
(45) |
bps |
|
(6) |
bps |
|
Adjusted Operating Expenses as % of Gross Profit (1) |
|
|
71.9 |
% |
|
69.0 |
% |
|
69.6 |
% |
|
(225) |
bps |
|
65 |
bps |
|
|
|
|
|
|
|
|
|
|
|
|
|
|
|
|
|
|
|
GAAP Operating Income |
|
$ |
193.2 |
|
$ |
180.5 |
|
$ |
207.0 |
|
$ |
13.8 |
|
$ |
26.5 |
|
|
Adjusted Operating Income (1) |
|
$ |
223.7 |
|
$ |
243.8 |
|
$ |
240.4 |
|
$ |
16.7 |
|
$ |
(3.4) |
|
|
Adjusted Operating Income Margin (1) |
|
|
3.3 |
% |
|
3.6 |
% |
|
3.5 |
% |
|
18 |
bps |
|
(14) |
bps |
|
|
|
|
|
|
|
|
|
|
|
|
|
|
|
|
|
|
|
GAAP Net Income |
|
$ |
127.9 |
|
$ |
158.7 |
|
$ |
130.3 |
|
$ |
2.3 |
|
$ |
(28.5) |
|
|
Adjusted Net Income (1) |
|
$ |
144.2 |
|
$ |
159.5 |
|
$ |
152.9 |
|
$ |
8.8 |
|
$ |
(6.6) |
|
|
|
|
|
|
|
|
|
|
|
|
|
|
|
|
|
|
|
|
GAAP Diluted EPS |
|
$ |
0.91 |
|
$ |
1.15 |
|
$ |
0.96 |
|
|
5.5 |
% |
|
(16.5) |
% |
|
Adjusted Diluted EPS (1) |
|
$ |
1.02 |
|
$ |
1.16 |
|
$ |
1.12 |
|
|
9.8 |
% |
|
(3.4) |
% |
|
|
|
|
|
|
|
|
|
|
|
|
|
|
|
|
|
|
|
Return on Working Capital (ROWC) (1) |
|
|
19.9 |
% |
|
22.5 |
% |
|
20.9 |
% |
|
100 |
bps |
|
(156) |
bps |
|
Return on Capital Employed (ROCE) (1) |
|
|
10.6 |
% |
|
12.0 |
% |
|
11.2 |
% |
|
56 |
bps |
|
(79) |
bps |
|
Working Capital Velocity (1) |
|
|
6.1 |
|
|
6.3 |
|
|
6.1 |
|
|
(0.0) |
|
|
(0.2) |
|
|
(1) |
A reconciliation of non-GAAP financial measures is presented in the Non-GAAP Financial Information section of the press release attached as Exhibit 99.1 included in this Current Report on Form 8-K. |
Key Highlights
|
· |
As highlighted on the August earnings call, the Company’s fiscal 2016 is a 53-week year and the additional week impacts the first quarter of fiscal 2016. When discussing organic sales performance year over year and sequentially, the first quarter of fiscal 2016 reported sales have been reduced to adjust for the estimated impact of the extra week. |
|
· |
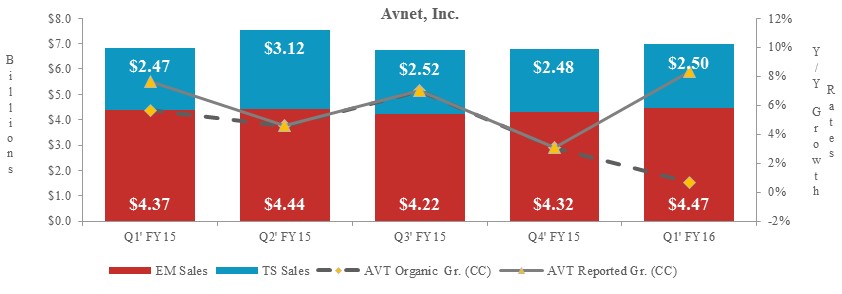
Sales for the first quarter of fiscal 2016, increased 1.9% year over year or $130 million to $7.0 billion. Excluding the translation impact of changes in foreign currency exchange rates (also referred to as “constant currency” and referenced to as “CC” in the graphs that follow) reported sales grew 8.4% year over year driven by high single digit growth at both operating groups. Organic sales increased 0.7% year over year in constant currency. |
|
o |
Sequentially, reported sales increased 2.8% in constant currency (2.6% in reported dollars), driven by growth at both operating groups. Organic sales declined 5.0% in constant currency, which is at the low end of the normal seasonal range of -5% to -1% primarily due to below seasonal growth at EM. |
|
· |
Adjusted operating income increased 7.5% year over year to $240.4 million and adjusted operating income margin increased 18 basis points to 3.5% due to significant improvement in the EMEA region at both operating groups. |
|
o |
Sequentially, adjusted operating income declined 1.4% and adjusted operating income margin decreased 14 basis points primarily due to a decline at TS. |
|
· |
Adjusted diluted earnings per share of $1.12 increased 9.8% year over year, primarily due to the growth in operating income at both operating groups and was negatively impacted by approximately $0.09, or 8.0%, due to the translation impact of changes in foreign currency exchange rates. |
|
· |
Cash used for operations was $33.7 million in the first of quarter fiscal 2016 and cash generated from operations for the trailing twelve months was $590.8 million. Working capital decreased $96.0 million, or 2.2%, year over year in reported dollars and increased 3.7% in constant currency as an increase at EM to support sales growth was partially offset by a decrease at TS. |
|
· |
Avnet’s ROWC increased 100 basis points year over year and ROCE was up 56 basis points primarily due to improvements in the EMEA region. |
|
· |
During the first quarter of fiscal 2016, the Company increased its dividend by 6.3% and the Board of Directors increased the current share repurchase authorization program by $250 million to an aggregate $1.25 billion. |
|
o |
The Company paid a cash dividend of $0.17 per share, or $22.6 million in total. |
|
o |
The Company repurchased $145.1 million worth of stock, or 3.5 million shares at an average price of $41.17. As of the end of the quarter, the Company had $407.4 million remaining in the authorized share repurchase program. |
Avnet, Inc. Q1 Fiscal Year 2016
$ in millions - except per share data
October 29, 2015
|
|
|
|
|
|
|
|
|
|
|
|
|
|
|
|
|
|
Year-over- |
|
|
|
|
|
|
|
|
|
|
|
|
|
|
|
|
|
|
|
Year Growth |
|
|
|
|
|
|
|
|
|
|
|
|
|
|
|
|
|
|
|
Rates |
|
|
|
|
Q1' FY15 |
Q2' FY15 |
Q3' FY15 |
Q4' FY15 |
Q1' FY16 |
Reported |
|||||||||||
|
Avnet, Inc. (1) |
|
$ |
6,839.6 |
|
$ |
7,551.9 |
|
$ |
6,736.9 |
|
$ |
6,796.3 |
|
$ |
6,969.7 |
|
1.9 |
% |
|
Constant Currency (2) |
|
|
|
|
|
|
|
|
|
|
|
|
|
|
|
|
8.4 |
% |
|
|
|
|
|
|
|
|
|
|
|
|
|
|
|
|
|
|
|
|
|
Electronics Marketing (EM) (1) |
|
$ |
4,374.1 |
|
$ |
4,435.2 |
|
$ |
4,219.5 |
|
$ |
4,315.9 |
|
$ |
4,471.4 |
|
2.2 |
% |
|
Constant Currency (2) |
|
|
|
|
|
|
|
|
|
|
|
|
|
|
|
|
8.7 |
% |
|
Americas |
|
$ |
1,214.0 |
|
$ |
1,200.9 |
|
$ |
1,237.2 |
|
$ |
1,269.9 |
|
$ |
1,265.2 |
|
4.2 |
% |
|
EMEA |
|
$ |
1,302.5 |
|
$ |
1,205.3 |
|
$ |
1,251.9 |
|
$ |
1,245.0 |
|
$ |
1,326.4 |
|
1.8 |
% |
|
Constant Currency (2) |
|
|
|
|
|
|
|
|
|
|
|
|
|
|
|
|
20.8 |
% |
|
Asia |
|
$ |
1,857.6 |
|
$ |
2,029.0 |
|
$ |
1,730.4 |
|
$ |
1,801.0 |
|
$ |
1,879.8 |
|
1.2 |
% |
|
|
|
|
|
|
|
|
|
|
|
|
|
|
|
|
|
|
|
|
|
Technology Solutions (TS) (1) |
|
$ |
2,465.5 |
|
$ |
3,116.7 |
|
$ |
2,517.3 |
|
$ |
2,480.5 |
|
$ |
2,498.3 |
|
1.3 |
% |
|
Constant Currency (2) |
|
|
|
|
|
|
|
|
|
|
|
|
|
|
|
|
7.8 |
% |
|
Americas |
|
$ |
1,433.1 |
|
$ |
1,851.0 |
|
$ |
1,440.5 |
|
$ |
1,497.3 |
|
$ |
1,508.7 |
|
5.3 |
% |
|
EMEA |
|
$ |
672.9 |
|
$ |
856.8 |
|
$ |
717.2 |
|
$ |
624.8 |
|
$ |
688.8 |
|
2.4 |
% |
|
Constant Currency (2) |
|
|
|
|
|
|
|
|
|
|
|
|
|
|
|
|
16.1 |
% |
|
Asia |
|
$ |
359.5 |
|
$ |
408.9 |
|
$ |
359.6 |
|
$ |
358.4 |
|
$ |
300.8 |
|
(16.3) |
% |
|
(1) |
Excluding the estimate for the extra week, Avnet year-over-year sales would have increased 0.7% in CC and would have declined 5.8% in reported dollars; EM year-over-year sales would have increased 1.8% in CC and would have declined 4.6% in reported dollars; and TS year-over-year sales would have declined 1.4% in CC and 7.8% in reported dollars. |
|
(2) |
Year-over-year sales growth rate excluding the impact of changes in foreign currency exchange rates. |
|
· |
Avnet’s first quarter fiscal 2016 reported sales increased 8.4% in constant currency (1.9% in reported dollars) year over year to $6.97 billion with both operating groups contributing towards this growth. Organic sales, excluding the $525 million estimated impact of the extra week, increased 0.7% in constant currency and declined 5.8% in reported dollars. |
|
o |
Year over year, the change in foreign currency exchange rates negatively impacted Avnet sales by $441 million or approximately 6.5%, with a majority of this impact in the EMEA region. |
|
o |
On a sequential basis, Avnet organic sales decreased 5.0% in constant currency (5.2% on a reported basis), which was at the low end of the normal seasonal range of -5% to -1% primarily due to below seasonal growth at EM. |
Avnet, Inc. Q1 Fiscal Year 2016
$ in millions - except per share data
October 29, 2015
|
· |
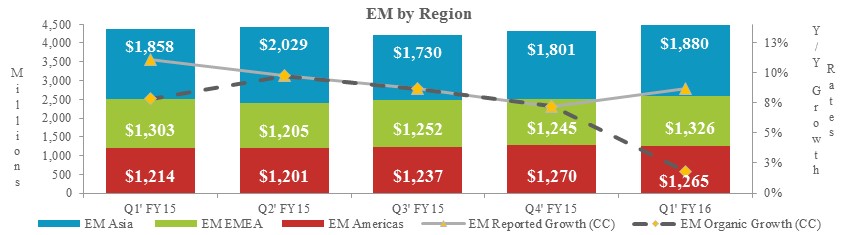
EM's first quarter fiscal 2016 reported sales of $4.5 billion increased 8.7% year over year in constant currency (2.2% in reported dollars) and organic sales, which exclude the $300 million estimated impact of the extra week, grew 1.8% in constant currency (declined 4.6% in reported dollars) as strength in the EMEA region in constant currency was partially offset by weakness in the Asia and Americas regions. |
|
o |
Americas' reported sales increased 4.2% year over year. |
|
o |
EMEA sales increased 20.8% year over year in constant currency and reported sales increased 1.8%. |
|
o |
Asia’s reported sales increased 1.2% year over year, a decline from double digit growth in fiscal 2015 as growth in high volume supply chain engagements slowed. |
|
· |
EM's organic sales decreased 3.4% sequentially in constant currency, which was below the normal seasonal range of -2% to +2% primarily due to a decline in high volume supply chain engagements in the Asia region. |
|
· |
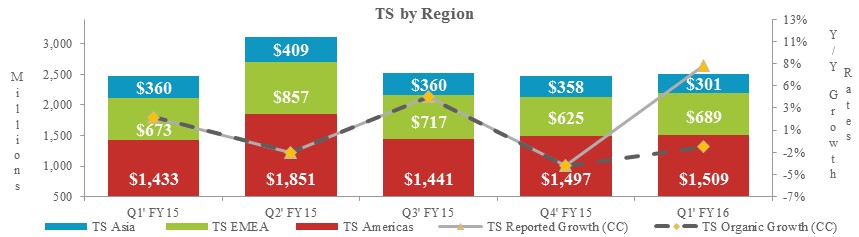
TS' first quarter fiscal 2016 reported sales of $2.5 billion increased 7.8% year over year in constant currency (1.3% in reported dollars) as strength in the EMEA and Americas regions was partially offset by weakness in the Asia region. Organic sales, which exclude the $225 million estimated impact of the extra week, declined 1.4% in constant currency (7.8% in reported dollars). |
|
o |
America’s reported sales increased 5.3% year over year. |
|
o |
EMEA sales increased 16.1% year over year in constant currency and reported sales increased 2.4%. |
|
o |
Asia’s reported sales declined 16.3% year over year primarily due to a decline in the computing components business and the strengthening of the U.S. Dollar against local currencies. |
|
· |
TS' organic sales decreased 7.7% sequentially in constant currency, which was within the normal seasonal range of -10% to -5%. |
|
· |
At a product level, year-over-year growth in networking and security, software, and services was offset by a decline in computing components. |
Avnet, Inc. Q1 Fiscal Year 2016
$ in millions - except per share data
October 29, 2015
Gross Profit
|
|
|
|
|
|
|
|
|
|
|
|
|
|
|
|
|
|
|
|
|
|
|
|
Q1' FY15 |
Q2' FY15 |
Q3' FY15 |
Q4' FY15 |
Q1' FY16 |
Y/Y Change |
||||||||||||
|
Gross Profit |
|
$ |
795.5 |
|
$ |
837.5 |
|
$ |
774.4 |
|
$ |
785.8 |
|
$ |
791.5 |
|
$ |
(4.0) |
|
|
Gross Profit Margin |
|
|
11.6 |
% |
|
11.1 |
% |
|
11.5 |
% |
|
11.6 |
% |
|
11.4 |
% |
|
(27) |
bps |
|
· |
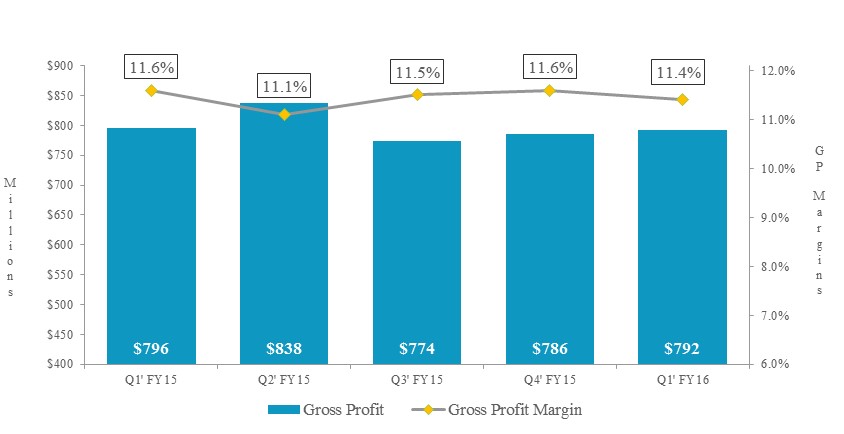
Gross profit of $791.5 million, was essentially flat with the year ago quarter and sequentially. |
|
o |
Gross profit margin declined 27 basis points from the year ago quarter primarily due to a decline at EM in part due to a higher mix of high volume supply chain engagements at EM Asia. |
|
o |
Gross profit margin decreased 20 basis points sequentially primarily due to a decline in the EMEA region at both operating groups, which were coming off the seasonally stronger June quarter. |
|
· |
EM gross profit margin declined year-over-year and sequentially. |
|
o |
The year-over-year decline was primarily due to a decline in the EMEA and Asia regions. |
|
o |
The sequential decrease was primarily due to a seasonal decline in EMEA coming off their strong June quarter. |
|
· |
TS gross profit margin decreased year over year and sequentially primarily due to declines in the western regions, which was partially offset by improvements in the Asia region. |
Avnet, Inc. Q1 Fiscal Year 2016
$ in millions - except per share data
October 29, 2015
Operating Expenses
|
|
|
|
|
|
|
|
|
|
|
|
|
|
|
|
|
|
|
|
|
|
|
|
Q1' FY15 |
Q2' FY15 |
Q3' FY15 |
Q4' FY15 |
Q1' FY16 |
Y/Y Change |
||||||||||||
|
Selling, General and Administrative Expenses |
|
$ |
583.9 |
|
$ |
574.0 |
|
$ |
555.1 |
|
$ |
561.6 |
|
$ |
558.6 |
|
$ |
(25.4) |
|
|
Amortization of Intangible Assets and Other |
|
|
(12.2) |
|
|
(11.1) |
|
|
(11.2) |
|
|
(19.6) |
|
|
(7.5) |
|
|
4.7 |
|
|
Adjusted Operating Expenses |
|
$ |
571.7 |
|
$ |
562.9 |
|
$ |
543.9 |
|
$ |
542.0 |
|
$ |
551.1 |
|
$ |
(20.7) |
|
|
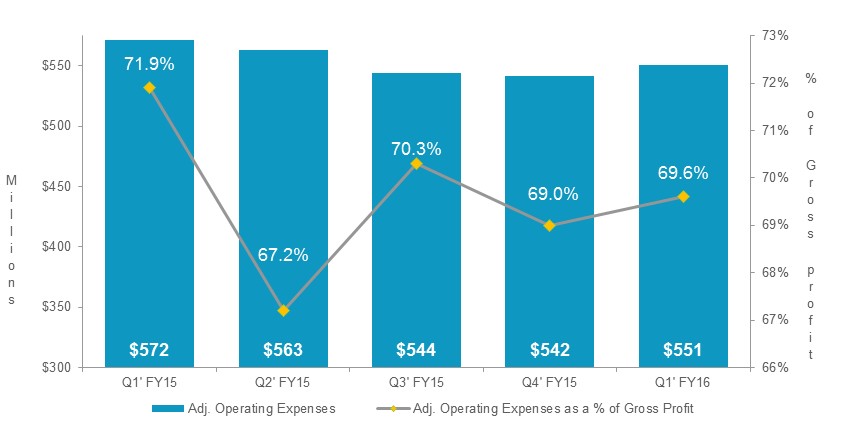
Adjusted Operating Expenses as a % of Gross Profit |
|
|
71.9 |
% |
|
67.2 |
% |
|
70.3 |
% |
|
69.0 |
% |
|
69.6 |
% |
|
(225) |
bps |
|
· |
Adjusted operating expenses were $551.1 million in the first quarter of fiscal 2016, a decrease of $20.7 million, or 3.6%, from the first quarter of fiscal 2015. |
|
o |
The year-over-year decrease in adjusted operating expenses was primarily due to the translation impact of changes in foreign currency exchange rates, and expense efficiencies, including from the Avnet Advantage program, partially offset by the impact of the extra week. |
|
o |
Sequentially, adjusted operating expenses increased $9.1 million, or 1.7%, primarily due to the increase in expenses related to the extra week partially offset by cost savings related to prior restructuring actions. |
|
· |
Adjusted operating expenses as a percentage of gross profit decreased 225 basis points to 69.6% from the year ago quarter. |
|
o |
EM operating expenses as a percentage of gross profit decreased 212 basis points from the year ago quarter primarily due to the operating leverage related to sales growth and operational expense efficiencies. |
|
o |
TS operating expenses as a percentage of gross profit decreased 510 basis points from the year ago quarter primarily due to the operating leverage related to sales growth and operational expense efficiencies. |
Avnet, Inc. Q1 Fiscal Year 2016
$ in millions - except per share data
October 29, 2015
Operating Income
|
|
|
|
|
|
|
|
|
|
|
|
|
|
|
|
|
|
|
|
|
|
|
|
Q1' FY15 |
Q2' FY15 |
Q3' FY15 |
Q4' FY15 |
Q1' FY16 |
Y/Y Change |
||||||||||||
|
GAAP Operating Income |
|
$ |
193.2 |
|
$ |
250.3 |
|
$ |
203.7 |
|
$ |
180.5 |
|
$ |
207.0 |
|
$ |
13.8 |
|
|
Adjusted Operating Income (1) |
|
$ |
223.7 |
|
$ |
274.6 |
|
$ |
230.4 |
|
$ |
243.8 |
|
$ |
240.4 |
|
$ |
16.7 |
|
|
Adjusted Operating Income Margin (1) |
|
|
3.3 |
% |
|
3.6 |
% |
|
3.4 |
% |
|
3.6 |
% |
|
3.5 |
% |
|
18 |
bps |
|
|
|
|
|
|
|
|
|
|
|
|
|
|
|
|
|
|
|
|
|
|
Electronics Marketing (EM) Total |
|
|
|
|
|
|
|
|
|
|
|
|
|
|
|
|
|
|
|
|
Operating Income |
|
$ |
202.7 |
|
$ |
191.4 |
|
$ |
197.3 |
|
$ |
205.9 |
|
$ |
213.0 |
|
$ |
10.3 |
|
|
Operating Income Margin |
|
|
4.6 |
% |
|
4.3 |
% |
|
4.7 |
% |
|
4.8 |
% |
|
4.8 |
% |
|
13 |
bps |
|
|
|
|
|
|
|
|
|
|
|
|
|
|
|
|
|
|
|
|
|
|
Technology Solutions (TS) Total |
|
|
|
|
|
|
|
|
|
|
|
|
|
|
|
|
|
|
|
|
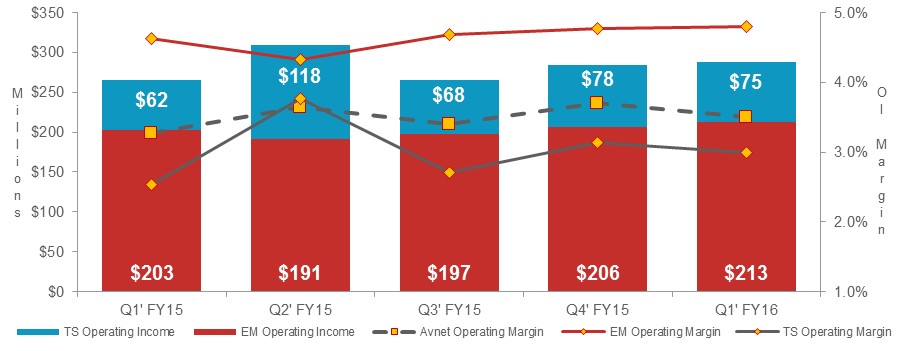
Operating Income |
|
$ |
62.4 |
|
$ |
117.6 |
|
$ |
68.1 |
|
$ |
77.6 |
|
$ |
74.5 |
|
$ |
12.1 |
|
|
Operating Income Margin |
|
|
2.5 |
% |
|
3.8 |
% |
|
2.7 |
% |
|
3.1 |
% |
|
3.0 |
% |
|
45 |
bps |
|
(1) |
A reconciliation of non-GAAP financial measures is presented in the Non-GAAP Financial Information section of the press release attached as Exhibit 99.1 included in this Current Report on Form 8-K. |
|
· |
Avnet’s adjusted operating income of $240.4 million increased 7.5% year over year primarily due to improved profitability at both operating groups related to sales growth and disciplined expense management. Adjusted operating income decreased $3.4 million, or 1.4% sequentially primarily due to an increase in corporate expense related to the accounting for stock based compensation. |
|
o |
Avnet adjusted operating income margin of 3.5% increased 18 basis points year over year and declined 14 basis points sequentially. |
|
· |
EM operating income margin of 4.8% increased 13 basis points from the year ago quarter primarily due to the improved profitability in the EMEA region. Sequentially, operating income margin was essentially flat with the June quarter. |
Avnet, Inc. Q1 Fiscal Year 2016
$ in millions - except per share data
October 29, 2015
Interest Expense, Other Income (Expense) and Income Taxes
|
|
|
|
|
|
|
|
|
|
|
|
|
|
|
|
|
|
|
|
|
|
|
|
Q1' FY15 |
Q2' FY15 |
Q3' FY15 |
Q4' FY15 |
Q1' FY16 |
Y/Y Change |
||||||||||||
|
Interest Expense |
|
$ |
23.4 |
|
$ |
24.7 |
|
$ |
23.9 |
|
$ |
23.7 |
|
$ |
23.6 |
|
$ |
(0.2) |
|
|
Other Income (Expense) |
|
$ |
(1.5) |
|
$ |
(5.5) |
|
$ |
(8.9) |
|
$ |
(3.1) |
|
$ |
(5.9) |
|
$ |
4.4 |
|
|
|
|
|
|
|
|
|
|
|
|
|
|
|
|
|
|
|
|
|
|
|
GAAP Income Tax Expense (Benefit) |
|
$ |
40.4 |
|
$ |
56.4 |
|
$ |
49.4 |
|
$ |
(5.1) |
|
$ |
47.3 |
|
$ |
6.9 |
|
|
Adjusted Income Tax Expense (1) |
|
$ |
54.7 |
|
$ |
68.4 |
|
$ |
54.1 |
|
$ |
61.2 |
|
$ |
58.0 |
|
$ |
3.3 |
|
|
GAAP Effective Tax Rate |
|
|
24.0 |
% |
|
25.6 |
% |
|
28.9 |
% |
|
(3.3) |
% |
|
26.6 |
% |
|
264 |
bps |
|
Adjusted Effective Tax Rate (1) |
|
|
27.5 |
% |
|
28.0 |
% |
|
27.4 |
% |
|
27.7 |
% |
|
27.5 |
% |
|
— |
bps |
|
(1) |
A reconciliation of non-GAAP financial measures is presented in the Non-GAAP Financial Information section of the press release attached as Exhibit 99.1 included in this Current Report on Form 8-K. |
|
· |
Interest expense of $23.6 million increased $0.2 million from the year ago quarter. |
|
· |
The Company incurred $5.9 million of other expense in the first quarter of fiscal 2016 compared with $1.5 million of other expense in the first quarter of fiscal 2015. The increase in other expense was primarily due to the strengthening of the U.S. Dollar relative to foreign currencies versus the year ago quarter and the corresponding higher costs incurred to purchase foreign currency forward contracts in order to economically hedge such foreign currency exposures. |
|
· |
The GAAP effective tax rate was 26.6% in the first quarter of fiscal 2016 as compared with 24.0% in the first quarter of fiscal 2015. |
Avnet, Inc. Q1 Fiscal Year 2016
$ in millions - except per share data
October 29, 2015
Net Income and EPS
|
|
|
|
|
|
|
|
|
|
|
|
|
|
|
|
|
|
|
|
|
|
|
|
Q1' FY15 |
Q2' FY15 |
Q3' FY15 |
Q4' FY15 |
Q1' FY16 |
Y/Y Change |
||||||||||||
|
GAAP Net Income |
|
$ |
127.9 |
|
$ |
163.7 |
|
$ |
121.5 |
|
$ |
158.7 |
|
$ |
130.3 |
|
$ |
2.3 |
|
|
Adjusted Net Income (1) |
|
$ |
144.2 |
|
$ |
176.0 |
|
$ |
143.5 |
|
$ |
159.5 |
|
$ |
152.9 |
|
$ |
8.8 |
|
|
|
|
|
|
|
|
|
|
|
|
|
|
|
|
|
|
|
|
|
|
|
GAAP Diluted EPS |
|
$ |
0.91 |
|
$ |
1.18 |
|
$ |
0.88 |
|
$ |
1.15 |
|
$ |
0.96 |
|
|
5.5 |
% |
|
Adjusted Diluted EPS (1) |
|
$ |
1.02 |
|
$ |
1.27 |
|
$ |
1.04 |
|
$ |
1.16 |
|
$ |
1.12 |
|
|
9.8 |
% |
|
(1) |
A reconciliation of non-GAAP financial measures is presented in the Non-GAAP Financial Information section of the press release attached as Exhibit 99.1 included in this Current Report on Form 8-K. |
|
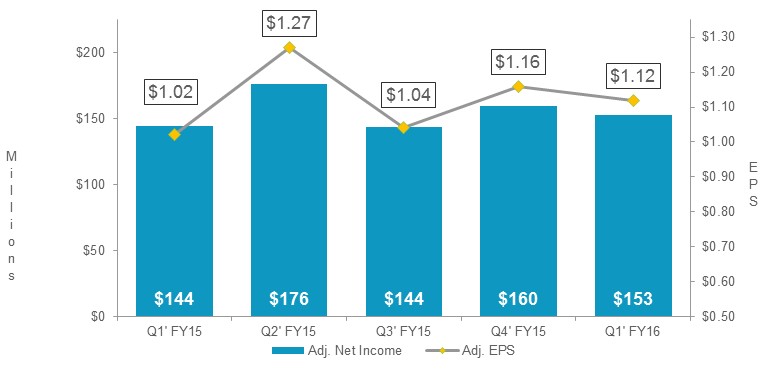
· |
GAAP net income increased by $2.3 million year over year to $130.3 million or $0.96 per share on a diluted basis, primarily due to the increase in operating income discussed in a preceding section, partially offset by an increase in other expenses. |
|
· |
Adjusted net income for the first quarter of fiscal 2016 was $152.9 million, or $1.12 per share on a diluted basis. |
|
o |
Adjusted net income and adjusted diluted earnings per share increased from the year ago quarter by 6.1% and 9.8%, respectively, primarily due to the growth in operating income at both operating groups partially offset by the negative impact of foreign currency when translating the results in U.S. Dollars. Adjusted diluted earnings per share was negatively impacted by approximately $0.09, or 8.0%, due to the translation impact of changes in foreign currency exchange rates and positively impacted by $0.03 as a result of lower average shares due to the share repurchase program. |
|
o |
Adjusted diluted earnings per share of $1.12 decreased $0.04, or 3.4%, sequentially primarily due to the previously discussed decrease in operating income and the increase in other expenses. |
Avnet, Inc. Q1 Fiscal Year 2016
$ in millions - except per share data
October 29, 2015
Working Capital
|
|
|
|
|
|
|
|
|
|
|
|
|
|
|
|
|
|
|
|
|
|
|
|
Q1' FY15 |
Q2' FY15 |
Q3' FY15 |
Q4' FY15 |
Q1' FY16 |
Y/Y Change |
||||||||||||
|
Accounts Receivable |
|
$ |
5,060.5 |
|
$ |
5,696.6 |
|
$ |
4,994.8 |
|
$ |
5,054.3 |
|
$ |
4,903.2 |
|
$ |
(157.3) |
|
|
Inventories |
|
$ |
2,705.4 |
|
$ |
2,493.6 |
|
$ |
2,474.4 |
|
$ |
2,482.2 |
|
$ |
2,805.0 |
|
$ |
99.6 |
|
|
Accounts Payable |
|
$ |
(3,301.5) |
|
$ |
(3,850.3) |
|
$ |
(3,272.0) |
|
$ |
(3,338.1) |
|
$ |
(3,339.8) |
|
$ |
(38.3) |
|
|
Working Capital |
|
$ |
4,464.4 |
|
$ |
4,339.9 |
|
$ |
4,197.2 |
|
$ |
4,198.4 |
|
$ |
4,368.4 |
|
$ |
(96.0) |
|
|
Working Capital Velocity(1) |
|
|
6.09 |
|
|
6.59 |
|
|
6.03 |
|
|
6.27 |
|
|
6.06 |
|
|
(0.03) |
|
|
(1) |
A reconciliation of non-GAAP financial measures is presented in the Non-GAAP Financial Information section of the press release attached as Exhibit 99.1 included in this Current Report on Form 8-K. |
|
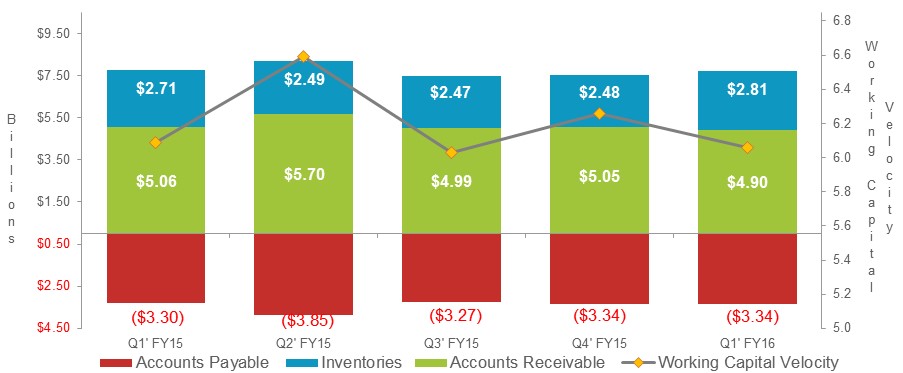
· |
Working capital (accounts receivable plus inventories less accounts payable) decreased $96.0 million, or 2.2%, and increased $166.0 million, or 3.7%, year over year in constant currency. The increase in constant currency was primarily due to an increase at EM to support sales growth. |
|
o |
On a sequential basis, working capital increased $200.3 million, or 4.8% when adjusted for the translation impact of changes in foreign currency exchange rates, primarily due to an increase in inventories at EM Asia to support the expected growth related to select high volume supply chain engagements in the December quarter. |
|
· |
Working capital velocity was consistent with the year ago quarter and decreased 0.21 turns sequentially, primarily due to the working capital growth at EM. |
|
· |
Inventories increased $99.6 million, or 3.7%, year over year and increased 9.3% in constant currency primarily to support the sales growth at EM. |
|
o |
On a sequential basis, inventories increased $322.8 million, or 13.0%, in constant currency primarily due to an increase at EM related to the previously discussed growth in high volume supply chain engagements and an increase at TS. |
Avnet, Inc. Q1 Fiscal Year 2016
$ in millions - except per share data
October 29, 2015
|
|
|
Q1' FY15 |
Q2' FY15 |
Q3' FY15 |
Q4' FY15 |
Q1' FY16 |
Y/Y Change |
||||||
|
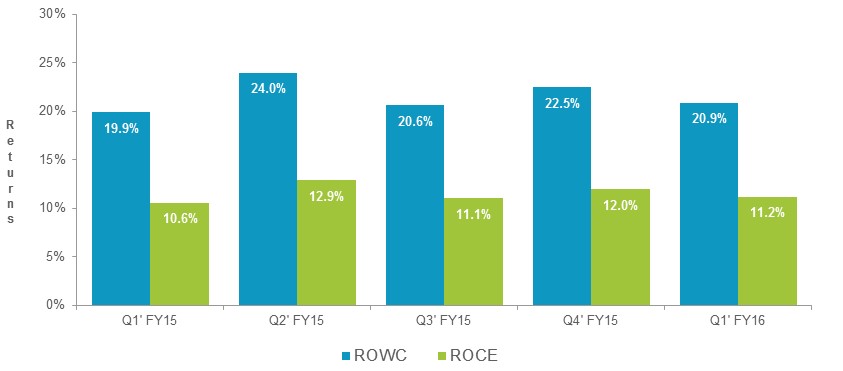
Return on Working Capital (ROWC) (1) |
|
19.9 |
% |
24.0 |
% |
20.6 |
% |
22.5 |
% |
20.9 |
% |
100 |
bps |
|
Return on Capital Employed (ROCE) (1) |
|
10.6 |
% |
12.9 |
% |
11.1 |
% |
12.0 |
% |
11.2 |
% |
56 |
bps |
|
(1) |
A reconciliation of non-GAAP financial measures is presented in the Non-GAAP Financial Information section of the press release attached as Exhibit 99.1 included in this Current Report on Form 8-K. |
|
· |
ROWC for the first quarter of fiscal 2016 was 20.9%, an increase of 100 basis points year over year and a decrease of 156 basis points sequentially. The year-over-year increase is primarily related to the improvement in profitability at both operating groups, particularly in the EMEA region. |
|
· |
ROCE of 11.2% increased 56 basis points year over year and declined 79 basis points sequentially. |
Avnet, Inc. Q1 Fiscal Year 2016
$ in millions - except per share data
October 29, 2015
Cash Flow
|
|
|
|
|
|
|
|
|
|
|
|
|
|
|
|
|
|
|
|
|
|
|
|
Q1' FY15 |
|
Q2' FY15 |
|
Q3' FY15 |
|
Q4' FY15 |
|
Q1' FY16 |
|
Y/Y Change |
|
||||||
|
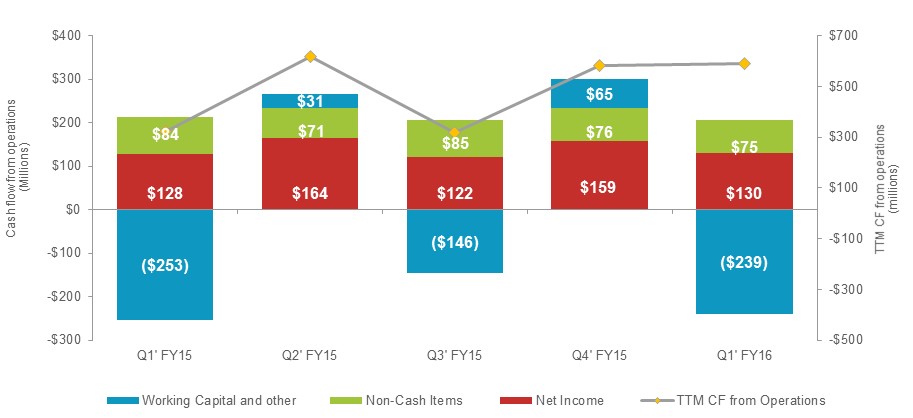
Net Income |
|
$ |
127.9 |
|
$ |
163.7 |
|
$ |
121.5 |
|
$ |
158.7 |
|
$ |
130.3 |
|
$ |
2.3 |
|
|
Non-Cash Items |
|
$ |
84.4 |
|
$ |
70.5 |
|
$ |
84.8 |
|
$ |
75.7 |
|
$ |
74.8 |
|
$ |
(9.6) |
|
|
Working Capital and Other |
|
$ |
(253.0) |
|
$ |
30.9 |
|
$ |
(146.2) |
|
$ |
64.9 |
|
$ |
(238.8) |
|
$ |
14.2 |
|
|
Cash Flow from Operations |
|
$ |
(40.7) |
|
$ |
265.1 |
|
$ |
60.1 |
|
$ |
299.3 |
|
$ |
(33.7) |
|
$ |
6.9 |
|
|
TTM CF from Operations |
|
$ |
323.0 |
|
$ |
616.0 |
|
$ |
318.1 |
|
$ |
583.9 |
|
$ |
590.8 |
|
$ |
267.8 |
|
|
· |
During the first quarter of fiscal 2016, cash used for operations was $33.7 million, consistent with the year ago quarter, primarily due to the working capital investment in organic growth. The trailing twelve month cash flow generated from operations was $590.8 million and over the past four quarters, our trailing twelve month cash flow from operations has averaged $527 million. |
|
· |
During the first quarter of fiscal 2016, the Board of Directors announced an increase in quarterly dividends (+6.3%) for the second consecutive year and increased the existing share repurchase authorization program by $250 million to an aggregate total of $1.25 billion. |
|
· |
During the first quarter of fiscal 2016, the Company paid a dividend of $0.17 per share, or $22.6 million in total. |
|
· |
During the first quarter of fiscal 2016, the Company repurchased approximately 3.5 million shares representing an aggregate investment of $145.1 million. Entering the second quarter, the Company had $407.4 million remaining under the current repurchase authorization. |
|
· |
Cash and cash equivalents at the end of the quarter were $824.7 million, of which $719.2 million was held outside the United States; net debt (total debt less cash and cash equivalents) was approximately $1.3 billion. |
Avnet, Inc. Q1 Fiscal Year 2016
$ in millions - except per share data
October 29, 2015
This document contains certain “forward-looking statements” within the meaning of Section 27A of the Securities Act of 1933, as amended, and Section 21E of the Securities Exchange Act of 1934, as amended. These statements are based on management’s current expectations and are subject to uncertainty and changes in facts and circumstances. The forward-looking statements herein include statements addressing future financial and operating results of Avnet and may include words such as “will,” “anticipate,” “estimate,” “forecast,” “expect,” “believe,” and “should,” and other words and terms of similar meaning in connection with any discussions of future operating or financial performance, business prospects or market conditions. Actual results may differ materially from the expectations contained in the forward-looking statements.
The following factors, among others, could cause actual results to differ materially from those described in the forward-looking statements: the Company’s ability to retain and grow market share and to generate additional cash flow, risks associated with any acquisition activities and the successful integration of acquired companies, declines in sales, changes in business conditions and the economy in general, changes in market demand and pricing pressures, any material changes in the allocation of product or product rebates by suppliers, and other competitive and/or regulatory factors affecting the businesses of Avnet generally.
More detailed information about these and other factors is set forth in Avnet’s filings with the Securities and Exchange Commission, including the Company’s reports on Form 10-K, Form 10-Q and Form 8-K. Except as required by law, Avnet is under no obligation to update any forward-looking statements, whether as a result of new information, future events or otherwise.
Organic Sales
Organic sales is defined as reported sales adjusted for the impact of acquisitions and divestitures by adjusting Avnet’s prior periods to include the sales of acquired businesses and exclude the sales of divested businesses as if the acquisitions and divestitures had occurred at the beginning of the earliest period presented. Additionally, fiscal 2016 sales are adjusted for the estimated impact of the extra week of sales in the first quarter of fiscal 2016 due to the 14-week fiscal first quarter and the 53-week fiscal year. Organic sales in constant currency is defined as organic sales excluding the impact of changes in foreign currency exchange rates.
Non-GAAP Financial Information
In addition to disclosing financial results that are determined in accordance with generally accepted accounting principles in the United States (“GAAP”), the Company also discloses in this document certain non-GAAP financial information including adjusted operating income, adjusted operating expenses, adjusted net income and adjusted diluted earnings per share, as well as sales adjusted for the impact of acquisitions and other items (as defined in the Organic Sales section of this document). There are also references to the impact of foreign currency in the discussion of the Company’s results of operations. When the U.S. Dollar strengthens and the stronger exchange rates of the current year are used to translate the results of operations of Avnet’s subsidiaries denominated in foreign currencies, the resulting impact is a decrease in U.S. Dollars of reported results. Conversely, when the U.S. Dollar weakens and the weaker exchange rates of the current year are used to translate the results of operations of Avnet’s subsidiaries denominated in foreign currencies, the resulting impact is an increase in U.S. Dollars of reported results. In the discussion of the Company’s results of operations, results excluding this impact are referred to as “excluding the translation impact of changes in foreign currency exchange rates” or “constant currency.” Management believes organic sales and sales in constant currency are useful measures for evaluating current period performance as compared with prior periods and for understanding underlying trends. Management believes that operating income and operating expenses adjusted for (i) restructuring, integration and other expenses and (ii) amortization of acquired intangible assets and other, are useful measures to help investors better assess and understand the Company’s operating performance, especially when comparing results with previous periods or forecasting performance for future periods, primarily because management views the excluded items to be outside of Avnet’s normal operating results or non-cash in nature. Management analyzes operating income and operating expenses without the impact of these items as an indicator of ongoing margin performance and underlying trends in the business. Management also uses these non-GAAP measures to establish operational goals and, in many cases, for measuring performance for compensation purposes.
Additional non-GAAP metrics management uses are adjusted operating income margin, which is defined as adjusted operating income (as defined above) divided by sales and adjusted operating expense to gross profit ratio, which is defined as adjusted operating expenses (as defined above) divided by gross profit.
Management believes net income and diluted EPS adjusted for (i) the impact of the items described above, (ii) certain items impacting other expense and (iii) certain items impacting income tax expense is useful to investors because it provides a measure of the Company’s net profitability on a more comparable basis to historical periods and provides a more meaningful basis for forecasting future performance. Additionally, because of management’s focus on generating shareholder value, of which net profitability is a primary driver, management believes net income and diluted EPS excluding the impact of these items provides an important measure of the Company’s net results for the investing public.
Avnet, Inc. Q1 Fiscal Year 2016
$ in millions - except per share data
October 29, 2015
Other metrics management monitors in its assessment of business performance include return on working capital (ROWC), return on capital employed (ROCE) and working capital velocity (WC velocity).
|
· |
ROWC is defined as annualized adjusted operating income (as defined above) divided by the sum of the monthly average balances of receivables and inventories less accounts payable. |
|
· |
ROCE is defined as annualized, tax effected adjusted operating income (as defined above) divided by the monthly average balances of interest-bearing debt and equity (including the impact of adjustments to operating income discussed above) less cash and cash equivalents. |
|
· |
WC velocity is defined as annualized sales divided by the sum of the monthly average balances of receivables and inventories less accounts payable. |
Any analysis of results and outlook on a non-GAAP basis should be used as a complement to, and in conjunction with, results presented in accordance with GAAP. A reconciliation of the GAAP financial measures to the non-GAAP financial measures is included in the Company’s press release dated October 29, 2015 (Exhibit 99.1) in this Current Report on Form 8-K.