Attached files
| file | filename |
|---|---|
| 8-K - AMERICAN CAMPUS COMMUNITIES, INC. 8-K - AMERICAN CAMPUS COMMUNITIES INC | a51209663.htm |
| EX-99.1 - EXHIBIT 99.1 - AMERICAN CAMPUS COMMUNITIES INC | a51209663_ex991.htm |
Exhibit 99.2
Supplemental Analyst Package 3Q 2015 October 26, 2015 Where students love living. AMERICAN CAMPUS COMMUNITIES
Table of Contents Financial Highlights 1 Consolidated Balance Sheets 2 Consolidated Statements of Comprehensive Income 3 Consolidated Statements of Funds from Operations 4 Wholly-Owned Properties Results of Operations 5 Same Store Wholly-Owned Properties Operating Expenses 6 Seasonality of Operations 7 Portfolio Overview 8 Investment Update 9 Owned Development Update 10 Third-Party Development Update 11 Management Services Update 12 Capital Structure 13 Interest Coverage 14 Capital Allocation – Long Term Funding Plan 15 2015 Outlook - Summary 16 2015 Outlook – Changes from Previous Guidance 17 Definitions 18 Investor Information 20
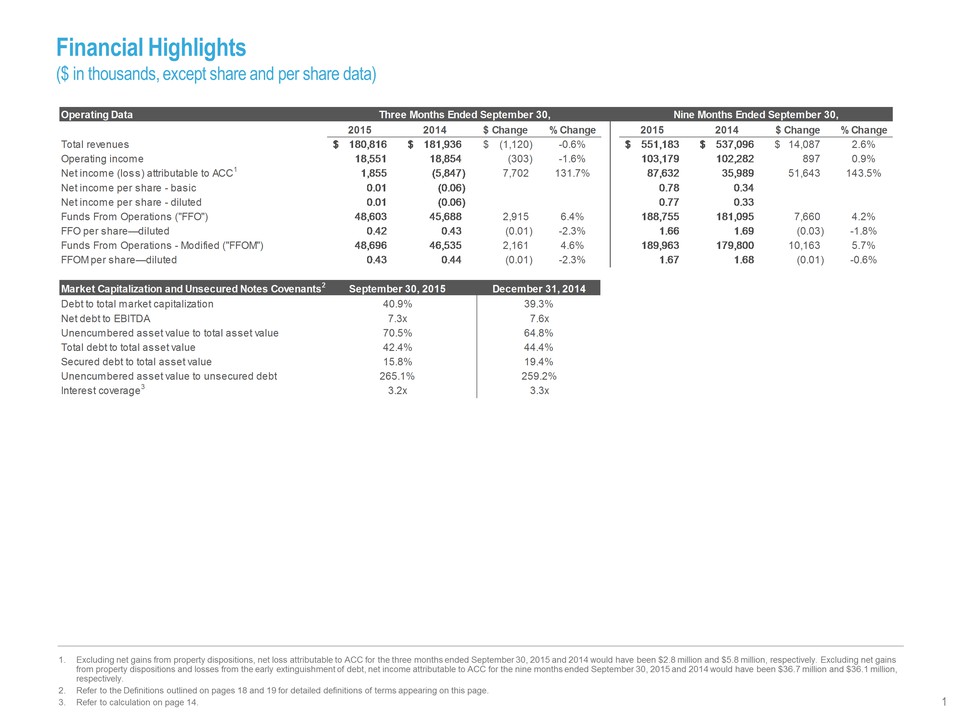
1. Excluding net gains from property dispositions, net loss attributable to ACC for the three months ended September 30, 2015 and 2014 would have been $2.8 million and $5.8 million, respectively. Excluding net gains from property dispositions and losses from the early extinguishment of debt, net income attributable to ACC for the nine months ended September 30, 2015 and 2014 would have been $36.7 million and $36.1 million, respectively. 2. Refer to the Definitions outlined on pages 18 and 19 for detailed definitions of terms appearing on this page. 3. Refer to calculation on page 14. Operating Data 2015 2014 $ Change % Change 2015 2014 $ Change % Change Total revenues $ 1 80,816 $ 181,936 $ (1,120) -0.6% $ 5 51,183 $ 537,096 $ 14,087 2.6% Operating income 1 8,551 18,854 ( 303) -1.6% 103,179 102,282 8 97 0.9% Net income (loss) attributable to ACC1 1 ,855 (5,847) 7,702 131.7% 87,632 35,989 51,643 143.5% Net income per share - basic 0 .01 (0.06) 0.78 0.34 Net income per share - diluted 0 .01 (0.06) 0.77 0.33 Funds From Operations ("FFO") 4 8,603 45,688 2,915 6.4% 188,755 181,095 7,660 4.2% FFO per share—diluted 0 .42 0.43 (0.01) -2.3% 1 .66 1.69 (0.03) -1.8% Funds From Operations - Modified ("FFOM") 4 8,696 46,535 2,161 4.6% 189,963 179,800 10,163 5.7% FFOM per share—diluted 0 .43 0.44 (0.01) -2.3% 1 .67 1.68 (0.01) -0.6% Market Capitalization and Unsecured Notes Covenants2 Debt to total market capitalization Net debt to EBITDA Unencumbered asset value to total asset value Total debt to total asset value Secured debt to total asset value Unencumbered asset value to unsecured debt Interest coverage3 15.8% 19.4% 265.1% 259.2% 3.2x 3.3x 7.3x 7.6x 70.5% 64.8% 42.4% 44.4% Three Months Ended September 30, Nine Months Ended September 30, September 30, 2015 December 31, 2014 40.9% 39.3% Financial Highlights ($ in thousands, except share and per share data) 1
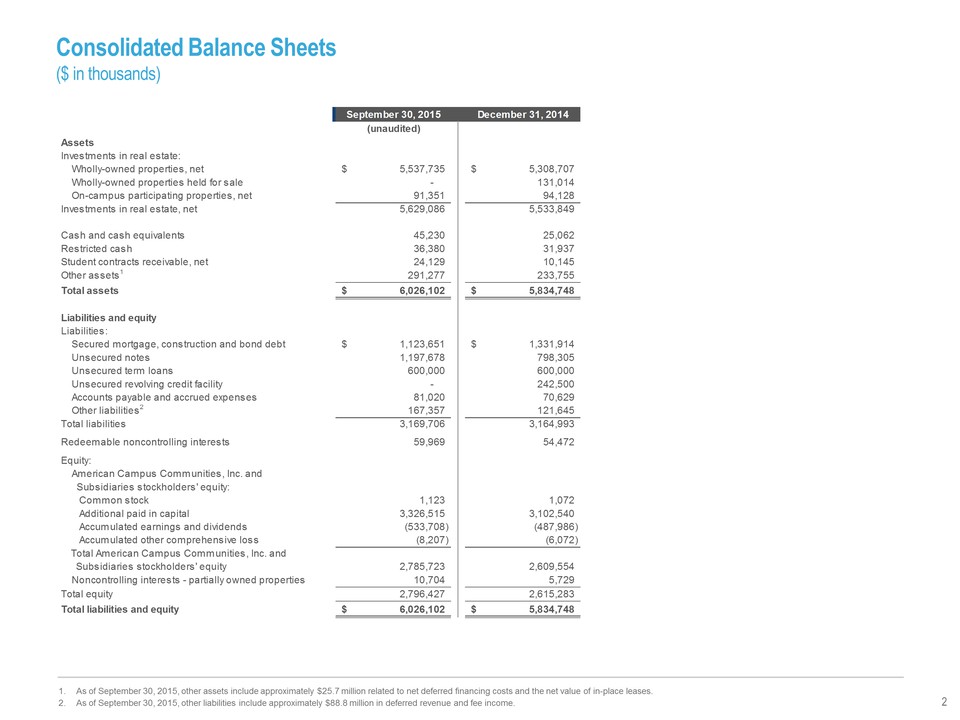
Consolidated Balance Sheets ($ in thousands) September 30, 2015 December 31, 2014 (unaudited) Assets Investments in real estate: Wholly-owned properties, net $ 5 ,537,735 $ 5,308,707 Wholly-owned properties held for sale - 131,014 On-campus participating properties, net 91,351 94,128 Investments in real estate, net 5,629,086 5,533,849 Cash and cash equivalents 45,230 25,062 Restricted cash 36,380 31,937 Student contracts receivable, net 24,129 10,145 Other assets1 291,277 233,755 Total assets $ 6 ,026,102 $ 5,834,748 Liabilities and equity Liabilities: Secured mortgage, construction and bond debt $ 1 ,123,651 $ 1,331,914 Unsecured notes 1 ,197,678 7 98,305 Unsecured term loans 6 00,000 600,000 Unsecured revolving credit facility - 242,500 Accounts payable and accrued expenses 81,020 70,629 Other liabilities2 167,357 121,645 Total liabilities 3,169,706 3,164,993 Redeemable noncontrolling interests 59,969 54,472 Equity: American Campus Communities, Inc. and Subsidiaries stockholders' equity: Common stock 1,123 1,072 Additional paid in capital 3,326,515 3,102,540 Accumulated earnings and dividends (533,708) (487,986) Accumulated other comprehensive loss (8,207) (6,072) 2,785,723 2,609,554 Noncontrolling interests - partially owned properties 10,704 5,729 Total equity 2,796,427 2,615,283 Total liabilities and equity $ 6 ,026,102 $ 5,834,748 Total American Campus Communities, Inc. and Subsidiaries stockholders' equity 1. As of September 30, 2015, other assets include approximately $25.7 million related to net deferred financing costs and the net value of in-place leases. 2. As of September 30, 2015, other liabilities include approximately $88.8 million in deferred revenue and fee income. 2
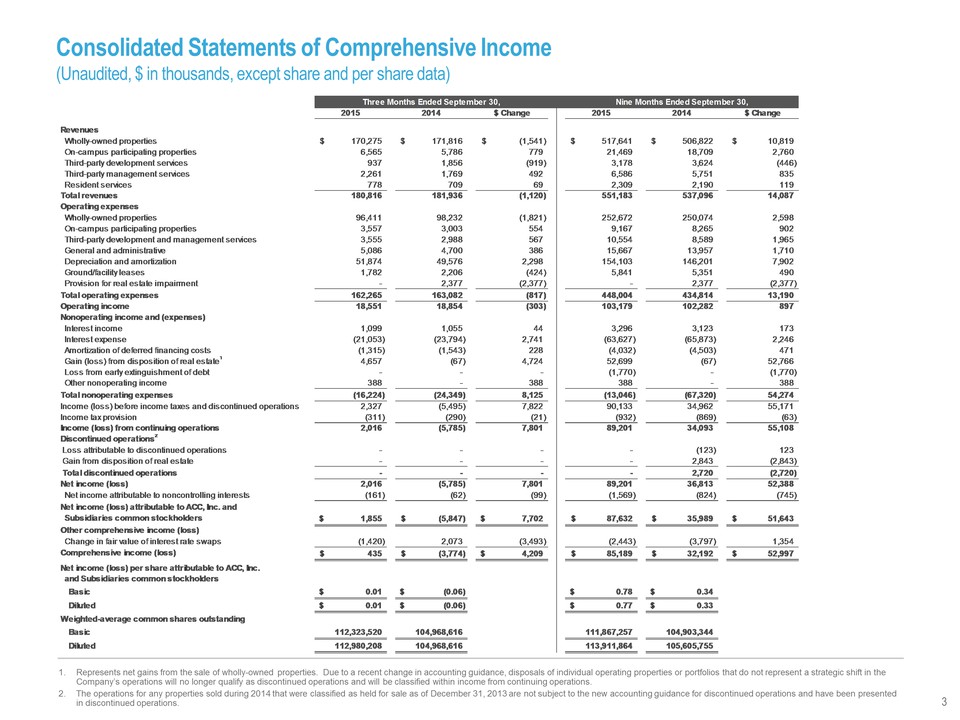
Consolidated Statements of Comprehensive Income (Unaudited, $ in thousands, except share and per share data) 2015 2014 $ Change 2015 2014 $ Change Revenues Wholly-owned properties $ 1 70,275 $ 171,816 $ ( 1,541) $ 517,641 $ 506,822 $ 10,819 On-campus participating properties 6,565 5,786 7 79 21,469 18,709 2 ,760 Third-party development services 937 1,856 ( 919) 3,178 3,624 ( 446) Third-party management services 2,261 1,769 4 92 6,586 5,751 8 35 Resident services 778 709 6 9 2,309 2,190 1 19 Total revenues 1 80,816 181,936 (1,120) 551,183 537,096 14,087 Operating expenses Wholly-owned properties 96,411 98,232 ( 1,821) 252,672 250,074 2 ,598 On-campus participating properties 3,557 3,003 5 54 9,167 8,265 9 02 Third-party development and management services 3,555 2,988 5 67 10,554 8,589 1 ,965 General and administrative 5,086 4,700 3 86 15,667 13,957 1 ,710 Depreciation and amortization 51,874 49,576 2 ,298 154,103 146,201 7 ,902 Ground/facility leases 1,782 2,206 ( 424) 5,841 5,351 4 90 Provision for real estate impairment - 2,377 (2,377) - 2,377 (2,377) Total operating expenses 1 62,265 163,082 (817) 4 48,004 434,814 13,190 Operating income 1 8,551 18,854 (303) 1 03,179 102,282 897 Nonoperating income and (expenses) Interest income 1,099 1,055 4 4 3,296 3,123 1 73 Interest expense (21,053) (23,794) 2 ,741 (63,627) (65,873) 2 ,246 Amortization of deferred financing costs (1,315) (1,543) 2 28 (4,032) (4,503) 4 71 Gain (loss) from disposition of real estate1 4,657 ( 67) 4,724 52,699 ( 67) 52,766 Loss from early extinguishment of debt - - - (1,770) - (1,770) Other nonoperating income 3 88 - 388 388 – 388 Total nonoperating expenses ( 16,224) (24,349) 8 ,125 (13,046) (67,320) 5 4,274 Income (loss) before income taxes and discontinued operations 2 ,327 (5,495) 7,822 9 0,133 34,962 55,171 Income tax provision ( 311) (290) ( 21) (932) (869) ( 63) Income (loss) from continuing operations 2,016 (5,785) 7 ,801 89,201 34,093 5 5,108 Discontinued operations 2 Loss attributable to discontinued operations - - - - (123) 1 23 Gain from disposition of real estate - - - - 2,843 (2,843) Total discontinued operations - - - - 2,720 (2,720) Net income (loss) 2 ,016 (5,785) 7,801 8 9,201 36,813 52,388 Net income attributable to noncontrolling interests ( 161) ( 62) (99) (1,569) ( 824) (745) Net income (loss) attributable to ACC, Inc. and Subsidiaries common stockholders $ 1 ,855 $ (5,847) $ 7 ,702 $ 87,632 $ 35,989 $ 51,643 Other comprehensive income (loss) Change in fair value of interest rate swaps (1,420) 2,073 ( 3,493) (2,443) (3,797) 1 ,354 Comprehensive income (loss) $ 4 35 $ (3,774) $ 4 ,209 $ 85,189 $ 32,192 $ 52,997 Net income (loss) per share attributable to ACC, Inc. and Subsidiaries common stockholders Basic $ 0.01 $ (0.06) $ 0.78 $ 0.34 Diluted $ 0.01 $ (0.06) $ 0.77 $ 0.33 Weighted-average common shares outstanding Basic 1 12,323,520 104,968,616 111,867,257 104,903,344 Diluted 1 12,980,208 104,968,616 113,911,864 105,605,755 Three Months Ended September 30, Nine Months Ended September 30, 1. Represents net gains from the sale of wholly-owned properties. Due to a recent change in accounting guidance, disposals of individual operating properties or portfolios that do not represent a strategic shift in the Company’s operations will no longer qualify as discontinued operations and will be classified within income from continuing operations. 2. The operations for any properties sold during 2014 that were classified as held for sale as of December 31, 2013 are not subject to the new accounting guidance for discontinued operations and have been presented in discontinued operations. 3
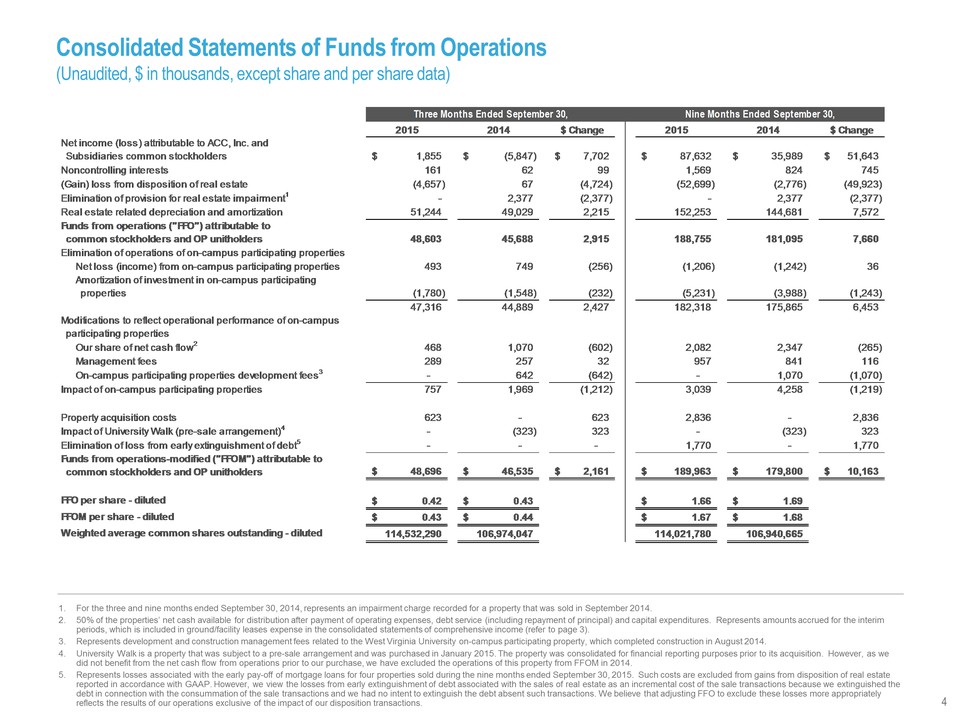
Consolidated Statements of Funds from Operations (Unaudited, $ in thousands, except share and per share data) 2015 2014 $ Change 2015 2014 $ Change Net income (loss) attributable to ACC, Inc. and Subsidiaries common stockholders $ 1,855 $ (5,847) $ 7,702 $ 87,632 $ 35,989 $ 51,643 Noncontrolling interests 161 62 99 1 ,569 824 745 (Gain) loss from disposition of real estate (4,657) 67 (4,724) (52,699) (2,776) (49,923) Elimination of provision for real estate impairment1 - 2,377 (2,377) - 2,377 (2,377) Real estate related depreciation and amortization 51,244 49,029 2,215 152,253 144,681 7,572 Funds from operations ("FFO") attributable to common stockholders and OP unitholders 48,603 45,688 2,915 188,755 181,095 7,660 Elimination of operations of on-campus participating properties Net loss (income) from on-campus participating properties 493 749 (256) (1,206) (1,242) 36 Amortization of investment in on-campus participating properties (1,780) (1,548) (232) (5,231) (3,988) (1,243) 47,316 44,889 2,427 182,318 175,865 6,453 Modifications to reflect operational performance of on-campus participating properties Our share of net cash flow2 468 1,070 (602) 2 ,082 2,347 (265) Management fees 289 257 32 957 841 116 On-campus participating properties development fees3 - 642 (642) - 1,070 (1,070) Impact of on-campus participating properties 757 1,969 (1,212) 3 ,039 4,258 (1,219) Property acquisition costs 623 - 623 2 ,836 - 2,836 Impact of University Walk (pre-sale arrangement)4 - (323) 323 - (323) 323 Elimination of loss from early extinguishment of debt5 - - - 1 ,770 - 1,770 Funds from operations-modified ("FFOM") attributable to common stockholders and OP unitholders $ 48,696 $ 6,535 $ 2,161 $ 1 89,963 $ 179,800 $ 10,163 FFO per share - diluted $ 0 .42 $ 0.43 $ 1.66 $ 1.69 FFOM per share - diluted $ 0 .43 $ 0.44 $ 1.67 $ 1.68 Weighted average common shares outstanding - diluted 114,532,290 106,974,047 114,021,780 106,940,665 Three Months Ended September 30, Nine Months Ended September 30, 1. For the three and nine months ended September 30, 2014, represents an impairment charge recorded for a property that was sold in September 2014. 2. 50% of the properties’ net cash available for distribution after payment of operating expenses, debt service (including repayment of principal) and capital expenditures. Represents amounts accrued for the interim periods, which is included in ground/facility leases expense in the consolidated statements of comprehensive income (refer to page 3). 3. Represents development and construction management fees related to the West Virginia University on-campus participating property, which completed construction in August 2014. 4. University Walk is a property that was subject to a pre-sale arrangement and was purchased in January 2015. The property was consolidated for financial reporting purposes prior to its acquisition. However, as we did not benefit from the net cash flow from operations prior to our purchase, we have excluded the operations of this property from FFOM in 2014. 5. Represents losses associated with the early pay-off of mortgage loans for four properties sold during the nine months ended September 30, 2015. Such costs are excluded from gains from disposition of real estate reported in accordance with GAAP. However, we view the losses from early extinguishment of debt associated with the sales of real estate as an incremental cost of the sale transactions because we extinguished the debt in connection with the consummation of the sale transactions and we had no intent to extinguish the debt absent such transactions. We believe that adjusting FFO to exclude these losses more appropriately reflects the results of our operations exclusive of the impact of our disposition transactions. 4
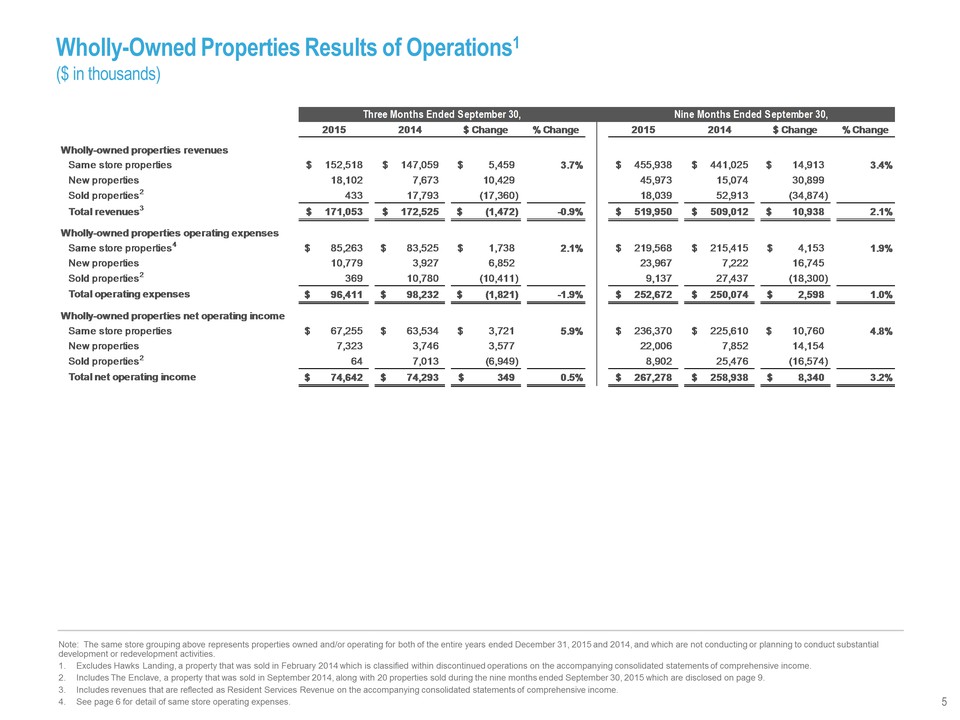
Wholly-Owned Properties Results of Operations1 ($ in thousands) 2015 2014 $ Change % Change 2015 2014 $ Change % Change Wholly-owned properties revenues Same store properties $ 1 52,518 $ 147,059 $ 5 ,459 3.7% $ 4 55,938 $ 441,025 $ 1 4,913 3.4% New properties 1 8,102 7 ,673 10,429 45,973 15,074 30,899 Sold properties2 4 33 17,793 (17,360) 18,039 52,913 (34,874) Total revenues3 $ 1 71,053 $ 172,525 $ ( 1,472) -0.9% $ 519,950 $ 509,012 $ 1 0,938 2.1% Wholly-owned properties operating expenses Same store properties4 $ 8 5,263 $ 83,525 $ 1 ,738 2.1% $ 2 19,568 $ 215,415 $ 4 ,153 1.9% New properties 1 0,779 3 ,927 6,852 23,967 7 ,222 16,745 Sold properties2 3 69 10,780 (10,411) 9 ,137 27,437 (18,300) Total operating expenses $ 9 6,411 $ 98,232 $ ( 1,821) -1.9% $ 252,672 $ 250,074 $ 2 ,598 1.0% Wholly-owned properties net operating income Same store properties $ 6 7,255 $ 63,534 $ 3 ,721 5.9% $ 2 36,370 $ 225,610 $ 1 0,760 4.8% New properties 7 ,323 3,746 3,577 22,006 7 ,852 14,154 Sold properties2 6 4 7,013 (6,949) 8 ,902 25,476 (16,574) Total net operating income $ 7 4,642 $ 74,293 $ 3 49 0.5% $ 267,278 $ 258,938 $ 8 ,340 3.2% Three Months Ended September 30, Nine Months Ended September 30, Note: The same store grouping above represents properties owned and/or operating for both of the entire years ended December 31, 2015 and 2014, and which are not conducting or planning to conduct substantial development or redevelopment activities. 1. Excludes Hawks Landing, a property that was sold in February 2014 which is classified within discontinued operations on the accompanying consolidated statements of comprehensive income. 2. Includes The Enclave, a property that was sold in September 2014, along with 20 properties sold during the nine months ended September 30, 2015 which are disclosed on page 9. 3. Includes revenues that are reflected as Resident Services Revenue on the accompanying consolidated statements of comprehensive income. 4. See page 6 for detail of same store operating expenses. 5
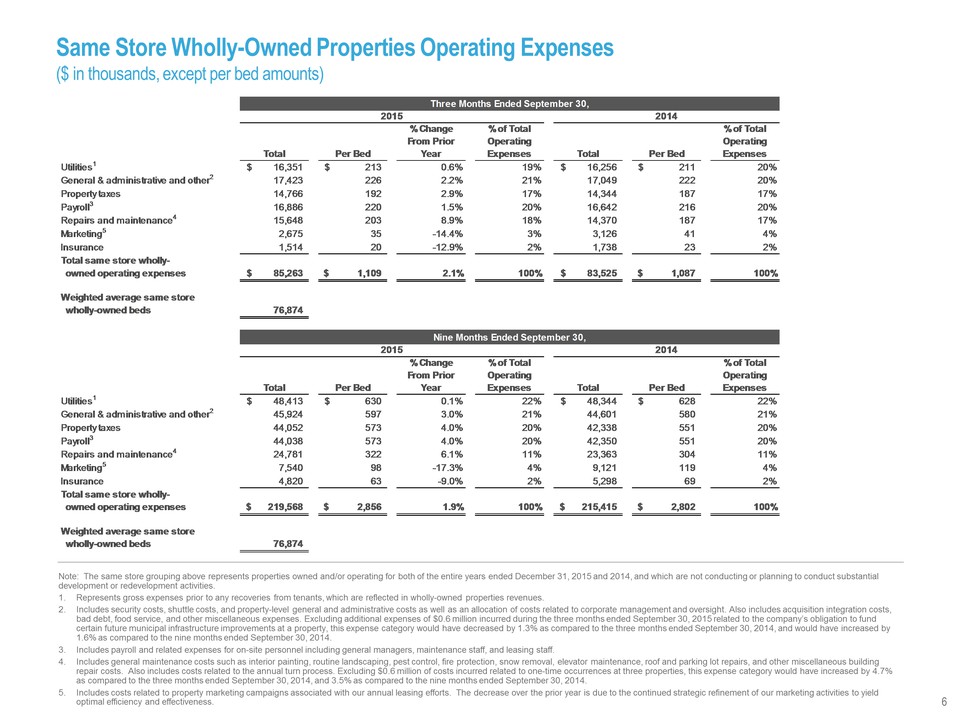
Same Store Wholly-Owned Properties Operating Expenses ($ in thousands, except per bed amounts) Total Per Bed Total Per Bed Utilities1 $ 1 6,351 $ 2 13 0.6% 19% $ 16,256 $ 2 11 20% General & administrative and other2 1 7,423 226 2.2% 21% 17,049 222 20% Property taxes 1 4,766 192 2.9% 17% 14,344 187 17% Payroll3 1 6,886 220 1.5% 20% 16,642 216 20% Repairs and maintenance4 1 5,648 203 8.9% 18% 14,370 187 17% Marketing5 2 ,675 3 5 -14.4% 3% 3,126 4 1 4% Insurance 1 ,514 2 0 -12.9% 2% 1,738 2 3 2% Total same store whollyowned operating expenses $ 85,263 $ 1 ,109 2.1% 100% $ 8 3,525 $ 1 ,087 100% Weighted average same store wholly-owned beds 76,874 Total Per Bed Total Per Bed Utilities1 $ 4 8,413 $ 6 30 0.1% 22% $ 48,344 $ 6 28 22% General & administrative and other2 4 5,924 597 3.0% 21% 44,601 580 21% Property taxes 4 4,052 573 4.0% 20% 42,338 551 20% Payroll3 4 4,038 573 4.0% 20% 42,350 551 20% Repairs and maintenance4 2 4,781 322 6.1% 11% 23,363 304 11% Marketing5 7 ,540 9 8 -17.3% 4% 9,121 119 4% Insurance 4 ,820 6 3 -9.0% 2% 5,298 6 9 2% Total same store whollyowned operating expenses $ 219,568 $ 2 ,856 1.9% 100% $ 215,415 $ 2 ,802 100% Weighted average same store wholly-owned beds 76,874 Three Months Ended September 30, 2015 2014 % Change From Prior Year % of Total Operating Expenses % of Total Operating Expenses Nine Months Ended September 30, 2015 2014 % Change From Prior Year % of Total Operating Expenses % of Total Operating Expenses Note: The same store grouping above represents properties owned and/or operating for both of the entire years ended December 31, 2015 and 2014, and which are not conducting or planning to conduct substantial development or redevelopment activities. 1. Represents gross expenses prior to any recoveries from tenants, which are reflected in wholly-owned properties revenues. 2. Includes security costs, shuttle costs, and property-level general and administrative costs as well as an allocation of costs related to corporate management and oversight. Also includes acquisition integration costs, bad debt, food service, and other miscellaneous expenses. Excluding additional expenses of $0.6 million incurred during the three months ended September 30, 2015 related to the company’s obligation to fund certain future municipal infrastructure improvements at a property, this expense category would have decreased by 1.3% as compared to the three months ended September 30, 2014, and would have increased by 1.6% as compared to the nine months ended September 30, 2014. 3. Includes payroll and related expenses for on-site personnel including general managers, maintenance staff, and leasing staff. 4. Includes general maintenance costs such as interior painting, routine landscaping, pest control, fire protection, snow removal, elevator maintenance, roof and parking lot repairs, and other miscellaneous building repair costs. Also includes costs related to the annual turn process. Excluding $0.6 million of costs incurred related to one-time occurrences at three properties, this expense category would have increased by 4.7% as compared to the three months ended September 30, 2014, and 3.5% as compared to the nine months ended September 30, 2014. 5. Includes costs related to property marketing campaigns associated with our annual leasing efforts. The decrease over the prior year is due to the continued strategic refinement of our marketing activities to yield optimal efficiency and effectiveness. 6
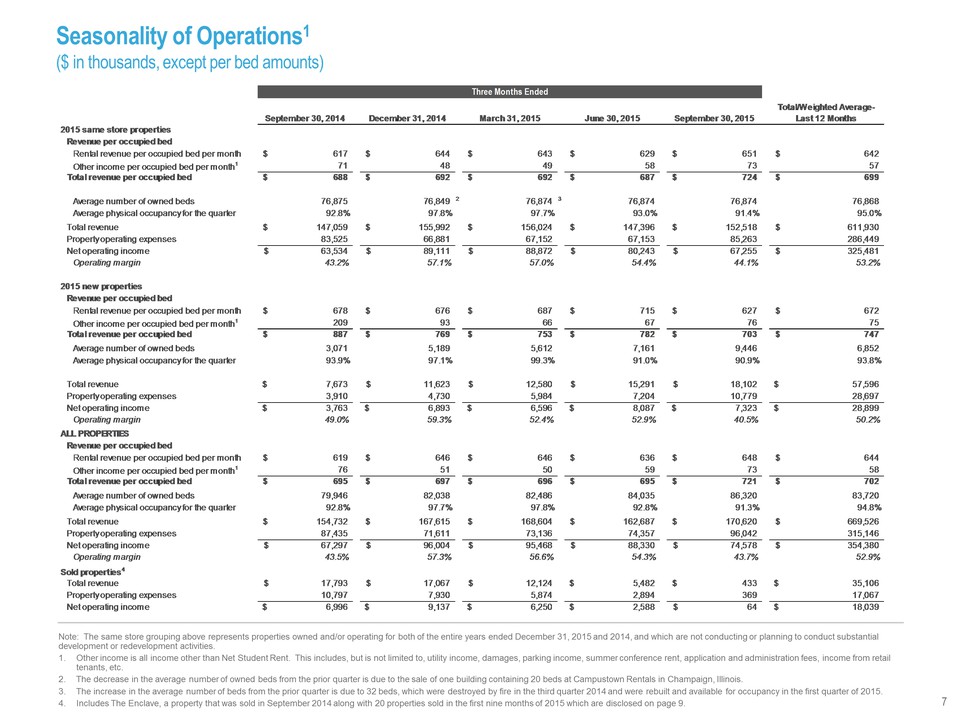
Seasonality of Operations1 ($ in thousands, except per bed amounts) September 30, 2014 December 31, 2014 March 31, 2015 June 30, 2015 September 30, 2015 Total/Weighted Average- Last 12 Months 2015 same store properties Revenue per occupied bed Rental revenue per occupied bed per month $ 6 17 $ 644 $ 643 $ 629 $ 651 $ 6 42 Other income per occupied bed per month1 71 48 49 58 73 57 Total revenue per occupied bed $ 6 88 $ 692 $ 692 $ 687 $ 724 $ 6 99 Average number of owned beds 7 6,875 76,849 2 7 6,874 3 7 6,874 76,874 7 6,868 Average physical occupancy for the quarter 92.8% 97.8% 97.7% 93.0% 91.4% 95.0% Total revenue $ 1 47,059 $ 155,992 $ 156,024 $ 147,396 $ 152,518 $ 6 11,930 Property operating expenses 83,525 66,881 67,152 67,153 85,263 286,449 Net operating income $ 6 3,534 $ 89,111 $ 88,872 $ 80,243 $ 67,255 $ 3 25,481 Operating margin 43.2% 57.1% 57.0% 54.4% 44.1% 53.2% 2015 new properties Revenue per occupied bed Rental revenue per occupied bed per month $ 6 78 $ 676 $ 687 $ 715 $ 627 $ 6 72 Other income per occupied bed per month1 209 93 66 67 76 75 Total revenue per occupied bed $ 8 87 $ 769 $ 753 $ 782 $ 703 $ 7 47 Average number of owned beds 3 ,071 5,189 5,612 7,161 9,446 6 ,852 Average physical occupancy for the quarter 93.9% 97.1% 99.3% 91.0% 90.9% 93.8% Total revenue $ 7 ,673 $ 11,623 $ 12,580 $ 15,291 $ 18,102 $ 5 7,596 Property operating expenses 3,910 4,730 5,984 7,204 10,779 28,697 Net operating income $ 3 ,763 $ 6,893 $ 6,596 $ 8,087 $ 7,323 $ 2 8,899 Operating margin 49.0% 59.3% 52.4% 52.9% 40.5% 50.2% ALL PROPERTIES Revenue per occupied bed Rental revenue per occupied bed per month $ 6 19 $ 646 $ 646 $ 636 $ 648 $ 6 44 Other income per occupied bed per month1 76 51 50 59 73 58 Total revenue per occupied bed $ 6 95 $ 697 $ 696 $ 695 $ 721 $ 7 02 Average number of owned beds 7 9,946 82,038 82,486 84,035 86,320 8 3,720 Average physical occupancy for the quarter 92.8% 97.7% 97.8% 92.8% 91.3% 94.8% Total revenue $ 1 54,732 $ 167,615 $ 168,604 $ 162,687 $ 170,620 $ 6 69,526 Property operating expenses 87,435 71,611 73,136 74,357 96,042 315,146 Net operating income $ 6 7,297 $ 96,004 $ 95,468 $ 88,330 $ 74,578 $ 3 54,380 Operating margin 43.5% 57.3% 56.6% 54.3% 43.7% 52.9% Sold properties4 Total revenue $ 1 7,793 $ 17,067 $ 12,124 $ 5 ,482 $ 4 33 $ 3 5,106 Property operating expenses 10,797 7 ,930 5,874 2,894 369 17,067 Net operating income $ 6 ,996 $ 9,137 $ 6,250 $ 2,588 $ 6 4 $ 1 8,039 Three Months Ended Note: The same store grouping above represents properties owned and/or operating for both of the entire years ended December 31, 2015 and 2014, and which are not conducting or planning to conduct substantial development or redevelopment activities. 1. Other income is all income other than Net Student Rent. This includes, but is not limited to, utility income, damages, parking income, summer conference rent, application and administration fees, income from retail tenants, etc. 2. The decrease in the average number of owned beds from the prior quarter is due to the sale of one building containing 20 beds at Campustown Rentals in Champaign, Illinois. 3. The increase in the average number of beds from the prior quarter is due to 32 beds, which were destroyed by fire in the third quarter 2014 and were rebuilt and available for occupancy in the first quarter of 2015. 4. Includes The Enclave, a property that was sold in September 2014 along with 20 properties sold in the first nine months of 2015 which are disclosed on page 9. 7
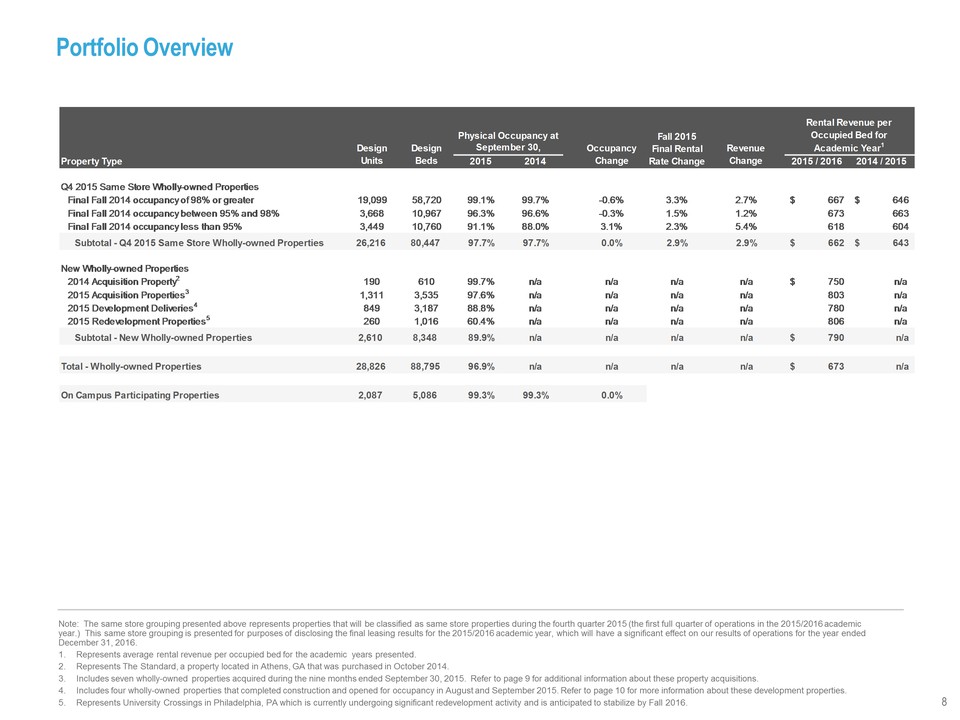
Portfolio Overview September 30, Property Type 2015 2014 2015 / 2016 2014 / 2015 Q4 2015 Same Store Wholly-owned Properties Final Fall 2014 occupancy of 98% or greater 19,099 58,720 99.1% 99.7% -0.6% 3.3% 2.7% $ 6 67 $ 646 Final Fall 2014 occupancy between 95% and 98% 3,668 10,967 96.3% 96.6% -0.3% 1.5% 1.2% 6 73 663 Final Fall 2014 occupancy less than 95% 3,449 10,760 91.1% 88.0% 3.1% 2.3% 5.4% 6 18 604 Subtotal - Q4 2015 Same Store Wholly-owned Properties 26,216 80,447 97.7% 97.7% 0.0% 2.9% 2.9% $ 6 62 $ 643 New Wholly-owned Properties 2014 Acquisition Property2 190 610 99.7% n/a n/a n/a n/a $ 7 50 n/a 2015 Acquisition Properties3 1,311 3,535 97.6% n/a n/a n/a n/a 8 03 n/a 2015 Development Deliveries4 849 3,187 88.8% n/a n/a n/a n/a 7 80 n/a 2015 Redevelopment Properties5 260 1,016 60.4% n/a n/a n/a n/a 8 06 n/a Subtotal - New Wholly-owned Properties 2,610 8,348 89.9% n/a n/a n/a n/a $ 7 90 n/a Total - Wholly-owned Properties 28,826 88,795 96.9% n/a n/a n/a n/a $ 6 73 n/a On Campus Participating Properties 2,087 5,086 99.3% 99.3% 0.0% Design Units Design Beds Occupancy Change Revenue Change Academic Year1 Physical Occupancy at Fall 2015 Final Rental Rate Change Rental Revenue per Occupied Bed for Note: The same store grouping presented above represents properties that will be classified as same store properties during the fourth quarter 2015 (the first full quarter of operations in the 2015/2016 academic year.) This same store grouping is presented for purposes of disclosing the final leasing results for the 2015/2016 academic year, which will have a significant effect on our results of operations for the year ended December 31, 2016. 1. Represents average rental revenue per occupied bed for the academic years presented. 2. Represents The Standard, a property located in Athens, GA that was purchased in October 2014. 3. Includes seven wholly-owned properties acquired during the nine months ended September 30, 2015. Refer to page 9 for additional information about these property acquisitions. 4. Includes four wholly-owned properties that completed construction and opened for occupancy in August and September 2015. Refer to page 10 for more information about these development properties. 5. Represents University Crossings in Philadelphia, PA which is currently undergoing significant redevelopment activity and is anticipated to stabilize by Fall 2016. 8
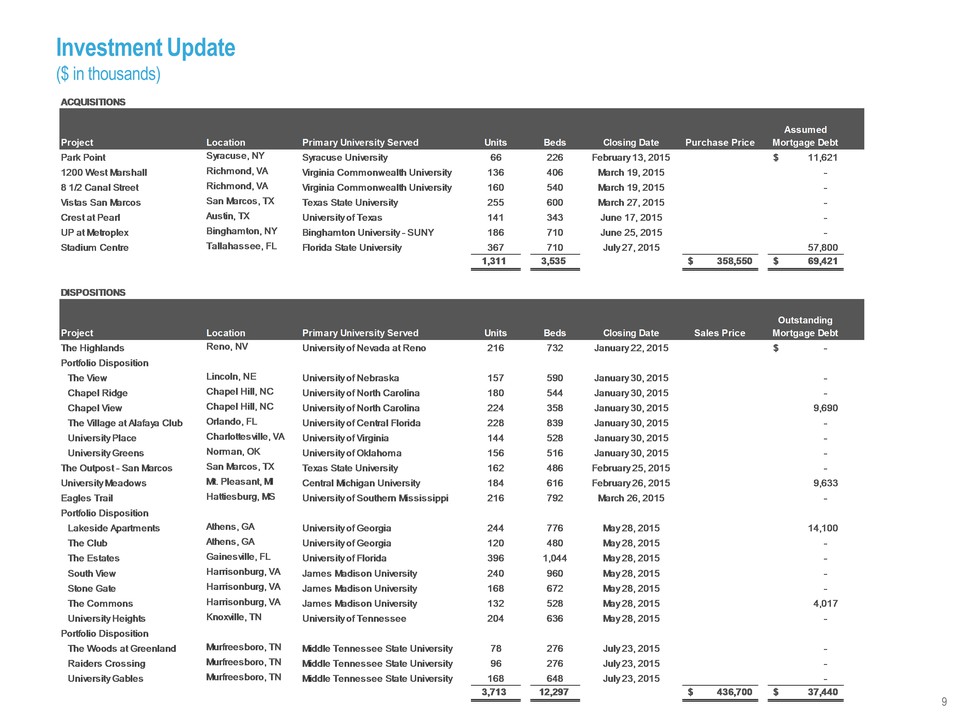
Investment Update ($ in thousands) ACQUISITIONS Project Location Primary University Served Units Beds Closing Date Purchase Price Assumed Mortgage Debt Park Point Syracuse, NY Syracuse University 66 226 February 13, 2015 $ 11,621 1200 West Marshall Richmond, VA Virginia Commonwealth University 136 406 March 19, 2015 - 8 1/2 Canal Street Richmond, VA Virginia Commonwealth University 160 540 March 19, 2015 - Vistas San Marcos San Marcos, TX Texas State University 255 600 March 27, 2015 - Crest at Pearl Austin, TX University of Texas 141 343 June 17, 2015 - UP at Metroplex Binghamton, NY Binghamton University - SUNY 186 710 June 25, 2015 - Stadium Centre Tallahassee, FL Florida State University 367 710 July 27, 2015 57,800 1,311 3,535 $ 3 58,550 $ 69,421 DISPOSITIONS Project Location Primary University Served Units Beds Closing Date Sales Price Outstanding Mortgage Debt The Highlands Reno, NV University of Nevada at Reno 216 732 January 22, 2015 $ - Portfolio Disposition The View Lincoln, NE University of Nebraska 157 590 January 30, 2015 - Chapel Ridge Chapel Hill, NC University of North Carolina 180 544 January 30, 2015 - Chapel View Chapel Hill, NC University of North Carolina 224 358 January 30, 2015 9 ,690 The Village at Alafaya Club Orlando, FL University of Central Florida 228 839 January 30, 2015 - University Place Charlottesville, VA University of Virginia 144 528 January 30, 2015 - University Greens Norman, OK University of Oklahoma 156 516 January 30, 2015 - The Outpost - San Marcos San Marcos, TX Texas State University 162 486 February 25, 2015 - University Meadows Mt. Pleasant, MI Central Michigan University 184 616 February 26, 2015 9 ,633 Eagles Trail Hattiesburg, MS University of Southern Mississippi 216 792 March 26, 2015 - Portfolio Disposition Lakeside Apartments Athens, GA University of Georgia 244 776 May 28, 2015 14,100 The Club Athens, GA University of Georgia 120 480 May 28, 2015 - The Estates Gainesville, FL University of Florida 396 1,044 May 28, 2015 - South View Harrisonburg, VA James Madison University 240 960 May 28, 2015 - Stone Gate Harrisonburg, VA James Madison University 168 672 May 28, 2015 - The Commons Harrisonburg, VA James Madison University 132 528 May 28, 2015 4 ,017 University Heights Knoxville, TN University of Tennessee 204 636 May 28, 2015 - Portfolio Disposition The Woods at Greenland Murfreesboro, TN Middle Tennessee State University 78 276 July 23, 2015 - Raiders Crossing Murfreesboro, TN Middle Tennessee State University 96 276 July 23, 2015 - University Gables Murfreesboro, TN Middle Tennessee State University 168 648 July 23, 2015 - 3,713 12,297 $ 4 36,700 $ 37,440 9
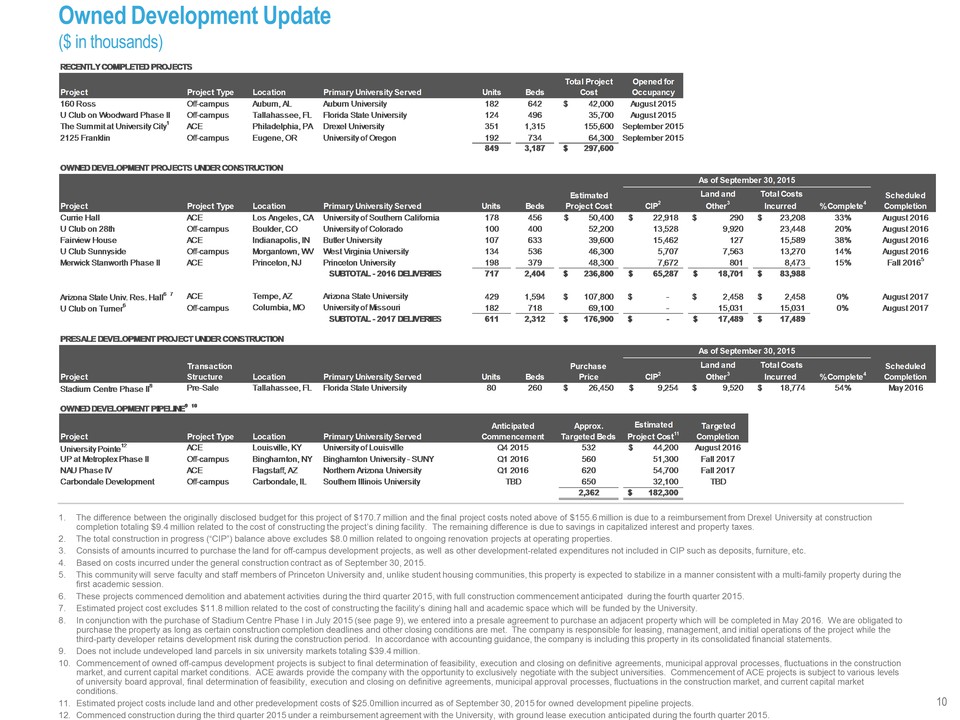
Owned Development Update ($ in thousands) RECENTLY COMPLETED PROJECTS Project Project Type Location Primary University Served Units Beds Total Project Cost Opened for Occupancy 160 Ross Off-campus Auburn, AL Auburn University 182 642 $ 42,000 August 2015 U Club on Woodward Phase II Off-campus Tallahassee, FL Florida State University 124 496 35,700 August 2015 The Summit at University City1 ACE Philadelphia, PA Drexel University 351 1,315 155,600 September 2015 2125 Franklin Off-campus Eugene, OR University of Oregon 192 734 64,300 September 2015 849 3,187 $ 2 97,600 OWNED DEVELOPMENT PROJECTS UNDER CONSTRUCTION Project Project Type Location Primary University Served Units Beds CIP2 Land and Other3 Total Costs Incurred0 % Complete4 Scheduled Completion Currie Hall ACE Los Angeles, CA University of Southern California 178 456 $ 5 0,400 $ 22,918 $ 290 $ 23,208 33% August 2016 U Club on 28th Off-campus Boulder, CO University of Colorado 100 400 52,200 13,528 9,920 23,448 20% August 2016 Fairview House ACE Indianapolis, IN Butler University 107 633 39,600 15,462 127 15,589 38% August 2016 U Club Sunnyside Off-campus Morgantown, WV West Virginia University 134 536 46,300 5 ,707 7,563 13,270 14% August 2016 Merwick Stanworth Phase II ACE Princeton, NJ Princeton University 198 379 48,300 7 ,672 801 8,473 15% Fall 20165 SUBTOTAL - 2016 DELIVERIES 717 2,404 $ 2 36,800 $ 6 5,287 $ 18,701 $ 83,988 Arizona State Univ. Res. Hall6 7 ACE Tempe, AZ Arizona State University 429 1,594 $ 1 07,800 $ - $ 2,458 $ 2,458 0% August 2017 U Club on Turner6 Off-campus Columbia, MO University of Missouri 182 718 6 9,100 - 15,031 15,031 0% August 2017 SUBTOTAL - 2017 DELIVERIES 611 2,312 $ 1 76,900 $ - $ 17,489 $ 17,489 PRESALE DEVELOPMENT PROJECT UNDER CONSTRUCTION Project Location Primary University Served Units Beds CIP2 Land and Other3 Total Costs Incurred0 % Complete4 Scheduled Completion Stadium Centre Phase II8 Pre-Sale Tallahassee, FL Florida State University 80 260 $ 26,450 $ 9 ,254 $ 9 ,520 $ 18,774 54% May 2016 OWNED DEVELOPMENT PIPELINE9 10 Project Project Type Location Primary University Served Approx. Targeted Beds Estimated Project Cost11 Targeted Completion University Pointe12 ACE Louisville, KY University of Louisville 532 $ 4 4,200 August 2016 UP at Metroplex Phase II Off-campus Binghamton, NY Binghamton University - SUNY 560 5 1,300 Fall 2017 NAU Phase IV ACE Flagstaff, AZ Northern Arizona University 620 54,700 Fall 2017 Carbondale Development Off-campus Carbondale, IL Southern Illinois University 650 32,100 TBD 2,362 $ 1 82,300 Transaction Structure Purchase Price As of September 30, 2015 TBD Anticipated Commencement Q1 2016 Q1 2016 Q4 2015 Estimated Project Cost As of September 30, 2015 1. The difference between the originally disclosed budget for this project of $170.7 million and the final project costs noted above of $155.6 million is due to a reimbursement from Drexel University at construction completion totaling $9.4 million related to the cost of constructing the project’s dining facility. The remaining difference is due to savings in capitalized interest and property taxes. 2. The total construction in progress (“CIP”) balance above excludes $8.0 million related to ongoing renovation projects at operating properties. 3. Consists of amounts incurred to purchase the land for off-campus development projects, as well as other development-related expenditures not included in CIP such as deposits, furniture, etc. 4. Based on costs incurred under the general construction contract as of September 30, 2015. 5. This community will serve faculty and staff members of Princeton University and, unlike student housing communities, this property is expected to stabilize in a manner consistent with a multi-family property during the first academic session. 6. These projects commenced demolition and abatement activities during the third quarter 2015, with full construction commencement anticipated during the fourth quarter 2015. 7. Estimated project cost excludes $11.8 million related to the cost of constructing the facility’s dining hall and academic space which will be funded by the University. 8. In conjunction with the purchase of Stadium Centre Phase I in July 2015 (see page 9), we entered into a presale agreement to purchase an adjacent property which will be completed in May 2016. We are obligated to purchase the property as long as certain construction completion deadlines and other closing conditions are met. The company is responsible for leasing, management, and initial operations of the project while the third-party developer retains development risk during the construction period. In accordance with accounting guidance, the company is including this property in its consolidated financial statements. 9. Does not include undeveloped land parcels in six university markets totaling $39.4 million. 10. Commencement of owned off-campus development projects is subject to final determination of feasibility, execution and closing on definitive agreements, municipal approval processes, fluctuations in the construction market, and current capital market conditions. ACE awards provide the company with the opportunity to exclusively negotiate with the subject universities. Commencement of ACE projects is subject to various levels of university board approval, final determination of feasibility, execution and closing on definitive agreements, municipal approval processes, fluctuations in the construction market, and current capital market conditions. 11. Estimated project costs include land and other predevelopment costs of $25.0million incurred as of September 30, 2015 for owned development pipeline projects. 12. Commenced construction during the third quarter 2015 under a reimbursement agreement with the University, with ground lease execution anticipated during the fourth quarter 2015. 10
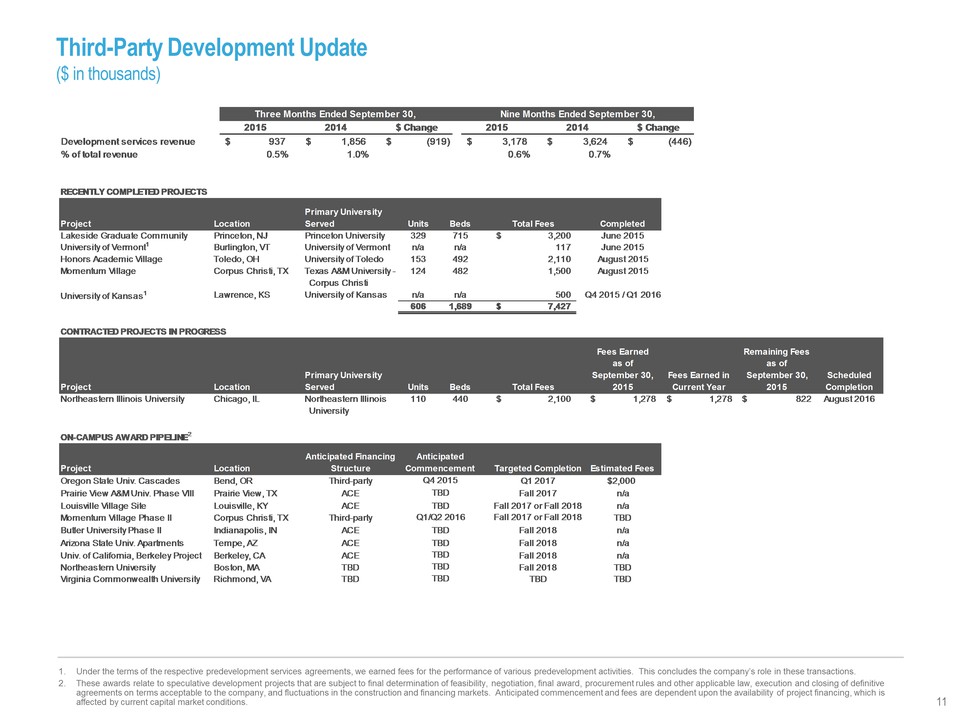
Third-Party Development Update ($ in thousands) RECENTLY COMPLETED PROJECTS Project Location Primary University Served Units Beds Total Fees Completed Lakeside Graduate Community Princeton, NJ Princeton University 329 715 $ 3 ,200 June 2015 University of Vermont1 Burlington, VT University of Vermont n/a n/a 1 17 June 2015 Honors Academic Village Toledo, OH University of Toledo 153 492 2 ,110 August 2015 Momentum Village Corpus Christi, TX Texas A&M University - Corpus Christi 124 482 1 ,500 August 2015 University of Kansas1 Lawrence, KS University of Kansas n/a n/a 5 00 Q4 2015 / Q1 2016 606 1,689 $ 7 ,427 CONTRACTED PROJECTS IN PROGRESS Project Location Primary University Served Units Beds Total Fees Fees Earned as of September 30, 2015 Fees Earned in Current Year Remaining Fees as of September 30, 2015 Scheduled Completion Northeastern Illinois University Chicago, IL Northeastern Illinois University 110 440 $ 2 ,100 $ 1,278 $ 1,278 $ 8 22 August 2016 ON-CAMPUS AWARD PIPELINE2 Project Location Anticipated Financing Structure Estimated Fees Oregon State Univ. Cascades Bend, OR Third-party $2,000 Prairie View A&M Univ. Phase VIII Prairie View, TX ACE n/a Louisville Village Site Louisville, KY ACE n/a Momentum Village Phase II Corpus Christi, TX Third-party TBD Butler University Phase II Indianapolis, IN ACE n/a Arizona State Univ. Apartments Tempe, AZ ACE n/a Univ. of California, Berkeley Project Berkeley, CA ACE n/a Northeastern University Boston, MA TBD TBD Virginia Commonwealth University Richmond, VA TBD TBD Q4 2015 Q1 2017 TBD TBD TBD TBD Fall 2018 TBD Fall 2018 Anticipated Commencement Targeted Completion TBD Fall 2018 TBD Fall 2017 or Fall 2018 Q1/Q2 2016 Fall 2017 or Fall 2018 TBD Fall 2018 Fall 2017 2015 2014 $ Change 2015 2014 $ Change Development services revenue $ 9 37 $ 1,856 $ (919) $ 3,178 $ 3,624 $ (446) % of total revenue 0.5% 1.0% 0.6% 0.7% Three Months Ended September 30, Nine Months Ended September 30, 1. Under the terms of the respective predevelopment services agreements, we earned fees for the performance of various predevelopment activities. This concludes the company’s role in these transactions. 2. These awards relate to speculative development projects that are subject to final determination of feasibility, negotiation, final award, procurement rules and other applicable law, execution and closing of definitive agreements on terms acceptable to the company, and fluctuations in the construction and financing markets. Anticipated commencement and fees are dependent upon the availability of project financing, which is affected by current capital market conditions. 11
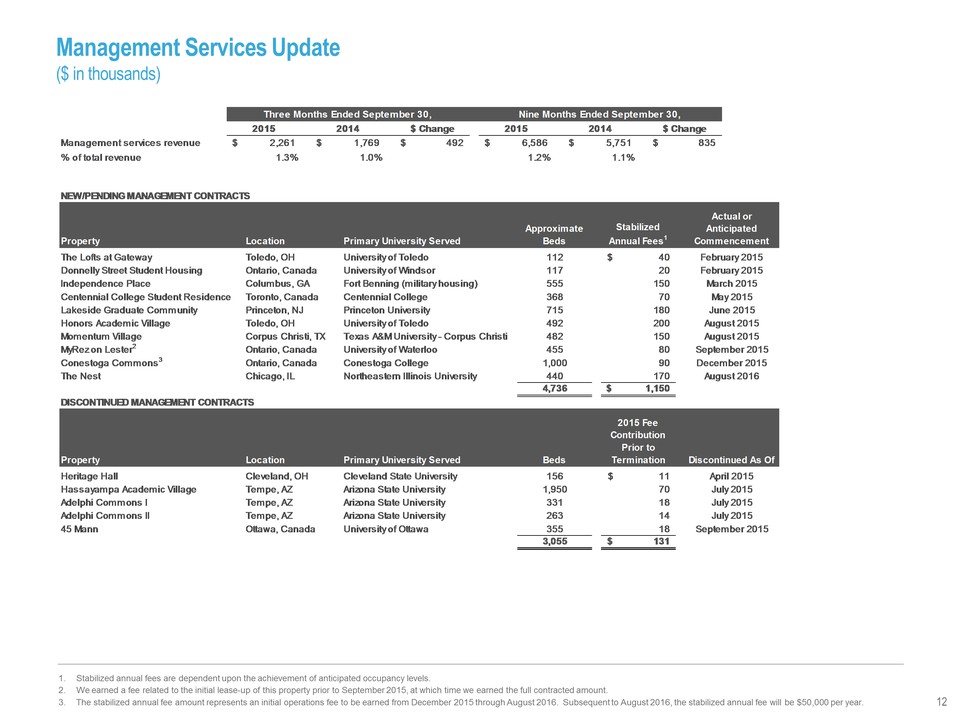
Management Services Update ($ in thousands) 2015 2014 $ Change 2015 2014 $ Change Management services revenue $ 2,261 $ 1,769 $ 4 92 $ 6,586 $ 5,751 $ 8 35 % of total revenue 1.3% 1.0% 1.2% 1.1% Three Months Ended September 30, Nine Months Ended September 30, 1. Stabilized annual fees are dependent upon the achievement of anticipated occupancy levels. 2. We earned a fee related to the initial lease-up of this property prior to September 2015, at which time we earned the full contracted amount. 3. The stabilized annual fee amount represents an initial operations fee to be earned from December 2015 through August 2016. Subsequent to August 2016, the stabilized annual fee will be $50,000 per year. 12 NEW/PENDING MANAGEMENT CONTRACTS Property Location Approximate Beds Stabilized Annual Fees1 Actual or Anticipated Commencement The Lofts at Gateway Toledo, OH University of Toledo 112 $ 40 February 2015 Donnelly Street Student Housing Ontario, Canada University of Windsor 117 2 0 February 2015 Independence Place Columbus, GA Fort Benning (military housing) 555 150 March 2015 Centennial College Student Residence Toronto, Canada Centennial College 368 7 0 May 2015 Lakeside Graduate Community Princeton, NJ Princeton University 715 180 June 2015 Honors Academic Village Toledo, OH University of Toledo 492 200 August 2015 Momentum Village Corpus Christi, TX Texas A&M University - Corpus Christi 482 150 August 2015 MyRez on Lester2 Ontario, Canada University of Waterloo 455 8 0 September 2015 Conestoga Commons3 Ontario, Canada Conestoga College 1,000 9 0 December 2015 The Nest Chicago, IL Northeastern Illinois University 440 170 August 2016 4,736 $ 1 ,150 DISCONTINUED MANAGEMENT CONTRACTS Property Location Beds 2015 Fee Contribution Prior to Termination Discontinued As Of Heritage Hall Cleveland, OH Cleveland State University 156 $ 1 1 April 2015 Hassayampa Academic Village Tempe, AZ Arizona State University 1,950 7 0 July 2015 Adelphi Commons I Tempe, AZ Arizona State University 331 1 8 July 2015 Adelphi Commons II Tempe, AZ Arizona State University 263 1 4 July 2015 45 Mann Ottawa, Canada University of Ottawa 355 1 8 September 2015 3,055 $ 1 31 12
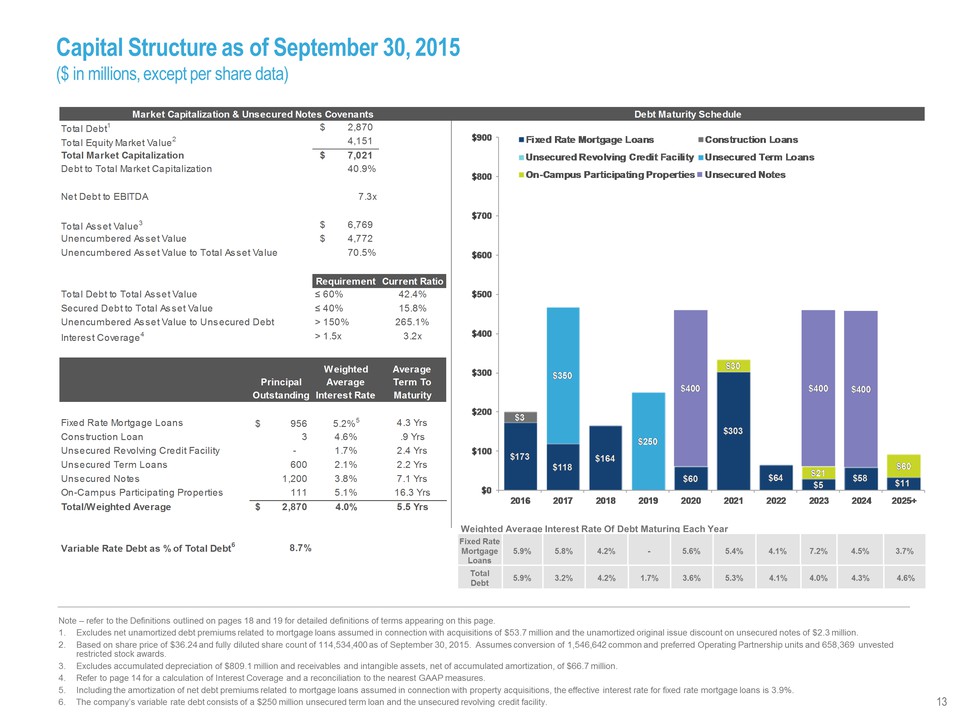
Capital Structure as of September 30, 2015 ($ in millions, except per share data) Weighted Average Interest Rate Of Debt Maturing Each Year Fixed Rate Mortgage Loans 5.9% 5.8% 4.2% - 5.6% 5.4% 4.1% 7.2% 4.5% 3.7% Total Debt 5.9% 3.2% 4.2% 1.7% 3.6% 5.3% 4.1% 4.0% 4.3% 4.6% Note – refer to the Definitions outlined on pages 18 and 19 for detailed definitions of terms appearing on this page. 1. Excludes net unamortized debt premiums related to mortgage loans assumed in connection with acquisitions of $53.7 million and the unamortized original issue discount on unsecured notes of $2.3 million. 2. Based on share price of $36.24 and fully diluted share count of 114,534,400 as of September 30, 2015. Assumes conversion of 1,546,642 common and preferred Operating Partnership units and 658,369 unvested restricted stock awards. 3. Excludes accumulated depreciation of $809.1 million and receivables and intangible assets, net of accumulated amortization, of $66.7 million. 4. Refer to page 14 for a calculation of Interest Coverage and a reconciliation to the nearest GAAP measures. 5. Including the amortization of net debt premiums related to mortgage loans assumed in connection with property acquisitions, the effective interest rate for fixed rate mortgage loans is 3.9%. 6. The company’s variable rate debt consists of a $250 million unsecured term loan and the unsecured revolving credit facility. 13 Market Capitalization & Unsecured Notes Covenants Total Debt1 $2,870 Total Equity Market Value2 4,151 Total Market Capitalization $7,021 Debt to Total Market Capitalization 40.9% Net Debt to EBITDA 7.3x Total Asset Value3 $6,769 Unencumbered Asset Value $4,772 Unencumbered Asset Value to Total Asset Value 7.5% Requirement Current Ratio Total Debt to Total Asset Value Secured Debt to Total Asset Value Unencumbered Asset Value to Unsecured Debt Interest Coverage4 60% 42.4% 40% 15.8% 150% 265.1% 1.5x 3.2x Principal Outstanding Weighted Average Interest Rate Average Term to Maturity Fixed Rate Mortgage Loans Construction Loan Unsecured Revolving Credit Facility Unsecured Term Loans Unsecured Notes On-Campus Participating Properties Total/Weighted Average Variable Rate Debt as % of Total Debt6 $956 3 – 600 1,200 111 $2,870 5.2%5 4.6% 1.7% 2.1% 3.8% 5.1% 4.0% 4.3 Yrs .9 Yrs 2.4 Yrs 2.2 Yrs 7.1 Yrs 16.3 Yrs 5.5 Yrs 8.7% Debt Maturity Schedule Fixed Rate Mortgage Loans Construction Loans Unsecured Revolving Credit Facility Unsecured Term Loans On-Campus Participating Properties Unsecured Notes $900 $800 $700 $600 $500 $400 $300 $200 $100 $0 2016 2017 2018 2019 2020 2021 2022 2023 2024 2025+ $173 $3 $118 $350 $164 $250 $400 $60 $30 $303 $64 $21 $5 $400 $58 $60 $11
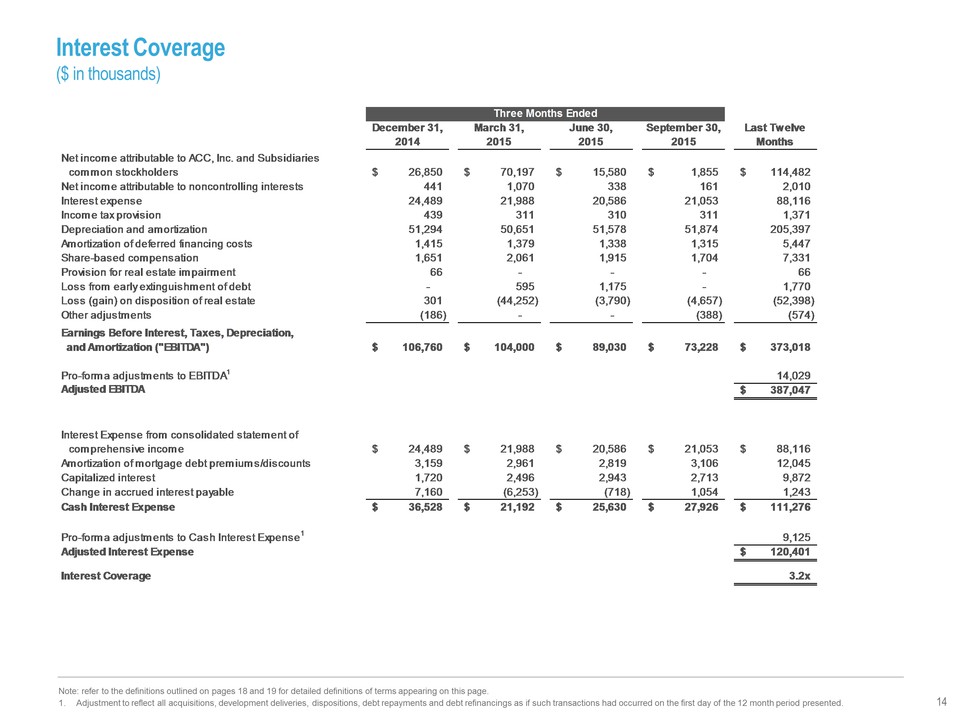
Interest Coverage ($ in thousands) 14 December 31, 2014 March 31, 2015 June 30, 2015 September 30, 2015 Last Twelve Months Net income attributable to ACC, Inc. and Subsidiaries common stockholders $ 26,850 $ 70,197 $ 15,580 $ 1,855 $ 114,482 Net income attributable to noncontrolling interests 441 1,070 338 161 2,010 Interest expense 24,489 21,988 20,586 21,053 88,116 Income tax provision 439 311 310 311 1,371 Depreciation and amortization 51,294 50,651 51,578 51,874 205,397 Amortization of deferred financing costs 1 ,415 1,379 1,338 1,315 5,447 Share-based compensation 1 ,651 2,061 1,915 1,704 7,331 Provision for real estate impairment 66 - - - 66 Loss from early extinguishment of debt - 595 1,175 - 1,770 Loss (gain) on disposition of real estate 301 (44,252) (3,790) (4,657) (52,398) Other adjustments ( 186) - - (388) (574) Earnings Before Interest, Taxes, Depreciation, and Amortization ("EBITDA") $ 1 06,760 $ 104,000 $ 89,030 $ 73,228 $ 373,018 Pro-forma adjustments to EBITDA1 14,029 Adjusted EBITDA $ 3 87,047 Interest Expense from consolidated statement of comprehensive income $ 24,489 $ 21,988 $ 20,586 $ 21,053 $ 88,116 Amortization of mortgage debt premiums/discounts 3 ,159 2,961 2,819 3,106 12,045 Capitalized interest 1 ,720 2,496 2,943 2,713 9,872 Change in accrued interest payable 7 ,160 (6,253) ( 718) 1,054 1,243 Cash Interest Expense $ 36,528 $ 21,192 $ 25,630 $ 27,926 $ 111,276 Pro-forma adjustments to Cash Interest Expense1 9 ,125 Adjusted Interest Expense $ 1 20,401 Interest Coverage 3.2x Three Months Ended Note: refer to the definitions outlined on pages 18 and 19 for detailed definitions of terms appearing on this page. 1. Adjustment to reflect all acquisitions, development deliveries, dispositions, debt repayments and debt refinancings as if such transactions had occurred on the first day of the 12 month period presented.
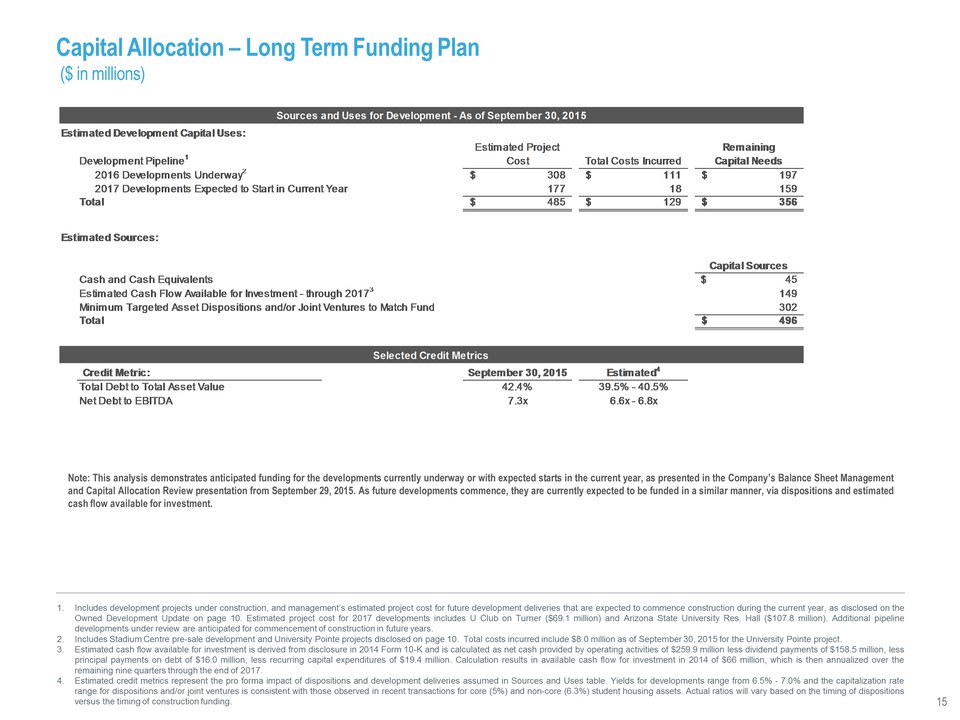
Capital Allocation – Long Term Funding Plan ($ in millions) 15 Note: This analysis demonstrates anticipated funding for the developments currently underway or with expected starts in the current year, as presented in the Company’s Balance Sheet Management and Capital Allocation Review presentation from September 29, 2015. As future developments commence, they are currently expected to be funded in a similar manner, via dispositions and estimated cash flow available for investment. Estimated Development Capital Uses: Development Pipeline1 Estimated Project Cost Total Costs Incurred Remaining Capital Needs 2016 Developments Underway2 $ 308 $ 111 $ 197 2017 Developments Expected to Start in Current Year 1 77 1 8 159 Total $ 485 $ 129 $ 356 Estimated Sources: Capital Sources Cash and Cash Equivalents $ 4 5 Estimated Cash Flow Available for Investment - through 20173 1 49 Minimum Targeted Asset Dispositions and/or Joint Ventures to Match Fund 3 02 Total $ 496 Credit Metric: September 30, 2015 Estimated4 Total Debt to Total Asset Value 42.4% 39.5% - 40.5% Net Debt to EBITDA 7.3x 6.6x - 6.8x Sources and Uses for Development - As of September 30, 2015 Selected Credit Metrics 1. Includes development projects under construction, and management’s estimated project cost for future development deliveries that are expected to commence construction during the current year, as disclosed on the Owned Development Update on page 10. Estimated project cost for 2017 developments includes U Club on Turner ($69.1 million) and Arizona State University Res. Hall ($107.8 million). Additional pipeline developments under review are anticipated for commencement of construction in future years. 2. Includes Stadium Centre pre-sale development and University Pointe projects disclosed on page 10. Total costs incurred include $8.0 million as of September 30, 2015 for the University Pointe project. 3. Estimated cash flow available for investment is derived from disclosure in 2014 Form 10-K and is calculated as net cash provided by operating activities of $259.9 million less dividend payments of $158.5 million, less principal payments on debt of $16.0 million, less recurring capital expenditures of $19.4 million. Calculation results in available cash flow for investment in 2014 of $66 million, which is then annualized over the remaining nine quarters through the end of 2017. 4. Estimated credit metrics represent the pro forma impact of dispositions and development deliveries assumed in Sources and Uses table. Yields for developments range from 6.5% - 7.0% and the capitalization rate range for dispositions and/or joint ventures is consistent with those observed in recent transactions for core (5%) and non-core (6.3%) student housing assets. Actual ratios will vary based on the timing of dispositions versus the timing of construction funding.
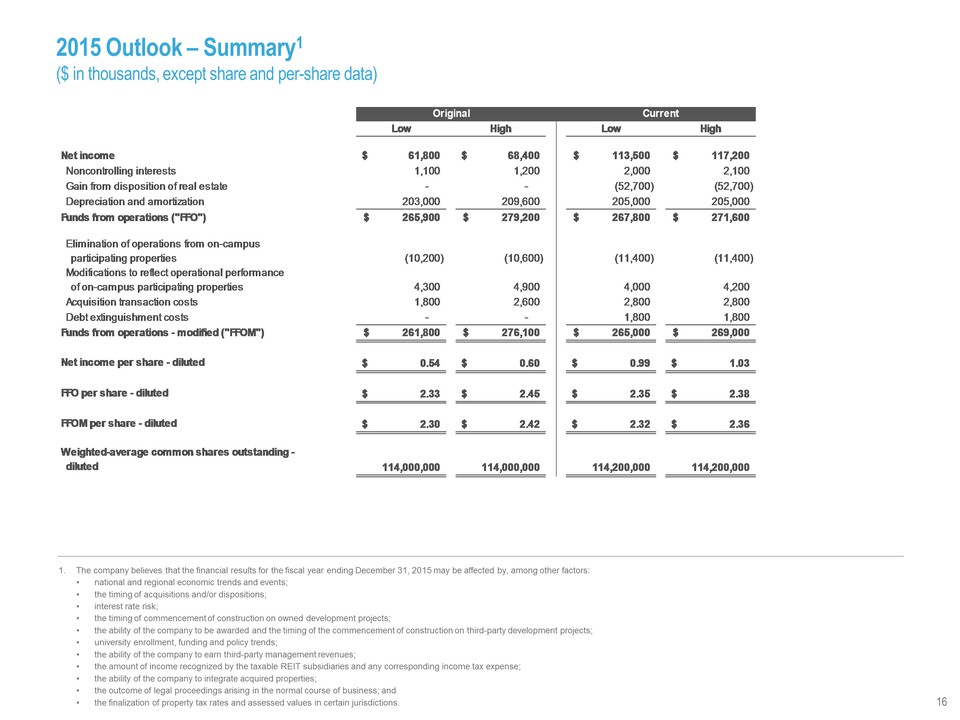
2015 Outlook – Summary1 ($ in thousands, except share and per-share data) 1. The company believes that the financial results for the fiscal year ending December 31, 2015 may be affected by, among other factors: • national and regional economic trends and events; • the timing of acquisitions and/or dispositions; • interest rate risk; • the timing of commencement of construction on owned development projects; • the ability of the company to be awarded and the timing of the commencement of construction on third-party development projects; • university enrollment, funding and policy trends; • the ability of the company to earn third-party management revenues; • the amount of income recognized by the taxable REIT subsidiaries and any corresponding income tax expense; • the ability of the company to integrate acquired properties; • the outcome of legal proceedings arising in the normal course of business; and • the finalization of property tax rates and assessed values in certain jurisdictions. 16 Low High Low High Net income $ 6 1,800 $ 68,400 $ 113,500 $ 117,200 Noncontrolling interests 1,100 1 ,200 2,000 2 ,100 Gain from disposition of real estate - - (52,700) (52,700) Depreciation and amortization 203,000 209,600 205,000 205,000 Funds from operations ("FFO") $ 2 65,900 $ 279,200 $ 267,800 $ 271,600 Elimination of operations from on-campus participating properties (10,200) (10,600) (11,400) (11,400) Modifications to reflect operational performance of on-campus participating properties 4,300 4,900 4,000 4,200 Acquisition transaction costs 1,800 2,600 2,800 2,800 Debt extinguishment costs - - 1,800 1,800 Funds from operations - modified ("FFOM") $ 261,800 $ 276,100 $ 265,000 $ 269,000 Net income per share - diluted $ 0.54 $ 0.60 $ 0.99 $ 1.03 FFO per share - diluted $ 2.33 $ 2.45 $ 2.35 $ 2.38 FFOM per share - diluted $ 2.30 $ 2.42 $ 2.32 $ 2.36 Weighted-average common shares outstanding - diluted 114,000,000 114,000,000 114,200,000 114,200,000 Original Current 16
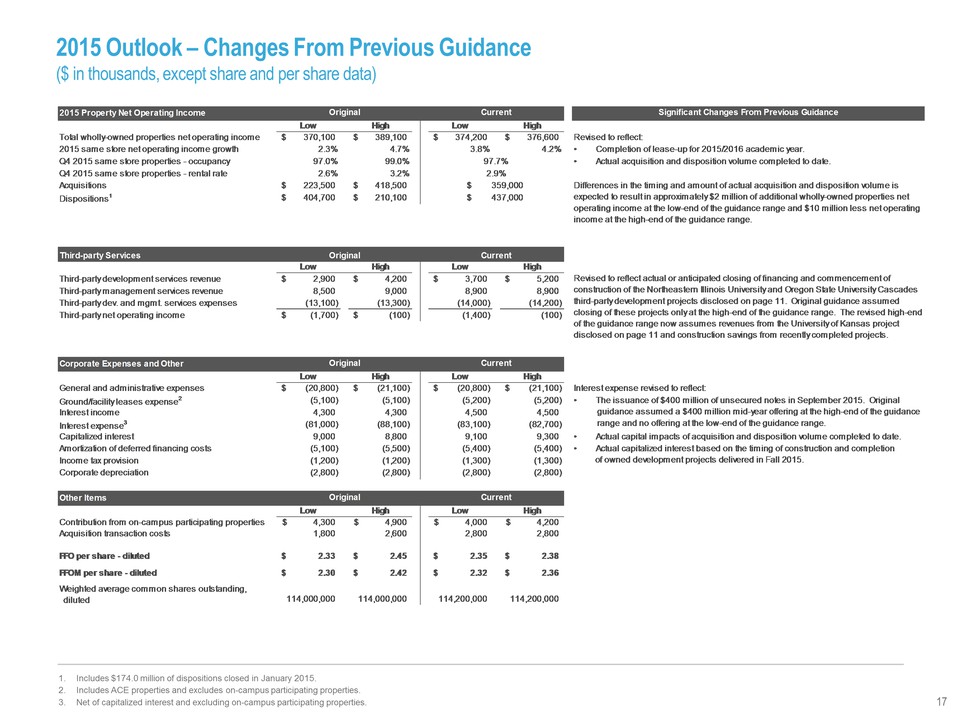
2015 Outlook – Changes From Previous Guidance ($ in thousands, except share and per share data) 1. Includes $174.0 million of dispositions closed in January 2015. 2. Includes ACE properties and excludes on-campus participating properties. 3. Net of capitalized interest and excluding on-campus participating properties. 17 2015 Property Net Operating Income Low High Low High $ 3 70,100 $ 389,100 $ 374,200 $ 376,600 Revised to reflect: 2.3% 4.7% 3.8% 4.2% 97.0% 99.0% 2.6% 3.2% $ 2 23,500 $ 418,500 $ 4 04,700 $ 210,100 Third-party Services Low High Low High Third-party development services revenue $ 2,900 $ 4,200 $ 3,700 $ 5,200 Third-party management services revenue 8 ,500 9,000 8,900 8,900 Third-party dev. and mgmt. services expenses (13,100) (13,300) (14,000) (14,200) Third-party net operating income $ (1,700) $ (100) (1,400) ( 100) Corporate Expenses and Other Low High Low High General and administrative expenses $ ( 20,800) $ (21,100) $ (20,800) $ (21,100) Ground/facility leases expense2 (5,100) (5,100) (5,200) (5,200) Interest income 4 ,300 4,300 4,500 4,500 Interest expense3 ( 81,000) (88,100) (83,100) (82,700) Capitalized interest 9 ,000 8,800 9,100 9,300 Amortization of deferred financing costs (5,100) (5,500) (5,400) (5,400) Income tax provision (1,200) (1,200) (1,300) (1,300) Corporate depreciation (2,800) (2,800) (2,800) (2,800) Other Items Low High Low High Contribution from on-campus participating properties $ 4,300 $ 4,900 $ 4,000 $ 4,200 Acquisition transaction costs 1 ,800 2,600 2,800 2,800 FFO per share - diluted $ 2 .33 $ 2.45 $ 2.35 $ 2.38 FFOM per share - diluted $ 2 .30 $ 2.42 $ 2.32 $ 2.36 114,000,000 114,000,000 114,200,000 114,200,000 • Completion of lease-up for 2015/2016 academic year. Differences in the timing and amount of actual acquisition and disposition volume is expected to result in approximately $2 million of additional wholly-owned properties net operating income at the low-end of the guidance range and $10 million less net operating income at the high-end of the guidance range. • Actual acquisition and disposition volume completed to date. Original Current Dispositions1 97.7% 2.9% $ 359,000 Weighted average common shares outstanding, diluted Current Original Current Original Original Current Total wholly-owned properties net operating income Q4 2015 same store properties – occupancy Q4 2015 same store properties - rental rate 2015 same store net operating income growth Significant Changes From Previous Guidance $ 437,000 • Actual capital impacts of acquisition and disposition volume completed to date. • The issuance of $400 million of unsecured notes in September 2015. Original guidance assumed a $400 million mid-year offering at the high-end of the guidance range and no offering at the low-end of the guidance range. • Actual capitalized interest based on the timing of construction and completion of owned development projects delivered in Fall 2015. Interest expense revised to reflect: Revised to reflect actual or anticipated closing of financing and commencement of construction of the Northeastern Illinois University and Oregon State University Cascades third-party development projects disclosed on page 11. Original guidance assumed closing of these projects only at the high-end of the guidance range. The revised high-end of the guidance range now assumes revenues from the University of Kansas project disclosed on page 11 and construction savings from recently completed projects.
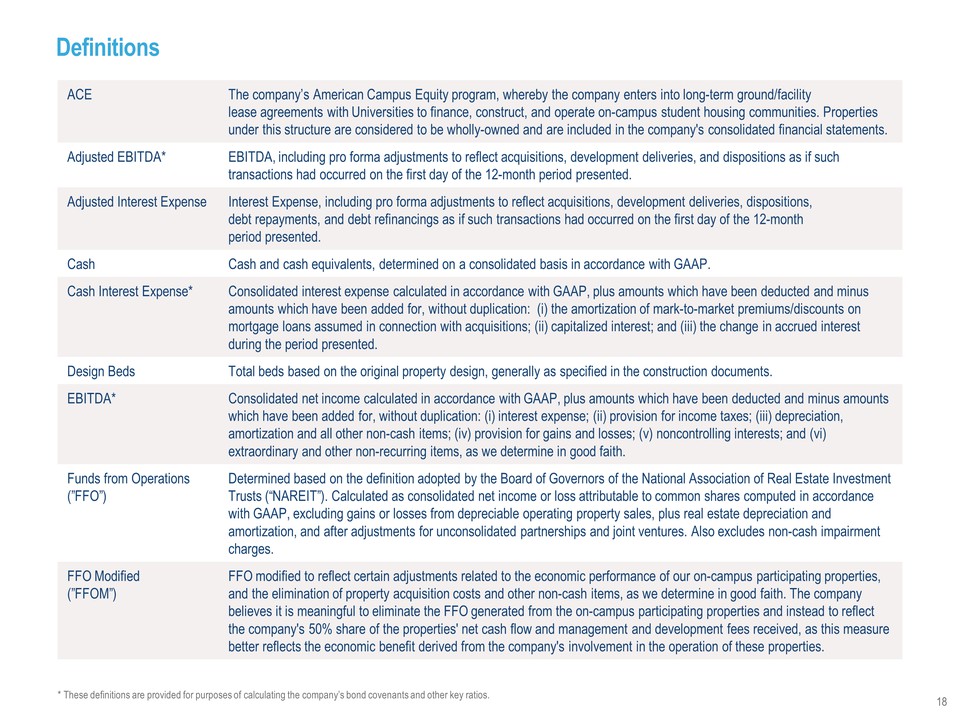
Definitions ACE The company’s American Campus Equity program, whereby the company enters into long-term ground/facility lease agreements with Universities to finance, construct, and operate on-campus student housing communities. Properties under this structure are considered to be wholly-owned and are included in the company's consolidated financial statements. Adjusted EBITDA* EBITDA, including pro forma adjustments to reflect acquisitions, development deliveries, and dispositions as if such transactions had occurred on the first day of the 12-month period presented. Adjusted Interest Expense Interest Expense, including pro forma adjustments to reflect acquisitions, development deliveries, dispositions, debt repayments, and debt refinancings as if such transactions had occurred on the first day of the 12-month period presented. Cash Cash and cash equivalents, determined on a consolidated basis in accordance with GAAP. Cash Interest Expense* Consolidated interest expense calculated in accordance with GAAP, plus amounts which have been deducted and minus amounts which have been added for, without duplication: (i) the amortization of mark-to-market premiums/discounts on mortgage loans assumed in connection with acquisitions; (ii) capitalized interest; and (iii) the change in accrued interest during the period presented. Design Beds Total beds based on the original property design, generally as specified in the construction documents. EBITDA* Consolidated net income calculated in accordance with GAAP, plus amounts which have been deducted and minus amounts which have been added for, without duplication: (i) interest expense; (ii) provision for income taxes; (iii) depreciation, amortization and all other non-cash items; (iv) provision for gains and losses; (v) noncontrolling interests; and (vi) extraordinary and other non-recurring items, as we determine in good faith. Funds from Operations (”FFO”) Determined based on the definition adopted by the Board of Governors of the National Association of Real Estate Investment Trusts (“NAREIT”). Calculated as consolidated net income or loss attributable to common shares computed in accordance with GAAP, excluding gains or losses from depreciable operating property sales, plus real estate depreciation and amortization, and after adjustments for unconsolidated partnerships and joint ventures. Also excludes non-cash impairment charges. FFO Modified (”FFOM”) FFO modified to reflect certain adjustments related to the economic performance of our on-campus participating properties, and the elimination of property acquisition costs and other non-cash items, as we determine in good faith. The company believes it is meaningful to eliminate the FFO generated from the on-campus participating properties and instead to reflect the company's 50% share of the properties' net cash flow and management and development fees received, as this measure better reflects the economic benefit derived from the company's involvement in the operation of these properties. * These definitions are provided for purposes of calculating the company’s bond covenants and other key ratios. 18
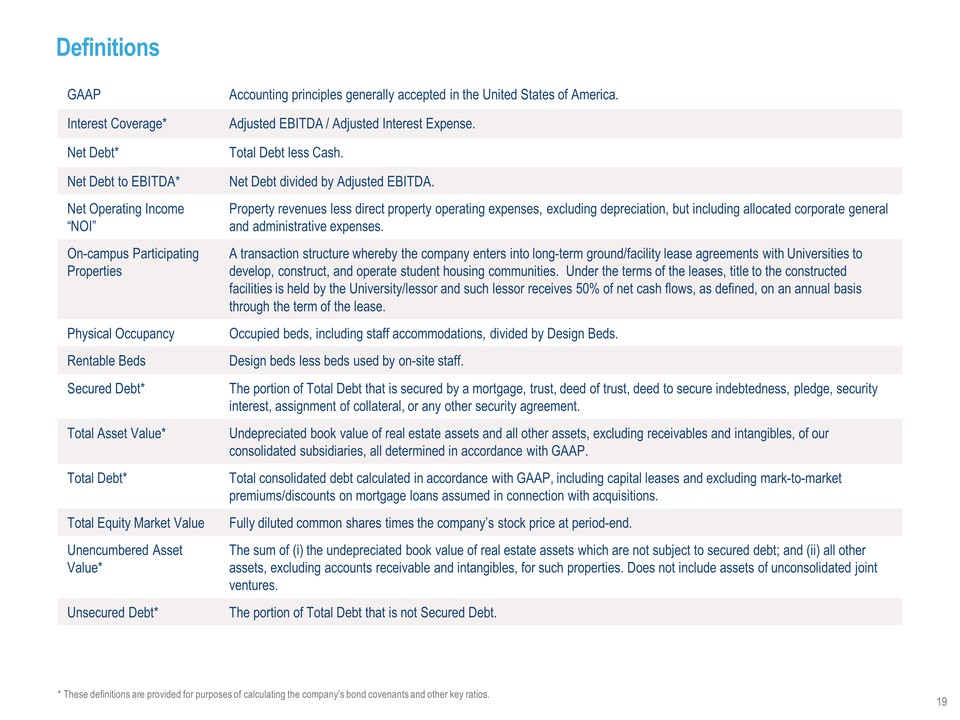
Definitions GAAP Accounting principles generally accepted in the United States of America. Interest Coverage* Adjusted EBITDA / Adjusted Interest Expense. Net Debt* Total Debt less Cash. Net Debt to EBITDA* Net Debt divided by Adjusted EBITDA. Net Operating Income “NOI” Property revenues less direct property operating expenses, excluding depreciation, but including allocated corporate general and administrative expenses. On-campus Participating Properties A transaction structure whereby the company enters into long-term ground/facility lease agreements with Universities to develop, construct, and operate student housing communities. Under the terms of the leases, title to the constructed facilities is held by the University/lessor and such lessor receives 50% of net cash flows, as defined, on an annual basis through the term of the lease. Physical Occupancy Occupied beds, including staff accommodations, divided by Design Beds. Rentable Beds Design beds less beds used by on-site staff. Secured Debt* The portion of Total Debt that is secured by a mortgage, trust, deed of trust, deed to secure indebtedness, pledge, security interest, assignment of collateral, or any other security agreement. Total Asset Value* Undepreciated book value of real estate assets and all other assets, excluding receivables and intangibles, of our consolidated subsidiaries, all determined in accordance with GAAP. Total Debt* Total consolidated debt calculated in accordance with GAAP, including capital leases and excluding mark-to-market premiums/discounts on mortgage loans assumed in connection with acquisitions. Total Equity Market Value Fully diluted common shares times the company’s stock price at period-end. Unencumbered Asset Value* The sum of (i) the undepreciated book value of real estate assets which are not subject to secured debt; and (ii) all other assets, excluding accounts receivable and intangibles, for such properties. Does not include assets of unconsolidated joint ventures. Unsecured Debt* The portion of Total Debt that is not Secured Debt. * These definitions are provided for purposes of calculating the company’s bond covenants and other key ratios. 19
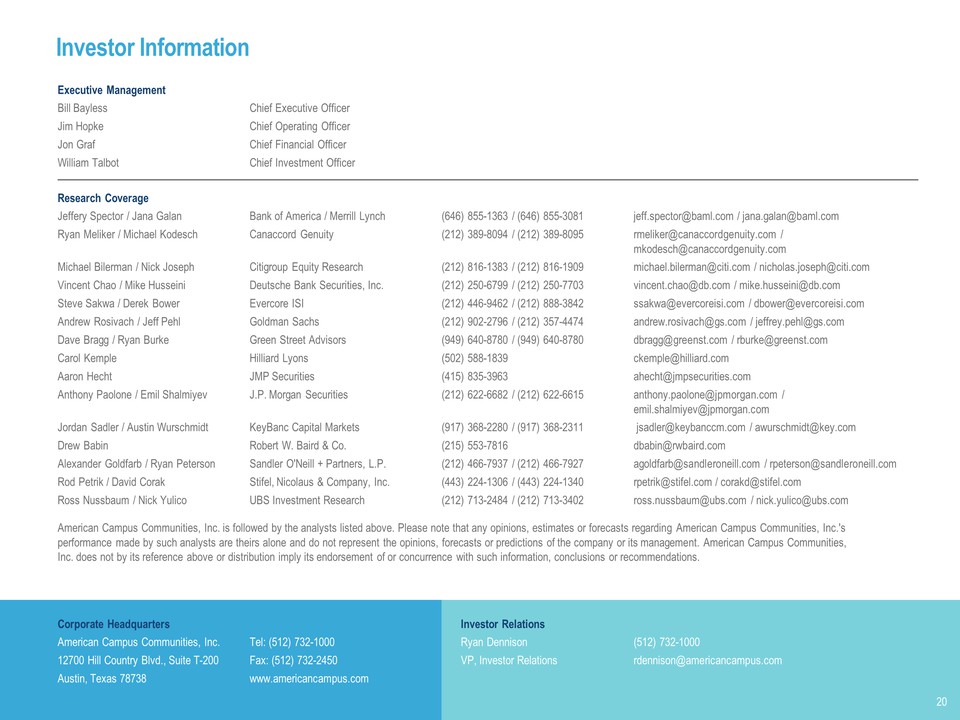
Investor Information Corporate Headquarters Investor Relations American Campus Communities, Inc. Tel: (512) 732-1000 Ryan Dennison (512) 732-1000 12700 Hill Country Blvd., Suite T-200 Fax: (512) 732-2450 VP, Investor Relations rdennison@americancampus.com Austin, Texas 78738 www.americancampus.comExecutive Management Bill Bayless Chief Executive Officer Jim Hopke Chief Operating Officer Jon Graf Chief Financial Officer William Talbot Chief Investment Officer Research Coverage Jeffery Spector / Jana Galan Bank of America / Merrill Lynch (646) 855-1363 / (646) 855-3081 jeff.spector@baml.com / jana.galan@baml.com Ryan Meliker / Michael Kodesch Canaccord Genuity (212) 389-8094 / (212) 389-8095 rmeliker@canaccordgenuity.com /mkodesch@canaccordgenuity.com Michael Bilerman / Nick Joseph Citigroup Equity Research (212) 816-1383 / (212) 816-1909 michael.bilerman@citi.com / nicholas.joseph@citi.com Vincent Chao / Mike Husseini Deutsche Bank Securities, Inc. (212) 250-6799 / (212) 250-7703 vincent.chao@db.com / mike.husseini@db.com Steve Sakwa / Derek Bower Evercore ISI (212) 446-9462 / (212) 888-3842 ssakwa@evercoreisi.com / bower@evercoreisi.com Andrew Rosivach / Jeff Pehl Goldman Sachs (212) 902-2796 / (212) 357-4474 andrew.rosivach@gs.com / jeffrey.pehl@gs.com Dave Bragg / Ryan Burke Green Street Advisors (949) 640-8780 / (949) 640-8780 dbragg@greenst.com / rburke@greenst.com Carol Kemple Hilliard Lyons (502) 588-1839 ckemple@hilliard.com Aaron Hecht JMP Securities (415) 835-3963 ahecht@jmpsecurities.com Anthony Paolone / Emil Shalmiyev J.P. Morgan Securities (212) 622-6682 / (212) 622-6615 anthony.paolone@jpmorgan.com / emil.shalmiyev@jpmorgan.com Jordan Sadler / Austin Wurschmidt KeyBanc Capital Markets (917) 368-2280 / (917) 368-2311 jsadler@keybanccm.com / awurschmidt@key.com Drew Babin Robert W. Baird & Co. (215) 553-7816 dbabin@rwbaird.com Alexander Goldfarb / Ryan Peterson Sandler O'Neill + Partners, L.P. (212) 466-7937 / (212) 466-7927 agoldfarb@sandleroneill.com / rpeterson@sandleroneill.com Rod Petrik / David Corak Stifel, Nicolaus & Company, Inc. (443) 224-1306 / (443) 224-1340 rpetrik@stifel.com / corakd@stifel.com Ross Nussbaum / Nick Yulico UBS Investment Research (212) 713-2484 / (212) 713-3402 ross.nussbaum@ubs.com / nick.yulico@ubs.com American Campus Communities, Inc. is followed by the analysts listed above. Please note that any opinions, estimates or forecasts regarding American Campus Communities, Inc.'s performance made by such analysts are theirs alone and do not represent the opinions, forecasts or predictions of the company or its management. American Campus Communities, Inc. does not by its reference above or distribution imply its endorsement of or concurrence with such information, conclusions or recommendations. 20
Forward-looking Statements In addition to historical information, this supplemental package contains forward-looking statements under the federal securities law. These statements are based on current expectations, estimates and projections about the industry and markets in which American Campus operates, management's beliefs, and assumptions made by management. Forward-looking statements are not guarantees of future performance and involve certain risks and uncertainties, which are difficult to predict.