Attached files
| file | filename |
|---|---|
| 8-K - INVESTOR PRESENTATION 8-K - PRA GROUP INC | investorpresentation8-k.htm |

Investor Presentation September 2015
Statements herein, other than statements of historical fact, are forward-looking statements, which are based on our current beliefs, projections, assumptions and expectations concerning future operations and financial performance. Such statements involve uncertainties and risks, some of which are not currently known to us, and may be superseded by future events that could cause actual results to differ materially from those expressed or implied herein. You are cautioned not to place undue reliance on forward-looking statements, which speak only as of today, and are qualified in their entirety by these cautionary statements. Information regarding risk factors and other information that could change our projections or impact our actual results can be found in our most recent Annual Report on Form 10-K and in subsequent public filings, and should be considered in evaluating the forward looking statements herein. Except as required by law, we assume no obligation to update or revise these statements to reflect changes in events, conditions or circumstances on which any such forward-looking statements are based, in whole or in part. About Forward-Looking Statements 2

Company Overview What We Do Purchase defaulted receivables and manage collection efforts Purchase insolvent consumer accounts, both secured and unsecured Provide fee-based services 1 2 3 What Sets Us Apart Analytical and operational excellence: deep data set, advanced analytics and scoring Track record of success: Management has guided company for 20 years through multiple cycles Customer-centric 1 2 3 3

Today’s PRA Group – A Global Debt Buyer Own portfolios in 17 countries 3,800 employees worldwide Invested $1.47 billion in 2014 including the Aktiv Kapital acquisition $1.4 billion in cash collections in 2014 4

Successfully Managed Through Multiple Economic Cycles $17 $31 $53 $81 $120 $161 $205 $261 $298 $383 $433 $592 $762 $971 $1,214 $1,444 1999 2000 2001 2002 2003 2004 2005 2006 2007 2008 2009 2010 2011 2012 2013 2014 Cash Receipts ($ in millions) U.S. Recession U.S. Recession 5

Second Quarter 2015 Results Q2 2015 Q2 2014(a) Cash Collections $390 million $319 million 22% % change Revenues $237 million $197 million 20% Net Income $51.4 million $43.8 million 17% Diluted EPS $1.06 $0.87 22% Investment $208 million $109 million 91% Income from Operations $88.9 million $76.5 million 16% (a) Q2 2014 excludes the impact of transaction costs and a foreign exchange loss associated with the purchase of Aktiv Kapital. A reconciliation of this non-GAAP number to GAAP can be found at the end of this presentation. 6

Allowance Charges are Normal Course of Business 0.0% 1.0% 2.0% 3.0% 4.0% 5.0% $0 $2 $4 $6 $8 $10 $12 Q1 2008 Q2 2008 Q3 2008 Q4 2008 Q1 2009 Q2 2009 Q3 2009 Q4 2009 Q1 2010 Q2 2010 Q3 2010 Q4 2010 Q1 2011 Q2 2011 Q3 2011 Q4 2011 Q1 2012 Q2 2012 Q3 2012 Q4 2012 Q1 2013 Q2 2013 Q3 2013 Q4 2013 Q1 2014 Q2 2014 Q3 2014 Q4 2014 Q1 2015 Q2 2015 Allowance Charges Allowances Charges as % of NFR Remain low as a % of Net Finance Receivables 7 Excludes allowance reversals ($ in millions)

Goal is to generate more income for each $1 of cash collected Utilize analytics and activity costing to produce ROI driven strategies Larger gross cash multiple does not necessarily equate to increased profitability Focus is on Net IRR, Not Gross Cash Multiple
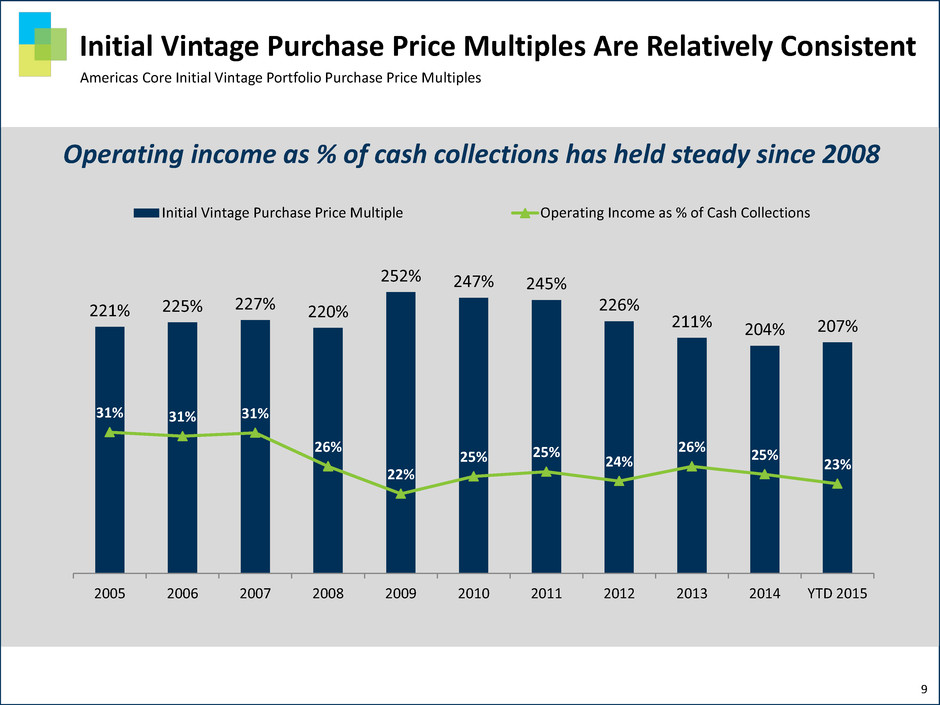
Initial Vintage Purchase Price Multiples Are Relatively Consistent 9 221% 225% 227% 220% 252% 247% 245% 226% 211% 204% 207% 31% 31% 31% 26% 22% 25% 25% 24% 26% 25% 23% 10% 20% 30% 40% 50% 60% 0% 50% 100% 150% 200% 250% 300% 2005 2006 2007 2008 2009 2010 2011 2012 2013 2014 YTD 2015 Initial Vintage Purchase Price Multiple Operating Income as % of Cash Collections Operating income as % of cash collections has held steady since 2008 Americas Core Initial Vintage Portfolio Purchase Price Multiples
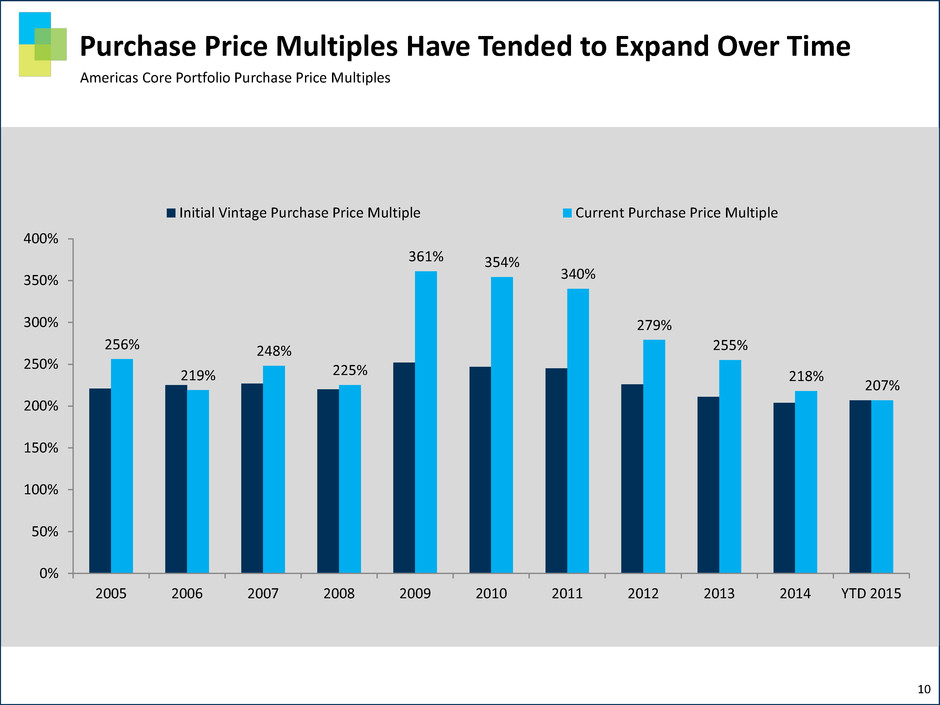
Purchase Price Multiples Have Tended to Expand Over Time 10 Americas Core Portfolio Purchase Price Multiples 256% 219% 248% 225% 361% 354% 340% 279% 255% 218% 207% 0% 50% 100% 150% 200% 250% 300% 350% 400% 2005 2006 2007 2008 2009 2010 2011 2012 2013 2014 YTD 2015 Initial Vintage Purchase Price Multiple Current Purchase Price Multiple

175% 225% 275% 325% 375% 2005 2006 2007 2008 2009 2010 2011 2012 2013 2014 2005 2006 2007 2008 2009 2010 2011 2012 2013 2014 Purchase Price Multiples Have Tended to Expand Over Time 11 Vintages Purchase Price Multiple by Year Americas Core Portfolio Purchase Price Multiples

Investment Has Grown Consistently $62 $61 $150 $112 $264 $280 $289 $367 $408 $542 $657 $1,468 ~$621 2003 2004 2005 2006 2007 2008 2009 2010 2011 2012 2013 2014 Q2 2015 (a) Includes finance receivables associated with the Mackenzie Hall acquisition (b) Includes finance receivables associated with the Aktiv Kapital acquisition and investment in securitized fund in Poland (c) Includes investment in securitized fund in Poland and ~$200 million purchase in Europe that was signed in Q2 but funded in Q3 (a) (b) (c) 12 ($ in millions)

Estimated Remaining Collections Have Grown Consistently $0 $1,000 $2,000 $3,000 $4,000 $5,000 2003 2004 2005 2006 2007 2008 2009 2010 2011 2012 2013 2014 Q2 2015 $557M Insolvency $4,191M Core(a) ($ in millions) (a) Includes the estimated remaining collections associated with investment in the securitized fund in Poland $4.7 Billion(a) in ERC Worldwide 13

United States $2,846.1 British Isles $530.6 Central Europe $553.5 Southern Europe $370.0 Northern Europe $379.0 Other Americas $68.4 ERC is Diversified ($ in millions) (a) (a) Includes the estimated remaining collections associated with investment in the securitized fund in Poland 14

Balance Sheet Provides Flexibility for Capital Needs 1.70 2.24 2.40 3.71 4.74 6.76 1.72 6.17 2.15 4.52 3.07 7.56 PRA Company A Company B Company C Company D Company E Debt to Shareholders' Equity - Adjusted Debt to TTM EBITDA - Adjusted (a) (a) A reconciliation of these non-GAAP number to GAAP can be found at the end of this presentation. 15 PRA Group versus Global Industry at June 30, 2015

Opportunities for Growth As U.S. consumer lending thaws and sellers return to the market - well positioned to capture our market share of receivable sales Industry adapting to OCC guidelines on receivable sales creating barriers to entry in U.S. Increase market share in select countries where we currently operate Identify acquisition and organic growth opportunities in both new geographies and products 16

17

GAAP to non-GAAP Reconciliation Use of Non-GAAP Financial Measures Management believes that the presentation of certain financial information in this presentation excluding the costs associated with the Aktiv Kapital acquisition and foreign exchange losses that were recorded during the three months ended June 30, 2014, which is non-GAAP financial information, is useful to investors and improves the comparability of the Company’s ongoing operational results between periods. The non-GAAP information should be considered in addition to, not as a substitute for, financial information prepared in accordance with GAAP. 18
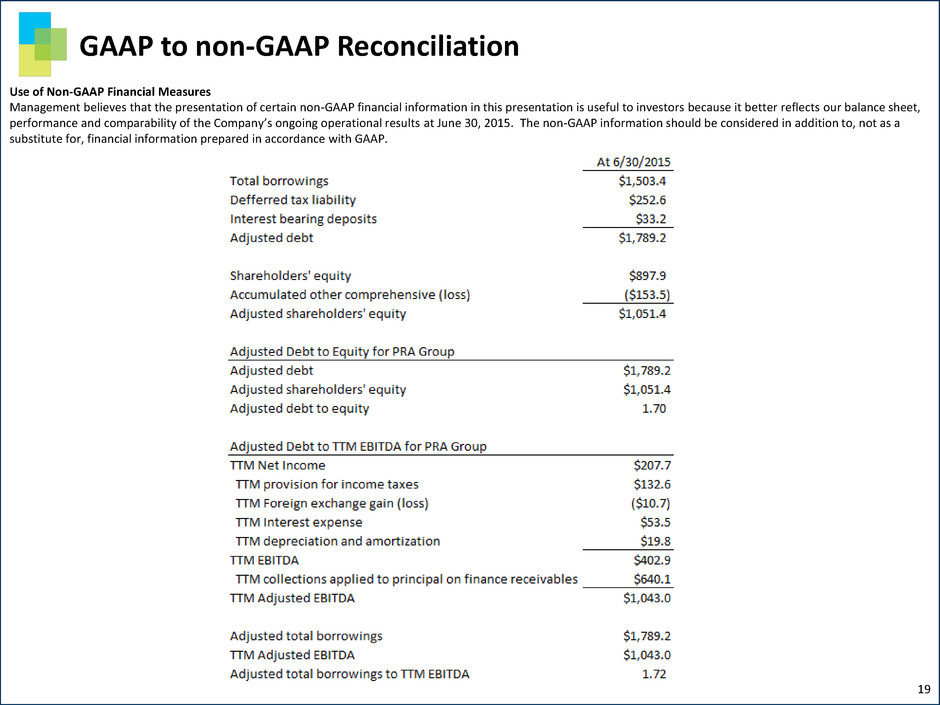
GAAP to non-GAAP Reconciliation Use of Non-GAAP Financial Measures Management believes that the presentation of certain non-GAAP financial information in this presentation is useful to investors because it better reflects our balance sheet, performance and comparability of the Company’s ongoing operational results at June 30, 2015. The non-GAAP information should be considered in addition to, not as a substitute for, financial information prepared in accordance with GAAP. 19
