Attached files
| file | filename |
|---|---|
| EX-32.1 - EX-32.1 - PRA GROUP INC | w79857exv32w1.htm |
| EX-31.2 - EX-31.2 - PRA GROUP INC | w79857exv31w2.htm |
| EX-31.1 - EX-31.1 - PRA GROUP INC | w79857exv31w1.htm |
| EXCEL - IDEA: XBRL DOCUMENT - PRA GROUP INC | Financial_Report.xls |
Table of Contents
UNITED STATES
SECURITIES AND EXCHANGE COMMISSION
SECURITIES AND EXCHANGE COMMISSION
WASHINGTON, D.C. 20549
FORM 10-Q
| þ | QUARTERLY REPORT PURSUANT TO SECTION 13 OR 15(d) OF THE SECURITIES EXCHANGE ACT OF 1934 |
For the quarterly period ended September 30, 2010.
| o | TRANSITION REPORT PURSUANT TO SECTION 13 OR 15(d) OF THE SECURITIES EXCHANGE ACT OF 1934 |
For the transition period from to
Commission File Number: 000-50058
Portfolio Recovery Associates, Inc.
(Exact name of registrant as specified in its charter)
| Delaware | 75-3078675 | |
| (State or other jurisdiction of | (I.R.S. Employer | |
| incorporation or organization) | Identification No.) | |
| 120 Corporate Boulevard, Norfolk, Virginia | 23502 | |
| (Address of principal executive offices) | (zip code) |
(888) 772-7326
(Registrant’s telephone number, including area code)
Indicate by check mark whether the registrant (1) has filed all reports required to be filed by
Section 13 or 15(d) of the Securities Exchange Act of 1934 during the preceding 12 months (or for
such shorter period that the registrant was required to file such reports), and (2) has been
subject to such filing requirements for the past 90 days.
YES þ NO o
Indicate by check mark whether the registrant has submitted electronically and posted on its
corporate Web site, if any, every Interactive Data File required to be submitted and posted
pursuant to Rule 405 of Regulation S-T during the preceding 12 months (or for such shorter period
that the registrant was required to submit and post such files).
YES o NO o
Indicate by check mark whether the registrant is a large accelerated filer, an accelerated
filer, or a non-accelerated filer. See the definitions of “large accelerated filer,” “accelerated
filer” and “smaller reporting company” in Rule 12b-2 of the Exchange Act.
| Large accelerated filer þ | Accelerated filer o | Non-accelerated filer o | Smaller Reporting Company o | |||
| (Do not check if a smaller reporting company) |
Indicate by check mark whether the registrant is a shell company (as defined in Rule 12b-2 of
the Exchange Act).
YES o NO þ
The number of shares outstanding of each of the issuer’s classes of common stock, as of the
latest practicable date.
| Class | Outstanding as of November 3, 2010 | |||
Common Stock, $0.01 par value |
17,061,914 |
PORTFOLIO RECOVERY ASSOCIATES, INC.
INDEX
| Page(s) | ||||||||
| 3 | ||||||||
| 3 | ||||||||
| 4 | ||||||||
| 5 | ||||||||
| 6 | ||||||||
| 7-24 | ||||||||
| 25-49 | ||||||||
| 49 | ||||||||
| 49-50 | ||||||||
| 50 | ||||||||
| 51 | ||||||||
| 51 | ||||||||
| 51 | ||||||||
| 51 | ||||||||
| 51 | ||||||||
| 52 | ||||||||
| EX-31.1 | ||||||||
| EX-31.2 | ||||||||
| EX-32.1 | ||||||||
| EX-101 INSTANCE DOCUMENT | ||||||||
| EX-101 SCHEMA DOCUMENT | ||||||||
| EX-101 CALCULATION LINKBASE DOCUMENT | ||||||||
| EX-101 LABELS LINKBASE DOCUMENT | ||||||||
| EX-101 PRESENTATION LINKBASE DOCUMENT | ||||||||
| EX-101 DEFINITION LINKBASE DOCUMENT | ||||||||
2
Table of Contents
Part I. FINANCIAL INFORMATION
Item 1. Financial Statements
PORTFOLIO RECOVERY ASSOCIATES, INC.
CONSOLIDATED BALANCE SHEETS
September 30, 2010 and December 31, 2009
(unaudited)
(Amounts in thousands, except per share amounts)
CONSOLIDATED BALANCE SHEETS
September 30, 2010 and December 31, 2009
(unaudited)
(Amounts in thousands, except per share amounts)
| September 30, | December 31, | |||||||
| 2010 | 2009 | |||||||
Assets |
||||||||
Cash and cash equivalents |
$ | 20,297 | $ | 20,265 | ||||
Finance receivables, net |
807,239 | 693,462 | ||||||
Accounts receivable, net |
7,789 | 9,169 | ||||||
Income taxes receivable |
2,603 | 4,460 | ||||||
Property and equipment, net |
22,794 | 21,864 | ||||||
Goodwill |
61,665 | 29,299 | ||||||
Intangible assets, net |
19,945 | 10,756 | ||||||
Other assets |
5,405 | 5,158 | ||||||
Total assets |
$ | 947,737 | $ | 794,433 | ||||
Liabilities and Stockholders’ Equity |
||||||||
Liabilities: |
||||||||
Accounts payable |
$ | 5,739 | $ | 4,108 | ||||
Accrued expenses and other liabilities |
6,922 | 4,506 | ||||||
Accrued payroll and bonuses |
10,447 | 11,633 | ||||||
Deferred tax liability |
151,638 | 117,206 | ||||||
Line of credit |
288,500 | 319,300 | ||||||
Long-term debt |
998 | 1,499 | ||||||
Derivative instrument |
537 | 701 | ||||||
Total liabilities |
464,781 | 458,953 | ||||||
Commitments and contingencies (Note 14) |
||||||||
Redeemable noncontrolling interest |
14,531 | — | ||||||
Stockholders’ equity: |
||||||||
Preferred stock, par value $0.01, authorized shares, 2,000,
issued and outstanding shares - 0 |
— | — | ||||||
Common stock, par value $0.01, authorized shares, 30,000,
17,061 issued and outstanding shares at September 30, 2010, and
15,596 issued and 15,514 outstanding shares at December 31, 2009 |
171 | 155 | ||||||
Additional paid-in capital |
162,418 | 82,400 | ||||||
Retained earnings |
306,164 | 253,353 | ||||||
Accumulated other comprehensive loss, net of taxes |
(328 | ) | (428 | ) | ||||
Total stockholders’ equity |
468,425 | 335,480 | ||||||
Total liabilities and stockholders’ equity |
$ | 947,737 | $ | 794,433 | ||||
The accompanying notes are an integral part of these consolidated financial statements.
3
Table of Contents
PORTFOLIO RECOVERY ASSOCIATES, INC.
CONSOLIDATED INCOME STATEMENTS
For the three and nine months ended September 30, 2010 and 2009
(unaudited)
(Amounts in thousands, except per share amounts)
CONSOLIDATED INCOME STATEMENTS
For the three and nine months ended September 30, 2010 and 2009
(unaudited)
(Amounts in thousands, except per share amounts)
| Three Months Ended | Nine Months Ended | |||||||||||||||
| September 30, | September 30, | |||||||||||||||
| 2010 | 2009 | 2010 | 2009 | |||||||||||||
Revenues: |
||||||||||||||||
Income recognized on finance receivables, net |
$ | 80,026 | $ | 54,336 | $ | 224,897 | $ | 159,650 | ||||||||
Fee income |
15,518 | 14,229 | 47,054 | 48,225 | ||||||||||||
Total revenues |
95,544 | 68,565 | 271,951 | 207,875 | ||||||||||||
Operating expenses: |
||||||||||||||||
Compensation and employee services |
31,213 | 26,844 | 91,725 | 79,940 | ||||||||||||
Legal and agency fees and costs |
16,748 | 11,296 | 43,573 | 34,460 | ||||||||||||
Outside fees and services |
3,470 | 2,284 | 9,454 | 6,854 | ||||||||||||
Communications |
4,000 | 3,472 | 13,160 | 11,157 | ||||||||||||
Rent and occupancy |
1,362 | 1,270 | 3,912 | 3,515 | ||||||||||||
Depreciation and amortization |
3,294 | 2,269 | 9,050 | 6,874 | ||||||||||||
Other operating expenses |
2,634 | 2,341 | 7,488 | 6,565 | ||||||||||||
Total operating expenses |
62,721 | 49,776 | 178,362 | 149,365 | ||||||||||||
Income from operations |
32,823 | 18,789 | 93,589 | 58,510 | ||||||||||||
Other income and (expense): |
||||||||||||||||
Interest income |
— | — | 35 | 3 | ||||||||||||
Interest expense |
(2,178 | ) | (1,964 | ) | (6,535 | ) | (5,891 | ) | ||||||||
Income before income taxes |
30,645 | 16,825 | 87,089 | 52,622 | ||||||||||||
Provision for income taxes |
11,888 | 6,729 | 33,847 | 20,730 | ||||||||||||
Net income |
$ | 18,757 | $ | 10,096 | $ | 53,242 | $ | 31,892 | ||||||||
Less net income attributable
to redeemable noncontrolling
interest |
(276 | ) | — | (431 | ) | — | ||||||||||
Net income attributable to Portfolio Recovery Associates, Inc. |
$ | 18,481 | $ | 10,096 | $ | 52,811 | $ | 31,892 | ||||||||
Net income per common share attributable to Portfolio Recovery Associates, Inc: |
||||||||||||||||
Basic |
$ | 1.08 | $ | 0.65 | $ | 3.15 | $ | 2.07 | ||||||||
Diluted |
$ | 1.08 | $ | 0.65 | $ | 3.15 | $ | 2.07 | ||||||||
Weighted average number of shares outstanding: |
||||||||||||||||
Basic |
17,058 | 15,466 | 16,740 | 15,392 | ||||||||||||
Diluted |
17,093 | 15,502 | 16,792 | 15,428 | ||||||||||||
The accompanying notes are an integral part of these consolidated financial statements.
4
Table of Contents
PORTFOLIO RECOVERY ASSOCIATES, INC.
CONSOLIDATED STATEMENT OF CHANGES IN STOCKHOLDERS’ EQUITY AND COMPREHENSIVE INCOME
For the nine months ended September 30, 2010
(unaudited)
(Amounts in thousands)
CONSOLIDATED STATEMENT OF CHANGES IN STOCKHOLDERS’ EQUITY AND COMPREHENSIVE INCOME
For the nine months ended September 30, 2010
(unaudited)
(Amounts in thousands)
| Additional | Accumulated Other | Total | ||||||||||||||||||
| Common | Paid-in | Retained | Comprehensive | Stockholders’ | ||||||||||||||||
| Stock | Capital | Earnings | Loss, Net of Taxes | Equity | ||||||||||||||||
Balance at December 31, 2009 |
$ | 155 | $ | 82,400 | $ | 253,353 | $ | (428 | ) | $ | 335,480 | |||||||||
Net income |
— | — | 52,811 | — | 52,811 | |||||||||||||||
Net unrealized change in: |
||||||||||||||||||||
Interest rate swap derivative, net of tax |
— | — | — | 100 | 100 | |||||||||||||||
Comprehensive income |
52,911 | |||||||||||||||||||
Exercise of stock options and vesting of nonvested shares |
2 | 55 | — | — | 57 | |||||||||||||||
Proceeds from stock offering, net of offering costs |
14 | 71,674 | — | — | 71,688 | |||||||||||||||
Amortization of share-based compensation |
— | 3,114 | — | — | 3,114 | |||||||||||||||
Income tax benefit from share-based compensation |
— | 225 | — | — | 225 | |||||||||||||||
Issuance of common stock for acquisition |
— | 4,950 | — | — | 4,950 | |||||||||||||||
Balance at September 30, 2010 |
$ | 171 | $ | 162,418 | $ | 306,164 | $ | (328 | ) | $ | 468,425 | |||||||||
The accompanying notes are an integral part of these consolidated financial statements.
5
Table of Contents
PORTFOLIO RECOVERY ASSOCIATES, INC.
CONSOLIDATED STATEMENTS OF CASH FLOWS
For the nine months ended September 30, 2010 and 2009
(unaudited)
(Amounts in thousands)
CONSOLIDATED STATEMENTS OF CASH FLOWS
For the nine months ended September 30, 2010 and 2009
(unaudited)
(Amounts in thousands)
| Nine Months Ended | ||||||||
| September 30, | ||||||||
| 2010 | 2009 | |||||||
Cash flows from operating activities: |
||||||||
Net income |
$ | 53,242 | $ | 31,892 | ||||
Adjustments to reconcile net income to net cash
provided by operating activities: |
||||||||
Amortization of share-based compensation |
3,114 | 3,240 | ||||||
Depreciation and amortization |
9,050 | 6,874 | ||||||
Deferred tax expense |
34,368 | 22,000 | ||||||
Changes in operating assets and liabilities: |
||||||||
Other assets |
(244 | ) | (14 | ) | ||||
Accounts receivable |
1,380 | 1,369 | ||||||
Accounts payable |
1,631 | 520 | ||||||
Income taxes |
1,857 | (2,306 | ) | |||||
Accrued expenses |
194 | (851 | ) | |||||
Accrued payroll and bonuses |
(1,186 | ) | 1,443 | |||||
Net cash provided by operating activities |
103,406 | 64,167 | ||||||
Cash flows from investing activities: |
||||||||
Purchases of property and equipment |
(6,162 | ) | (3,079 | ) | ||||
Acquisition of finance receivables, net of buybacks |
(273,858 | ) | (210,116 | ) | ||||
Collections applied to principal on finance receivables |
160,081 | 113,067 | ||||||
Business acquisitions, net of cash acquired |
(23,000 | ) | — | |||||
Contingent payments made for business acquisition |
(104 | ) | (100 | ) | ||||
Net cash used in investing activities |
(143,043 | ) | (100,228 | ) | ||||
Cash flows from financing activities: |
||||||||
Proceeds from exercise of options |
57 | 1,630 | ||||||
Income tax benefit from share-based compensation |
225 | 746 | ||||||
Payments of liability-classified contingent consideration |
(1,000 | ) | — | |||||
Proceeds from line of credit |
131,000 | 84,500 | ||||||
Principal payments on line of credit |
(161,800 | ) | (46,500 | ) | ||||
Proceeds from stock offering, net of offering costs |
71,688 | — | ||||||
Proceeds from long-term debt |
— | 2,036 | ||||||
Principal payments on long-term debt |
(501 | ) | (373 | ) | ||||
Principal payments on capital lease obligations |
— | (5 | ) | |||||
Net cash provided by financing activities |
39,669 | 42,034 | ||||||
Net increase in cash and cash equivalents |
32 | 5,973 | ||||||
Cash and cash equivalents, beginning of period |
20,265 | 13,901 | ||||||
Cash and cash equivalents, end of period |
$ | 20,297 | $ | 19,874 | ||||
Supplemental disclosure of cash flow information: |
||||||||
Cash paid for interest |
$ | 6,508 | $ | 6,028 | ||||
Cash paid for income taxes |
89 | 321 | ||||||
Noncash investing and financing activities: |
||||||||
Net unrealized change in fair value of derivative instrument |
$ | 164 | $ | (655 | ) | |||
Common stock issued for acquisition |
4,950 | 1,170 | ||||||
The accompanying notes are an integral part of these consolidated financial statements.
6
Table of Contents
PORTFOLIO RECOVERY ASSOCIATES, INC.
NOTES TO CONSOLIDATED FINANCIAL STATEMENTS
(unaudited)
1. Organization and Business:
Portfolio Recovery Associates, LLC (“PRA”) was formed on March 20, 1996. Portfolio Recovery
Associates, Inc. (“PRA Inc”) was formed in August 2002. On November 8, 2002, PRA Inc completed its
initial public offering (“IPO”) of common stock. In connection with the IPO, all of the membership
units and warrants of PRA were exchanged on a one to one basis for shares of a single class of
common stock of PRA Inc and warrants to purchase shares of PRA Inc common stock, respectively. PRA
Inc owns all outstanding membership units of PRA, PRA Holding I, LLC (“PRA Holding I”), PRA Holding
II, LLC (“PRA Holding II”), PRA Holding III, LLC (“PRA Holding III”), PRA Receivables Management,
LLC (formerly d/b/a Anchor Receivables Management) (“Anchor”), PRA Location Services, LLC (d/b/a
IGS Nevada) (“IGS”), PRA Government Services, LLC (d/b/a RDS) (“RDS”) and MuniServices, LLC (d/b/a
PRA Government Services) (“MuniServices”). On March 15, 2010, PRA Inc acquired 62% of the
membership units of Claims Compensation Bureau, LLC (“CCB”). The business of PRA Inc, a Delaware
corporation, and its subsidiaries (collectively, the “Company”) revolves around the detection,
collection, and processing of both unpaid and normal-course receivables originally owed to credit
grantors, governments, retailers and others. The Company’s primary business is the purchase,
collection and management of portfolios of defaulted consumer receivables. These accounts are
purchased from sellers of finance receivables and collected by a highly skilled staff whose purpose
is to locate and contact customers and arrange payment or resolution of their debts. The Company,
through its Litigation Department, collects accounts judicially, either by using its own attorneys
or by contracting with independent attorneys throughout the country through whom the Company takes
legal action to satisfy consumer debts. The Company also services receivables on behalf of clients
on either a commission or transaction-fee basis. Clients include entities in the financial
services, auto, retail, utility, health care and government sectors. Services provided to these
clients include obtaining location information for clients in support of their collection
activities (known as skip tracing), and the management of both delinquent and non-delinquent
receivables for government entities. In addition, through its newly acquired CCB subsidiary, the
Company provides class action claims settlement recovery services and related payment processing to
its corporate clients.
The consolidated financial statements of the Company include the accounts of PRA Inc, PRA, PRA
Holding I, PRA Holding II, PRA Holding III, Anchor, IGS, RDS, MuniServices and CCB. Under the
guidance of ASC Topic 280 “Segment Reporting” (“ASC 280”), the Company has determined that it has
several operating segments that meet the aggregation criteria of ASC 280 and, therefore, it has one
reportable segment, receivables management, based on similarities among the operating units
including homogeneity of services, service delivery methods and use of technology.
The accompanying unaudited consolidated financial statements of the Company have been prepared
in accordance with Rule 10-01 of Regulation S-X promulgated by the Securities and Exchange
Commission (“SEC”) and, therefore, do not include all information and disclosures required by U.S.
generally accepted accounting principles for complete financial statements. In the opinion of the
Company, however, the accompanying unaudited consolidated financial statements contain all
adjustments, consisting only of normal recurring adjustments, necessary for a fair presentation of
the Company’s consolidated balance sheet as of September 30, 2010, its consolidated income
statements for the three and nine months ended September 30, 2010 and 2009, its consolidated
statement of changes in stockholders’ equity and comprehensive income for the nine months ended
September 30, 2010, and its consolidated statements of cash flows for the nine months ended
September 30, 2010 and 2009. The consolidated income statement of the Company for the nine months
ended September 30, 2010 may not be indicative of future results. These unaudited consolidated
financial statements should be read in conjunction with the audited consolidated financial
statements and notes thereto included in the Company’s Annual Report on Form 10-K, as filed for the
year ended December 31, 2009.
2. Finance Receivables, net:
The Company’s principal business consists of the acquisition and collection of pools of
accounts that have experienced deterioration of credit quality between origination and the
Company’s acquisition of the accounts. The amount paid for any pool reflects the Company’s
determination that it is probable the Company will be unable to
7
Table of Contents
PORTFOLIO RECOVERY ASSOCIATES, INC.
NOTES TO CONSOLIDATED FINANCIAL STATEMENTS
(unaudited)
NOTES TO CONSOLIDATED FINANCIAL STATEMENTS
(unaudited)
collect all amounts due according to an account’s contractual terms. At acquisition, the Company reviews the portfolio both by
account and aggregate pool to determine whether there is evidence of deterioration of credit
quality since origination and if it is probable that the Company will be unable to
collect all amounts due according to the account’s contractual terms. If both conditions exist, the Company determines whether each
such account is to be accounted for individually or whether such accounts will be assembled into
pools based on common risk characteristics. The Company considers expected prepayments and
estimates the amount and timing of undiscounted expected principal, interest and other cash flows
for each acquired portfolio and subsequently aggregates pools of accounts. The Company determines
the excess of the pool’s scheduled contractual principal and contractual interest payments over all
cash flows expected at acquisition as an amount that should not be accreted (nonaccretable
difference) based on the Company’s proprietary acquisition models. The remaining amount,
representing the excess of the pool’s cash flows expected to be collected over the amount paid, is
accreted into income recognized on finance receivables over the remaining life of the pool
(accretable yield).
The Company accounts for its investment in finance receivables under the guidance of FASB ASC
Topic 310-30 “Loans and Debt Securities Acquired with Deteriorated Credit Quality” (“ASC 310-30”).
Under ASC 310-30, static pools of accounts may be established. These pools are aggregated based on
certain common risk criteria. Each static pool is recorded at cost, which includes certain direct
costs of acquisition paid to third parties, and is accounted for as a single unit for the
recognition of income, principal payments and loss provision. Once a static pool is established
for a calendar quarter, individual receivable accounts are not added to the pool (unless replaced
by the seller) or removed from the pool (unless sold or returned to the seller). ASC 310-30
requires that the excess of the contractual cash flows over expected cash flows, based on the
Company’s estimates derived from its proprietary collection models, not be recognized as an
adjustment of revenue or expense or on the balance sheet. ASC 310-30, utilizing the interest
method, initially freezes the yield estimated when the accounts are purchased as the basis for
subsequent impairment testing. Significant increases in actual, or expected future cash flows may
be recognized prospectively through an upward adjustment of the yield over a portfolio’s remaining
life. Any increase to the yield then becomes the new benchmark for impairment testing. Under ASC
310-30, rather than lowering the estimated yield if the collection estimates are not received or
projected to be received, the carrying value of a pool would be written down to maintain the then
current yield and is shown as a reduction in revenue in the consolidated income statements with a
corresponding valuation allowance offsetting finance receivables, net, on the consolidated balance
sheet. Income on finance receivables is accrued quarterly based on each static pool’s effective
yield. Quarterly cash flows greater than the interest accrual will reduce the carrying value of the
static pool. This reduction in carrying value is defined as payments applied to principal (also
referred to as finance receivable amortization). Likewise, cash flows that are less than the
interest accrual will accrete the carrying balance. The Company generally does not allow accretion
in the first six to twelve months; accordingly, the Company utilizes either the cost recovery
method or cash method when necessary to prevent accretion as permitted by ASC 310-30. The yield is
estimated and periodically recalculated based on the timing and amount of anticipated cash flows
using the Company’s proprietary collection models. A pool can
become fully amortized
(zero carrying balance on the balance sheet) while still generating cash collections. In this
case, all cash collections are recognized as revenue when received. Under the cash method, revenue
is recognized as it would be under the interest method up to the amount of cash collections.
Additionally, the Company uses the cost recovery method when collections on a particular pool of
accounts cannot be reasonably predicted. These cost recovery pools are not aggregated with other
portfolios. Under the cost recovery method, no revenue is recognized until the Company has fully
collected the cost of the portfolio, or until such time that the Company considers the collections
to be probable and estimable and begins to recognize income based on the interest method as
described above. At September 30, 2010 and December 31, 2009, the Company had unamortized
purchased principal (purchase price) in pools accounted for under the cost recovery method of $1.8
million and $2.9 million, respectively.
The Company establishes valuation allowances, if necessary, for acquired accounts subject to
ASC 310-30 to reflect only those losses incurred after acquisition (that is, the present value of
cash flows initially expected at acquisition that are no longer expected to be collected).
Valuation allowances are established only subsequent to acquisition of the accounts. At September
30, 2010 and December 31, 2009, the Company had an allowance against its finance receivables of
$70,965,000 and $51,255,000, respectively.
8
Table of Contents
PORTFOLIO RECOVERY ASSOCIATES, INC.
NOTES TO CONSOLIDATED FINANCIAL STATEMENTS
(unaudited)
NOTES TO CONSOLIDATED FINANCIAL STATEMENTS
(unaudited)
The Company implements the accounting for income recognized on finance receivables under ASC
310-30 as follows. The Company creates each accounting pool using its projections of estimated
cash flows and expected economic life. The Company then computes the effective yield that fully
amortizes the pool to the end of its expected economic life based on the current projections of
estimated cash flows using the interest method. As actual cash flow results are recorded, the
Company balances those results to the data contained in its proprietary models to ensure accuracy,
then reviews each accounting pool watching for trends, actual
performance versus projections and curve shape (a graphical depiction of the timing of cash flows), sometimes re-forecasting
future cash flows utilizing the Company’s statistical models. The review process is primarily
performed by the Company’s finance staff; additionally, the Company’s operational and statistical
staffs may also be involved. To the extent there is overperformance, the Company will either
increase the yield or release the allowance and consider increasing future cash projections, if
persuasive evidence indicates that the overperformance is considered to be a significant
betterment. If the overperformance is considered more of an acceleration of cash flows (a timing
difference), the Company will adjust estimated future cash flows downward which effectively extends
the amortization period, or take no action at all if the amortization period is reasonable and
falls within the pool’s expected economic life. In either case, the yield may or may not be
increased due to the time value of money (accelerated cash collections). To the extent there is
underperformance, the Company will record an allowance if the underperformance is significant and
will also consider revising estimated future cash flows based on current period information, or
take no action if the pool’s amortization period is reasonable and falls within the currently
projected economic life.
The Company capitalizes certain fees paid to third parties related to the direct acquisition
of a portfolio of accounts. These fees are added to the acquisition cost of the portfolio and
accordingly are amortized over the life of the portfolio using the interest method. The balance of
the unamortized capitalized fees at September 30, 2010 and 2009 was $3,105,239 and $3,262,929,
respectively. During the three and nine months ended September 30, 2010, the Company capitalized
$177,337 and $624,168, respectively, of these direct acquisition fees. During the three and nine
months ended September 30, 2009, the Company capitalized $156,248 and $805,962, respectively, of
these direct acquisition fees. During the three and nine months ended September 30, 2010, the
Company amortized $233,603 and $750,855, respectively, of these direct acquisition fees. During
the three and nine months ended September 30, 2009, the Company amortized $206,270 and $621,593,
respectively, of these direct acquisition fees.
The agreements to purchase the aforementioned receivables include general representations and
warranties from the sellers covering account holder death or bankruptcy and accounts settled or
disputed prior to sale. The representation and warranty period permitting the return of these
accounts from the Company to the seller is typically 90 to 180 days. Any funds received from the
seller of finance receivables as a return of purchase price are referred to as buybacks. Buyback
funds are applied against the finance receivable balance received and are not included in the
Company’s cash collections from operations. In some cases, the seller will replace the returned
accounts with new accounts in lieu of returning the purchase price. In that case, the old account
is removed from the pool and the new account is added.
Changes in finance receivables, net for the three and nine months ended September 30, 2010 and
2009 are as follows (amounts in thousands):
| Three Months Ended | Three Months Ended | Nine Months Ended | Nine Months Ended | |||||||||||||
| September 30, 2010 | September 30, 2009 | September 30, 2010 | September 30, 2009 | |||||||||||||
Balance at beginning of period |
$ | 775,606 | $ | 624,592 | $ | 693,462 | $ | 563,830 | ||||||||
Acquisitions of finance receivables, net of buybacks |
88,984 | 74,318 | 273,858 | 210,116 | ||||||||||||
Cash collections |
(137,377 | ) | (92,367 | ) | (384,978 | ) | (272,717 | ) | ||||||||
Income recognized on finance receivables, net |
80,026 | 54,336 | 224,897 | 159,650 | ||||||||||||
Cash collections applied to principal |
(57,351 | ) | (38,031 | ) | (160,081 | ) | (113,067 | ) | ||||||||
Balance at end of period |
$ | 807,239 | $ | 660,879 | $ | 807,239 | $ | 660,879 | ||||||||
At the time of acquisition, the life of each pool is generally estimated to be between 84 to
96 months based on projected amounts and timing of future cash collections using the proprietary
models of the Company. As of
9
Table of Contents
PORTFOLIO RECOVERY ASSOCIATES, INC.
NOTES TO CONSOLIDATED FINANCIAL STATEMENTS
(unaudited)
NOTES TO CONSOLIDATED FINANCIAL STATEMENTS
(unaudited)
September 30, 2010, the Company had $807.2 million in finance
receivables, net. Based upon projections as of
September 30, 2010, cash collections applied to principal are estimated to be as follows for
the twelve months in the periods ending (amounts in thousands):
September 30, 2011 |
$ | 188,821 | ||
September 30, 2012 |
207,400 | |||
September 30, 2013 |
208,665 | |||
September 30, 2014 |
150,098 | |||
September 30, 2015 |
45,993 | |||
September 30, 2016 |
5,816 | |||
September 30, 2017 |
446 | |||
| $ | 807,239 | |||
During the three and nine months ended September 30, 2010, the Company purchased approximately
$1.38 billion and $4.94 billion, respectively, in face value of charged-off consumer receivables.
During the three and nine months ended September 30, 2009, the Company purchased approximately
$1.75 billion and $6.09 billion, respectively, in face value of charged-off consumer receivables.
At September 30, 2010, the estimated remaining collections (“ERC”) on the receivables purchased in
the three and nine months ended September 30, 2010 were $171.6 million and $537.1 million,
respectively. At September 30, 2010, ERC on the receivables purchased in the three and nine months
ended September 30, 2009 were $137.7 million and $375.1 million, respectively.
Accretable yield represents the amount of income recognized on finance receivables the Company
can expect to generate over the remaining life of its existing portfolios based on estimated future
cash flows as of September 30, 2010 and 2009. Reclassifications from nonaccretable difference to
accretable yield primarily result from the Company’s increase in its estimate of future cash flows.
Reclassifications to nonaccretable difference from accretable yield result from the Company’s
decrease in its estimates of future cash flows and allowance charges that exceed the Company’s
increase in its estimate of future cash flows. Changes in accretable yield for the three and nine
months ended September 30, 2010 and 2009 were as follows (amounts in thousands):
| Three Months Ended | Three Months Ended | Nine Months Ended | Nine Months Ended | |||||||||||||
| September 30, 2010 | September 30, 2009 | September 30, 2010 | September 30, 2009 | |||||||||||||
Balance at beginning of period |
$ | 835,903 | $ | 613,392 | $ | 721,984 | $ | 551,735 | ||||||||
Income recognized on finance receivables, net |
(80,026 | ) | (54,336 | ) | (224,897 | ) | (159,650 | ) | ||||||||
Additions |
84,860 | 106,359 | 312,735 | 303,195 | ||||||||||||
Reclassifications (to)/from nonaccretable difference |
21,598 | 5,618 | 52,513 | (24,247 | ) | |||||||||||
Balance at end of period |
$ | 862,335 | $ | 671,033 | $ | 862,335 | $ | 671,033 | ||||||||
The Company maintains a valuation allowance on pools that had underperformed the Company’s
most recent expectations during the three and nine months ended September 30, 2010 and 2009. The
following is a summary of activity, including allowance charges recorded, within the Company’s
valuation allowance account (amounts in thousands):
| Three Months Ended | Three Months Ended | Nine Months Ended | Nine Months Ended | |||||||||||||
| September 30, 2010 | September 30, 2009 | September 30, 2010 | September 30, 2009 | |||||||||||||
Balance at beginning of period |
$ | 64,445 | $ | 33,760 | $ | 51,255 | $ | 23,620 | ||||||||
Allowance charges recorded |
7,375 | 8,395 | 20,675 | 19,305 | ||||||||||||
Reversal of previously recorded allowance charges |
(855 | ) | (385 | ) | (965 | ) | (1,155 | ) | ||||||||
Change in allowance charge |
6,520 | 8,010 | 19,710 | 18,150 | ||||||||||||
Balance at end of period |
$ | 70,965 | $ | 41,770 | $ | 70,965 | $ | 41,770 | ||||||||
10
Table of Contents
PORTFOLIO RECOVERY ASSOCIATES, INC.
NOTES TO CONSOLIDATED FINANCIAL STATEMENTS
(unaudited)
NOTES TO CONSOLIDATED FINANCIAL STATEMENTS
(unaudited)
3. Accounts Receivable, net:
Accounts receivable are recorded at the invoiced amount and do not bear interest. Amounts
collected on accounts receivable are included in net cash provided by operating activities in the
consolidated statements of cash flows. The Company maintains an allowance for doubtful accounts for
estimated losses inherent in its accounts receivable portfolio. In establishing the required
allowance, management considers historical losses adjusted to take into account current market
conditions and its customers’ financial condition, the amount of receivables in dispute, the
current receivables aging, and current payment patterns. The Company reviews its allowance for
doubtful accounts monthly. Account balances are charged off against the allowance after all means
of collection have been exhausted and the potential for recovery is considered remote. The balance
of the allowance for doubtful accounts at September 30, 2010 and December 31, 2009 was $3.0 million
and $2.9 million, respectively. The Company does not have any off balance sheet credit exposure
related to its customers.
4. Line of Credit:
On November 29, 2005, the Company entered into a Loan and Security Agreement for a revolving
line of credit. The agreement has been amended six times to add additional lenders and ultimately
increase the total availability of credit under the line to $365 million. The agreement is a line
of credit in an amount equal to the lesser of $365 million or 30% of the Company’s ERC of all its
eligible asset pools. Borrowings under the revolving credit facility bear interest at a floating
rate equal to the one month LIBOR Market Index Rate plus 1.40%, which equated to 1.66% at September
30, 2010. Of the $365 million facility, $50 million was locked in as an interest only term loan at
a rate of 6.80% and expires on May 4, 2012. The remaining $315 million expires on May 2, 2011.
The Company also pays an unused line fee equal to three-tenths of one percent, or 30 basis points,
on any unused portion of the line of credit. The loan is collateralized by substantially all the
tangible and intangible assets of the Company. The agreement provides as follows:
| • | monthly borrowings may not exceed 30% of ERC; |
| • | funded debt to EBITDA (defined as net income, less income or plus loss from discontinued operations and extraordinary items, plus income taxes, plus interest expense, plus depreciation, depletion, amortization (including finance receivable amortization) and other non-cash charges) ratio must be less than 2.0 to 1.0 calculated on a rolling twelve-month average; |
| • | tangible net worth must be at least 100% of tangible net worth reported at September 30, 2005, plus 25% of cumulative positive net income since the end of such fiscal quarter, plus 100% of the net proceeds from any equity offering without giving effect to reductions in tangible net worth due to repurchases of up to $100,000,000 of the Company’s common stock; and |
| • | restrictions on change of control. |
As of September 30, 2010 and 2009, outstanding borrowings under the facility totaled $288.5
million and $306.3 million, respectively, of which $50.0 million was part of the non-revolving
fixed rate sub-limit. As of September 30, 2010, the Company is in compliance with all of the
covenants of the agreement.
5. Derivative Instrument:
The Company may periodically enter into derivative financial instruments, typically interest
rate swap agreements, to reduce its exposure to fluctuations in interest rates on variable-rate
debt and their impact on earnings and cash flows. The Company does not utilize derivative financial
instruments with a level of complexity or with a risk greater than the exposure to be managed nor
does it enter into or hold derivatives for trading or speculative purposes. The Company
periodically reviews the creditworthiness of the swap counterparty to assess the counterparty’s
ability to honor its obligation. Counterparty default would expose the Company to fluctuations in
variable interest rates. Based on the guidance of FASB ASC Topic 815 “Derivatives and Hedging”
(“ASC 815”), the Company records derivative financial instruments at fair value on the consolidated
balance sheet.
11
Table of Contents
PORTFOLIO RECOVERY ASSOCIATES, INC.
NOTES TO CONSOLIDATED FINANCIAL STATEMENTS
(unaudited)
NOTES TO CONSOLIDATED FINANCIAL STATEMENTS
(unaudited)
On December 16, 2008, the Company entered into an interest rate forward rate swap transaction
(the “Swap”) with J.P. Morgan Chase Bank, National Association pursuant to an ISDA Master Agreement
which contains customary representations, warranties and covenants. The Swap has an effective date
of January 1, 2010, with a notional amount of $50.0 million. Under the Swap, the Company receives a
floating interest rate based on one-
month LIBOR Market Index Rate and pays a fixed interest rate of 1.89% through maturity of the
Swap on May 1, 2011. Notwithstanding the terms of the Swap, the Company is ultimately obligated
for all amounts due and payable under the credit facility.
The Company’s financial derivative instrument is designated and qualifies as a cash flow
hedge, and the effective portion of the gain or loss on such hedge is reported as a component of
other comprehensive income/(loss) in the consolidated financial statements of the Company. To the
extent that the hedging relationship is not effective, the ineffective portion of the change in
fair value of the derivative is recorded in other income (expense). The hedge was considered
effective for the twelve months ended December 31, 2009 and for the nine months ended September 30,
2010. Therefore, no amount has been recorded in the consolidated income statements related to the
hedge’s ineffectiveness during 2009 or the nine months ended September 30, 2010. Hedges that
receive designated hedge accounting treatment are evaluated for effectiveness at the time that they
are designated, as well as throughout the hedging period.
The following table sets forth the fair value amounts of the derivative instrument held by the
Company as of the dates indicated (amounts in thousands):
| September 30, 2010 | December 31, 2009 | |||||||||||||||
| Derivative designated as hedging instruments under ASC 815: | Asset Derivative | Liability Derivative | Asset Derivative | Liability Derivative | ||||||||||||
Interest rate swap contract |
$ | — | $ | 537 | $ | — | $ | 701 | ||||||||
Total derivative |
$ | — | $ | 537 | $ | — | $ | 701 | ||||||||
Liability derivatives are recorded in the liability section of the accompanying consolidated
balance sheets.
The following table sets forth the (loss) recorded in Accumulated Other Comprehensive Loss
(“AOCL”), net of tax, for the three and nine months ended September 30, 2010 and 2009, for
derivatives held by the Company as well as any loss reclassified from AOCL into expense (amounts in
thousands):
| Amount of Loss Recognized in | Amount of Loss Reclassified from | |||||||||||||||||||
| Accumulated Other Comprehensive | Accumulated Other Comprehensive | |||||||||||||||||||
| Loss (Effective Portion) | Loss into Expense (Effective Portion) | |||||||||||||||||||
| Three Months Ended | Location of Loss | Three Months Ended | ||||||||||||||||||
| Derivative designated as hedging | September 30, | Reclassified from AOCL into | September 30, | |||||||||||||||||
| instruments under ASC 815: | 2010 | 2009 | Expense (Effective Portion) | 2010 | 2009 | |||||||||||||||
Interest rate swap contract |
$ | (62 | ) | $ | (214 | ) | Interest Expense | $ | (204 | ) | $ | — | ||||||||
Total derivative |
$ | (62 | ) | $ | (214 | ) | $ | (204 | ) | $ | — | |||||||||
| Amount of Loss Recognized in | Amount of Loss Reclassified from | |||||||||||||||||||
| Accumulated Other Comprehensive | Accumulated Other Comprehensive | |||||||||||||||||||
| Loss (Effective Portion) | Loss into Expense (Effective Portion) | |||||||||||||||||||
| Nine Months Ended | Location of Loss | Nine Months Ended | ||||||||||||||||||
| Derivative designated as hedging | September 30, | Reclassified from AOCL into | September 30, | |||||||||||||||||
| instruments under ASC 815: | 2010 | 2009 | Expense (Effective Portion) | 2010 | 2009 | |||||||||||||||
Interest rate swap contract |
$ | (273 | ) | $ | (435 | ) | Interest Expense | $ | (611 | ) | $ | — | ||||||||
Total derivative |
$ | (273 | ) | $ | (435 | ) | $ | (611 | ) | $ | — | |||||||||
12
Table of Contents
PORTFOLIO RECOVERY ASSOCIATES, INC.
NOTES TO CONSOLIDATED FINANCIAL STATEMENTS
(unaudited)
NOTES TO CONSOLIDATED FINANCIAL STATEMENTS
(unaudited)
Amounts in accumulated other comprehensive loss will be reclassified into earnings under
certain situations, for example, if the occurrence of the transaction is no longer probable or no
longer qualifies for hedge accounting. The Company expects to reclassify approximately $537,000
currently included in accumulated other comprehensive loss, net of taxes into interest expense
within the next 12 months.
6. Long-Term Debt:
On February 6, 2009, the Company entered into a commercial loan agreement to finance computer
software and equipment purchases in the amount of $2,036,114. The loan, which matures on February
28, 2012, is collateralized by the related computer software and equipment, has a three year loan
term with a fixed rate of 4.78% and provides for monthly installment payments, including interest,
of $60,823 beginning on March 31, 2009.
7. Property and Equipment, net:
Property and equipment, at cost, consist of the following as of the dates indicated (amounts
in thousands):
| September 30, | December 31, | |||||||
| 2010 | 2009 | |||||||
Software |
$ | 19,675 | $ | 16,542 | ||||
Computer equipment |
10,162 | 8,869 | ||||||
Furniture and fixtures |
5,970 | 5,624 | ||||||
Equipment |
7,310 | 6,040 | ||||||
Leasehold improvements |
3,429 | 3,277 | ||||||
Building and improvements |
6,045 | 6,045 | ||||||
Land |
992 | 992 | ||||||
Accumulated depreciation and amortization |
(30,789 | ) | (25,525 | ) | ||||
Property and equipment, net |
$ | 22,794 | $ | 21,864 | ||||
Depreciation and amortization expense, relating to property and equipment, for the three and
nine months ended September 30, 2010, was $1,814,249 and $5,314,419, respectively. Depreciation
and amortization expense, relating to property and equipment, for the three and nine months ended
September 30, 2009, was $1,600,764 and $4,869,540, respectively.
The Company, in accordance with the guidance of FASB ASC Topic 350-40 “Internal-Use Software”
(“ASC 350-40”), capitalizes qualifying computer software costs incurred during the application
development stage and amortizes them over their estimated useful life of three to seven years on a
straight-line basis beginning when the project is completed. Costs associated with preliminary
project stage activities, training, maintenance and all other post implementation stage activities
are expensed as incurred. The Company’s policy provides for the
capitalization of certain direct payroll costs for employees who are directly associated with internal use
computer software projects, as well as external direct costs of services associated with developing
or obtaining internal use software. Capitalizable personnel costs are limited to the time directly
spent on such projects. As of September 30, 2010, the Company has incurred and capitalized
$3,934,892 of these direct payroll costs and external direct costs related to software developed
for internal use. Of these costs, $1,169,007 is for projects that are in the development stage
and, therefore are a component of Other Assets. Once the projects are completed, the costs will be
transferred to Software and amortized over their estimated useful life of three to seven years.
Amortization expense for the three and nine months ended September 30, 2010 was $134,654 and
$297,483, respectively. Amortization expense for the three and nine months ended September 30,
2009 was $25,229 and $69,501, respectively. The remaining unamortized costs relating to internally
developed software at September 30, 2010 and 2009 were $2,229,784 and $523,079, respectively.
13
Table of Contents
PORTFOLIO RECOVERY ASSOCIATES, INC.
NOTES TO CONSOLIDATED FINANCIAL STATEMENTS
(unaudited)
NOTES TO CONSOLIDATED FINANCIAL STATEMENTS
(unaudited)
8. Business Acquisitions:
On March 15, 2010, the Company acquired 62% of the membership units of CCB. The remaining 38%
of the membership units were acquired by Claims Compensation Bureau, Inc., CCB’s predecessor.
Claims Compensation Bureau, Inc. was founded in 1996 and is a leading provider of class action
claims settlement recovery services and related payment processing to corporate clients. CCB’s
process allows clients to maximize settlement recoveries, in many cases participating in
settlements they would otherwise not know existed. The company charges fees for its services and
works with clients to identify, prepare and submit claims to class action administrators charged
with dispersing class action settlement funds. In connection with the acquisition, the president
and founder of CCB, as well as another member of its senior management, entered into long-term
employment agreements with the Company. The consolidated income statement for the nine months
ended September 30, 2010 includes the results of operations of CCB from March 15, 2010 through
September 30, 2010.
The Company’s initial investment for the 62% ownership of CCB was paid for with $23.0 million
in cash plus $2.0 million in deferred payments which are expected to be paid during 2010 if certain
events occur. Of the $2.0 million, $1.0 million was paid in the second quarter of 2010 and the
remaining $1.0 million is expected to be paid by December 31, 2010. The remaining deferred payment
is included in the accrued expenses and other liabilities account on the consolidated balance sheet
as of September 30, 2010. As part of the agreement, the Company has the right through February 28,
2015 to purchase the remaining 38% of CCB at certain multiples of EBITDA. In addition, beginning
March 1, 2012 and ending February 28, 2018, the noncontrolling interest can require the Company to
purchase its units at pre-defined multiples of EBITDA. Any future acquisitions by the Company of
the noncontrolling interest will be accounted for as an equity transaction.
The Company accounted for this purchase in accordance with ASC Topic 805, “Business
Combinations”. Under this guidance, an entity is required to recognize the assets acquired,
liabilities assumed, any noncontrolling interest in the acquiree, and the consideration given at
their fair value on the acquisition date. The following tables summarize the fair value of the
consideration given for CCB, as well as the fair value of the assets acquired, liabilities assumed,
and the noncontrolling interest in the acquiree as of the March 15, 2010 acquisition date (amounts
in thousands):
Purchase price consideration given: |
||||
Cash |
$ | 23,000 | ||
Contingent consideration arrangement |
2,000 | |||
Fair value of total consideration given |
$ | 25,000 | ||
Recognized amounts of identifiable assets are as follows (amounts in thousands):
Contractual relationships |
$ | 12,000 | ||
Tradenames |
400 | |||
Non-compete agreements |
500 | |||
Cash |
500 | |||
Software |
67 | |||
Other assets |
2 | |||
Total identifiable net assets acquired |
13,469 | |||
Goodwill |
26,854 | |||
Estimated fair value of acquired business |
40,323 | |||
Redeemable noncontrolling interest in CCB |
15,323 | |||
Purchase price consideration given |
$ | 25,000 | ||
14
Table of Contents
PORTFOLIO RECOVERY ASSOCIATES, INC.
NOTES TO CONSOLIDATED FINANCIAL STATEMENTS
(unaudited)
NOTES TO CONSOLIDATED FINANCIAL STATEMENTS
(unaudited)
The estimated fair value of the noncontrolling interest in CCB was determined as the
percentage of the noncontrolling interest multiplied by the fair value of all assets which were
derived from the acquisition of CCB on March 15, 2010.
On June 11, 2010, the Company’s wholly-owned subsidiary, RDS, acquired substantially all the
assets of Tax Return, Inc. for $500,000. The purchase price was allocated to a non-competition
agreement, fixed assets and goodwill, all of which are included as assets of RDS. There is no
contingent consideration associated with this acquisition.
The acquisition of CCB levers the Company’s competency in payment and administrative
processing, while broadening its scope of services. The acquisition of Tax Return, Inc. further
expands the audit expertise and capacity of the Company’s government services business.
9. Redeemable Noncontrolling Interest:
In accordance with ASC 810, the Company has consolidated all financial statement accounts of
CCB in its consolidated balance sheet as of September 30, 2010 and its consolidated income
statements for the three and nine months ended September 30, 2010. The redeemable noncontrolling
interest amount is separately stated on the consolidated balance sheet and represents the 38%
interest in CCB not controlled by the Company. In addition, net income attributable to the
noncontrolling interest is stated separately in the consolidated income statements for the three
and nine months ended September 30, 2010.
In the second quarter of 2010, the Company applied the provisions of FASB ASC Topic 480-10-S99
‘Distinguishing Liabilities from Equity” (“ASC 480-10-S99”) which provides guidance on the
accounting for equity securities that are subject to mandatory redemption requirements or whose
redemption is outside the control of the issuer. The noncontrolling interest “put” arrangement is
accounted for under ASC 480-10-S99, as redemption under the “put” arrangement is outside the
control of the Company. As such, the redeemable noncontrolling interest is recorded outside of
“permanent” equity. The Company measures the redeemable noncontrolling interest at the greater of
its ASC 480-10-S99 measurement amount (estimated redemption value of the “put” option embedded in
the noncontrolling interest) or its measurement amount under the guidance of ASC 810. The ASC 810
measurement amount includes adjustments for the noncontrolling interest’s pro-rata share of
earnings, losses and distributions, pursuant to the limited liability company agreement.
Adjustments to the measurement amount are recorded to stockholders’ equity. The Company used a
present value calculation to estimate the redemption value of the “put” option as of the reporting
date. If material, the Company adjusts the numerator of earnings per share calculations for the
current period change in the excess of the noncontrolling interest’s ASC 480-10-S99 measurement
amount over the greater of its ASC 810 measurement amount or the estimated fair value of the
noncontrolling interest. The Company has recorded the redeemable noncontrolling interest amount
outside of permanent equity, in accordance with ASC 480-10-S99. Although the noncontrolling
interest was redeemable by the Company as of the reporting date, it was not yet redeemable by the
holder of the “put” option. The estimated redemption value of the noncontrolling interest, as if
it were currently redeemable by the holder of the put option under the terms of the put
arrangement, was $22,800,000 as of September 30, 2010.
The following table represents the changes in the redeemable noncontrolling interest for the
period from March 15, 2010 to September 30, 2010 (amounts in thousands):
Acquisition date fair value of redeemable noncontrolling interest |
$ | 15,323 | ||
Net income attributable to redeemable noncontrolling interest |
431 | |||
Distributions |
(1,223 | ) | ||
Redeemable noncontrolling interest at September 30, 2010 |
$ | 14,531 | ||
15
Table of Contents
PORTFOLIO RECOVERY ASSOCIATES, INC.
NOTES TO CONSOLIDATED FINANCIAL STATEMENTS
(unaudited)
NOTES TO CONSOLIDATED FINANCIAL STATEMENTS
(unaudited)
10. Goodwill and Intangible Assets, net:
In connection with the Company’s business acquisitions, the Company purchased certain tangible
and intangible assets. Intangible assets purchased included client and customer relationships,
non-compete agreements, trademarks and goodwill. In accordance FASB ASC Topic 350
“Intangibles-Goodwill and Other” (“ASC 350”), the Company is amortizing the following intangible
assets over the estimated useful lives as indicated:
| Acquisition Date | Customer Relationships | Non-Compete Agreements | Trademarks | |||||
IGS
|
October 1, 2004 | 7 years | 3 years (1) | — | ||||
RDS (2)
|
July 29, 2005 | 10 years | 3 years (1) | — | ||||
The Palmer Group (2)
|
July 25, 2007 | 2.4 years (1) | — | — | ||||
MuniServices (2)
|
July 1, 2008 | 11 years | 3 years | 14 years | ||||
BPA (2)
|
August 1, 2008 | 10 years | 2.4 years | — | ||||
CCB
|
March 15, 2010 | 4-7 years | 3 years | 14 years | ||||
Tax Return, Inc. (2)
|
June 11, 2010 | — | 3.5 years | — |
| (1) | These intangible assets are fully amortized with no expense recognized during 2010. | |
| (2) | Operates as part of the Company’s government services group. |
The combined original weighted average amortization period is 8.1 years. The Company reviews
these assets at least annually for impairment. Total amortization expense was $1,479,702 and
$3,735,977 for the three and nine months ended September 30, 2010, respectively. Total
amortization expense was $668,277 and $2,004,831 for the three and nine months ended September 30,
2009, respectively. In addition, goodwill, pursuant to ASC 350, is not amortized but rather is
reviewed at least annually for impairment. During the fourth quarter of 2009, the Company
underwent its annual review of goodwill. Based upon the results of this review, which was
conducted as of October 1, 2009, no impairment charges to goodwill or the other intangible assets
were necessary as of the date of this review. The Company believes that nothing has occurred since
the review was performed through September 30, 2010 that would indicate a triggering event and
thereby necessitate an impairment charge to goodwill or the other intangible assets. The Company
will undergo its next annual goodwill review during the fourth quarter of 2010. At September 30,
2010 and December 31, 2009, the carrying value of goodwill was $61.7 million and $29.3 million,
respectively. The $32.4 million increase in the carrying value of goodwill during the nine months
ended September 30, 2010 mainly relates to the purchase of CCB on March 15, 2010 (see Note 8) and
additional contingent purchase price of $5.0 million paid in stock relating to the achievement of
the earn-out provisions of the MuniServices acquisition.
11. Share-Based Compensation:
The Company has a stock option and nonvested share plan. The Company created the 2002 Stock
Option Plan (the “Plan”) on November 7, 2002. The Plan was amended in 2004 (the “Amended Plan”) to
enable the Company to issue nonvested shares of stock to its employees and directors. The Amended
Plan was approved by the Company’s shareholders at its Annual Meeting on May 12, 2004. On March
19, 2010, the Company adopted a 2010 Stock Plan, which was approved by its shareholders at the 2010
Annual Meeting. The 2010 Stock Plan is a further amendment to the Amended Plan, and contains,
among other things, specific performance metrics with respect to performance-based stock awards. Up
to 2,000,000 shares of common stock may be issued under the 2010 Stock Plan. The 2010 Stock Plan
expires November 7, 2012.
The Company follows the provisions of FASB ASC Topic 718 “Compensation-Stock Compensation”
(“ASC 718”). As of September 30, 2010, total future compensation costs related to nonvested
awards of nonvested shares (not including nonvested shares granted under the Long-Term Incentive
Program (“LTI”)) is estimated to be $3.3 million with a weighted average remaining life of 2.3
years (not including nonvested shares granted under the LTI Programs). As of September 30, 2010,
there are no future compensation costs related to stock options and the remaining vested stock
options have a weighted average remaining life of 0.30 years. Based upon historical data, the
Company used an annual forfeiture rate of 14% for stock options and 15-40% for nonvested shares for
most of
16
Table of Contents
PORTFOLIO RECOVERY ASSOCIATES, INC.
NOTES TO CONSOLIDATED FINANCIAL STATEMENTS
(unaudited)
NOTES TO CONSOLIDATED FINANCIAL STATEMENTS
(unaudited)
the employee grants. Grants made to key employee hires and directors of the Company were
assumed to have no forfeiture rates associated with them due to the historically low turnover among
this group.
Total share-based compensation expense was $1,040,124 and $3,114,010 for the three and nine
months ended September 30, 2010, respectively. Total share-based compensation expense was $588,595
and $3,240,301 for the three and nine months ended September 30, 2009, respectively. The Company,
in conjunction with the renewal of employment agreements with its named executive officers and
other senior executives, awarded nonvested shares which vested on January 1, 2009. As a result of
the vesting of these shares, the Company recorded stock-based compensation expense in connection
with these shares in the amount of approximately $1.4 million during the first quarter of 2009.
Tax benefits resulting from tax deductions in excess of share-based compensation expense recognized
under the fair value recognition provisions of ASC 718 (windfall tax benefits) are credited to
additional paid-in capital in the Company’s Consolidated Balance Sheets. Realized tax shortfalls,
if any, are first offset against the cumulative balance of windfall tax benefits, if any, and then
charged directly to income tax expense. The total tax benefit realized from share-based
compensation was $309,529 and $777,115 for the three and nine months ended September 30, 2010,
respectively. The total tax benefit realized from share-based compensation was $731,867 and
$1,923,946 for the three and nine months ended September 30, 2009, respectively.
Stock Options
All options issued under the Amended Plan vest ratably over five years. Granted options expire
seven years from the applicable grant date. All outstanding stock options expire on January 16,
2011. Options granted to a single person cannot exceed 200,000 in a single year. At September 30,
2010, 895,000 options have been granted under the Amended Plan, of which 118,955 have been
cancelled. There were no antidilutive options outstanding for the three and nine months ended
September 30, 2010 and 2009, respectively.
The Company granted no options during the three and nine months ended September 30, 2010 and
2009. All of the stock options which have been granted under the Amended Plan were granted to
employees of the Company, except for 40,000 which were granted to non-employee directors. The
total intrinsic value of options exercised during the three and nine months ended September 30,
2010 was approximately $0 and $77,000, respectively. The total intrinsic value of options
exercised during the three and nine months ended September 30, 2009 was approximately $1,199,000
and $2,306,000, respectively.
The following summarizes all option related transactions from December 31, 2008 through
September 30, 2010 (amounts in thousands, except per share amounts):
| Weighted-Average | Weighted-Average | |||||||||||
| Options | Exercise Price Per | Fair Value Per | ||||||||||
| Outstanding | Share | Share | ||||||||||
December 31, 2008 |
123 | $ | 17.24 | $ | 3.21 | |||||||
Exercised |
(116 | ) | 16.51 | 3.24 | ||||||||
December 31, 2009 |
7 | 29.41 | 2.70 | |||||||||
Exercised |
(2 | ) | 28.45 | 2.92 | ||||||||
September 30, 2010 |
5 | $ | 29.79 | $ | 2.62 | |||||||
The following information is as of September 30, 2010 (amounts in thousands, except per share
amounts):
| Options Outstanding | Options Exercisable | |||||||||||||||||||||||||||
| Weighted-Average | Weighted-Average | |||||||||||||||||||||||||||
| Exercise | Number | Average Remaining | Exercise Price Per | Aggregate | Number | Exercise Price | Aggregate | |||||||||||||||||||||
| Price | Outstanding | Contractual Life | Share | Intrinsic Value | Exercisable | Per Share | Intrinsic Value | |||||||||||||||||||||
$29.79 |
5 | 0.3 | $ | 29.79 | $ | 174 | 5 | $ | 29.79 | $ | 174 | |||||||||||||||||
Total as of September 30, 2010 |
5 | 0.3 | $ | 29.79 | $ | 174 | 5 | $ | 29.79 | $ | 174 | |||||||||||||||||
17
Table of Contents
PORTFOLIO RECOVERY ASSOCIATES, INC.
NOTES TO CONSOLIDATED FINANCIAL STATEMENTS
(unaudited)
NOTES TO CONSOLIDATED FINANCIAL STATEMENTS
(unaudited)
The Company utilizes the Black-Scholes option pricing model to calculate the value of the
stock options when granted. This model was developed to estimate the fair value of traded options,
which have different characteristics than employee stock options. In addition, changes to the
subjective input assumptions can result in materially different fair market value estimates.
Therefore, the Black-Scholes model may not necessarily provide a reliable single measure of the
fair value of employee stock options.
Nonvested Shares
With the exception of the awards made pursuant to the LTI Program and a few employee and
director grants, the terms of the nonvested share awards are similar to those of the stock option
awards, wherein the nonvested shares vest ratably over five years and are expensed over their
vesting period.
The following summarizes all nonvested share transactions (excluding shares granted under the
LTI Programs) from December 31, 2008 through September 30, 2010 (amounts in thousands, except per
share amounts):
| Nonvested Shares | Weighted-Average Price | |||||||
| Outstanding | at Grant Date | |||||||
December 31, 2008 |
98 | $ | 41.60 | |||||
Granted |
70 | 34.22 | ||||||
Vested |
(82 | ) | 36.62 | |||||
Cancelled |
(5 | ) | 42.20 | |||||
December 31, 2009 |
81 | 40.24 | ||||||
Granted |
52 | 51.64 | ||||||
Vested |
(34 | ) | 41.52 | |||||
Cancelled |
(5 | ) | 39.66 | |||||
September 30, 2010 |
94 | $ | 46.15 | |||||
The total grant date fair value of shares vested during the three and nine months ended
September 30, 2010 was $497,077 and $1,387,399, respectively. The total grant date fair value of
shares vested during the three and nine months ended September 30, 2009 was $464,690 and
$2,094,180, respectively.
Long-Term Incentive Programs
Pursuant to the Amended Plan, on March 30, 2007, January 4, 2008, January 20, 2009 and January
14, 2010, the Compensation Committee approved the grant of 96,550, 80,000, 108,720 and 53,656
performance-based nonvested shares, respectively. All shares granted under the LTI Programs were
granted to key employees of the Company. For both the 2007 and 2008 grants, no estimated
compensation costs have been accrued or recognized because the achievements of the performance
targets of the programs were either not met or deemed unlikely to be achieved. The 2009 grant is
performance based and cliff vests after the requisite service period of two to three years if
certain financial goals are met. The goals are based upon diluted earnings per share (“EPS”)
totals for 2009, the return on owners’ equity for the three year period beginning on January 1,
2009 and ending December 31, 2011, and the relative total shareholder return as compared to a peer
group for the same three year period. The number of shares vested can double if the financial
goals are exceeded and no shares will vest if the financial goals are not met. The Company is
expensing the nonvested share grant over the requisite service period of two to three years
beginning on January 1, 2009. If the Company believes that the number of shares granted will be
more or less than originally projected, an adjustment to the expense will be made at that time
based on the probable outcome. The EPS component of the 2009 plan was not achieved and therefore
no compensation expense was recognized during 2009 or the three and nine months ended September 30,
2010. The 2010 grant is performance based and cliff vests after the requisite service period of
two to three years if certain financial goals are met. The goals are based upon diluted EPS totals
for 2010, the return on owners’ equity for the three year period beginning on January 1, 2010 and
18
Table of Contents
PORTFOLIO RECOVERY ASSOCIATES, INC.
NOTES TO CONSOLIDATED FINANCIAL STATEMENTS
(unaudited)
NOTES TO CONSOLIDATED FINANCIAL STATEMENTS
(unaudited)
ending December 31, 2012, and the relative total shareholder return as compared to a peer group for
the same three year period. The number of shares vested can double if the financial goals are
exceeded and no shares will vest if the financial goals are not met. The Company is expensing the
nonvested share grant over the requisite service period of two to three years beginning on January
1, 2010. If the Company believes that the number of shares granted will be more or less than
originally projected, an adjustment to the expense will be made at that time based on the probable
outcome. At September 30, 2010, total future compensation costs related to nonvested share awards
granted under the 2009 and 2010 LTI Programs are estimated to be approximately $3.5 million. The
Company assumed a 7.5% forfeiture rate for this grant and the remaining shares have a weighted
average life of 1.67 years at September 30, 2010.
12. Income Taxes:
The Company follows the guidance of FASB ASC Topic 740 “Income Taxes” (“ASC 740”) as it
relates to the provision for income taxes and uncertainty in income taxes. The guidance prescribes
a recognition threshold and measurement attribute for the financial statement recognition and
measurement of a tax position taken or expected to be taken in a tax return. There were no
unrecognized tax benefits at both September 30, 2010 and 2009.
The Company was notified on June 21, 2007 that it was being examined by the Internal Revenue
Service for the 2005 calendar year. The IRS has concluded its audit and on March 19, 2009 issued
Form 4549-A, Income Tax Examination Changes for tax years ending December 31, 2007, 2006 and 2005.
The IRS has proposed that cost recovery for tax revenue recognition does not clearly reflect
taxable income and that unused line fees paid on credit facilities should be capitalized and
amortized rather than taken as a current deduction. On April 22, 2009, the Company filed a formal
protest of the findings contained in the examination report prepared by the IRS. The Company
believes it has sufficient support for the technical merits of its positions and that it is
more-likely-than-not these positions will ultimately be sustained; therefore, a reserve for
uncertain tax positions is not necessary. If the Company is unsuccessful in its appeal, it might
ultimately be required to pay the related deferred taxes and any potential interest, possibly
requiring additional financing from other sources.
At September 30, 2010, the tax years subject to examination by the major taxing jurisdictions,
including the Internal Revenue Service, are 2003 and 2005 and subsequent years. The 2003 tax year
remains open to examination because of a net operating loss that originated in that year but was
not fully utilized until the 2005 tax year. The examination period for the 2005, 2006 and 2007 tax
years were extended through December 31, 2011.
ASC 740 requires the recognition of interest, if the tax law would require interest to be paid
on the underpayment of taxes, and recognition of penalties, if a tax position does not meet the
minimum statutory threshold to avoid payment of penalties. Penalties and interest may be
classified as either penalties and interest expense or income tax expense. Management has elected
to classify accrued penalties and interest as income tax expense. No interest or penalties were
accrued or reversed in the first three or nine months of 2009 or 2010.
13. Earnings per Share:
Basic EPS are computed by dividing net income available to common shareholders of PRA Inc by
weighted average common shares outstanding. Diluted EPS are computed using the same components as
basic EPS with the denominator adjusted for the dilutive effect of stock options and nonvested
share awards. Share-based awards that are contingent upon the attainment of performance goals are
not included in the computation of diluted EPS until the performance goals have been attained. The
following tables provide a reconciliation between the computation of basic EPS and diluted EPS for
the three and nine months ended September 30, 2010 and 2009 (amounts in thousands, except per share
amounts):
19
Table of Contents
PORTFOLIO RECOVERY ASSOCIATES, INC.
NOTES TO CONSOLIDATED FINANCIAL STATEMENTS
(unaudited)
NOTES TO CONSOLIDATED FINANCIAL STATEMENTS
(unaudited)
| For the three months ended September 30, | ||||||||||||||||||||||||
| Net Income | 2010 | Net Income | 2009 | |||||||||||||||||||||
| attributable to Portfolio | Weighted Average | attributable to Portfolio | Weighted Average | |||||||||||||||||||||
| Recovery Associates, Inc. | Common Shares | EPS | Recovery Associates, Inc. | Common Shares | EPS | |||||||||||||||||||
Basic EPS |
$ | 18,481 | 17,058 | $ | 1.08 | $ | 10,096 | 15,466 | $ | 0.65 | ||||||||||||||
Dilutive effect of stock options
and nonvested share awards |
35 | 36 | ||||||||||||||||||||||
Diluted EPS |
$ | 18,481 | 17,093 | $ | 1.08 | $ | 10,096 | 15,502 | $ | 0.65 | ||||||||||||||
| For the nine months ended September 30, | ||||||||||||||||||||||||
| Net Income | 2010 | Net Income | 2009 | |||||||||||||||||||||
| attributable to Portfolio | Weighted Average | attributable to Portfolio | Weighted Average | |||||||||||||||||||||
| Recovery Associates, Inc. | Common Shares | EPS | Recovery Associates, Inc. | Common Shares | EPS | |||||||||||||||||||
Basic EPS |
$ | 52,811 | 16,740 | $ | 3.15 | $ | 31,892 | 15,392 | $ | 2.07 | ||||||||||||||
Dilutive effect of stock
options and nonvested share
awards |
52 | 36 | ||||||||||||||||||||||
Diluted EPS |
$ | 52,811 | 16,792 | $ | 3.15 | $ | 31,892 | 15,428 | $ | 2.07 | ||||||||||||||
There were no antidilutive options outstanding for the three and nine months ended
September 30, 2010 and 2009.
14. Commitments and Contingencies:
Employment Agreements:
The Company has employment agreements, most of which expire on December 31, 2011, with all of
its executive officers and with several members of its senior management group. Such agreements
provide for base salary payments as well as bonuses which are based on the attainment of specific
management goals. Future compensation under these agreements is approximately $10.2 million. The
agreements also contain confidentiality and non-compete provisions.
Leases:
The Company is party to various operating and capital leases with respect to its facilities
and equipment. For further discussion of these leases please refer to the Company’s audited
consolidated financial statements and notes thereto included in the Company’s Annual Report on Form
10-K, as filed for the year ended December 31, 2009.
Forward Flow Agreements:
The Company is party to several forward flow agreements that allow for the purchase of
defaulted consumer receivables at pre-established prices. The maximum remaining amount to be
purchased under forward flow agreements at September 30, 2010 is approximately $104.8 million.
Business Acquisition:
In connection with the Company’s acquisition of 62% of the membership units of CCB on March
15, 2010, the Company acquired the right to purchase the remaining 38% of the membership units of
CCB not held by the Company at a predetermined price within the next five years. Also, Claims
Compensation Bureau, Inc., the holder
of such remaining 38% interest in CCB can require the Company to purchase its interest during
the period beginning on March 1, 2012 and ending on February 28, 2018. While the actual amount or
timing of any future payment is unknown at this time, the maximum amount of consideration to be
paid for such 38% interest is $22.8 million. In addition, the Company expects to pay the remaining
$1.0 million deferred portion of the acquisition date consideration for its 62% interest in CCB by
December 31, 2010, upon the expected occurrence of certain events.
20
Table of Contents
PORTFOLIO RECOVERY ASSOCIATES, INC.
NOTES TO CONSOLIDATED FINANCIAL STATEMENTS
(unaudited)
NOTES TO CONSOLIDATED FINANCIAL STATEMENTS
(unaudited)
Litigation:
The Company is from time to time subject to routine legal claims and proceedings, most of
which are incidental to the ordinary course of its business. The Company initiates lawsuits
against consumers and is occasionally countersued by them in such actions. Also, consumers, either
individually, as members of a class action, or through a governmental entity on behalf of
consumers, may initiate litigation against the Company, in which they allege that the Company has
violated a state or federal law in the process of collecting on an account. From time to time,
other types of lawsuits are brought against the Company. The Company maintains appropriate levels
of errors and omissions insurance coverage to protect against financial losses associated with
potential litigation involving the Company, and while it is not expected that these or any other
legal proceedings or claims in which the Company is involved will, either individually or in the
aggregate, have a material adverse impact on the results of operations, liquidity or the Company’s
financial condition, the matters described below fall outside of the normal parameters of the
Company’s routine legal proceedings.
PRA is currently a defendant in a purported class action counterclaim entitled PRA v.
Barkwell, 4:09-cv-00113-CDL, which was filed in response to a motion filed by PRA that sought to
confirm an arbitration award, in the amount of $9,781.43. The counterclaim, which was filed against
PRA, the National Arbitration Forum (“NAF”) and MBNA America Bank, N.A., on July 29, 2009 in the
Superior Court of Muscogee County, Georgia, and has since been removed to the United States
District Court for the Middle District of Georgia, where it is currently pending. The counterclaim
alleges that in pursuing arbitration claims against Barkwell and other consumer debtors, pursuant
to the terms and conditions of their respective cardholder agreements, PRA breached a duty of good
faith and fair dealing and made negligent misrepresentations concerning its “arbitration
practices.” The counterclaim asserts that because NAF was financially tied to Axiant, LLC, a
large, nationwide debt collector, NAF lacked the necessary independence and impartiality to conduct
arbitration proceedings, such as the ones filed by PRA, including the arbitration claim that was
filed against Mr. Barkwell. Barkwell asserts that PRA knew, or should have known, of the
relationship between NAF and Axiant, and brought this action on behalf of a purported class of
consumers to, among other things, vacate the arbitration awards that PRA has obtained before NAF
and have PRA disgorge the amounts collected with respect to such awards. While it is not possible
at this time to accurately estimate the possible loss, if any, as the Company believes it has
meritorious defenses to the allegations made in this counterclaim and intends to defend itself
vigorously against them. This matter has not progressed to the discovery stage yet, therefore
the Company currently lacks the necessary information to determine the aggregate amount of
arbitration claims potentially impacted by the purported class herein.
As previously disclosed, PRA is also defendant in another purported class action related to
matters previously brought before NAF, styled PRA v. Freeman (Case No.: 10-CVD-1003) which was
filed in the District Court for Wake County, North Carolina on or about March 26, 2010. The court
in PRA v. Freeman recently heard arguments on the motion to dismiss that PRA had filed earlier this
year and has informed the parties that the matter will be dismissed, pending submission of an
appropriate order. PRA anticipates submitting such an order and having the matter dismissed
imminently.
The Company was also a defendant in a purported enforcement action brought by the Attorney
General for the State of Missouri. The action, filed in August 2009, sought relief for Missouri
consumers that had allegedly been injured as a result of certain of the Company’s alleged
collection practices. The Company denied any wrongdoing with respect to the allegations in the
complaint and on June 25, 2010, the Missouri Circuit Court dismissed the matter in its entirety.
On July 26, 2010, the Missouri Attorney General filed a notice of appeal.
15. Fair Value Measurements and Disclosures:
(a) Disclosures about Fair Value of Financial Instruments:
In accordance with the disclosure requirements of FASB ASC Topic 825, “Financial Instruments”
(“ASC 825”), the table below summarizes fair value estimates for the Company’s financial
instruments. The total of the fair value calculations presented does not represent, and should not
be construed to represent, the underlying value of the
21
Table of Contents
PORTFOLIO RECOVERY ASSOCIATES, INC.
NOTES TO CONSOLIDATED FINANCIAL STATEMENTS
(unaudited)
NOTES TO CONSOLIDATED FINANCIAL STATEMENTS
(unaudited)
Company. The carrying amounts in the table are recorded in the consolidated balance sheet under
the indicated captions (amounts in thousands):
| September 30, 2010 | December 31, 2009 | |||||||||||||||
| Carrying Amount | Estimated Fair Value | Carrying Amount | Estimated Fair Value | |||||||||||||
Financial assets: |
||||||||||||||||
Cash and cash equivalents |
$ | 20,297 | $ | 20,297 | $ | 20,265 | $ | 20,265 | ||||||||
Finance receivables, net |
807,239 | 1,067,140 | 693,462 | 839,417 | ||||||||||||
Financial liabilities: |
||||||||||||||||
Line of credit |
$ | 288,500 | $ | 288,500 | $ | 319,300 | $ | 319,300 | ||||||||
Long-tern debt |
998 | 998 | 1,499 | 1,499 | ||||||||||||
Derivative instrument |
537 | 537 | 701 | 701 | ||||||||||||
Disclosure of the estimated fair values of financial instruments often requires the use of
estimates. The Company uses the following methods and assumptions to estimate the fair value of
financial instruments:
Cash and cash equivalents: The carrying amount approximates fair value.
Finance receivables, net: The Company records purchased receivables at cost, which represents
a significant discount from the contractual receivable balances due. The Company computed the
estimated fair value of these receivables using proprietary pricing models that the Company
utilizes to make portfolio purchase decisions.
Line of credit: The carrying amount approximates fair value, as the interest rates
approximate the rate currently offered to the Company for similar debt instruments of comparable
maturities by the Company’s bankers.
Long-term debt: The carrying amount approximates fair value, as the interest rates
approximate the rate currently offered to the Company for similar debt instruments of comparable
maturities by the Company’s bankers.
Derivative instrument: The interest rate swap is recorded at estimated fair value, which is
determined using pricing models developed based on the LIBOR swap rate and other observable market
data, adjusted for non-performance risk of both the counterparty and the Company.
(b) Fair Value Hierarchy:
The Company records its derivative instrument at estimated fair value on a recurring basis.
The accompanying consolidated financial statements include estimated fair value information
regarding its derivative instrument as of September 30, 2010 and December 31, 2009, as required by
FASB ASC Topic 820, “Fair Value Measurements and Disclosures” (“ASC 820”). ASC 820 defines fair
value as the price that would be received to sell an asset or paid to transfer a liability in an
orderly transaction between market participants at the measurement date. ASC 820 also
requires the consideration of differing levels of inputs in the determination of fair values.
Those levels of input are summarized as follows:
• Level 1 – Quoted prices in active markets for identical assets and liabilities.
• Level 2 – Observable inputs other than Level 1 quote prices, such as quoted prices for
similar instruments in active markets, quoted prices for identical or similar instruments in
markets that are not active, and model-based valuation techniques for which all significant
assumptions are observable in the market.
• Level 3 – Unobservable inputs that are supported by little or no market activity.
Level 3 assets and liabilities include financial instruments whose value is determined using
pricing models, discounted cash flow
22
Table of Contents
PORTFOLIO RECOVERY ASSOCIATES, INC.
NOTES TO CONSOLIDATED FINANCIAL STATEMENTS
(unaudited)
NOTES TO CONSOLIDATED FINANCIAL STATEMENTS
(unaudited)
methodologies, or similar techniques as well as instruments
for which the determination of fair value requires significant management judgment or estimation.
The level in the fair value hierarchy within which a fair value measurement in its entirety
falls is based on the lowest level input that is significant to the fair value measurement in its
entirety.
The placement in the fair value hierarchy of the Company’s interest rate swap derivative
instrument as of September 30, 2010 and December 31, 2009 is Level 2 based on the Level 2 inputs
described in section (a) above. Refer to Note 5 for further information regarding the derivative
instrument.
16. Recent Accounting Pronouncements:
In June 2009, the FASB issued guidance on accounting for transfers of financial assets to
improve the reporting for the transfer of financial assets. The guidance must be applied as of the
beginning of each reporting entity’s first annual reporting period that begins after November 15,
2009, for interim periods within that first annual reporting period and for interim and annual
reporting periods thereafter. Earlier application is prohibited. The Company adopted the guidance
during the first quarter of 2010, which had no material impact on its consolidated financial
statements.
In June 2009, the FASB issued guidance on consolidation of variable interest entities to
improve financial reporting by enterprises involved with variable interest entities and to provide
more relevant and reliable information to users of financial statements. The guidance is effective
as of the beginning of each reporting entity’s first annual reporting period that begins after
November 15, 2009, for interim periods within that first annual reporting period, and for interim
and annual reporting periods thereafter. Earlier application is prohibited. The Company adopted
the guidance during the first quarter of 2010, which had no material impact on its consolidated
financial statements.
In January 2010, the FASB issued Accounting Standards Update (“ASU”) No. 2010-06, “Fair Value
Measurements and Disclosures” (Topic 820): “Improving Disclosures about Fair Value Measurements”
(“ASU 2010-06”), which clarifies and expands disclosure requirements related to fair value
measurements. Disclosures are required for significant transfers between levels in the fair value
hierarchy. Activity in Level 3 fair value measurements is to be presented on a gross, rather than
net, basis. The update clarifies how the appropriate level of disaggregation should be determined
and emphasizes that information sufficient to permit reconciliation between fair value measurements
and line items on the financial statements should be provided. The update is effective for interim
and annual reporting periods beginning after December 15, 2009, except for the expanded disclosures
related to activity in Level 3 fair value measurements, which are effective one year later. The
Company adopted ASU 2010-06 during the first quarter of 2010, which had no material effect on its
consolidated financial statements.
In April 2010, the FASB issued ASU No. 2010-18, “Receivables” (Topic 310): “Effect of a Loan
Modification When the Loan Is Part of a Pool that is Accounted for as a Single Asset” (‘ASU
2010-18”), which clarifies the accounting for acquired loans that have evidence of a deterioration
in credit quality since origination (referred to as “Subtopic 310-30 Loans”). Under ASU 2010-18,
an entity may not apply troubled debt restructuring (“TDR”) accounting guidance to individual
Subtopic 310-30 loans that are part of a pool, even if the modification of those loans would
otherwise be considered a troubled debt restructuring. Once a pool is established, individual
loans should not be removed from the pool unless the entity sells, forecloses, or writes off the
loan. Entities would
continue to consider whether the pool of loans is impaired if expected cash flows for the pool
change. Subtopic 310-30 loans that are accounted for individually would continue to be subject to
TDR accounting guidance. A one-time election to terminate accounting for loans as a pool, which
may be made on a pool-by-pool basis, is provided upon adoption of ASU 2010-18. ASU 2010-18 is
effective for interim or annual periods ending on or after July 15, 2010. The Company adopted ASU
2010-18 during the third quarter of 2010, which had no material effect on its consolidated
financial statements.
In July, 2010, the FASB issued ASU No. 2010-20, “Receivables” (Topic 310) “Disclosures about
the Credit Quality of Financing Receivables and the Allowance for Credit Losses” (“ASU 2010-20”),
which requires
23
Table of Contents
PORTFOLIO RECOVERY ASSOCIATES, INC.
NOTES TO CONSOLIDATED FINANCIAL STATEMENTS
(unaudited)
NOTES TO CONSOLIDATED FINANCIAL STATEMENTS
(unaudited)
significant new disclosures about the allowance for credit losses and the credit
quality of financing receivables. The requirements are intended to enhance transparency regarding
credit losses and the credit quality of loan and lease receivables. Under this statement,
allowance for credit losses and fair value are to be disclosed by portfolio segment, while credit
quality information, impaired financing receivables and nonaccrual status are to be presented by
class of financing receivable. Disclosure of the nature and extent, the financial impact and
segment information of troubled debt restructurings will also be required. The disclosures are to
be presented at the level of disaggregation that management uses when assessing and monitoring the
portfolio’s risk and performance. ASU 2010-20 is effective for interim and annual reporting
periods ending on or after December 15, 2010. The adoption of ASU 2010-20 by the Company is not
expected to have a material effect on its consolidated financial statements.
24
Table of Contents
Item 2. Management’s Discussion and Analysis of Financial Condition and Results of Operations
Cautionary Statements Pursuant to Safe Harbor Provisions of the Private Securities Litigation
Reform Act of 1995:
This report contains forward-looking statements within the meaning of the federal securities
laws. These forward-looking statements involve risks, uncertainties and assumptions that, if they
never materialize or prove incorrect, could cause our results to differ materially from those
expressed or implied by such forward-looking statements. All statements, other than statements of
historical fact, are forward-looking statements, including statements regarding overall trends,
gross margin trends, operating cost trends, liquidity and capital needs and other statements of
expectations, beliefs, future plans and strategies, anticipated events or trends, and similar
expressions concerning matters that are not historical facts. The risks, uncertainties and
assumptions referred to above may include the following:
| • | changes in the economic or inflationary environment which have an adverse effect on the ability of consumers to pay their debts or on the stability of the financial system as a whole; | ||
| • | our ability to purchase defaulted consumer receivables at appropriate prices; | ||
| • | changes in the business practices of credit originators in terms of selling defaulted consumer receivables or outsourcing defaulted consumer receivables to third-party contingent fee collection agencies; | ||
| • | our ability to retain, renegotiate or replace our existing credit facility; | ||
| • | risks relating to the performance of our computer and telecommunications systems and our ability to successfully anticipate, manage or adopt technological advances within our industry; | ||
| • | changes in government regulations that affect our ability to collect sufficient amounts on our acquired or serviced receivables; | ||
| • | changes in or interpretation of tax laws; | ||
| • | deterioration in economic conditions in the United States that may have an adverse effect on our collections, results of operations, revenue and stock price; | ||
| • | changes in bankruptcy or collection agency laws that could negatively affect our business; | ||
| • | our ability to employ and retain qualified employees, especially collection and information technology personnel; | ||
| • | our work force could become unionized in the future, which could adversely affect the stability of our production and increase our costs; | ||
| • | changes in the credit or capital markets, which affect our ability to borrow money or raise capital to purchase or service defaulted consumer receivables; | ||
| • | the degree and nature of our competition; | ||
| • | our ability to comply with the provisions of the Sarbanes-Oxley Act of 2002 and the rules and regulations promulgated thereunder; | ||
| • | our ability to retain existing clients and obtain new clients for our fee-for-service businesses; | ||
| • | the sufficiency of our funds generated from operations, existing cash and available borrowings to finance our current operations; and | ||
| • | the risk factors listed from time to time in our filings with the Securities and Exchange Commission (the “SEC”). |
You should assume that the information appearing in this quarterly report is accurate only as
of the date it was issued. Our business, financial condition, results of operations and prospects
may have changed since that date.
For a discussion of the risks, uncertainties and assumptions that could affect our future
events, developments or results, you should carefully review the following “Management’s Discussion
and Analysis of Financial Condition and Results of Operations”, as well as the discussion of
“Business” and “Risk Factors” described in our 2009 Annual Report on Form 10-K, filed on February
16, 2010.
25
Table of Contents
Our forward-looking statements could be wrong in light of these and other risks, uncertainties
and assumptions. The future events, developments or results described in this report could turn out
to be materially different. We have no obligation to publicly update or revise our forward-looking
statements after the date of this report and you should not expect us to do so.
Investors should also be aware that while we do, from time to time, communicate with
securities analysts and others, we do not, by policy, selectively disclose to them any material
nonpublic information or other confidential commercial information. Accordingly, stockholders
should not assume that we agree with any statement or report issued by any analyst regardless of
the content of the statement or report. We do not, by policy, confirm forecasts or projections
issued by others. Thus, to the extent that reports issued by securities analysts contain any
projections, forecasts or opinions, such reports are not our responsibility.
Overview
Portfolio Recovery Associates is a diversified financial and business services company. We
are a leading company in the business of purchasing and collecting defaulted consumer receivables.
Those finance receivables fall into two general categories: bankruptcy portfolios and charged-off
“core” portfolios. Revenue for this part of our business consists of cash collections received
less amounts applied to principal on the Company’s owned debt portfolios.
Through our subsidiaries, we provide a broad range of fee-based business services. Those
services include collateral location services to credit originators through our IGS subsidiary;
revenue administration, discovery, and compliance services to governmental entities through both
our RDS and MuniServices subsidiaries; and class action claims recovery services through our CCB
subsidiary.
Portfolio Recovery Associates is headquartered in Norfolk, Virginia, and employs approximately
2,400 team members. The shares of Portfolio Recovery Associates are traded on the NASDAQ Global
Select Market under the symbol “PRAA.”
On July 21, 2010 the Dodd-Frank Wall Street Reform and Consumer Protection Act (the Dodd-Frank
Act) became law. The Dodd-Frank Act restructures the regulation and supervision of the financial
services industry. Many of the provisions of the Dodd-Frank Act have extended implementation
periods and delayed effective dates and will require extensive rulemaking by regulatory
authorities. The ultimate impact of the act cannot be determined.
Earnings Summary
During the third quarter of 2010, net income was $18.5 million, or $1.08 per diluted share,
compared with $10.1 million, or $0.65 per diluted share, in the third quarter of 2009. Total
revenue was $95.5 million in the third quarter of 2010, up 39.2% from the same quarter one year
earlier. Revenue in the recently completed quarter consisted of $80.0 million in income recognized
on finance receivables, net of allowance charges, and $15.5 million in fee income. Income
recognized on finance receivables, net of allowance charges, increased $25.7 million, or 47.3%,
over the same period in 2009, primarily as a result of a significant increase in cash collections.
Cash collections were $137.4 million in the third quarter of 2010, up 48.7% over $92.4 million in
the third quarter of 2009. During the quarter, the Company recorded $6.5 million in net allowance
charges, compared with $8.0 million in the comparable quarter of 2009. The Company’s performance
has been positively impacted by operational efficiencies surrounding the cash collections process,
including the continued refinement of automated dialer technology and account scoring analytics.
Additionally, the Company has continued to develop its internal legal collection staff resources,
which enables us to place accounts into that channel that otherwise would have been prohibitively
expense for legal action.
Fee income increased from $14.2 million in the third quarter of 2009 to $15.5 million in the
third quarter of 2010, as a result of the acquisition of a majority interest of CCB in March 2010.
CCB provides class action claim processing services to businesses. Excluding the fee income
attributable to CCB, fee income declined slightly over the third quarter of 2009, due primarily to
the adverse impact of the economic slowdown on general business growth and governmental tax
revenues.
26
Table of Contents
Operating expenses were $62.7 million in the third quarter of 2010, up 26% over the third
quarter of 2009, due primarily to increased compensation expense and legal costs. Compensation
expense increased primarily as a result of larger staff sizes. Legal and agency fees and costs
increased from $11.3 million in the third quarter of 2009 to $16.7 million in the third quarter of
2010. This increase was the result of several factors, including growth in the size of our owned
debt portfolios, expansion of our internal legal collection resources, and refinement of our
internal scoring methodology that expanded our account selections for legal action.
Results of Operations
The results of operations include the financial results of Portfolio Recovery Associates, Inc.
and all of our subsidiaries, all of which are in the receivables management business. Under the
guidance of the FASB ASC Topic 280 “Segment Reporting” (“ASC 280”), we have determined that we have
several operating segments that meet the aggregation criteria of ASC 280, and therefore, we have
one reportable segment, receivables management, based on similarities among the operating units
including homogeneity of services, service delivery methods and use of technology.
The following table sets forth certain operating data as a percentage of total revenues for
the periods indicated:
| For the Three Months | For the Nine Months | |||||||||||||||
| Ended September 30, | Ended September 30, | |||||||||||||||
| 2010 | 2009 | 2010 | 2009 | |||||||||||||
Revenues: |
||||||||||||||||
Income recognized on finance receivables, net |
83.8 | % | 79.2 | % | 82.7 | % | 76.8 | % | ||||||||
Fee income |
16.2 | % | 20.8 | % | 17.3 | % | 23.2 | % | ||||||||
Total revenues |
100.0 | % | 100.0 | % | 100.0 | % | 100.0 | % | ||||||||
Operating expenses: |
||||||||||||||||
Compensation and employee services |
32.7 | % | 39.2 | % | 33.7 | % | 38.5 | % | ||||||||
Legal and agency fees and costs |
17.5 | % | 16.5 | % | 16.0 | % | 16.6 | % | ||||||||
Outside fees and services |
3.6 | % | 3.3 | % | 3.5 | % | 3.3 | % | ||||||||
Communications |
4.2 | % | 5.1 | % | 4.8 | % | 5.4 | % | ||||||||
Rent and occupancy |
1.4 | % | 1.9 | % | 1.4 | % | 1.7 | % | ||||||||
Depreciation and amortization |
3.4 | % | 3.3 | % | 3.3 | % | 3.3 | % | ||||||||
Other operating expenses |
2.8 | % | 3.4 | % | 2.8 | % | 3.1 | % | ||||||||
Total operating expenses |
65.6 | % | 72.7 | % | 65.5 | % | 71.9 | % | ||||||||
Income from operations |
34.4 | % | 27.3 | % | 34.5 | % | 28.1 | % | ||||||||
Other income and (expense): |
||||||||||||||||
Interest income |
0.0 | % | 0.0 | % | 0.0 | % | 0.1 | % | ||||||||
Interest expense |
(2.3 | %) | (2.9 | %) | (2.4 | %) | (2.8 | %) | ||||||||
Income before income taxes |
32.1 | % | 24.4 | % | 32.1 | % | 25.4 | % | ||||||||
Provision for income taxes |
12.4 | % | 9.8 | % | 12.4 | % | 10.0 | % | ||||||||
Net income |
19.7 | % | 14.6 | % | 19.7 | % | 15.4 | % | ||||||||
Less net income attributable to redeemable noncontrolling interest |
(0.3 | %) | 0.0 | % | (0.2 | %) | 0.0 | % | ||||||||
Net income attributable to Portfolio Recovery Associates, Inc. |
19.4 | % | 14.6 | % | 19.5 | % | 15.4 | % | ||||||||
We use the following terminology throughout our reports: “Cash Receipts” refers to
collections on our owned portfolios together with fee income. “Cash Collections” refers to
collections on our owned portfolios only, exclusive of fee income. “Fee Income” refers to revenues
generated from our contingent fee and fee-for-service subsidiaries.
27
Table of Contents
Three Months Ended September 30, 2010 Compared To Three Months Ended September 30, 2009
Revenues
Total revenues were $95.5 million for the three months ended September 30, 2010, an increase
of $26.9 million or 39.2% compared to total revenues of $68.6 million for the three months ended
September 30, 2009.
Income Recognized on Finance Receivables, net
Income recognized on finance receivables, net was $80.0 million for the three months ended
September 30, 2010, an increase of $25.7 million or 47.3% compared to income recognized on finance
receivables, net of $54.3 million for the three months ended September 30, 2009. The increase was
primarily due to an increase in our cash collections on our owned defaulted consumer receivables to
$137.4 million for the three months ended September 30, 2010 compared to $92.4 million for the
three months ended September 30 2009, an increase of $45.0 million or 48.7%. During the three
months ended September 30, 2010, we acquired defaulted consumer receivables portfolios with an
aggregate face value amount of $1.38 billion at a cost of $92.5 million. During the three months
ended September 30, 2009, we acquired defaulted consumer receivable portfolios with an aggregate
face value of $1.75 billion at a cost of $76.7 million. In any period, we acquire defaulted
consumer receivables that can vary dramatically in their age, type and ultimate collectability. We
may pay significantly different purchase rates for purchased receivables within any period as a
result of this quality fluctuation. In addition, market forces can drive pricing rates up or down
in any period, irrespective of other quality fluctuations. As a result, the average purchase rate
paid for any given period can fluctuate dramatically based on our particular buying activity in
that period. However, regardless of the average purchase price and for similar time frames, we
intend to target a similar internal rate of return, after direct expenses, in pricing our portfolio
acquisitions; therefore, the absolute rate paid is not necessarily relevant to estimated
profitability of a period’s buying.
Income recognized on finance receivables, net is shown net of changes in valuation allowances
recognized under FASB ASC Topic 310-30 “Loans and Debt Securities Acquired with Deteriorated Credit
Quality” (“ASC 310-30”), which requires that a valuation allowance be recorded for significant
decreases in expected cash flows or a change in timing of cash flows which would otherwise require
a reduction in the stated yield on a pool of accounts. For the three months ended September 30,
2010, we recorded net allowance charges of $6.5 million, the majority of which related to
non-bankruptcy portfolios acquired in 2005 through 2007. For the three months ended September 30,
2009, we recorded net allowance charges of $8.0 million, the majority of which related to
non-bankruptcy portfolios acquired in 2005 through 2008. In any given period, we may be required
to record valuation allowances due to pools of receivables underperforming our expectations.
Factors that may contribute to the recording of valuation allowances may include both internal as
well as external factors. External factors which may have an impact on the collectability, and
subsequently to the overall profitability of purchased pools of defaulted consumer receivables
include: overall market pricing for pools of consumer receivables (which is driven by both supply
and demand), new laws or regulations relating to collections, new interpretations of existing laws
or regulations, and the overall condition of the economy. Internal factors which may have an
impact on the collectability, and subsequently the overall profitability of purchased pools of
defaulted consumer receivables would include: necessary revisions to initial and post-acquisition
scoring and modeling estimates, non-optimal operational activities (which relates to the collection
and movement of accounts on both our collection floor and external channels), as well as decreases
in productivity related to turnover and tenure of our collection staff.
Fee Income
Fee income was $15.5 million for the three months ended September 30, 2010, an increase of
$1.3 million or 9.2% compared to fee income of $14.2 million for the three months ended September
30, 2009. Fee income increased primarily due to the revenue generated as a result the acquisition
of CCB on March 15, 2010, offset by a decrease in revenue generated by our government services
businesses and our IGS fee-for-service business as compared to the prior year period. Excluding
the fee income attributable to CCB, fee income declined slightly over the third quarter of 2009,
due primarily to the adverse impact of the economic slowdown on general business growth and
governmental tax revenues.
28
Table of Contents
Operating Expenses
Total operating expenses were $62.7 million for the three months ended September 30, 2010, an
increase of $12.9 million or 25.9% compared to total operating expenses of $49.8 million for the
three months ended September 30, 2009. Total operating expenses, including compensation and
employee services expenses, were 41.0% of cash receipts for the three months ended September 30,
2010 compared to 46.7% for the same period in 2009.
Compensation and Employee Services
Compensation and employee services expenses were $31.2 million for the three months ended
September 30, 2010, an increase of $4.4 million or 16.4% compared to compensation and employee
services expenses of $26.8 million for the three months ended September 30, 2009. This increase is
mainly due to an overall increase in our owned portfolio collection staff as well as the hiring of
non-collection personnel mainly due to the expansion of our information technology department.
Compensation and employee services expenses increased as total employees grew 12.8% to 2,421 as of
September 30, 2010 from 2,146 as of September 30, 2009. Compensation and employee services
expenses as a percentage of cash receipts decreased to 20.4% for the three months ended September
30, 2010 from 25.2% of cash receipts for the same period in 2009.
Legal and Agency Fees and Costs
Legal and agency fees and costs were $16.7 million for the three months ended September 30,
2010, an increase of $5.4 million or 47.8% compared to legal and agency fees and costs of $11.3
million for the three months ended September 30, 2009. Of the $5.4 million increase, $6.2 million
was attributable to an increase in legal fees and costs resulting from accounts referred to both
our in-house attorneys and outside independent contingent fee attorneys. This increase was largely
due to the refinement of our internal scoring methodology that expanded our account selections for
legal action. Growth in the size of our owned debt portfolios and expansion of our internal legal
collection resources were also contributing factors. The increase in legal fees and costs was
partially offset by a $0.8 million decline in agency fees. Total legal fees paid to independent
contingent fee attorneys for the three months ended September 30, 2010 were 22.6% of external legal
cash collections compared to 23.7% for the three months ended September 30, 2009. These legal fees
represent the contingent fees for the cash collections generated by our independent third party
attorney network. Total legal costs paid to bring suit on our legal accounts totaled $9.3 million
for the three months ended September 30, 2010 and $4.1 million for the three months ended September
30, 2009. As a percentage of total legal collections, these legal costs were 28.8% and 19.1% for
the three month periods ended September 30, 2010 and 2009, respectively.
Outside Fees and Services
Outside fees and services expenses were $3.5 million for the three months ended September 30,
2010, an increase of $1.2 million or 52.2% compared to outside fees and services expenses of $2.3
million for the three months ended September 30, 2009. The $1.2 million increase was attributable
to an increase in other outside fees and services and corporate legal expense.
Communications
Communications expenses were $4.0 million for the three months ended September 30, 2010, an
increase of $0.5 million or 14.3% compared to communications expenses of $3.5 million for the three
months ended September 30, 2009. The increase was attributable to growth in mailings and higher
telephone expenses driven by a greater number of defaulted consumer receivables to work. Mailings
were responsible for 80.0% or $0.4 million of this increase, while the remaining 20.0% or $0.1
million was attributable to increased call volumes.
Rent and Occupancy
Rent and occupancy expenses were $1.4 million for the three months ended September 30, 2010,
an increase of $0.1 million or 7.7% compared to rent and occupancy expenses of $1.3 million for the
three months ended September 30, 2009. The increase was primarily due to relocation of our IGS
business to another location, the expansion of our Hampton, Virginia call center, the acquisition
of CCB and increased utility charges.
29
Table of Contents
Depreciation and Amortization
Depreciation and amortization expenses were $3.3 million for the three months ended September
30, 2010, an increase of $1.0 million or 43.5% compared to depreciation and amortization expenses
of $2.3 million for the three months ended September 30, 2009. The increase is mainly due to
additional amortization expense incurred relating to the intangible assets of our newly acquired
CCB subsidiary as well as continued capital expenditures on equipment, software, and computers
related to our growth and systems upgrades.
Other Operating Expenses
Other operating expenses were $2.6 million for the three months ended September 30, 2010, an
increase of $0.3 million or 13.0% compared to other operating expenses of $2.3 million for the
three months ended September 30, 2009. The increase was mainly due to increases in various expenses
when compared to the prior year period. No individual item represents a significant portion of the
overall increase.
Interest Income
Interest income was $0 for both the three months ended September 30, 2010 and 2009.
Interest Expense
Interest expense was $2.2 million for the three months ended September 30, 2010, a increase of
$0.2 million compared to interest expense of $2.0 million for the three months ended September 30,
2009. The increase was mainly due to an increase in our average borrowings under our revolving
credit facility for the three months ended September 30, 2010 compared to the same period in 2009
as well as the interest expense paid during 2010 relating to the interest rate swap, offset by a
decrease in our weighted average interest rate which decreased to 2.43% for the three months ended
September 30, 2010, as compared to 2.56% for the three months ended September 30, 2009, including
the effect of the interest rate swap derivative.
Provision for Income Taxes
Income tax expense was $11.9 million for the three months ended September 30, 2010, an
increase of $5.2 million or 77.6% compared to income tax expense of $6.7 million for the three
months ended September 30, 2009. The increase is mainly due to an increase of 82.1% in income
before taxes for the three months ended September 30, 2010 as compared to the same period in 2009.
This was offset by a decrease in the effective tax rate of 38.8% for the three months ended
September 30, 2010, compared to an effective tax rate of 40.0% for the same period in 2009,
primarily due to the impact of permanent items.
Nine months Ended September 30, 2010 Compared To Nine months Ended September 30, 2009
Revenues
Total revenues were $272.0 million for the nine months ended September 30, 2010, an increase
of $64.1 million or 30.8% compared to total revenues of $207.9 million for the nine months ended
September 30, 2009.
Income Recognized on Finance Receivables, net
Income recognized on finance receivables, net was $224.9 million for the nine months ended
September 30, 2010, an increase of $65.2 million or 40.8% compared to income recognized on finance
receivables, net of $159.7 million for the nine months ended September 30, 2009. The increase was
primarily due to an increase in our cash collections on our owned defaulted consumer receivables to
$385.0 million for the nine months ended September 30, 2010 compared to $272.7 million for the nine
months September 30, 2009, an increase of $112.3 million or 41.2%. During the nine months ended
September 30, 2010, we acquired defaulted consumer receivables portfolios with an aggregate face
value amount of $4.94 billion at a cost of $281.9 million. During the nine months ended September
30, 2009, we acquired defaulted consumer receivable portfolios with an aggregate face value of
$6.09 billion at a cost of $213.8 million. In any period, we acquire defaulted consumer
receivables that can vary dramatically in their age, type and ultimate collectability. We may pay
significantly different purchase rates for
30
Table of Contents
purchased receivables within any period as a result of this quality fluctuation. In addition,
market forces can drive pricing rates up or down in any period, irrespective of other quality
fluctuations. As a result, the average purchase rate paid for any given period can fluctuate
dramatically based on our particular buying activity in that period. However, regardless of the
average purchase price and for similar time frames, we intend to target a similar internal rate of
return, after direct expenses, in pricing our portfolio acquisitions; therefore, the absolute rate
paid is not necessarily relevant to estimated profitability of a period’s buying.
Income recognized on finance receivables, net is shown net of changes in valuation allowances
recognized under FASB ASC Topic 310-30 “Loans and Debt Securities Acquired with Deteriorated Credit
Quality” (“ASC 310-30”), which requires that a valuation allowance be recorded for significant
decreases in expected cash flows or change in timing of cash flows which would otherwise require a
reduction in the stated yield on a pool of accounts. For the nine months ended September 30, 2010,
we recorded net allowance charges of $19.7 million, the majority of which related to non-bankruptcy
portfolios acquired in 2005 through 2007. For the nine months ended September 30, 2009, we
recorded net allowance charges of $18.2 million, the majority of which related to non-bankruptcy
portfolios acquired in 2005 through 2008. In any given period, we may be required to record
valuation allowances due to pools of receivables underperforming our expectations. Factors that
may contribute to the recording of valuation allowances may include both internal as well as
external factors. External factors which may have an impact on the collectability, and
subsequently to the overall profitability of purchased pools of defaulted consumer receivables
include: overall market pricing for pools of consumer receivables (which is driven by both supply
and demand), new laws or regulations relating to collections, new interpretations of existing laws
or regulations, and the overall condition of the economy. Internal factors which may have an
impact on the collectability, and, consequentially, the overall profitability of purchased pools of
defaulted consumer receivables would include: necessary revisions to initial and post-acquisition
scoring and modeling estimates, non-optimal operational activities (which relates to the collection
and movement of accounts on both our collection floor and external channels), as well as decreases
in productivity related to turnover and tenure of our collection staff.
Fee Income
Fee income was $47.1 million for the nine months ended September 30, 2010, a decrease of $1.1
million or 2.3% compared to fee income of $48.2 million for the nine months ended September 30,
2009. Fee income declined as a result of a decrease in revenue generated by our IGS
fee-for-service business and our government services businesses due primarily to the adverse impact
of the economic slowdown on general business growth and governmental tax revenues, partially offset
by an increase in revenue generated as compared to the prior year period as a result of the
acquisition of CCB on March 15, 2010.
Operating Expenses
Total operating expenses were $178.4 million for the nine months ended September 30, 2010, an
increase of $29.0 million or 19.4% compared to total operating expenses of $149.4 million for the
nine months ended September 30, 2009. Total operating expenses, including compensation and
employee services expenses, were 41.3% of cash receipts for the nine months ended September 30,
2010, compared to 46.5% for the same period in 2009.
Compensation and Employee Services
Compensation and employee services expenses were $91.7 million for the nine months ended
September 30, 2010, an increase of $11.8 million or 14.8% compared to compensation and employee
services expenses of $79.9 million for the nine months ended September 30, 2009. This increase is
mainly due to an increase in our owned portfolio collection staff as well as the hiring of
non-collection personnel mainly due to the expansion of our information technology department.
Compensation and employee services expenses increased as total employees grew 12.8% to 2,421 as of
September 30, 2010 from 2,146 as of September 30, 2009. Compensation and employee services
expenses as a percentage of cash receipts decreased to 21.2% for the nine months ended September
30, 2010 from 24.9% of cash receipts for the same period in 2009.
Legal and Agency Fees and Costs
Legal and agency fees and costs were $43.6 million for the nine months ended September 30,
2010, an
31
Table of Contents
increase of $9.1 million or 26.4% compared to legal and agency fees and costs of $34.5 million for
the nine months ended September 30, 2009. Of the $9.1 million increase, $11.3 million was
attributable to an increase in legal fees and costs resulting from accounts referred to both our
in-house attorneys and outside independent contingent fee attorneys. This increase was largely due
to the refinement of our internal scoring methodology that expanded our account selections for
legal action. Growth in the size of our owned debt portfolios and expansion of our internal legal
collection resources were also contributing factors. The increase in legal fees and costs was
partially offset by a $2.2 million decline in agency fees. Total legal fees paid to independent
contingent fee attorneys for the nine months ended September 30, 2010 were 22.3% of external legal
cash collections compared to 23.0% for the nine months ended September 30, 2009. These legal fees
represent the contingent fees for the cash collections generated by our independent third party
attorney network. Total legal costs paid to bring suit on our legal accounts totaled $21.4 million
for the nine months ended September 30, 2010 and $11.5 million for the nine months ended September
30, 2009. As a percentage of total legal collections, these legal costs were 23.4% and 18.1% for
the nine month periods ended September 30, 2010 and 2009, respectively.
Outside Fees and Services
Outside fees and services expenses were $9.5 million for the nine months ended September 30,
2010, an increase of $2.6 million or 37.7% compared to outside fees and services expenses of $6.9
million for the nine months ended September 30, 2009. The $2.6 million increase was attributable to
an increase in other outside fees and services and corporate legal expense.
Communications
Communications expenses were $13.2 million for the nine months ended September 30, 2010, an
increase of $2.0 million or 17.9% compared to communications expenses of $11.2 million for the nine
months ended September 30, 2009. The increase was attributable to growth in mailings and higher
telephone expenses driven by a greater number of defaulted consumer receivables to work. Mailings
were responsible for 90.0% or $1.8 million of this increase, while the remaining 10.0% or $0.2
million was attributable to increased call volumes.
Rent and Occupancy
Rent and occupancy expenses were $3.9 million for the nine months ended September 30, 2010, an
increase of $0.4 million or 11.4% compared to rent and occupancy expenses of $3.5 million for the
nine months ended September 30, 2009. The increase was primarily due to relocation of our IGS
business to another location, the expansion of our Hampton, VA call center, the acquisition of CCB
and increased utility charges.
Depreciation and Amortization
Depreciation and amortization expenses were $9.1 million for the nine months ended September
30, 2010, an increase of $2.2 million or 31.9% compared to depreciation and amortization expenses
of $6.9 million for the nine months ended September 30, 2009. The increase is mainly due to
additional amortization expense incurred relating to the intangible assets of our newly acquired
CCB subsidiary as well as continued capital expenditures on equipment, software, and computers
related to our growth and systems upgrades.
Other Operating Expenses
Other operating expenses were $7.5 million for the nine months ended September 30, 2010, an
increase of $0.9 million or 13.6% compared to other operating expenses of $6.6 million for the nine
months ended September 30, 2009. The increase was mainly due to increases in various expenses when
compared to the prior year period. No individual item represents a significant portion of the
overall increase.
Interest Income
Interest income was $35,000 for the nine months ended September 30, 2010, an increase of
$32,000 compared to interest income of $3,000 for the nine months ended September 30, 2009. This
increase is the result of interest earned and a refund received on the overpayment of federal
income taxes.
32
Table of Contents
Interest Expense
Interest expense was $6.5 million for the nine months ended September 30, 2010, an increase of
$0.6 million compared to interest expense of $5.9 million for the nine months ended September 30,
2009. The increase was mainly due to an increase in our average borrowings under our revolving
credit facility for the nine months ended September 30, 2010 compared to the same period in 2009 as
well as the interest expense paid during 2010 relating to the interest rate swap, offset by a
decrease in our weighted average interest rate which decreased to 2.41% for the nine months ended
September 30, 2010 as compared to 2.67% for the nine months ended September 30, 2009.
Provision for Income Taxes
Income tax expense was $33.8 million for the nine months ended September 30, 2010, an increase
of $13.1 million or 63.3% compared to income tax expense of $20.7 million for the nine months ended
September 30, 2009. The increase is mainly due to an increase of 65.5% in income before taxes for
the nine months ended September 30, 2010 when compared to the same period in 2009. This was offset
by a slight decrease in the effective tax rate of 38.9% for the nine months ended September 30,
2010 compared to 39.4% for the same period in 2009.
Supplemental Performance Data
Owned Portfolio Performance:
The following tables show certain data related to our owned portfolio. These tables describe
the purchase price, cash collections and related multiples. Further, these tables disclose our
entire portfolio, the portfolio of purchased bankrupt accounts and our entire portfolio less the
impact of our purchased bankrupt accounts. The accounts represented in the purchased bankruptcy
tables are those portfolios of accounts that were bankrupt at the time of purchase. This contrasts
with accounts that file bankruptcy after we purchase them.
The purchase price multiples for 2005 through 2008 described in the table below are lower than
historical multiples in previous years. This trend is primarily, but not entirely related to
pricing competition. When competition increases, and or supply decreases so that pricing becomes
negatively impacted on a relative basis (total lifetime collections in relation to purchase price),
yields tend to trend lower. This was the situation during 2005-2007 and this situation also
extended into 2008 to the extent that deals purchased in 2008 were part of forward flow agreements
priced in earlier periods.
Additionally however, the way we initially book newly acquired pools of accounts and how we
forecast future estimated collections for any given portfolio of accounts has evolved over the
years due to a number of factors including the current economic situation. Since our revenue
recognition under ASC 310-30 is driven by both the ultimate magnitude of estimated lifetime
collections as well as the timing of those collections, we have progressed towards booking new
portfolio purchases using a higher confidence level for both estimated collection amounts and pace.
Subsequent to the initial booking, as we gain collection experience and comfort with a pool of
accounts, we continuously update ERC as time goes on. Since our inception, these processes have
tended to cause the ratio of collections, including ERC, to purchase price multiple for any given
year of buying to gradually increase over time. As a result, our estimate of lifetime collections
to purchase price has shown relatively steady increases as pools have aged. Thus, all factors
being equal in terms of pricing, one would naturally tend to see a higher collection to purchase
price ratio from a pool of accounts that were six years from purchase than say a pool that was just
two years from purchase.
To the extent that lower purchase price multiples are the ultimate result of more competitive
pricing and lower yields, this will generally lead to higher amortization rates (payments applied
to principal as a percentage of cash collections), lower operating margins and ultimately lower
profitability. As portfolio pricing becomes more favorable on a relative basis, our profitability
will tend to increase. It is important to consider, however, that to the extent we can improve our
collection operations by extracting additional cash from a discreet quantity and quality of
accounts, and/or by extracting cash at a lower cost structure, we can put upward pressure on the
collection to purchase price ratio and also on our operating margins. During 2008 and continuing
through all of 2009, we made significant enhancements in our analytical abilities, management
personnel and automated dialing capabilities, all with the intent to collect more cash at lower
cost.
33
Table of Contents
Entire Portfolio ($ in thousands)
| Unamortized | Percentage of | Percentage of Reserve | Actual Cash | |||||||||||||||||||||||||||||||||
| Purchase Price | Life to Date | Reserve | Allowance to Unamortized | Collections | Estimated | Total Estimated | ||||||||||||||||||||||||||||||
| Purchase | Purchase | Total Estimated | Balance at | Reserve | Allowance to | Purchase Price and | Including Cash | Remaining | Collections to | |||||||||||||||||||||||||||
| Period | Price (1) | Collections (2) | September 30, 2010 (3) | Allowance (4) | Purchase Price (5) | Reserve Allowance (6) | Sales | Collections (7) | Purchase Price (8) | |||||||||||||||||||||||||||
1996 |
$ | 3,080 | $ | 10,094 | $ | 0 | $ | 0 | 0 | % | 0 | % | $ | 10,024 | $ | 70 | 328 | % | ||||||||||||||||||
1997 |
$ | 7,685 | $ | 25,244 | $ | 0 | $ | 0 | 0 | % | 0 | % | $ | 25,057 | $ | 187 | 328 | % | ||||||||||||||||||
1998 |
$ | 11,089 | $ | 36,913 | $ | 0 | $ | 0 | 0 | % | 0 | % | $ | 36,506 | $ | 407 | 333 | % | ||||||||||||||||||
1999 |
$ | 18,898 | $ | 68,282 | $ | 0 | $ | 0 | 0 | % | 0 | % | $ | 66,901 | $ | 1,381 | 361 | % | ||||||||||||||||||
2000 |
$ | 25,020 | $ | 113,442 | $ | 0 | $ | 0 | 0 | % | 0 | % | $ | 110,146 | $ | 3,296 | 453 | % | ||||||||||||||||||
2001 |
$ | 33,481 | $ | 169,035 | $ | 0 | $ | 0 | 0 | % | 0 | % | $ | 165,568 | $ | 3,467 | 505 | % | ||||||||||||||||||
2002 |
$ | 42,325 | $ | 187,309 | $ | 0 | $ | 0 | 0 | % | 0 | % | $ | 182,872 | $ | 4,437 | 443 | % | ||||||||||||||||||
2003 |
$ | 61,448 | $ | 248,438 | $ | 0 | $ | 0 | 0 | % | 0 | % | $ | 240,944 | $ | 7,494 | 404 | % | ||||||||||||||||||
2004 |
$ | 59,177 | $ | 184,196 | $ | 462 | $ | 1,225 | 2 | % | 2 | % | $ | 176,311 | $ | 7,885 | 311 | % | ||||||||||||||||||
2005 |
$ | 143,171 | $ | 309,500 | $ | 23,563 | $ | 15,985 | 11 | % | 10 | % | $ | 265,608 | $ | 43,892 | 216 | % | ||||||||||||||||||
2006 |
$ | 107,701 | $ | 218,553 | $ | 29,349 | $ | 17,695 | 16 | % | 14 | % | $ | 163,894 | $ | 54,659 | 203 | % | ||||||||||||||||||
2007 |
$ | 258,271 | $ | 505,819 | $ | 111,183 | $ | 17,165 | 7 | % | 6 | % | $ | 316,096 | $ | 189,723 | 196 | % | ||||||||||||||||||
2008 |
$ | 275,130 | $ | 538,306 | $ | 166,926 | $ | 18,895 | 7 | % | 6 | % | $ | 246,306 | $ | 292,000 | 196 | % | ||||||||||||||||||
2009 |
$ | 281,641 | $ | 713,656 | $ | 213,969 | $ | 0 | 0 | % | 0 | % | $ | 190,109 | $ | 523,547 | 253 | % | ||||||||||||||||||
YTD 2010 |
$ | 278,266 | $ | 585,030 | $ | 261,787 | $ | 0 | 0 | % | 0 | % | $ | 47,901 | $ | 537,129 | 210 | % | ||||||||||||||||||
Total |
$ | 1,606,383 | $ | 3,913,817 | $ | 807,239 | $ | 70,965 | 4 | % | 4 | % | $ | 2,244,243 | $ | 1,669,574 | 244 | % | ||||||||||||||||||
Purchased Bankruptcy Portfolio ($ in thousands)
| Unamortized | Percentage of | Percentage of Reserve | Actual Cash | |||||||||||||||||||||||||||||||||
| Purchase Price | Life to Date | Reserve | Allowance to Unamortized | Collections | Estimated | Total Estimated | ||||||||||||||||||||||||||||||
| Purchase | Purchase | Total Estimated | Balance at | Reserve | Allowance to | Purchase Price and | Including Cash | Remaining | Collections to | |||||||||||||||||||||||||||
| Period | Price (1) | Collections (2) | September 30, 2010 (3) | Allowance (4) | Purchase Price (5) | Reserve Allowance (6) | Sales | Collections (7) | Purchase Price (8) | |||||||||||||||||||||||||||
1996-2003 |
$ | 0 | $ | 0 | $ | 0 | $ | 0 | 0 | % | 0 | % | $ | 0 | $ | 0 | 0 | % | ||||||||||||||||||
2004 |
$ | 7,469 | $ | 14,160 | $ | 13 | $ | 1,225 | 16 | % | 14 | % | $ | 14,113 | $ | 47 | 190 | % | ||||||||||||||||||
2005 |
$ | 29,302 | $ | 43,020 | $ | 340 | $ | 920 | 3 | % | 3 | % | $ | 42,577 | $ | 443 | 147 | % | ||||||||||||||||||
2006 |
$ | 17,643 | $ | 30,450 | $ | 269 | $ | 1,430 | 8 | % | 7 | % | $ | 28,321 | $ | 2,129 | 173 | % | ||||||||||||||||||
2007 |
$ | 78,933 | $ | 112,658 | $ | 31,286 | $ | 1,910 | 2 | % | 2 | % | $ | 74,210 | $ | 38,448 | 143 | % | ||||||||||||||||||
2008 |
$ | 108,603 | $ | 183,195 | $ | 72,428 | $ | 0 | 0 | % | 0 | % | $ | 78,709 | $ | 104,486 | 169 | % | ||||||||||||||||||
2009 |
$ | 156,094 | $ | 360,983 | $ | 132,970 | $ | 0 | 0 | % | 0 | % | $ | 75,372 | $ | 285,611 | 231 | % | ||||||||||||||||||
YTD 2010 |
$ | 172,703 | $ | 324,795 | $ | 167,846 | $ | 0 | 0 | % | 0 | % | $ | 21,327 | $ | 303,468 | 188 | % | ||||||||||||||||||
Total |
$ | 570,747 | $ | 1,069,261 | $ | 405,152 | $ | 5,485 | 1 | % | 1 | % | $ | 334,629 | $ | 734,632 | 187 | % | ||||||||||||||||||
Entire Portfolio Less Purchased Bankruptcy Portfolio ($ in thousands)
| Unamortized | Percentage of | Percentage of Reserve | Actual Cash | |||||||||||||||||||||||||||||||||
| Purchase Price | Life to Date | Reserve | Allowance to Unamortized | Collections | Estimated | Total Estimated | ||||||||||||||||||||||||||||||
| Purchase | Purchase | Total Estimated | Balance at | Reserve | Allowance to | Purchase Price and | Including Cash | Remaining | Collections to | |||||||||||||||||||||||||||
| Period | Price (1) | Collections (2) | September 30, 2010 (3) | Allowance (4) | Purchase Price (5) | Reserve Allowance (6) | Sales | Collections (7) | Purchase Price (8) | |||||||||||||||||||||||||||
1996 |
$ | 3,080 | $ | 10,094 | $ | 0 | $ | 0 | 0 | % | 0 | % | $ | 10,024 | $ | 70 | 328 | % | ||||||||||||||||||
1997 |
$ | 7,685 | $ | 25,244 | $ | 0 | $ | 0 | 0 | % | 0 | % | $ | 25,057 | $ | 187 | 328 | % | ||||||||||||||||||
1998 |
$ | 11,089 | $ | 36,913 | $ | 0 | $ | 0 | 0 | % | 0 | % | $ | 36,506 | $ | 407 | 333 | % | ||||||||||||||||||
1999 |
$ | 18,898 | $ | 68,282 | $ | 0 | $ | 0 | 0 | % | 0 | % | $ | 66,901 | $ | 1,381 | 361 | % | ||||||||||||||||||
2000 |
$ | 25,020 | $ | 113,442 | $ | 0 | $ | 0 | 0 | % | 0 | % | $ | 110,146 | $ | 3,296 | 453 | % | ||||||||||||||||||
2001 |
$ | 33,481 | $ | 169,035 | $ | 0 | $ | 0 | 0 | % | 0 | % | $ | 165,568 | $ | 3,467 | 505 | % | ||||||||||||||||||
2002 |
$ | 42,325 | $ | 187,309 | $ | 0 | $ | 0 | 0 | % | 0 | % | $ | 182,872 | $ | 4,437 | 443 | % | ||||||||||||||||||
2003 |
$ | 61,448 | $ | 248,438 | $ | 0 | $ | 0 | 0 | % | 0 | % | $ | 240,944 | $ | 7,494 | 404 | % | ||||||||||||||||||
2004 |
$ | 51,708 | $ | 170,036 | $ | 449 | $ | 0 | 0 | % | 0 | % | $ | 162,198 | $ | 7,838 | 329 | % | ||||||||||||||||||
2005 |
$ | 113,869 | $ | 266,480 | $ | 23,223 | $ | 15,065 | 13 | % | 12 | % | $ | 223,032 | $ | 43,448 | 234 | % | ||||||||||||||||||
2006 |
$ | 90,058 | $ | 188,103 | $ | 29,080 | $ | 16,265 | 18 | % | 15 | % | $ | 135,572 | $ | 52,531 | 209 | % | ||||||||||||||||||
2007 |
$ | 179,338 | $ | 393,161 | $ | 79,897 | $ | 15,255 | 9 | % | 8 | % | $ | 241,887 | $ | 151,274 | 219 | % | ||||||||||||||||||
2008 |
$ | 166,527 | $ | 355,111 | $ | 94,498 | $ | 18,895 | 11 | % | 10 | % | $ | 167,597 | $ | 187,514 | 213 | % | ||||||||||||||||||
2009 |
$ | 125,547 | $ | 352,673 | $ | 80,999 | $ | 0 | 0 | % | 0 | % | $ | 114,737 | $ | 237,936 | 281 | % | ||||||||||||||||||
YTD 2010 |
$ | 105,563 | $ | 260,235 | $ | 93,941 | $ | 0 | 0 | % | 0 | % | $ | 26,573 | $ | 233,662 | 247 | % | ||||||||||||||||||
Total |
$ | 1,035,636 | $ | 2,844,556 | $ | 402,087 | $ | 65,480 | 6 | % | 6 | % | $ | 1,909,614 | $ | 934,942 | 275 | % | ||||||||||||||||||
| (1) | Purchase price refers to the cash paid to a seller to acquire defaulted consumer receivables, plus certain capitalized costs, less the purchase price refunded by the seller due to the return of non-compliant accounts (also defined as buybacks). Non-compliant refers to the contractual representations and warranties provided for in the purchase and sale contract between the seller and us. These representations and warranties from the sellers generally cover account holders’ death or bankruptcy and accounts settled or disputed prior to sale. The seller can replace or repurchase these accounts. | |
| (2) | Total estimated collections refers to the actual cash collections, including cash sales, plus estimated remaining collections. |
34
Table of Contents
| (3) | Unamortized purchase price balance refers to the purchase price less finance receivable amortization over the life of the portfolio. | |
| (4) | Life to date reserve allowance refers to the total amount of allowance charges incurred on our owned portfolios net of any reversals. | |
| (5) | Percentage of reserve allowance to purchase price refers to the total amount of allowance charges incurred on our owned portfolios net of any reversals, divided by the purchase price. | |
| (6) | Percentage of reserve allowance to unamortized purchase price and reserve allowance refers to the total amount of allowance charges incurred on our owned portfolios net of any reversals, divided by the sum of the unamortized purchase price and the life to date reserve allowance. | |
| (7) | Estimated remaining collections refers to the sum of all future projected cash collections on our owned portfolios. | |
| (8) | Total estimated collections to purchase price refers to the total estimated collections divided by the purchase price. |
The following table shows our net valuation allowances booked since we began accounting for
our investment in finance receivables under the guidance of ASC 310-30.
| ($ in thousands) | ||||||||||||||||||||||||||||||||||||
| Allowance | ||||||||||||||||||||||||||||||||||||
| Allowance | Purchase Period | Charge as | ||||||||||||||||||||||||||||||||||
| Period (1) | 1996-2003 | 2004 | 2005 | 2006 | 2007 | 2008 | 2009-2010 | Total | % of NFR (2) | |||||||||||||||||||||||||||
Q1 05 |
$ | — | $ | — | $ | — | $ | — | $ | — | $ | — | $ | — | $ | — | 0.0 | % | ||||||||||||||||||
Q2 05 |
— | — | — | — | — | — | — | — | 0.0 | % | ||||||||||||||||||||||||||
Q3 05 |
— | — | — | — | — | — | — | — | 0.0 | % | ||||||||||||||||||||||||||
Q4 05 |
200 | — | — | — | — | — | — | 200 | 0.1 | % | ||||||||||||||||||||||||||
Q1 06 |
— | — | 175 | — | — | — | — | 175 | 0.1 | % | ||||||||||||||||||||||||||
Q2 06 |
75 | — | 125 | — | — | — | — | 200 | 0.1 | % | ||||||||||||||||||||||||||
Q3 06 |
200 | — | 75 | — | — | — | — | 275 | 0.1 | % | ||||||||||||||||||||||||||
Q4 06 |
— | — | 450 | — | — | — | — | 450 | 0.2 | % | ||||||||||||||||||||||||||
Q1 07 |
(245 | ) | — | 610 | — | — | — | — | 365 | 0.1 | % | |||||||||||||||||||||||||
Q2 07 |
90 | — | — | — | — | — | — | 90 | 0.0 | % | ||||||||||||||||||||||||||
Q3 07 |
200 | 320 | 660 | — | — | — | — | 1,180 | 0.4 | % | ||||||||||||||||||||||||||
Q4 07 |
190 | 150 | 615 | 340 | — | — | — | 1,295 | 0.3 | % | ||||||||||||||||||||||||||
Q1 08 |
120 | 650 | 910 | 1,105 | — | — | — | 2,785 | 0.6 | % | ||||||||||||||||||||||||||
Q2 08 |
260 | 720 | — | 2,330 | 650 | — | — | 3,960 | 0.8 | % | ||||||||||||||||||||||||||
Q3 08 |
(90 | ) | 60 | 325 | 1,135 | 2,350 | — | — | 3,780 | 0.7 | % | |||||||||||||||||||||||||
Q4 08 |
(400 | ) | (140 | ) | 1,805 | 2,600 | 4,380 | 620 | — | 8,865 | 1.6 | % | ||||||||||||||||||||||||
Q1 09 |
(225 | ) | 35 | 1,150 | 910 | 2,300 | 2,050 | — | 6,220 | 1.1 | % | |||||||||||||||||||||||||
Q2 09 |
(230 | ) | (220 | ) | 495 | 765 | 685 | 2,425 | — | 3,920 | 0.6 | % | ||||||||||||||||||||||||
Q3 09 |
(25 | ) | (190 | ) | 1,170 | 1,965 | 340 | 4,750 | — | 8,010 | 1.2 | % | ||||||||||||||||||||||||
Q4 09 |
(120 | ) | — | 1,375 | 1,220 | 110 | 6,900 | — | 9,485 | 1.4 | % | |||||||||||||||||||||||||
Q1 10 |
— | — | 2,795 | 1,175 | 2,900 | — | — | 6,870 | 0.9 | % | ||||||||||||||||||||||||||
Q2 10 |
— | (80 | ) | 1,600 | 2,100 | 700 | 2,000 | — | 6,320 | 0.8 | % | |||||||||||||||||||||||||
Q3 10 |
— | (80 | ) | 1,650 | 2,050 | 2,750 | 150 | — | 6,520 | 0.8 | % | |||||||||||||||||||||||||
Total |
$ | — | $ | 1,225 | $ | 15,985 | $ | 17,695 | $ | 17,165 | $ | 18,895 | $ | — | $ | 70,965 | ||||||||||||||||||||
Portfolio
Purchases, net |
$ | 203,026 | $ | 59,177 | $ | 143,171 | $ | 107,701 | $ | 258,271 | $ | 275,130 | $ | 559,907 | $ | 1,606,383 | ||||||||||||||||||||
| (1) | Allowance period represents the quarter in which we recorded valuation allowances, net of any (reversals). | |
| (2) | NFR refers to total net finance receivables as of the end of the allowance period presented. |
35
Table of Contents
The following graph shows the purchase price of our owned portfolios by year and includes the
year to date acquisition amount for the nine months ended September 30, 2010. The purchase price
number represents the cash paid to the seller to acquire defaulted consumer receivables, plus
certain capitalized costs, less the purchase price refunded by the seller due to the return of
non-compliant accounts.
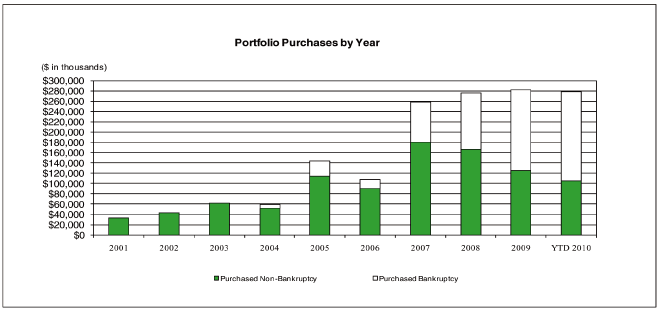
We utilize a long-term approach to collecting our owned pools of receivables. This approach
has historically caused us to realize significant cash collections and revenues from purchased
pools of finance receivables years after they are originally acquired. As a result, we have in the
past been able to reduce our level of current period acquisitions without a corresponding negative
current period impact on cash collections and revenue.
The following table, which excludes any proceeds from cash sales of finance receivables,
demonstrates our ability to realize significant multi-year cash collection streams on our owned
pools:
Cash Collections By Year, By Year of Purchase — Entire Portfolio
| ($ in thousands) | ||||||||||||||||||||||||||||||||||||||||||||||||||||
| Purchase | Purchase | Cash Collection Period | ||||||||||||||||||||||||||||||||||||||||||||||||||
| Period | Price | 1996-2000 | 2001 | 2002 | 2003 | 2004 | 2005 | 2006 | 2007 | 2008 | 2009 | YTD 2010 | Total | |||||||||||||||||||||||||||||||||||||||
1996 |
$ | 3,080 | $ | 7,295 | $ | 730 | $ | 496 | $ | 398 | $ | 285 | $ | 210 | $ | 237 | $ | 102 | $ | 83 | $ | 78 | $ | 48 | $ | 9,962 | ||||||||||||||||||||||||||
1997 |
7,685 | 15,138 | 2,630 | 1,829 | 1,324 | 1,022 | 860 | 597 | 437 | 346 | 215 | 151 | 24,549 | |||||||||||||||||||||||||||||||||||||||
1998 |
11,089 | 16,981 | 5,152 | 3,948 | 2,797 | 2,200 | 1,811 | 1,415 | 882 | 616 | 397 | 281 | 36,480 | |||||||||||||||||||||||||||||||||||||||
1999 |
18,898 | 18,207 | 12,090 | 9,598 | 7,336 | 5,615 | 4,352 | 3,032 | 2,243 | 1,533 | 1,328 | 875 | 66,209 | |||||||||||||||||||||||||||||||||||||||
2000 |
25,020 | 6,894 | 19,498 | 19,478 | 16,628 | 14,098 | 10,924 | 8,067 | 5,202 | 3,604 | 3,198 | 2,093 | 109,684 | |||||||||||||||||||||||||||||||||||||||
2001 |
33,481 | — | 13,048 | 28,831 | 28,003 | 26,717 | 22,639 | 16,048 | 10,011 | 6,164 | 5,299 | 3,317 | 160,077 | |||||||||||||||||||||||||||||||||||||||
2002 |
42,325 | — | — | 15,073 | 36,258 | 35,742 | 32,497 | 24,729 | 16,527 | 9,772 | 7,444 | 4,819 | 182,861 | |||||||||||||||||||||||||||||||||||||||
2003 |
61,448 | — | — | — | 24,308 | 49,706 | 52,640 | 43,728 | 30,695 | 18,818 | 13,135 | 7,915 | 240,945 | |||||||||||||||||||||||||||||||||||||||
2004 |
59,177 | — | — | — | — | 18,019 | 46,475 | 40,424 | 30,750 | 19,339 | 13,677 | 7,622 | 176,306 | |||||||||||||||||||||||||||||||||||||||
2005 |
143,171 | — | — | — | — | — | 18,968 | 75,145 | 69,862 | 49,576 | 33,366 | 18,691 | 265,608 | |||||||||||||||||||||||||||||||||||||||
2006 |
107,701 | — | — | — | — | — | — | 22,971 | 53,192 | 40,560 | 29,749 | 17,422 | 163,894 | |||||||||||||||||||||||||||||||||||||||
2007 |
258,271 | — | — | — | — | — | — | — | 42,263 | 115,011 | 94,805 | 64,017 | 316,096 | |||||||||||||||||||||||||||||||||||||||
2008 |
275,130 | — | — | — | — | — | — | — | — | 61,277 | 107,974 | 77,055 | 246,306 | |||||||||||||||||||||||||||||||||||||||
2009 |
281,641 | — | — | — | — | — | — | — | — | — | 57,338 | 132,771 | 190,109 | |||||||||||||||||||||||||||||||||||||||
YTD 2010 |
278,266 | — | — | — | — | — | — | — | — | — | — | 47,901 | 47,901 | |||||||||||||||||||||||||||||||||||||||
Total |
$ | 1,606,383 | $ | 64,515 | $ | 53,148 | $ | 79,253 | $ | 117,052 | $ | 153,404 | $ | 191,376 | $ | 236,393 | $ | 262,166 | $ | 326,699 | $ | 368,003 | $ | 384,978 | $ | 2,236,987 | ||||||||||||||||||||||||||
36
Table of Contents
Cash Collections By Year, By Year of Purchase — Purchased Bankruptcy only Portfolio
| ($ in thousands) | ||||||||||||||||||||||||||||||||||||||||||||||||||||
| Purchase | Purchase | Cash Collection Period | ||||||||||||||||||||||||||||||||||||||||||||||||||
| Period | Price | 1996-2000 | 2001 | 2002 | 2003 | 2004 | 2005 | 2006 | 2007 | 2008 | 2009 | YTD 2010 | Total | |||||||||||||||||||||||||||||||||||||||
2004 |
$ | 7,469 | $ | — | $ | — | $ | — | $ | — | $ | 743 | $ | 4,554 | $ | 3,956 | $ | 2,777 | $ | 1,455 | $ | 496 | $ | 132 | $ | 14,113 | ||||||||||||||||||||||||||
2005 |
29,302 | — | — | — | — | — | 3,777 | 15,500 | 11,934 | 6,845 | 3,318 | 1,203 | 42,577 | |||||||||||||||||||||||||||||||||||||||
2006 |
17,643 | — | — | — | — | — | — | 5,608 | 9,455 | 6,522 | 4,398 | 2,338 | 28,321 | |||||||||||||||||||||||||||||||||||||||
2007 |
78,933 | — | — | — | — | — | — | — | 2,850 | 27,972 | 25,630 | 17,758 | 74,210 | |||||||||||||||||||||||||||||||||||||||
2008 |
108,603 | — | — | — | — | — | — | — | — | 14,024 | 35,894 | 28,791 | 78,709 | |||||||||||||||||||||||||||||||||||||||
2009 |
156,094 | — | — | — | — | — | — | — | — | — | 16,635 | 58,737 | 75,372 | |||||||||||||||||||||||||||||||||||||||
YTD 2010 |
172,703 | — | — | — | — | — | — | — | — | — | — | 21,327 | 21,327 | |||||||||||||||||||||||||||||||||||||||
Total |
$ | 570,747 | $ | — | $ | — | $ | — | $ | — | $ | 743 | $ | 8,331 | $ | 25,064 | $ | 27,016 | $ | 56,818 | $ | 86,371 | $ | 130,286 | $ | 334,629 | ||||||||||||||||||||||||||
Cash Collections By Year, By Year of Purchase — Entire Portfolio less Purchased Bankruptcy Portfolio
| ($ in thousands) | ||||||||||||||||||||||||||||||||||||||||||||||||||||
| Purchase | Purchase | Cash Collection Period | ||||||||||||||||||||||||||||||||||||||||||||||||||
| Period | Price | 1996-2000 | 2001 | 2002 | 2003 | 2004 | 2005 | 2006 | 2007 | 2008 | 2009 | YTD 2010 | Total | |||||||||||||||||||||||||||||||||||||||
1996 |
$ | 3,080 | $ | 7,295 | $ | 730 | $ | 496 | $ | 398 | $ | 285 | $ | 210 | $ | 237 | $ | 102 | $ | 83 | $ | 78 | $ | 48 | $ | 9,962 | ||||||||||||||||||||||||||
1997 |
7,685 | 15,138 | 2,630 | 1,829 | 1,324 | 1,022 | 860 | 597 | 437 | 346 | 215 | 151 | 24,549 | |||||||||||||||||||||||||||||||||||||||
1998 |
11,089 | 16,981 | 5,152 | 3,948 | 2,797 | 2,200 | 1,811 | 1,415 | 882 | 616 | 397 | 281 | 36,480 | |||||||||||||||||||||||||||||||||||||||
1999 |
18,898 | 18,207 | 12,090 | 9,598 | 7,336 | 5,615 | 4,352 | 3,032 | 2,243 | 1,533 | 1,328 | 875 | 66,209 | |||||||||||||||||||||||||||||||||||||||
2000 |
25,020 | 6,894 | 19,498 | 19,478 | 16,628 | 14,098 | 10,924 | 8,067 | 5,202 | 3,604 | 3,198 | 2,093 | 109,684 | |||||||||||||||||||||||||||||||||||||||
2001 |
33,481 | — | 13,048 | 28,831 | 28,003 | 26,717 | 22,639 | 16,048 | 10,011 | 6,164 | 5,299 | 3,317 | 160,077 | |||||||||||||||||||||||||||||||||||||||
2002 |
42,325 | — | — | 15,073 | 36,258 | 35,742 | 32,497 | 24,729 | 16,527 | 9,772 | 7,444 | 4,819 | 182,861 | |||||||||||||||||||||||||||||||||||||||
2003 |
61,448 | — | — | — | 24,308 | 49,706 | 52,640 | 43,728 | 30,695 | 18,818 | 13,135 | 7,915 | 240,945 | |||||||||||||||||||||||||||||||||||||||
2004 |
51,708 | — | — | — | — | 17,276 | 41,921 | 36,468 | 27,973 | 17,884 | 13,181 | 7,490 | 162,193 | |||||||||||||||||||||||||||||||||||||||
2005 |
113,869 | — | — | — | — | — | 15,191 | 59,645 | 57,928 | 42,731 | 30,048 | 17,489 | 223,032 | |||||||||||||||||||||||||||||||||||||||
2006 |
90,058 | — | — | — | — | — | — | 17,363 | 43,737 | 34,038 | 25,351 | 15,083 | 135,572 | |||||||||||||||||||||||||||||||||||||||
2007 |
179,338 | — | — | — | — | — | — | — | 39,413 | 87,039 | 69,175 | 46,260 | 241,887 | |||||||||||||||||||||||||||||||||||||||
2008 |
166,527 | — | — | — | — | — | — | — | — | 47,253 | 72,080 | 48,264 | 167,597 | |||||||||||||||||||||||||||||||||||||||
2009 |
125,547 | — | — | — | — | — | — | — | — | — | 40,703 | 74,034 | 114,737 | |||||||||||||||||||||||||||||||||||||||
YTD 2010 |
105,563 | — | — | — | — | — | — | — | — | — | — | 26,573 | 26,573 | |||||||||||||||||||||||||||||||||||||||
Total |
$ | 1,035,636 | $ | 64,515 | $ | 53,148 | $ | 79,253 | $ | 117,052 | $ | 152,661 | $ | 183,045 | $ | 211,329 | $ | 235,150 | $ | 269,881 | $ | 281,632 | $ | 254,692 | $ | 1,902,358 | ||||||||||||||||||||||||||
When we acquire a new pool of finance receivables, our estimates typically result in an
84 — 96 month projection of cash collections. The following chart shows our historical cash
collections (including cash sales of finance receivables) in relation to the aggregate of the total
estimated collection projections made at the time of each respective pool purchase, adjusted for
buybacks.
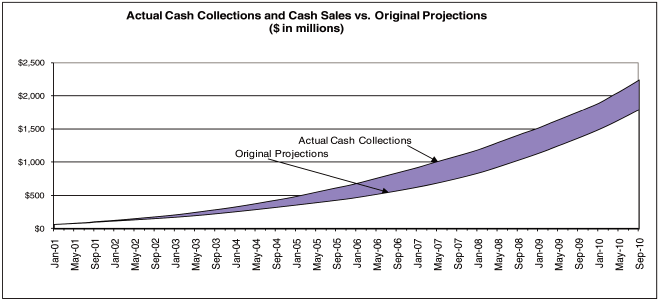
37
Table of Contents
Owned Portfolio Personnel Performance:
We measure the productivity of each collector each month, breaking results into groups of
similarly tenured collectors. The following tables display various productivity measures that we
track.
Number of Collectors by Tenure
| One year +(1) | ||||||||||||
| 2005 | 2006 | 2007 | 2008 | 2009 | 2010 | |||||||
| Q1 | 319 | 331 | 340 | 314 | 488 | 690 | ||||||
| Q2 | 319 | 342 | 360 | 348 | 587 | 711 | ||||||
| Q3 | 324 | 324 | 397 | 410 | 604 | 742 | ||||||
| Q4 | 327 | 340 | 327 | 452 | 638 | — | ||||||
| Less than one year(2) | ||||||||||||
| 2005 | 2006 | 2007 | 2008 | 2009 | 2010 | |||||||
| Q1 | 345 | 360 | 435 | 688 | 621 | 686 | ||||||
| Q2 | 330 | 372 | 481 | 744 | 612 | 681 | ||||||
| Q3 | 268 | 402 | 475 | 631 | 585 | 642 | ||||||
| Q4 | 364 | 375 | 553 | 739 | 676 | — | ||||||
| Total(2) | ||||||||||||
| 2005 | 2006 | 2007 | 2008 | 2009 | 2010 | |||||||
| Q1 | 664 | 691 | 775 | 1,002 | 1,109 | 1,376 | ||||||
| Q2 | 649 | 714 | 841 | 1,092 | 1,199 | 1,392 | ||||||
| Q3 | 592 | 726 | 872 | 1,041 | 1,189 | 1384 | ||||||
| Q4 | 691 | 715 | 880 | 1,191 | 1,314 | — | ||||||
| (1) | Calculated based on actual employees (collectors) with one year of service or more. | |
| (2) | Calculated using total hours worked by all collectors, including those in training to produce a full time equivalent “FTE.” |
The tables below contain our past five years of collector productivity metrics as defined by
calendar quarter.
QTD Cash Collections per Hour Paid (1)
| Total cash collections | ||||||||||||
| 2005 | 2006 | 2007 | 2008 | 2009 | 2010 | |||||||
| Q1 | $136 | $152 | $156 | $133 | $147 | $182 | ||||||
| Q2 | $138 | $146 | $142 | $136 | $143 | $188 | ||||||
| Q3 | $135 | $145 | $131 | $134 | $144 | $200 | ||||||
| Q4 | $126 | $142 | $119 | $123 | $148 | — | ||||||
| Non-legal cash collections(2) | ||||||||||||
| 2005 | 2006 | 2007 | 2008 | 2009 | 2010 | |||||||
| Q1 | $96 | $106 | $108 | $96 | $118 | $154 | ||||||
| Q2 | $92 | $99 | $96 | $99 | $116 | $160 | ||||||
| Q3 | $88 | $98 | $88 | $99 | $119 | $170 | ||||||
| Q4 | $82 | $94 | $80 | $94 | $123 | — | ||||||
38
Table of Contents
| Non-bankruptcy cash collections(3) | ||||||||||||
| 2005 | 2006 | 2007 | 2008 | 2009 | 2010 | |||||||
| Q1 | $132 | $141 | $141 | $116 | $120 | $135 | ||||||
| Q2 | $132 | $132 | $129 | $115 | $114 | $127 | ||||||
| Q3 | $129 | $129 | $120 | $110 | $111 | $127 | ||||||
| Q4 | $120 | $127 | $107 | $98 | $109 | — | ||||||
| Non-legal/non-bankruptcy cash collections(4) | ||||||||||||
| 2005 | 2006 | 2007 | 2008 | 2009 | 2010 | |||||||
| Q1 | $92 | $95 | $92 | $79 | $90 | $106 | ||||||
| Q2 | $85 | $85 | $83 | $78 | $87 | $100 | ||||||
| Q3 | $82 | $82 | $76 | $76 | $87 | $97 | ||||||
| Q4 | $77 | $80 | $68 | $69 | $84 | — | ||||||
| (1) | Cash collections (assigned and unassigned) divided by total hours paid (including holiday, vacation and sick time) to collectors (including those in training). | |
| (2) | Represents total cash collections less external legal cash collections. | |
| (3) | Represents total cash collections less purchased bankruptcy cash collections from trustee-administered accounts. | |
| (4) | Represents total cash collections less external legal cash collections and less purchased bankruptcy cash collections from trustee-administered accounts. |
Cash collections have substantially exceeded income recognized on finance receivables in each
quarter since our formation. The following chart illustrates the consistent excess of our cash
collections on our owned portfolios over the income recognized on finance receivables, net on a
quarterly basis. The difference between cash collections and income recognized is referred to as
payments applied to principal. It is also referred to as finance receivable amortization. This
finance receivable amortization is the portion of cash collections that is used to recover the cost
of the portfolio investment represented on the balance sheet.
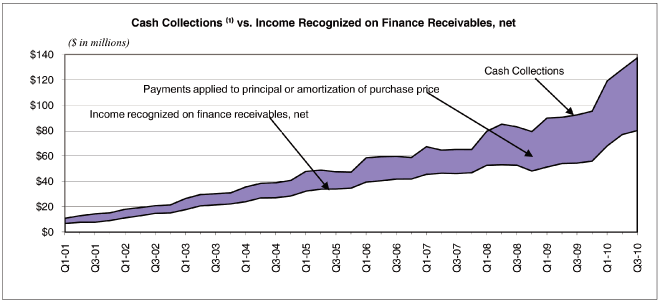
| (1) | Includes cash collections on finance receivables only and excludes cash proceeds from sales of defaulted consumer receivables. |
39
Table of Contents
The following table displays our quarterly cash collections by source, for the periods
indicated.
| Cash Collection Source ($ in thousands) | Q32010 | Q22010 | Q12010 | Q42009 | Q32009 | Q22009 | Q12009 | Q42008 | Q32008 | |||||||||||||||||||||||||||
Call Center & Other Collections |
$ | 51,711 | $ | 54,477 | $ | 56,987 | $ | 45,365 | $ | 48,590 | $ | 50,052 | $ | 50,914 | $ | 41,268 | $ | 43,949 | ||||||||||||||||||
External Legal Collections |
20,217 | 18,819 | 18,276 | 15,496 | 15,330 | 16,527 | 17,790 | 18,424 | 21,590 | |||||||||||||||||||||||||||
Internal Legal Collections |
12,130 | 11,362 | 10,714 | 7,570 | 6,196 | 4,263 | 3,539 | 2,652 | 2,106 | |||||||||||||||||||||||||||
Purchased Bankruptcy Collections |
53,319 | 43,748 | 33,219 | 26,855 | 22,251 | 19,637 | 17,628 | 16,904 | 15,362 | |||||||||||||||||||||||||||
Rollforward of Net Finance Receivables
The following table shows the changes in finance receivables, including the amounts paid to
acquire new portfolios (amounts in thousands).
| Three Months | Three Months | Nine Months | Nine Months | |||||||||||||
| Ended | Ended | Ended | Ended | |||||||||||||
| September 30, | September 30, | September 30, | September 30, | |||||||||||||
| 2010 | 2009 | 2010 | 2009 | |||||||||||||
Balance at beginning of period |
$ | 775,606 | $ | 624,592 | $ | 693,462 | $ | 563,830 | ||||||||
Acquisitions of finance receivables, net of buybacks (1) |
88,984 | 74,318 | 273,858 | 210,116 | ||||||||||||
Cash collections applied to principal on finance receivables (2) |
(57,351 | ) | (38,031 | ) | (160,081 | ) | (113,067 | ) | ||||||||
Balance at end of period |
$ | 807,239 | $ | 660,879 | $ | 807,239 | $ | 660,879 | ||||||||
Estimated Remaining Collections (“ERC”) (3) |
$ | 1,669,574 | $ | 1,331,912 | $ | 1,669,574 | $ | 1,331,912 | ||||||||
| (1) | Agreements to purchase receivables typically include general representations and warranties from the sellers covering account holders’ death or bankruptcy and accounts settled or disputed prior to sale. The seller can replace or repurchase these accounts. We refer to repurchased accounts as buybacks. We also capitalize certain acquisition related costs. | |
| (2) | Cash collections applied to principal (also referred to as finance receivable amortization) on finance receivables consists of cash collections less income recognized on finance receivables, net. | |
| (3) | Estimated Remaining Collections refers to the sum of all future projected cash collections on our owned portfolios. ERC is not a balance sheet item; however, it is provided here for informational purposes. |
Seasonality
We depend on the ability to collect on our owned and serviced defaulted consumer receivables.
Cash collections tend to be higher in the first and second quarters of the year and lower in the
third and fourth quarters of the year, due to consumer payment patterns in connection with seasonal
employment trends, income tax refunds and holiday spending habits. Historically, our growth has
partially masked the impact of this cash collections seasonality.
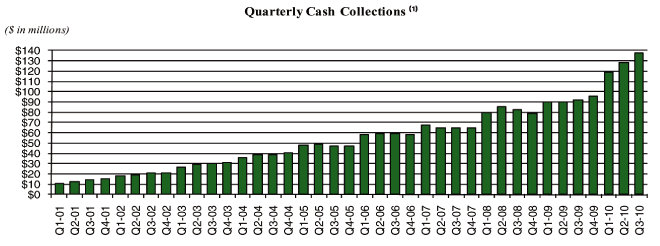
40
Table of Contents
| (1) | Includes cash collections on finance receivables only and excludes cash proceeds from sales of defaulted consumer receivables. |
Portfolios by Type and Geography
The following table categorizes our life to date owned portfolios at September 30, 2010 into
the major asset types represented (amounts in thousands):
| Life to Date | ||||||||||||||||
| Purchased Face | ||||||||||||||||
| Value of Defaulted | ||||||||||||||||
| Consumer | ||||||||||||||||
| Receivables | ||||||||||||||||
| Asset Type | No. of Accounts | % | (1) | % | ||||||||||||
Major Credit Cards |
14,220 | 59.8 | % | $ | 38,321,385 | 72.3 | % | |||||||||
Consumer Finance |
5,285 | 22.2 | % | 6,195,641 | 11.7 | % | ||||||||||
Private Label Credit Cards |
3,776 | 15.9 | % | 5,171,199 | 9.8 | % | ||||||||||
Auto Deficiency |
510 | 2.1 | % | 3,278,611 | 6.2 | % | ||||||||||
Total: |
23,791 | 100.0 | % | $ | 52,966,836 | 100.0 | % | |||||||||
| (1) | The “Life to Date Purchased Face Value of Defaulted Consumer Receivables” represents the original face amount purchased from sellers and has not been decremented by any adjustments including payments and buybacks. |
The following chart shows details of our life to date buying activity as of September 30, 2010
(amounts in thousands). We actively seek to purchase both bankrupt and non-bankrupt accounts at
any point in the delinquency cycle.
| Life to Date | ||||||||||||||||
| Purchased Face | ||||||||||||||||
| Value of Defaulted | ||||||||||||||||
| Consumer | ||||||||||||||||
| Receivables | ||||||||||||||||
| Account Type | No. of Accounts | % | (1) | % | ||||||||||||
Fresh |
1,320 | 5.5 | % | $ | 4,109,213 | 7.8 | % | |||||||||
Primary |
3,620 | 15.2 | % | 6,212,667 | 11.7 | % | ||||||||||
Secondary |
3,825 | 16.1 | % | 6,121,552 | 11.6 | % | ||||||||||
Tertiary |
3,937 | 16.5 | % | 5,017,483 | 9.5 | % | ||||||||||
BK Trustees |
3,439 | 14.5 | % | 15,174,713 | 28.6 | % | ||||||||||
Other |
7,650 | 32.2 | % | 16,331,208 | 30.8 | % | ||||||||||
Total: |
23,791 | 100.0 | % | $ | 52,966,836 | 100.0 | % | |||||||||
| (1) | The “Life to Date Purchased Face Value of Defaulted Consumer Receivables” represents the original face amount purchased from sellers and has not been decremented by any adjustments including payments and buybacks. |
We also review the geographic distribution of accounts within a portfolio because we have
found that certain states have more debtor-friendly laws than others and, therefore, are less
desirable from a collectability perspective. In addition, economic factors and bankruptcy trends
vary regionally and are factored into our maximum purchase price equation.
The following chart sets forth our overall life to date portfolio of defaulted consumer
receivables geographically at September 30, 2010 (amounts in thousands):
41
Table of Contents
| Life to Date | ||||||||||||||||||||||||
| Purchased Face | Original Purchase | |||||||||||||||||||||||
| Value of Defaulted | Price of Defaulted | |||||||||||||||||||||||
| Consumer | Consumer | |||||||||||||||||||||||
| Receivables | Receivables | |||||||||||||||||||||||
| Geographic Distribution | No. of Accounts | % | (1) | % | (2) | % | ||||||||||||||||||
California |
2,444 | 10 | % | $ | 6,799,417 | 13 | % | $ | 197,164 | 12 | % | |||||||||||||
Texas |
3,768 | 16 | % | 6,118,228 | 12 | % | 153,383 | 9 | % | |||||||||||||||
Florida |
1,864 | 8 | % | 5,059,455 | 10 | % | 145,930 | 9 | % | |||||||||||||||
New York |
1,401 | 6 | % | 3,283,264 | 6 | % | 94,105 | 6 | % | |||||||||||||||
Pennsylvania |
830 | 3 | % | 2,014,301 | 4 | % | 64,247 | 4 | % | |||||||||||||||
North Carolina |
842 | 4 | % | 1,865,383 | 4 | % | 55,885 | 3 | % | |||||||||||||||
Illinois |
935 | 4 | % | 1,852,381 | 3 | % | 62,859 | 4 | % | |||||||||||||||
Ohio |
825 | 3 | % | 1,842,272 | 3 | % | 68,544 | 4 | % | |||||||||||||||
Georgia |
748 | 3 | % | 1,708,829 | 3 | % | 64,948 | 4 | % | |||||||||||||||
New Jersey |
552 | 2 | % | 1,512,003 | 3 | % | 47,417 | 3 | % | |||||||||||||||
Michigan |
632 | 3 | % | 1,432,679 | 3 | % | 50,993 | 3 | % | |||||||||||||||
Virginia |
655 | 3 | % | 1,141,459 | 2 | % | 39,343 | 2 | % | |||||||||||||||
Tennessee |
501 | 2 | % | 1,105,474 | 2 | % | 41,156 | 3 | % | |||||||||||||||
Arizona |
399 | 2 | % | 1,070,902 | 2 | % | 31,577 | 2 | % | |||||||||||||||
Massachusetts |
423 | 2 | % | 1,023,540 | 2 | % | 30,855 | 2 | % | |||||||||||||||
South Carolina |
416 | 2 | % | 946,733 | 2 | % | 27,430 | 2 | % | |||||||||||||||
Other (3) |
6,556 | 27 | % | 14,190,516 | 26 | % | 466,934 | 28 | % | |||||||||||||||
Total: |
23,791 | 100 | % | $ | 52,966,836 | 100 | % | $ | 1,642,770 | 100 | % | |||||||||||||
| (1) | The “Life to Date Purchased Face Value of Defaulted Consumer Receivables” represents the original face amount purchased from sellers and has not been decremented by any adjustments including payments and buybacks. | |
| (2) | The “Original Purchase Price of Defaulted Consumer Receivables” represents the cash paid to sellers to acquire portfolios of defaulted consumer receivables. | |
| (3) | Each state included in “Other” represents less than 2% of the face value of total defaulted consumer receivables. |
Liquidity and Capital Resources
Historically, our primary sources of cash have been cash flows from operations, bank
borrowings and equity offerings. Cash has been used for acquisitions of finance receivables,
corporate acquisitions, repurchase of our common stock, payment of cash dividends, repayments of
bank borrowings, purchases of property and equipment and working capital to support our growth.
As of September 30, 2010, cash and cash equivalents totaled $20.3 million, consistent with the
amount as of December 31, 2009. Total debt outstanding on our $365 million line of credit was
$288.5 million as of September 30, 2010, which represents availability of $76.5 million.
We have in place forward flow commitments for the purchase of defaulted consumer receivables
over the next 12 months of approximately $104.8 million as of September 30, 2010. Additionally we
may enter into new or renewed flow commitments in the next twelve months and close on spot
transactions in addition to the aforementioned flow agreements. We believe that funds generated
from operations and from cash collections on finance receivables, together with existing cash and
available borrowings under our credit agreement would be sufficient to finance our operations,
planned capital expenditures, the aforementioned forward flow commitments, and a material amount of
additional portfolio purchasing in excess of the currently committed flow amounts during the next
twelve months.
We are cognizant of the current market fundamentals in the debt purchase and company
acquisition market which, because of significant supply and tight capital availability, could cause
increased buying opportunities to arise. Accordingly, we filed a $150 million shelf registration
during the third quarter of 2009. We issued $75.5 million of equity securities under that
registration statement during February of 2010 in order to take advantage of market opportunities
while retaining the ability to issue up to an additional $74.5 million of equity or debt securities
under the shelf registration statement in the future. The outcome of any future transaction is
subject to market conditions. In addition, due to these opportunities, we continue to work with
our current bank group and others on a new and expanded syndicated loan facility with a goal of
closing on an increased syndicated line of credit during the fourth quarter of 2010, but no later
than the expiration of our current facility. We are seeking to
increase the total line to
approximately $400 to $450 million. Based on current market conditions, we expect the
interest rate on a new, expanded revolving floating rate line of credit will be higher than the
rate on our current revolving floating rate line of credit. Borrowings under the current revolving
floating rate line of credit bear interest at a
42
Table of Contents
floating rate equal to the one month LIBOR Market
Index Rate plus 1.40%, which equated to 1.66% at September 30, 2010. Based on initial indications,
the interest rate on a new, expanded line of credit, if consummated, could
increase to the one month LIBOR Market Index Rate plus approximately 2.75%, which equated to
3.01% at September 30, 2010. Refer to the “Borrowings” section below for additional information on
the line of credit.
With the acquisition of a controlling interest in CCB, we have the right to call the
noncontrolling interest through February 2015. In addition, the noncontrolling interest has the
right to put the remainder of the shares to us beginning in March 2012 and ending February 2018.
The total maximum amount we would have to pay in any scenario is $22.8 million.
We file income taxes using the cost recovery method for tax revenue recognition. We were
notified on June 21, 2007 that we were being examined by the Internal Revenue Service for the 2005
calendar year. The IRS has concluded its audit and on March 19, 2009 issued Form 4549-A, Income
Tax Examination Changes, for tax years ended December 31, 2007, 2006 and 2005. The IRS has
proposed that cost recovery for tax revenue recognition does not clearly reflect taxable income and
that unused line fees paid on credit facilities should be capitalized and amortized rather than
taken as a current deduction. On April 22, 2009, we filed a formal protest of the findings
contained in the examination report prepared by the IRS. We believe we have sufficient support for
the technical merits of our positions and that it is more-likely-than-not that these positions will
ultimately be sustained; therefore, a reserve for uncertain tax positions is not necessary for
these tax positions. If we are unsuccessful in our appeal, we may ultimately be required to pay
the related deferred taxes and any potential interest, possibly requiring additional financing from
other sources.
Cash generated from operations is dependent upon our ability to collect on our defaulted
consumer receivables. Many factors, including the economy and our ability to hire and retain
qualified collectors and managers, are essential to our ability to generate cash flows.
Fluctuations in these factors that cause a negative impact on our business could have a material
impact on our expected future cash flows.
Our operating activities provided cash of $103.4 million and $64.2 million for the nine months
ended September 30, 2010 and 2009, respectively. In these periods, cash from operations was
generated primarily from net income earned through cash collections and fee income received for the
period. The increase was due mostly to changes in deferred taxes and an increase in net income to
$53.2 million for the nine months ended September 30, 2010 from $31.9 million for the nine months
ended September 30, 2009. The remaining changes were due to net changes in other accounts related
to our operating activities.
Our investing activities used cash of $143.0 million and $100.2 million during the nine months
ended September 30, 2010 and 2009, respectively. Cash provided by investing activities is
primarily driven by cash collections applied to principal on finance receivables. Cash used in
investing activities is primarily driven by acquisitions of defaulted consumer receivables,
purchases of property and equipment and business acquisitions. The majority of the increase was
due to cash payments for business acquisitions totaling $23.1 million during the nine months ended
September 30, 2010, as compared to $100,000 during the nine months ended September 30, 2009, as
well as an increase in acquisitions of finance receivables, which increased from $210.1 million for
the nine months ended September 30, 2009 to $273.9 million for the nine months ended September 30,
2010, partially offset by an increase in collections applied to principal on finance receivables
from $113.1 million for the nine months ended September 30, 2009 to $160.1 million for the nine
months ended September 30, 2010.
Our financing activities provided cash of $39.7 million and $42.0 million during the nine
months ended September 30, 2010 and 2009, respectively. Cash is provided by draws on our line of
credit, proceeds from equity offerings, proceeds from debt financing and stock option exercises.
Cash used in financing activities is primarily driven by payments on our line of credit and
principal payments on long-term debt and capital lease obligations. The majority of the increase
was due to cash proceeds received from our $75.5 million equity offering during the nine months
ended September 30, 2010, partially offset by $30.8 million in net repayments on our line of credit
during the nine months ended September 30, 2010, as compared to net borrowings on our line of
credit of $38.0 million during the same period in 2009.
Cash paid for interest was $6.5 million and $6.0 million for the nine months ended September
30, 2010 and 2009, respectively. Interest was paid on our line of credit, long-term debt, capital
lease obligations and our interest rate swap agreement. The increase was mainly due to an increase
in our average borrowings for the nine months
43
Table of Contents
ended September 30, 2010 compared to the same period in 2009 as well as the interest
expense paid during 2010 relating to the interest rate swap, offset by a decrease in our weighted
average interest rate which decreased to 2.41% for the nine months ended September 30, 2010 as
compared to 2.67% for the nine months ended September 30, 2009.
Borrowings
On November 29, 2005, we entered into a Loan and Security Agreement for a revolving line of
credit. The agreement has been amended six times to add additional lenders and ultimately increase
the total availability of credit under the line to $365 million. The agreement is a line of credit
in an amount equal to the lesser of $365 million or 30% of our ERC of all our eligible asset pools.
Borrowings under the revolving credit facility bear interest at a floating rate equal to the one
month LIBOR Market Index Rate plus 1.40%, which equated to 1.66% at September 30, 2010. Of the $365
million facility, $50 million was locked in as an interest only term loan at a rate of 6.80% and
expires on May 4, 2012. The remaining $315 million expires on May 2, 2011. We also pay an unused
line fee equal to three-tenths of one percent, or 30 basis points, on any unused portion of the
line of credit. The loan is collateralized by substantially all our tangible and intangible
assets. The agreement provides as follows:
| • | monthly borrowings may not exceed 30% of ERC; | ||
| • | funded debt to EBITDA (defined as net income, less income or plus loss from discontinued operations and extraordinary items, plus income taxes, plus interest expense, plus depreciation, depletion, amortization (including finance receivable amortization) and other non-cash charges) ratio must be less than 2.0 to 1.0 calculated on a rolling twelve-month average; | ||
| • | tangible net worth must be at least 100% of tangible net worth reported at September 30, 2005, plus 25% of cumulative positive net income since the end of such fiscal quarter, plus 100% of the net proceeds from any equity offering without giving effect to reductions in tangible net worth due to repurchases of up to $100,000,000 of our common stock; and | ||
| • | restrictions on change of control. |
As of September 30, 2010 and 2009, outstanding borrowings under the facility totaled $288.5
million and $306.3 million, respectively, of which $50.0 million was part of the non-revolving
fixed rate sub-limit. The average balance on the revolving portion of the credit facility for the
three months ended September 30, 2010 and 2009 was $246.7 million and $238.8 million, respectively.
As of September 30, 2010, we were in compliance with all of the covenants of the agreement.
Other borrowings at September 30, 2010, consisted of $1.0 million of long-term debt which
matures on February 28, 2012.
Stockholders’ Equity
Stockholders’ equity was $468.5 at September 30, 2010 and $335.5 million at December 31, 2009.
The increase was attributable primarily to $71.7 in net proceeds from a stock offering and $52.8
million in net income.
Contractual Obligations
Our contractual obligations as of September 30, 2010 were as follows (amounts in thousands):
| Payments due by period | ||||||||||||||||||||
| Less | More | |||||||||||||||||||
| than 1 | 1 - 3 | 4 - 5 | than 5 | |||||||||||||||||
| Contractual Obligations | Total | year | years | years | years | |||||||||||||||
Operating Leases |
$ | 20,097 | $ | 4,083 | $ | 8,178 | $ | 5,416 | $ | 2,420 | ||||||||||
Line of Credit (1) |
297,106 | 245,123 | 51,983 | — | — | |||||||||||||||
Long-term Debt |
1,034 | 730 | 304 | — | — | |||||||||||||||
Purchase Commitments (2) (3) |
130,976 | 108,001 | 15,375 | 7,600 | — | |||||||||||||||
Employment Agreements |
10,160 | 8,359 | 1,647 | 154 | — | |||||||||||||||
Total |
$ | 459,373 | $ | 366,296 | $ | 77,487 | $ | 13,170 | $ | 2,420 | ||||||||||
44
Table of Contents
| (1) | To the extent that a balance is outstanding on our lines of credit, the revolving portion would be due in May, 2011 and the non-revolving fixed rate sub-limit portion would be due in May 2012. This amount also includes estimated interest and unused line fees due on the line of credit for both the fixed rate and variable rate components as well as interest due on our interest rate swap. This estimate also assumes that the balance on the line of credit remains constant from the September 30, 2010 balance of $288.5 million and the balance is paid in full at its respective maturity. | |
| (2) | This amount includes the maximum remaining amount to be purchased under forward flow contracts for the purchase of charged-off consumer debt in the amount of approximately $104.8 million. | |
| (3) | This amount includes $1.0 million of remaining consideration to be paid relating to the acquisition of CCB as well as the maximum remaining purchase price of $22.8 million to be paid to acquire the noncontrolling interest of CCB. |
Off Balance Sheet Arrangements
We do not have any off balance sheet arrangements as defined by Regulation S-K 303(a)(4)
promulgated under the Securities Exchange Act of 1934 (the “Exchange Act”).
Recent Accounting Pronouncements
In June 2009, the FASB issued guidance on accounting for transfers of financial assets to
improve the reporting for the transfer of financial assets. The guidance must be applied as of the
beginning of each reporting entity’s first annual reporting period that begins after November 15,
2009, for interim periods within that first annual reporting period and for interim and annual
reporting periods thereafter. Earlier application is prohibited. We adopted this guidance during
the first quarter of 2010, which had no material impact on our consolidated financial statements.
In June 2009, the FASB issued guidance on consolidation of variable interest entities to
improve financial reporting by enterprises involved with variable interest entities and to provide
more relevant and reliable information to users of financial statements. The guidance is effective
as of the beginning of each reporting entity’s first annual reporting period that begins after
November 15, 2009, for interim periods within that first annual reporting period, and for interim
and annual reporting periods thereafter. Earlier application is prohibited. We adopted this
guidance during the first quarter of 2010, which had no material impact on our consolidated
financial statements.
In January 2010, the FASB issued ASU No. 2010-06, “Fair Value Measurements and Disclosures”
(Topic 820): “Improving Disclosures about Fair Value Measurements” (“ASU 2010-06”), which clarifies
and expands disclosure requirements related to fair value measurements. Disclosures are required
for significant transfers between levels in the fair value hierarchy. Activity in Level 3 fair
value measurements is to be presented on a gross, rather than net, basis. The update clarifies how
the appropriate level of disaggregation should be determined and emphasizes that information
sufficient to permit reconciliation between fair value measurements and line items on the financial
statements should be provided. The update is effective for interim and annual reporting periods
beginning after December 15, 2009 except for the expanded disclosures related to activity in Level
3 fair value measurements which are effective one year later. We adopted ASU 2010-06 during the
first quarter of 2010, which had no material effect on our consolidated financial statements.
In April 2010, the FASB issued ASU No. 2010-18, “Receivables” (Topic 310): “Effect of a Loan
Modification When the Loan Is Part of a Pool that is Accounted for as a Single Asset” (‘ASU
2010-18”), which clarifies the accounting for acquired loans that have evidence of a deterioration
in credit quality since origination (referred to as
“Subtopic 310-30 Loans”). Under ASU 2010-18, an entity may not apply troubled debt
restructuring (“TDR”) accounting guidance to individual Subtopic 310-30 loans that are part of a
pool, even if the modification of those loans would otherwise be considered a troubled debt
restructuring. Once a pool is established, individual loans should not be removed from the pool
unless the entity sells, forecloses, or writes off the loan. Entities would continue to consider
whether the pool of loans is impaired if expected cash flows for the pool change. Subtopic 310-30
loans that are accounted for individually would continue to be subject to TDR accounting guidance.
A one-time election to terminate accounting for loans as a pool, which may be made on a
pool-by-pool basis, is provided upon adoption of ASU 2010-18. ASU 2010-18 is effective for interim
or annual periods ending on or after July 15, 2010. We adopted ASU 2010-18 during the third
quarter of 2010, which had no material effect on our consolidated financial statements.
45
Table of Contents
In July, 2010, the FASB issued ASU No. 2010-20, “Receivables” (Topic 310) “Disclosures about
the Credit Quality of Financing Receivables and the Allowance for Credit Losses” (“ASU 2010-20”),
which requires significant new disclosures about the allowance for credit losses and the credit
quality of financing receivables. The requirements are intended to enhance transparency regarding
credit losses and the credit quality of loan and lease receivables. Under this statement,
allowance for credit losses and fair value are to be disclosed by portfolio segment, while credit
quality information, impaired financing receivables and nonaccrual status are to be presented by
class of financing receivable. Disclosure of the nature and extent, the financial impact and
segment information of troubled debt restructurings will also be required. The disclosures are to
be presented at the level of disaggregation that management uses when assessing and monitoring the
portfolio’s risk and performance. ASU 2010-20 is effective for interim and annual reporting
periods ending on or after December 15, 2010. The adoption of ASU 2010-20 is not expected to have
a material effect on our consolidated financial statements.
Critical Accounting Policies
The preparation of financial statements and related disclosures in conformity with U.S.
generally accepted accounting principles and our discussion and analysis of our financial condition
and results of operations require our management to make judgments, assumptions, and estimates that
affect the amounts reported in our consolidated financial statements and accompanying notes. We
base our estimates on historical experience and on various other assumptions we believe to be
reasonable under the circumstances, the results of which form the basis for making judgments about
the carrying values of assets and liabilities. Actual results may differ from these estimates and
such differences may be material.
Management believes our critical accounting policies and estimates are those related to
revenue recognition, valuation of acquired intangibles and goodwill and income taxes. Management
believes these policies to be critical because they are both important to the portrayal of our
financial condition and results, and because they require management to make judgments and
estimates about matters that are inherently uncertain. Our senior management has reviewed these
critical accounting policies and related disclosures with the Audit Committee of our Board of
Directors.
Revenue Recognition
We acquire accounts that have experienced deterioration of credit quality between origination
and our acquisition of the accounts. The amount paid for an account reflects our determination
that it is probable we will be unable to collect all amounts due according to the account’s
contractual terms. At acquisition, we review each account to determine whether there is evidence of
deterioration of credit quality since origination and if it is probable that we will be unable to
collect all amounts due according to the account’s contractual terms. If both conditions exist, we
determine whether each such account is to be accounted for individually or whether such accounts
will be assembled into pools based on common risk characteristics. We consider expected prepayments
and estimate the amount and timing of undiscounted expected principal, interest and other cash
flows for each acquired portfolio and subsequently aggregated pools of accounts. We determine the
excess of the pool’s scheduled contractual principal and contractual interest payments over all
cash flows expected at acquisition as an amount that should not be accreted (nonaccretable
difference) based on our proprietary acquisition models. The remaining amount, representing the
excess of the account’s cash flows expected to be collected over the amount paid, is accreted into
income recognized on finance receivables over the remaining life of the account or pool (accretable
yield).
We account for our investment in finance receivables under the guidance of ASC Topic 310-30,
“Loans and Debt Securities Acquired with Deteriorated Credit Quality” (ASC 310-30). Under ASC
310-30 static pools of accounts may be established. These pools are aggregated based on certain
common risk criteria. Each static pool is recorded at cost, which includes certain direct costs
of acquisition paid to third parties, and is accounted for as a single unit for the recognition of
income, principal payments and loss provision. Once a static pool is established for a calendar
quarter, individual receivable accounts are not added to the pool (unless replaced by the seller)
or removed from the pool (unless sold or returned to the seller). ASC 310-30 requires that the
excess of the contractual cash flows over expected cash flows, based on our estimates
derived from our proprietary collection models, not be recognized as an adjustment of revenue or
expense or on the balance sheet. ASC 310-30, utilizing the interest method, initially freezes the
yield, estimated when the accounts are purchased as the basis for subsequent
46
Table of Contents
impairment testing.
Significant increases in expected future cash flows may be recognized prospectively through an
upward adjustment of the yield over a portfolio’s remaining life. Any increase to the yield then
becomes the new benchmark for impairment testing. Under ASC 310-30, rather than lowering the
estimated yield if the collection estimates are not received or projected to be received, the
carrying value of a pool would be written down to maintain the then current yield and is shown as a
reduction in revenue in the consolidated income statements with a corresponding valuation allowance
offsetting finance receivables, net, on the consolidated balance sheet. Income on finance
receivables is accrued quarterly based on each static pool’s effective yield. Quarterly cash flows
greater than the interest accrual will reduce the carrying value of the static pool. This
reduction in carrying value is defined as payments applied to principal (also referred to as
finance receivable amortization). Likewise, cash flows that are less than the interest accrual
will accrete the carrying balance. Generally, we do not allow accretion in the first six to twelve
months; accordingly, we utilize either the cost recovery method or cash method when necessary to
prevent accretion as permitted by ASC 310-30. The yield is estimated and periodically recalculated
based on the timing and amount of anticipated cash flows using our proprietary collection models.
A pool can become fully amortized (zero carrying balance on the balance sheet) while still
generating cash collections. In this case, all cash collections are recognized as revenue when
received. Under the cash method, revenue is recognized as it would be under the interest method up
to the amount of cash collections. Additionally, we use the cost recovery method when collections
on a particular pool of accounts cannot be reasonably predicted. These cost recovery pools are not
aggregated with other portfolios. Under the cost recovery method, no revenue is recognized until
we have fully collected the cost of the portfolio, or until such time that we consider the
collections to be probable and estimable and begin to recognize income based on the interest method
as described above.
We establish valuation allowances for all acquired accounts subject to ASC 310-30 to reflect
only those losses incurred after acquisition (that is, the present value of cash flows initially
expected at acquisition that are no longer expected to be collected). Valuation allowances are
established only subsequent to acquisition of the accounts. At September 30, 2010, we had a $71.0
million valuation allowance on our finance receivables.
We implement the accounting for income recognized on finance receivables under ASC 310-30 as
follows. We create each accounting pool using our projections of estimated cash flows and expected
economic life. We then compute the effective yield that fully amortizes the pool to the end of its
expected economic life based on the current projections of estimated cash flows. As actual cash
flow results are recorded, we balance those results to the data contained in our proprietary models
to ensure accuracy, then review each accounting pool watching for trends, actual performance versus
projections and curve shape, sometimes re-forecasting future cash flows utilizing our statistical
models. The review process is primarily performed by our finance staff; however, our operational
and statistical staffs may also be involved depending upon actual cash flow results achieved. To
the extent there is overperformance, we will either increase the yield or release the allowance and
consider increasing future cash projections, if persuasive evidence indicates that the
overperformance is considered to be a significant betterment. If the overperformance is considered
more of an acceleration of cash flows (a timing difference), the Company will adjust estimated
future cash flows downward which effectively extends the amortization period, or take no action at
all if the amortization period is reasonable and falls within the pools’ expected economic life.
In either case, yield may or may not be increased due to the time value of money (accelerated cash
collections). To the extent there is underperformance, we will record an allowance if the
underperformance is significant and will also consider revising estimated future cash flows based
on current period information, or take no action if the pool’s amortization period is reasonable
and falls within the currently projected economic life.
We utilize the provisions ASC Topic 605-45, “Principal Agent Considerations” (“ASC 605-45”),
to account for revenues from our fee for service subsidiaries. ASC 605-45 requires an analysis to
be completed to determine if
certain revenues should be reported gross or reported net of their related operating expense.
This analysis includes an assessment of who retains inventory/credit risk, who controls vendor
selection, who establishes pricing and who remains the primary obligor on the transaction. Each of
these factors was considered to determine the correct method of recognizing revenue from our
subsidiaries.
Our skip tracing subsidiary utilizes both gross and net reporting under ASC 605-45. We
generate revenue by working an account and successfully locating a customer for our client. An
“investigative fee” is received for these services. In addition, we incur “agent expenses” where
we hire a third-party collector to effectuate repossession. In many cases we have an arrangement
with our client which allows us to bill the client for these fees. We have determined these fees
to be gross revenue based on the criteria in ASC 605-45 and they are recorded as such in the line
item “Fee income,” primarily because we are primarily liable to the third party collector. There is
a
47
Table of Contents
corresponding expense in “Legal and agency fees and costs” for these pass-through items. We
also incur fees to release liens on the repossessed collateral. These lien-release fees are netted
in the line “Legal and agency fees and costs.”
Our government processing and collection business’ primary source of income is derived from
servicing taxing authorities in several different ways: processing all of their tax payments and
tax forms, collecting delinquent taxes, identifying taxes that are not being paid and auditing tax
payments. The processing and collection pieces are standard commission based billings or fee for
service transactions. When we conduct an audit, there are two components. The first component is
a charge for the hours incurred on conducting the audit. This charge is for hours worked. This
charge is up-charged from the actual costs incurred. The gross billing is a component of the line
item “Fee income” and the expense is included in the line item “Compensation and employee
services.” The second component is expenses incurred while conducting the audit. Most
jurisdictions will reimburse us for direct expenses incurred for the audit including such items as
travel and meals. The billed amounts are included in the line item “Fee income” and the expense
component is included in its appropriate expense category, generally, “Other operating expenses.”
Our claims administration and payment processing business utilizes net reporting under ASC
605-45. We generate revenue by filing claims with the class action claims administrator on behalf
of our clients and receive the related settlement payment. Under SEC Staff Accounting Bulletin
104, (“SAB 104”), we have determined our fee is not earned until we have received the settlement
funds. When a payment is received from the claims administrator for settlement of a lawsuit, we
record our fee on a net basis as revenue and include it in the line item “Fee income.” The
balance of the received amounts are recorded as a liability and included in the line item “Accrued
expenses and other liabilities.”
Valuation of Acquired Intangibles and Goodwill
In accordance with ASC Topic 350, “Intangibles—Goodwill and Other” (“ASC 350”), we are
required to perform a review of goodwill for impairment annually or earlier if indicators of
potential impairment exist. The review of goodwill for potential impairment is highly subjective
and requires that: (1) goodwill is allocated to various reporting units of our business to which it
relates; and (2) we estimate the fair value of those reporting units to which the goodwill relates
and then determine the book value of those reporting units. If the estimated fair value of
reporting units with allocated goodwill is determined to be less than their book value, we are
required to estimate the fair value of all identifiable assets and liabilities of those reporting
units in a manner similar to a purchase price allocation for an acquired business. This requires
independent valuation of certain unrecognized assets. Once this process is complete, the amount of
goodwill impairment, if any, can be determined.
We believe that, at September 30, 2010, there were no indicators of potential impairment of
goodwill. Therefore, no early review of goodwill for impairment was performed. However, changes in
various circumstances including changes in our market capitalization, changes in our forecasts and
changes in our internal business structure could cause one of our reporting units to be valued
differently thereby causing an impairment of goodwill. Additionally, in response to changes in our
industry and changes in global or regional economic conditions, we may strategically realign our
resources and consider restructuring, disposing or otherwise exiting businesses, which could result
in an impairment of some or all of our identifiable intangibles or goodwill.
Income Taxes
We follow the guidance of FASB ASC Topic 740 “Income Taxes” (“ASC 740”) as it relates to the
provision for income taxes and uncertainty in income taxes. Accordingly, we record a tax provision
for the anticipated tax consequences of the reported results of operations. In accordance with ASC
740 the provision for income taxes is computed using the asset and liability method, under which
deferred tax assets and liabilities are recognized for the expected future tax consequences of
temporary differences between the financial reporting and tax bases of assets and liabilities, and
for operating losses and tax credit carry-forwards. Deferred tax assets and liabilities are
measured using the currently enacted tax rates that apply to taxable income in effect for the years
in which those tax assets are expected to be realized or settled. The guidance also prescribes a
recognition threshold and measurement attribute for the financial statement recognition and
measurement of a tax position taken or expected to be taken in a tax return. It also provides
guidance on derecognition, classification, interest and penalties, accounting in interim periods,
disclosure and transition. The evaluation of a tax position in accordance with the guidance is a
two-step
48
Table of Contents
process. The first step is recognition: the enterprise determines whether it is
more-likely-than-not that a tax position will be sustained upon examination, including resolution
of any related appeals or litigation processes, based on the technical merits of the position. In
evaluating whether a tax position has met the more-likely-than-not recognition threshold, the
enterprise should presume that the position will be examined by the appropriate taxing authority
that would have full knowledge of all relevant information. The second step is measurement: a tax
position that meets the more-likely-than-not recognition threshold is measured to determine the
amount of benefit to recognize in the financial statements. The tax position is measured as the
largest amount of benefit that is greater than 50 percent likely of being realized upon ultimate
settlement. Tax positions that previously failed to meet the more-likely-than-not recognition
threshold should be recognized in the first subsequent financial reporting period in which that
threshold is met. Previously recognized tax positions that no longer meet the more-likely-than-not
recognition threshold should be derecognized in the first subsequent financial reporting period in
which that threshold is no longer met.
Effective with our 2002 tax filings, we adopted the cost recovery method of income recognition
for tax purposes. We believe cost recovery to be an acceptable method for companies in the bad debt
purchasing industry and results in the reduction of current taxable income as, for tax purposes,
collections on finance receivables are applied first to principal to reduce the finance receivables
to zero before any income is recognized.
We believe it is more likely than not that forecasted income, including income that may be
generated as a result of certain tax planning strategies, together with the tax effects of the
deferred tax liabilities, will be sufficient to fully recover the remaining deferred tax assets.
In the event that all or part of the deferred tax assets are determined not to be realizable in the
future, a valuation allowance would be established and charged to earnings in the period such
determination is made. Similarly, if we subsequently realize deferred tax assets that were
previously determined to be unrealizable, the respective valuation allowance would be reversed,
resulting in a positive adjustment to earnings or a decrease in goodwill in the period such
determination is made. In addition, the calculation of tax liabilities involves significant
judgment in estimating the impact of uncertainties in the application of complex tax laws.
Resolution of these uncertainties in a manner inconsistent with our expectations could have a
material impact on our results of operations and financial position.
Item 3. Quantitative and Qualitative Disclosure About Market Risk
Our exposure to market risk relates to interest rate risk with our variable rate credit line.
The average borrowings on our variable rate credit line were $246.7 million and $238.8 million for
the three months ended September 30, 2010 and 2009, respectively. Assuming a 200 basis point
increase in interest rates, interest expense would have increased by $1.2 million for the three
months ended September 30, 2010 and 2009, respectively. At September 30, 2010 and 2009, we had
$238.5 million and $256.3 million, respectively, of variable rate debt outstanding on our credit
line. We do not have any other variable rate debt outstanding at September 30, 2010. Significant
increases in future interest rates on the variable rate credit line could lead to a material
decrease in future earnings assuming all other factors remained constant.
Item 4. Controls and Procedures
Evaluation of Disclosure Controls and Procedures. We maintain disclosure controls and procedures
(as defined in Exchange Act Rules 13a-15(e) and 15d-15(e)) that are designed to ensure that
information required to be disclosed
in our Exchange Act reports is recorded, processed, summarized and reported within the time periods
specified in the SEC’s rules and forms, and that such information is accumulated and communicated
to our management, including our Chief Executive Officer and Chief Financial and Administrative
Officer, as appropriate, to allow timely decisions regarding required disclosure. In designing and
evaluating the disclosure controls and procedures, management recognized that any controls and
procedures, no matter how well designed and operated, can provide only reasonable assurance of
achieving the desired control objectives, and management necessarily was required to apply its
judgment in evaluating the cost-benefit relationship of possible controls and procedures. Also,
controls may become inadequate because of changes in conditions and the degree of compliance with
the policies or procedures may deteriorate. We conducted an evaluation, under the supervision and
with the participation of our principal executive
49
Table of Contents
officer and principal financial officer, of the
effectiveness of our disclosure controls and procedures as of the end of the period covered by this
report. Based on this evaluation, the principal executive officer and principal financial officer
have concluded that, as of September 30, 2010, our disclosure controls and procedures were
effective.
Changes in Internal Control Over Financial Reporting. There was no change in our internal control
over financial reporting that occurred during the quarter ended September 30, 2010 that has
materially affected, or is reasonably likely to materially affect, our internal control over
financial reporting.
PART II. OTHER INFORMATION
Item 1. Legal Proceedings
We are from time to time subject to routine legal claims and proceedings, most of which are
incidental to the ordinary course of our business. We initiate lawsuits against consumers and are
occasionally countersued by them in such actions. Also, consumers, either individually, as members
of a class action, or through a governmental entity on behalf of consumers, may initiate litigation
against us, in which they allege that we have violated a state or federal law in the process of
collecting on an account. From time to time, other types of lawsuits are brought against us. We maintain appropriate levels of errors and omissions insurance coverage to protect us against
financial losses associated with potential litigation involving us, and while it is not expected
that these or any other legal proceedings or claims in which we are involved will, either
individually or in the aggregate, have a material adverse impact on our results of operations,
liquidity or our financial condition, the matters described below falls outside of the normal
parameters of our routine legal proceedings.
We are currently a defendant in a purported class action counterclaim entitled PRA v.
Barkwell, 4:09-cv-00113-CDL, which was filed in response to a motion filed by PRA that sought to
confirm an arbitration award, in the amount of $9,781.43. The counterclaim, which was filed against
us, the National Arbitration Forum (“NAF”) and MBNA America Bank, N.A., on July 29, 2009 in the
Superior Court of Muscogee County, Georgia, and has since been removed to the United States
District Court for the Middle District of Georgia, where it is currently pending. The counterclaim
alleges that in pursuing arbitration claims against Barkwell and other consumer debtors, pursuant
to the terms and conditions of their respective cardholder agreements, we breached a duty of good
faith and fair dealing and made negligent misrepresentations concerning its “arbitration
practices.” The counterclaim asserts that because NAF was financially tied to Axiant, LLC, a
large, nationwide debt collector, NAF lacked the necessary independence and impartiality to conduct
arbitration proceedings, such as the ones filed by PRA, including the arbitration claim that was
filed against Mr. Barkwell. Barkwell asserts that PRA knew, or should have known, of the
relationship between NAF and Axiant, and brought this action on behalf of a purported class of
consumers to, among other things, vacate the arbitration awards that we have obtained before NAF
and have us disgorge the amounts collected with respect to such awards. While it is not possible at
this time to accurately estimate the possible loss, if any, as we believe we have meritorious
defenses to the allegations made in this counterclaim and intend to defend ourselves vigorously
against them. This matter has not progressed to the discovery stage yet, therefore the Company
currently lacks the necessary information to determine the aggregate amount of arbitration claims
potentially impacted by the purported class herein.
As previously disclosed, we are a defendant in another purported class action related to
matters previously brought before NAF, styled PRA v. Freeman (Case No.: 10-CVD-1003) which was
filed in the District Court for Wake County, North Carolina on or about March 26, 2010. The court
in PRA v. Freeman recently heard arguments
on the motion to dismiss that the Company had filed earlier this year and has informed the
parties that the matter will be dismissed, pending submission of an appropriate order. We
anticipate submitting such an order and having the matter dismissed imminently.
As previously disclosed, we were a defendant in a purported enforcement action brought by the
Attorney General for the State of Missouri. The action, filed in August 2009, sought relief for
Missouri consumers that had allegedly been injured as a result of certain of our alleged collection
practices. We denied any wrongdoing with respect to the allegations in the complaint and on June
25, 2010, the Missouri Circuit Court dismissed the matter in its entirety. On July 26, 2010, the
Missouri Attorney General filed a notice of appeal.
50
Table of Contents
Item 1A. Risk Factors
An investment in our common stock involves a high degree of risk. You should carefully
consider the specific risk factors listed under Part I, Item 1A of our 2009 Annual Report on Form
10-K filed on February 16, 2010, together with all other information included or incorporated in
our reports filed with the SEC. Any such risks may materialize, and additional risks not known to
us, or that we now deem immaterial, may arise. In such event, our business, financial condition,
results of operations or prospects could be materially adversely affected. If that occurs, the
market price of our common stock could fall, and you could lose all or part of your investment.
Item 2. Unregistered Sales of Equity Securities and Use of Proceeds
None.
Item 3. Defaults Upon Senior Securities
None.
Item 4. Other Information
None.
Item 5. Exhibits
| 31.1 | Section 302 Certifications of Chief Executive Officer. | |
| 31.2 | Section 302 Certifications of Chief Financial Officer. | |
| 32.1 | Section 906 Certifications of Chief Executive Officer and Chief Financial Officer. |
51
Table of Contents
SIGNATURES
Pursuant to the requirements of the Exchange Act, the registrant has duly caused this report to be
signed on its behalf by the undersigned, thereunto duly authorized.
| PORTFOLIO RECOVERY ASSOCIATES, INC. (Registrant) |
||||
| Date: November 9, 2010 | By: | /s/ Steven D. Fredrickson | ||
| Steven D. Fredrickson | ||||
| Chief Executive Officer, President and Chairman of the Board of Directors (Principal Executive Officer) |
||||
| Date: November 9, 2010 | By: | /s/ Kevin P. Stevenson | ||
| Kevin P. Stevenson | ||||
| Chief Financial and Administrative Officer, Executive Vice President, Treasurer and Assistant Secretary (Principal Financial and Accounting Officer) |
||||
52