Attached files
| file | filename |
|---|---|
| 8-K - IFF 8-K 9-10-15 - INTERNATIONAL FLAVORS & FRAGRANCES INC | iff8-k9x9x15.htm |

Barclays Back to School Alison Cornell, Executive Vice President & CFO September 10, 2015

Statements made in this presentation that relate to our future performance or future financial results or other future events (identified by such terms as “expect”, “anticipate”, “believe”, “outlook”, “guidance”, “may”, “target” or similar terms and variations thereof) are forward-looking statements, including the Company’s 2015 guidance, its long-term financial guidance, the impact of recent developments in China and emerging markets on its final results and the Company’s expectations regarding the impact of its 2020 strategy on its financial and operational results, including its ability to fund through cost-savings and the impact of acquisitions. These statements are based on our current beliefs and expectations and are subject to significant risks and uncertainties. Actual results may materially differ from those set forth in the forward-looking statements. Factors that could cause IFF’s actual results to differ materially include (1) macroeconomic trends affecting the emerging markets; (2) the Company’s ability to implement its Vision 2020 strategy; (3) the Company’s ability to benefit from its investments and expansion in emerging markets; (4) the impact of currency fluctuations or devaluations in the Company’s principal foreign markets; (5) risks associated with the Company’s supply chain, including availability and pricing of raw materials, energy and transportation; (6) economic, regulatory and political risks associated with the Company’s international operations; (7) changes in consumer demand, either due to changes in preferences or consumer confidence; (8) the Company’s ability to successfully increase its sales through acquisitions, collaborations and joint ventures including its ability to identify, acquire on terms consistent with the Company’s return criteria and successfully integrate bolt-on or adjacent companies; (9) the Company’s ability to implement its business strategy, including the ability to fund growth through anticipated cost savings; and (10) the Company’s ability to successfully develop new and competitive products and technology that appeal to its customers and consumers as well as those risks described in the Risk Factor forward-looking statements sections of our Annual Report on Form 10-K for the year ended December 31, 2014 and in our other periodic reports filed with the SEC, all of which are available on our website under Investor Relations, at www.iff.com. We do not undertake to update the forward-looking statements to reflect the impact of circumstances or events that may arise after the date of the forward-looking statements. We have disclosed certain non- GAAP measures within this presentation. Please see reconciliations to their respective measures prescribed by accounting principles generally accepted in the U.S., all of which are available on our website under Investor Relations, at www.iff.com. Cautionary Statement

Overview Investment Thesis Summary Vision 2020 Recent Performance Agenda

Total Global F&F Market (B$) Segment Share of F&F Market (%) North America GA 3.1 21.6 LATAM Europe 6.4 2.0 5.0 5.1 18.0 2.4 4.8 1.6 4.6 4.6 10.6 6.5 3.5 2014 Flavors (~4% CAGR) CAGR (14-19) ~75% growth expected in emerging markets 2.2% 1.7% 4.5% 5.9% 5.2% Africa & Mid-East Fragrance Ingredients (2% CAGR) Fragrance compounds (~3% CAGR) Flavor & Fragrance Market Overview Source: IAL Consultants: Overview of the Global Favours & Fragrances market (8th edition, 2014) and Company estimates

• IFF holds ~16% market share • Top 4 represent 2/3 of market • Market fragmented outside top players • Barriers to entry include: – Research & Development – Customer relationships – Regulatory expertise – Consumer insight – Global platform 25% 16% 16% 12% 31% Givaudan IFF Symrise Firmenich Other Source: IAL Consultants: Overview of the Global Favours & Fragrances market (8th edition, 2014) and Company estimates Flavor & Fragrance Market Share Dynamics F&F Market Share

$0.7 $0.7 Bioland 10% 7% 5% 4% 4% 4% 4% 3% 3% 3% 53% Cosmetic Actives Market Share Natural Actives (6 to 7% CAGR)* Synthetic Actives (~2 to 4% CAGR)* BASF Silab Air Liquide Gattefossé Other Cosmetic Actives Market Overview Lonza IFF DSM Croda Symrise $1.4B Total Cosmetic Actives Market * Expected annual growth Source: Company estimates

• 126 Years Old & 51 Years on NYSE • S&P 500 Company • ~$9.2 Billion Market Capitalization • $3.1 Billion in Sales, with Top Tier Adjusted EBITDA Margin of 22.2%* • 79% of Sales outside the U.S. • 29 Manufacturing Facilities • 31 Creative Centers • ~6,400 Employees at a Glance * Adjusted EBITDA margin is a Non-GAAP metric, please see our GAAP to Non-GAAP Reconciliation at IFF.com

• Consumer Insight • Research and Development • Creative Expertise • Consumer Experience How We Compete to Win

• Strong Growth Dynamics • Proven Profitability • Excellent Cash Flow Generation • Industry-Leading Returns High Quality Investment Thesis

5% 5% 6% 4% 6% 7% 7% 5% 6% 1-Yr CAGR 3-Yr CAGR 5-Yr CAGR Strong Growth Dynamics Currency Neutral Sales Growth For year ending 2014 Total Company: Currency Neutral Sales Growth Flavors: Like-For-Like Currency Neutral Sales Growth Fragrances: Currency Neutral Sales Growth * Currency neutral sales are Non-GAAP metrics, please see our GAAP to Non-GAAP Reconciliation at IFF.com

Proven Profitability 15.5% 16.0% 16.5% 17.0% 17.5% 18.0% 18.5% 19.0% 19.5% 20.0% $300 $350 $400 $450 $500 $550 $600 2010 2011 2012 2013 2014 Adjusted Operating Profit Adjusted Operating Profit Margin Adjusted Operating Profit Trends * Adjusted operating profit and adjusted operating profit margin are Non-GAAP metrics, please see our GAAP to Non-GAAP Reconciliation at IFF.com

Excellent Cash Flow Generation * Adjusted operating cash flow is a Non-GAAP metrics, please see our GAAP to Non-GAAP Reconciliation at IFF.com 4.5% 6.5% 8.5% 10.5% 12.5% 14.5% 16.5% 18.5% $100 $150 $200 $250 $300 $350 $400 $450 $500 $550 2010 2011 2012 2013 2014 Adjusted Operating Cash Flow Trends Adjusted Operating Cash Flow Adjusted Operating Cash Flow as % of Sales

Industry-Leading Returns 7.0% 8.0% 9.0% 10.0% 11.0% 12.0% 13.0% 14.0% $120 $140 $160 $180 $200 $220 $240 $260 $280 2010 2011 2012 2013 2014 Adjusted Economic Profit Adjusted Economic Profit Spread Adjusted Economic Profit / Spread Trends * Adjusted economic profit and adjusted economic profit spread are Non-GAAP metrics, please see our GAAP to Non-GAAP Reconciliation at IFF.com

We are the catalyst for discoveries that spark the senses & transform the everyday Build Our Talent and Organization Continuously Improving Create a Sustainable Future Lead in key markets Close gaps across value enhancing categories Achieve #1 position with targeted customers Drive differentiation in key technologies Develop responsible products to meet the future needs of our customers & consumers Actively support our customers' success Achieve commercial excellence & service leadership Become a marketing powerhouse Strengthen the F&F core Stretch into adjacencies Pursue partnerships & collaborations Win Where We Compete Innovating Firsts Become Our Customers’ Partner of Choice Strengthen & Expand Portfolio 2020 Vision

Currency neutral operating profit growth 7-9% Currency neutral EPS growth 10% Currency neutral sales growth 4-6% 2016 to 2020 Financial Targets

Targeting $500M to $1B of sales through acquisitions by 2020 Accelerate Growth Through M&A

Cash Returned to Shareholders Goal 50-60% of net income Dividend Share Authorization +20% +$250M Accelerating Shareholder Return

Currency neutral adjusted operating profit growth* +7% Currency neutral adjusted EPS growth* +10% Currency neutral sales growth* +5% Q2 2015 1H 2015 +9% +11% +6% * Currency Neutral Sales, Currency Neutral Adjusted Operating Profit & Adjusted EPS are Non-GAAP metrics, please see our GAAP to Non-GAAP Reconciliation at IFF.com Financial Highlights

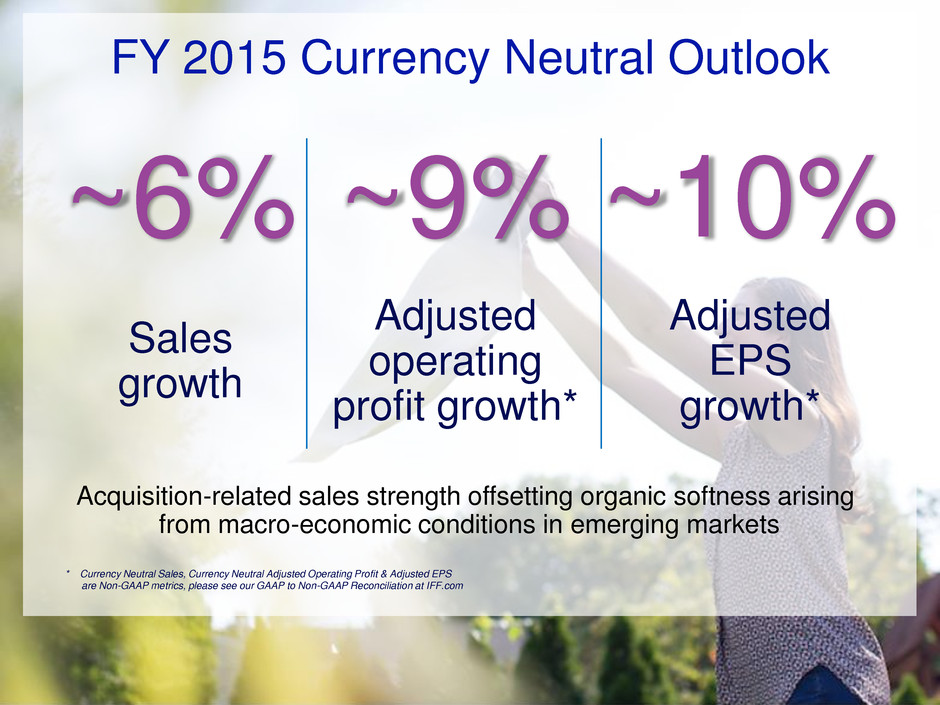
* Currency Neutral Sales, Currency Neutral Adjusted Operating Profit & Adjusted EPS are Non-GAAP metrics, please see our GAAP to Non-GAAP Reconciliation at IFF.com FY 2015 Currency Neutral Outlook Acquisition-related sales strength offsetting organic softness arising from macro-economic conditions in emerging markets Sales growth ~6% ~10% Adjusted EPS growth* Adjusted operating profit growth* ~9%

Summary • IFF is a high-quality investment with a proven track-record of success • Strategy focused on growth, differentiation and shareholder value • Solid year-to-date financial performance • Expecting to finish 2015 strong… financially & strategically… and enter 2016 on solid footing

