Attached files
| file | filename |
|---|---|
| EX-10.21 - EXHIBIT 10.21 - INTERNATIONAL FLAVORS & FRAGRANCES INC | iff10k2016exhibit1021.htm |
| EX-32 - EXHIBIT 32 - INTERNATIONAL FLAVORS & FRAGRANCES INC | iff10k2016exhibit32.htm |
| EX-31.2 - EXHIBIT 31.2 - INTERNATIONAL FLAVORS & FRAGRANCES INC | iff10k2016exhibit312.htm |
| EX-31.1 - EXHIBIT 31.1 - INTERNATIONAL FLAVORS & FRAGRANCES INC | iff10k2016exhibit311.htm |
| EX-23 - EXHIBIT 23 - INTERNATIONAL FLAVORS & FRAGRANCES INC | iff10k2016exhibit23.htm |
| EX-21 - EXHIBIT 21 - INTERNATIONAL FLAVORS & FRAGRANCES INC | iff10k2016exhibit21.htm |
| EX-12 - EXHIBIT 12 - INTERNATIONAL FLAVORS & FRAGRANCES INC | iff10k2016exhibit12.htm |
| EX-10.26 - EXHIBIT 10.26 - INTERNATIONAL FLAVORS & FRAGRANCES INC | iff10k2016exhibit1026.htm |
| EX-10.13 - EXHIBIT 10.13 - INTERNATIONAL FLAVORS & FRAGRANCES INC | iff10k2016exhibit1013.htm |
UNITED STATES SECURITIES AND EXCHANGE COMMISSION
Washington, D.C. 20549
FORM 10-K
þ | ANNUAL REPORT PURSUANT TO SECTION 13 OR 15(d) OF THE SECURITIES EXCHANGE ACT OF 1934 | |
For the fiscal year ended December 31, 2016 | ||
OR
¬ | TRANSITION REPORT PURSUANT TO SECTION 13 OR 15(d) OF THE SECURITIES EXCHANGE ACT OF 1934 | |
For the transition period from to | ||
Commission File Number 1-4858
INTERNATIONAL FLAVORS & FRAGRANCES INC.
(Exact name of registrant as specified in its charter)
NEW YORK | 13-1432060 |
(State or other jurisdiction of incorporation or organization) | (I.R.S. Employer Identification No.) |
521 WEST 57TH STREET, NEW YORK, N.Y. | 10019 |
(Address of principal executive offices) | (Zip Code) |
Registrant’s telephone number, including area code (212) 765-5500
SECURITIES REGISTERED PURSUANT TO SECTION 12(b) OF THE ACT:
Title of Each Class | Name of Each Exchange on Which Registered |
Common Stock, par value | New York Stock Exchange |
12 1/2¢ per share | |
SECURITIES REGISTERED PURSUANT TO SECTION 12(g) OF THE ACT:
None
Indicate by check mark if the registrant is a well-known seasoned issuer, as defined in Rule 405 of the Securities Act. Yes þ No ¬
Indicate by check mark if the registrant is not required to file reports pursuant to Section 13 or Section 15(d) of the Act. Yes ¬ No þ
Indicate by check mark whether the registrant (1) has filed all reports required to be filed by Section 13 or 15(d) of the Securities Exchange Act of 1934 during the preceding 12 months (or for such shorter period that the registrant was required to file such reports), and (2) has been subject to such filing requirements for the past 90 days. Yes þ No ¬
Indicate by check mark whether the registrant has submitted electronically and posted on its corporate Website, if any, every Interactive Data File required to be submitted and posted pursuant to Rule 405 of Regulation S-T (§232.405 of this chapter) during the preceding 12 months (or for such shorter period that the registrant was required to submit and post such files). Yes þ No ¬
Indicate by check mark if disclosure of delinquent filers pursuant to Item 405 of Regulation S-K (§229.405 of this chapter) is not contained herein, and will not be contained, to the best of registrant’s knowledge, in definitive proxy or information statements incorporated by reference in Part III of this Form 10-K or any amendments to this Form 10-K. ¬
Indicate by check mark whether the registrant is a large accelerated filer, an accelerated filer, a non-accelerated filer, or a smaller reporting company. See the definitions of “large accelerated filer,” “accelerated filer” and “smaller reporting company” in Rule 12b-2 of the Exchange Act.
Large accelerated filer þ | Accelerated filer ¬ | Non-accelerated filer ¬ | Smaller reporting company ¬ | ||||
Indicate by check mark whether the registrant is a shell company (as defined in Rule 12b-2 of the Exchange Act). Yes ¬ No þ
For the purpose of reporting the following market value of registrant’s outstanding common stock, the term “affiliate” refers to persons, entities or groups which directly or indirectly control, are controlled by, or are under common control with the registrant and does not include individual executive officers, directors or less than 10% shareholders. The aggregate market value of registrant’s common stock not held by affiliates as of June 30, 2016 was $10,040,332,045.
As of February 15, 2017, there were 79,037,680 shares of the registrant’s common stock, par value 12 1/2¢ per share, outstanding.
DOCUMENTS INCORPORATED BY REFERENCE
Portions of the registrant’s proxy statement for the 2017 Annual Meeting of Shareholders (the “IFF 2017 Proxy Statement”) are incorporated by reference in Part III of this Form 10-K.
INTERNATIONAL FLAVORS & FRAGRANCES INC.
TABLE OF CONTENTS
PAGE | ||
PART I | ||
ITEM 1. | ||
ITEM 1A. | ||
ITEM 1B. | ||
ITEM 2. | ||
ITEM 3. | ||
ITEM 4. | ||
PART II | ||
ITEM 5. | ||
ITEM 6. | ||
ITEM 7. | ||
ITEM 7A. | ||
ITEM 8. | ||
ITEM 9. | ||
ITEM 9A. | ||
ITEM 9B. | ||
PART III | ||
ITEM 10. | ||
ITEM 11. | ||
ITEM 12. | ||
ITEM 13. | ||
ITEM 14. | ||
PART IV | ||
ITEM 15. | ||
ITEM 16. | ||
2
PART I
When used in this report, the terms “IFF,” “the Company,” “we,” “us” and “our” mean International Flavors & Fragrances Inc., and its subsidiaries.
ITEM 1. | BUSINESS. |
We are a leading innovator of sensorial experiences, co-creating unique products that consumers taste, smell, or feel in fine fragrances and cosmetics, detergents and household goods, and food and beverages. Our approximately 7,300 team members globally (including our recent acquisition of Fragrance Resources) take advantage of our capabilities in consumer insights, research and product development (“R&D”), creative expertise and customer intimacy to partner with our customers in developing innovative and differentiated offerings for consumers. We believe that this collaborative approach will generate market share gains for our customers.
Leveraging our international footprint, including 42 manufacturing facilities (of which 11 were acquired since 2014) and 70 creative centers and application laboratories (of which 14 were acquired since 2014) located in 35 different countries, we collaborate with our customers to develop over 35,000 products that we provide to our customers in approximately 160 countries. We believe we are well-positioned to serve both our global customers and the increasing number of regional and specialty consumer goods producers.
We principally compete in the flavors and fragrances market, which is part of a larger market that supplies a wide variety of ingredients and compounds used in consumer products. The broader market includes large multi-national companies and smaller regional and local participants that supply products such as seasonings, texturizers, spices, enzymes, certain food-related commodities, fortified products and cosmetic ingredients. The global market for flavors and fragrances has expanded consistently, primarily as a result of an increase in demand for, and an increase in the variety of, consumer products containing flavors and fragrances. In 2016, the flavors, fragrances and cosmetic actives and functional ingredients market, in which we compete, was estimated by management to be approximately $20.0 billion, and is forecasted to grow approximately 2-3% by 2020, primarily driven by expected growth in emerging markets.
In 2016, we achieved sales of approximately $3.1 billion, making us one of the top four companies in the global flavors and fragrances sub-segment of the broader consumer products ingredients and compounds market. Within the flavors and fragrances sub-segment of this broader market, the top four companies represent approximately two-thirds of the total estimated sales. We believe that our diversified business platform, expansive geographic coverage, broad product portfolio and global and regional customer base, positions us to achieve long-term growth as the flavors and fragrances markets expand.
We operate in two business segments, Flavors and Fragrances. In 2016, our Flavors business represented 48% of our sales, while our Fragrances business represented 52% of sales. Our business is geographically diverse, with sales to customers in the four regions set forth below:
Region | % of 2016 Sales | |
Europe, Africa, Middle East | 31 | % |
Greater Asia | 28 | % |
North America | 25 | % |
Latin America | 16 | % |
We are committed to winning in emerging markets. We believe that more significant future growth potential for the flavors and fragrances industry, and for our business, exists in the emerging markets (all markets except North America, Japan, Australia, and Western, Southern and Northern Europe). Over the past five years our currency neutral sales growth rate in emerging markets has outpaced that of developed markets. We expect this long-term trend to continue for the foreseeable future.
We have had operations in some of the largest emerging markets for multiple decades. As a result of these established operations, sales in emerging markets represented 51% of 2016 and 2015 sales. As our customers seek to grow their businesses in emerging markets, they will have the ability to leverage our long-standing presence and our extensive market knowledge to help drive their brands in these markets. During 2016, our 25 largest customers accounted for 52% of our sales. Sales to our largest customer accounted for 12% of our sales for each of the last three fiscal years. These sales were
3
principally in our Fragrances business.
For financial information about our operating segments and the geographic areas in which we do business, please see Note 13 of our Consolidated Financial Statements included in this Form 10-K.
Vision 2020 Strategy
During 2016, we continued to execute against the four pillars of our Vision 2020 strategy originally announced in 2015, which focuses on building differentiation and accelerating growth:
(1) | Innovating Firsts - We seek to strengthen our position and drive differentiation in priority R&D platforms. In 2016, we launched four captive fragrance molecules and four new flavor modulators. We also continued to see sales growth with respect to products using our encapsulation technology. |
(2) | Winning Where We Compete - Our ambition is to achieve a #1 or #2 market leadership position in key markets and categories and with specific customers. In 2016, we grew our sales in both our Flavors and Fragrances businesses in North America and the Middle East and Africa. |
(3) | Becoming Our Customers' Partner of Choice - Our goal is to attain commercial excellence by providing our customers with in-depth local consumer understanding, industry-leading innovation, outstanding service and the highest quality products. In 2016, we achieved “core list” status with two key customers and received awards for business excellence from several customers. In addition, we received several business excellence awards from top customers and were rated gold by EcoVadis for sustainability, ranked top supplier. |
(4) | Strengthening and Expanding the Portfolio - We actively pursue value-creation through partnerships, collaborations, and acquisitions within flavors, fragrances and adjacencies. We prioritize opportunities that provide (i) access to new technologies, (ii) the ability to increase our market share in key markets and with key customers or (iii) access to adjacent products or services that will position us to leverage our expertise in science and technology and our customer base. During 2016, we acquired David Michael to strengthen our share of the North American flavors business and announced our acquisition of Fragrance Resources, which was completed in January 2017. We expect these acquisitions to strengthen our market share position within the key markets of North America and Germany. |
Our Product Offerings
Flavors
Flavors are the key building blocks that impart taste experiences in food and beverage products and, as such, play a significant role in determining consumer preference for the end products in which they are used. As a leading creator of flavor compounds, we help our customers deliver on the promise of delicious and healthy foods and drinks that appeal to consumers. While we are a global leader, our Flavors business is more regional in nature, with different formulas that reflect local taste preferences. We create our flavors in our regional creative centers which allow us to satisfy local taste preferences, while also helping to ensure regulatory compliance and production standards. We develop thousands of different flavors and taste offerings for our customers, most of which are tailor-made. We continually develop new formulas in order to meet changing consumer preferences and customer needs.
Our Flavors compounds are ultimately used by our customers in the following four end-use categories of consumer goods: (1) Savory, for use in soups, sauces, condiments, prepared meals, meat and poultry, potato chips and other savory snacks; (2) Beverages, for use in juice drinks, carbonated beverages, flavored waters and spirits, (3) Sweet, for use in bakery products, candy, chewing gum and cereal and (4) Dairy, for use in all dairy products such as yogurt, ice cream and cheese and other products that have a creamy flavor. We also offer a wide range of quality vanilla extracts and a variety of flavor solutions that build on our understanding of vanilla.
We continue to build upon our strengths and to focus on addressing industry trends that will allow us to differentiate ourselves from our competitors and deliver accelerated growth consistent with our Vision 2020 strategy. These trends include:
• | Continued Consumer Demand for Fresh, Clean and Authentic Products. Consumers in developed markets increasingly want to make food choices that promote a healthy lifestyle and are moving towards products with “all natural” or healthier ingredients. In addition, consumers, non-governmental organizations and governmental agencies are seeking more transparency in product labeling. In response, many of our customers are announcing initiatives to provide |
4
“clean label” products (products that do not include any artificial ingredients). As a result of these trends, we believe our Vision 2020 strategy’s focus on innovation, including our modulation technology, delivery systems and our naturals and proprietary ingredients will help our customers address changing consumer demands.
• | Expansion of Consumer Food Companies. The number of participants in the food industry continues to expand, with mid-sized regional companies and companies focused on niche-product categories joining the traditional global companies to drive and accelerate product innovation. As a result, larger food and beverage companies are seeing slower growth than in previous years. We continue to look for innovative and value-creating methods for serving this growing customer base as evidenced by our recent acquisitions of Ottens Flavors and David Michael. We believe these acquisitions will permit us to further penetrate small and mid-sized customers, primarily in North America. |
Fragrances
We are a global leader in the creation of fragrance compounds that are integral elements in the world’s finest perfumes and best-known consumer products, within fabric care, home care, personal wash, hair care and toiletries. Our Fragrance business is a vertically integrated operation, originating with the development in our research laboratories of naturals, synthetic and proprietary molecules and innovative delivery systems, progressing to our manufacturing facilities that produce these ingredients in a consistent, high-quality and cost-effective manner and transitioning to our creative centers and application laboratories where our perfumers partner with our customers to create unique fragrance compounds for use in a variety of end-use products.
By providing our fragrance development teams with an extensive portfolio of innovative, high-quality and effective ingredients to support their creativity, we are able to provide our customers with a unique identity for their brands. These ingredients or fragrance compounds can then be combined with our innovative delivery systems, including our proprietary encapsulation technology, which consists of individual fragrance droplets coated with a protective polymetric shell to deliver superior fragrance performance throughout a product's lifecycle. These delivery systems are key differentiators in the growth of our consumer fragrance compounds.
Our Fragrances business derives revenue from two sources, Fragrance Compounds and Ingredients.
Fragrance Compounds. Fragrance Compounds are unique and proprietary combinations of multiple ingredients that are ultimately used by our customers in their consumer goods. Our creative and commercial teams within Fragrance Compounds are organized into two broad categories, Fine Fragrances and Consumer Fragrances.
◦ | Fine Fragrances - Fine Fragrances focuses on perfumes and colognes. IFF’s scientists and perfumers collaborate to develop new molecules, new natural extractions, and innovative processes that enliven perfumers' palettes and help them create unique, inspiring fragrances. We have created some of the industry-leading fine fragrance classics as well as cutting-edge niche fragrances, as evidenced by the number of top sellers. |
◦ | Consumer Fragrances - Our Consumer Fragrances include five end-use categories of products: |
▪ | Fabric Care - laundry detergents, fabric softeners and specialty laundry products; |
▪ | Home Care - household cleaners, dishwashing detergents and air fresheners; |
▪ | Personal Wash, including bar soap and shower gel; |
▪ | Hair Care; and |
▪ | Toiletries. |
Ingredients. Fragrance Ingredients consists of active and functional ingredients that are used internally and sold to third parties, including customers and competitors, for use in preparation of compounds. While the principal role of our Fragrance Ingredients facilities is to support our Fragrance Compounds business, we utilize our excess manufacturing capacity to manufacture and sell certain fragrance ingredients to third parties. We believe that this business allows us to leverage our fixed costs while maintaining the security of supply for our perfumers and ultimately our customers. Fragrance Ingredients available for sale to third parties include innovative ingredients that leverage our manufacturing experience as well as a limited amount of cost-competitive, commodity ingredients. As our Fragrance Compounds business grows, we expect that the percentage of capacity allocated to the production of Fragrance Ingredients for sale to third parties may decrease. Fragrance Ingredients also includes our cosmetic active and functional ingredients, which provide biologists and cosmetic chemists with innovative solutions to address cosmetic challenges such as skin aging and hair protection.
5
With approximately 1,300 separate fragrance and active and functional cosmetic ingredients (excluding our recent acquisition of Fragrance Resources), plus additional botanicals and delivery systems, we believe we are a leader in the industry with the breadth of our product portfolio.
Consistent with our Vision 2020 strategy, Fragrances continues to build upon our strengths to differentiate ourselves from our competitors, address evolving consumer demands and deliver accelerated growth. Specifically, we intend to focus on:
(1) Consumer Demand for Natural and Organic Products. Increased demand for natural ingredients is a primary driver of future growth in Fine Fragrances. We believe that our in-house naturals operations, led by Laboratoire Monique Rémy (“LMR”) in Grasse, France, are industry leading in the processing of quality materials and offer decades of experience understanding natural products and perfecting the process of transforming naturals, such as narcissus, jasmine and blackcurrant bud, into pure absolutes that retain the unique fragrance of their origin. Our objective is to expand our naturals capabilities by offering our clients naturals and proprietary ingredients.
(2) Transparency in Labeling. As consumers worldwide seek to require transparency in labeling, our customers will progressively seek to differentiate their products through proprietary molecules. A major emphasis of our research program is the creation of new proprietary molecules and ingredients.
(3) Delivery Systems. We continue to invest in our delivery system technologies, including expansion of our market-leading encapsulation technology, which we believe will allow us to differentiate our products and those of our customers. Our encapsulation technology extends, controls the release of and increases aromas in a variety of consumer products. We have expanded our portfolio to offer multi-functional delivery systems with cosmetic actives that work to enhance skin penetration, protect the active against interactions with other ingredients, provide long-lasting release, facilitate formulation of challenging ingredients and allow a better-targeted action.
Research and Product Development Process
Consumer Insights
We believe that the first step to creating a unique scent or taste experience begins with gaining insight into the consumer. By developing a deep understanding of what consumers value and prefer, we are better able to focus our R&D and creative efforts. Our quest to bring new, exciting, and winning ideas to our clients begins with insight into the consumer.
Our consumer insight and marketing teams work tirelessly interpreting trends, monitoring product launches, analyzing quantitative market data, and conducting several hundred thousand consumer interviews annually. Our sensory experts direct research programs exploring topics such as fragrance performance, the psychophysics of sensory perception (including chemesthetic properties such as warming, cooling, and tingling), the genetic basis for flavor and fragrance preference, and the effects of aromas on mood, performance, health, and well-being.
Based on this information, we develop innovative programs to evaluate potential products that enable us to understand the emotional connections between a prospective product and the consumer. We believe this ability to pinpoint the likelihood of a product’s success translates into stronger brand equity, resulting in increased returns and greater market share gains for our customers as well as IFF.
Research and Development
We consider our R&D infrastructure to be one of our key competencies and we focus and invest substantial resources in the research and development of new and innovative compounds, formulas and technologies and the application of these to our customers’ products. We spend approximately 8% of our sales on the research, development and implementation of new molecules, compounds and technologies that help our customers respond to changing consumer preferences. Using the knowledge gained from our Consumer Insights program, we strategically focus our resources around key R&D platforms that address consumer needs or preferences, or anticipate future preferences. By aligning our resources around these platforms, we ensure the proper support and focus for each program so that it can be further developed and eventually accepted for commercial application. As a result of this investment, we have been granted 315 patents in the United States since 2000, including 9 in 2016, and we have developed many unique molecules and delivery systems for our customers that are used as the foundations of successful flavors and fragrances around the world.
We principally conduct our R&D activities in Union Beach, New Jersey, where we employ scientists and application engineers who collaborate with our five other R&D centers around the world, to support the:
◦ | discovery of new materials; |
6
◦ | development of new technologies, such as delivery systems; |
◦ | creation of new compounds; and |
◦ | enhancement of existing ingredients and compounds. |
As of December 31, 2016, we employed about 1,500 people globally in R&D activities. We spent $254.3 million, $246.1 million and $253.6 million, or approximately 8.2%, 8.1% and 8.2% of sales in 2016, 2015 and 2014, respectively, on R&D activities.
Our ingredients research program discovers molecules found in natural substances and creates new molecules that are subsequently tested for their sensorial value. To broaden our offerings of natural, innovative and unique products, we seek collaborations with research institutions and other companies throughout the world. We have established a number of such collaborations to strengthen our innovation pipeline. We may also consider acquiring companies that could provide access to new technologies, consistent with our Vision 2020 strategy.
The development of new and customized flavor and fragrance compounds is a complex process calling upon the combined knowledge of our scientists, flavorists and perfumers. Scientists from various disciplines work in project teams with flavorists and perfumers to develop flavor and fragrance compounds with consumer preferred performance characteristics. The development of new flavor and fragrance compounds requires (i) an in-depth knowledge of the flavor and fragrance characteristics of the various ingredients we use, (ii) an understanding of how the many ingredients in a consumer product interact and (iii) the creation of controlled release and delivery systems to enhance flavor and fragrance performance. To facilitate this process, we have a scientific advisory board comprised of five leading scientists that provide external perspectives and independent feedback on our R&D initiatives.
Creative Application
We also have a network of 70 creative centers and application laboratories (including 14 acquired since 2014) around the world where we create or adapt the basic flavors or fragrances that we have developed in the R&D process to commercialize for use in our customers’ consumer products. Our global creative teams consist of perfumers, fragrance evaluators and flavorists, as well as marketing, consumer insights and technical application experts, from a wide range of cultures and nationalities. In close partnership with our customers’ product development groups, our creative teams create the sensorial experiences that our customers are seeking in order to satisfy consumer demands in each of their markets.
Development of new flavors and fragrances is driven by a variety of sources including requests from our customers, who are in need of a specific flavor or fragrance for use in a new or modified consumer product, or as a result of internal initiatives stemming from our Consumer Insights program. Our product development team works in partnership with our scientists and researchers to optimize the consumer appeal of the flavor or fragrance. A collaborative process between our researchers, our product development team and our customers then follows to perfect the flavor or fragrance so that it is ready to be included in the final consumer product.
In addition to creating new flavors and fragrances, our researchers and product development teams advise customers on ways to improve their existing products by adjusting or substituting current ingredients with more readily accessible or less expensive materials or by modifying the current ingredients to produce an enhanced yield. This often results in creating a better value proposition for our customers.
Our flavor and fragrance compound formulas are treated as trade secrets and remain our proprietary asset. Our business is not materially dependent upon any individual patent, trademark or license.
Supply Chain
We strive to provide our customers with consistent quality products on a timely and cost-effective basis by managing all aspects of the supply chain, from raw material sourcing through manufacturing, quality assurance, regulatory compliance and distribution.
Procurement
We use both natural and synthetic ingredients in our compounds. We purchase approximately 9,000 different raw materials from about 2,500 domestic and international suppliers and distributors (excluding our recent acquisitions of David Michael and Fragrance Resources). Approximately half of the materials we purchase are naturals or crop-related items and the other half are synthetics and chemicals. Natural ingredients are derived from flowers, fruits and other botanical products as well as from animal products. They contain varying numbers of organic chemicals that are responsible for the fragrance or flavor of the natural product. Natural products are purchased in processed or semi-processed form. Some are used in
7
compounds in the state in which they are purchased and others are used after further processing. Natural products, together with various chemicals, are also used as raw materials for the manufacture of synthetic ingredients by chemical processes. Our flavor products also include extracts and seasonings derived from various fruits, vegetables, nuts, herbs and spices as well as microbiologically-derived ingredients. We manufacture most of our synthetic ingredients for use in our fragrance compounds as well as for sale to others.
In order to ensure our supply of raw materials, achieve favorable pricing and provide timely transparency regarding inflationary trends to our customers, we continue to be focused on (i) implementing a forward-buy strategy, (ii) entering into supplier relationships to gain access to supplies that we do not have, (iii) implementing indexed pricing, (iv) reducing the complexity of our formulations and (v) evaluating whether it is more profitable to buy or make an ingredient. We are also concentrating on local country sourcing with our own procurement professionals.
Manufacturing and Distribution
We have 42 manufacturing sites (including 11 acquired since 2014) around the world that support more than 35,000 products. Our major manufacturing facilities are located in the United States, the Netherlands, Spain, Great Britain, Indonesia, Turkey, Brazil, Mexico, China, India, and Singapore. Our supply chain initiatives in developing markets are focused on increasing capacity and investments in key technologies. Within our more mature markets, we tend to focus on consolidation and cost optimization as well as implementing new technologies. In addition to our own manufacturing facilities, we develop relationships with third parties, including contract manufacturing organizations, that permit us to expand access to the technologies, capabilities and capacity that we need to better serve our customers.
Based on the regional nature of the Flavors business and the concerns regarding the transportability of raw materials, we have established smaller manufacturing facilities in our local markets that are focused on local needs. Products within the Fragrances business are typically composed of compounds that are more stable and more transportable around the world. Consequently, we have fewer manufacturing facilities within our Fragrances business, which produce compounds and ingredients for global distribution.
In 2016, we continued to invest in our facilities. We completed construction of a new manufacturing facility in Jakarta, Indonesia. In addition to a new capital project to construct a second Flavors manufacturing facility in China, we also expect to complete relocation of a Fragrance Ingredients facility in China in the second half of 2017. We also continue to assess our existing footprint and manufacturing capabilities that serve the Indian and Mexican markets. In addition, we are evaluating a request to relocate a second Fragrance Ingredients plant in China.
Sustainability
As a leading global creator of flavors and fragrances for a wide variety of consumer products, sustainability has been an important part of how we do business. Our sustainability strategy is centered on three main aspects: Positive Principles, Regenerative Products and Sensational People.
• | Positive Principles - We seek to embed the principles of eliminating the concept of waste, using clean renewable energy, and celebrating diversity into our company and culture. |
• | Regenerative Products - We strive to intentionally design our products to continuously support well-being and have a positive contribution to society and the environment in a circular economy. |
• | Sensational People - We seek to engage our employees and stakeholders to make a positive difference in the world. |
In 2016, we released the first-ever Cradle to Cradle Certified fragrance, PuraVita, a proof of concept for an innovative approach to sustainable fragrance creation, and launched the flavor and fragrance industry’s first-ever on-site wind turbine at our Tilburg, Netherlands manufacturing facility. Also, we entered into Vetiver Together, a unique partnership to enhance the livelihoods of farmers in Haiti, while securing our supply chain. In addition, we were identified, for the second consecutive year, as a global leader for our actions and strategies regarding climate change and awarded a leadership position on the Climate “A” list by the CDP.
Governmental Regulation
We develop, produce and market our products in a number of jurisdictions throughout the world and are subject to federal, regional and local legislation and regulations in each of the various countries. Our flavor and many of our fragrance products are intended for the food, beverage and pharmaceutical industries, which are subject to strict quality and regulatory standards. As a result, we are required to meet these strict standards which, in recent years, have become increasingly
8
stringent.
Our products and operations are subject to regulation by governmental agencies in each of the markets in which we operate. These agencies include (1) the Food and Drug Administration and equivalent international agencies that regulate flavors and other ingredients in consumer products, (2) the Environmental Protection Agency and equivalent international agencies that regulate our manufacturing facilities, (3) the Occupational Safety and Health Administration and equivalent international agencies that regulate the working conditions in our manufacturing, research laboratories and creative centers, (4) local and international agencies that regulate trade and customs, (5) the Drug Enforcement Administration and other local or international agencies that regulate controlled chemicals that we use in our operations and (6) the Chemical Registration/Notification authorities that regulate chemicals that we use in, or transport to, the various countries in which we manufacture and/or market our products. We have seen an increase in registration and reporting requirements concerning the use of certain chemicals in a number of countries, such as Registration, Evaluation, Authorisation and Restriction of Chemicals ("REACH") regulations in the European Union.
In addition, we are subject to various rules relating to health, work safety and the environment at the local and international levels in the various countries in which we operate. Our manufacturing facilities throughout the world are subject to environmental standards relating to air emissions, sewage discharges, the use of hazardous materials, waste disposal practices and clean-up of existing environmental contamination. In recent years, there has been a significant increase in the stringency of environmental regulation and enforcement of environmental standards, and the costs of compliance have risen significantly, a trend we expect will continue in the future.
Competition
The flavors and fragrances market is part of a larger market which supplies a variety of ingredients and components that consumer products companies utilize in their products. The broader market includes large multi-national companies or smaller regional and local participants which supply products such as seasonings, texturizers, spices, enzymes, certain food-related commodities, fortified products and cosmetic ingredients.
The market for flavors and fragrances is highly competitive. Based on annual sales, our main competitors consist of (1) the three other large global flavor and fragrance manufacturers, Givaudan, Firmenich and Symrise, (2) mid-sized companies, (3) numerous local and regional manufacturers and (4) consumer product companies who may develop their own flavors or fragrances. We, together with the other top three companies, represent approximately two-thirds of the total estimated sales in the global flavors and fragrances sub-segment of the broader market.
We believe that our ability to compete successfully in the flavors and fragrances sub-market is based on (1) our understanding of consumers, (2) innovation, arising from the creative skills of our perfumers and flavorists and the technological advances resulting from our research and development activities, (3) our ability to create products which are tailor-made for our customers’ needs, (4) developing strong customer intimacy and (5) driving efficiency in all that we do.
Large multi-national customers and, increasingly, mid-sized customers, may limit the number of their suppliers by placing some on “core lists,” giving them priority for development and production of their new or modified products.
To compete more successfully in this environment, we must make continued investments in customer relationships and tailor our research and development efforts to anticipate customers’ needs, provide effective service and secure and maintain inclusion on certain “core lists.”
Employee Relations
At December 31, 2016, we had approximately 6,900 employees worldwide, of whom approximately 1,800 are employed in the United States. We believe that relations with our employees are good.
Availability of Reports
We make available free of charge on or through the Investor Relations link on our website, www.iff.com, all materials that we file electronically with the Securities and Exchange Commission (“SEC”), including our annual report on Form 10-K, quarterly reports on Form 10-Q, current reports on Form 8-K and amendments to those reports, filed or furnished pursuant to Section 13(a) or 15(d) of the Securities Exchange Act of 1934, as amended, as soon as reasonably practicable after electronically filing such materials with, or furnishing them to, the SEC. During the period covered by this Form 10-K, we made all such materials available through our website as soon as reasonably practicable after filing such materials with the SEC.
9
You may also read and copy any materials filed by us with the SEC at the SEC’s Public Reference Room at 100 F Street, N.E., Washington, D.C. 20549, and you may obtain information on the operation of the Public Reference Room by calling the SEC in the United States at 1-800-SEC-0330. In addition, the SEC maintains an Internet website, www.sec.gov, that contains reports, proxy and information statements and other information that we file electronically with the SEC.
A copy of our Corporate Governance Guidelines, Code of Business Conduct and Ethics, and the charters of the Audit Committee, Compensation Committee and Nominating and Governance Committee of the Board of Directors are posted on the Investor Relations section of our website, www.iff.com.
Our principal executive offices are located at 521 West 57th Street, New York, New York 10019 (212-765-5500).
Executive Officers of Registrant
The current executive officers of the Company, as of February 28, 2017, are listed below.
Andreas Fibig | 55 | Chairman of the Board and Chief Executive Officer |
Richard A. O'Leary | 56 | Executive Vice President and Chief Financial Officer |
Nicolas Mirzayantz | 54 | Group President, Fragrances |
Matthias Haeni | 51 | Group President, Flavors |
Gregory Yep | 52 | Executive Vice President, Chief Global Scientific & Sustainability Officer |
Susana Suarez-Gonzalez | 47 | Executive Vice President, Chief Human Resources Officer |
Anne Chwat | 57 | Executive Vice President, General Counsel and Corporate Secretary |
Francisco Fortanet | 48 | Executive Vice President, Operations |
Andreas Fibig has served as our Chairman since December 2014 and Chief Executive Officer since September 2014. Mr. Fibig has been a member of our Board of Directors since 2011. From 2008 to 2014, Mr. Fibig served as President and Chairman of the Board of Management of Bayer HealthCare Pharmaceuticals, the pharmaceutical division of Bayer AG. Prior to this position, Mr. Fibig held a number of positions of increasing responsibility at Pfizer Inc., a research-based pharmaceutical company, including as Senior Vice President in the US Pharmaceutical Operations group from 2007 through 2008 and as President, Latin America, Africa and Middle East from 2006 through 2007.
Richard A. O'Leary has served as our Executive Vice President and Chief Financial Officer since October 2016. Mr. O’Leary originally joined our Company in July 2007. Mr. O’Leary was our Senior Vice President, Controller and Chief Accounting Officer from July 2015 until his appointment as Chief Financial Officer, and served as our Vice President and Controller from May 2009 to November 2014. Mr. O’Leary served as our Interim Chief Financial Officer from November 2014 to July 2015 and from July 2008 to May 2009. Mr. O’Leary was Vice President, Corporate Development from July 2007 to May 2009. Prior to joining our Company, Mr. O’Leary served in various positions at International Paper Co., a paper and packaging company, which he originally joined in 1986, including, as Chief Financial Officer of International Paper Company (Brazil) from June 2004 to June 2007. Prior to International Paper, Mr. O’Leary was with Arthur Young & Co.
Nicolas Mirzayantz has served as our Group President, Fragrances since January 2007, and originally joined our Company in 1988. Prior to his appointment as Group President, Fragrances, he served as a member of our Temporary Office of the Chief Executive Officer from October 1, 2009 until February 2010, our Senior Vice President, Fine Fragrance and Beauty Care and Regional Manager North America, from March 2005 to December 2006, our Senior Vice President, Fine Fragrance and Beauty Care from October 2004 to February 2005, and our Vice President Global Fragrance Business Development from February 2002 to September 2004.
Matthias Haeni has served as our Group President, Flavors since April 2014. Mr. Haeni joined us in 2007 in the role of Regional General Manager, Flavors Greater Asia. In 2010, Mr. Haeni transferred to Hilversum, The Netherlands where he served as Regional General Manager for Flavors Europe, Africa, and the Middle East (EAME).
Gregory Yep has served as our Executive Vice President, Chief Global Scientific & Sustainability Officer since June 2016. Prior to joining our Company, Dr. Yep was Senior Vice President of Research, Development & Applications with The Kerry Group from January 2015 to June 2016, where he was responsible for creating strategy and implementation of technical platforms in the taste and nutrition, food and beverage and the biotechnology industry. Previously, he was Senior Vice President of R&D at PepsiCo from June 2009 to December 2015 and was Global Vice President, Application Technologies at Givaudan Flavors and Fragrances from December 2005 to June 2009. Earlier in his career, Dr. Yep was at McCormick & Company, where he held executive roles of increasing responsibility in food science. Dr. Yep holds a bachelor’s degree in
10
biology and chemistry from the University of Pennsylvania, and master’s degree and Ph.D. in organic chemistry from Johns Hopkins University.
Susana Suarez-Gonzalez has served as our Executive Vice President, Chief Human Resources Officer since November 2016. Prior to joining our Company, Ms. Gonzalez was Senior Vice President Global Operations, Human Resources of Fluor Corporation from July 1991 to November 2016, and was responsible for the global execution of HR services as well as all corporate HR functions, encompassing global benefits, compensation, talent development, recruiting and human resources information systems. Ms. Gonzalez was at Fluor for 25 years, where she held leadership positions across several business groups and functions including construction, marketing, sales, project engineering and human resources.
Anne Chwat has served as our Executive Vice President, General Counsel and Corporate Secretary since August 2015 and as our Senior Vice President, General Counsel and Corporate Secretary from April 2011 to August 2015. Prior to joining us, Ms. Chwat served as Executive Vice President and General Counsel of Burger King Holdings, Inc., a fast food hamburger restaurant company, from September 2004 to April 2011. From September 2000 to September 2004, Ms. Chwat served in various positions at BMG Music (now Sony Music Entertainment), including as Senior Vice President, General Counsel and Chief Ethics and Compliance Officer.
Francisco Fortanet has served as Executive Vice President, Operations since August 2015 and as Senior Vice President, Operations from February 27, 2012 to August 2015. Mr. Fortanet joined our Company in 1995, and has served as our Vice President, Global Manufacturing Compounding from January 2007 to February 2012, our Vice President, Global Manufacturing from January 2006 to January 2007, our Regional Director of North America Operations from December 2003 to January 2005, the Project Manager of a Special Project in IFF Ireland from May 2003 to December 2003 and as our Plant Manager in Hazlet, New Jersey from October 1999 to May 2003.
ITEM 1A. | RISK FACTORS. |
We routinely encounter and address risks in conducting our business. Some of these risks may cause our future results to be different - sometimes materially different - than we presently anticipate. Below are material risks we have identified that could adversely affect our business. How we react to material future developments, as well as how our competitors and customers react to those developments, could also affect our future results.
Our business is highly competitive, and if we are unable to compete effectively our sales and results of operations will suffer.
The market for flavors and fragrances is highly competitive. We face vigorous competition from companies throughout the world, including multi-national and specialized flavor, fragrance and cosmetic ingredients companies, as well as consumer product companies who may develop their own flavors, fragrances or cosmetic ingredients. In the flavors industry, we also face increasing competition from ingredient suppliers that have expanded their portfolios to include flavor offerings. Some of our competitors specialize in one or more of our product sub-segments, while others participate in many of our product sub-segments. In addition, some of our global competitors may have greater resources than we do or may have proprietary products that could permit them to respond to changing business and economic conditions more effectively than we can. Consolidation of our competitors may exacerbate these risks. With our recent entry into cosmetic ingredients, we may face greater competition-related risks in this market than with our core historic flavor and fragrances businesses.
Competition in our business is based on innovation, product quality, regulatory compliance, pricing, quality of customer service, the support provided by marketing and application groups, and understanding of consumers. It is difficult for us to predict the timing, scale and success of our competitors’ actions in these areas. The discovery and development of new flavors and fragrance compounds and ingredients, protection of the Company’s intellectual property and development and retention of key employees are important issues in our ability to compete in our business. Increased competition by existing or future competitors, including aggressive price competition, could result in the potential loss of substantial sales or create the need for us to reduce prices or increase spending and this could have an adverse impact on sales and profitability.
During 2016, our 25 largest customers accounted for 52% of our sales, and sales to our largest customer accounted for 12% of our sales in each of the last three fiscal years. Disruption of sales to this customer or any of our other large customers for an extended period of time could adversely affect our business or financial results.
Large multi-national customers, and increasingly, mid-sized customers are unilaterally limiting the number of their suppliers or rationalizing the number of products that they offer to increase their margins and profitability. As part of these initiatives, these
11
customers are creating “core lists” of suppliers and giving these “core lists” suppliers priority for new or modified products. Recently, these customers are making inclusion on their “core lists” contingent upon a supplier providing more favorable commercial terms which may adversely affect our margins. These, and other profitability initiatives being pursued by our customers, reduce the market opportunity for which we compete and subject the volume and pricing of the remaining suppliers to downward pressure. To compete more successfully in this environment, we must continue to make investments in customer relationships and tailor product research and development in order to anticipate customers’ needs, deliver supplies that contribute to our customers’ profitability, provide effective customer service and offer competitive cost-in-use solutions to secure and maintain inclusion on certain “core lists” and our share of our customers’ purchases. If we are unable to do so, it could adversely impact our future results of operations.
We may not be able to successfully identify and complete sufficient acquisitions to meet our Vision 2020 strategy, and even if we are able to do so, we may not realize the anticipated benefits of these acquisitions.
As part of our Vision 2020 strategy, we intend to add between $500 million and $1.0 billion of sales growth through acquisitions within the flavors and fragrances industries and adjacencies. During 2015, we completed two acquisitions which align with this strategic objective, acquiring Ottens Flavors, a flavor supplier and developer, and Lucas Meyer Cosmetics, a developer, manufacturer and marketer of cosmetic active and functional ingredients. In 2016, we acquired David Michael, a privately-held flavors company, and announced our acquisition of Fragrance Resources, a privately-held fragrance company.
Identifying suitable acquisition candidates can be difficult, time-consuming and costly, and we may not be able to identify suitable candidates or complete acquisitions in a timely manner, on a cost-effective basis or at all.
Even if we complete an acquisition, we may not realize the anticipated benefits of such acquisition. Our recent acquisitions have required, and any similar future transactions may also require, significant efforts and expenditures, including with respect to integrating the acquired business with our historical business. We may encounter unexpected difficulties, or incur unexpected costs, in connection with acquisition activities and integration efforts, which include:
• | diversion of management attention from managing our historical core business; |
• | potential disruption of our historical core business or of the acquired business; |
• | the strain on, and need to continue to expand, our existing operational, technical, financial and administrative infrastructure; |
• | challenges related to the lack of experience in operating in the geographical or product markets of the acquired business; |
• | challenges in controlling additional costs and expenses in connection with and as a result of the acquisition; |
• | difficulties in assimilating employees and corporate cultures or in integrating systems and controls; |
• | difficulties in anticipating and responding to actions that may be taken by competitors; |
• | difficulties in realizing the anticipated benefits of the transaction; |
• | potential loss of key employees, key customers, suppliers or other partners of the acquired business; and |
• | the assumption of and exposure to unknown or contingent liabilities of acquired businesses. |
If any of our acquisitions do not perform as anticipated for any of the reasons noted above or otherwise, there could be a negative impact on our results of operations and financial condition.
The interruption or failure of key information technology systems or a loss of data, malicious attack or other breach of security of our information technology systems, may have a material adverse effect on our ability to conduct our business, subject us to increased operating costs, damage our reputation and expose us to litigation.
We rely on information technology systems, including some managed by third-party providers, to conduct business and support our business processes, including product formulas, product development, sales, order processing, production, distribution, internal communications and communications with third parties throughout the world, processing transactions, summarizing
12
and reporting results of operations, complying with regulatory, tax or legal requirements, and collecting and storing customer, supplier, employee and other stakeholder information. These systems may be susceptible to disruptions or outages due to fire, floods, power loss, telecommunications failures, natural disasters, cyber attacks, failed upgrades or other similar events, or due to the poor performance of third-party providers. Effective response to such disruptions will require effort and diligence on the part of our employees and third-party providers to avoid any adverse impact to our business. In addition, our systems and proprietary data stored electronically may be vulnerable to computer viruses, cybercrime, computer hacking and similar information security breaches, which in turn could result in the unauthorized release or misuse of confidential or proprietary information about our business (including, but not limited to, the trade secrets upon which we rely to protect our proprietary fragrance and flavor formulations), employees, or customers, and disrupt our operations. Depending on their nature and scope, these threats could potentially lead to improper use of our systems and networks, manipulation and destruction of data or product non-compliance. The occurrence of any of these events could have a material adverse effect on our sales, subject us to increased operating costs, damage our reputation and expose us to litigation or regulatory proceedings.
The industries in which our Flavors customers operate are expanding and becoming increasingly decentralized, and if we and/or our customers are unable to adjust, our operating results and future growth may be adversely affected.
Our customers include large food and beverage companies, which operate in highly competitive industries and rely on continued consumer demand for their products. In recent years many of our customers have faced growing competition from mid-size regional companies and companies focused on niche-product categories driving and accelerating product innovation. Consequently, the food and beverage industry is expanding and becoming increasingly decentralized. If our customers fail to adequately address the challenges pertaining to this expansion and decentralization of business, it may adversely affect their operations or financial performance, and could have a corresponding material adverse effect on our Flavors business. If our global customers’ market shares continue to erode and we are unable to gain market share with small and mid-sized customers in this evolved environment, our operating results and future growth could be adversely affected.
We may not successfully develop and introduce new products that meet our customers’ needs, which may adversely affect our results of operations.
Our ability to differentiate ourselves and deliver growth in line with our Vision 2020 strategy largely depends on our ability to successfully develop and introduce new products and product improvements that meet our customers’ needs, and ultimately appeal to consumers. Innovation is a key element of our ability to develop and introduce new products. We cannot be certain that we will be successful in achieving our innovation goals, such as the development of new molecules, new and expanded delivery systems and other technologies. We currently spend approximately 8% of our sales on research and development; however, such investments may only generate future revenues to the extent that we are able to develop products that meet our customers’ specifications, can be delivered at an acceptable cost and are accepted by the targeted consumer market. Furthermore, there may be significant lag times from the time we incur R&D costs to the time that these R&D costs may result in increased revenue. Consequently, even when we “win” a project, our ability to generate revenues as a result of these investments is subject to numerous customer, economic and other risks that are outside of our control, including delays by our customers in the launch of a new product, the level of promotional support for the launch, poor performance of our third-party vendors, anticipated sales by our customers not being realized or changes in market preferences or demands, or disruptive innovations by competitors.
Increasing awareness of health and wellness are driving changes in the consumer products industry, and if we are unable to react in a timely and cost-effective manner, our results of operations and future growth may be adversely affected.
We must continually anticipate and react, in a timely and cost-effective manner, to changes in consumer preferences and demands, including changes in demand driven by increasing awareness of health and wellness and demands for transparency with respect to product ingredients. Consumers, especially in developed economies such as the United States and Western Europe, are shifting away from products containing artificial ingredients to “all natural,” healthier alternatives. In addition, there has been a growing demand by consumers, non-governmental organizations and, to a lesser extent, governmental agencies to provide more transparency in product labeling and our customers have been taking steps to address this demand, including by voluntarily providing product-specific ingredients disclosure. These two trends could affect the types and volumes of our flavors and fragrances that our customers include in their product offerings. If we are unable to react to or anticipate these trends in a timely and cost-effective manner, our results of operations and future growth may be adversely affected.
13
We may not succeed in establishing and maintaining collaborations, joint ventures or partnerships, and such arrangements may not lead to development or commercialization of products, which may limit our ability to execute our Vision 2020 strategy and adversely affect our future growth.
From time to time and in line with our Vision 2020 strategy, we may evaluate and enter into collaborations, joint ventures or partnerships to enhance our research and development efforts. Our ability to generate revenues from such collaborations will depend on our partners’ abilities and efforts to successfully perform the functions assigned to them in these arrangements. The process of establishing and maintaining collaborative relationships is difficult, time-consuming to negotiate, document and implement. We may not be successful in our efforts to establish and implement collaborations or other alternative arrangements should we choose to enter into such arrangements, and the terms of the arrangements may not be favorable to us. Additionally, collaborations may not lead to development or commercialization of products in the most efficient manner, or at all. If we are unable to establish and maintain collaborative relationships on acceptable terms or to successfully transition terminated collaborative agreements, it could limit our ability to execute our Vision 2020 strategy and adversely affect our future growth.
We have made investments in and continue to expand our business into emerging markets, which exposes us to certain risks.
As part of our growth strategy, we have increased our presence in emerging markets by expanding our manufacturing presence, sales organization and product offerings in these markets, and we expect to continue to expand our business in these markets. In addition to the currency and international operation risks described below, our operations in these markets may be subject to a variety of other risks. Emerging markets typically have a consumer base with limited or fluctuating disposable income and customer demand in these markets may fluctuate accordingly. As a result, decrease in customer demand in emerging markets may have an adverse effect on our ability to execute our growth strategy. In addition, emerging markets may have weak legal systems which may affect our ability to enforce our intellectual property and contractual rights, exchange controls, unstable governments and privatization or other government actions that may affect taxes, subsidies and incentive programs and the flow of goods and currency. In conducting our business, we move products from one country to another and may provide services in one country from a subsidiary located in another country. Accordingly, we are vulnerable to abrupt changes in customs and tax regimes that may have significant negative impacts on our financial condition and operating results.
The impact of currency fluctuation or devaluation in the international markets in which we operate may negatively affect our results of operations.
We have significant operations outside the United States, the results of which are reported in the local currency and then translated into United States dollars at applicable exchange rates for inclusion in our consolidated financial statements. The exchange rates between these currencies and the United States dollar have fluctuated and will continue to do so in the future. Changes in exchange rates between these local currencies and the United States dollar will affect the recorded levels of sales, profitability, assets and/or liabilities. For example, the weakening of the Euro and several emerging market currencies in 2016 resulted in approximately $14 million impact on operating profit versus 2015. Additionally, volatility in currency exchange rates may adversely impact our financial condition, cash flows or liquidity. Although we employ a variety of techniques to mitigate the impact of exchange rate fluctuations, including sourcing strategies and a limited number of foreign currency hedging activities, we cannot guarantee that such hedging and risk management strategies will be effective, and our results of operations could be adversely affected.
Our international operations are subject to regulatory, political and other risks that could materially and adversely affect our revenues, cash flows or financial position.
We operate on a global basis, with manufacturing and sales facilities in the United States, Europe, Africa, the Middle East, Latin America, and Greater Asia. During 2016, 76% of our net sales were to customers outside the United States and we intend to continue expansion of our international operations. As a result, our business is increasingly exposed to risks inherent in international operations. These risks, which can vary substantially by location, include the following:
• | governmental laws, regulations and policies adopted to manage national economic and macroeconomic conditions, such as increases in taxes, austerity measures that may impact consumer spending, monetary policies that may impact inflation rates, currency fluctuations and sustainability of resources; |
• | changes in environmental, health and safety regulations, such as the continued implementation of the European Union’s REACH regulations, and the burdens and costs of our compliance with such regulations; |
14
• | the imposition of or changes in tariffs, quotas, trade barriers, other trade protection measures and import or export licensing requirements, by the United States or other Countries, which could adversely affect our cost or ability to import raw materials or export our flavors or fragrances to surrounding markets; |
• | risks and costs arising from language and cultural differences; |
• | changes in the laws and policies that govern foreign investment in the countries in which we operate, including the risk of expropriation or nationalization, and the costs and ability to repatriate the profit that we generate in these countries; |
• | risks and costs associated with political and economic instability, bribery and corruption, and social and ethnic unrest in the countries in which we operate; |
• | difficulty in recruiting and retaining trained local personnel; |
• | natural disasters, pandemics or international conflicts, including terrorist acts, or national and regional labor strikes in the countries in which we operate, which could interrupt our operations or endanger our personnel; or |
• | the risks of operating in developing or emerging markets in which there are significant uncertainties regarding the interpretation, application and enforceability of laws and regulations and the enforceability of contract rights and intellectual property rights. |
The occurrence of any one or more of these factors could increase our costs and adversely affect our results of operations.
Volatility and challenging economic conditions may adversely affect demand for consumer products using flavors and fragrances and this may have a negative impact on our operating results and future growth.
Our flavors and fragrance compounds and ingredients are components of a wide assortment of global consumer products throughout the world. Historically, demand for consumer products using flavors and fragrances was stimulated and broadened by changing social habits and consumer needs, population growth, an expanding global middle-class and general economic growth, especially in emerging markets. The global economy has experienced significant recessionary pressures and declines in consumer confidence and economic growth. While some segments of the global economy appear to be recovering, the ongoing global recessionary economic environment in Europe has, and may in the near future, increase unemployment and underemployment, decrease salaries and wage rates, increase inflation or result in other market-wide cost pressures that will adversely affect demand for consumer products in both developed and emerging markets.
In addition, growth rates in the emerging markets have moderated from previous levels. Reduced consumer spending may cause changes in our customer orders including reduced demand for our flavors and fragrances, or order cancellations. For example, recent challenging economic conditions in China and Latin America, which culminated in the weakening of the Chinese yuan, Brazilian real and Argentinian peso, have undermined consumer confidence and resulted in our customers throughout the emerging markets taking a more cautious approach to managing their inventory.
The timing of placing of orders and the amounts of these orders are generally at our customers' discretion. Customers may cancel, reduce or postpone orders with us on relatively short notice. Significant cancellations, reductions or delays in orders by customers could affect our quarterly results.
It is currently anticipated that these challenging economic conditions will continue during 2017. To the extent that the volatility in global economic conditions continues, our sales, profitability and overall operating results could be adversely affected.
Our success depends on attracting and retaining talented people within our business. Significant shortfalls in recruitment or retention could adversely affect our ability to compete and achieve our strategic goals.
Attracting, developing, and retaining talented employees, including our perfumers and flavorists, is essential to the successful delivery of our products and success in the marketplace. Competition for these employees can be intense. The ability to attract and retain talented employees is critical in the development of new products and technologies which is an integral component of our growth strategy. However, we may not be able to attract and retain such employees in the future. If we experience significant shortfalls in recruitment or retention, our ability to effectively compete with our competitors and to grow our business could be adversely affected.
15
Failure to comply with environmental protection laws may cause us to close, relocate or operate one or more of our plants at reduced production levels, which could adversely affect our operating results and future growth.
Our business operations and properties are subject to extensive and increasingly stringent federal, state, local and foreign laws and regulations pertaining to protection of the environment, including air emissions, sewage discharges, the use of hazardous materials, waste disposal practices and clean-up of existing environmental contamination. Failure to comply with these laws and regulations or any future changes to them may result in significant consequences to us, including the need to close or relocate one or more of our production facilities, administrative, civil and criminal penalties, liability for damages and negative publicity. If we are unable to meet production requirements, we can lose customer orders, which can adversely affect our future growth or we may be required to make incremental capital investments to ensure supply. For example, in 2015 Chinese authorities notified us of compliance issues pertaining to the emission of odors from several of our plants in China and, consequently, we invested approximately $6.5 million in odor-abatement equipment at these facilities and have located a site for construction of a second flavors manufacturing facility in China, with an estimated cost of $45 million. We are also in discussions with the Chinese government concerning the relocation of a second Ingredients plan in China. Such idling of facilities or production modifications has caused or may cause customers to seek alternate suppliers due to concerns regarding supply interruptions and these customers may not return or may order at reduced levels even once issues are remediated. If these non-compliance issues reoccur in China or occur or in any other jurisdiction, we may lose business and may be required to incur capital spending above previous expectations, close a plant, or operate a plant at significantly reduced production levels on a permanent basis, and our operating results and cash flows from operations may be adversely affected.
Our ongoing optimization of our manufacturing facilities may not be as effective as we anticipate, and we may fail to realize the expected cost savings and increased efficiencies.
As part of our strategy, we seek to enhance our manufacturing efficiency and align our geographic manufacturing footprint with our expectations of future growth and technology needs. Many of our facilities are located in close proximity to our customers in order to minimize both our customers’ and our own costs. However, we may not have sufficient demand to utilize all of our production capacity and may be required to ship excess products to other regions in which we operate, which will increase our costs and decrease our margins. To operate more efficiently and control costs, from time to time we also execute rationalization activities, which include manufacturing facility consolidations. For example, we are in the midst of relocating our Ingredients facility in Hangzhou, China, constructing a new facility in Indonesia and expect to begin relocating a second Ingredients facility in China. We have also initiated a study regarding our existing footprint and manufacturing capabilities that serve the Indian market. The spending associated with these projects may result in capital spending above previous expectations. Our ability to realize anticipated cost savings, synergies and revenue enhancements from these activities may be affected by a number of factors and may pose significant risks, including:
• | the risk that we may be unable to integrate successfully the relocated manufacturing operations; |
• | the risk that we may be unable to effectively reduce overhead, coordinate management and integrate and retain employees of the relocated manufacturing operations; |
• | the risk that we may face difficulties in implementing and maintaining consistent standards, controls, procedures, policies and information systems; |
• | potential strains on our personnel, systems and resources and diversion of attention from other priorities; and |
• | unforeseen or contingent liabilities of the relocated manufacturing operations. |
Furthermore, our rationalization and consolidation actions may not be as effective as we anticipate, and we may fail to realize the cost savings we expect from these actions. Actual charges, costs and adjustments due to these activities may vary materially from our estimates, and these activities may require cash and non-cash integration and implementation costs or charges in excess of budgeted amounts, which could offset any such savings and other synergies and therefore could have an adverse effect on our margins.
Volatility and increases in the price of raw materials, energy and transportation could harm our profits.
We use many different raw materials for our business, including essential oils, extracts and concentrates derived from fruits, vegetables, flowers, woods and other botanicals, animal products, raw fruits, organic chemicals and petroleum-based chemicals. Historically, we have experienced a considerable amount of price volatility in natural products that represent approximately half of our raw material purchases, and in 2016 we experienced increases in the prices of certain naturals,
16
including citrus and vanilla. Availability and pricing of these natural products can be impacted by crop size and quality, weather, alternative land use, and other factors which we cannot control.
If we are unable to increase the prices to our customers of our fragrance or flavor products to offset raw material and other input cost increases, or if we are unable to achieve cost savings to offset such cost increases, we could fail to meet our cost expectations and our profits and operating results could be adversely affected. Increases in prices of our products to customers may lead to declines in volume, and we may not be able to accurately predict the volume impact of price increases, which could adversely affect our financial condition and results of operations.
Similarly, commodities and energy prices are subject to significant volatility caused by market fluctuations, supply and demand, currency fluctuations, production and transportation disruptions, and other world events. As we source many of our raw materials globally to help ensure quality control, if the cost of energy, shipping or transportation increases and we are unable to pass along these costs to our customers, our profit margins would be adversely affected. Furthermore, increasing our prices to our customers could result in long-term sales declines or loss of market share if our customers find alternative suppliers or choose to reformulate their consumer products to use fewer ingredients, which could have an adverse long-term impact on our results of operations.
To mitigate our sourcing risk, we maintain strategic stock levels for critical items. However, if we do not accurately estimate the amount of raw materials that will be used for the geographic region in which we will need these materials, our margins could be adversely affected.
Our reliance on a limited base of suppliers may result in a disruption to our business and may adversely affect our financial results.
For certain raw materials, we rely on a limited number of suppliers and we may not have readily available alternatives. If we are unable to maintain our supplier arrangements and relationships and are unable to obtain the quantity, quality and price levels needed for our business, or if any of our key suppliers becomes insolvent or experiences other financial distress, or if we are unable to identify new suppliers in response to any of these events, we could experience disruptions in production and our financial results could be adversely affected.
If we are unable to maintain the integrity of our raw materials, supply chain and finished goods, or fail to comply with applicable regulations, it may result in regulatory non-compliance, litigation costs, customer loss and harm to our reputation, all of which may adversely impact sales and our results of operations.
The development, manufacture and sale of our products are subject to various regulatory requirements in each of the countries in which our products are developed, manufactured and sold. In addition, we are subject to product safety and compliance requirements established by the industry or similar oversight bodies. We use a variety of strategies, methodologies and tools to (i) identify current product standards, (ii) assess relative risks in our supply chain that can impact product integrity, (iii) monitor internal and external performance and (iv) test raw materials and finished goods to minimize the likelihood of product or process non-compliance.
Gaps in our operational processes could adversely affect the quality of our finished products and result in a regulatory non-compliance event. If a product non-compliance event were to go undetected, it could subject us to customer claims, recalls, penalties, litigation costs and settlements, remediation costs or loss of sales. As our flavors and fragrance compounds and ingredients are used in many products intended for human use or consumption, these consequences would be exacerbated if we or our customer did not identify the defect before the product reaches the consumer and there was a resulting impact at the consumer level. Such a result could lead to potentially large scale adverse publicity, negative effects on consumer's health, recalls and potential consumer litigation. In addition, if we do not have adequate insurance or contractual indemnification from suppliers or other third parties, or if insurance or indemnification is not available, the liability relating to product or possible third-party claims arising from defective products could adversely affect our business, financial condition or results of operations. Furthermore, adverse publicity about our products, or our customers' products that contain our ingredients, including concerns about product safety or similar issues, whether real or perceived, could harm our reputation and result in an immediate adverse effect on our sales and customer relationships, as well as require us to utilize significant resources to rebuild our reputation.
A disruption in our operations or our supply chain could adversely affect our business and financial results.
As a company engaged in research and development, manufacturing and distribution on a global scale, we are subject to the risks inherent in such activities, including industrial accidents, environmental events, strikes and other labor disputes,
17
disruptions in supply chain or information systems, disruption or loss of key research or manufacturing sites, product quality control, safety, licensing requirements and other regulatory issues, as well as natural disasters, international conflicts, terrorist acts and other external factors over which we have no control. While we have research and development and manufacturing facilities throughout the world, many of these facilities are extremely specialized and certain of our facilities are the sole source of a specific ingredient or product. If our research and development activities or the manufacturing of ingredients or products were disrupted, the cost of relocating or replacing these activities or reformulating these ingredients or products may be substantial, which could result in production or development delays or otherwise have an adverse effect on our margins, operating results and future growth.
Our performance may be adversely impacted if we are not successful in managing our inventory and/or working capital balances.
We evaluate our inventory balances of materials based on shelf life, expected sourcing levels, known uses and anticipated demand based on forecasted customer order activity and changes in our product/sales mix. Efficient inventory management is a key component of our business success, financial returns and profitability. To be successful, we must maintain sufficient inventory levels and an appropriate product/sales mix to meet our customers’ demands, without allowing those levels to increase to such an extent that the costs associated with storing and holding other inventory adversely impact our financial results. If our buying decisions do not accurately predict sourcing levels, customer trends or our expectations about customer needs are inaccurate, we may have to take unanticipated markdowns or impairment charges to dispose of the excess or obsolete inventory, which can adversely impact our financial results. Additionally, we believe excess inventory levels of raw materials with a short shelf life in our manufacturing facilities subjects us to the risk of increased inventory shrinkage. If we are not successful in managing our inventory balances and shrinkage, our results of and cash flows from operations may be negatively affected.
We sell certain accounts receivable on a non-recourse basis to unrelated financial institutions under “factoring” agreements that are sponsored, solely and individually, by certain customers. The cost of participating in these programs was immaterial to our results in all periods. Should we choose not to participate, or if these programs were no longer available, it could reduce our cash flows from operations in the period in which the arrangement ends.
We could be adversely affected by violations of the U.S. Foreign Corrupt Practices Act or similar U.S. or foreign anti-bribery and anti-corruption laws and regulations in the jurisdictions in which we operate.
The global nature of our business, the significance of our international revenue and our focus on emerging markets create various domestic and local regulatory challenges and subject us to risks associated with our international operations. The U.S. Foreign Corrupt Practices Act, or FCPA, and similar anti-bribery and anti-corruption laws and regulations in other countries generally prohibit companies and their intermediaries from making improper payments to foreign officials for the purpose of obtaining or keeping business or for other commercial advantage. In addition, U.S. public companies are required to maintain records that accurately and fairly represent their transactions and have an adequate system of internal accounting controls. Under the FCPA, U.S. companies may be held liable for the corrupt actions taken by directors, officers, employees, agents, or other strategic or local partners or representatives. As such, if we or our intermediaries fail to comply with the requirements of the FCPA or similar legislation, governmental authorities in the United States and elsewhere could seek to impose substantial civil and/or criminal fines and penalties which could have a material adverse effect on our business, reputation, operating results and financial condition.
We operate or may pursue opportunities in some jurisdictions, such as China, India, Brazil and Africa, which pose potentially elevated risks of fraud or corruption or increased risk of internal control issues. In certain jurisdictions, compliance with anti-bribery laws may conflict with local customs and practices. From time to time, we have conducted and will conduct internal investigations of the relevant facts and circumstances, control testing and compliance reviews, and take remedial actions, when appropriate, to help ensure that we are in compliance with applicable corruption and similar laws and regulations. Detecting, investigating and resolving actual or alleged violations of the FCPA or similar laws is expensive and could consume significant time and attention of our senior management. We could be subject to inquiries or investigations by government and other regulatory bodies. Any allegations of non-compliance with the FCPA or similar laws could have a disruptive effect on our operations in such jurisdiction over the near term, including interruptions of business or loss of third-party relationships, which may negatively impact our results of operations or financial condition. Any determination that our operations or activities are not in compliance with the FCPA or similar laws could expose us to severe criminal or civil penalties or other sanctions, significant fines, termination of necessary licenses and permits, and penalties or other sanctions that may harm our business and reputation.
Our ability to compete effectively depends on our ability to protect our intellectual property rights.
18
We rely on patents and trade secrets to protect our intellectual property rights. We often rely on trade secrets to protect our proprietary fragrance and flavor formulations, as this does not require us to publicly file information regarding our intellectual property. From time to time, a third party may claim that we have infringed upon or misappropriated their intellectual property rights, or a third party may infringe upon or misappropriate our intellectual property rights. We could incur significant costs in connection with legal actions to assert our intellectual property rights against third parties or to defend ourselves from third party assertions of invalidity, infringement or misappropriation or other claims. Any settlement or adverse judgment resulting from such litigation could require us to obtain a license to continue to use the intellectual property rights that are the subject of the claim, or otherwise restrict or prohibit our use of such intellectual property rights. Any required licensing fees may not be available to us on acceptable terms, if at all. For those intellectual property rights that are protected as trade secrets, this litigation could result in even higher costs, and potentially the loss of certain rights, since we would not have a perfected intellectual property right that precludes others from making, using or selling our products or processes. The ongoing trend among our customers towards more transparent labeling could further diminish our ability to effectively protect our proprietary flavor formulations.
For intellectual property rights that we seek to protect through patents, we cannot be certain that these rights, if obtained, will not later be opposed, invalidated, or circumvented. In addition, even if such rights are obtained in the United States, the laws of some of the other countries in which our products are or may be sold do not protect intellectual property rights to the same extent as the laws of the United States. If other parties were to infringe on our intellectual property rights, or if a third party successfully asserted that we had infringed on their intellectual property rights, it could materially and adversely affect our future results of operations by (i) reducing the price that we could obtain in the marketplace for products which are based on such rights, (ii) increasing the royalty or other fees that we may be required to pay in connection with such rights or (iii) limiting the volume, if any, of such products that we can sell.
Our results of operations may be negatively impacted by the outcome of uncertainties related to litigation.
From time to time we are involved in a number of legal claims and litigation, including claims related to intellectual property, product liability, environmental matters and indirect taxes. We cannot predict the ultimate outcome of such litigation. In addition, we cannot provide assurance that future events will not result in an increase in the number of claims or require an increase in the amount accrued for any such claims, or require accrual for one or more claims that has not been previously accrued. In addition, if we were found liable, we could be subject to certain indemnification claims. There can be no assurance that our insurance will be adequate to protect us from all material expenses related to pending and future claims or that such levels of insurance will be available in the future at economical prices.
The level of returns on pension and postretirement plan assets and the actuarial assumptions used for valuation purposes could affect our earnings and cash flows in future periods. Changes in government regulations could also affect our pension and postretirement plan expenses and funding requirements.
The funding obligations for our pension plans are impacted by the performance of the financial markets, particularly the equity markets, and interest rates. Funding obligations are determined under government regulations and are measured each year based on the value of assets and liabilities on a specific date. If the financial markets do not provide the long-term returns that are expected under the governmental funding calculations, we could be required to make larger contributions. The equity markets can be very volatile, and therefore our estimate of future contribution requirements can change dramatically in relatively short periods of time. Similarly, changes in interest rates and legislation enacted by governmental authorities can impact the timing and amounts of contribution requirements. An adverse change in the funded status of the plans could significantly increase our required contributions in the future and adversely impact our liquidity.
Assumptions used in determining projected benefit obligations and the fair value of plan assets for our pension and other postretirement benefit plans are determined by us in consultation with outside consultants and advisors. In the event that we determine that changes are warranted in the assumptions used, such as the discount rate, expected long-term rate of return on assets, or expected health care costs, our future pension and postretirement benefit expenses could increase or decrease. Due to changing market conditions or changes in the participant population, the assumptions that we use may differ from actual results, which could have a significant impact on our pension and postretirement liabilities and related costs and funding requirements.
Any future impairment of our tangible or intangible long-lived assets may adversely impact our profitability.
A significant portion of our assets consists of long-lived assets, including tangible assets such as our manufacturing facilities, and intangible assets and goodwill. As of December 31, 2016, we had recorded $1.4 billion of intangible assets and goodwill including goodwill and intangible assets related to our acquisitions. Long-lived assets are subject to an impairment analysis
19
whenever events or changes in circumstances indicate the carrying amount of the asset may not be recoverable. Additionally, goodwill is subject to an impairment test at least annually. Indicators such as underperformance relative to historical or projected future operating results, changes in the Company’s strategy for its overall business or use of acquired assets, unexpected negative industry or economic trends, decreased market capitalization relative to net book values, unanticipated competitive activities, change in consumer demand, loss of key personnel and acts by governments and courts may signal that an asset has become impaired. To the extent any of our acquisitions do not perform as anticipated, whether due to internal or external factors, the value of such assets may be negatively affected and we may be required to record impairment charges. Our results of operations and financial position in future periods could be negatively impacted should future impairments of our long-lived assets, including intangible assets or goodwill occur.
Changes in our tax rates, the adoption of new United States or international tax legislation, or changes in existing tax laws could expose us to additional tax liabilities that may affect our future results.
We are subject to taxes in the United States and numerous foreign jurisdictions. Our future effective tax rates could be affected by changes in the mix of earnings in countries with differing statutory tax rates, changes in the valuation of deferred tax assets and liabilities, changes in liabilities for uncertain tax positions, cost of repatriations or changes in tax laws or their interpretation. Any of these changes could have a material adverse effect on our profitability.
We have and will continue to implement transfer pricing policies among our various operations located in different countries. These transfer pricing policies are a significant component of the management and compliance of our operations across international boundaries and overall financial results. Many countries routinely examine transfer pricing policies of taxpayers subject to their jurisdiction, challenge transfer pricing policies aggressively where there is potential non-compliance and impose significant interest charges and penalties where non-compliance is determined. There can be no assurance that a governmental authority will not challenge these policies more aggressively in the future or, if challenged, that we will prevail. We could suffer significant costs related to one or more challenges to our transfer pricing policies.
We are subject to the continual examination of our income tax returns by the Internal Revenue Service and foreign tax authorities in those countries in which we operate, and we may be subject to assessments or audits in the future in any of the countries in which we operate. The final determination of tax audits and any related litigation could be materially different from our historical income tax provisions and accruals, and while we do not believe the results that follow would have a material adverse effect on our financial condition, such results could have a material effect on our income tax provision, net income or cash flows in the period or periods in which that determination is made.
In addition, a number of international legislative and regulatory bodies have proposed legislation and begun investigations of the tax practices of multi-national companies and, in the European Union (“EU”), the tax policies of certain EU member states. One of these efforts has been led by the OECD, an international association of 34 countries including the United States, which has finalized recommendations to revise corporate tax, transfer pricing, and tax treaty provisions in member countries. Since 2013, the European Commission (“EC”) has been investigating tax rulings granted by tax authorities in a number of EU member states with respect to specific multi-national corporations to determine whether such rulings comply with EU rules on state aid, as well as more recent investigations of the tax regimes of certain EU member states. Under EU law, selective tax advantages for particular taxpayers that are not sufficiently grounded in economic realities may constitute impermissible state aid. If the EC determines that a tax ruling or tax regime violates the state aid restrictions, the tax authorities of the affected EU member state may be required to collect back taxes for the period of time covered by the ruling. In late 2015 and early 2016, the EC declared that tax rulings, related to other companies, by tax authorities in Luxembourg, the Netherlands and Belgium did not comply with the EU state aid restrictions. If the EC were to successfully challenge tax rulings applicable to us in any of the EU member states in which we are subject to taxation, we could be exposed to increased tax liabilities.
Our operations may be affected by greenhouse emissions and climate change and related regulations.
The availability of raw materials and energy supplies fluctuate in markets throughout the world. Climate change may also affect the availability and price of key raw materials, including natural products used in the manufacture of our products. In order to mitigate the risk of price increases and shortages, our procurement team has developed various sourcing strategies, including multiple suppliers, inventory management systems, various geographic suppliers and long-term agreements to mitigate risk.
In addition to market forces, there are various regulatory efforts relating to climate change that may increase the cost of raw materials, particularly energy used to operate our facilities, that could materially impact our financial condition, results of operations and cash flows.
20
The potential government regulation of certain of our product development initiatives is uncertain, and we may be subject to adverse consequences if we fail to comply with applicable regulations.
As part of our ingredients research program, we seek to collaborate with research institutions and companies throughout the world, including biotechnology companies. However, it is unclear whether any of our product developments will be classified as genetically modified food products subject to regulation as a biotechnology product. The manufacture of biotechnology products is subject to applicable Current Good Manufacturing Practice (CGMP) regulations as prescribed by the Food and Drug Administration and the applicable standards prescribed by European Commission and the competent authorities of European Union Member States and to other rules and regulations prescribed by foreign regulatory authorities. Compliance with these regulations can be expensive and time consuming. Such regulation could also subject us to requirements for labeling and traceability, which may cause our customers to avoid our affected products and seek our competitors’ products. This may result in our inability to realize any benefit from our investment and have an adverse effect on our operating results.
The United Kingdom’s impending departure from the European Union could have an adverse effect on us.
In June 2016, the United Kingdom held a referendum in which a majority of voters voted to exit the European Union, commonly referred to as “Brexit.” As a result of the referendum, it is expected that the British government will commence negotiations to determine the terms of the U.K.’s withdrawal from the European Union. A withdrawal could, among other outcomes, disrupt the free movement of goods, services and people between the U.K. and the European Union, undermine bilateral cooperation in key geographic areas and significantly disrupt trade between the U.K. and the European Union or other nations as the U.K. pursues independent trade relations. In addition, Brexit could lead to legal uncertainty and potentially divergent national laws and regulations as the U.K. determines which European Union laws to replace or replicate. The effects of Brexit will depend on any agreements the U.K. makes to retain access to European Union or other markets either during a transitional period or more permanently. Given the lack of comparable precedent, it is unclear what financial, trade and legal implications the withdrawal of the U.K. from the European Union would have and how such withdrawal would affect us. Adverse consequences concerning Brexit or the European Union could include deterioration in global economic conditions, instability in global financial markets, political uncertainty, volatility in currency exchange rates, or adverse changes in the cross-border agreements currently in place, any of which could have an adverse impact on our financial results in the future.
ITEM 1B. | UNRESOLVED STAFF COMMENTS. |
None.
21
ITEM 2. | PROPERTIES. |
Our principal properties are as follows:
Location | Operation |
United States | |
Carrollton, TX(1) | Production of flavor compounds; flavor laboratories. |
Hazlet, NJ(1) | Production of fragrance compounds; fragrance laboratories. |
Jacksonville, FL | Production of fragrance ingredients. |
New York, NY(1) | Fragrance laboratories; corporate headquarters. |
South Brunswick, NJ(1) | Production of flavor compounds and ingredients; flavor laboratories. |
Union Beach, NJ | Research and development center. |
France | |
Neuilly(1) | Fragrance laboratories. |
Grasse | Production of fragrance ingredients. |
Great Britain | |
Haverhill | Production of flavor compounds and ingredients, and fragrance ingredients; flavor laboratories. |
Netherlands | |
Hilversum | Flavor and fragrance laboratories. |
Tilburg | Production of flavor compounds and ingredients, and fragrance compounds. |
Spain | |
Benicarló | Production of fragrance ingredients. |
Argentina | |
Garin | Production of flavor and fragrance compounds; flavor and fragrance laboratories. |
Brazil | |
Rio de Janeiro | Production of fragrance compounds. |
São Paulo | Flavor and fragrance laboratories. |
Taubate | Production of flavor compounds and ingredients. |
Mexico | |
Tlalnepantla | Production of flavor and fragrance compounds; flavor and fragrance laboratories. |
India | |
Mumbai(2) | Flavor and fragrance laboratories. |
Chennai(2) | Production of flavor compounds and ingredients, and fragrance compounds; flavor laboratories. |
Australia | |
Dandenong | Production of flavor compounds and flavor ingredients. |
China | |
Guangzhou(3) | Production of flavor compounds. |
Guangzhou(3) | Production of fragrance compounds. |
Shanghai(4) | Flavor and fragrance laboratories. |
Xin’anjiang(5) | Production of fragrance ingredients. |
Zhejiang(3) | Production of fragrance ingredients. |
22
Location | Operation |
Indonesia | |
Jakarta | Production of flavor compounds and ingredients; flavor and fragrance laboratories. |
Japan | |
Gotemba | Production of flavor compounds. |
Tokyo | Flavor and fragrance laboratories. |
Singapore | |
Jurong(4) | Production of flavor and fragrance compounds. |
Science Park(1) | Flavor and fragrance laboratories. |
Turkey | |
Gebze | Production of flavor compounds. |
Israel | |
Kibbutz Givat-Oz(3) | Production of fragrance ingredients. |
Germany | |
Hamburg | Production of fragrance compounds. |
_______________________
(1) | Leased. |
(2) | We have a 93.4% interest in the subsidiary company that owns this facility. |
(3) | Land is leased and building and machinery and equipment are owned. |
(4) | Building is leased and machinery and equipment are owned. |
(5) | We have a 90% interest in the subsidiary company that leases the land and owns the buildings and machinery. |
Our principal executive offices and New York laboratory facilities are located at 521 West 57th Street, New York City.
ITEM 3. | LEGAL PROCEEDINGS. |
We are subject to various claims and legal actions in the ordinary course of our business.
Tax Claims
The Spanish tax authorities alleged claims for a capital tax and the Appellate Court rejected one of the two bases upon which we based our capital tax position. On January 22, 2014, we filed an appeal and in order to avoid future interest costs in the event our appeal was unsuccessful, we paid Euro 9.8 million ($11.2 million, representing the principal amount) during the first quarter of 2014. On February 24, 2016, we received a favorable ruling on our appeal from the Spanish Supreme Court which overruled a lower court ruling. As a result of this decision, we reversed the previously recorded provision of Euro 9.8 million ($10.5 million) for the year ended December 31, 2015. During 2016, we recorded additional income of $2.3 million related to the finalization of amounts received from the authorities. This amount has been principally reflected as a reduction of administrative expense.
We do not currently believe that any of our pending tax assessments, even if ultimately resolved against us, would have a material impact on our financial condition.
Environmental
Over the past 20 years, various federal and state authorities and private parties have claimed that we are a Potentially Responsible Party (“PRP”) as a generator of waste materials for alleged pollution at a number of waste sites operated by third parties located principally in New Jersey and have sought to recover costs incurred and to be incurred to clean up the sites.
We have been identified as a PRP at eight facilities operated by third parties at which investigation and/or remediation activities may be ongoing. We analyze our potential liability on at least a quarterly basis. We accrue for environmental liabilities when they are probable and estimable. We estimate our share of the total future cost for these sites to be less than $5 million.
While joint and several liability is authorized under federal and state environmental laws, we believe the amounts we have paid and anticipate paying in the future for clean-up costs and damages at all sites are not material and will not have a material adverse effect on our financial condition, results of operations or liquidity. This assessment is based upon, among other
23
things, the involvement of other PRPs at most of the sites, the status of the proceedings, including various settlement agreements and consent decrees, and the extended time period over which payments will likely be made. There can be no assurance, however, that future events will not require us to materially increase the amounts we anticipate paying for clean-up costs and damages at these sites, and that such increased amounts will not have a material adverse effect on our financial condition, results of operations or cash flows.
Other
In March 2012, ZoomEssence, Inc. filed a complaint against the Company in the U.S. District Court for the District of New Jersey alleging trade secret misappropriation, breach of contract and unjust enrichment in connection with certain spray dry technology disclosed to the Company. ZoomEssence sought an injunction and monetary damages. ZoomEssence initially sought a temporary restraining order and preliminary injunction, but the Court denied these applications in an order entered on September 27, 2013, finding that ZoomEssence had not demonstrated a likelihood of success on the merits of its claims. On November 3, 2014, ZoomEssence amended its complaint against the Company to include allegations of breach of the duty of good faith and fair dealing, fraud in the inducement, and misappropriation of confidential and proprietary information. On November 13, 2014, the Company filed a counterclaim against ZoomEssence alleging trade secret misappropriation, breach of contract, breach of the implied covenant of good faith and fair dealing, unjust enrichment, misappropriation of confidential and proprietary information, common law unfair competition, tortious interference with contractual relations, and conversion. During the third quarter of 2016, the Court stayed the case and directed the parties to mediate. During the fourth quarter of 2016, the parties engaged in mediation and various settlement discussions which have not resulted in a resolution of the litigation to date. If the case is not settled, we expect that a trial on the merits of the case will occur during 2017. Based on expert assessment of potential exposure and the status of the settlement discussions, the Company recorded an additional reserve of $50 million during 2016.
The Company determines estimates of reasonably possible losses or ranges of reasonably possible losses in excess of related accrued liabilities, if any, when it has determined that either a loss is reasonably possible or a loss in excess of accrued amounts is reasonably possible and the amount of losses or range of losses is determinable. For all third party contingencies (including labor, contract, technology, tax, product-related claims and business litigation), the Company currently estimates that the aggregate range of reasonably possible losses in excess of any accrued liabilities is $0 to approximately $28 million. The estimates included in this amount are based on the Company’s analysis of currently available information and, as new information is obtained, these estimates may change. Due to the inherent subjectivity of the assessments and the unpredictability of outcomes of legal proceedings, any amounts accrued or included in this aggregate amount may not represent the ultimate loss to the Company from the matters in question. Thus, the Company’s exposure and ultimate losses may be higher or lower, and possibly significantly so, than the amounts accrued or the range disclosed above.
We are also a party to other litigation arising in the ordinary course of our business. We do not expect the outcome of these cases, singly or in the aggregate, to have a material effect on our consolidated financial condition.
ITEM 4. | MINE SAFETY DISCLOSURES. |
Not applicable.
24
PART II
ITEM 5. | MARKET FOR REGISTRANT’S COMMON EQUITY, RELATED STOCKHOLDER MATTERS AND ISSUER PURCHASES OF EQUITY SECURITIES. |
Market Information.
Our common stock is traded principally on the New York Stock Exchange. The high and low stock prices for each quarter during the last two years were:
2016 | 2015 | ||||||||||||||
Quarter | High | Low | High | Low | |||||||||||
First | $ | 122.38 | $ | 97.24 | $ | 123.08 | $ | 97.59 | |||||||
Second | 131.30 | 114.65 | 120.61 | 108.82 | |||||||||||
Third | 143.43 | 124.77 | 118.87 | 100.02 | |||||||||||
Fourth | 143.64 | 116.64 | 122.64 | 106.91 | |||||||||||
Approximate Number of Equity Security Holders.
Title of Class | Number of shareholders of record as of February 15, 2017 |
Common stock, par value 12 1/2¢ per share | 1,878 |
Dividends.
Cash dividends declared per share for each quarter during the two most recent fiscal years were as follows:
Quarter | 2016 | 2015 | |||||
First | $ | 0.56 | $ | 0.47 | |||
Second | 0.56 | 0.47 | |||||
Third | 0.64 | 0.56 | |||||
Fourth | 0.64 | 0.56 | |||||
Our current intention is to return 50%-60% of adjusted Net Income through a combination of dividends and share repurchases; however, the payment of dividends and share repurchases is determined by our Board of Directors (“Board”) at its discretion based on various factors, and no assurance can be provided as to future dividends.
Performance Graph.
Total Return To Shareholders(1)
(Includes reinvestment of dividends)
ANNUAL RETURN PERCENTAGE Years Ending | ||||||||||||||
Company Name / Index | 2012 | 2013 | 2014 | 2015 | 2016 | |||||||||
International Flavors & Fragrances | 29.72 | 31.59 | 19.95 | 20.22 | 0.40 | |||||||||
S&P 500 Index | 16.00 | 32.39 | 13.69 | 1.38 | 11.96 | |||||||||
Peer Group | 8.21 | 19.83 | 7.98 | 5.54 | 4.34 | |||||||||
INDEXED RETURNS Years Ending | |||||||||||||||||||||||
Company Name / Index | Base Period 2011 | 2012 | 2013 | 2014 | 2015 | 2016 | |||||||||||||||||
International Flavors & Fragrances | $ | 100 | $ | 129.72 | $ | 170.70 | $ | 204.75 | $ | 246.15 | $ | 247.13 | |||||||||||
S&P 500 Index | 100 | 116.00 | 153.57 | 174.60 | 177.01 | 198.18 | |||||||||||||||||
Peer Group | 100 | 108.21 | 129.66 | 140.01 | 147.78 | 154.19 | |||||||||||||||||
25
Peer Group Companies(2) | |
Avon Products Inc. | Hormel Foods Corp. |
Campbell Soup Co. | Kellogg Co. |
Church & Dwight Co. Inc. | Estee Lauder Companies, Inc. |
Clorox Company | McCormick & Company, Inc. |
Coca-Cola Company | McDonald’s Corp. |
Colgate-Palmolive Co. | Nestle SA |
ConAgra Foods, Inc. | Pepsico Inc. |
Edgewell Personal Care (included since 7/1/15) | Procter & Gamble Co. |
General Mills Inc. | Revlon Inc. |
Heinz (HJ) Co. (included through 6/7/13) | Sensient Technologies Corp. |
Hershey Company | Unilever NV |
Hillshire Brands Co. (included through 8/28/14) | YUM! Brands Inc. |
Total Shareholder Return Performance Graph
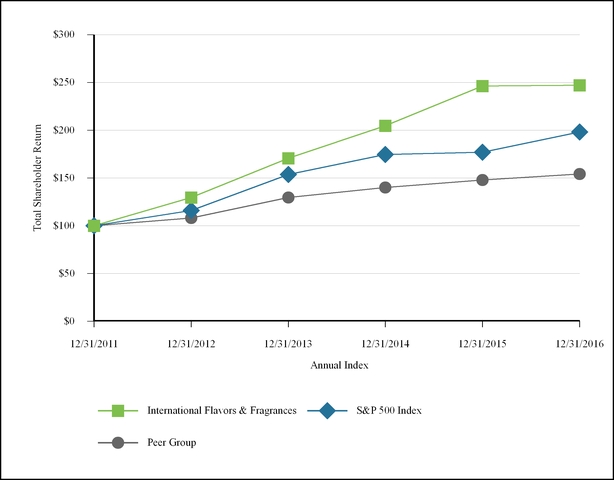
_______________________
(1) | The Cumulative Shareholder Return assumes that the value of an investment in our Common Stock and each index was $100 on December 31, 2011, and that all dividends were reinvested. |
(2) | Due to the international scope and breadth of our business, we believe that a Peer Group comprising international public companies, which are representative of the customer group to which we sell our products, is the most appropriate group against which to compare shareholder returns. In July 2012, Sara Lee Corp. spun off certain of its businesses and changed its name to Hillshire Brands Co. Heinz (HJ) Co. was acquired by Hawk Acquisition Holding Corp on June 7, 2013 and has only been included through that date. Hillshire Brands Co. was acquired by Tyson Foods on August 28, 2014 and has |
26
only been included through that date. Edgewell Personal Care has been included starting from July 1, 2015 when it spun off from Energizer Holdings.
Issuer Purchases of Equity Securities.
The table below reflects shares of common stock we repurchased during the fourth quarter of 2016.
Period | Total Number of Shares Repurchased (1) | Average Price Paid per Share | Total Number of Shares Purchased as Part of Publicly Announced Program | Approximate Dollar Value of Shares That May Yet be Purchased Under the Program | |||||||||
October 1 - 31, 2016 | 56,167 | $ | 133.62 | 56,167 | $ | 135,088,381 | |||||||
November 1 - 30, 2016 | 79,335 | 123.41 | 79,335 | 125,297,344 | |||||||||
December 1 - 31, 2016 | 132,985 | 120.31 | 132,985 | 109,297,809 | |||||||||
Total | 268,487 | $ | 124.01 | 268,487 | $ | 109,297,809 | |||||||
(1) | Shares were repurchased pursuant to the repurchase program originally announced in December 2012 and amended in August 2015 (i) to increase from $250 million to $500 million the total purchase price of shares that may be repurchased under the program and (ii) to extend the program through December 31, 2017. Authorization of the repurchase program may be modified, suspended, or discontinued at any time. |
ITEM 6. | SELECTED FINANCIAL DATA. |
INTERNATIONAL FLAVORS & FRAGRANCES INC.
QUARTERLY FINANCIAL DATA (UNAUDITED)
The following selected consolidated financial data is derived from our Consolidated Financial Statements. This data should be read in conjunction with the Consolidated Financial Statements and Notes thereto, and with Item 7, Management’s Discussion and Analysis of Financial Condition and Results of Operations.
(DOLLARS IN THOUSANDS EXCEPT PER SHARE DATA) | Net Income Per Share | ||||||||||||||||||||||||||||||||||||||
Net Sales | Gross Profit(a) | Net Income(b) | Basic | Diluted(c)(d) | |||||||||||||||||||||||||||||||||||
Quarter | 2016 | 2015 | 2016 | 2015 | 2016 | 2015 | 2016 | 2015 | 2016 | 2015 | |||||||||||||||||||||||||||||
First | $ | 783,312 | $ | 774,907 | $ | 360,209 | $ | 346,277 | $ | 118,603 | $ | 128,258 | $ | 1.48 | $ | 1.58 | $ | 1.47 | $ | 1.57 | |||||||||||||||||||
Second | 793,478 | 767,541 | 365,641 | 345,040 | 116,733 | 105,374 | 1.46 | 1.30 | 1.46 | 1.29 | |||||||||||||||||||||||||||||
Third | 777,001 | 765,092 | 346,268 | 347,126 | 89,777 | 106,447 | 1.13 | 1.32 | 1.12 | 1.31 | |||||||||||||||||||||||||||||
Fourth(d) | 762,559 | 715,649 | 326,952 | 313,156 | 79,918 | 79,168 | 1.00 | 0.99 | 1.00 | 0.98 | |||||||||||||||||||||||||||||
$ | 3,116,350 | $ | 3,023,189 | $ | 1,399,070 | $ | 1,351,599 | $ | 405,031 | $ | 419,247 | $ | 5.07 | $ | 5.19 | $ | 5.05 | $ | 5.16 | ||||||||||||||||||||
_______________________
* See the following chart for (a)-(d) footnote explanations.
27
Included in the above quarterly results are the following:
Footnotes | ||||||||||||||
(DOLLARS IN THOUSANDS EXCEPT PER SHARE DATA) | Gross Profit(a) | Net Income(b) | Diluted EPS (c) | Description | ||||||||||
Q1 2016 | ||||||||||||||
Operational improvement initiatives | $ | 268 | $ | 201 | $ | — | Accelerated depreciation in Hangzhou, China. | |||||||
Restructuring and other charges | 101 | 82 | — | Accelerated depreciation related to restructuring initiatives. | ||||||||||
Acquisition related costs and adjustments | 889 | 669 | 0.01 | Expense related to the fair value step up of inventory and additional transaction costs related to the acquisition of Lucas Meyer. | ||||||||||
Legal charges/credits | — | (1,044 | ) | (0.01 | ) | Amounts expected to be received related to the Spanish capital tax settlement. | ||||||||
Q2 2016 | ||||||||||||||
Operational improvement initiatives | 831 | 623 | 0.01 | Accelerated depreciation in Hangzhou, China and severance costs in Guangzhou, China. | ||||||||||
Restructuring and other charges | 182 | 147 | — | Accelerated depreciation and severance costs related to restructuring initiatives. | ||||||||||
Acquisition related costs and adjustments | — | 315 | — | Additional transaction costs related to the acquisition of Lucas Meyer. | ||||||||||
Q3 2016 | ||||||||||||||
Operational improvement initiatives | 791 | 602 | 0.01 | Accelerated depreciation and dismantling costs in Hangzhou, China and severance costs in Guangzhou, China. | ||||||||||
Restructuring and other charges | 190 | 154 | — | Accelerated depreciation costs related to restructuring initiatives. | ||||||||||
Acquisition related costs and adjustments | — | 510 | 0.01 | Transaction costs related to the acquisition of David Michael. | ||||||||||
Legal charges/credits | — | 16,250 | 0.20 | Legal charge related to litigation accrual. | ||||||||||
Q4 2016 | ||||||||||||||
Operational improvement initiatives | 502 | 379 | — | Accelerated depreciation, dismantling and idle labor costs in Hangzhou, China and the partial reversal of severance accruals related to prior year operational initiatives in Europe. | ||||||||||
Restructuring and other charges | 185 | (158 | ) | — | Accelerated depreciation related to restructuring initiatives, severance costs related to the termination of a former executive officer and the partial reversal of restructuring accruals recorded in the prior year. | |||||||||
Acquisition related costs and adjustments | 6,759 | 6,586 | 0.08 | Transaction costs related to the acquisition of David Michael and Fragrance Resources as well as expense related to the fair value step up of inventory on the David Michael acquisition. | ||||||||||
Gain on Asset Sale | — | (5,160 | ) | (0.06 | ) | Gain from sale of property in Brazil. | ||||||||
Legal charges/credits | — | 16,250 | 0.20 | Legal charge related to litigation accrual. | ||||||||||
Q1 2015 | ||||||||||||||
Operational improvement initiatives | 281 | 211 | — | Accelerated depreciation in Hangzhou, China. | ||||||||||
Restructuring and other charges | — | 121 | — | Restructuring costs associated with the Fragrance Ingredients Rationalization. | ||||||||||
Acquisition related costs and adjustments | — | 325 | — | Transaction costs related to the acquisition of Ottens Flavors. | ||||||||||
Tax settlements | — | (10,478 | ) | (0.13 | ) | Settlements due to favorable tax rulings in jurisdictions for which reserves were previously recorded for ongoing tax disputes. | ||||||||
Q2 2015 | ||||||||||||||
Operational improvement initiatives | 281 | 211 | — | Accelerated depreciation in Hangzhou, China. | ||||||||||
Restructuring and other charges | — | (233 | ) | — | Restructuring costs associated with the Fragrance Ingredients Rationalization. | |||||||||
Acquisition related costs and adjustments | 844 | 5,691 | 0.07 | Transaction costs related to the acquisition of Ottens Flavors and Lucas Meyer as well as expense related to the fair value step up of inventory on the Ottens Flavors acquisition. | ||||||||||
Q3 2015 | ||||||||||||||
Operational improvement initiatives | 279 | 209 | — | Accelerated depreciation in Hangzhou, China. | ||||||||||
Acquisition related costs and adjustments | 2,465 | 6,001 | 0.07 | Transaction costs related to the acquisition of Ottens Flavors and Lucas Meyer as well as expense related to the fair value step up of inventory on the Lucas Meyer acquisition. | ||||||||||
Q4 2015 | ||||||||||||||
Operational improvement initiatives | 274 | 205 | — | Accelerated depreciation in Hangzhou, China. | ||||||||||
Restructuring and other charges | — | 5,402 | 0.07 | Severance costs associated with various restructuring activities. | ||||||||||
Acquisition related costs and adjustments | 3,515 | 99 | — | Transaction costs related to the acquisition of Ottens Flavors and Lucas Meyer as well as expense related to the fair value step up of inventory on the Lucas Meyer acquisition. | ||||||||||
Accelerated contingent consideration | — | 7,192 | 0.09 | Represents the acceleration of the contingent consideration payment related to the Aromor acquisition. | ||||||||||
Legal charges/credits | — | (7,582 | ) | (0.09 | ) | To reverse the previously recorded provision related to the Spanish capital tax case as a result of the favorable ruling received on February 24, 2016. | ||||||||
(d) | The sum of the 2015 Net Income per diluted share by quarter does not equal the earnings per share for the full year due to rounding. |
28
INTERNATIONAL FLAVORS & FRAGRANCES INC.
FIVE-YEAR SUMMARY
(DOLLARS IN THOUSANDS EXCEPT PER SHARE AMOUNTS)
2016 | 2015 | 2014 | 2013 | 2012 | |||||||||||||||
Consolidated Statement of Income Data | |||||||||||||||||||
Net sales | $ | 3,116,350 | $ | 3,023,189 | $ | 3,088,533 | $ | 2,952,896 | $ | 2,821,446 | |||||||||
Cost of goods sold(a) | 1,717,280 | 1,671,590 | 1,726,383 | 1,668,691 | 1,645,912 | ||||||||||||||
Gross profit | 1,399,070 | 1,351,599 | 1,362,150 | 1,284,205 | 1,175,534 | ||||||||||||||
Research and development expenses | 254,263 | 246,101 | 253,640 | 259,838 | 233,713 | ||||||||||||||
Selling and administrative expenses(b) | 566,224 | 494,517 | 507,563 | 499,805 | 447,463 | ||||||||||||||
Restructuring and other charges, net(c) | (1,700 | ) | 7,594 | 1,298 | 2,151 | 1,668 | |||||||||||||
Amortization of acquisition-related intangibles | 23,763 | 15,040 | 7,328 | 6,072 | 6,072 | ||||||||||||||
Gain on sales of fixed assets(d) | (10,836 | ) | — | — | — | — | |||||||||||||
Operating profit | 567,356 | 588,347 | 592,321 | 516,339 | 486,618 | ||||||||||||||
Interest expense | 52,989 | 46,062 | 46,067 | 46,767 | 41,753 | ||||||||||||||
Other (income) expense, net(e) | (9,350 | ) | 3,184 | (2,807 | ) | (15,638 | ) | 1,450 | |||||||||||
Income before taxes | 523,717 | 539,101 | 549,061 | 485,210 | 443,415 | ||||||||||||||
Taxes on income(f) | 118,686 | 119,854 | 134,518 | 131,666 | 189,281 | ||||||||||||||
Net income | $ | 405,031 | $ | 419,247 | $ | 414,543 | $ | 353,544 | $ | 254,134 | |||||||||
Percentage of net sales | 13.0 | 13.9 | 13.4 | 12.0 | 9.0 | ||||||||||||||
Percentage of average shareholders’ equity | 25.1 | 26.9 | 27.7 | 26.0 | 21.5 | ||||||||||||||
Net income per share — basic | $ | 5.07 | $ | 5.19 | $ | 5.09 | $ | 4.32 | $ | 3.11 | |||||||||
Net income per share — diluted | $ | 5.05 | $ | 5.16 | $ | 5.06 | $ | 4.29 | $ | 3.09 | |||||||||
Average number of diluted shares (thousands) | 79,981 | 80,891 | 81,494 | 81,930 | 81,833 | ||||||||||||||
Consolidated Balance Sheet Data | |||||||||||||||||||
Cash and cash equivalents | $ | 323,992 | $ | 181,988 | $ | 478,573 | $ | 405,505 | $ | 324,422 | |||||||||
Receivables, net | 550,658 | 537,896 | 493,768 | 524,493 | 499,443 | ||||||||||||||
Inventories | 592,017 | 572,047 | 568,729 | 533,806 | 540,658 | ||||||||||||||
Property, plant and equipment, net | 775,716 | 732,794 | 720,268 | 687,215 | 654,641 | ||||||||||||||
Goodwill and intangible assets, net | 1,365,906 | 1,247,393 | 752,041 | 696,197 | 702,270 | ||||||||||||||
Total assets | 4,016,984 | 3,702,010 | 3,494,621 | 3,331,731 | 3,246,192 | ||||||||||||||
Bank borrowings, overdrafts and current portion of long-term debt | 258,516 | 132,349 | 8,090 | 149 | 150,071 | ||||||||||||||
Long-term debt | 1,066,855 | 935,373 | 934,232 | 932,665 | 881,104 | ||||||||||||||
Total Shareholders’ equity(g) | 1,631,134 | 1,594,989 | 1,522,689 | 1,467,051 | 1,252,555 | ||||||||||||||
Other Data | |||||||||||||||||||
Current ratio(h) | 1.8 | 2.0 | 3.3 | 2.9 | 2.5 | ||||||||||||||
Additions to property, plant and equipment | $ | 126,412 | $ | 101,030 | $ | 143,182 | $ | 134,157 | $ | 126,140 | |||||||||
Depreciation and amortization expense | 102,469 | 89,597 | 89,354 | 83,227 | 76,667 | ||||||||||||||
Cash dividends declared per share | $ | 2.40 | $ | 2.06 | $ | 1.72 | $ | 1.46 | $ | 1.30 | |||||||||
Number of shareholders of record at year-end | 1,892 | 2,013 | 2,105 | 2,255 | 2,430 | ||||||||||||||
Number of employees at year-end | 6,932 | 6,732 | 6,211 | 6,000 | 5,715 | ||||||||||||||
_______________________
(a) | The 2016 amount includes $7,648 ($5,139 after tax) of costs related to the fair value step-up for the David Michael and Lucas Meyer acquisitions, $2,391 ($1,803 after tax) of operational improvement initiative costs consisting of accelerated depreciation and $658 ($533 after tax) of accelerated depreciation related to restructuring activities. The 2015 amount includes $6,825 ($4,516 after tax) of costs related to the fair value step-up of inventory for the Ottens Flavors and Lucas Meyer acquisitions and $1,115 ($836 after tax) of operational improvement initiative costs in Europe and Asia. The 2014 amount includes $7,641 ($5,221 after tax) of accelerated depreciation associated with the Fragrance Ingredients |
29
rationalization and operational improvement initiative costs in Europe and Asia. The 2013 amount includes $8,770 ($6,084 after tax) of accelerated depreciation associated with the Fragrance Ingredients rationalization and several locations in Asia.
(b) | The 2016 amount includes $48,518 ($31,429 after tax) of legal charges/credits principally related to litigation accrual, $4,547 ($2,940 after tax) of acquisition-related costs related to the acquisitions of Lucas Meyer, David Michael and Fragrance Resources and $1,364 ($822 after tax) of severance costs related to the termination of a former executive officer. The 2015 amount includes $10,530 ($7,582 after tax) of reversal of the previously recorded provision for the Spanish capital tax case, $7,192 of expense for the acceleration of the contingent consideration payments related to the Aromor acquisition and $11,517 ($7,601 after tax) of acquisition-related costs for the Ottens and Lucas Meyer acquisitions. The 2013 amount includes $13,011 ($9,108 after tax) of expense associated with the Spanish capital tax case. |
(c) | Restructuring and other charges after tax of $5,292 in 2015, $844 in 2014, $1,398 in 2013 and $1,047 in 2012, were the result of various restructuring and reorganization programs of the Company. |
(d) | The 2016 amount includes $7,818 ($5,160 after tax) of gains related to the sale of property in Brazil. |
(e) | The 2014 amount includes $723 ($470 after tax) and the 2013 amount includes $14,155 ($8,522 after tax) of net gains related to the sale of non-operating assets. |
(f) | The 2015 amount includes $10,478 of settlements due to favorable tax rulings in jurisdictions for which reserves were previously recorded for ongoing tax disputes. The 2012 amount includes after tax charges of $72,362 related to the overall Spanish tax settlement. |
(g) | Includes noncontrolling interest for all periods presented. |
(h) | Current ratio is equal to current assets divided by current liabilities. |
ITEM 7. | MANAGEMENT’S DISCUSSION AND ANALYSIS OF FINANCIAL CONDITION AND RESULTS OF OPERATIONS. |
(UNLESS INDICATED OTHERWISE, DOLLARS IN MILLIONS EXCEPT PER SHARE AMOUNTS)
Overview
Company background
We are a leading innovator of sensorial experiences, co-creating unique products that consumers taste, smell, or feel in fine fragrances and cosmetics, detergents and household goods, and food and beverages. We take advantage of our capabilities in consumer insights, research and product development (“R&D”), creative expertise and customer intimacy to partner with our customers in developing innovative and differentiated offerings for consumers. We believe that this collaborative approach will generate market share gains for our customers. Our flavors and fragrance compounds combine a number of ingredients that are blended, mixed or reacted together to produce proprietary formulas created by our flavorists and perfumers.
Flavors are the key building blocks that impart taste experiences in food and beverage products and, as such, play a significant role in determining consumer preference of the end products in which they are used. As a leading creator of flavors, we help our customers deliver on the promise of delicious and healthy foods and drinks that appeal to consumers. While we are a global leader, our flavors business is more regional in nature, with different formulas that reflect local taste preferences. Our flavors compounds are ultimately used by our customers in four end-use categories: (1) Savory, (2) Beverages, (3) Sweet and (4) Dairy.
We are a global leader in the creation of fragrance compounds that are integral elements in the world’s finest perfumes and best-known consumer products, within fabric care, home care, personal wash, hair care and toiletries products. Our Fragrances business consists of Fragrance Compounds and Fragrance Ingredients. Our Fragrance Compounds are defined into broad categories, (1) Fine Fragrances and (2) Consumer Fragrances. Consumer Fragrances consists of five end-use categories of products: (1) Fabric Care, (2) Home Care, (3) Personal Wash, (4) Hair Care and (5) Toiletries. In addition, Fragrance Ingredients, that are used internally and sold to third parties, including customers and competitors, for use in preparation of compounds, and cosmetic active ingredients, which consist of active and functional ingredients, are included in the Fragrances business unit.
The flavors and fragrances market is part of a larger market which supplies a wide variety of ingredients and compounds that are used in consumer products. The broader market includes large multinational companies or smaller regional and local participants which supply products such as seasonings, texturizers, spices, enzymes, certain food-related commodities, fortified products and cosmetic active ingredients. The global market for flavors and fragrances has expanded consistently, primarily as a result of an increase in demand for, as well as an increase in the variety of, consumer products containing flavors and fragrances. In 2016, the flavors, fragrances and cosmetic actives and functional ingredients market, in which we compete, was estimated by management to be approximately $20.0 billion and is forecasted to grow approximately 2-3% by 2020, primarily
30
driven by expected growth in emerging markets; however the exact size of the global market is not available due to fragmentation of data. We, together with the other top three companies, are estimated to represent approximately two-thirds of the total estimated sales in the global flavors and fragrances sub-segment of the broader market.
Development of new flavors and fragrance compounds is driven by a variety of sources, including requests from our customers, who are in need of a specific flavor or fragrance for use in a new or modified consumer product, or as a result of internal initiatives stemming from our consumer insights program. Our product development team works in partnership with our scientists and researchers to optimize the consumer appeal of the flavor or fragrance. It then becomes a collaborative process between our researchers, our product development team and our customers to perfect the flavor or fragrance so that it is ready to be included in the final consumer product.
On January 17, 2017, we completed the acquisition of Fragrance Resources for approximately Euro 142 million (approximately $150.5 million). The acquisition had no impact on our consolidated financial statements for 2016. The acquisition is expected to strengthen our fragrances market position in North America and Germany.
2016 Overview
Our 25 largest customers accounted for 52% of total sales in 2016; this percentage has remained fairly constant for several years. Sales to our largest customer across all end-use categories accounted for 12% of our sales for each of the last three fiscal years. A key factor for commercial success is inclusion on our strategic customers’ core supplier lists, which provides opportunities to win new business. We are on the core supplier lists of a large majority of our global and strategic customers within Fragrances and Flavors.
Sales in 2016 increased 3% on a reported basis and 5% on a currency neutral basis (which excludes the effects of changes in currency), with the effects of acquisitions contributing approximately 2% to both reported and currency neutral growth rates. Flavors achieved reported sales growth of 4% and currency neutral sales growth of 6%, with the effect of acquisitions contributing approximately 3% to both reported and currency neutral growth rates. Fragrances achieved reported sales growth of 3% and currency neutral growth of 4% in 2016, with the effect of acquisitions contributing approximately 2% to both reported and currency neutral growth rates. Sales growth excluding acquisitions was driven by new win performance (net of losses) in both Flavors and Fragrance Compounds. Additionally, Fragrance Ingredients sales were up 9% on a reported basis and 10% on a currency neutral basis, which were driven entirely by the inclusion of acquisitions. Overall, our 2016 results continued to be driven by our strong emerging market presence that represented 51% of total sales and experienced 4% currency neutral growth in 2016. From a geographic perspective, North America (NOAM), Europe, Africa and Middle East (EAME) and Greater Asia (GA) all delivered sales growth on a consolidated basis in 2016; led by NOAM. Latin America (LA) sales declined in 2016.
During the fourth quarter of 2016, we completed the acquisition of 100% of the outstanding shares of David Michael & Company, Inc. ("David Michael") for approximately $242.0 million. The acquisition did not have a material impact on our Consolidated Statement of Income and Comprehensive Income for 2016. The acquisition strengthened our flavors market position in the targeted North American market.
The year 2014 included an extra week of activity, due to the timing of our fiscal year-end (as discussed in Note 1 of the Consolidated Financial Statements). The impact of this week was not material to our results of operations for the year ended December 31, 2014.
31
2016 Sales by Business Unit
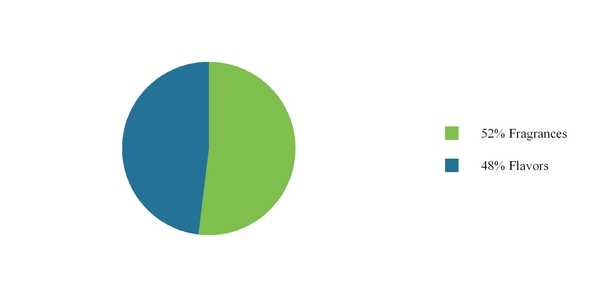
Sales by Destination (DOLLARS IN MILLIONS) | 2016 | Percent of sales | 2015 | Percent of sales | 2014 | Percent of sales | ||||||||||||||
Europe, Africa and Middle East (EAME) | $ | 965 | 31 | % | $ | 946 | 31 | % | $ | 1,042 | 34 | % | ||||||||
Greater Asia (GA) | 880 | 28 | % | 839 | 28 | % | 856 | 28 | % | |||||||||||
North America (NOAM) | 769 | 25 | % | 718 | 24 | % | 690 | 22 | % | |||||||||||
Latin America (LA) | 502 | 16 | % | 520 | 17 | % | 501 | 16 | % | |||||||||||
Total net sales, as reported | $ | 3,116 | $ | 3,023 | $ | 3,089 | ||||||||||||||
Year Ended December 31, | ||||||||
Sales by Category | 2016 | 2015 | 2014 | |||||
Flavor Compounds | 48 | % | 48 | % | 47 | % | ||
Consumer Fragrances | 32 | % | 32 | % | 32 | % | ||
Fine Fragrances | 10 | % | 10 | % | 11 | % | ||
Fragrance Ingredients | 10 | % | 10 | % | 10 | % | ||
Total Net Sales | 100 | % | 100 | % | 100 | % | ||
FINANCIAL PERFORMANCE OVERVIEW
Reported sales for 2016 increased 3% year-over-year (including approximately 2% growth from acquisitions). We continue to benefit from our diverse portfolio of end-use product categories and geographies and had sales growth in three of our four regions and in Consumer Fragrances, Fragrance Ingredients and Flavor Compounds. Both Flavors and Fragrances benefited from new win performance (net of losses) and the effect of acquisitions. Exchange rate variations represented a 2% decrease in year-over-year sales. The effect of exchange rates can vary by business and region depending upon the mix of sales by country as well as the relative percentage of local sales priced in U.S. dollars versus local currencies. Currency neutral sales growth, including acquisitions, was 5% in 2016. We saw currency neutral sales growth during each quarter of 2016. We believe that market conditions and the macro-economic environment will continue to be challenging in many markets in 2017. This lower growth environment combined with a stronger U.S. dollar and the reset of the incentive compensation program is expected to pressure our currency neutral operating profit growth in 2017.
On a long-term basis, we expect that sales growth for the industry will generally be in line with the underlying assumptions that support our long-term strategic goals, albeit with some risk in the near term given the continuing global economic uncertainty. We believe changing social habits resulting from increased disposable income, improved focus on personal health and wellness awareness should help drive growth of our consumer product customers’ businesses.
32
Gross margin increased 20 basis points (bps) year-over-year. Included in 2016 was $7.6 million of acquisition-related inventory "step-up" costs, $2.4 million of costs associated with operational improvement initiatives and $0.7 million of costs related to accelerated depreciation included in Cost of goods sold, compared to $6.8 million of acquisition-related inventory "step-up" costs and $1.1 million of costs related to operational improvement initiatives included in 2015. Excluding these items, adjusted gross margin increased 20 bps compared to the prior year period. The increase was principally driven by productivity initiatives. We ended 2016 in a relatively stable, but upward trending raw material cost environment. We believe that we will continue to see higher prices on certain categories (such as vanilla and citrus) and to a lesser extent oil-based derivatives that are expected to continue in 2017. We continue to seek improvements in our margins through operational performance, cost reduction efforts and mix enhancement.
Operating profit decreased $21.0 million to $567.4 million (18.2% of sales) in 2016 compared to $588.3 million (19.5% of sales) in 2015. Included in 2016 were net legal charges/credits of $48.5 million, acquisition-related costs of $12.2 million, gain on sale of fixed assets of $7.8 million, operational improvement initiative costs of $2.4 million and restructuring and other charges, net of $0.3 million. Included in 2015 were acquisition-related costs of $18.3 million, the reversal of the previously recorded provision for the Spanish capital tax case of $10.5 million, Restructuring and other charges, net of $7.6 million, accelerated contingent consideration payments of $7.2 million and operational improvement initiative costs of $1.1 million in 2015. Excluding these charges, adjusted operating profit was $623.0 million (20.0% of sales) for 2016 versus $612.1 million (20.2% of sales) for 2015. Foreign currency changes had an unfavorable impact on operating profit of approximately 2% and 6% in 2016 and 2015, respectively.
Cash flows from operations were $535.4 million or 17.2% of sales in 2016 as compared to cash flows from operations of $433.6 million, or 14.3% of sales, during 2015. The increase in operating cash flows in 2016 as compared to 2015 is principally related to the impact of decreased core working capital requirements (trade receivables, inventories and accounts payable) and lower pension contributions.
Our capital spend was $126.4 million (4.1% of sales, excluding David Michael) during 2016. Given our intent to construct a new flavors facility in China, the continuation of our Indonesia project, spending associated with the integrations of David Michael and Fragrance Resources, infrastructure needs in India, upgrades to creative center and application laboratory facilities and carryover payments from 2016, we expect that capital spending in 2017 will be about 5% of sales (net of potential grants and other reimbursements from government authorities).
33
Results of Operations
Year Ended December 31, | Change | ||||||||||||||||
(DOLLARS IN THOUSANDS EXCEPT PER SHARE AMOUNTS) | 2016 | 2015 | 2014 | 2016 vs. 2015 | 2015 vs. 2014 | ||||||||||||
Net sales | $ | 3,116,350 | $ | 3,023,189 | $ | 3,088,533 | 3.1 | % | (2.1 | )% | |||||||
Cost of goods sold | 1,717,280 | 1,671,590 | 1,726,383 | 2.7 | % | (3.2 | )% | ||||||||||
Gross profit | 1,399,070 | 1,351,599 | 1,362,150 | ||||||||||||||
Research and development (R&D) expenses | 254,263 | 246,101 | 253,640 | 3.3 | % | (3.0 | )% | ||||||||||
Selling and administrative (S&A) expenses | 566,224 | 494,517 | 507,563 | 14.5 | % | (2.6 | )% | ||||||||||
Restructuring and other charges, net | (1,700 | ) | 7,594 | 1,298 | (122.4 | )% | 485.1 | % | |||||||||
Amortization of acquisition-related intangibles | 23,763 | 15,040 | 7,328 | 58.0 | % | 105.2 | % | ||||||||||
Gain on sales of fixed assets | (10,836 | ) | — | — | 100 | % | — | % | |||||||||
Operating profit | 567,356 | 588,347 | 592,321 | ||||||||||||||
Interest expense | 52,989 | 46,062 | 46,067 | 15.0 | % | — | % | ||||||||||
Other (income) expense, net | (9,350 | ) | 3,184 | (2,807 | ) | (393.7 | )% | (213.4 | )% | ||||||||
Income before taxes | 523,717 | 539,101 | 549,061 | ||||||||||||||
Taxes on income | 118,686 | 119,854 | 134,518 | (1.0 | )% | (10.9 | )% | ||||||||||
Net income | $ | 405,031 | $ | 419,247 | $ | 414,543 | |||||||||||
Net income per share — diluted | $ | 5.05 | $ | 5.16 | $ | 5.06 | (2.1 | )% | 2.0 | % | |||||||
Gross margin | 44.9 | % | 44.7 | % | 44.1 | % | 20.0 | 60.0 | |||||||||
R&D as a percentage of sales | 8.2 | % | 8.1 | % | 8.2 | % | 10.0 | (10.0 | ) | ||||||||
S&A as a percentage of sales | 18.2 | % | 16.4 | % | 16.4 | % | 180.0 | — | |||||||||
Operating margin | 18.2 | % | 19.5 | % | 19.2 | % | (130.0 | ) | 30.0 | ||||||||
Adjusted operating margin (1) | 20.0 | % | 20.2 | % | 19.5 | % | (20.0 | ) | 70.0 | ||||||||
Effective tax rate | 22.7 | % | 22.2 | % | 24.5 | % | 50.0 | (230.0 | ) | ||||||||
Segment net sales | |||||||||||||||||
Flavors | $ | 1,496,525 | $ | 1,442,951 | $ | 1,457,055 | 3.7 | % | (1.0 | )% | |||||||
Fragrances | 1,619,825 | 1,580,238 | 1,631,478 | 2.5 | % | (3.1 | )% | ||||||||||
Consolidated | $ | 3,116,350 | $ | 3,023,189 | $ | 3,088,533 | |||||||||||
(1) | Adjusted operating margin for the twelve months ended December 31, 2016 excludes net legal charges/credits of $48.5 million, acquisition related costs of $12.2 million, gain on sale of assets of $7.8 million, operational improvement initiative costs of $2.4 million and restructuring and other charges, net of $0.3 million. |
Adjusted operating margin for the twelve months ended December 31, 2015 excludes acquisition related costs of $18.3 million, the reversal of the previously recorded provision for the Spanish capital tax case of $10.5 million, Restructuring and other charges, net of $7.6 million, accelerated contingent consideration payments of $7.2 million and operational improvement initiative costs of $1.1 million.
Adjusted operating margin for the twelve months ended December 31, 2014 excludes the operational improvement initiative costs of $2.5 million, Restructuring and other charges, net of $1.3 million and $5.1 million of accelerated depreciation included in Cost of goods sold related to the Fragrance Ingredients Rationalization and several locations in Asia.
Cost of goods sold includes the cost of materials and manufacturing expenses; raw materials generally constitute 70% of the total. R&D expenses relate to the development of new and improved molecules and technologies, technical product support and compliance with governmental regulations. S&A expenses include expenses necessary to support our commercial activities and administrative expenses principally associated with staff groups that support our overall operating activities.
2016 IN COMPARISON TO 2015
Sales
Sales for 2016 totaled $3.1 billion, an increase of 3% from the prior year. Excluding currency impacts, sales increased 5%. Sales growth reflected new win performance (net of losses) in both Flavors and Fragrance Compounds. On both a reported and currency neutral basis, the effect of acquisitions was approximately 2% to net sales amounts. In addition, Fragrance
34
Ingredients sales were up 9% on a reported basis and 10% on a currency neutral basis, driven entirely by the impact of acquisitions. Overall organic sales growth includes 1% growth from both developed and emerging markets and on a currency neutral basis, 4% growth from emerging markets and 1% growth from developed markets, respectively.
Flavors Business Unit
Flavors sales in 2016 increased 4% on a reported basis and 6% on a currency neutral basis versus the prior year period. Acquisitions accounted for approximately 3% of the net sales growth on both a reported and currency neutral basis. Overall growth was primarily driven by to mid single-digit growth in Savory, Sweet and Dairy combined with low single-digit growth in Beverage. Regionally, the Flavors business delivered reported and currency neutral growth across all regions. Sales growth was led by NOAM, driven by high single-digit gains in Sweet and low single-digit gains in Beverage and Dairy. Sales growth in GA was driven by mid single-digit gains in Savory, Beverage and Sweet and high single-digit gains in Dairy. Sales growth in EAME was driven by mid single-digit gains in Savory and Sweet and high single-digit gains in Dairy. LA sales growth was primarily driven by double-digit growth in Savory and Dairy and high single-digit growth in Sweet. EAME performance continues to be led by our performance in the emerging market countries within the region. Globally, Flavors growth included mid single-digit growth in emerging markets. Overall, emerging markets represented approximately 52% of total Flavors sales.
Fragrances Business Unit
Fragrances sales in 2016 increased 3% on a reported basis and 4% on a currency neutral basis. Acquisitions accounted for approximately 2% of both reported and currency neutral sales growth. Year-over-year, 2016 sales performance was led by high single-digit growth in Fragrance Ingredients (which was driven entirely by the impact of acquisitions) and mid single-digit growth in Fabric Care, Home Care and Personal Wash. Sales growth within the regions was led by GA reflecting double-digit gains in Fragrance Ingredients and Fabric Care and high single-digit growth in Personal Wash. NOAM sales growth reflected double-digit gains in Fragrance Ingredients, Fabric Care and Home Care categories, which more than offset low single-digit declines in Fine Fragrance. EAME sales growth reflected double-digit gains in Fragrance Ingredients and Hair Care and low single-digit gains in Fabric Care. LA sales declined reflecting double-digit declines in Fragrance Ingredients as well as high single-digit declines in Hair Care and mid single-digit declines in Fabric Care and Home Care which more than offset double-digit gains in Personal Wash. Excluding the effects of acquisitions, Fragrance Ingredients sales declined low single-digits. Globally, Fragrances growth included low single-digit growth in emerging markets. Overall, emerging markets represented 48% of total Fragrances sales.
Sales Performance by Region and Category
% Change in Sales — 2016 vs 2015 | ||||||||||||||||||
Fine Fragrances | Consumer Fragrances | Ingredients | Total Frag. | Flavors | Total | |||||||||||||
NOAM | Reported | -2 | % | 8 | % | 10 | % | 6 | % | 8 | % | 7 | % | |||||
EAME | Reported | -1 | % | 1 | % | 13 | % | 3 | % | 1 | % | 2 | % | |||||
Currency Neutral(1) | 0 | % | 2 | % | 14 | % | 4 | % | 5 | % | 4 | % | ||||||
LA | Reported | -6 | % | -5 | % | -15 | % | -6 | % | 1 | % | -3 | % | |||||
Currency Neutral(1) | -3 | % | -3 | % | -13 | % | -4 | % | 5 | % | -1 | % | ||||||
GA | Reported | 0 | % | 6 | % | 13 | % | 7 | % | 4 | % | 5 | % | |||||
Currency Neutral(1) | 2 | % | 7 | % | 11 | % | 8 | % | 6 | % | 6 | % | ||||||
Total | Reported | -2 | % | 2 | % | 9 | % | 3 | % | 4 | % | 3 | % | |||||
Currency Neutral(1) | -1 | % | 3 | % | 10 | % | 4 | % | 6 | % | 5 | % | ||||||
_______________________
(1) | Currency neutral sales growth is calculated by translating prior year sales at the exchange rates for the corresponding 2016 period. |
• | NOAM Flavors sales growth, which included the impact of acquisitions, primarily reflected high single-digit gains in Sweet and low single-digit gains in Beverage and Dairy. Total Fragrances sales growth reflected double-digit gains in Fragrance Ingredients (driven entirely by the impact of acquisitions), Fabric Care and Home Care categories, which more than offset low single-digit declines in Fine Fragrance. |
• | EAME Flavors sales growth primarily reflected mid single-digit gains in Savory and Sweet and high single-digit gains in Dairy. EAME total Fragrances sales growth was driven by double-digit gains in Fragrance Ingredients (driven entirely by the impact of acquisitions) and Hair Care and low single-digit gains in Fabric Care. |
• | LA Flavors sales growth was driven by double-digit growth in Savory and Dairy and high single-digit growth in Sweet. LA total Fragrances sales declined reflecting double-digit declines in Fragrance Ingredients as well as high |
35
single-digit declines in Hair Care and mid single-digit declines in Fabric Care and Home Care which more than offset double-digit gains in Personal Wash.
• | GA Flavors sales growth was led by mid single-digit gains in Savory, Beverage and Sweet and high single-digit gains in Dairy. GA total Fragrances sales growth primarily reflected double-digit gains in Fragrance Ingredients (driven entirely by the impact of acquisitions) and Fabric Care and high single-digit growth in Personal Wash. |
Cost of Goods Sold
Cost of goods sold, as a percentage of sales, decreased 20 bps, to 55.1% in 2016 compared to 55.3% in 2015. Included in cost of goods sold was $7.6 million of acquisition-related inventory "step-up" costs, $2.4 million of costs associated with operational improvement initiatives and $0.7 million of costs related to accelerated depreciation in 2016 and $6.8 million of acquisition-related inventory "step-up" costs and $1.1 million of costs related to operational improvement initiatives included in 2015.
Research and Development (R&D)
R&D expenses, as a percentage of sales, remained relatively consistent with the prior year period at 8.2% in 2016 compared to 8.1% in 2015. The slight increase in 2016 was principally driven by slightly higher salary costs and, to a lesser extent, the effect of recent acquisitions.
Selling and Administrative (S&A)
S&A, as a percentage of sales, increased 180 bps to 18.2% versus 16.4% (or 16.4% and 16.1% on an adjusted basis in 2016 and 2015, respectively). Included in 2016 were net legal charges/credits, principally related to litigation accrual, of $48.5 million, acquisition-related costs of $4.5 million and severance costs related to the termination of a former executive officer of $1.4 million, compared to acquisition related costs of $11.5 million, accelerated contingency payments of $7.2 million and the reversal of the previously recorded provision related to the Spanish capital tax case of $10.5 million included in 2015. Additionally, during 2016, costs were higher as a result of legal and professional fees associated with various finance initiatives and the effect of recently acquired companies, offset by slightly lower salary costs and the effect of foreign currency.
Restructuring and Other Charges
Restructuring and other charges primarily consist of separation costs for employees, including severance, outplacement and other benefit costs.
Restructuring Charges (In Thousands) | |||||||
2016 | 2015 | ||||||
Flavors | $ | (1,119 | ) | $ | 4,198 | ||
Fragrances | (581 | ) | 1,347 | ||||
Global | — | 2,049 | |||||
Total | $ | (1,700 | ) | $ | 7,594 | ||
2015 Severance and Contingent Consideration Charges
During the fourth quarter of 2015, the Company established a series of initiatives intended to streamline its management structure, simplify decision-making and accountability, better leverage and align its capabilities across the organization and improve efficiency of its global manufacturing and operations network. As a result, in 2015, the Company recorded a pre-tax charge of $7.6 million, included in Restructuring and other charges, net, related to severance and related costs pertaining to approximately 150 positions that will be affected. During 2016, the Company made payments of $2.9 million and recorded accelerated depreciation expense of $0.7 million. In addition, during 2016, the Company recorded a credit of $1.7 million related to the reversal of severance accruals that were determined to be no longer required. The total cost of the plan is now expected to be approximately $8.8 million with the remaining charges related principally to accelerated depreciation. The Company expects the plan to be fully completed in the second half of 2017.
Separately, in 2015, the Company recorded a charge of $7.2 million, included in Selling and administrative expenses, associated with the acceleration from 2016 to 2015 of contingent consideration payments from the Aromor acquisition that were triggered by certain of the management structure changes noted above.
2017 Productivity Program
On February 15, 2017, the Company announced that it was adopting a multi-year productivity program designed to improve overall financial performance, provide flexibility to invest in growth opportunities and drive long-term value creation. In connection
36
with this program, the Company expects to optimize its global footprint and simplify its organizational structures globally. In connection with this initiative, the Company expects to incur cumulative, pre-tax cash charges of between $30-$35 million, consisting primarily of $21-$22 million in personnel-related costs and an estimated $9-$13 million in facility-related costs, such as lease termination, and integration-related costs. In addition, the Company may incur up to $5 million of accelerated depreciation. Approximately $10 million of these charges are expected to be recorded in the first quarter of 2017, with the remainder of the personnel-related costs expected to be recognized by the end of 2017 and the other costs expected to be recognized over the following seven quarters. The overall charges are split approximately evenly between Flavors and Fragrances. This initiative is expected to result in the reduction of approximately 370 members of the Company’s global workforce in various parts of the organization. Once fully implemented, the Company expects to realize annual run-rate savings of between $40 million and $45 million from this program by 2019.
Amortization of Acquisition-Related Intangibles
Amortization expenses increased to $23.8 million in 2016 compared to $15.0 million in 2015. The increase of $8.7 million is principally due a full year of amortization in 2016 related to the acquisitions of Ottens Flavors and Lucas Meyer as compared to 2015 as well as the acquisition of David Michael in 2016.
Operating Results by Business Unit
We evaluate the performance of business units based on segment profit which is defined as operating profit before Restructuring and certain non-recurring items, Interest expense, Other expense, net and Taxes on income. See Note 13 to our Consolidated Financial Statements for the reconciliation to Income before taxes.
For the Year Ended December 31, | |||||||
(DOLLARS IN THOUSANDS) | 2016 | 2015 | |||||
Segment profit: | |||||||
Flavors | $ | 337,242 | $ | 318,476 | |||
Fragrances | 334,220 | 321,764 | |||||
Global Expenses | (48,487 | ) | (28,180 | ) | |||
Restructuring and other charges, net | (322 | ) | (7,594 | ) | |||
Gain on sales of fixed assets | 7,818 | — | |||||
Spanish capital tax charge reversal | — | 10,530 | |||||
Operational improvement initiative costs | (2,402 | ) | (1,115 | ) | |||
Acquisition related costs | (12,195 | ) | (18,342 | ) | |||
Accelerated contingent consideration | — | (7,192 | ) | ||||
Legal charges/credits, net | (48,518 | ) | — | ||||
Operating Profit | $ | 567,356 | $ | 588,347 | |||
Profit margin | |||||||
Flavors | 22.5 | % | 22.1 | % | |||
Fragrances | 20.6 | % | 20.4 | % | |||
Consolidated | 18.2 | % | 19.5 | % | |||
Flavors Business Unit
Flavors segment profit increased $18.8 million to $337.2 million in 2016 (22.5% of sales) from $318.5 million (22.1% of sales) in the comparable 2015 period. The increase in segment profit and profit margin principally reflects productivity initiatives and solid top-line growth.
Fragrances Business Unit
Fragrances segment profit increased $12.5 million to $334.2 million in 2016 (20.6% of sales), compared to $321.8 million (20.4% of sales) reported in 2015. The increase in segment profit and profit margin was principally driven by volume growth and the benefits from cost and productivity initiatives.
Global Expenses
Global expenses represent corporate and headquarter-related expenses which include legal, finance, human resources and R&D and other administrative expenses that are not allocated to an individual business unit. In 2016, Global expenses were
37
$48.5 million compared to $28.2 million during 2015. The increase is principally driven by lower gains on our cash flow hedging program and higher incentive compensation costs.
Interest Expense
In 2016, interest expense increased $6.9 million to $53.0 million, compared to $46.1 million in 2015 reflecting the impact of borrowings under the Euro Senior Notes - 2016. Average cost of debt was 3.8% for the 2016 period compared to 4.5% in 2015.
Other (Income) Expense, Net
Other (income) expense, net increased approximately $12.5 million to $9.4 million of income in 2016 versus $3.2 million of expense in 2015. The increase was largely driven by gains on foreign currency of approximately $5.0 million in the current year versus losses of approximately $6.0 million in the prior year.
Income Taxes
The effective tax rate was 22.7% in 2016 as compared to 22.2% in 2015. Excluding $17.1 million, $4.1 million, $0.6 million and $0.1 million of tax benefits associated with pretax legal charges/credits, net, acquisition-related costs, operational improvement initiatives and restructuring related costs, respectively, as well as a $2.7 million tax charge related to the gain on sale of property, the adjusted tax rate for 2016 was 23.8%. Excluding $6.2 million, $2.3 million and $0.3 million of tax benefits associated with pretax acquisition-related costs, restructuring charges and operational improvement initiatives, respectively, a $10.5 million tax settlement received in 2015 due to favorable tax rulings in Spain and another jurisdiction as well as a $2.9 million charge related to the reversal of the previously recorded provision for the Spanish capital tax case, the adjusted tax rate for 2015 was 24.2%. The year-over-year reduction reflects a benefit from lower cost of repatriation and mix of earnings, which were partially offset by loss provisions.
2015 IN COMPARISON TO 2014
Sales
Sales for 2015 totaled $3.0 billion, a decrease of 2% from the prior year. Excluding currency impacts, sales increased 5%. Sales growth reflects new win performance (net of losses) in both Flavors and Fragrance Compounds, partially offset by volume erosion on existing business principally driven by our customers' product line rationalization and inventory management efforts. In addition, our Flavors business was negatively impacted by volume erosion in North America (NOAM) as well as weak demand and lost business in China (principally associated with facility issues). On both a reported and currency neutral basis, the effect of acquisitions was approximately 2% to net sales amounts. Fragrance Ingredients sales declined 5% on a reported basis but were up 2% on a currency neutral basis. Overall organic sales growth includes declines of 1% and 7% from emerging markets and developed markets, respectively, compared to currency neutral sales growth of 5% and 1% from emerging markets and developed markets, respectively.
Flavors Business Unit
Flavors sales in 2015 decreased 1% on a reported basis but increased 6% on a currency neutral basis versus the prior year period. Acquisitions accounted for the majority of net sales growth on a reported basis and approximately half of the net sales growth on a currency neutral basis. Overall sales growth was primarily due to mid single-digit growth in Beverage combined with high single-digit growth in Dairy and low single-digit growth in Savory. Regionally, the Flavors business delivered reported sales growth in NOAM and LA but had currency neutral growth across all regions. Sales growth was led by NOAM which was primarily driven by high double-digit growth in Sweet and Dairy and double-digit growth in Beverage. LA sales growth was driven by double-digit gains in Beverage, Savory and Dairy. GA sales included low single-digit gains in Savory and Dairy and low single-digit declines in Sweet, offset by the effects of currency. EAME sales included mid single-digit gains in Savory and Beverage, offset by the effects of currency. EAME performance continued to be led by our performance in the emerging market countries within the region. Globally, Flavors growth was led by mid single-digit growth in emerging markets. Overall, emerging markets represented approximately 52% of total Flavors sales.
Fragrances Business Unit
Fragrances sales in 2015 declined 3% on a reported basis but increased 4% on a currency neutral basis. Acquisitions accounted for approximately 1% of both reported and currency neutral sales growth. Year-over-year, 2015 sales performance was led by double-digit growth in Fabric Care, high single-digit growth in Home Care, mid single-digit growth in Hair Care and low single-digit growth in Fragrance Ingredients and Fine Fragrance. Sales in EAME included double-digit gains in Fabric Care and mid single-digit growth in Fine Fragrance and Fragrance Ingredients, offset by the effects of currency. LA sales growth reflected double-digit gains in Fabric Care, Home Care and Hair Care categories as well as low single-digit gains in Fragrance Ingredients, which offset mid single-digit declines in Fine Fragrance. GA sales growth reflected high single-digit
38
gains in Fragrance Ingredients and mid single-digit gains in Fabric Care, offset by the effects of currency. NOAM sales declined driven by double-digit declines in Toiletries, high single-digit declines in Fragrance Ingredients and mid single-digit declines in Fine Fragrance which more than offset mid to high single-digit gains in Home Care and Fabric Care. Overall, emerging markets represented 49% of total Fragrances sales.
Sales Performance by Region and Category
% Change in Sales — 2015 vs 2014 | ||||||||||||||||||
Fine Fragrances | Consumer Fragrances | Ingredients | Total Frag. | Flavors | Total | |||||||||||||
NOAM | Reported | -5 | % | 1 | % | -7 | % | -2 | % | 11 | % | 4 | % | |||||
EAME | Reported | -9 | % | -8 | % | -7 | % | -8 | % | -11 | % | -9 | % | |||||
Currency Neutral(1) | 6 | % | 8 | % | 4 | % | 7 | % | 4 | % | 5 | % | ||||||
LA | Reported | -10 | % | 7 | % | 1 | % | 2 | % | 7 | % | 4 | % | |||||
Currency Neutral(1) | -5 | % | 10 | % | 3 | % | 6 | % | 16 | % | 9 | % | ||||||
GA | Reported | -2 | % | — | % | 3 | % | — | % | -3 | % | -2 | % | |||||
Currency Neutral(1) | -1 | % | 2 | % | 8 | % | 3 | % | 2 | % | 2 | % | ||||||
Total | Reported | -8 | % | -1 | % | -5 | % | -3 | % | -1 | % | -2 | % | |||||
Currency Neutral(1) | 1 | % | 5 | % | 2 | % | 4 | % | 6 | % | 5 | % | ||||||
_______________________
(1) | Currency neutral sales growth is calculated by translating prior year sales at the exchange rates for the corresponding 2015 period. |
• | NOAM Flavors sales growth, which included the impact of acquisitions, primarily reflected high double-digit growth in Sweet and Dairy and double-digit growth in Beverage. NOAM total Fragrances sales declined driven by double-digit declines in Toiletries, high single-digit declines in Fragrance Ingredients and mid single-digit declines in Fine Fragrance, which more than offset mid single-digit gains in Home Care and Fabric Care. |
• | EAME Flavors sales growth primarily reflected mid single-digit gains in Savory and Beverage. EAME total Fragrances sales growth was driven by double-digit gains in the Fabric Care and mid single-digit growth in Fine Fragrance and Fragrance Ingredients, offset by the effects of currency, which included the impact of acquisitions. |
• | LA Flavors sales growth was driven by double-digit gains in Beverage, Savory and Dairy. LA total Fragrances sales growth reflected double-digit gains in Fabric Care, Home Care and Hair Care categories as well as low single-digit gains in Fragrance Ingredients, which offset mid single-digit declines in Fine Fragrance. |
• | GA Flavors sales growth was led by low single-digit gains in Savory and Dairy, which more than offset low single-digit declines in Sweet. GA total Fragrances sales growth primarily reflected high single-digit gains in Fragrance Ingredients and mid single-digit gains in Fabric Care, offset by the effects of currency. |
Cost of Goods Sold
Cost of goods sold, as a percentage of sales, decreased 60 bps, to 55.3% in 2015 compared to 55.9% in 2014. Included in cost of goods sold was $7.9 million of acquisition-related costs (including $6.8 million of inventory "step-up" costs) and operational improvement initiative costs in 2015 and $7.6 million of charges related to restructuring and operational improvement initiative costs in 2014.
Research and Development (R&D)
R&D expenses, as a percentage of sales, decreased slightly from the prior year period at 8.1% in 2015 compared to 8.2% in 2014. The decrease was principally driven by lower incentive compensation expense in 2015.
Selling and Administrative (S&A)
S&A, as a percentage of sales, remained consistent at 16.4% in 2015 and 2014. 2015 S&A expenses included acquisition-related expenses and a charge of $7.2 million related to the accelerated contingent consideration payments from the Aromor acquisition, offset by lower incentive compensation expense and the reversal of the previously recorded provision related to the Spanish capital tax case of $10.5 million.
Restructuring and Other Charges
Restructuring and other charges primarily consist of separation costs for employees, including severance, outplacement and other benefit costs.
39
Restructuring Charges (In Thousands) | |||||||
2015 | 2014 | ||||||
Flavors | $ | 4,198 | $ | — | |||
Fragrances | 1,347 | 1,298 | |||||
Global | 2,049 | — | |||||
Total | $ | 7,594 | $ | 1,298 | |||
2015 Severance and Contingent Consideration Charges
During the fourth quarter of 2015, we established a series of initiatives that were expected to streamline our management structure, simplify decision-making and accountability, better leverage and align our capabilities across the organization and improve efficiency of our global manufacturing and operations network. As a result, we recorded a pre-tax charge of $7.6 million, included in restructuring and other charges, net, related to severance and related costs pertaining to approximately 150 positions that will be affected. The Company expects the plan to be fully completed in the second half of 2017.
Separately, we recorded a charge of $7.2 million, included in Selling and administrative expenses, associated with the acceleration from 2016 to 2015 of contingent consideration payments from the Aromor acquisition that were triggered by certain of the management structure changes noted above.
Fragrance Ingredients Rationalization - 2014
In 2014, we closed our fragrance ingredients manufacturing facility in Augusta, Georgia and consolidated production into other Company facilities. In connection with this closure, we incurred charges of $13.8 million, consisting primarily of $10.3 million in accelerated depreciation of fixed assets, $2.2 million in personnel-related costs and $1.3 million in plant shutdown and other related costs. We recorded total charges of $7.4 million during 2013, consisting of $2.2 million of pre-tax charges related to severance included in Restructuring and other charges, net and $5.2 million of non-cash charges related to accelerated depreciation included in Cost of goods sold. During 2014, we recorded $1.3 million of plant shutdown and other related costs included in Restructuring and other charges, net as well as an additional $5.1 million of non-cash charges related to accelerated depreciation included in Cost of goods sold. As a result of this closure, 43 positions were eliminated. During 2015, we recorded a net credit of $0.5 million principally related to the reversal of severance accruals.
Amortization of Acquisition-Related Intangibles
Amortization expenses increased to $15.0 million in 2015 compared to $7.3 million in 2014. The increase of $7.7 million was driven by the acquisitions of Ottens Flavors and Lucas Meyer in 2015.
40
Operating Results by Business Unit
We evaluate the performance of business units based on segment profit which is defined as operating profit before Restructuring and certain non-recurring items, Interest expense, Other expense, net and Taxes on income. See Note 13 to our Consolidated Financial Statements for the reconciliation to Income before taxes.
For the Year Ended December 31, | |||||||
(DOLLARS IN THOUSANDS) | 2015 | 2014 | |||||
Segment profit: | |||||||
Flavors | $ | 318,476 | $ | 331,257 | |||
Fragrances | 321,764 | 335,447 | |||||
Global Expenses | (28,180 | ) | (65,443 | ) | |||
Restructuring and other charges, net | (7,594 | ) | (1,298 | ) | |||
Spanish capital tax charge reversal | 10,530 | — | |||||
Operational improvement initiative costs | (1,115 | ) | (7,642 | ) | |||
Acquisition related costs | (18,342 | ) | — | ||||
Accelerated contingent consideration | (7,192 | ) | — | ||||
Operating Profit | $ | 588,347 | $ | 592,321 | |||
Profit margin | |||||||
Flavors | 22.1 | % | 22.7 | % | |||
Fragrances | 20.4 | % | 20.6 | % | |||
Consolidated | 19.5 | % | 19.2 | % | |||
Flavors Business Unit
Flavors segment profit decreased $12.8 million to $318.5 million in 2015 (22.1% of sales) from $331.3 million (22.7% of sales) in the comparable 2014 period. The decrease in segment profit and profit margin was driven by unfavorable foreign currency impacts, scale up costs of new sites in Turkey and Indonesia and other one-off costs, including incremental operating costs associated with the China Flavors facility. These costs were only partially offset by favorable volume growth, productivity initiatives, sales mix and a slight impact from the addition of Ottens Flavors.
Fragrances Business Unit
Fragrances segment profit decreased $13.7 million to $321.8 million in 2015 (20.4% of sales), compared to $335.4 million (20.6% of sales) reported in 2014. The decrease in segment profit and profit margin was principally driven by unfavorable foreign currency impacts, which were partially offset by favorable volume growth, sales mix and a slight impact from the addition of Lucas Meyer.
Global Expenses
Global expenses represent corporate and headquarter-related expenses which include legal, finance, human resources and R&D and other administrative expenses that are not allocated to an individual business unit. In 2015, Global expenses were $28.2 million compared to $65.4 million during 2014. The decrease is principally driven by lower incentive compensation expense and the favorable impact of our cash flow hedging program.
Interest Expense
In 2015, interest expense remained comparable with the prior year at $46.1 million. Average cost of debt was 4.5% for the 2015 period compared to 4.9% in 2014.
Other Expense (Income), Net
Other expense (income), net decreased approximately $6.0 million to $3.2 million of expense in 2015 versus $2.8 million of income in 2014. This decrease is primarily driven by lower foreign exchange gains on working capital and lower mark-to-market adjustments on deferred compensation plan assets during 2015 compared to the 2014 period.
Income Taxes
The effective tax rate was 22.2% in 2015 as compared to 24.5% in 2014. Excluding the $2.6 million tax benefit associated with the pretax restructuring charges and operational improvement initiatives, the $6.2 million benefit associated with acquisition related costs, the $10.5 million tax settlement received in 2015 due to favorable tax rulings in Spain and
41
another jurisdiction as well as the $2.9 million charge related to the reversal of the previously recorded provision for the Spanish capital tax case, the adjusted tax rate for 2015 was 24.2%. Excluding the $2.6 million tax benefit associated with the pretax restructuring charges and operational improvement initiative costs as well as the $3.8 million tax benefit related to the reserve reversal for the 2001 Spanish dividend withholding tax case, the adjusted tax rate for 2014 was 25.3%. The year-over-year reduction reflected a benefit from lower cost of repatriation and loss provisions which were partially offset by mix of earnings.
Liquidity and Capital Resources
CASH AND CASH EQUIVALENTS
We had cash and cash equivalents of $324.0 million at December 31, 2016 compared to $182.0 million at December 31, 2015, of which $252.6 million of the balance at December 31, 2016 was held outside the United States. Cash balances held in foreign jurisdictions are, in most circumstances, available to be repatriated to the United States; however, they would be subject to United States federal income taxes, less applicable foreign tax credits. We have not provided U.S. income tax expense on substantially all of the accumulated undistributed earnings of our foreign subsidiaries because we have the ability and plan to reinvest these indefinitely.
Effective utilization of the cash generated by our international operations is a critical component of our tax strategy. Strategic dividend repatriation from foreign subsidiaries creates U.S. taxable income, which enables us to realize U.S. deferred tax assets. We regularly repatriate, in the form of dividends from our non-U.S. subsidiaries, a portion of our current year earnings to fund financial obligations in the U.S. These repatriations of current year earnings totaled $134.5 million, $184.6 million and $248.0 million in 2016, 2015 and 2014, respectively.
CASH FLOWS FROM OPERATING ACTIVITIES
Operating cash flows in 2016 were $535.4 million compared to $433.6 million in 2015 and $518.4 million in 2014. The increase in operating cash flows in 2016 as compared to 2015 is principally related to the impact of decreased core working capital requirements (trade receivables, inventories and accounts payable) and lower pension contributions. Included in 2014 was payment of $11.2 million to the Spanish government related to a capital tax case.
Working capital (current assets less current liabilities) totaled $710.7 million at year-end 2016 compared to $712.0 million at December 31, 2015. This slight decrease in working capital of $1.3 million primarily reflects an increase in payable balances principally associated with short-term debt which were partially offset by increased cash balances as a result of our borrowings under the Euro Senior Notes - 2016. We sold certain accounts receivable on a non-recourse basis to unrelated financial institutions under “factoring” agreements that are sponsored, solely and individually, by certain customers. We believe that participating in the factoring programs strengthens our relationships with these customers and provides operational efficiencies. We estimate that, as a result of participating in the programs, there was a beneficial impact on cash provided by operations of approximately $34.0 million, $3.4 million and $33.1 million in 2016, 2015 and 2014, respectively. The cost of participating in these programs was immaterial to our results in all periods.
CASH FLOWS USED IN INVESTING ACTIVITIES
Net investing activities in 2016 utilized $355.5 million compared to $577.2 million and $221.3 million in 2015 and 2014, respectively. The decrease in cash paid for investing activities is primarily driven by the acquisition of David Michael in 2016 for approximately $236.9 million (net of cash acquired) as compared to the acquisitions of Ottens Flavors and Lucas Meyer for approximately $188.5 million (net of cash acquired) and $305.1 million (net of cash acquired), respectively, in 2015. The 2014 amount was principally driven by the acquisition of Aromor for approximately $102.5 million (net of cash acquired).
Additions to property, plant and equipment were $126.4 million, $101.0 million and $143.2 million in 2016, 2015 and 2014, respectively (net of grants and other reimbursements from government authorities). These investments largely arise from our ongoing focus to align our manufacturing facilities with our customer demand, primarily in emerging markets and new technology consistent with our strategy.
In light of our intent to construct a new flavors facility in China, our relocation of our Ingredients facility in Hangzhou, China and the continuation of our Indonesia project we expect that capital spending in 2017 will be about 5% of sales (net of potential grants and other reimbursements from government authorities).
CASH FLOWS USED IN FINANCING ACTIVITIES
Net financing activities in 2016 utilized $19.7 million compared to $131.3 million and $202.3 million in 2015 and 2014, respectively. The decrease in outflow of cash used in financing activities in 2016 as compared to 2015 principally reflects borrowings under the Euro Senior Notes - 2016 which were offset by repayment of our Senior Notes - 2006 as well as higher
42
dividend payments and treasury share repurchases in 2016. The decrease in outflow of cash used in financing activities in 2015 compared to 2014 principally reflected incremental dividend payments and treasury share repurchases in 2015 which were more than offset by proceeds from the drawdown on the revolving credit facility during 2015.
At December 31, 2016, we had $1,325.4 million of debt outstanding compared to $1,067.7 million outstanding at December 31, 2015.
We paid dividends totaling $184.9 million, $158.9 million and $133.2 million in 2016, 2015 and 2014, respectively. The cash dividend declared per share in 2016, 2015 and 2014 was $2.40, $2.06 and $1.72, respectively.
In December 2012, the Board of Directors authorized a $250 million share repurchase program, which commenced in the first quarter of 2013. In August 2015, the Board of Directors approved an additional $250 million share repurchase authorization and extension through December 31, 2017. Based on the total remaining amount of $109 million available under the repurchase program, approximately 0.9 million shares, or 1.2% of shares outstanding (based on the market price and shares outstanding as of December 31, 2016) could be repurchased under the program as of December 31, 2016. The purchases will be made from time to time on the open market or through private transactions as market and business conditions warrant. Repurchased shares will be placed into treasury stock. The ultimate level of purchases will be a function of the daily purchase limits established in the pre-approved program according to the share price at that time.
CAPITAL RESOURCES
Operating cash flow provides the primary source of funds for capital investment needs, dividends paid to shareholders and debt service repayments. We anticipate that cash flows from operations and availability under our existing credit facilities are sufficient to meet our investing and financing needs for at least the next eighteen months. We regularly assess our capital structure, including both current and long-term debt instruments, as compared to our cash generation and investment needs in order to provide ample flexibility and to optimize our leverage ratios. Based on our leverage ratios and general market interest rate expectations, we anticipate evaluating refinancing opportunities during 2017. We believe our existing cash balances are sufficient to meet our debt service requirements.
During the first quarter of 2017, we acquired Fragrance Resources for approximately $143.3 million (net of cash acquired), which was funded from existing resources.
During the fourth quarter of 2016, we acquired David Michael for approximately $236.9 million (net of cash acquired), which was funded from existing resources.
During the third quarter of 2015, we acquired Lucas Meyer for approximately $305.1 million (net of cash acquired), which was funded from existing resources.
During the second quarter of 2015, we acquired Ottens Flavors for approximately $188.5 million (net of cash acquired), which was funded from existing resources.
Credit Facility and Senior Notes
We supplement short-term liquidity with access to capital markets, mainly through bank credit facilities and issuance of commercial paper.
Commercial Paper
During 2016, we issued approximately $65 million of commercial paper, which was fully repaid by December 31, 2016. As of December 31, 2016, there was no commercial paper outstanding. We did not issue commercial paper during 2015.
Subsequent to December 31, 2016, we issued approximately $87.5 million of commercial paper.
Credit Facility
There are two tranches under the credit facility. Tranche A of the Facility is now available to borrowers in U.S. dollars, euros, Swiss francs, Japanese yen and British sterling in an aggregate amount up to an equivalent of approximately $564.1 million, with a sublimit of $25 million for swing line borrowings. Tranche B of the Facility is now available to borrowers in U.S. dollars, euros, Swiss francs, Japanese yen and British sterling in an aggregate amount up to an equivalent of approximately $385.9 million, with sublimits of €50 million and $25 million for swing line borrowings.
The credit facility is available for general corporate purposes. Borrowings under the credit facility bear interest at an annual rate of LIBOR plus a margin, currently 112.5 bps, linked to our credit rating. The interest rate under our credit facility at
43
December 31, 2016 was 1.13%. The credit facility contains various affirmative and negative covenants, including the requirement for us to maintain, at the end of each fiscal quarter, a ratio of net debt for borrowed money to adjusted EBITDA in respect of the previous 12-month period of not more than 3.50 to 1. Based on this ratio, at December 31, 2016 our covenant compliance would provide overall borrowing capacity of $1,647.3 million.
During the first quarter of 2016, the Company repaid the full amount outstanding under the credit facility ($131.2 million).
As of December 31, 2016 we had no borrowings under the credit facility. The amount which we are able to draw down on under the credit facility is limited by financial covenants as described in more detail below. Our drawdown capacity on the credit facility was $950 million at December 31, 2016. See Note 9 to the Consolidated Financial Statements for further information on the credit facility.
At December 31, 2016 and 2015 we were in compliance with all financial and other covenants, including the net debt to adjusted EBITDA ratio. At December 31, 2016 our Net Debt/adjusted EBITDA(1) ratio was 1.32 to 1 as defined by the credit facility, well below the financial covenants of existing outstanding debt. Failure to comply with the financial and other covenants under our debt agreements would constitute default and would allow the lenders to accelerate the maturity of all indebtedness under the related agreement. If such acceleration were to occur, we would not have sufficient liquidity available to repay the indebtedness. We would likely have to seek amendments under the agreements for relief from the financial covenants or repay the debt with proceeds from the issuance of new debt or equity, and/or asset sales, if necessary. We may be unable to amend the agreements or raise sufficient capital to repay such obligations in the event the maturities are accelerated.
_______________________
(1) | Adjusted EBITDA and Net Debt, which are non-GAAP measures used for these covenants, are calculated in accordance with the definition in the debt agreements. In this context, these measures are used solely to provide information on the extent to which we are in compliance with debt covenants and may not be comparable to adjusted EBITDA and Net Debt used by other companies. Reconciliations of adjusted EBITDA to net income and net debt to total debt are as follows: |
(DOLLARS IN MILLIONS) | Twelve Months Ended December 31, 2016 | ||
Net income | $ | 405.0 | |
Interest expense | 53.0 | ||
Income taxes | 118.7 | ||
Depreciation and amortization | 102.5 | ||
Specified items(1) | 63.4 | ||
Non-cash items(2) | 13.8 | ||
Adjusted EBITDA | $ | 756.4 | |
_______________________
(1) | Specified items for the 12 months ended December 31, 2016 of $63.4 million consist of legal charges/credits principally related to litigation accrual, acquisition-related costs, restructuring charges and operational improvement initiative costs. |
(2) | Non-cash items represent all other adjustments to reconcile net income to net cash provided by operations as presented on the Statement of Cash Flows, including gain on disposal of assets and stock-based compensation. |
(DOLLARS IN MILLIONS) | December 31, 2016 | ||
Total debt | $ | 1,325.4 | |
Adjustments: | |||
Deferred gain on interest rate swaps | (1.3 | ) | |
Cash and cash equivalents | (324.0 | ) | |
Net debt | $ | 1,000.1 | |
Senior Notes
Euro Senior Notes - 2016. On March 14, 2016, we issued Euro 500.0 million face amount of 1.75% Senior Notes ("Euro Senior Notes - 2016") due 2024 at a discount of Euro 0.9 million. The Company received proceeds related to the issuance of these Euro Senior Notes - 2016 of Euro 496.0 million which was net of the Euro 0.9 million discount and Euro 3.1 million underwriting discount (recorded as deferred financing costs). The Euro Senior Notes - 2016 bear interest at a rate of 1.75% per annum, with interest payable on March 14 of each year, commencing on March 14, 2017. The Euro Senior Notes - 2016 will mature on March 14, 2024. See Note 9 to the Consolidated Financial Statements for further information on the Senior Notes - 2013.
44
Senior Notes - 2013. In April 2013, we issued $300.0 million face amount of 3.20% Senior Notes (“Senior Notes - 2013”) due 2023 at a discount of $0.3 million, to take advantage of attractive borrowing rates and maintain efficiency and flexibility in our capital structure, and received proceeds of $297.8 million. The Senior Notes -2013 bear interest at a rate of 3.20% per year, with interest payable on May 1 and November 1 of each year, commencing on November 1, 2013. See Note 9 to the Consolidated Financial Statements for further information on the Senior Notes - 2013.
Senior Notes - 2007. In September 2007, we issued an aggregate of $500.0 million of senior unsecured notes in four series, with $250.0 million due in 2017, $100.0 million due in 2019, $50 million due in 2022 and $100.0 million due in 2027. See Note 9 to the Consolidated Financial Statements for further information on the Senior Notes - 2007.
Senior Notes - 2006. In 2006, we issued an aggregate of $375.0 million of senior unsecured notes in four series, which was fully repaid in 2016. See Note 9 to the Consolidated Financial Statements for further information on the Senior Notes - 2006.
Other Commitments
Compliance with existing governmental requirements regulating the discharge of materials into the environment has not materially affected our operations, earnings or competitive position. In 2016 and 2015, we spent $4.6 million and $9.3 million on capital projects and $16.0 million and $19.0 million, respectively, in operating expenses and governmental charges for the purpose of complying with such regulations. Expenditures for these purposes will continue for the foreseeable future. In addition, we are party to a number of proceedings brought under the Comprehensive Environmental Response, Compensation and Liability Act or similar state statutes. It is expected that the impact of any judgments in or voluntary settlements of such proceedings will not be material to our financial condition, results of operations or liquidity.
CONTRACTUAL OBLIGATIONS
At December 31, 2016, we had contractual payment obligations due within the time periods as specified in the following table:
Payments Due | |||||||||||||||||||
Contractual Obligations (Dollars In Millions) | Total | 2017 | 2018 - 2019 | 2020 - 2021 | 2022 and thereafter | ||||||||||||||
Borrowings(1) | $ | 1,321 | $ | 250 | $ | 100 | $ | — | $ | 971 | |||||||||
Interest on borrowings(1) | 247 | 47 | 69 | 57 | 74 | ||||||||||||||
Operating leases(2) | 256 | 33 | 53 | 48 | 122 | ||||||||||||||
Pension funding obligations(3) | 180 | 60 | 120 | — | — | ||||||||||||||
Postretirement obligations(4) | 80 | 5 | 10 | 11 | 54 | ||||||||||||||
Purchase commitments(5) | 64 | 54 | 9 | 1 | — | ||||||||||||||
Total | $ | 2,148 | $ | 449 | $ | 361 | $ | 117 | $ | 1,221 | |||||||||
_______________________
(1) | See Note 9 to the Consolidated Financial Statements for a further discussion of our various borrowing facilities. |
(2) | Operating leases include facility and other lease commitments executed in the normal course of the business, including sale leaseback obligations included in Note 8 of the Notes to the Consolidated Financial Statements. Further details concerning worldwide aggregate operating leases are contained in Note 18 of the Notes to the Consolidated Financial Statements. |
(3) | See Note 14 of the Notes to the Consolidated Financial Statements for a further discussion of our retirement plans. Anticipated funding obligations are based on current actuarial assumptions. The projected contributions beyond fiscal year 2019 are not currently determinable. |
(4) | Amounts represent expected future benefit payments for our postretirement benefit plans. |
(5) | Purchase commitments include agreements for raw material procurement and contractual capital expenditures. Amounts for purchase commitments represent only those items which are based on agreements that are enforceable and legally binding. |
The table above does not include $26.4 million of the total unrecognized tax benefits for uncertain tax positions and approximately $1.1 million of associated accrued interest. Due to the high degree of uncertainty regarding the timing of potential cash flows, we are unable to make a reasonable estimate of the amount and period in which the remaining liabilities might be paid.
45
Critical Accounting Policies and Use of Estimates
Our significant accounting policies are more fully described in Note 1 to the Consolidated Financial Statements. As disclosed in Note 1, the preparation of financial statements in conformity with U.S. generally accepted accounting principles (“GAAP”) requires management to make estimates and assumptions that affect reported amounts and accompanying disclosures. These estimates are based on management’s best judgment of current events and actions that we may undertake in the future. Actual results may ultimately differ from these estimates.
Those areas requiring the greatest degree of management judgment or deemed most critical to our financial reporting involve:
The periodic assessment of potential impairment of goodwill. We currently have goodwill of $1.0 billion. In assessing the potential for impairment of goodwill, management uses the most current actual and forecasted operating data available and current market based assumptions in accordance with the criteria in ASC 350. The Company has identified four reporting units: (1) Flavors, (2) Fragrance Compounds (3) Fragrance Ingredients and (4) Cosmetic Active Ingredients.
The Company performed the annual goodwill impairment test, utilizing the two-step approach for the Flavors, Fragrance Compounds, Fragrance Ingredients and Cosmetic Active Ingredients reporting units, by assessing the fair value of our reporting units based on discounted cash flows. We completed our annual goodwill impairment test as of November 30, 2016, which indicated no impairment of goodwill, as the estimated fair values substantially exceeded the carrying values of each of these reporting units.
The periodic assessment of potential impairment of finite-lived intangible assets. We currently have intangible assets of $365.8 million. The Company reviews long-lived assets for impairment when events or changes in business conditions indicate that their full carrying value may not be recovered. An estimate of undiscounted future cash flows produced by an asset or group of assets is compared to the carrying value to determine whether impairment exists. If assets are determined to be impaired, the loss is measured based on an estimate of fair value using various valuation techniques, including a discounted estimate of future cash flows.
The analysis and evaluation of income taxes. We account for taxes under the asset and liability method. Under this method, deferred income taxes are recognized for temporary differences between the financial statement and tax return bases of assets and liabilities. A valuation allowance is recognized if, based on the weight of available evidence, it is more likely than not that some portion or all of the deferred tax asset will not be realized. The assessment of the need for a valuation allowance requires management to make estimates and assumptions about future earnings, reversal of existing temporary differences and available tax planning strategies. If actual experience differs from these estimates and assumptions, the recorded deferred tax asset may not be fully realized resulting in an increase to income tax expense in our results of operations.
The Company has not established deferred tax liabilities for substantially all undistributed foreign earnings as it has plans to and intends to indefinitely reinvest those earnings to finance foreign activities. The unrecognized deferred tax liability on these undistributed earnings approximates $344 million.
We are subject to income taxes in the U.S. and numerous foreign jurisdictions. Significant judgment is required in evaluating our uncertain tax positions and determining our provision for income taxes. We first determine whether it is “more likely than not” that we would sustain our tax position if the relevant tax authority were to audit the position with full knowledge of all the relevant facts and other information. For those tax positions that meet this threshold, we measure the amount of tax benefit based on the largest amount of tax benefit that we have a greater than 50% chance of realizing in a final settlement with the relevant authority. Those tax positions failing to qualify for initial recognition are recognized in the first interim period in which they meet the more likely than not standard. This evaluation is made at the time that we adopt a tax position and whenever there is new information and is based upon management’s evaluation of the facts, circumstances and information available at the reporting date. We maintain a cumulative risk portfolio relating to all of our uncertainties in income taxes in order to perform this analysis, but the evaluation of our tax positions requires significant judgment and estimation in part because, in certain cases, tax law is subject to varied interpretation, and whether a tax position will ultimately be sustained may be uncertain. We do not currently believe that any of our pending tax assessments, even if ultimately resolved against us, would have a material impact on our results of operations and cash flows.
The evaluation of potential litigation and environmental liabilities, where changing circumstances, rules and regulations require regular reassessment of related practices and anticipated costs. We are subject to certain legal claims regarding products and other matters, as well as environmental-related matters. Significant management judgment is involved in determining when it is probable that a liability has been incurred and the extent to which it can be reasonably estimated.
We regularly assess potential liabilities with respect to all legal claims based on the most recent available information, in consultation with outside counsel we have engaged on our behalf to handle the defense of such matters. To the extent a liability is considered to be probable and reasonably estimable, we recognize a corresponding liability; if the reasonably estimated liability is a range, we recognize that amount considered most likely, or in the absence of such a determination, the minimum
46
reasonably estimated liability. To the extent such claims are covered by various insurance policies, we separately evaluate the right to recovery and estimate the related insurance claim receivable. Management judgments involve determination as to whether a liability has been incurred, the reasonably estimated amount of that liability, and any potential insurance recovery.
We regularly evaluate potential environmental exposure in terms of total estimated cost and the viability of other potentially responsible parties (“PRP’s”) associated with our exposure. Recorded liabilities are adjusted periodically as remediation efforts progress and additional information becomes available. Critical management assumptions relate to expected total costs to remediate and the financial viability of PRP’s to share such costs.
Determination of the various assumptions employed in the valuation of pension and retiree health care expense and associated obligations. Amounts recognized in the Consolidated Financial Statements related to pension and other postretirement benefits are determined from actuarial valuations. Inherent in such valuations are assumptions including expected return on plan assets, discount rates at which the liabilities could be settled, rates of increase in future compensation levels, mortality rates and health care cost trend rates. These assumptions are updated annually and are disclosed in Note 14 to the Consolidated Financial Statements. In accordance with GAAP, actual results that differ from the assumptions are accumulated and amortized over future periods and, therefore, affect expense recognized and obligations recorded in future periods.
We consider a number of factors in determining and selecting assumptions for the overall expected long-term rate of return on plan assets. We consider the historical long-term return experience of our assets, the current and expected allocation of our plan assets, and expected long-term rates of return. We derive these expected long-term rates of return with the assistance of our investment advisors. We base our expected allocation of plan assets on a diversified portfolio consisting of domestic and international equity securities, fixed income, real estate, and alternative asset classes.
We consider a variety of factors in determining and selecting our assumptions for the discount rate at December 31. For the U.S. plans, the discount rate was based on the internal rate of return for a portfolio of high quality bonds rated Aa or higher by either Moody’s or Standard & Poor's with maturities that are consistent with the projected future benefit payment obligations of the plan. For the Non-U.S. Plans, the discount rates were determined by region and are based on high quality long-term corporate bonds. Consideration has been given to the duration of the liabilities in each plan when selecting the bonds to be used in determining the discount rate. The rate of compensation increase for all plans and the medical cost trend rate for the applicable U.S. plans are based on plan experience.
With respect to the U.S. plans, the expected rate of return on plan assets was determined based on an asset allocation model using the current target allocation, real rates of return by asset class and an anticipated inflation rate. The target asset allocation consists of approximately: 40% in equity securities and 60% in fixed income securities. The plan has achieved a compounded annual rate of return of 6.3% over the previous 20 years. At December 31, 2016, the actual asset allocation for the U.S. plan was: 36% in equity securities and 64% in fixed income securities.
The expected rate of return for the non-U.S. plans employs a similar set of criteria adapted for local investments, inflation rates and in certain cases specific government requirements. The target asset allocation, for the non-U.S. plans, consists of approximately: 40% – 70% in fixed income securities; 15% – 40% in equity securities; 5% – 20% in real estate; and 5% – 10% in alternative investments. At December 31, 2016, the actual asset allocation for the non-U.S. plan was: 56% in fixed income investments; 27% in equity investments; 5% in real estate investments, 2% in cash and cash equivalents and 10% in alternative investments.
Changes in pension and other post-employment benefits, and associated expenses, may occur in the future due to changes in these assumptions. The impact that a 0.25% decrease in the discount rate or a 1% change in the medical cost trend rate would have on our pension and other post-employment benefit expense, as applicable, is as follows:
Sensitivity of Disclosures to Changes in Selected Assumptions | |||||||||||||||
25 BP Decrease in Discount Rate | 25 BP Decrease in Discount Rate | 25 BP Decrease in Long-Term Rate of Return | |||||||||||||
(DOLLARS IN THOUSANDS) | Change in PBO | Change in ABO | Change in pension expense | Change in pension expense | |||||||||||
U.S. Pension Plans | $ | 15,719 | $ | 15,620 | $ | (109 | ) | $ | 1,250 | ||||||
Non-U.S. Pension Plans | 46,658 | 44,861 | 2,876 | 1,895 | |||||||||||
Postretirement Benefit Plan | N/A | 2,302 | 100 | N/A | |||||||||||
The effect of a 1% increase in the medical cost trend rate would increase the accumulated postretirement benefit obligation and the annual postretirement expense by approximately $0.3 million and less than $0.1 million, respectively; a 1% decrease in the rate would decrease the obligation and expense by approximately $0.4 million and less than $0.1 million, respectively.
47
The ongoing assessment of the valuation of inventory, given the large number of natural ingredients employed, the quality of which may be diminished over time. We hold a majority of our inventory as raw materials, providing the greatest degree of flexibility in manufacture and use. As of December 31, 2016, we maintained 49% of our inventory as raw materials. Materials are evaluated based on shelf life, known uses and anticipated demand based on forecasted customer order activity and changes in product/sales mix. Management policy provides for an ongoing assessment of inventory with adjustments recorded when an item is deemed to be slow moving or obsolete.
We believe that we have considered relevant circumstances that we may be currently subject to, and the financial statements accurately reflect our best estimate of the impact of these items in our results of operations, financial condition and cash flows for the years presented. We have discussed the decision process and selection of these critical accounting policies with the Audit Committee of the Board of Directors.
New Accounting Standards
In January 2017, the Financial Accounting Standards Board (“FASB”) issued amendments to the Business Combination guidance which clarifies the definition of a business in order to assist companies when evaluating whether transactions should be accounted for as acquisitions or disposals of assets or businesses. This guidance will be effective prospectively for annual and interim periods beginning after December 15, 2017. This guidance may have an impact on accounting for future acquisitions.
In January 2017, the FASB issued an amendment to the Goodwill Impairment guidance which eliminates Step 2 from the goodwill impairment test. This guidance will be effective for fiscal years beginning after December 15, 2019. Early adoption is permitted. The Company plans to adopt this guidance in accordance with its existing annual impairment review policy in fiscal year 2017. The Company does not expect this adoption to have an impact on its consolidated financial statements.
In October 2016, the FASB issued authoritative guidance which allows for the immediate recognition of current and deferred income tax impact on intra-entity asset transfers, excluding inventory. This guidance will be effective for fiscal years beginning after December 15, 2017. Early adoption is only permitted as of the beginning of an annual reporting period. This guidance must be adopted using a modified retrospective transition. The Company plans to adopt this guidance in the first quarter of fiscal year 2017 and accordingly, will record a cumulative-effect adjustment directly to Retained earnings of approximately $47 million.
In August 2016, the FASB issued authoritative guidance which requires changes to the classification of certain activities within the statement of cash flows. This guidance will be effective for annual and interim periods beginning after December 15, 2017. Early adoption will be permitted for all entities. The Company does not expect this adoption to have a significant impact on its statement of cash flows.
In March 2016, the FASB issued authoritative guidance which requires changes to several aspects of the accounting for share-based payment transactions, including the treatment of income tax consequences, classification of awards as either equity or liabilities, and classification of certain items on the statement of cash flows. This guidance will be effective for annual and interim periods beginning after December 15, 2016. The standard requires that employee taxes paid when an employer withholds shares be presented in the Consolidated Statement of Cash Flows as a financing activity instead of an operating activity. The Company expects to adopt this change retroactively and that the impact of this aspect of the standard on the Consolidated Statement of Cash Flows will be approximately $13-$25 million on an annual basis. In addition, the standard requires that excess tax benefits presented in the Consolidated Statement of Cash Flows be classified as an operating activity instead of a financing activity. The Company expects to adopt this change retroactively and that the impact of this aspect of the standard on the Consolidated Statement of Cash Flows will be approximately $5-$12 million on an annual basis. The standard also requires all excess tax benefits/deficiencies be recognized as income tax expense/benefit in the income statement to be applied on a prospective basis. Depending on the future volatility of the stock price, the impact of this aspect of the standard could have a material impact on tax expense on its Consolidated Statement of Income and Comprehensive Income. Additionally, the standard allows the Company to make an entity-wide accounting policy election to either estimate the number of awards that are expected to vest or account for forfeitures as they occur. The Company plans to continue to account for forfeitures using an estimate of awards expected to be forfeited. Lastly, the standard requires that the threshold for equity classification of awards permits withholding up to the maximum statutory tax rates in the applicable jurisdictions. The adoption of this aspect of the standard will impact future vestings.
In February 2016, the FASB issued authoritative guidance which requires changes to the accounting for leases. The new guidance establishes a new lease accounting model, that requires entities to record assets and liabilities related to leases on the balance sheet for certain types of leases. The guidance will be effective for annual and interim periods beginning after December 31, 2018. Early adoption will be permitted for all entities. The Company expects the adoption of this guidance will
48
result in significant increases to assets and liabilities on its Consolidated Balance Sheet and is still evaluating the impact on its Consolidated Statement of Income and Comprehensive Income.
In September 2015, the FASB issued authoritative guidance related to the adjustments made during the measurement period for items in a business combination. Specifically, the new guidance requires adjustments related to the finalization of estimates to be recorded in the period when they are determined and to provide certain additional disclosures. This guidance is effective for fiscal years beginning after December 15, 2015. The Company adopted this guidance during 2016 and the adoption did not have a significant impact on its consolidated financial statements.
In May 2015, the FASB issued authoritative guidance which removed the requirement to categorize within the fair value hierarchy investments for which fair values are estimated using the net asset value practical expedient. The Company has adopted this guidance for the year ended December 31, 2016 and has reclassified prior year amounts for the year ended December 31, 2015 as disclosed in Note 14 to the Consolidated Financial Statements.
In April 2015, the FASB issued authoritative guidance which requires that debt issuance costs related to a recognized debt liability be presented in the balance sheet as a direct deduction from the carrying amount of that debt liability. This guidance is effective for annual and interim periods beginning after December 15, 2015. The Company adopted this guidance retrospectively in 2016 and accordingly has reclassified all debt issuance costs on long-term debt as a direct deduction from the carrying amount of the debt liability in the Consolidated Balance Sheet as of December 31, 2015. The adoption of this guidance did not have a significant impact on its consolidated financial statements.
In May 2014, the FASB issued authoritative guidance that provides for a comprehensive model to be used in accounting for revenue arising from contracts with customers. Under this standard, revenue will be recognized to depict the transfer of goods or services to customers in an amount that reflects the consideration to which the Company expects to be entitled in exchange for those goods or services. This guidance is applicable to all entities and is effective for annual and interim periods beginning after December 15, 2017. Adoption as of the original effective date is permitted. Accordingly, the Company is required to adopt this standard in the first quarter of fiscal year 2018. Companies have the option to apply the new guidance under a retrospective approach to each prior reporting period presented or a modified retrospective approach with the cumulative effect of initially applying the new guidance recognized at the date of initial application within the Consolidated Balance Sheet. The Company is evaluating the impact of the new standard, including updates to the standard that have been proposed by the FASB. In particular, the Company has reviewed the nature of its larger customer relationships and is in the process of reviewing the nature of potential regional variations in all aspects of its customer base regardless of size. Based on the work performed to date, the Company expects to conduct further review and analysis of certain areas that may lead to changes in the manner in which the Company recognizes revenue, including the customized nature of the product, consignment arrangements, rebates, upfront costs, shipping terms and documentation other than formal contracts. As a result, the financial statement impact has not yet been determined. The Company is also currently evaluating the method of adoption and the potential impacts to the consolidated financial statements and related disclosures.
Non-GAAP Financial Measures
The Company uses non-GAAP financial operating measures in this Quarterly Report, including: (i) currency neutral sales (which eliminates the effects that result from translating its international sales in U.S. dollars), (ii) adjusted gross profit and adjusted gross margin (which exclude acquisition-related costs, operational improvement initiative costs and restructuring charges) (iii) adjusted operating profit and adjusted operating margin (which excludes legal charges/credits, acquisition-related costs, operational improvement initiative costs, restructuring charges and gains on sale of assets), (iv) adjusted selling and administrative expenses (which excludes legal charges/credits, acquisition-related costs, operational improvement initiative costs and restructuring charges) and (v) adjusted effective tax rate (which excludes legal charges/credits, acquisition-related costs, operational improvement initiative costs, restructuring charges and gains on the sale of assets). The Company also provides the non-GAAP measures adjusted EBITDA (which excludes certain specified items and non-cash items as set forth in the Company’s debt agreements) and net debt (which is adjusted for deferred gain on interest rate swaps and cash and cash equivalents) solely for the purpose of providing information on the extent to which the Company is in compliance with debt covenants contained in its debt agreements.
We have included each of these non-GAAP measures in order to provide additional information regarding our underlying operating results and comparable year-over-year performance. Such information is supplemental to information presented in accordance with GAAP and is not intended to represent a presentation in accordance with GAAP. In discussing our historical and expected future results and financial condition, we believe it is meaningful for investors to be made aware of and to be assisted in a better understanding of, on a period-to-period comparable basis, financial amounts both including and excluding these identified items, as well as the impact of exchange rate fluctuations. We believe such additional non-GAAP information provides investors with an overall perspective of the period-to-period performance of our business. In addition, management internally reviews each of these non-GAAP measures to evaluate performance on a comparative period-to-period basis in terms
49
of absolute performance, trends and expected future performance with respect to our business. A material limitation of these non-GAAP measures is that such measures do not reflect actual GAAP amounts. We compensate for such limitations by using these measures as one of several metrics, including GAAP measures. These non-GAAP measures may not be comparable to similarly titled measures used by other companies.
A. Reconciliation of Non-GAAP Metrics
For the Year Ended December 31, 2016
Reconciliation of Gross Profit | ||||||||||||||
Reported (GAAP) | Restructuring and Other Charges (a) | Operational Improvement Initiative Costs (b) | Acquisition and Related Costs (c) | Adjusted (Non-GAAP) | ||||||||||
Gross profit | 1,399,070 | 658 | 2,391 | 7,648 | 1,409,767 | |||||||||
Reconciliation of Selling and Administrative Expenses | |||||||||||||||||
Reported (GAAP) | Restructuring and Other Charges (a) | Operational Improvement Initiative Costs (b) | Acquisition and Related Costs (c) | Legal Charges/Credits (d) | Adjusted (Non-GAAP) | ||||||||||||
Selling and Administrative Expenses | 566,224 | (1,364 | ) | (11 | ) | (4,547 | ) | (48,518 | ) | 511,784 | |||||||
Reconciliation of Operating Profit | ||||||||||||||||||||
Reported (GAAP) | Restructuring and Other Charges (a) | Operational Improvement Initiative Costs (b) | Acquisition Related Costs (c) | Legal Charges/Credits (d) | Gain on Sale of Asset (e) | Adjusted (Non-GAAP) | ||||||||||||||
Operating profit | 567,356 | 322 | 2,402 | 12,195 | 48,518 | (7,818 | ) | 622,975 | ||||||||||||
Reconciliation of Net Income | ||||||||||||||||||||
Reported (GAAP) | Restructuring and Other Charges (a) | Operational Improvement Initiative Costs (b) | Acquisition Related Costs (c) | Legal Charges/Credits (d) | Gain on Sale of Asset (e) | Adjusted (Non-GAAP) | ||||||||||||||
Income before taxes | 523,717 | 322 | 2,402 | 12,195 | 48,518 | (7,818 | ) | 579,336 | ||||||||||||
Taxes on income (f) | 118,686 | 97 | 599 | 4,117 | 17,089 | (2,658 | ) | 137,930 | ||||||||||||
Net income | 405,031 | 225 | 1,803 | 8,078 | 31,429 | (5,160 | ) | 441,406 | ||||||||||||
____________________
(a) Accelerated depreciation related to restructuring initiatives, severance costs related to the termination of a former executive officer and the partial reversal of restructuring accruals recorded in the prior year.
(b) Accelerated depreciation, dismantling and idle labor costs in Hangzhou, China and the partial reversal of severance accruals related to prior year operational initiatives in Europe. There was approximately $0.4 million of idle labor costs in Hangzhou, China recorded during the third quarter of 2016 that were not excluded from Adjusted Non-GAAP metrics.
(c) Expense related to the fair value step up of inventory and transaction costs related to acquisition of Lucas Meyer in 2015 and David Michael in 2016 as well as transaction costs related to the acquisition of Fragrance Resources in 2017.
(d) Includes legal charges related to litigation accrual offset by settlements due to favorable tax rulings in jurisdictions for which reserves were previously recorded for ongoing tax disputes.
(e) Represents the gain from sale of property in Brazil during the fourth quarter of 2016. During the first quarter of 2016, we previously recognized approximately $3 million of gains related to the sale of fixed assets. We have not retrospectively adjusted these amounts out of our Adjusted Non-GAAP metrics.
(f) The tax effects are calculated based upon the specific rate of the applicable jurisdiction of the items.
50
For the Year Ended December 31, 2015
Reconciliation of Gross Profit | |||||||||||
Reported (GAAP) | Operational Improvement Initiative Costs (a) | Acquisition and Related Costs (b) | Adjusted (Non-GAAP) | ||||||||
Gross profit | 1,351,599 | 1,115 | 6,825 | 1,359,539 | |||||||
Reconciliation of Selling and Administrative Expenses | ||||||||||||||
Reported (GAAP) | Acquisition and Related Costs (b) | Accelerated Contingent Consideration (c) | Legal Charges/Credits (d) | Adjusted (Non-GAAP) | ||||||||||
Selling and Administrative Expenses | 494,517 | (11,517 | ) | (7,192 | ) | 10,530 | 486,338 | |||||||
Reconciliation of Operating Profit | ||||||||||||||||||||
Reported (GAAP) | Operational Improvement Initiative Costs (a) | Acquisition Related Costs (b) | Accelerated Contingent Consideration (c) | Legal Charges/Credits (d) | Restructuring and Other Charges (e) | Adjusted (Non-GAAP) | ||||||||||||||
Operating profit | 588,347 | 1,115 | 18,342 | 7,192 | (10,530 | ) | 7,594 | 612,060 | ||||||||||||
Reconciliation of Net Income | |||||||||||||||||||||||
Reported (GAAP) | Operational Improvement Initiative Costs (a) | Acquisition Related Costs (b) | Accelerated Contingent Consideration (c) | Legal Charges/Credits (d) | Restructuring and Other Charges (e) | Tax Settle-ments (f) | Adjusted (Non-GAAP) | ||||||||||||||||
Income before taxes | 539,101 | 1,115 | 18,342 | 7,192 | (10,530 | ) | 7,594 | — | 562,814 | ||||||||||||||
Taxes on income (g) | 119,854 | 279 | 6,225 | — | (2,948 | ) | 2,302 | 10,478 | 136,190 | ||||||||||||||
Net income | 419,247 | 836 | 12,117 | 7,192 | (7,582 | ) | 5,292 | (10,478 | ) | 426,624 | |||||||||||||
____________________
(a) Related to plant closings in Europe and partial closing in Asia.
(b) Transaction costs related to acquisitions (Ottens Flavors and Lucas Meyer) as well as expense related to the fair value step up of inventory for both acquisitions.
(c) Represents the acceleration of the contingent consideration payment related to the Aromor acquisition.
(d) Represents the reversal of the previously recorded provision related to the Spanish capital tax case as a result of a favorable ruling.
(e) Restructuring costs related to Q4 2015 Profit Improvement Initiative.
(f) Settlements due to favorable tax rulings in jurisdictions for which reserves were previously recorded for ongoing tax disputes.
(g) The tax effects are calculated based upon the specific rate of the applicable jurisdiction of the items.
51
B. Foreign Currency Reconciliation
Operating Profit | |||
December 31, 2016 | December 31, 2015 | ||
% Change - Reported (GAAP) | (4)% | (1)% | |
Items impacting comparability (1) (2) | 5% | 3% | |
% Change - Adjusted (Non-GAAP)(2) | 2% | 2% | |
Currency Impact | 2% | 6% | |
% Change Year-over-Year - Currency Neutral Adjusted (Non-GAAP)(2)** | 4% | 8% | |
_______________________
(1) Includes items impacting comparability of $55.6 million for the twelve months ended December 31, 2016 and includes $23.7 million of items impacting comparability for the twelve months ended December 31, 2015.
(2) 2016 item does not foot due to rounding.
** Currency neutral amount is calculated by translating prior year amounts at the exchange rates used for the corresponding 2016 period. Currency neutral operating profit also eliminates the year-over-year impact of cash flow hedging.
C. Acquisition Related Intangible Asset Amortization
The Company tracks the amount of amortization recorded on recent acquisitions in order to monitor its progress with respect to its Vision 2020 goals. The following amounts were recorded with respect to recent acquisitions:
(DOLLARS IN THOUSANDS) | December 31, 2016 | December 31, 2015 | |
David Michael | $1,662 | $— | |
Ottens Flavors | 6,345 | 4,310 | |
Lucas Meyer Cosmetics | 8,322 | 3,249 | |
Cautionary Statement Under the Private Securities Litigation Reform Act of 1995
Statements in this Annual Report, which are not historical facts or information, are “forward-looking statements” within the meaning of The Private Securities Litigation Reform Act of 1995. Such forward-looking statements are based on management’s current assumptions, estimates and expectations and include statements concerning (i) our ability to achieve long-term sustainable growth and increase shareholder value, (ii) growth potential in the emerging markets, (iii) the anticipated impact of our acquisitions on our market position within key markets, (iv) our ability to generate returns above cost of capital, (v) our competitive position in the market and expected financial results in 2017, (vi) expected savings from profit improvement initiatives, (vii) expected capital expenditures and cost pressures in 2017 and (viii) timing of completion or relocation of our plants in China. These forward-looking statements should be evaluated with consideration given to the many risks and uncertainties inherent in our business that could cause actual results and events to differ materially from those in the forward-looking statements. Certain of such forward-looking information may be identified by such terms as “expect”, “anticipate”, “believe”, “intend”, “outlook”, “may”, “estimate”, “should”, “predict” and similar terms or variations thereof. Such forward-looking statements are based on a series of expectations, assumptions, estimates and projections about the Company, are not guarantees of future results or performance, and involve significant risks, uncertainties and other factors, including assumptions and projections, for all forward periods. Our actual results may differ materially from any future results expressed or implied by such forward-looking statements. Such factors include, among others, the following:
•macroeconomic trends affecting the emerging markets;
•our ability to implement and adopt our Vision 2020 strategy;
• | our ability to successfully identify and complete acquisitions in line with our Vision 2020 strategy, and to realize the anticipated benefits of those acquisitions; |
• | our ability to effectively compete in our market, and to successfully develop new and competitive products that appeal to our customers and consumers; |
• | changes in consumer preferences and demand for our products or a decline in consumer confidence and spending; |
• | our ability to benefit from our investments and expansion in emerging markets; |
52
• | the impact of currency fluctuations or devaluations in the principal foreign markets in which we operate, including the devaluation of the Euro; |
• | the potential adverse impact of Brexit on currency exchange rates, global economic conditions and cross-border agreements that affect our business; |
• | the economic and political risks associated with our international operations, including current challenging economic conditions in China and Latin America; |
• | the impact of any failure of our key information technology systems or a breach of information security; |
• | our ability to attract and retain talented employees; |
• | our ability to comply with, and the costs associated with compliance with, U.S. and foreign environmental protection laws; |
• | our ability to realize expected cost savings and efficiencies from our profitability improvement initiatives and other optimization activities; |
• | volatility and increases in the price of raw materials, energy and transportation; |
• | fluctuations in the quality and availability of raw materials; |
• | the impact of a disruption in our supply chain or our relationship with our suppliers; |
• | any adverse impact on the availability, effectiveness and cost of our hedging and risk management strategies; |
• | our ability to successfully manage our working capital and inventory balances; |
• | uncertainties regarding the outcome of, or funding requirements, related to litigation or settlement of pending litigation, uncertain tax positions or other contingencies; |
• | the effect of legal and regulatory proceedings, as well as restrictions imposed on the Company, its operations or its representatives by U.S. and foreign governments; |
• | adverse changes in federal, state, local and international tax legislation or policies, including with respect to transfer pricing and state aid, and adverse results of tax audits, assessments, or disputes; and |
• | changes in market conditions or governmental regulations relating to our pension and postretirement obligations. |
The foregoing list of important factors does not include all such factors, nor necessarily present them in order of importance. In addition, you should consult other disclosures made by the Company (such as in our other filings with the Securities and Exchange Commission (“SEC”) or in company press releases) for other factors that may cause actual results to differ materially from those projected by the Company. Please refer to Part I. Item 1A., Risk Factors, of this 2016 Form 10-K for additional information regarding factors that could affect the Company’s results of operations, financial condition and liquidity.
We intend our forward-looking statements to speak only as of the time of such statements and do not undertake or plan to update or revise them as more information becomes available or to reflect changes in expectations, assumptions or results. We can give no assurance that such expectations or forward-looking statements will prove to be correct. An occurrence of, or any material adverse change in, one or more of the risk factors or risks and uncertainties referred to in this report or included in our other periodic reports filed with the SEC could materially and adversely impact our operations and our future financial results.
Any public statements or disclosures made by us following this report that modify or impact any of the forward-looking statements contained in or accompanying this report will be deemed to modify or supersede such outlook or other forward-looking statements in or accompanying this report.
ITEM 7A. QUANTITATIVE AND QUALITATIVE DISCLOSURES ABOUT MARKET RISK.
We operate on a global basis and are exposed to currency fluctuation related to the manufacture and sale of our products in currencies other than the U.S. dollar. The major foreign currencies involve the markets in the European Union, Great Britain, Mexico, Brazil, China, India, Indonesia, Australia and Japan, although all regions are subject to foreign currency fluctuations versus the U.S. dollar. We actively monitor our foreign currency exposures in all major markets in which we operate, and
53
employ a variety of techniques to mitigate the impact of exchange rate fluctuations, including foreign currency hedging activities.
We have established a centralized reporting system to evaluate the effects of changes in interest rates, currency exchange rates and other relevant market risks. Our risk management procedures include the monitoring of interest rate and foreign exchange exposures and hedge positions utilizing statistical analyses of cash flows, market value and sensitivity analysis. However, the use of these techniques to quantify the market risk of such instruments should not be construed as an endorsement of their accuracy or the accuracy of the related assumptions. For the year ended December 31, 2016, the Company’s exposure to market risk was estimated using sensitivity analyses, which illustrate the change in the fair value of a derivative financial instrument assuming hypothetical changes in foreign exchange rates and interest rates.
We enter into foreign currency forward contracts with the objective of reducing exposure to cash flow volatility associated with foreign currency receivables and payables, and with anticipated purchases of certain raw materials used in operations. These contracts, the counterparties to which are major international financial institutions, generally involve the exchange of one currency for a second currency at a future date, and have maturities not exceeding twelve months. The gain or loss on the hedging instrument and services is recorded in earnings at the same time as the transaction being hedged is recorded in earnings. At December 31, 2016, the Company’s foreign currency exposures pertaining to derivative contracts exist with the Euro, Japanese Yen, British Pound, Australian Dollar and Indonesian Rupiah. Based on a hypothetical decrease or increase of 10% in the applicable balance sheet exchange rates (primarily against the U.S. dollar), the estimated fair value of the Company’s foreign currency forward contracts would increase or decrease by approximately $36 million. However, any change in the value of the contracts, real or hypothetical, would be significantly offset by a corresponding change in the value of the underlying hedged items.
We have also used non-U.S. dollar borrowings and foreign currency forward contracts, to hedge the foreign currency exposures of our net investment in certain foreign subsidiaries, primarily in the European Union. Based on a hypothetical decrease or increase of 10% in the value of the U.S. dollar against the Euro, the estimated fair value of the Company’s foreign currency forward contracts would change by approximately $7 million. However, any change in the value of the contracts, real or hypothetical, would be significantly offset by a corresponding change in the value of the underlying hedged items.
We use derivative instruments as part of our interest rate risk management strategy. The derivative instruments used are comprised of fixed to variable rate interest rate swaps based on the LIBOR plus an interest mark up and interest rate swaps to hedge the anticipated issuance of fixed rate debt. The notional amount, interest payment and maturity date of the swaps match the principal, interest payment and maturity date of the related debt and the swaps are valued using observable benchmark rates. Based on a hypothetical decrease or increase of one percentage point in LIBOR, the estimated fair value of the Company’s interest rate swaps would change by less than $10 million.
At December 31, 2016, the fair value of our fixed rate debt was $1.4 billion. Based on a hypothetical decrease of 10% in interest rates, the estimated fair value of the Company’s fixed debt would increase by $6 million.
We purchase certain commodities, such as natural gas, electricity, petroleum based products and certain crop related items. We generally purchase these commodities based upon market prices that are established with the vendor as part of the purchase process. In general, we do not use commodity financial instruments to hedge commodity prices.
ITEM 8. | FINANCIAL STATEMENTS AND SUPPLEMENTARY DATA. |
See index to Consolidated Financial Statements on page 57. See Item 6 on page 27 for supplemental quarterly data.
ITEM 9. | CHANGES IN AND DISAGREEMENTS WITH ACCOUNTANTS ON ACCOUNTING AND FINANCIAL DISCLOSURE. |
None.
54
ITEM 9A. | CONTROLS AND PROCEDURES. |
Evaluation of Disclosure Controls and Procedures and Changes in Internal Control over Financial Reporting.
Our Chief Executive Officer and Chief Financial Officer, with the assistance of other members of our management, have evaluated the effectiveness of our disclosure controls and procedures as of the end of the period covered by this Annual Report on Form 10-K. Based on such evaluation, our Chief Executive Officer and Chief Financial Officer have concluded that our disclosure controls and procedures are effective as of the end of the period covered by this Annual Report on Form 10-K.
We have established controls and procedures designed to ensure that information required to be disclosed in the reports that we file or submit under the Exchange Act is recorded, processed, summarized and reported within the time periods specified in the Commission’s rules and forms and is accumulated and communicated to management, including the principal executive officer and the principal financial officer, to allow timely decisions regarding required disclosure.
Our Chief Executive Officer and Chief Financial Officer have concluded that there have not been any changes in our internal control over financial reporting during the fourth quarter that have materially affected, or are reasonably likely to materially affect, our internal control over financial reporting.
Management’s Report on Internal Control Over Financial Reporting.
Our management is responsible for establishing and maintaining adequate internal control over financial reporting as defined in Rules 13a-15(f) and 15d-15(f) under the Securities Exchange Act of 1934. Our internal control over financial reporting is a process designed to provide reasonable assurance regarding the reliability of financial reporting and the preparation of financial statements for external purposes in accordance with generally accepted accounting principles.
Because of its inherent limitations, internal control over financial reporting may not prevent or detect misstatements. Also, projections of any evaluation of effectiveness to future periods are subject to the risk that controls may become inadequate because of changes in conditions, or that the degree of compliance with the policies or procedures may deteriorate.
Management assessed the effectiveness of our internal control over financial reporting as of December 30, 2016. In making this assessment, management used the criteria set forth by the Committee of Sponsoring Organizations of the Treadway Commission (“COSO”) in its 2013 Internal Control — Integrated Framework.
Based on this assessment, management determined that, as of December 30, 2016, our internal control over financial reporting was effective.
PricewaterhouseCoopers LLP, our independent registered public accounting firm, has audited the effectiveness of our internal control over financial reporting as of December 30, 2016 as stated in their report which is included herein.
ITEM 9B. OTHER INFORMATION.
None.
PART III
ITEM 10. DIRECTORS, EXECUTIVE OFFICERS AND CORPORATE GOVERNANCE.
The information relating to directors and nominees of the Company is set forth in the IFF 2017 Proxy Statement and is incorporated by reference herein. The information relating to Section 16(a) beneficial ownership reporting compliance that appears in the IFF 2017 Proxy Statement is also incorporated by reference herein. See Part I, Item 1 of this Form 10-K for information relating to the Company’s Executive Officers.
We have adopted a Code of Business Conduct and Ethics (the “Code of Ethics”) that applies to all of our employees, including our chief executive officer and our chief financial officer (who is also our principal accounting officer). We have also adopted a Code of Conduct for Directors and a Code of Conduct for Executive Officers (together with the Code of Ethics, the “Codes”). The Codes are available through the Investors — Corporate Governance link on our website www.iff.com.
Only the Board of Directors or the Audit Committee of the Board may grant a waiver from any provision of our Codes in favor of a director or executive officer, and any such waiver will be publicly disclosed. We will disclose substantive amendments to and any waivers from the Codes provided to our chief executive officer and principal financial officer (principal accounting officer), as well as any other executive officer or director, on the Company’s website: www.iff.com.
The information regarding the Company’s Audit Committee and its designated audit committee financial experts is set forth in the IFF 2017 Proxy Statement and such information is incorporated by reference herein.
55
The information concerning procedures by which shareholders may recommend director nominees is set forth in the IFF 2017 Proxy Statement and such information is incorporated by reference herein.
ITEM 11. | EXECUTIVE COMPENSATION. |
The information relating to executive compensation and the Company’s policies and practices as they relate to the Company’s risk management is set forth in the IFF 2017 Proxy Statement and such information is incorporated by reference herein; except that the information under the caption “Compensation Committee Report” shall be deemed “furnished” with this report and shall not be deemed “filed” with this report, not deemed incorporated by reference into any filing under the Securities Act of 1933 except only as may be expressly set forth in any such filing by specific reference.
ITEM 12. | SECURITY OWNERSHIP OF CERTAIN BENEFICIAL OWNERS AND MANAGEMENT AND RELATED STOCKHOLDER MATTERS. |
The information relating to security ownership of management, certain beneficial owners and the Company’s equity plans is set forth in the IFF 2017 Proxy Statement and such information is incorporated by reference herein.
ITEM 13. | CERTAIN RELATIONSHIPS AND RELATED TRANSACTIONS, AND DIRECTOR INDEPENDENCE. |
The information regarding certain relationships and related party transactions and director independence is set forth in the IFF 2017 Proxy Statement and such information is incorporated by reference herein.
ITEM 14. | PRINCIPAL ACCOUNTANT FEES AND SERVICES. |
The information regarding the independent registered public accounting firm (“independent accountant”) fees and services and the Company’s pre-approval policies and procedures for audit and non-audit services provided by the Company’s independent accountant are set forth in the IFF 2017 Proxy Statement and such information is incorporated by reference herein.
56
PART IV
ITEM 15. | EXHIBITS AND FINANCIAL STATEMENT SCHEDULES. |
(a)(1) FINANCIAL STATEMENTS: The following consolidated financial statements, related notes, and independent registered public accounting firm’s report are included in this report on Form 10-K:
(a)(2) FINANCIAL STATEMENT SCHEDULES | |
All other schedules are omitted because they are not applicable or the required information is shown in the financial statements or notes thereto.
57
REPORT OF INDEPENDENT REGISTERED PUBLIC ACCOUNTING FIRM
To the Board of Directors and Shareholders of International Flavors & Fragrances Inc.
In our opinion, the consolidated financial statements listed in the index appearing under item 15(a)(1) present fairly, in all material respects, the financial position of International Flavors & Fragrances Inc. and its subsidiaries at December 30, 2016 and January 1, 2016, and the results of their operations and their cash flows for each of the three years in the period ended December 30, 2016 in conformity with accounting principles generally accepted in the United States of America. In addition, in our opinion, the financial statement schedule listed in the index appearing under Item 15(a)(2) presents fairly, in all material respects, the information set forth therein when read in conjunction with the related consolidated financial statements. Also in our opinion, the Company maintained, in all material respects, effective internal control over financial reporting as of December 30, 2016, based on criteria established in Internal Control - Integrated Framework 2013 issued by the Committee of Sponsoring Organizations of the Treadway Commission (COSO). The Company's management is responsible for these financial statements and financial statement schedule, for maintaining effective internal control over financial reporting and for its assessment of the effectiveness of internal control over financial reporting, included in Management's Report on Internal Control over Financial Reporting, appearing under Item 9A. Our responsibility is to express opinions on these financial statements, on the financial statement schedule, and on the Company's internal control over financial reporting based on our integrated audits. We conducted our audits in accordance with the standards of the Public Company Accounting Oversight Board (United States). Those standards require that we plan and perform the audits to obtain reasonable assurance about whether the financial statements are free of material misstatement and whether effective internal control over financial reporting was maintained in all material respects. Our audits of the financial statements included examining, on a test basis, evidence supporting the amounts and disclosures in the financial statements, assessing the accounting principles used and significant estimates made by management, and evaluating the overall financial statement presentation. Our audit of internal control over financial reporting included obtaining an understanding of internal control over financial reporting, assessing the risk that a material weakness exists, and testing and evaluating the design and operating effectiveness of internal control based on the assessed risk. Our audits also included performing such other procedures as we considered necessary in the circumstances. We believe that our audits provide a reasonable basis for our opinions.
A company’s internal control over financial reporting is a process designed to provide reasonable assurance regarding the reliability of financial reporting and the preparation of financial statements for external purposes in accordance with generally accepted accounting principles. A company’s internal control over financial reporting includes those policies and procedures that (i) pertain to the maintenance of records that, in reasonable detail, accurately and fairly reflect the transactions and dispositions of the assets of the company; (ii) provide reasonable assurance that transactions are recorded as necessary to permit preparation of financial statements in accordance with generally accepted accounting principles, and that receipts and expenditures of the company are being made only in accordance with authorizations of management and directors of the company; and (iii) provide reasonable assurance regarding prevention or timely detection of unauthorized acquisition, use, or disposition of the company’s assets that could have a material effect on the financial statements.
Because of its inherent limitations, internal control over financial reporting may not prevent or detect misstatements. Also, projections of any evaluation of effectiveness to future periods are subject to the risk that controls may become inadequate because of changes in conditions, or that the degree of compliance with the policies or procedures may deteriorate.
/s/ PricewaterhouseCoopers LLP |
New York, New York |
February 28, 2017 |
58
INTERNATIONAL FLAVORS & FRAGRANCES INC.
CONSOLIDATED STATEMENT OF INCOME AND COMPREHENSIVE INCOME
Year Ended December 31, | |||||||||||
(DOLLARS IN THOUSANDS EXCEPT PER SHARE AMOUNTS) | 2016 | 2015 | 2014 | ||||||||
Net sales | $ | 3,116,350 | $ | 3,023,189 | $ | 3,088,533 | |||||
Cost of goods sold | 1,717,280 | 1,671,590 | 1,726,383 | ||||||||
Gross profit | 1,399,070 | 1,351,599 | 1,362,150 | ||||||||
Research and development expenses | 254,263 | 246,101 | 253,640 | ||||||||
Selling and administrative expenses | 566,224 | 494,517 | 507,563 | ||||||||
Restructuring and other charges, net | (1,700 | ) | 7,594 | 1,298 | |||||||
Amortization of acquisition-related intangibles | 23,763 | 15,040 | 7,328 | ||||||||
Gain on sales of fixed assets | (10,836 | ) | — | — | |||||||
Operating profit | 567,356 | 588,347 | 592,321 | ||||||||
Interest expense | 52,989 | 46,062 | 46,067 | ||||||||
Other (income) expense, net | (9,350 | ) | 3,184 | (2,807 | ) | ||||||
Income before taxes | 523,717 | 539,101 | 549,061 | ||||||||
Taxes on income | 118,686 | 119,854 | 134,518 | ||||||||
Net income | 405,031 | 419,247 | 414,543 | ||||||||
Other comprehensive income (loss): | |||||||||||
Foreign currency translation adjustments | (54,526 | ) | (124,157 | ) | (69,064 | ) | |||||
(Losses) gains on derivatives qualifying as hedges | (1,797 | ) | (2,970 | ) | 16,383 | ||||||
Pension and postretirement liability adjustment | (10,332 | ) | 54,117 | (95,038 | ) | ||||||
Comprehensive income | $ | 338,376 | $ | 346,237 | $ | 266,824 | |||||
2016 | 2015 | 2014 | |||||||||
Net income per share — basic | $ | 5.07 | $ | 5.19 | $ | 5.09 | |||||
Net income per share — diluted | $ | 5.05 | $ | 5.16 | $ | 5.06 | |||||
See Notes to Consolidated Financial Statements
59
INTERNATIONAL FLAVORS & FRAGRANCES INC.
CONSOLIDATED BALANCE SHEET
December 31, | |||||||
(DOLLARS IN THOUSANDS) | 2016 | 2015 | |||||
ASSETS | |||||||
Current Assets: | |||||||
Cash and cash equivalents | $ | 323,992 | $ | 181,988 | |||
Receivables: | |||||||
Trade | 560,653 | 546,125 | |||||
Allowance for doubtful accounts | (9,995 | ) | (8,229 | ) | |||
Inventories | 592,017 | 572,047 | |||||
Prepaid expenses and other current assets | 142,347 | 145,178 | |||||
Total Current Assets | 1,609,014 | 1,437,109 | |||||
Property, plant and equipment, net | 775,716 | 732,794 | |||||
Goodwill | 1,000,123 | 941,389 | |||||
Other intangible assets, net | 365,783 | 306,004 | |||||
Deferred income taxes | 138,636 | 166,323 | |||||
Other assets | 127,712 | 118,391 | |||||
Total Assets | $ | 4,016,984 | $ | 3,702,010 | |||
LIABILITIES AND SHAREHOLDERS’ EQUITY | |||||||
Current Liabilities: | |||||||
Bank borrowings, overdrafts and current portion of long-term debt | $ | 258,516 | $ | 132,349 | |||
Accounts payable | 274,815 | 285,501 | |||||
Dividends payable | 50,678 | 44,824 | |||||
Other current liabilities | 314,288 | 262,482 | |||||
Total Current Liabilities | 898,297 | 725,156 | |||||
Other Liabilities: | |||||||
Long-term debt | 1,066,855 | 935,373 | |||||
Deferred gains | 39,816 | 43,260 | |||||
Retirement liabilities | 243,407 | 242,383 | |||||
Other liabilities | 137,475 | 160,849 | |||||
Total Other Liabilities | 1,487,553 | 1,381,865 | |||||
Commitments and Contingencies (Note 18) | |||||||
Shareholders’ Equity: | |||||||
Common stock 12 1/2¢ par value; authorized 500,000,000 shares; issued 115,858,190 shares as of December 31, 2016 and 2015; and outstanding 79,213,037 and 80,022,291 shares as of December 31, 2016 and 2015 | 14,470 | 14,470 | |||||
Capital in excess of par value | 152,481 | 140,802 | |||||
Retained earnings | 3,818,535 | 3,604,254 | |||||
Accumulated other comprehensive loss: | |||||||
Cumulative translation adjustments | (352,025 | ) | (297,499 | ) | |||
Accumulated gains on derivatives qualifying as hedges | 7,604 | 9,401 | |||||
Pension and postretirement liability adjustment | (335,674 | ) | (325,342 | ) | |||
Treasury stock, at cost - 36,645,153 and 35,835,899 shares as of December 31, 2016 and 2015 | (1,679,147 | ) | (1,555,769 | ) | |||
Total Shareholders’ Equity | 1,626,244 | 1,590,317 | |||||
Noncontrolling interest | 4,890 | 4,672 | |||||
Total Shareholders’ Equity including noncontrolling interest | 1,631,134 | 1,594,989 | |||||
Total Liabilities and Shareholders’ Equity | $ | 4,016,984 | $ | 3,702,010 | |||
See Notes to Consolidated Financial Statements
60
INTERNATIONAL FLAVORS & FRAGRANCES INC.
CONSOLIDATED STATEMENT OF CASH FLOWS
Year Ended December 31, | |||||||||||
(DOLLARS IN THOUSANDS) | 2016 | 2015 | 2014 | ||||||||
Cash flows from operating activities: | |||||||||||
Net income | $ | 405,031 | $ | 419,247 | $ | 414,543 | |||||
Adjustments to reconcile to net cash provided by operating activities: | |||||||||||
Depreciation and amortization | 102,469 | 89,597 | 89,354 | ||||||||
Deferred income taxes | 14,350 | 13,043 | 23,350 | ||||||||
Gain on disposal of assets | (10,836 | ) | (622 | ) | (3,768 | ) | |||||
Stock-based compensation | 24,587 | 23,160 | 22,648 | ||||||||
Pension contributions | (46,347 | ) | (67,897 | ) | (43,982 | ) | |||||
Changes in assets and liabilities, net of acquisitions: | |||||||||||
Trade receivables | (21,544 | ) | (91,712 | ) | (2,635 | ) | |||||
Inventories | 15,452 | (37,628 | ) | (40,042 | ) | ||||||
Accounts payable | (7,642 | ) | 89,273 | 19,403 | |||||||
Accruals for incentive compensation | 12,133 | (17,399 | ) | (30,947 | ) | ||||||
Other current payables and accrued expenses | 49,103 | 29,124 | (30,982 | ) | |||||||
Other assets | (2,442 | ) | 46,862 | 64,605 | |||||||
Other liabilities | 1,092 | (61,470 | ) | 36,843 | |||||||
Net cash provided by operating activities | 535,406 | 433,578 | 518,390 | ||||||||
Cash flows from investing activities: | |||||||||||
Cash paid for acquisitions, net of cash received (including $15 million of contingent consideration related to the Aromor acquisition in 2014) | (236,836 | ) | (493,424 | ) | (102,500 | ) | |||||
Additions to property, plant and equipment | (126,412 | ) | (101,030 | ) | (143,182 | ) | |||||
Proceeds from disposal of assets | 6,856 | 4,302 | 3,295 | ||||||||
Maturity of net investment hedges | 637 | 12,128 | 3,304 | ||||||||
Proceeds from life insurance contracts | 292 | 868 | 17,750 | ||||||||
Net cash used in investing activities | (355,463 | ) | (577,156 | ) | (221,333 | ) | |||||
Cash flows from financing activities: | |||||||||||
Cash dividends paid to shareholders | (184,897 | ) | (158,870 | ) | (133,239 | ) | |||||
Increase (decrease) in revolving credit facility borrowings and overdrafts | (134,344 | ) | 136,826 | 8,332 | |||||||
Proceeds from issuance of long-term debt | 555,559 | — | 3,609 | ||||||||
Deferred financing costs | (5,788 | ) | — | (1,023 | ) | ||||||
Repayments of debt | (125,000 | ) | — | — | |||||||
Loss on pre-issuance hedges | (3,244 | ) | — | — | |||||||
Proceeds from issuance of stock under stock plans | 813 | 886 | 1,864 | ||||||||
Excess tax benefits on stock-based payments | 4,650 | 12,055 | 6,330 | ||||||||
Purchase of treasury stock | (127,443 | ) | (122,193 | ) | (88,203 | ) | |||||
Net cash used in financing activities | (19,694 | ) | (131,296 | ) | (202,330 | ) | |||||
Effect of exchange rate changes on cash and cash equivalents | (18,245 | ) | (21,711 | ) | (21,659 | ) | |||||
Net change in cash and cash equivalents | 142,004 | (296,585 | ) | 73,068 | |||||||
Cash and cash equivalents at beginning of year | 181,988 | 478,573 | 405,505 | ||||||||
Cash and cash equivalents at end of year | $ | 323,992 | $ | 181,988 | $ | 478,573 | |||||
Cash paid for: | |||||||||||
Interest, net of amounts capitalized | $ | 50,576 | $ | 46,760 | $ | 46,106 | |||||
Income taxes | $ | 107,898 | $ | 102,734 | $ | 92,087 | |||||
Noncash investing activities: | |||||||||||
Accrued capital expenditures | $ | 26,049 | $ | 26,030 | $ | 14,376 | |||||
See Notes to Consolidated Financial Statements
61
INTERNATIONAL FLAVORS & FRAGRANCES INC.
CONSOLIDATED STATEMENT OF SHAREHOLDERS’ EQUITY
(DOLLARS IN THOUSANDS) | Common stock | Capital in excess of par value | Retained earnings | Accumulated other comprehensive (loss) income | Treasury stock | Non-controlling interest | Total | |||||||||||||||||||||||
Shares | Cost | |||||||||||||||||||||||||||||
Balance at December 31, 2013 | $ | 14,470 | $ | 131,461 | $ | 3,075,657 | $ | (392,711 | ) | (34,377,594 | ) | $ | (1,365,805 | ) | $ | 3,979 | $ | 1,467,051 | ||||||||||||
Net income | 414,543 | 149 | 414,692 | |||||||||||||||||||||||||||
Cumulative translation adjustment | (69,064 | ) | (69,064 | ) | ||||||||||||||||||||||||||
Gains on derivatives qualifying as hedges; net of tax $(2,526) | 16,383 | 16,383 | ||||||||||||||||||||||||||||
Pension liability and postretirement adjustment; net of tax $36,554 | (95,038 | ) | (95,038 | ) | ||||||||||||||||||||||||||
Cash dividends declared ($1.72 per share) | (139,466 | ) | (139,466 | ) | ||||||||||||||||||||||||||
Stock options | 9,770 | 87,706 | 3,590 | 13,360 | ||||||||||||||||||||||||||
Treasury share repurchases | (927,339 | ) | (88,959 | ) | (88,959 | ) | ||||||||||||||||||||||||
Vested restricted stock units and awards | (23,871 | ) | 136,627 | 4,953 | (18,918 | ) | ||||||||||||||||||||||||
Stock-based compensation | 22,648 | 22,648 | ||||||||||||||||||||||||||||
Balance at December 31, 2014 | $ | 14,470 | $ | 140,008 | $ | 3,350,734 | $ | (540,430 | ) | (35,080,600 | ) | $ | (1,446,221 | ) | $ | 4,128 | $ | 1,522,689 | ||||||||||||
Net income | 419,247 | 544 | 419,791 | |||||||||||||||||||||||||||
Cumulative translation adjustment | (124,157 | ) | (124,157 | ) | ||||||||||||||||||||||||||
Losses on derivatives qualifying as hedges; net of tax $463 | (2,970 | ) | (2,970 | ) | ||||||||||||||||||||||||||
Pension liability and postretirement adjustment; net of tax $(29,452) | 54,117 | 54,117 | ||||||||||||||||||||||||||||
Cash dividends declared ($2.06 per share) | (165,727 | ) | (165,727 | ) | ||||||||||||||||||||||||||
Stock options | 6,099 | 194,016 | 7,085 | 13,184 | ||||||||||||||||||||||||||
Treasury share repurchases | (1,074,210 | ) | (121,193 | ) | (121,193 | ) | ||||||||||||||||||||||||
Vested restricted stock units and awards | (28,465 | ) | 124,895 | 4,560 | (23,905 | ) | ||||||||||||||||||||||||
Stock-based compensation | 23,160 | — | — | 23,160 | ||||||||||||||||||||||||||
Balance at December 31, 2015 | $ | 14,470 | $ | 140,802 | $ | 3,604,254 | $ | (613,440 | ) | (35,835,899 | ) | $ | (1,555,769 | ) | $ | 4,672 | $ | 1,594,989 | ||||||||||||
Net income | 405,031 | 218 | 405,249 | |||||||||||||||||||||||||||
Cumulative translation adjustment | (54,526 | ) | (54,526 | ) | ||||||||||||||||||||||||||
Losses on derivatives qualifying as hedges; net of tax $(227) | (1,797 | ) | (1,797 | ) | ||||||||||||||||||||||||||
Pension liability and postretirement adjustment; net of tax $3,049 | (10,332 | ) | (10,332 | ) | ||||||||||||||||||||||||||
Cash dividends declared ($2.40 per share) | (190,750 | ) | (190,750 | ) | ||||||||||||||||||||||||||
Stock options | 8,952 | 30,015 | 1,335 | 10,287 | ||||||||||||||||||||||||||
Treasury share repurchases | (1,058,018 | ) | (127,443 | ) | (127,443 | ) | ||||||||||||||||||||||||
Vested restricted stock units and awards | (21,860 | ) | 218,749 | 2,730 | (19,130 | ) | ||||||||||||||||||||||||
Stock-based compensation | 24,587 | — | — | 24,587 | ||||||||||||||||||||||||||
Balance at December 31, 2016 | $ | 14,470 | $ | 152,481 | $ | 3,818,535 | $ | (680,095 | ) | (36,645,153 | ) | $ | (1,679,147 | ) | $ | 4,890 | $ | 1,631,134 | ||||||||||||
See Notes to Consolidated Financial Statements
62
INTERNATIONAL FLAVORS & FRAGRANCES INC.
NOTES TO CONSOLIDATED FINANCIAL STATEMENTS
NOTE 1. NATURE OF OPERATIONS AND SUMMARY OF SIGNIFICANT ACCOUNTING POLICIES
Nature of Operations International Flavors & Fragrances Inc. and its subsidiaries (the “Registrant,” “IFF,” “the Company,” “we,” “us” and “our”) is a leading creator and manufacturer of flavors and fragrances (including cosmetic active ingredients) used to impart or improve flavor or fragrance in a wide variety of consumer products. Our products are sold principally to manufacturers of perfumes and cosmetics, hair and other personal care products, soaps and detergents, cleaning products, dairy, meat and other processed foods, beverages, snacks and savory foods, sweet and baked goods, and pharmaceutical and oral care products.
Fiscal Year End The Company has historically operated on a 52/53 week fiscal year generally ending on the Friday closest to the last day of the year. For ease of presentation, December 31 is used consistently throughout the financial statements and notes to represent the period-end date. The 2016 and 2015 fiscal years were 52 week periods and the 2014 fiscal year was a 53 week period. For the 2016, 2015 and 2014 fiscal years, the actual closing dates were December 30, January 1 and January 2, respectively.
Use of Estimates The preparation of financial statements in conformity with accounting principles generally accepted in the United States requires management to make estimates and assumptions that affect the reported amounts and accompanying disclosures. These estimates are based on management’s best knowledge of current events and actions the Company may undertake in the future. Actual results may ultimately differ from estimates.
Principles of Consolidation The consolidated financial statements include the accounts of International Flavors & Fragrances Inc. and those of its subsidiaries. Significant intercompany balances and transactions have been eliminated. To the extent a subsidiary is not wholly owned, any related noncontrolling interest is included as a separate component of Shareholders’ Equity. Any applicable expense (income) attributable to the noncontrolling interest is included in Other expense, net in the accompanying Consolidated Statement of Income and Comprehensive Income due to its immateriality and, as such, is not presented separately.
Revenue Recognition The Company recognizes revenue when the earnings process is complete. This generally occurs when (i) title and risk of loss have been transferred to the customer in accordance with the terms of sale and (ii) collection is reasonably assured. Sales are reduced, at the time revenue is recognized, for applicable discounts, rebates and sales allowances based on historical experience. Related accruals are included in Other current liabilities in the accompanying Consolidated Balance Sheet.
Foreign Currency Translation The Company translates the assets and liabilities of non-U.S. subsidiaries into U.S. dollars at year-end exchange rates. Income and expense items are translated at average exchange rates during the year. Cumulative translation adjustments are shown as a separate component of Shareholders’ Equity.
Research and Development Research and development (“R&D”) expenses relate to the development of new and improved flavors or fragrances, technical product support and compliance with governmental regulation. All research and development costs are expensed as incurred.
Cash Equivalents Cash equivalents include highly liquid investments with maturities of three months or less at date of purchase.
Accounts Receivable The Company sells certain accounts receivable on a non-recourse basis to unrelated financial institutions under “factoring” agreements that are sponsored, solely and individually, by certain customers. The Company accounts for these transactions as sale of receivables, removes the receivables sold from its financial statements, and records cash proceeds when received by the Company. The beneficial impact on cash provided by operations from participating in these programs increased approximately $34.0 million, $3.4 million and $33.1 million in 2016, 2015 and 2014, respectively. The cost of participating in these programs was immaterial to our results in all periods.
63
Inventories Inventories are stated at the lower of cost (on a weighted-average basis) or market. Our inventories consisted of the following:
December 31, | |||||||
(DOLLARS IN THOUSANDS) | 2016 | 2015 | |||||
Raw materials | $ | 288,629 | $ | 282,181 | |||
Work in process | 13,792 | 17,450 | |||||
Finished goods | 289,596 | 272,416 | |||||
Total | $ | 592,017 | $ | 572,047 | |||
Long-Lived Assets
Property, Plant and Equipment Property, plant and equipment are recorded at cost. Depreciation is calculated on a straight-line basis, principally over the following estimated useful lives: buildings and improvements, 10 to 40 years; machinery and equipment, 3 to 20 years; information technology hardware and software, 3 to 7 years; and leasehold improvements which are included in buildings and improvements, the estimated life of the improvements or the remaining term of the lease, whichever is shorter.
Finite-Lived Intangible Assets Finite-lived intangible assets include customer relationships, patents, trade names, technological know-how and other intellectual property valued at acquisition and amortized on a straight-line basis over the following estimated useful lives: customer relationships, 11 - 24 years; patents, 10 - 15 years; trade names, approximately 30 years and technological know-how, 19 - 28 years.
The Company reviews long-lived assets for impairment when events or changes in business conditions indicate that their full carrying value may not be recovered. An estimate of undiscounted future cash flows produced by an asset or group of assets is compared to the carrying value to determine whether impairment exists. If assets are determined to be impaired, the loss is measured based on an estimate of fair value using various valuation techniques, including a discounted estimate of future cash flows.
Goodwill Goodwill represents the difference between the total purchase price and the fair value of identifiable assets and liabilities acquired in business acquisitions.
In assessing the potential for impairment of goodwill, management uses the most current actual and forecasted operating data available and current market-based assumptions in accordance with the criteria in FASB Accounting Standards Codification ("ASC") 350. The Company has identified four reporting units: (1) Flavors, (2) Fragrance Compounds, (3) Fragrance Ingredients and (4) Cosmetic Actives Ingredients. These reporting units were determined based on the level at which the performance is measured and reviewed by segment management.
The Company performs an annual goodwill impairment test utilizing the two-step approach for the Flavors, Fragrance Compounds, Fragrance Ingredients and Cosmetic Actives Ingredients reporting units, by assessing the fair value of the reporting units based on discounted cash flows. The Company completed its annual goodwill impairment test as of November 30, 2016, which indicated no impairment of goodwill, as the estimated fair values substantially exceeded the carrying values of each of these reporting units.
Income Taxes The Company accounts for taxes under the asset and liability method. Under this method, deferred income taxes are recognized for temporary differences between the financial statement and tax return bases of assets and liabilities, based on enacted tax rates and other provisions of the tax law. The effect of a change in tax laws or rates on deferred tax assets and liabilities is recognized as income in the period in which such change is enacted. Future tax benefits are recognized to the extent that the realization of such benefits is more likely than not, and a valuation allowance is established for any portion of a deferred tax asset that management believes may not be realized.
The Company recognizes uncertain tax positions that it has taken or expects to take on a tax return. Pursuant to accounting requirements, the Company first determines whether it is “more likely than not” its tax position will be sustained if the relevant tax authority were to audit the position with full knowledge of all the relevant facts and other information. For those tax positions that meet this threshold, the Company measures the amount of tax benefit based on the largest amount of tax benefit that it has a greater than 50% chance of realizing in a final settlement with the relevant authority. Those tax positions failing to qualify for initial recognition are recognized in the first interim period in which they meet the more likely than not standard. The Company maintains a cumulative risk portfolio relating to all of its uncertainties in income taxes in order to perform this analysis, but the evaluation of its tax positions requires significant judgment and estimation in part because, in
64
certain cases, tax law is subject to varied interpretation, and whether a tax position will ultimately be sustained may be uncertain.
The Company regularly repatriates a portion of current year earnings from select non–U.S. subsidiaries. No provision has been made for additional taxes on undistributed earnings of subsidiary companies that are intended and planned to be indefinitely invested in such subsidiaries. The Company intends to, and has plans to, reinvest these earnings indefinitely in its foreign subsidiaries to fund local operations, capital projects and/or aquisitions.
Interest and penalties related to unrecognized tax benefits are recognized as a component of income tax expense.
Retirement Benefits Current service costs of retirement plans and postretirement health care and life insurance benefits are accrued. Prior service costs resulting from plan improvements are amortized over periods ranging from 10 to 20 years.
Financial Instruments Derivative financial instruments are used to manage interest and foreign currency exposures. The gain or loss on the hedging instrument is recorded in earnings at the same time as the transaction being hedged is recorded in earnings. The associated asset or liability related to the open hedge instrument is recorded in Prepaid expenses and Other current assets or Other current liabilities, as applicable.
The Company records all derivative financial instruments on the balance sheet at fair value. Changes in a derivative’s fair value are recognized in earnings unless specific hedge criteria are met. If the derivative is designated as a fair value hedge, the changes in the fair value of the derivative and of the hedged item attributable to the hedged risk are recognized in Net income. If the derivative is designated as a cash flow hedge, the effective portions of changes in the fair value of the derivative are recorded in Accumulated other comprehensive income ("AOCI") in the accompanying Consolidated Balance Sheet and are subsequently recognized in Net income when the hedged item affects earnings. Ineffective portions of changes in the fair value of cash flow hedges, if any, are recognized as a charge or credit to earnings.
Software Costs The Company capitalizes direct internal and external development costs for certain significant projects associated with internal-use software and amortizes these costs over 7 years. Neither preliminary evaluation costs nor costs associated with the software after implementation are capitalized. Costs related to projects that are not significant are expensed as incurred.
Shipping and Handling Costs Net sales include shipping and handling charges billed to customers. Cost of goods sold includes all costs incurred in connection with shipping and handling.
Net Income Per Share Net income per share is based on the weighted average number of shares outstanding. A reconciliation of shares used in the computations of basic and diluted net income per share is as follows:
Number of Shares | ||||||||
(SHARES IN THOUSANDS) | 2016 | 2015 | 2014 | |||||
Basic | 79,648 | 80,449 | 80,936 | |||||
Assumed dilution under stock plans | 333 | 442 | 558 | |||||
Diluted | 79,981 | 80,891 | 81,494 | |||||
An immaterial amount of Stock-Settled Appreciation Rights (“SSARs”) were excluded from the computation of diluted net income per share at December 31, 2016 and 2015. There were no stock options or SSARs excluded from the computation in 2014.
The Company has issued shares of Purchased Restricted Stock ("PRS") and Purchased Restricted Stock Units (“PRSUs”) which contain nonforfeitable rights to dividends and thus are considered participating securities which are required to be included in the computation of basic and diluted earnings per share pursuant to the two-class method. The two-class method was not presented since the difference between basic and diluted net income per share for both common shareholders, PRS and PRSU holders was less than $0.01 per share for each year and the number of PRS and PRSUs outstanding as of December 31, 2016, 2015 and 2014 was immaterial. Net income allocated to such PRS and PRSUs during 2016, 2015 and 2014 was approximately $1.0 million, $2.0 million and $2.4 million, respectively.
Stock-Based Compensation Compensation cost of all stock-based awards is measured at fair value on the date of grant and recognized over the service period for which awards are expected to vest. The cost of such stock-based awards is principally recognized on a straight-line attribution basis over their respective vesting periods, net of estimated forfeitures.
65
New Accounting Standards
In January 2017, the Financial Accounting Standards Board (“FASB”) issued amendments to the Business Combination guidance which clarifies the definition of a business in order to assist companies when evaluating whether transactions should be accounted for as acquisitions or disposals of assets or businesses. This guidance will be effective prospectively for annual and interim periods beginning after December 15, 2017. This guidance may have an impact on accounting for future acquisitions.
In January 2017, the FASB issued an amendment to the Goodwill Impairment guidance which eliminates Step 2 from the goodwill impairment test. This guidance will be effective for fiscal years beginning after December 15, 2019. Early adoption is permitted. The Company plans to adopt this guidance in accordance with its existing annual impairment review policy in fiscal year 2017. The Company does not expect this adoption to have an impact on its consolidated financial statements.
In October 2016, the FASB issued authoritative guidance which allows for the immediate recognition of current and deferred income tax impact on intra-entity asset transfers, excluding inventory. This guidance will be effective for fiscal years beginning after December 15, 2017. Early adoption is only permitted as of the beginning of an annual reporting period. This guidance must be adopted using a modified retrospective transition. The Company plans to adopt this guidance in the first quarter of fiscal year 2017 and accordingly, will record a cumulative-effect adjustment directly to Retained earnings of approximately $47 million.
In August 2016, the FASB issued authoritative guidance which requires changes to the classification of certain activities within the statement of cash flows. This guidance will be effective for annual and interim periods beginning after December 15, 2017. Early adoption will be permitted for all entities. The Company does not expect this adoption to have a significant impact on its statement of cash flows.
In March 2016, the FASB issued authoritative guidance which requires changes to several aspects of the accounting for share-based payment transactions, including the treatment of income tax consequences, classification of awards as either equity or liabilities, and classification of certain items on the statement of cash flows. This guidance will be effective for annual and interim periods beginning after December 15, 2016. The standard requires that employee taxes paid when an employer withholds shares be presented in the Consolidated Statement of Cash Flows as a financing activity instead of an operating activity. The Company expects to adopt this change retroactively and that the impact of this aspect of the standard on the Consolidated Statement of Cash Flows will be approximately $13-$25 million on an annual basis. In addition, the standard requires that excess tax benefits presented in the Consolidated Statement of Cash Flows be classified as an operating activity instead of a financing activity. The Company expects to adopt this change retroactively and that the impact of this aspect of the standard on the Consolidated Statement of Cash Flows will be approximately $5-$12 million on an annual basis. The standard also requires all excess tax benefits/deficiencies be recognized as income tax expense/benefit in the income statement to be applied on a prospective basis. Depending on the future volatility of the stock price, the impact of this aspect of the standard could have a material impact on tax expense on its Consolidated Statement of Income and Comprehensive Income. Additionally, the standard allows the Company to make an entity-wide accounting policy election to either estimate the number of awards that are expected to vest or account for forfeitures as they occur. The Company plans to continue to account for forfeitures using an estimate of awards expected to be forfeited. Lastly, the standard requires that the threshold for equity classification of awards permits withholding up to the maximum statutory tax rates in the applicable jurisdictions. The adoption of this aspect of the standard will impact future vestings.
In February 2016, the FASB issued authoritative guidance which requires changes to the accounting for leases. The new guidance establishes a new lease accounting model, that requires entities to record assets and liabilities related to leases on the balance sheet for certain types of leases. The guidance will be effective for annual and interim periods beginning after December 31, 2018. Early adoption will be permitted for all entities. The Company expects the adoption of this guidance will result in significant increases to assets and liabilities on its Consolidated Balance Sheet and is still evaluating the impact on its Consolidated Statement of Income and Comprehensive Income.
In September 2015, the FASB issued authoritative guidance related to the adjustments made during the measurement period for items in a business combination. Specifically, the new guidance requires adjustments related to the finalization of estimates to be recorded in the period when they are determined and to provide certain additional disclosures. This guidance is effective for fiscal years beginning after December 15, 2015. The Company adopted this guidance during 2016 and the adoption did not have a significant impact on its consolidated financial statements.
In May 2015, the FASB issued authoritative guidance which removed the requirement to categorize within the fair value hierarchy investments for which fair values are estimated using the net asset value practical expedient. The Company has adopted this guidance for the year ended December 31, 2016 and has reclassified prior year amounts for the year ended December 31, 2015 as disclosed in Note 14 to the Consolidated Financial Statements.
66
In April 2015, the FASB issued authoritative guidance which requires that debt issuance costs related to a recognized debt liability be presented in the balance sheet as a direct deduction from the carrying amount of that debt liability. This guidance is effective for annual and interim periods beginning after December 15, 2015. The Company adopted this guidance retrospectively in 2016 and accordingly has reclassified all debt issuance costs on long-term debt as a direct deduction from the carrying amount of the debt liability in the Consolidated Balance Sheet as of December 31, 2015. The adoption of this guidance did not have a significant impact on its consolidated financial statements.
In May 2014, the FASB issued authoritative guidance that provides for a comprehensive model to be used in accounting for revenue arising from contracts with customers. Under this standard, revenue will be recognized to depict the transfer of goods or services to customers in an amount that reflects the consideration to which the Company expects to be entitled in exchange for those goods or services. This guidance is applicable to all entities and is effective for annual and interim periods beginning after December 15, 2017. Adoption as of the original effective date is permitted. Accordingly, the Company is required to adopt this standard in the first quarter of fiscal year 2018. Companies have the option to apply the new guidance under a retrospective approach to each prior reporting period presented or a modified retrospective approach with the cumulative effect of initially applying the new guidance recognized at the date of initial application within the Consolidated Balance Sheet. The Company is evaluating the impact of the new standard, including updates to the standard that have been proposed by the FASB. In particular, the Company has reviewed the nature of its larger customer relationships and is in the process of reviewing the nature of potential regional variations in all aspects of its customer base regardless of size. Based on the work performed to date, the Company expects to conduct further review and analysis of certain areas that may lead to changes in the manner in which the Company recognizes revenue, including the customized nature of the product, consignment arrangements, rebates, upfront costs, shipping terms and documentation other than formal contracts. As a result, the financial statement impact has not yet been determined. The Company is also currently evaluating the method of adoption and the potential impacts to the consolidated financial statements and related disclosures.
Reclassifications and Revisions
Certain prior year amounts have been reclassified and revised to conform with current year presentation.
The Consolidated Balance Sheet as of December 31, 2015, has been revised to properly reflect in-bound goods in transit. Accordingly, Inventory and Accounts payable decreased by $17.0 million. This adjustment was not material to the previously-issued financial statements.
NOTE 2. RESTRUCTURING AND OTHER CHARGES
Restructuring and other charges primarily consist of separation costs for employees including severance, outplacement and other benefit costs.
2015 Severance and Contingent Consideration Charges
During the fourth quarter of 2015, the Company established a series of initiatives intended to streamline its management structure, simplify decision-making and accountability, better leverage and align its capabilities across the organization and improve efficiency of its global manufacturing and operations network. As a result, in 2015, the Company recorded a pre-tax charge of $7.6 million, included in Restructuring and other charges, net, related to severance and related costs pertaining to approximately 150 positions that will be affected. During 2016, the Company made payments of $2.9 million and recorded accelerated depreciation expense of $0.7 million. In addition, during 2016, the Company recorded a credit of $1.7 million related to the reversal of severance accruals that were determined to be no longer required. The total cost of the plan is now expected to be approximately $8.8 million with the remaining charges related principally to accelerated depreciation. The Company expects the plan to be fully completed the second half of 2017.
Separately, in 2015, the Company recorded a charge of $7.2 million, included in Selling and administrative expenses, associated with the acceleration from 2016 to 2015 of contingent consideration payments from the Aromor acquisition that were triggered by certain of the management structure changes noted above.
Fragrance Ingredients Rationalization - 2014
In 2014, the Company closed its fragrance ingredients manufacturing facility in Augusta, Georgia and consolidated production into other Company facilities. In connection with this closure, the Company incurred charges of $13.8 million, consisting primarily of $10.3 million in accelerated depreciation of fixed assets, $2.2 million in personnel-related costs and $1.3 million in plant shutdown and other related costs. The Company recorded total charges of $7.4 million during 2013, consisting of $2.2 million of pre-tax charges related to severance included in Restructuring and other charges, net and $5.2 million of non-cash charges related to accelerated depreciation included in Cost of goods sold. During 2014, the Company recorded $1.3 million of plant shutdown and other related costs included in Restructuring and other charges, net as well as an
67
additional $5.1 million of non-cash charges related to accelerated depreciation included in Cost of goods sold. As a result of this closure, 43 positions have been eliminated. During 2015, the Company recorded a net credit of $0.5 million principally related to the reversal of severance accruals.
Rollforward of Liability
Movements in related accruals during 2014, 2015 and 2016 are as follows:
(DOLLARS IN THOUSANDS) | Employee- Related | Asset - Related/and Other | Total | ||||||||
Balance at January 1, 2014 | $ | 2,116 | $ | — | $ | 2,116 | |||||
Additional charges (reversals), net | (46 | ) | 6,444 | 6,398 | |||||||
Non-cash charges | — | (5,100 | ) | (5,100 | ) | ||||||
Payments and other costs | (1,311 | ) | (1,344 | ) | (2,655 | ) | |||||
Balance at December 31, 2014 | 759 | — | 759 | ||||||||
Additional charges (reversals), net | 7,594 | — | 7,594 | ||||||||
Payments and other costs | (471 | ) | — | (471 | ) | ||||||
Balance at December 31, 2015 | 7,882 | — | 7,882 | ||||||||
Additional charges (reversals), net | (1,700 | ) | 658 | (1,042 | ) | ||||||
Non-cash charges | — | (658 | ) | (658 | ) | ||||||
Payments and other costs | (2,905 | ) | — | (2,905 | ) | ||||||
Balance at December 31, 2016 | $ | 3,277 | $ | — | $ | 3,277 | |||||
NOTE 3. ACQUISITIONS
Fragrance Resources
On January 17, 2017, the Company completed the acquisition of Fragrance Resources, a privately-held fragrance company with facilities in Germany, North America, France, and China. The acquisition will be accounted for under the purchase method. Fragrance Resources was acquired to strengthen the North American and German fragrances business. The Company paid approximately Euro 142 million (approximately $150.5 million) including approximately Euro 6.8 million (approximately $7.2 million) of cash acquired for this acquisition, which was funded from existing resources. Due to the limited time since closing and the fact that the purchase price allocation has not been completed, the Company has not yet calculated the actual amounts related to the assets and liabilities acquired in the Fragrance Resources transaction. As a result, certain required disclosures have not been made. The purchase price allocation is expected to be completed by the third quarter of 2017.
No pro forma financial information for 2016 is presented as the acquisition was not material to the consolidated financial statements.
2016 Activity
David Michael
On October 7, 2016, the Company completed the acquisition of 100% of the outstanding shares of David Michael & Company, Inc. ("David Michael"). The acquisition was accounted for under the purchase method. David Michael was acquired to strengthen the North American flavors business. The Company paid approximately $242.0 million (including $5.1 million of cash acquired) for this acquisition, which was funded from existing resources. The purchase price exceeded the preliminary fair value of existing net assets by approximately $169.0 million. The excess was allocated principally to identifiable intangible assets including approximately $90.0 million related to customer relationships, approximately $8.4 million related to proprietary technology and trade name and approximately $70.7 million of goodwill (which is deductible for tax purposes). Goodwill is the excess of the purchase price over the fair value of net assets acquired. Goodwill represents synergies from the addition of David Michael to the Company's existing Flavors business. The intangible assets are being amortized over the following estimated useful lives: trade name and proprietary technology, up to 5 years and customer relationships, 18 - 20 years. The purchase price allocation is preliminary pending the finalization of certain procedures associated with purchase price, contractually required to be completed subsequent to December 31, 2016 as well as the finalization of the analysis associated with customer relationships and certain other assets. The purchase price allocation is expected to be completed by the first half of 2017.
No pro forma financial information for 2016 is presented as the impact of the acquisition was immaterial to the Consolidated Statement of Comprehensive Income.
68
2015 Activity
Lucas Meyer
During the third quarter of 2015, the Company completed the acquisition of 100% of the outstanding shares of Lucas Meyer Cosmetics, a business of Unipex Group ("Lucas Meyer"). The total shares acquired include shares effectively acquired pursuant to put and call option agreements. The acquisition was accounted for under the purchase method. Total consideration was approximately Euro 284.0 million ($312.1 million), including approximately $4.8 million of cash acquired. The Company paid Euro 282.1 million (approximately $309.9 million) for this acquisition, which was funded from existing resources, and recorded a liability of approximately Euro 2.0 million (approximately $2.2 million). The purchase price exceeded the fair value of existing net assets by approximately $290.1 million. The excess was allocated principally to identifiable intangible assets (approximately $156.4 million), goodwill (approximately $179.5 million) and approximately $40.1 million to deferred taxes. Goodwill is the excess of the purchase price over the fair value of net assets acquired. Goodwill represents the value the Company expects to achieve from its expansion into new segments of the industry. Separately identifiable intangible assets are principally related to customer relationships, proprietary technology and patents. The intangible assets are being amortized over the following estimated useful lives: trade names and proprietary technology, 28 years; customer relationships, 23 years; patents, 11 years; and non-solicitation agreements, 3 years. The purchase price allocation was completed during the second quarter of 2016.
No pro forma financial information for 2015 is presented as the impact of the acquisition was immaterial to the Consolidated Statement of Comprehensive Income.
Ottens Flavors
During the second quarter of 2015, the Company completed the acquisition of 100% of the outstanding shares of Henry H. Ottens Manufacturing Co., Inc. ("Ottens Flavors"). The acquisition was accounted for under the purchase method. The Company paid $198.9 million (including $10.4 million of cash acquired) for this acquisition, which was funded from existing resources. The purchase price exceeded the fair value of existing net assets by $162.1 million. The excess was allocated principally to identifiable intangible assets ($80.0 million) and goodwill ($82.1 million, which is deductible for tax purposes). Goodwill represents synergies from the addition of Ottens Flavors to the Company's existing Flavors business. Separately identifiable intangible assets are principally related to customer relationships and proprietary flavors technology. The intangible assets are being amortized using lives ranging from 5-17 years. The purchase price allocation was completed during the fourth quarter of 2015.
No pro forma financial information for 2015 is presented as the impact of the acquisition was immaterial to the Consolidated Statement of Comprehensive Income.
NOTE 4. PROPERTY, PLANT AND EQUIPMENT, NET
Property, plant and equipment consisted of the following amounts:
(DOLLARS IN THOUSANDS) | December 31, | ||||||
2016 | 2015 | ||||||
Asset Type | |||||||
Land | $ | 36,366 | $ | 22,896 | |||
Buildings and improvements | 519,947 | 538,096 | |||||
Machinery and equipment | 1,052,114 | 991,746 | |||||
Information technology | 182,153 | 183,759 | |||||
Construction in process | 122,753 | 75,786 | |||||
1,913,333 | 1,812,283 | ||||||
Accumulated depreciation | (1,137,617 | ) | (1,079,489 | ) | |||
$ | 775,716 | $ | 732,794 | ||||
Depreciation expense was $78.6 million for the year ended December 31, 2016, and $74.8 million and $82.0 million for the years ended December 31, 2015 and 2014, respectively.
NOTE 5. GOODWILL AND OTHER INTANGIBLE ASSETS, NET
Goodwill
69
Movements in goodwill during 2014, 2015 and 2016 were as follows:
(DOLLARS IN THOUSANDS) | Goodwill | ||
Balance at January 1, 2014 | $ | 665,582 | |
Acquisitions | 9,902 | ||
Balance at December 31, 2014 | 675,484 | ||
Acquisitions | 265,905 | ||
Balance at December 31, 2015 | 941,389 | ||
Acquisitions | 67,480 | ||
Foreign exchange | (8,746 | ) | |
Balance at December 31, 2016 | $ | 1,000,123 | |
Goodwill by segment was as follows:
December 31, | |||||||
(DOLLARS IN THOUSANDS) | 2016 | 2015 | |||||
Flavors | $ | 473,820 | $ | 401,494 | |||
Fragrances | 526,303 | 539,895 | |||||
Total | $ | 1,000,123 | $ | 941,389 | |||
The increase reflected in Flavors above represents the preliminary purchase price allocation of David Michael as disclosed in Note 3. The decrease reflected in Fragrances above represents the impact of finalizing the purchase price allocation of Lucas Meyer as disclosed in Note 3.
Other Intangible Assets
Other intangible assets, net consisted of the following amounts:
December 31, | |||||||
(DOLLARS IN THOUSANDS) | 2016 | 2015 | |||||
Asset Type | |||||||
Customer relationships | $ | 371,270 | $ | 293,799 | |||
Trade names & patents | 30,679 | 34,182 | |||||
Technological know-how | 119,544 | 112,393 | |||||
Other | 24,470 | 22,711 | |||||
Total carrying value | 545,963 | 463,085 | |||||
Accumulated Amortization | |||||||
Customer relationships | (82,555 | ) | (66,324 | ) | |||
Trade names & patents | (12,198 | ) | (10,282 | ) | |||
Technological know-how | (68,292 | ) | (65,258 | ) | |||
Other | (17,135 | ) | (15,217 | ) | |||
Total accumulated amortization | (180,180 | ) | (157,081 | ) | |||
Other intangible assets, net | $ | 365,783 | $ | 306,004 | |||
Amortization expense was $23.8 million for the year ended December 31, 2016, and $15.0 million and $7.3 million for the years ended December 31, 2015 and 2014, respectively. Estimated annual amortization (excluding the recent acquisition of Fragrance Resources) is $27.7 million for the year 2017, $27.2 million for the year 2018, $26.0 million for the year 2019, $25.3 million for the year 2020 and $20.8 million for 2021.
NOTE 6. OTHER ASSETS
Other assets consisted of the following amounts:
70
December 31, | |||||||
(DOLLARS IN THOUSANDS) | 2016 | 2015 | |||||
Overfunded pension plans | $ | 4,343 | $ | 4,906 | |||
Cash surrender value of life insurance contracts | 43,425 | 41,957 | |||||
Other | 79,944 | 71,528 | |||||
Total | $ | 127,712 | $ | 118,391 | |||
NOTE 7. OTHER CURRENT LIABILITIES
Other current liabilities consisted of the following amounts:
December 31, | |||||||
(DOLLARS IN THOUSANDS) | 2016 | 2015 | |||||
Accrued payrolls and bonuses | $ | 64,357 | $ | 48,843 | |||
VAT payable | 15,567 | 10,241 | |||||
Interest payable | 17,173 | 12,515 | |||||
Current pension and other postretirement benefit obligation | 10,630 | 10,620 | |||||
Accrued insurance (including workers’ compensation) | 10,798 | 10,857 | |||||
Restructuring and other charges | 3,277 | 7,882 | |||||
Litigation accrual | 55,000 | 5,000 | |||||
Other | 137,486 | 156,524 | |||||
Total | $ | 314,288 | $ | 262,482 | |||
NOTE 8. SALE AND LEASEBACK TRANSACTIONS
In connection with the disposition of certain real estate in prior years, the Company entered into long-term operating leases. The leases are classified as operating leases and the gains realized on these leases have been deferred and are being credited to income over the initial lease term. Such deferred gains totaled $35.6 million and $38.4 million at December 31, 2016 and 2015, respectively, of which $32.4 million and $35.2 million, respectively, are reflected in the accompanying Consolidated Balance Sheet under Deferred gains, with the remainder included as a component of Other current liabilities.
NOTE 9. BORROWINGS
Debt consisted of the following at December 31:
(DOLLARS IN THOUSANDS) | Rate | Maturities | 2016 | 2015 | ||||||||
Senior notes — 2006 (1) | 6.14 | % | 2016 | $ | — | $ | 124,964 | |||||
Senior notes — 2007 (1) | 6.40 | % | 2017-27 | 499,676 | 499,618 | |||||||
Senior notes — 2013 (1) | 3.20 | % | 2023 | 297,986 | 297,683 | |||||||
Euro Senior notes - 2016 (1) | 1.75 | % | 2024 | 512,764 | — | |||||||
Credit facilities | 1.13 | % | 2019 | — | 131,196 | |||||||
Bank overdrafts and other | 13,599 | 10,982 | ||||||||||
Deferred realized gains on interest rate swaps | 1,346 | 3,279 | ||||||||||
1,325,371 | 1,067,722 | |||||||||||
Less: Bank borrowings, overdrafts and current portion of long-term debt | (258,516 | ) | (132,349 | ) | ||||||||
$ | 1,066,855 | $ | 935,373 | |||||||||
(1) Amount is net of unamortized discount and debt issuance costs.
Euro Senior Notes - 2016
On March 14, 2016, the Company issued Euro 500.0 million face amount of 1.75% Senior Notes ("Euro Senior Notes - 2016") due 2024 at a discount of Euro 0.9 million. The Company received proceeds related to the issuance of these Euro Senior Notes - 2016 of Euro 496.0 million which was net of the Euro 0.9 million discount and Euro 3.1 million underwriting discount (recorded as deferred financing costs). In addition, the Company incurred $1.3 million of other deferred financing costs in connection with the debt issuance. In connection with the debt issuance, the Company entered into pre-issuance hedging
71
transactions that were settled upon issuance of the debt and resulted in a loss of approximately $3.2 million. The discount, deferred financing costs and pre-issuance hedge loss are being amortized as interest expense over the eight year term of the debt. The Euro Senior Notes - 2016 bear interest at a rate of 1.75% per annum, with interest payable on March 14 of each year, commencing on March 14, 2017. The Euro Senior Notes - 2016 will mature on March 14, 2024.
Upon 30 days’ notice to holders of the Euro Senior Notes - 2016 , the Company may redeem the Euro Senior Notes - 2016 for cash in whole, at any time, or in part, from time to time, prior to maturity, at redemption prices that include accrued and unpaid interest and a make-whole premium, as specified in the indenture governing the Euro Senior Notes - 2016. However, no make-whole premium will be paid for redemptions of the Euro Senior Notes - 2016 on or after December 14, 2023. The indenture provides for customary events of default and contains certain negative covenants that limit the ability of the Company and its subsidiaries to grant liens on assets, or to enter into sale-leaseback transactions. In addition, subject to certain limitations, in the event of the occurrence of both (1) a change of control of the Company and (2) a downgrade of the Euro Senior Notes - 2016 below investment grade rating by both Moody’s Investors Services, Inc. and Standard & Poor’s Ratings Services within a specified time period, the Company will be required to make an offer to repurchase the Notes at a price equal to 101% of the principal amount of the Euro Senior Notes - 2016, plus accrued and unpaid interest to the date of repurchase.
As discussed in Note 15, the Euro Senior Notes - 2016 have been designated as a hedge of the Company's net investment in certain subsidiaries.
Senior Notes - 2013
On April 4, 2013, the Company issued $300.0 million face amount of 3.20% Senior Notes (“Senior Notes - 2013”) due 2023 at a discount of $0.3 million. The Company received proceeds related to the issuance of these Senior Notes - 2013 of $297.8 million which was net of the $0.3 million discount and a $1.9 million underwriting discount (recorded as deferred financing costs). In addition, the Company incurred $0.9 million of other deferred financing costs in connection with the debt issuance. The discount and deferred financing costs are being amortized as interest expense over the term of the Senior Notes - 2013. The Senior Notes - 2013 bear interest at a rate of 3.20% per year, with interest payable on May 1 and November 1 of each year, commencing on November 1, 2013. The Senior Notes - 2013 mature on May 1, 2023. Upon 30 days’ notice to holders of the Senior Notes - 2013, the Company may redeem the Senior Notes - 2013 for cash in whole, at any time, or in part, from time to time, prior to maturity, at redemption prices that include accrued and unpaid interest and a make-whole premium. However, no make-whole premium will be paid for redemptions of the Senior Notes - 2013 on or after February 1, 2023. The Indenture provides for customary events of default and contains certain negative covenants that limit the ability of the Company and its subsidiaries to grant liens on assets, to enter into sale-leaseback transactions or to consolidate with or merge into any other entity or convey, transfer or lease all or substantially all of the Company’s properties and assets. In addition, subject to certain limitations, in the event of the occurrence of both (1) a change of control of the Company and (2) a downgrade of the Senior Notes - 2013 below investment grade rating by both Moody’s Investors Services, Inc. and Standard & Poor’s Ratings Services within a specified time period, the Company will be required to make an offer to repurchase the Senior Notes - 2013 at a price equal to 101% of the principal amount of the Senior Notes - 2013, plus accrued and unpaid interest to the date of repurchase.
Senior Notes - 2007
On September 27, 2007, the Company issued $500 million of Senior Unsecured Notes (“Senior Notes - 2007”) in four series under the Note Purchase Agreement (“NPA”): (i) $250 million in aggregate principal amount of 6.25% Series A Senior Notes due September 27, 2017, (ii) $100 million in aggregate principal amount of 6.35% Series B Notes due September 27, 2019, (iii) $50 million in aggregate principal amount of 6.50% Series C Notes due September 27, 2022, and (iv) $100 million in aggregate principal amount of 6.79% Series D Notes due September 27, 2027.
Senior Notes - 2006
In 2006, the Company issued $375 million of Senior Unsecured Notes (“Senior Notes - 2006”) in four series under another NPA: (i) $50 million in aggregate principal amount of 5.89% Series A Senior Notes due July 12, 2009, (ii) $100 million in aggregate principal amount of 5.96% Series B Notes due July 12, 2011, (iii) $100 million in aggregate principal amount of 6.05% Series C Notes due July 12, 2013, and (iv) $125 million in aggregate principal amount of 6.14% Series D Notes due July 12, 2016.
In 2009, 2011 and 2013, the Company repaid $50 million, $100 million and $100 million, respectively, upon maturity of the first three series. In 2016, the Company made a final payment of $125.0 million on the last series of the Senior Notes - 2006.
72
Total Senior Notes Outstanding
Maturities on the outstanding Euro Senior Notes - 2016, Senior Notes - 2013 and Senior Notes - 2007 at December 31, 2016 were: 2017, $250 million; 2019, $100 million; 2022 and thereafter, $970.5 million. There is no debt maturing in 2018, 2020 or 2021.
The estimated fair value at December 31, 2016 of the Euro Senior Notes - 2016, Senior Notes - 2013 and Senior Notes - 2007 was approximately $546.0 million, $302.4 million and $556.2 million, respectively, and is discussed in further detail in Note 15.
Credit Facility
On December 2, 2016, the Company and certain of its subsidiaries amended and restated the Company’s existing amended and restated credit agreement with Citibank, N.A., as administrative agent, last amended and restated on April 4, 2014 (the “Credit Facility”), to, among other things (i) modify the available tranches of the revolving loan facility provided under the Credit Facility, (ii) extend the maturity date of the Credit Facility until December 2, 2021 and (iii) increase the Company’s required ratio of Net Debt to Consolidated EBITDA under the Facility from 3.25 to 1.0 to 3.50 to 1.0. Tranche A of the Credit Facility is now available to borrowers in U.S. dollars, euros, Swiss francs, Japanese yen and British sterling in an aggregate amount up to an equivalent of approximately $564.1 million, with a sublimit of $25 million for swing line borrowings. Tranche B of the Credit Facility is now available to borrowers in U.S. dollars, euros, Swiss francs, Japanese yen and British sterling in an aggregate amount up to an equivalent of approximately $385.9 million, with sublimits of €50 million and $25 million for swing line borrowings.
The Credit Facility is available for general corporate purposes of each borrower and its subsidiaries. The obligations under the Credit Facility are unsecured and the Company has guaranteed the obligations of each other borrower under the Credit Facility. Borrowings under the Credit Facility bear interest at an annual rate of LIBOR plus a margin, currently 112.5 bps, linked to the Company's credit rating. The Company pays a commitment fee on the aggregate unused commitments; such fee is not material. The Credit Facility contains various affirmative and negative covenants, including the requirement for the Company to maintain, at the end of each fiscal quarter, a ratio of net debt for borrowed money to adjusted EBITDA (Earnings Before Interest, Taxes, Depreciation and Amortization) in respect of the previous 12-month period of not more than 3.50 to 1. As of December 31, 2016, the Company was in compliance with all covenants under this Credit Facility. The Company had no borrowings outstanding under the Credit Facility as of December 31, 2016, with $950 million still available for additional borrowings. As the Credit Facility is a multi-year revolving credit agreement, the Company classifies as long-term debt the portion that it has the intent and ability to maintain outstanding longer than 12 months.
During the first quarter of 2016, the Company repaid the full amount outstanding under the credit facility ($131.2 million).
Short term borrowings, including the current portion of the Senior Notes - 2007, commercial paper, the Credit Facility borrowings and bank overdrafts, were outstanding in several countries and averaged $162.4 million in 2016 and $203.0 million in 2015. The highest levels were $289.3 million in 2016, $415.4 million in 2015, and $8.8 million in 2014. The 2016 weighted average interest rate of these borrowings, based on balances outstanding at the end of each month, was 5.17% compared to 2.67% and 4.13%, respectively, in 2015 and 2014.
Commercial Paper
Commercial paper issued by the Company generally has terms of 30 days or less. During 2016, the Company issued approximately $65 million of commercial paper, which was fully repaid by December 31, 2016. As of December 31, 2016, there was no commercial paper outstanding. The Company did not issue commercial paper during 2015.
Subsequent to December 31, 2016, the Company issued approximately $87.5 million of commercial paper.
Other
During 2013, the Company entered into multiple interest rate swap agreements effectively converting the fixed rate on a portion of certain of the long-term senior notes to a variable short-term rate based on the LIBOR plus an interest markup.
In March 2008, the Company realized an $18 million gain on the termination of an interest rate swap, which has been deferred and is being amortized as a reduction to interest expense over the remaining term of the related debt. The balance of this deferred gain was $1.3 million at December 31, 2016.
73
NOTE 10. INCOME TAXES
Earnings before income taxes consisted of the following:
December 31, | |||||||||||
(DOLLARS IN THOUSANDS) | 2016 | 2015 | 2014 | ||||||||
U.S. income before taxes | $ | 9,078 | $ | 29,792 | $ | 17,650 | |||||
Foreign income before taxes | 514,639 | 509,309 | 531,411 | ||||||||
Total income before taxes | $ | 523,717 | $ | 539,101 | $ | 549,061 | |||||
The income tax provision consisted of the following:
December 31, | |||||||||||
(DOLLARS IN THOUSANDS) | 2016 | 2015 | 2014 | ||||||||
Current | |||||||||||
Federal | $ | (2,920 | ) | $ | 7,648 | $ | 1,175 | ||||
State and local | 1,383 | 199 | 264 | ||||||||
Foreign | 105,873 | 98,964 | 109,729 | ||||||||
104,336 | 106,811 | 111,168 | |||||||||
Deferred | |||||||||||
Federal | 8,838 | 14,379 | 20,795 | ||||||||
State and local | (631 | ) | 399 | 113 | |||||||
Foreign | 6,143 | (1,735 | ) | 2,442 | |||||||
14,350 | 13,043 | 23,350 | |||||||||
Total income taxes | $ | 118,686 | $ | 119,854 | $ | 134,518 | |||||
Effective Tax Rate Reconciliation
A reconciliation between the U.S. federal statutory income tax rate to the actual effective tax rate was as follows:
December 31, | ||||||||
2016 | 2015 | 2014 | ||||||
Statutory tax rate | 35.0 | % | 35.0 | % | 35.0 | % | ||
Difference in effective tax rate on foreign earnings and remittances | (12.2 | ) | (10.7 | ) | (9.9 | ) | ||
Unrecognized tax benefit, net of reversals | 0.6 | (0.8 | ) | 0.8 | ||||
Spanish tax charges | — | (0.4 | ) | — | ||||
Spanish dividend withholdings | — | — | (0.7 | ) | ||||
State and local taxes | 0.1 | 0.1 | 0.1 | |||||
Other, net | (0.8 | ) | (1.0 | ) | (0.8 | ) | ||
Effective tax rate | 22.7 | % | 22.2 | % | 24.5 | % | ||
The effective tax rate reflects the benefit from having significant operations outside the U.S. that are taxed at rates that are lower than the U.S. federal rate of 35%. Included in the 2015 effective tax rate was a $10.5 million benefit related to favorable tax rulings in Spain and another jurisdiction for which reserves were previously recorded. Included in the 2014 effective tax rate was a $3.8 million tax benefit related to the reserve reversal for the 2001 Spanish dividend withholding tax case. The 2016, 2015 and 2014 effective tax rates were also favorably impacted by the reversals of liabilities for uncertain tax positions of $7.5 million, $2.8 million and $2.3 million, respectively, principally due to statutory expiry and effective settlement.
Deferred Taxes
The deferred tax assets consisted of the following amounts:
74
December 31, | |||||||
(DOLLARS IN THOUSANDS) | 2016 | 2015 | |||||
Employee and retiree benefits | $ | 132,638 | $ | 132,379 | |||
Credit and net operating loss carryforwards(1) | 186,062 | 183,594 | |||||
Trademarks and other(2) | 1,406 | 143,727 | |||||
Amortizable R&D expenses(2) | 4,040 | 56,091 | |||||
Other, net | (2,783 | ) | 10,076 | ||||
Gross deferred tax assets | 321,363 | 525,867 | |||||
Property, plant and equipment, net | (17,000 | ) | (11,337 | ) | |||
Trademarks and other | (55,899 | ) | (72,710 | ) | |||
Gross deferred tax liabilities | (72,899 | ) | (84,047 | ) | |||
Valuation allowance(1)(2) | (152,752 | ) | (339,395 | ) | |||
Total net deferred tax assets | $ | 95,712 | $ | 102,425 | |||
_______________________
(1) | During 2016 and 2015, the Company increased its deferred tax assets by $7.6 million and by $10.0 million, respectively, relating to an adjustment to the 2015 and 2014 foreign net operating loss carryforwards, respectively. The entire adjustments of $7.6 million and $10.0 million were offset by corresponding adjustments in valuation allowances. These adjustments are not considered material to the previously issued financial statements. |
(2) | The Company executed a legal entity restructuring that resulted in a significant reduction of fully valued deferred tax assets. |
Net operating loss carryforwards were $149.1 million and $144.1 million at December 31, 2016 and 2015, respectively. If unused, $4.9 million will expire between 2017 and 2036. The remainder, totaling $144.2 million, may be carried forward indefinitely. Tax credit carryforwards were $42.8 million and $42.0 million at December 31, 2016 and 2015, respectively. If unused, the credit carryforwards will expire between 2017 and 2036.
The U.S. consolidated group has historically generated taxable income after the inclusion of foreign dividends. As such, the Company is not in a federal net operating loss position. This allows IFF and its U.S. subsidiaries to realize tax benefits from the reversal of temporary differences and the utilization of its federal tax credits before the expiration of the applicable carryforward periods. The Company has not factored any future trends, other than inflation, in its U.S. taxable income projections. The corresponding U.S. federal taxable income is sufficient to realize $102 million in deferred tax assets as of December 31, 2016.
The majority of states in the U.S. where IFF and its subsidiaries file income tax returns allow a 100% foreign dividend exclusion, effectively converting the domestic companies’ reversing temporary differences into net operating losses. As there is significant doubt with respect to realizability of these net operating losses, the Company has established a full valuation allowance against these deferred tax assets.
Of the $191.9 million deferred tax asset for net operating loss carryforwards and credits at December 31, 2016, the Company considers it unlikely that a portion of the tax benefit will be realized. Accordingly, a valuation allowance of $142.6 million of net operating loss carryforwards and $9.4 million of tax credits has been established against these deferred tax assets, respectively. In addition, due to realizability concerns, the Company established a valuation allowance against certain other net deferred tax assets of $3.2 million.
Uncertain Tax Positions
A reconciliation of the beginning and ending amount of unrecognized tax benefits is as follows:
75
December 31, | |||||||||||
(DOLLARS IN THOUSANDS) | 2016 | 2015 | 2014 | ||||||||
Balance of unrecognized tax benefits at beginning of year | $ | 24,198 | $ | 23,055 | $ | 21,553 | |||||
Gross amount of increases in unrecognized tax benefits as a result of positions taken during a prior year | 1,254 | 18 | 1,795 | ||||||||
Gross amount of decreases in unrecognized tax benefits as a result of positions taken during a prior year | (3 | ) | (43 | ) | (823 | ) | |||||
Gross amount of increases in unrecognized tax benefits as a result of positions taken during the current year | 8,131 | 12,011 | 5,378 | ||||||||
The amounts of decreases in unrecognized benefits relating to settlements with taxing authorities | (6,075 | ) | (10,221 | ) | — | ||||||
Reduction in unrecognized tax benefits due to the lapse of applicable statute of limitation | (1,077 | ) | (622 | ) | (4,848 | ) | |||||
Balance of unrecognized tax benefits at end of year | $ | 26,428 | $ | 24,198 | $ | 23,055 | |||||
At December 31, 2016, 2015 and 2014, there were $19.1 million, $24.2 million, and $22.3 million, respectively, of unrecognized tax benefits recorded to Other liabilities and $7.3 million and $0.7 million recorded to Other current liabilities for 2016 and 2014, respectively. If these unrecognized tax benefits were recognized, all the benefits and related interest would be recorded as a benefit to income tax expense.
For the year ended December 31, 2016, the Company increased its liabilities for interest and penalties by $0.3 million, net, and reduced its liabilities by $1.4 million, net, and $0.1 million, net for the years ended 2015 and 2014, respectively, principally due to payments made pursuant to the Spanish tax settlement, as discussed below. At December 31, 2016, 2015 and 2014, the Company had accrued $0.8 million, $0.8 million and $1.7 million, respectively, of interest and penalties classified as Other liabilities and $0.3 million and $0.5 million in 2016 and 2014, respectively, recorded to Other current liabilities.
As of December 31, 2016, the Company’s aggregate provision for uncertain tax positions, including interest and penalties, was $27.5 million, associated with various tax positions asserted in foreign jurisdictions, none of which is individually material.
Other
Tax benefits credited to Shareholders’ equity totaled $0.2 million in each of the years ended December 31, 2016, 2015 and 2014 associated with stock option exercises and PRSU dividends.
U.S. income taxes and foreign withholding taxes associated with the repatriation of earnings of its foreign subsidiaries were not provided on a cumulative total of $1.9 billion of undistributed earnings of foreign subsidiaries. The Company intends to, and has plans to, reinvest these earnings indefinitely in the Company's foreign subsidiaries to fund local operations and/or capital projects. The unrecognized deferred tax liability on these undistributed earnings approximates $344 million.
The Company has ongoing income tax audits and legal proceedings which are at various stages of administrative or judicial review, of which the material items are discussed below. In addition, the Company has other ongoing tax audits and legal proceedings that relate to indirect taxes, such as value-added taxes, capital tax, sales and use and property taxes, which are discussed in Note 18.
The Company also has several other tax audits in process and has open tax years with various taxing jurisdictions that range primarily from 2006 to 2015. Based on currently available information, the Company does not believe the ultimate outcome of any of these tax audits and other tax positions related to open tax years, when finalized, will have a material impact on its financial position.
NOTE 11. SHAREHOLDERS’ EQUITY
Dividends
Cash dividends declared per share were $2.40, $2.06 and $1.72 in 2016, 2015 and 2014, respectively. The Consolidated Balance Sheet reflects $50.7 million of dividends payable at December 31, 2016. This amount relates to a cash dividend of $0.64 per share declared in December 2016 and paid in January 2017. Dividends declared, but not paid as of December 31, 2015 and December 31, 2014 were $44.8 million ($0.56 per share) and $38.0 million ($0.47 per share), respectively.
Share Repurchases
76
In December 2012, the Board of Directors authorized a $250 million share repurchase program, which commenced in the first quarter of 2013. In August 2015, the Board of Directors approved an additional $250 million share repurchase authorization and extension through December 31, 2017. Based on the total remaining amount of $109.3 million available under the repurchase program, approximately 0.9 million shares, or 1.2% of shares outstanding (based on the market price and shares outstanding as of December 31, 2016) could be repurchased under the program as of December 31, 2016. During the year ended December 31, 2016, the Company repurchased 1.1 million shares on the open market at an aggregate cost of $127.4 million or an average of $120.45 per share. The purchases will be made from time to time on the open market or through private transactions as market and business conditions warrant. Repurchased shares will be placed into treasury stock. The ultimate level of purchases will be a function of the daily purchase limits established in the pre-approved program according to the share price at that time. This plan expires on December 31, 2017.
NOTE 12. STOCK COMPENSATION PLANS
The Company has various equity plans under which its officers, senior management, other key employees and Board of Directors may be granted options to purchase IFF common stock or other forms of stock-based awards. Beginning in 2004, the Company granted Restricted Stock Units (“RSUs”) as the principal element of its equity compensation for all eligible U.S.-based employees and a majority of eligible overseas employees. Vesting of the RSUs is solely time based; the vesting period is primarily 3 years from date of grant. For a small group of employees, primarily overseas, the Company granted stock options prior to 2008.
The cost of all employee stock-based awards are principally recognized on a straight-line attribution basis over their respective vesting periods, net of estimated forfeitures. Total stock-based compensation expense included in the Consolidated Statement of Income and Comprehensive Income was as follows:
December 31, | |||||||||||
(DOLLARS IN THOUSANDS) | 2016 | 2015 | 2014 | ||||||||
Equity-based awards | $ | 24,587 | $ | 23,160 | $ | 22,648 | |||||
Liability-based awards | 3,884 | 4,784 | 4,354 | ||||||||
Total stock-based compensation | 28,471 | 27,944 | 27,002 | ||||||||
Less tax benefit | (7,375 | ) | (8,348 | ) | (8,018 | ) | |||||
Total stock-based compensation, net of tax | $ | 21,096 | $ | 19,596 | $ | 18,984 | |||||
The shareholders of the Company approved the Company’s 2015 Stock Award and Incentive Plan (the “2015 Plan”) on May 6, 2015. The 2015 Plan replaced the Company’s 2010 Stock Award and Incentive Plan (the “2010 Plan”) and provides the source for future deferrals of cash into deferred stock under the Company’s Deferred Compensation Plan (with the Deferred Compensation Plan being deemed a subplan under the 2015 Plan for the sole purpose of funding deferrals under the IFF Share Fund).
Under the 2015 Plan, a total of 1,500,000 shares are authorized for issuance in addition to 1,552,694 shares remaining available under the 2010 plan that were rolled into the 2015 Plan. At December 31, 2016, 853,746 shares were subject to outstanding awards and 2,715,923 shares remained available for future awards under all of the Company’s equity award plans, including the 2015 Plan (excluding shares not yet issued under open cycles of the Company’s Long-Term Incentive Plan).
The Company offers a Long-Term Incentive Plan (“LTIP”) for senior management. The targeted payout is 50% cash and 50% IFF common stock at the end of the three-year cycle and provides for segmentation in which one-fourth of the award vests during each twelve-month period, with the final one-fourth segment vesting over the full three-year period. Grants under the LTIP are currently earned upon achievement of defined Economic Profit ("EP") targets and the Company's performance ranking of Total Shareholder Return as a percentile of the S&P 500 ("Relative TSR"). EP measures operating profitability after considering (i) all operating costs, (ii) income taxes and (iii) a charge for the capital employed in the business. When the award is granted, 50% of the target dollar value of the award is converted to a number of “notional” shares based on the closing price at the beginning of the cycle. For those shares whose payout is based on Relative TSR, compensation expense is recognized using a graded-vesting attribution method, while compensation expense for the remainder of the performance shares (EP targets) is recognized on a straight-line basis over the vesting period based on the probable outcome of the performance condition.
The 2012-2014 cycle concluded at the end of 2014 and an aggregate 90,062 shares of common stock were issued in March 2015. The 2013-2015 cycle concluded at the end of 2015 and an aggregate 73,134 shares of common stock were issued in March 2016. The 2014-2016 cycle concluded at the end of 2016 and an aggregate 47,267 shares of common stock will be issued in March 2017.
77
In 2006, the Board of Directors approved the Equity Choice Program (the “Program”) for senior management. This program continues under the 2015 Plan. Eligible employees can choose from among three equity alternatives and will be granted such equity awards up to certain dollar awards depending on the participant’s employment grade level. A participant may choose among (1) SSARs, (2) RSUs or (3) PRSUs.
SSARs and Options
SSARs granted become exercisable on the third anniversary of the grant date and have a maximum term of 7 years. An immaterial amount of SSARS was granted in 2015. No SSARs were granted in 2016 or 2014. No stock options were granted in 2016, 2015 or 2014.
SSARs and options activity was as follows:
(SHARE AMOUNTS IN THOUSANDS) | Shares Subject to SSARs/Options | Weighted Average Exercise Price | SSARs/ Options Exercisable | ||||||
Balance at December 31, 2015 | 38 | $ | 52.10 | 38 | |||||
Exercised | (17 | ) | 46.72 | ||||||
Cancelled | (2 | ) | 41.16 | ||||||
Balance at December 31, 2016 | 19 | $ | 59.14 | 18 | |||||
The weighted average exercise price of SSARs and options exercisable at December 31, 2016, 2015 and 2014 were $58.24, $52.10 and $47.92, respectively.
SSARs and options outstanding at December 31, 2016 was as follows:
Price Range | Number Outstanding (in thousands) | Weighted Average Remaining Contractual Life (in years) | Weighted Average Exercise Price | Aggregate Intrinsic Value (in thousands) | ||||||||
$51 – $60 | 10 | 1.12 | $ | 55.09 | ||||||||
$61 – $65 | 8 | 1.42 | 62.13 | |||||||||
Over $65 | 1 | 5.35 | 118.10 | |||||||||
19 | $ | 59.14 | $ | 1,112 | ||||||||
SSARs and options exercisable as of December 31, 2016 was as follows:
Price Range | Number Exercisable (in thousands) | Weighted Average Remaining Contractual Life (in years) | Weighted Average Exercise Price | Aggregate Intrinsic Value (in thousands) | ||||||||
$51 – $60 | 10 | 1.12 | $ | 55.09 | ||||||||
$61 - $65 | 8 | 1.42 | 62.13 | |||||||||
18 | $ | 58.24 | $ | 1,112 | ||||||||
The total intrinsic value of options/SSARs exercised during 2016, 2015 and 2014 totaled $1.3 million, $7.3 million and $7.5 million, respectively.
As of December 31, 2016, there was less than $0.1 million of total unrecognized compensation cost related to non-vested SSARs granted; such cost is expected to be recognized over a period of 1.27 years.
Restricted Stock Units
The Company has granted RSUs to eligible employees and Board of Directors. Such RSUs are subject to forfeiture if certain conditions are not met. RSUs principally vest 100% at the end of 3 years and contain no performance criteria provisions. An RSU’s fair value is calculated based on the market price of the Company's stock at date of grant, with an adjustment to reflect the fact that such awards do not participate in dividend rights. The aggregate fair value is amortized to expense ratably over the vesting period.
RSU activity was as follows:
78
(SHARE AMOUNTS IN THOUSANDS) | Number of Shares | Weighted Average Grant Date Fair Value Per Share | ||||
Balance at December 31, 2015 | 480 | $ | 93.33 | |||
Granted | 183 | 113.76 | ||||
Vested | (192 | ) | 78.44 | |||
Forfeited | (27 | ) | 106.62 | |||
Balance at December 31, 2016 | 444 | $ | 107.43 | |||
The total fair value of RSUs that vested during the year ended December 31, 2016 was $22.8 million.
As of December 31, 2016, there was $21.3 million of total unrecognized compensation cost related to non-vested RSUs granted under the equity incentive plans; such cost is expected to be recognized over a weighted average period of 1.9 years.
Purchased Restricted Stock and Purchased Restricted Stock Units
In 2014, the grant of awards under the Equity Choice program provided for eligible employees to purchase restricted shares of IFF common stock and deposit them into an escrow account. For each share deposited in escrow by the eligible employee, the Company matched with a grant of a share of restricted stock or, for non-U.S. participants, a restricted stock unit. The shares of restricted stock and restricted stock units generally vest on the third anniversary of the grant date, are subject to continued employment and other specified conditions and pay dividends if and when paid by the Company. Holders of restricted stock have, in most instances, all of the rights of stockholders, except that they may not sell, assign, pledge or otherwise encumber such shares. The PRSUs provide no such rights. During 2015, the Company modified the program so that all participants, including U.S. participants, began to receive a restricted stock unit instead of a share of restricted stock. Restricted stock units pay dividend equivalents and do not have voting rights. The Company issued 58,629 shares of PRSUs in 2016 for an aggregate purchase price of $7.0 million covering 29,315 purchased shares, 52,577 and 14,622 shares of PRS and PRSUs, respectively, in 2015 for $6.2 million and $1.7 million, respectively, covering 33,600 purchased shares and 99,091 shares of PRS in 2014 for $9.7 million covering 49,545 purchased shares.
PRS and PRSU activity was as follows:
(SHARE AMOUNTS IN THOUSANDS) | Number of Shares | Weighted Average Grant Date Fair Value Per Share | ||||
Balance at December 31, 2015 | 234 | $ | 95.48 | |||
Granted | 59 | 119.81 | ||||
Vested | (91 | ) | 75.87 | |||
Forfeited | (4 | ) | 114.91 | |||
Balance at December 31, 2016 | 198 | $ | 110.62 | |||
The total fair value of PRS and PRSUs that vested during the year ended December 31, 2016 was $10.2 million.
As of December 31, 2016, there was $8.3 million of total unrecognized compensation cost related to non-vested PRS and PRSUs granted under the equity incentive plans; such cost is expected to be recognized over a weighted average period of 1.8 years.
Liability Awards
The Company has granted cash-settled RSUs ("Cash RSUs") to eligible employees that are paid out 100% in cash upon vesting. Such RSUs are subject to forfeiture if certain conditions are not met. Cash RSUs principally vest 100% at the end of three years and contain no performance criteria provisions. A Cash RSU's fair value is calculated based on the market price of the Company's stock at the date of the closing period and is accounted for as a liability award. The aggregate fair value is amortized to expense ratably over the vesting period.
Cash RSU activity was as follows:
79
(SHARE AMOUNTS IN THOUSANDS) | Cash RSUs | Weighted Average Fair Value Per Share | ||||
Balance at December 31, 2015 | 99 | $ | 119.64 | |||
Granted | 33 | 117.83 | ||||
Vested | (33 | ) | 129.53 | |||
Forfeited | (3 | ) | 130.89 | |||
Balance at December 31, 2016 | 96 | $ | 117.83 | |||
The total fair value of Cash RSUs that vested during the year ended December 31, 2016 was $3.9 million.
As of December 31, 2016, there was $4.9 million of total unrecognized compensation cost related to non-vested Cash RSUs granted under the equity incentive plans; such cost is expected to be recognized over a weighted average period of 1.8 years. The aggregate compensation cost will be adjusted based on changes in the Company’s stock price.
NOTE 13. SEGMENT INFORMATION
The Company is organized into two operating segments, Flavors and Fragrances; these segments align with the internal structure used to manage these businesses. Flavor compounds are sold to the food and beverage industries for use in consumer products such as prepared foods, beverages, dairy, food and sweet products. Fragrances is comprised of (1) Fragrance Compounds, which are ultimately used by our customers in two broad categories: Fine Fragrances, including perfumes and colognes, and Consumer Fragrances, including fragrance compounds for personal care (e.g., soaps), household products (e.g., detergents and cleaning agents) and beauty care, including toiletries; (2) Fragrance Ingredients, consisting of synthetic and natural ingredients that can be combined with other materials to create unique fine fragrance and consumer compounds; and (3) Cosmetic Active Ingredients, consisting of active and functional ingredients, botanicals and delivery systems to support our customers’ cosmetic and personal care product lines. Major fragrance customers include the cosmetics industry, including perfume and toiletries manufacturers, and the household products industry, including manufacturers of soaps, detergents, fabric care, household cleaners and air fresheners.
The Company's Chief Operating Decision Maker evaluates the performance of these operating segments based on segment profit which is defined as operating profit before Restructuring, global expenses (as discussed below) and certain non-recurring items, Interest expense, Other income (expense), net and Taxes on income.
The Global expenses caption represents corporate and headquarter-related expenses which include legal, finance, human resources, certain incentive compensation expenses and other R&D and administrative expenses that are not allocated to individual operating segments. Unallocated assets are principally cash and cash equivalents and other corporate and headquarter-related assets.
80
Reportable segment information is as follows:
December 31, | |||||||||||
(DOLLARS IN THOUSANDS) | 2016 | 2015 | 2014 | ||||||||
Net sales | |||||||||||
Flavors | $ | 1,496,525 | $ | 1,442,951 | $ | 1,457,055 | |||||
Fragrances | 1,619,825 | 1,580,238 | 1,631,478 | ||||||||
Consolidated | $ | 3,116,350 | $ | 3,023,189 | $ | 3,088,533 | |||||
December 31, | |||||||||||
(DOLLARS IN THOUSANDS) | 2016 | 2015 | |||||||||
Segment assets | |||||||||||
Flavors | $ | 1,780,695 | $ | 1,604,623 | |||||||
Fragrances | 1,925,642 | 1,975,002 | |||||||||
Global assets | 310,647 | 122,385 | |||||||||
Consolidated | $ | 4,016,984 | $ | 3,702,010 | |||||||
December 31, | |||||||||||
(DOLLARS IN THOUSANDS) | 2016 | 2015 | 2014 | ||||||||
Segment profit: | |||||||||||
Flavors | $ | 337,242 | $ | 318,476 | $ | 331,257 | |||||
Fragrances | 334,220 | 321,764 | 335,447 | ||||||||
Global expenses | (48,487 | ) | (28,180 | ) | (65,443 | ) | |||||
Restructuring and other charges, net (1) | (322 | ) | (7,594 | ) | (1,298 | ) | |||||
Gain on sales of fixed assets (2) | 7,818 | — | — | ||||||||
Spanish capital tax charge reversal (3) | — | 10,530 | — | ||||||||
Acquisition related costs (4) | (12,195 | ) | (18,342 | ) | — | ||||||
Operational improvement initiative costs (5) | (2,402 | ) | (1,115 | ) | (7,642 | ) | |||||
Accelerated contingent consideration (6) | — | (7,192 | ) | — | |||||||
Legal charges/credits, net (7) | (48,518 | ) | — | — | |||||||
Operating Profit | 567,356 | 588,347 | 592,321 | ||||||||
Interest expense | (52,989 | ) | (46,062 | ) | (46,067 | ) | |||||
Other income (expense), net | 9,350 | (3,184 | ) | 2,807 | |||||||
Income before taxes | $ | 523,717 | $ | 539,101 | $ | 549,061 | |||||
Profit margin | |||||||||||
Flavors | 22.5 | % | 22.1 | % | 22.7 | % | |||||
Fragrances | 20.6 | % | 20.4 | % | 20.6 | % | |||||
Consolidated | 18.2 | % | 19.5 | % | 19.2 | % | |||||
(1) Restructuring and other charges, net include accelerated depreciation related to restructuring initiatives, severance costs related to the termination of a former executive officer and the partial reversal of restructuring accruals recorded in the prior year for the year ended December 31, 2016, severance and related costs related to restructuring initiatives for the year ended December 31, 2015 and plant shutdown costs related to the Fragrance Ingredients Rationalization for the year ended December 31, 2014.
(2) Represents a gain related to the sale of property in Brazil for the year ended December 31, 2016.
(3) The Spanish capital tax charge reversal represents the reversal of the charge recorded during the year ended December 31, 2013 (as a result of the unfavorable ruling of the Spanish capital tax case from 2002) in the year ended December 31, 2015 due to a favorable ruling on the Company's appeal.
81
(4) Acquisition related costs include costs related to the fair value step-up of inventory of the David Michael and Lucas Meyer acquisitions as well as transaction costs related to the Lucas Meyer, David Michael and Fragrance Resources acquisitions for the year ended December 31, 2016 and transaction costs and costs related to the fair value step-up of inventory of the Ottens Flavors and Lucas Meyer acquisitions for the year ended December 31, 2015.
(5) Operational improvement initiative costs include accelerated depreciation and dismantling and idle labor costs in Hangzhou, China, severance costs in Guangzhou, China and the partial reversal of severance accruals related to prior year operational initiatives in Europe for the year ended December 31, 2016 and costs related to the closing of a smaller facility in Europe and certain manufacturing activities in Asia, while transferring production to larger facilities in each respective region for the year ended December 31, 2015 and December 31, 2014.
(6) Acceleration of contingent consideration payments related to the Aromor acquisition.
(7) Legal charges/credits principally relate to litigation accrual as discussed in Note 18 which was partially offset by settlements due to favorable tax rulings in jurisdictions for which reserves were previously recorded for ongoing tax disputes.
The Company has not disclosed revenues at a lower level than provided herein, such as revenues from external customers by product, as it is impracticable for it to do so.
The Company had one customer that accounted for more than 10% of consolidated net sales in each year for all periods presented and had net sales of $364.8 million, $358.9 million and $368.2 million in 2016, 2015 and 2014, respectively. The majority of these sales were in the Fragrances operating segment.
Total long-lived assets consist of net property, plant and equipment and amounted to $775.7 million and $732.8 million at December 31, 2016 and 2015, respectively. Of this total, $191.3 million and $170.2 million were located in the United States at December 31, 2016 and 2015, respectively, $95.1 million and $98.9 million were located in the Netherlands at December 31, 2016 and 2015, respectively, $78.4 million and $63.4 million were located in Singapore at December 31, 2016 and 2015, respectively, and $78.4 million and $82.7 million were located in China at December 31, 2016 and 2015, respectively.
Capital Expenditures | Depreciation and Amortization | ||||||||||||||||||||||
(DOLLARS IN THOUSANDS) | 2016 | 2015 | 2014 | 2016 | 2015 | 2014 | |||||||||||||||||
Flavors | $ | 47,064 | $ | 39,416 | $ | 91,104 | $ | 47,705 | $ | 45,228 | $ | 36,008 | |||||||||||
Fragrances | 73,345 | 50,597 | 43,948 | 50,724 | 39,614 | 43,790 | |||||||||||||||||
Unallocated assets | 6,003 | 11,017 | 8,130 | 4,040 | 4,755 | 9,556 | |||||||||||||||||
Consolidated | $ | 126,412 | $ | 101,030 | $ | 143,182 | $ | 102,469 | $ | 89,597 | $ | 89,354 | |||||||||||
Net Sales by Geographic Area | |||||||||||
(DOLLARS IN THOUSANDS) | 2016 | 2015 | 2014 | ||||||||
Europe, Africa and Middle East | $ | 964,931 | $ | 945,675 | $ | 1,041,585 | |||||
Greater Asia | 880,040 | 839,120 | 856,217 | ||||||||
North America | 769,081 | 718,614 | 690,214 | ||||||||
Latin America | 502,298 | 519,780 | 500,517 | ||||||||
Consolidated | $ | 3,116,350 | $ | 3,023,189 | $ | 3,088,533 | |||||
Net sales are attributed to individual regions based upon the destination of product delivery. Net sales related to the U.S. for the years ended December 31, 2016, 2015 and 2014 were $735.3 million, $682.2 million and $652.6 million, respectively. Net sales attributed to all foreign countries in total for the years ended December 31, 2016, 2015 and 2014 were $2.4 billion, $2.3 billion and $2.4 billion, respectively. No non-U.S. country had net sales in any period presented greater than 10.0% of total consolidated net sales.
NOTE 14. EMPLOYEE BENEFITS
The Company has pension and/or other retirement benefit plans covering approximately one-fourth of active employees. In 2007 the Company amended its U.S. qualified and non-qualified pension plans under which accrual of future benefits was suspended for all participants that did not meet the rule of 70 (age plus years of service equal to at least 70 at December 31, 2007). Pension benefits are generally based on years of service and on compensation during the final years of employment. Plan assets consist primarily of equity securities and corporate and government fixed income securities. Substantially all
82
pension benefit costs are funded as accrued; such funding is limited, where applicable, to amounts deductible for income tax purposes. Certain other retirement benefits are provided by general corporate assets.
The Company sponsors a qualified defined contribution plan covering substantially all U.S. employees. Under this plan, the Company matches 100% of participants’ contributions up to 4% of compensation and 75% of participants’ contributions from over 4% to 8%. Employees that are still eligible to accrue benefits under the pension plans are limited to a 50% match up to 6% of the participants’ compensation.
In addition to pension benefits, certain health care and life insurance benefits are provided to qualifying U.S. employees upon retirement from IFF. Such coverage is provided through insurance plans with premiums based on benefits paid. The Company does not generally provide health care or life insurance coverage for retired employees of foreign subsidiaries; such benefits are provided in most foreign countries by government-sponsored plans, and the cost of these programs is not material.
The Company offers a non-qualified Deferred Compensation Plan ("DCP") for certain key employees and non-employee directors. Eligible employees and non-employee directors may elect to defer receipt of salary, incentive payments and Board of Directors’ fees into participant-directed investments, which are generally invested by the Company in individual variable life insurance contracts it owns that are designed to informally fund savings plans of this nature. The cash surrender value of life insurance is based on the net asset values of the underlying funds available to plan participants. At December 31, 2016 and December 31, 2015, the Consolidated Balance Sheet reflects liabilities of $37.6 million and $34.6 million, respectively, related to the DCP in Other liabilities and $18.8 million and $13.9 million, respectively, included in Capital in excess of par value related to the portion of the DCP that will be paid out in IFF shares.
The total cash surrender value of life insurance contracts the Company owns in relation to the DCP and post-retirement life insurance benefits amounted to $43.4 million and $42.0 million at December 31, 2016 and 2015, respectively, and are recorded in Other assets in the Consolidated Balance Sheet.
The plan assets and benefit obligations of the defined benefit pension plans are measured at December 31 of each year.
U.S. Plans | Non-U.S. Plans | ||||||||||||||||||||||
(DOLLARS IN THOUSANDS) | 2016 | 2015 | 2014 | 2016 | 2015 | 2014 | |||||||||||||||||
Components of net periodic benefit cost | |||||||||||||||||||||||
Service cost for benefits earned | $ | 2,497 | $ | 3,144 | $ | 3,057 | $ | 15,210 | $ | 15,866 | $ | 14,142 | |||||||||||
Interest cost on projected benefit obligation | 24,096 | 23,705 | 25,090 | 24,413 | 25,389 | 33,360 | |||||||||||||||||
Expected return on plan assets | (33,988 | ) | (32,405 | ) | (27,647 | ) | (45,865 | ) | (50,437 | ) | (49,861 | ) | |||||||||||
Net amortization of deferrals | 5,821 | 21,390 | 17,656 | 12,802 | 12,864 | 10,584 | |||||||||||||||||
Settlements and curtailments | — | — | — | — | — | 43 | |||||||||||||||||
Net periodic benefit cost | (1,574 | ) | 15,834 | 18,156 | 6,560 | 3,682 | 8,268 | ||||||||||||||||
Defined contribution and other retirement plans | 8,404 | 7,104 | 7,854 | 6,304 | 7,028 | 6,323 | |||||||||||||||||
Total expense | $ | 6,830 | $ | 22,938 | $ | 26,010 | $ | 12,864 | $ | 10,710 | $ | 14,591 | |||||||||||
Changes in plan assets and benefit obligations recognized in OCI | |||||||||||||||||||||||
Net actuarial (gain) loss | $ | (4,917 | ) | $ | 7,623 | $ | 72,848 | $ | 3,848 | ||||||||||||||
Recognized actuarial loss | (5,759 | ) | (21,207 | ) | (13,643 | ) | (13,629 | ) | |||||||||||||||
Prior service cost | — | — | — | 459 | |||||||||||||||||||
Recognized prior service cost | (62 | ) | (183 | ) | 742 | 765 | |||||||||||||||||
Currency translation adjustment | — | — | (43,270 | ) | (25,230 | ) | |||||||||||||||||
Total recognized in OCI (before tax effects) | $ | (10,738 | ) | $ | (13,767 | ) | $ | 16,677 | $ | (33,787 | ) | ||||||||||||
83
Postretirement Benefits | |||||||||||
(DOLLARS IN THOUSANDS) | 2016 | 2015 | 2014 | ||||||||
Components of net periodic benefit cost | |||||||||||
Service cost for benefits earned | $ | 852 | $ | 966 | $ | 1,295 | |||||
Interest cost on projected benefit obligation | 3,326 | 3,904 | 4,896 | ||||||||
Net amortization and deferrals | (5,088 | ) | (4,476 | ) | (4,109 | ) | |||||
(Credit) Expense | $ | (910 | ) | $ | 394 | $ | 2,082 | ||||
Changes in plan assets and benefit obligations recognized in OCI | |||||||||||
Net actuarial loss (gain) | $ | 2,868 | $ | (1,557 | ) | ||||||
Recognized actuarial loss | (1,701 | ) | (1,331 | ) | |||||||
Prior service credit | — | (33,902 | ) | ||||||||
Recognized prior service credit | 6,789 | 5,807 | |||||||||
Total recognized in OCI (before tax effects) | $ | 7,956 | $ | (30,983 | ) | ||||||
The amounts expected to be recognized in net periodic cost in 2017 are:
(DOLLARS IN THOUSANDS) | U.S. Plans | Non-U.S. Plans | Postretirement Benefits | ||||||||
Actuarial loss recognition | $ | 5,181 | $ | 14,344 | $ | 1,513 | |||||
Prior service cost (credit) recognition | 31 | (696 | ) | (6,334 | ) | ||||||
Weighted-average actuarial assumption used to determine expense | U.S. Plans | Non-U.S. Plans | |||||||||||||||
2016 | 2015 | 2014 | 2016 | 2015 | 2014 | ||||||||||||
Discount rate | 4.20 | % | 3.90 | % | 4.70 | % | 3.03 | % | 2.74 | % | 4.18 | % | |||||
Expected return on plan assets | 7.30 | % | 7.30 | % | 7.30 | % | 6.40 | % | 6.24 | % | 6.27 | % | |||||
Rate of compensation increase | 3.25 | % | 3.25 | % | 3.25 | % | 1.98 | % | 2.00 | % | 2.66 | % | |||||
84
Changes in the postretirement benefit obligation and plan assets, as applicable, are detailed in the following table:
U.S. Plans | Non-U.S. Plans | Postretirement Benefits | |||||||||||||||||||||
(DOLLARS IN THOUSANDS) | 2016 | 2015 | 2016 | 2015 | 2016 | 2015 | |||||||||||||||||
Benefit obligation at beginning of year | $ | 587,511 | $ | 625,479 | $ | 860,240 | $ | 965,266 | $ | 77,148 | $ | 113,497 | |||||||||||
Service cost for benefits earned | 2,497 | 3,144 | 15,210 | 15,866 | 852 | 966 | |||||||||||||||||
Interest cost on projected benefit obligation | 24,096 | 23,705 | 24,413 | 25,389 | 3,326 | 3,904 | |||||||||||||||||
Actuarial (gain) loss | (7,078 | ) | (36,338 | ) | 134,377 | (47,883 | ) | 2,868 | (1,557 | ) | |||||||||||||
Plan amendments | — | — | — | 459 | — | (33,902 | ) | ||||||||||||||||
Adjustments for expense/tax contained in service cost | — | — | (1,515 | ) | (1,976 | ) | — | — | |||||||||||||||
Plan participants’ contributions | — | — | 1,538 | 1,790 | 411 | 809 | |||||||||||||||||
Benefits paid | (29,694 | ) | (28,479 | ) | (30,648 | ) | (29,121 | ) | (4,760 | ) | (6,569 | ) | |||||||||||
Curtailments / settlements | — | — | (487 | ) | — | — | — | ||||||||||||||||
Translation adjustments | — | — | (107,562 | ) | (69,550 | ) | — | — | |||||||||||||||
Benefit obligation at end of year | $ | 577,332 | $ | 587,511 | $ | 895,566 | $ | 860,240 | $ | 79,845 | $ | 77,148 | |||||||||||
Fair value of plan assets at beginning of year | $ | 500,311 | $ | 501,801 | $ | 790,614 | $ | 852,893 | |||||||||||||||
Actual return on plan assets | 31,828 | (11,556 | ) | 105,879 | (3,271 | ) | |||||||||||||||||
Employer contributions | 23,519 | 38,545 | 23,239 | 29,352 | |||||||||||||||||||
Participants’ contributions | — | — | 1,538 | 1,790 | |||||||||||||||||||
Benefits paid | (29,694 | ) | (28,479 | ) | (30,648 | ) | (29,121 | ) | |||||||||||||||
Settlements | — | — | (487 | ) | — | ||||||||||||||||||
Translation adjustments | — | — | (97,997 | ) | (61,029 | ) | |||||||||||||||||
Fair value of plan assets at end of year | $ | 525,964 | $ | 500,311 | $ | 792,138 | $ | 790,614 | |||||||||||||||
Funded status at end of year | $ | (51,368 | ) | $ | (87,200 | ) | $ | (103,428 | ) | $ | (69,626 | ) | |||||||||||
U.S. Plans | Non-U.S. Plans | ||||||||||||||
(DOLLARS IN THOUSANDS) | 2016 | 2015 | 2016 | 2015 | |||||||||||
Amounts recognized in the balance sheet: | |||||||||||||||
Other assets | $ | 4,343 | $ | — | $ | — | $ | 4,096 | |||||||
Other current liabilities | (4,027 | ) | (3,866 | ) | (557 | ) | (613 | ) | |||||||
Retirement liabilities | (51,684 | ) | (83,334 | ) | (102,871 | ) | (73,109 | ) | |||||||
Net amount recognized | $ | (51,368 | ) | $ | (87,200 | ) | $ | (103,428 | ) | $ | (69,626 | ) | |||
U.S. Plans | Non-U.S. Plans | Postretirement Benefits | |||||||||||||||||||||
(DOLLARS IN THOUSANDS) | 2016 | 2015 | 2016 | 2015 | 2016 | 2015 | |||||||||||||||||
Amounts recognized in AOCI consist of: | |||||||||||||||||||||||
Net actuarial loss | $ | 154,417 | $ | 165,093 | $ | 339,654 | $ | 324,068 | $ | 19,336 | $ | 18,169 | |||||||||||
Prior service cost (credit) | 141 | 203 | (7,390 | ) | (8,482 | ) | (31,664 | ) | (38,453 | ) | |||||||||||||
Total AOCI (before tax effects) | $ | 154,558 | $ | 165,296 | $ | 332,264 | $ | 315,586 | $ | (12,328 | ) | $ | (20,284 | ) | |||||||||
85
U.S. Plans | Non-U.S. Plans | ||||||||||||||
(DOLLARS IN THOUSANDS) | 2016 | 2015 | 2016 | 2015 | |||||||||||
Accumulated Benefit Obligation — end of year | $ | 574,612 | $ | 583,346 | $ | 865,585 | $ | 837,272 | |||||||
Information for Pension Plans with an ABO in excess of Plan Assets: | |||||||||||||||
Projected benefit obligation | $ | 65,101 | $ | 587,511 | $ | 895,566 | $ | 609,922 | |||||||
Accumulated benefit obligation | 65,101 | 583,346 | 865,585 | 586,954 | |||||||||||
Fair value of plan assets | 9,389 | 500,311 | 790,218 | 536,200 | |||||||||||
Weighted-average assumptions used to determine obligations at December 31 | |||||||||||||||
Discount rate | 4.20 | % | 3.90 | % | 2.14 | % | 3.03 | % | |||||||
Rate of compensation increase | 3.25 | % | 3.25 | % | 1.97 | % | 1.98 | % | |||||||
(DOLLARS IN THOUSANDS) | U.S. Plans | Non-U.S. Plans | Postretirement Benefits | ||||||||
Estimated Future Benefit Payments | |||||||||||
2017 | $ | 32,871 | $ | 22,781 | $ | 5,005 | |||||
2018 | 33,912 | 23,109 | 5,132 | ||||||||
2019 | 35,331 | 23,731 | 5,227 | ||||||||
2020 | 39,392 | 23,855 | 5,431 | ||||||||
2021 | 37,014 | 24,488 | 5,417 | ||||||||
2022 - 2026 | 187,696 | 134,742 | 25,968 | ||||||||
Contributions | |||||||||||
Required Company Contributions in the Following Year (2017) | $ | 16,107 | $ | 13,762 | $ | 5,005 | |||||
The Company considers a number of factors in determining and selecting assumptions for the overall expected long-term rate of return on plan assets. The Company considers the historical long-term return experience of its assets, the current and expected allocation of its plan assets and expected long-term rates of return. The Company derives these expected long-term rates of return with the assistance of its investment advisors. The Company bases its expected allocation of plan assets on a diversified portfolio consisting of domestic and international equity securities, fixed income, real estate and alternative asset classes. The asset allocation is monitored on an ongoing basis.
The Company considers a variety of factors in determining and selecting its assumptions for the discount rate at December 31. For the U.S. plans, the discount rate was based on the internal rate of return for a portfolio of high quality bonds rated Aa or higher by either Moody’s or Standard & Poor's with maturities that are consistent with the projected future benefit payment obligations of the plan. For the Non-U.S. Plans, the discount rates were determined by region and are based on high quality long-term corporate bonds. Consideration has been given to the duration of the liabilities in each plan when selecting the bonds to be used in determining the discount rate. The rate of compensation increase for all plans and the medical cost trend rate for the applicable U.S. plans are based on plan experience.
The percentage of assets in the Company's pension plans, by type, is as follows:
U.S. Plans | Non-U.S. Plans | ||||||||||
2016 | 2015 | 2016 | 2015 | ||||||||
Percentage of assets invested in: | |||||||||||
Cash and cash equivalents | — | % | 1 | % | 2 | % | 2 | % | |||
Equities | 36 | % | 41 | % | 27 | % | 27 | % | |||
Fixed income | 64 | % | 58 | % | 56 | % | 55 | % | |||
Property | — | % | — | % | 5 | % | 7 | % | |||
Alternative and other investments | — | % | — | % | 10 | % | 9 | % | |||
With respect to the U.S. plans, the expected return on plan assets was determined based on an asset allocation model using the current target allocation, real rates of return by asset class and an anticipated inflation rate. The target investment allocation is 40% equity securities and 60% fixed income securities.
86
The expected annual rate of return for the non-U.S. plans employs a similar set of criteria adapted for local investments, inflation rates and in certain cases specific government requirements. The target asset allocation, for the non-U.S. plans, consists of approximately: 40% – 70% in fixed income securities; 15% – 40% in equity securities; 5% – 20% in real estate; and 5% – 10% in alternative investments.
The following tables present the Company's plan assets for the U.S. and non-U.S. plans using the fair value hierarchy as of December 31, 2016 and 2015. The plans’ assets were accounted for at fair value and are classified in their entirety based on the lowest level of input that is significant to the fair value measurement. The Company's assessment of the significance of a particular input to the fair value measurement requires judgment, and may affect the valuation of fair value assets and their placement within the fair value hierarchy levels. For more information on a description of the fair value hierarchy, see Note 15.
U.S. Plans for the year ended | |||||||||||||||
December 31, 2016 | |||||||||||||||
(DOLLARS IN THOUSANDS) | Level 1 | Level 2 | Level 3 | Total | |||||||||||
Cash Equivalents | $ | — | $ | 1,673 | $ | — | $ | 1,673 | |||||||
Fixed Income Securities | |||||||||||||||
Government & Government Agency Bonds | — | 11,845 | — | 11,845 | |||||||||||
Corporate Bonds | — | 90,843 | — | 90,843 | |||||||||||
Municipal Bonds | — | 9,682 | — | 9,682 | |||||||||||
Asset Backed Securities | — | 64 | — | 64 | |||||||||||
Assets measured at net asset value(1) | — | — | — | 410,533 | |||||||||||
Total | $ | — | $ | 114,107 | $ | — | $ | 524,640 | |||||||
Receivables | $ | 1,324 | |||||||||||||
Total | $ | 525,964 | |||||||||||||
U.S. Plans for the year ended | |||||||||||||||
December 31, 2015 | |||||||||||||||
(DOLLARS IN THOUSANDS) | Level 1 | Level 2 | Level 3 | Total | |||||||||||
Cash Equivalents | $ | — | $ | 4,767 | $ | — | $ | 4,767 | |||||||
Equity Securities | |||||||||||||||
U.S. Common Stock | 37,024 | — | — | 37,024 | |||||||||||
Balanced Funds | — | 8,845 | — | 8,845 | |||||||||||
Fixed Income Securities | |||||||||||||||
Government & Government Agency Bonds | — | 11,070 | — | 11,070 | |||||||||||
Corporate Bonds | — | 77,754 | — | 77,754 | |||||||||||
Municipal Bonds | — | 10,006 | — | 10,006 | |||||||||||
Assets measured at net asset value(1) | — | — | — | 350,074 | |||||||||||
Total | $ | 37,024 | $ | 112,442 | $ | — | $ | 499,540 | |||||||
Receivables | $ | 771 | |||||||||||||
Total | $ | 500,311 | |||||||||||||
(1) Investments that are measured at fair value using the net asset value per share (or its equivalent) practical expedient have not been classified in the fair value hierarchy. The fair value amounts presented in the table above are intended to permit reconciliation of the fair value hierarchy to the amounts presented in the Consolidated Balance Sheet. The total amount measured at net asset value includes approximately $187.3 million and $159.7 million in pooled equity funds and $223.2 million and $190.3 million in fixed income mutual funds for the years ended December 31, 2016 and 2015, respectively.
87
Non-U.S. Plans for the year ended | |||||||||||||||
December 31, 2016 | |||||||||||||||
(DOLLARS IN THOUSANDS) | Level 1 | Level 2 | Level 3 | Total | |||||||||||
Cash | $ | 12,726 | $ | — | $ | — | $ | 12,726 | |||||||
Equity Securities | |||||||||||||||
U.S. Large Cap | 72,438 | 17,102 | — | 89,540 | |||||||||||
U.S. Mid Cap | 504 | — | — | 504 | |||||||||||
U.S. Small Cap | 382 | — | — | 382 | |||||||||||
Non-U.S. Large Cap | 69,442 | 10,606 | — | 80,048 | |||||||||||
Non-U.S. Mid Cap | 514 | — | — | 514 | |||||||||||
Non-U.S. Small Cap | 284 | — | — | 284 | |||||||||||
Emerging Markets | 37,354 | 1,035 | — | 38,389 | |||||||||||
Fixed Income Securities | |||||||||||||||
U.S. Treasuries/Government Bonds | 75 | — | — | 75 | |||||||||||
U.S. Corporate Bonds | — | 28,843 | — | 28,843 | |||||||||||
Non-U.S. Treasuries/Government Bonds | 121,987 | 57,116 | — | 179,103 | |||||||||||
Non-U.S. Corporate Bonds | 26,412 | 183,020 | — | 209,432 | |||||||||||
Non-U.S. Asset-Backed Securities | — | 27,114 | — | 27,114 | |||||||||||
Non-U.S. Other Fixed Income | 1,969 | — | — | 1,969 | |||||||||||
Alternative Types of Investments | |||||||||||||||
Insurance Contracts | — | 31,087 | 246 | 31,333 | |||||||||||
Hedge Funds | — | — | 30,739 | 30,739 | |||||||||||
Other | — | 16,904 | — | 16,904 | |||||||||||
Absolute Return Funds | 2,443 | — | — | 2,443 | |||||||||||
Non-U.S. Real Estate | — | — | 41,796 | 41,796 | |||||||||||
Total | $ | 346,530 | $ | 372,827 | $ | 72,781 | $ | 792,138 | |||||||
88
Non-U.S. Plans for the year ended | |||||||||||||||
December 31, 2015 | |||||||||||||||
(DOLLARS IN THOUSANDS) | Level 1 | Level 2 | Level 3 | Total | |||||||||||
Cash | $ | 13,239 | $ | — | $ | — | $ | 13,239 | |||||||
Equity Securities | |||||||||||||||
U.S. Large Cap | 74,306 | 17,118 | — | 91,424 | |||||||||||
U.S. Mid Cap | 262 | — | — | 262 | |||||||||||
U.S. Small Cap | 230 | — | — | 230 | |||||||||||
Non-U.S. Large Cap | 73,578 | 12,372 | — | 85,950 | |||||||||||
Non-U.S. Mid Cap | 2,175 | — | — | 2,175 | |||||||||||
Non-U.S. Small Cap | 226 | — | — | 226 | |||||||||||
Emerging Markets | 33,291 | 2,152 | — | 35,443 | |||||||||||
Fixed Income Securities | |||||||||||||||
U.S. Treasuries/Government Bonds | 67 | — | — | 67 | |||||||||||
Non-U.S. Treasuries/Government Bonds | 121,552 | 55,184 | — | 176,736 | |||||||||||
Non-U.S. Corporate Bonds | 56,238 | 174,626 | — | 230,864 | |||||||||||
Non-U.S. Asset-Backed Securities | — | 26,132 | — | 26,132 | |||||||||||
Non-U.S. Other Fixed Income | 1,625 | — | — | 1,625 | |||||||||||
Alternative Types of Investments | |||||||||||||||
Insurance Contracts | 299 | 36,447 | — | 36,746 | |||||||||||
Hedge Funds | — | — | 17,034 | 17,034 | |||||||||||
Absolute Return Funds | 2,566 | 16,603 | — | 19,169 | |||||||||||
Non-U.S. Real Estate | — | 13,985 | 39,307 | 53,292 | |||||||||||
Total | $ | 379,654 | $ | 354,619 | $ | 56,341 | $ | 790,614 | |||||||
Cash and cash equivalents are primarily held in registered money market funds which are valued using a market approach based on the quoted market prices of identical instruments. Other cash and cash equivalents are valued daily by the fund using a market approach with inputs that include quoted market prices for similar instruments.
Equity securities are primarily valued using a market approach based on the quoted market prices of identical instruments. Pooled funds are typically common or collective trusts valued at their net asset values (NAVs).
Fixed income securities are primarily valued using a market approach with inputs that include broker quotes and benchmark yields.
Derivative instruments are valued by the custodian using closing market swap curves and market derived inputs.
Real estate values are primarily based on valuation of the underlying investments, which include inputs such as cost, discounted future cash flows, independent appraisals and market comparable data.
Hedge funds are valued based on valuation of the underlying securities and instruments within the funds. Quoted market prices are used when available and NAVs are used for unquoted securities within the funds.
Absolute return funds are actively managed funds mainly invested in debt and equity securities and are valued at their NAVs.
89
The following table presents a reconciliation of Level 3 non-U.S. plan assets held during the year ended December 31, 2016:
Non-U.S. Plans | |||||||||||
(DOLLARS IN THOUSANDS) | Real Estate | Hedge Funds | Total | ||||||||
Ending balance as of December 31, 2015 | $ | 39,307 | $ | 17,034 | $ | 56,341 | |||||
Actual return on plan assets | (8,525 | ) | (1,333 | ) | (9,858 | ) | |||||
Purchases, sales and settlements | (528 | ) | 15,038 | 14,510 | |||||||
Transfers in/out | 11,788 | — | 11,788 | ||||||||
Ending balance as of December 31, 2016 | $ | 42,042 | $ | 30,739 | $ | 72,781 | |||||
The following weighted average assumptions were used to determine the postretirement benefit expense and obligation for the years ended December 31:
Expense | Liability | ||||||||||
2016 | 2015 | 2016 | 2015 | ||||||||
Discount rate | 4.20 | % | 3.90 | % | 4.20 | % | 4.20 | % | |||
Current medical cost trend rate | 7.15 | % | 5.80 | % | 8.00 | % | 7.15 | % | |||
Ultimate medical cost trend rate | 4.75 | % | 4.75 | % | 4.75 | % | 4.75 | % | |||
Medical cost trend rate decreases to ultimate rate in year | 2023 | 2023 | 2030 | 2023 | |||||||
Sensitivity of Disclosures to Changes in Selected Assumptions | |||||||||||||||
25 BP Decrease in Discount Rate | 25 BP Decrease in Discount Rate | 25 BP Decrease in Long-Term Rate of Return | |||||||||||||
(DOLLARS IN THOUSANDS) | Change in PBO | Change in ABO | Change in pension expense | Change in pension expense | |||||||||||
U.S. Pension Plans | $ | 15,719 | $ | 15,620 | $ | (109 | ) | $ | 1,250 | ||||||
Non-U.S. Pension Plans | 46,658 | 44,861 | 2,876 | 1,895 | |||||||||||
Postretirement Benefit Plan | N/A | 2,302 | 100 | N/A | |||||||||||
The effect of a 1% increase in the medical cost trend rate would increase the accumulated postretirement benefit obligation and the annual postretirement expense by approximately $0.3 million and less than $0.1 million, respectively; a 1% decrease in the rate would decrease the obligation and expense by approximately $0.4 million and less than $0.1 million, respectively.
The Company contributed $20.0 million and $23.2 million to its qualified U.S. pension plans and non-U.S. pension plans in 2016, respectively. The Company made $3.6 million in benefit payments with respect to its non-qualified U.S. pension plan. In addition, $4.8 million of payments were made with respect to the Company's other postretirement plans.
NOTE 15. FINANCIAL INSTRUMENTS
Fair Value
Accounting guidance on fair value measurements specifies a hierarchy of valuation techniques based on whether the inputs to those valuation techniques are observable or unobservable. Observable inputs reflect market data obtained from independent sources, while unobservable inputs reflect the Company's market assumptions. These two types of inputs create the following fair value hierarchy:
• | Level 1 — Quoted prices for identical instruments in active markets. |
• | Level 2 — Quoted prices for similar instruments in active markets; quoted prices for identical or similar instruments in markets that are not active; and model-derived valuations in which all significant inputs and significant value drivers are observable in active markets. |
• | Level 3 — Valuations derived from valuation techniques in which one or more significant inputs or significant value drivers are unobservable. |
90
This hierarchy requires the Company to use observable market data, when available, and to minimize the use of unobservable inputs when determining fair value. The Company determines the fair value of structured liabilities (where performance is linked to structured interest rates, inflation or currency risks) using the London InterBank Offer Rate (“LIBOR”) swap curve and forward interest and exchange rates at period end. Such instruments are classified as Level 2 based on the observability of significant inputs to the model. The Company does not have any instruments classified as Level 1 or Level 3, other than those included in pension asset trusts included in Note 14.
These valuations take into consideration the Company's credit risk and its counterparties’ credit risk. The estimated change in the fair value of these instruments due to such changes in its own credit risk (or instrument-specific credit risk) was immaterial as of December 31, 2016.
The amounts recorded in the balance sheet (carrying amount) and the estimated fair values of financial instruments at December 31 consisted of the following:
2016 | 2015 | ||||||||||||||
(DOLLARS IN THOUSANDS) | Carrying Amount | Fair Value | Carrying Amount | Fair Value | |||||||||||
Cash and cash equivalents(1) | $ | 323,992 | $ | 323,992 | $ | 181,988 | $ | 181,988 | |||||||
Credit facilities and bank overdrafts(2) | 13,599 | 13,599 | 142,178 | 142,178 | |||||||||||
Long-term debt:(3) | |||||||||||||||
Senior notes — 2006(4) | — | — | 124,964 | 127,717 | |||||||||||
Senior notes — 2007(4) | 499,676 | 556,222 | 499,618 | 563,855 | |||||||||||
Senior notes — 2013(4) | 297,986 | 302,376 | 297,683 | 290,830 | |||||||||||
Euro Senior notes - 2016(4) | 512,764 | 546,006 | — | — | |||||||||||
_______________________
(1) | The carrying amount of cash and cash equivalents approximates fair value due to the short maturity of those instruments. |
(2) | The carrying amount of the Company's credit facilities and bank overdrafts approximates fair value as the interest rate is reset frequently based on current market rates as well as the short maturity of those instruments. |
(3) | The fair value of the Company's long-term debt was calculated using discounted cash flows applying current interest rates and current credit spreads based on its own credit risk. |
(4) | Amount is net of unamortized discount and debt issuance costs. |
Derivatives
The Company periodically enters into foreign currency forward contracts with the objective of reducing exposure to cash flow volatility associated with its intercompany loans, foreign currency receivables and payables and anticipated purchases of certain raw materials used in operations. These contracts generally involve the exchange of one currency for a second currency at a future date, have maturities not exceeding twelve months and are with counterparties which are major international financial institutions.
During the years ended December 31, 2016 and 2015, the Company entered into several forward currency contracts which qualified as net investment hedges, in order to mitigate a portion of its net European investments from foreign currency risk. The effective portions of net investment hedges are recorded in other comprehensive income ("OCI") as a component of Foreign currency translation adjustments in the accompanying Consolidated Statement of Income and Comprehensive Income. Realized gains/(losses) are deferred in AOCI where they will remain until the net investments in the Company's European subsidiaries are divested. Sixteen of these forward currency contracts matured during the year ended December 31, 2016. The outstanding forward currency contacts have remaining maturities of less than one year.
Subsequent to the issuance of the Euro Senior Notes - 2016 during the first quarter of 2016, the Company designated the debt as a hedge of a portion of its net European investments. Accordingly, the change in the value of the debt that is attributable to foreign exchange movements is recorded in OCI as a component of Foreign currency translation adjustments in the accompanying Consolidated Statement of Income and Comprehensive Income.
During the year ended December 31, 2016 and 2015, the Company entered into several forward currency contracts which qualified as cash flow hedges. The objective of these hedges is to protect against the currency risk associated with forecasted U.S. dollar (USD) denominated raw material purchases made by Euro (EUR) functional currency entities which result from changes in the EUR/USD exchange rate. The effective portions of cash flow hedges are recorded in OCI as a component of Gains/(Losses) on derivatives qualifying as hedges in the accompanying Consolidated Statement of Income and
91
Comprehensive Income. Realized gains/(losses) in AOCI related to cash flow hedges of raw material purchases are recognized as a component of Cost of goods sold in the accompanying Consolidated Statement of Income and Comprehensive Income in the same period as the related costs are recognized.
During 2015 and 2014, the Company entered into interest rate swap agreements that effectively converted the fixed rate on a portion of its long-term borrowings to a variable short-term rate based on the LIBOR plus an interest markup. These swaps are designated as fair value hedges. Amounts recognized in Interest expense were immaterial for the year ended December 31, 2016.
During the first quarter of 2016, the Company entered into and terminated two Euro interest rate swap agreements to hedge the anticipated issuance of fixed-rate debt. These swaps were designated as cash flow hedges. The effective portions of cash flow hedges are recorded in OCI as a component of Losses on derivatives qualifying as hedges in the accompanying Consolidated Statement of Comprehensive Income. The Company incurred a loss of Euro 2.9 million ($3.2 million) due to the termination of these swaps. The loss is being amortized as interest expense over the life of the Euro Senior Notes - 2016 as discussed in Note 9.
During the fourth quarter of 2016, the Company entered into one interest rate swap to hedge the anticipated issuance of fixed-rate debt, which is designated as a cash flow hedge. The effective portions of cash flow hedges are recorded in OCI as a component of Losses/gains on derivatives qualifying as hedges in the accompanying Consolidated Statement of Income and Comprehensive Income.
During the first quarter of 2013, the Company entered into three interest rate swap to hedge the anticipated issuance of fixed-rate debt, which are designated as cash flow hedges. The effective portions of cash flow hedges are recorded in OCI as a component of Losses/gains on derivatives qualifying as hedges in the accompanying Consolidated Statement of Income and Comprehensive Income. During the second quarter of 2013, the Company terminated these swaps and incurred a loss of $2.7 million, which it will amortize as Interest expense over the life of the Senior Notes - 2013 (discussed in Note 9).
The following table shows the notional amount of the Company’s derivative instruments outstanding as of December 31, 2016 and December 31, 2015:
(DOLLARS IN THOUSANDS) | December 31, 2016 | December 31, 2015 | |||||
Forward currency contracts | $ | 527,500 | $ | 573,200 | |||
Interest rate swaps | $ | 412,500 | $ | 475,000 | |||
92
The following tables show the Company’s derivative instruments measured at fair value (Level 2 of the fair value hierarchy) as reflected in the Consolidated Balance Sheets as of December 31, 2016 and December 31, 2015 (in thousands):
December 31, 2016 | |||||||||||
Fair Value of Derivatives Designated as Hedging Instruments | Fair Value of Derivatives Not Designated as Hedging Instruments | Total Fair Value | |||||||||
Derivative assets(a) | |||||||||||
Foreign currency contracts | $ | 13,765 | $ | 7,737 | $ | 21,502 | |||||
Interest rate swaps | 335 | — | 335 | ||||||||
$ | 14,100 | $ | 7,737 | $ | 21,837 | ||||||
Derivative liabilities(b) | |||||||||||
Foreign currency contracts | $ | 46 | $ | 2,209 | $ | 2,255 | |||||
Interest rate swaps | 725 | — | 725 | ||||||||
$ | 771 | $ | 2,209 | $ | 2,980 | ||||||
December 31, 2015 | |||||||||||
Fair Value of Derivatives Designated as Hedging Instruments | Fair Value of Derivatives Not Designated as Hedging Instruments | Total Fair Value | |||||||||
Derivative assets(a) | |||||||||||
Foreign currency contracts | $ | 6,560 | $ | 3,700 | $ | 10,260 | |||||
Interest rate swaps | 1,210 | — | 1,210 | ||||||||
$ | 7,770 | $ | 3,700 | $ | 11,470 | ||||||
Derivative liabilities(b) | |||||||||||
Foreign currency contracts | $ | 2,106 | $ | 3,022 | $ | 5,128 | |||||
_______________________
(a) | Derivative assets are recorded to Prepaid expenses and other current assets in the Consolidated Balance Sheet. |
(b) | Derivative liabilities are recorded as Other current liabilities in the Consolidated Balance Sheet. |
The following table shows the effect of the Company’s derivative instruments which were not designated as hedging instruments in the Consolidated Statement of Income and Comprehensive Income for the years ended December 31, 2016 and December 31, 2015 (in thousands):
Derivatives Not Designated as Hedging Instruments | Amount of Gain For the years ended December 31, | Location of Gain Recognized in Income on Derivative | |||||||
2016 | 2015 | ||||||||
Foreign currency contract | $ | 26,821 | $ | 8,644 | Other (income) expense, net | ||||
Most of these net gains (losses) offset any recognized gains (losses) arising from the revaluation of the related intercompany loans during the same respective periods.
93
The following table shows the effect of the Company’s derivative instruments designated as cash flow and net investment hedging instruments in the Consolidated Statement of Income and Comprehensive Income for the years ended December 31, 2016 and December 31, 2015 (in thousands):
Amount of Gain or (Loss) Recognized in OCI on Derivative (Effective Portion) | Location of Gain or (Loss) Reclassified from Accumulated OCI into Income (Effective Portion) | Amount of Gain or (Loss) Reclassified from Accumulated OCI into Income (Effective Portion) | |||||||||||||||
For the years ended December 31, | For the years ended December 31, | ||||||||||||||||
2016 | 2015 | 2016 | 2015 | ||||||||||||||
Derivatives in Cash Flow Hedging Relationships: | |||||||||||||||||
Foreign currency contract | $ | 1,591 | $ | (3,244 | ) | Cost of goods sold | $ | 4,726 | $ | 16,250 | |||||||
Interest rate swaps (1) | (3,388 | ) | 274 | Interest expense | (595 | ) | (274 | ) | |||||||||
Derivatives in Net Investment Hedging Relationships: | |||||||||||||||||
Foreign currency contract | 3,230 | 5,231 | N/A | — | — | ||||||||||||
Euro Senior notes - 2016 | 32,897 | — | N/A | — | — | ||||||||||||
Total | $ | 34,330 | $ | 2,261 | $ | 4,131 | $ | 15,976 | |||||||||
_______________________
(1) | Interest rate swaps were entered into as pre-issuance hedges. |
The ineffective portion of the above noted cash flow hedges and net investment hedges was not material for the years ended December 31, 2016 and 2015.
The Company expects approximately $4.1 million (net of tax), of derivative gains included in AOCI at December 31, 2016, based on current market rates, will be reclassified into earnings within the next twelve months. The majority of this amount will vary due to fluctuations in foreign currency exchange rates.
NOTE 16. ACCUMULATED OTHER COMPREHENSIVE INCOME (LOSS)
The following tables present changes in the accumulated balances for each component of other comprehensive income, including current period other comprehensive income and reclassifications out of accumulated other comprehensive income:
Foreign Currency Translation Adjustments | (Losses) Gains on Derivatives Qualifying as Hedges | Pension and Postretirement Liability Adjustment | Total | ||||||||||||
(DOLLARS IN THOUSANDS) | |||||||||||||||
Accumulated other comprehensive loss, net of tax, as of December 31, 2015 | $ | (297,499 | ) | $ | 9,401 | $ | (325,342 | ) | $ | (613,440 | ) | ||||
OCI before reclassifications | (54,526 | ) | 2,334 | (21,111 | ) | (73,303 | ) | ||||||||
Amounts reclassified from AOCI | — | (4,131 | ) | 10,779 | 6,648 | ||||||||||
Net current period other comprehensive income (loss) | (54,526 | ) | (1,797 | ) | (10,332 | ) | (66,655 | ) | |||||||
Accumulated other comprehensive loss, net of tax, as of December 31, 2016 | $ | (352,025 | ) | $ | 7,604 | $ | (335,674 | ) | $ | (680,095 | ) | ||||
94
Foreign Currency Translation Adjustments | (Losses) Gains on Derivatives Qualifying as Hedges | Pension and Postretirement Liability Adjustment | Total | ||||||||||||
(DOLLARS IN THOUSANDS) | |||||||||||||||
Accumulated other comprehensive (loss) income, net of tax, as of December 31, 2014 | $ | (173,342 | ) | $ | 12,371 | $ | (379,459 | ) | $ | (540,430 | ) | ||||
OCI before reclassifications | (124,157 | ) | 13,006 | 33,410 | (77,741 | ) | |||||||||
Amounts reclassified from AOCI | — | (15,976 | ) | 20,707 | 4,731 | ||||||||||
Net current period other comprehensive income (loss) | (124,157 | ) | (2,970 | ) | 54,117 | (73,010 | ) | ||||||||
Accumulated other comprehensive loss, net of tax, as of December 31, 2015 | $ | (297,499 | ) | $ | 9,401 | $ | (325,342 | ) | $ | (613,440 | ) | ||||
Foreign Currency Translation Adjustments | (Losses) Gains on Derivatives Qualifying as Hedges | Pension and Postretirement Liability Adjustment | Total | ||||||||||||
(DOLLARS IN THOUSANDS) | |||||||||||||||
Accumulated other comprehensive (loss) income, net of tax, as of December 31, 2013 | $ | (104,278 | ) | $ | (4,012 | ) | $ | (284,421 | ) | $ | (392,711 | ) | |||
OCI before reclassifications | (69,064 | ) | 12,434 | (111,915 | ) | (168,545 | ) | ||||||||
Amounts reclassified from AOCI | — | 3,949 | 16,877 | 20,826 | |||||||||||
Net current period other comprehensive income (loss) | (69,064 | ) | 16,383 | (95,038 | ) | (147,719 | ) | ||||||||
Accumulated other comprehensive loss, net of tax, as of December 31, 2014 | $ | (173,342 | ) | $ | 12,371 | $ | (379,459 | ) | $ | (540,430 | ) | ||||
The following table provides details about reclassifications out of accumulated other comprehensive income to the Consolidated Statement of Comprehensive Income:
December 31, 2016 | December 31, 2015 | December 31, 2014 | Affected Line Item in the Consolidated Statement of Comprehensive Income | |||||||||
(DOLLARS IN THOUSANDS) | ||||||||||||
(Losses) gains on derivatives qualifying as hedges | ||||||||||||
Foreign currency contracts | $ | 5,401 | $ | 18,571 | $ | (4,426 | ) | Cost of goods sold | ||||
Interest rate swaps | (595 | ) | (274 | ) | (274 | ) | Interest expense | |||||
(675 | ) | (2,321 | ) | 751 | Provision for income taxes | |||||||
$ | 4,131 | $ | 15,976 | $ | (3,949 | ) | Total, net of income taxes | |||||
(Losses) gains on pension and postretirement liability adjustments | ||||||||||||
Settlements / Curtailments | $ | — | $ | — | $ | (43 | ) | (a) | ||||
Prior service cost | 7,469 | 6,389 | (63 | ) | (a) | |||||||
Actuarial losses | (21,103 | ) | (36,167 | ) | (28,219 | ) | (a) | |||||
2,855 | 9,071 | 11,448 | Provision for income taxes | |||||||||
$ | (10,779 | ) | $ | (20,707 | ) | $ | (16,877 | ) | Total, net of income taxes | |||
(a) The amortization of prior service cost and actuarial loss is included in the computation of net periodic benefit cost. Refer to Note 14 to the Consolidated Financial Statements - Employee Benefits for additional information regarding net periodic benefit cost.
NOTE 17. CONCENTRATIONS OF CREDIT RISK
The Company does not have significant concentrations of risk in financial instruments. Temporary investments are made in a well-diversified portfolio of high-quality, liquid obligations of government, corporate and financial institutions. There are also limited concentrations of credit risk with respect to trade receivables because the Company has a large number of customers who are spread across many industries and geographic regions. The Company’s larger customers are each spread
95
across many sub-categories of its segments and geographical regions. The Company had one customer that accounted for more than 10% of its consolidated net sales in each year for all periods presented.
NOTE 18. COMMITMENTS AND CONTINGENCIES
Lease Commitments
Minimum rental payments under non-cancelable operating leases are $32.6 million in 2017, $27.2 million in 2018, $25.4 million in 2019, $24.2 million in 2020 and $145.4 million in 2021 and thereafter through 2063. The corresponding rental expense was $35.4 million, $33.6 million and $34.4 million for the years ended December 31, 2016, 2015 and 2014, respectively. None of our leases contain escalation clauses and they do not require capital improvement funding.
Guarantees and Letters of Credit
The Company has various bank guarantees and letters of credit which are available for use to support its ongoing business operations and to satisfy governmental requirements associated with pending litigation in various jurisdictions.
At December 31, 2016, the Company had total bank guarantees and standby letters of credit of approximately $38.6 million with various financial institutions. Included in the above aggregate amount is a total of $15.9 million for other assessments in Brazil for various income tax and indirect tax disputes related to fiscal years 1998-2011. There were no material amounts utilized under the standby letters of credit as of December 31, 2016.
In order to challenge the assessments in these cases in Brazil, the Company has been required to and has separately pledged assets, principally property, plant and equipment to cover assessments in the amount of approximately $13.1 million as of December 31, 2016.
Lines of Credit
The Company has various lines of credit which are available to support its ongoing business operations. As of December 31, 2016, the Company had available lines of credit (in addition to the $950.0 million of capacity under the Credit Facility as discussed in Note 9) of approximately $74.1 million with various financial institutions. There were no material amounts drawn down pursuant to these lines of credit as of December 31, 2016.
Litigation
The Company assesses contingencies related to litigation and/or other matters to determine the degree of probability and range of possible loss. A loss contingency is accrued in the Company’s consolidated financial statements if it is probable that a liability has been incurred and the amount of the loss can be reasonably estimated. Because litigation is inherently unpredictable and unfavorable resolutions could occur, assessing contingencies is highly sensitive and requires judgments about future events. On at least a quarterly basis, the Company reviews contingencies related to litigation to determine the adequacy of accruals. The amount of ultimate loss may differ from these estimates and further events may require the Company to increase or decrease the amounts it has accrued on any matter.
Periodically, the Company assesses its insurance coverage for all known claims, where applicable, taking into account aggregate coverage by occurrence, limits of coverage, self-insured retentions and deductibles, historical claims experience and claims experience with its insurance carriers. The liabilities are recorded at management’s best estimate of the probable outcome of the lawsuits and claims, taking into consideration the facts and circumstances of the individual matters as well as past experience on similar matters. At each balance sheet date, the key issues that management assesses are whether it is probable that a loss as to asserted or unasserted claims has been incurred and if so, whether the amount of loss can be reasonably estimated. The Company records the expected liability with respect to claims in Other liabilities and expected recoveries from its insurance carriers in Other assets. The Company recognizes a receivable when it believes that realization of the insurance receivable is probable under the terms of the insurance policies and its payment experience to date.
Environmental
Over the past 20 years, various federal and state authorities and private parties have claimed that we are a Potentially Responsible Party (“PRP”) as a generator of waste materials for alleged pollution at a number of waste sites operated by third parties located principally in New Jersey and have sought to recover costs incurred and to be incurred to clean up the sites.
The Company has been identified as a PRP at eight facilities operated by third parties at which investigation and/or remediation activities may be ongoing. The Company analyzes its potential liability on at least a quarterly basis and accrues for environmental liabilities when they are probable and estimable. The Company estimates its share of the total future cost for these sites to be less than $5 million.
96
While joint and several liability is authorized under federal and state environmental laws, the Company believes the amounts it has paid and anticipates paying in the future for clean-up costs and damages at all sites are not and will not have a material adverse effect on its financial condition, results of operations or liquidity. This assessment is based upon, among other things, the involvement of other PRPs at most of the sites, the status of the proceedings, including various settlement agreements and consent decrees and the extended time period over which payments will likely be made. There can be no assurance, however, that future events will not require the Company to materially increase the amounts it anticipates paying for clean-up costs and damages at these sites, and that such increased amounts will not have a material adverse effect on its financial condition, results of operations or cash flows.
China Facilities
Guangzhou Flavors plant
During 2015, the Company was notified by Chinese authorities of compliance issues pertaining to the emission of odors from several of its plants in China. As a result, the Company's Flavors plant in China was temporarily idled. The Company has made additional capital improvements in odor-abatement equipment at these plants to address these issues and is in the process of building a second Flavors plant in China, which is expected to be operating in the first quarter of 2019.
During the fourth quarter of 2016, the Company was notified that certain governmental authorities have begun to evaluate a change in the zoning of the Guangzhou Flavors plant. The zoning, if changed, would prevent the Company from continuing to manufacture product at the existing plant. The ultimate outcome of any change that the governmental authorities may propose, the timing of such a change and the nature of any compensation arrangements that might be provided to the Company are uncertain.
The net book value of the existing plant was approximately $69 million as of December 31, 2016.
Zhejiang Ingredients plant
The Company has received a request from the Chinese government to relocate its Fragrance Ingredients plant in Zhejiang, China. The Company is in discussions with the government regarding the timing of the requested relocation and the amount and nature of government compensation to be provided to the Company. The Company expects to conclude discussions with the Government in the first half of 2017. The net book value of the current plant was approximately $26 million as of December 31, 2016. Depending upon the ultimate outcome of the discussions with the Chinese government, between $0-$26 million of the remaining net book value may be subject to accelerated depreciation.
Total China Operations
The total carrying value of all five plants in China (one of which is currently under construction) was approximately $135 million as of December 31, 2016.
If the Company is required to close a plant, or operate one at significantly reduced production levels on a permanent basis, the Company may be required to record charges that could have a material impact on its consolidated financial results of operations, financial position and cash flows in future periods.
Other Contingencies
The Company has contingencies involving third parties (such as labor, contract, technology or product-related claims or litigation) as well as government-related items in various jurisdictions in which it operates pertaining to such items as value-added taxes, other indirect taxes, customs and duties and sales and use taxes. It is possible that cash flows or results of operations, in any period, could be materially affected by the unfavorable resolution of one or more of these contingencies.
The most significant government-related contingencies exist in Brazil. With regard to the Brazilian matters, the Company believes it has valid defenses for the underlying positions under dispute; however, in order to pursue these defenses, the Company is required to, and has provided, bank guarantees and pledged assets in the aggregate amount of $29 million. The Brazilian matters take an extended period of time to proceed through the judicial process and there are a limited number of rulings to date.
ZoomEssence
In March 2012, ZoomEssence, Inc. filed a complaint against the Company in the U.S. District Court for the District of New Jersey alleging trade secret misappropriation, breach of contract and unjust enrichment in connection with certain spray dry technology disclosed to the Company. ZoomEssence sought an injunction and monetary damages. ZoomEssence initially sought a temporary restraining order and preliminary injunction, but the Court denied these applications in an order entered on September 27, 2013, finding that ZoomEssence had not demonstrated a likelihood of success on the merits of its claims. On November 3, 2014, ZoomEssence amended its complaint against the Company to include allegations of breach of the duty of
97
good faith and fair dealing, fraud in the inducement, and misappropriation of confidential and proprietary information. On November 13, 2014, the Company filed a counterclaim against ZoomEssence alleging trade secret misappropriation, breach of contract, breach of the implied covenant of good faith and fair dealing, unjust enrichment, misappropriation of confidential and proprietary information, common law unfair competition, tortious interference with contractual relations, and conversion. During the third quarter of 2016, the Court stayed the case and directed the parties to mediate. During the fourth quarter of 2016, the parties engaged in mediation and various settlement discussions which have not resulted in a resolution of the litigation to date. If the case is not settled, we expect that a trial on the merits of the case will occur during 2017. Based on expert assessment of potential exposure and the status of the settlement discussions, the Company recorded an additional reserve of $50 million during 2016.
Other
The Company determines estimates of reasonably possible losses or ranges of reasonably possible losses in excess of related accrued liabilities, if any, when it has determined that either a loss is reasonably possible or a loss in excess of accrued amounts is reasonably possible and the amount of losses or range of losses is determinable. For all third party contingencies (including labor, contract, technology, tax, product-related claims and business litigation), the Company currently estimates that the aggregate range of reasonably possible losses in excess of any accrued liabilities is $0 to approximately $28 million. The estimates included in this amount are based on the Company’s analysis of currently available information and, as new information is obtained, these estimates may change. Due to the inherent subjectivity of the assessments and the unpredictability of outcomes of legal proceedings, any amounts accrued or included in this aggregate amount may not represent the ultimate loss to the Company from the matters in question. Thus, the Company’s exposure and ultimate losses may be higher or lower, and possibly significantly so, than the amounts accrued or the range disclosed above.
Spanish Capital Tax
The Spanish tax authorities alleged claims for a capital tax and the Appellate Court rejected one of the two bases upon which the Company based its capital tax position. On January 22, 2014, the Company filed an appeal and in order to avoid future interest costs in the event its appeal was unsuccessful, the Company paid Euro 9.8 million ($11.2 million, representing the principal amount) during the first quarter of 2014. On February 24, 2016, the Company received a favorable ruling on its appeal from the Spanish Supreme Court which overruled a lower court ruling. As a result of this decision, the Company reversed the previously recorded provision of Euro 9.8 million ($10.5 million) for the year ended December 31, 2015. During 2016, the Company recorded additional income of $2.3 million related to the finalization of amounts received from the authorities. This amount has principally been reflected as a reduction of administrative expense.
NOTE 19. SUBSEQUENT EVENTS
2017 Productivity Program
On February 15, 2017, the Company announced that it was adopting a multi-year productivity program designed to improve overall financial performance, provide flexibility to invest in growth opportunities and drive long-term value creation. In connection with this program, the Company expects to optimize its global footprint and simplify its organizational structures globally. In connection with this initiative, the Company expects to incur cumulative, pre-tax cash charges of between $30-$35 million, consisting primarily of $21-$22 million in personnel-related costs and an estimated $9-$13 million in facility-related costs, such as lease termination, and integration-related costs. In addition, the Company may incur up to $5 million of accelerated depreciation. Approximately $10 million of these charges are expected to be recorded in the first quarter of 2017, with the remainder of the personnel-related costs expected to be recognized by the end of 2017 and the other costs expected to be recognized over the following seven quarters. The overall charges are split approximately evenly between Flavors and Fragrances. This initiative is expected to result in the reduction of approximately 370 members of the Company’s global workforce in various parts of the organization.
98
(a)(3) EXHIBITS
Exhibit Number | Description | ||
3(i) | Restated Certificate of Incorporation of the Registrant, incorporated by reference to Exhibit 10(g) to Registrant’s Quarterly Report on Form 10-Q (File No. 001-04858) filed on August 12, 2002. | ||
3(ii) | By-laws of the Registrant, including all amendments adopted as of December 15, 2015, incorporated by reference to Exhibit 3(ii) to Registrant’s Current Report on Form 8-K filed on December 17, 2015. | ||
4.1 | Note Purchase Agreement, dated as of September 27, 2007, by and among the Registrant and the various purchasers named therein, incorporated by reference to Exhibit 4.7 to Registrant’s Current Report on Form 8-K (File No. 001-04858) filed on October 1, 2007. | ||
4.2 | Form of Series A, Series B, Series C and Series D Senior Notes incorporated by reference to Exhibit 4.8 to Registrant’s Current Report on Form 8-K (File No. 001-04858) filed on October 1, 2007. | ||
4.3 | Indenture, dated as of April 4, 2013, between the Registrant and U.S. Bank National Association, as Trustee (including the form of Notes), incorporated by reference to Exhibit 4.1 to Registrant’s Current Report on Form 8-K filed on April 4, 2013. | ||
4.4 | Indenture, dated as of March 2, 2016, between the Registrant and U.S. Bank National Association, as Trustee, incorporated by reference to Exhibit 4.1 to Registrant’s Registration Statement on Form S-3 (Registration No. 333-209889) filed on March 2, 2016. | ||
4.5 | Form of Debt Security, incorporated by reference to Exhibit 4.2 to Registrant’s Registration Statement on Form S-3 (Registration No. 333-209889) filed on March 2, 2016. | ||
4.6 | First Supplemental Indenture, dated as of March 14, 2016, between the Registrant and U.S. Bank National Association, as Trustee (including the form of Notes), incorporated by reference to Exhibit 4.7 to Registrant’s Current Report on Form 8-K filed on March 14, 2016. | ||
*10.1 | Letter Agreement, dated as of May 26, 2014, between the Registrant and Andreas Fibig, incorporated by reference to Exhibit 10.1 to the Registrant’s Current Report on Form 8-K filed on May 28, 2014. | ||
*10.2 | Supplemental Retirement Plan, incorporated by reference to Exhibit 10.5 to Registrant’s Annual Report on Form 10-K (File No. 001-04858) filed on February 27, 2008. | ||
*10.3 | 2000 Stock Award and Incentive Plan, as amended and restated December 31, 2007, incorporated by reference to Exhibit 10.6 to Registrant’s Annual Report on Form 10-K (File No. 001-04858) filed on February 27, 2008. | ||
*10.4 | Form of Employee Stock Option Agreement under the 2000 Stock Award and Incentive Plan, incorporated by reference to Exhibit 10.1 to Registrant’s Quarterly Report on Form 10-Q (File No. 001-04858) filed on November 9, 2004. | ||
*10.5 | Form of Stock-Settled Appreciation Rights Agreement under the 2000 Stock Award and Incentive Plan, incorporated by reference to Exhibit 10.6 to Registrant’s Quarterly Report on Form 10-Q (File No. 001-04858) filed on October 31, 2007. | ||
*10.6 | Form of Non-Employee Director’s Restricted Stock Units Agreement under International Flavors & Fragrances Inc. 2000 Stock Award and Incentive Plan, incorporated by reference to Exhibit 10.7 to Registrant’s Report on Form 10-Q filed on October 31, 2007. | ||
*10.7 | 2010 Stock Award and Incentive Plan, as amended and restated as of May 6, 2015, incorporated by reference to Exhibit 10.8 to Registrant’s Quarterly Report on Form 10-Q filed on May 12, 2015. | ||
99
Exhibit Number | Description | |
*10.8 | Form of U.S. Stock Settled Appreciation Rights Agreement under the 2010 Stock Award and Incentive Plan, incorporated by reference to Exhibit 10.29 to Registrant’s Annual Report on Form 10-K (File No. 001-04858) filed on February 28, 2012. | |
*10.9 | Form of Restricted Stock Units Agreement - Non-Employee Director under the 2010 Stock Award and Incentive Plan, incorporated by reference to Exhibit 10.32 to Registrant’s Annual Report on Form 10-K (File No. 001-04858) filed on February 28, 2012. | |
*10.10 | Form of Long-Term Incentive Plan Award Agreement under the 2010 Stock Award and Incentive Plan, incorporated by reference to Exhibit 10.30 to Registrant’s Annual Report on Form 10-K filed on February 25, 2014. | |
*10.11 | Form of Restricted Stock Units Award Agreement under the 2010 Stock Award and Incentive Plan, incorporated by reference to Exhibit 10.1 to Registrant’s Quarterly Report on Form 10-Q filed on May 6, 2014. | |
*10.12 | Form of Equity Choice Program Award Agreement under the 2010 Stock Award and Incentive Plan, incorporated by reference to Exhibit 10.2 to Registrant’s Quarterly Report on Form 10-Q filed on May 6, 2014. | |
*10.13 | 2015 Stock Award and Incentive Plan, as amended and restated February 7, 2017. | |
*10.14 | Form of Annual Incentive Plan Award Agreement under the 2015 Stock Award and Incentive Plan, incorporated by reference to Exhibit 10.3 to Registrant’s Quarterly Report on Form 10-Q filed on May 12, 2015. | |
*10.15 | Form of Long-Term Incentive Plan Award Agreement under the 2015 Stock Award and Incentive Plan, incorporated by reference to Exhibit 10.4 to Registrant’s Quarterly Report on Form 10-Q filed on May 12, 2015. | |
*10.16 | Form of Equity Choice Program Award Agreement under the 2015 Stock Award and Incentive Plan, incorporated by reference to Exhibit 10.5 to Registrant’s Quarterly Report on Form 10-Q filed on May 12, 2015. | |
*10.17 | Form of Restricted Stock Units Award Agreement under the 2015 Stock Award and Incentive Plan, incorporated by reference to Exhibit 10.6 to Registrant’s Quarterly Report on Form 10-Q filed on May 12, 2015. | |
*10.18 | Form of Non-Employee Director Restricted Stock Units Award Agreement under the 2015 Stock Award and Incentive Plan, incorporated by reference to Exhibit 10.7 to Registrant’s Quarterly Report on Form 10-Q filed on May 12, 2015. | |
*10.19 | Form of Equity Choice Program Award Agreement under the 2015 Stock Award and Incentive Plan, incorporated by reference to Exhibit 10.1 to Registrant’s Quarterly Report on Form 10-Q filed on November 9, 2015. | |
*10.20 | Form of Long-Term Incentive Plan Award Agreement under the 2015 Stock Award and Incentive Plan, incorporated by reference to Exhibit 10.25 to Registrant’s Annual Report on Form 10-K filed on March 1, 2016. | |
100
Exhibit Number | Description | ||
*10.21 | Amended and Restated Executive Severance Policy, as amended through and including February 7, 2017. | ||
*10.22 | Form of Director/Officer Indemnification Agreement, incorporated by reference to Exhibit 10.1 to Registrant’s Current Report on Form 8-K (File No. 001-04858) filed on July 28, 2008. | ||
*10.23 | Credit Agreement, dated as of November 9, 2011, amended and restated as of December 2, 2016, among the Registrant, International Flavors & Fragrances (Luxembourg) S.à.r.l., International Flavors & Fragrances (Nederland) Holding B.V., International Flavors & Fragrances I.F.F. (Nederland) B.V. and International Flavors & Fragrances (Greater Asia) PTE. Ltd., as borrowers, the banks, financial institutions and other institutional lenders party thereto, and Citibank, N.A. as administrative agent, incorporated by reference to Exhibit 10.28 to Registrant’s Current Report on Form 8-K filed on December 5, 2016. | ||
*10.24 | Form of Executive Death Benefit Program - Plan Agreement, incorporated by reference to Exhibit 10.27 to Registrant’s Annual Report on Form 10-K filed on February 28, 2012. | ||
*10.25 | Deferred Compensation Plan, as amended and restated December 12, 2011, incorporated by reference to Exhibit 10.28 to Registrant’s Annual Report on Form 10-K (File No. 001-04858) filed on February 28, 2012. | ||
*10.26 | Separation Agreement and General Release, dated as of October 11, 2016, between the Registrant and Alison Cornell. | ||
12 | Statement re: Computation of Ratios | ||
21 | List of Principal Subsidiaries. | ||
23 | Consent of PricewaterhouseCoopers LLP. | ||
31.1 | Certification of Andreas Fibig pursuant to Section 302 of the Sarbanes-Oxley Act of 2002. | ||
31.2 | Certification of Richard A. O'Leary pursuant to Section 302 of the Sarbanes-Oxley Act of 2002. | ||
32 | Certification of Andreas Fibig and Richard A. O'Leary pursuant to 18 U.S.C. Section 1350 as adopted pursuant to the Sarbanes-Oxley Act of 2002. | ||
101.INS | XBRL Instance Document | ||
101.SCH | XBRL Taxonomy Extensions Schema | ||
101.CAL | XBRL Taxonomy Extension Calculation Linkbase | ||
101.DEF | XBRL Taxonomy Extension Definition Linkbase | ||
101.LAB | XBRL Taxonomy Extension Label Linkbase | ||
101.PRE | XBRL Taxonomy Extension Presentation Linkbase | ||
* | Management contract or compensatory plan or arrangement |
101
ITEM 16. | FORM 10-K SUMMARY. |
None.
102
SIGNATURES
Pursuant to the requirements of Section 13 or 15(d) of the Securities Exchange Act of 1934, the Registrant has duly caused this report to be signed on its behalf by the undersigned, thereunto duly authorized.
INTERNATIONAL FLAVORS & FRAGRANCES INC. | ||
By: | /s/ Richard A. O'Leary | |
Name: | Richard A. O'Leary | |
Title: | Executive Vice President and Chief Financial Officer | |
Dated: February 28, 2017
Pursuant to the requirements of the Securities Exchange Act of 1934, this report has been signed below by the following persons on behalf of the registrant and in the capacities and on the dates indicated:
103
Signature | Title | Date | ||
/s/ Andreas Fibig | Chairman of the Board, Chief Executive Officer and Director (Principal Executive Officer) | February 28, 2017 | ||
Andreas Fibig | ||||
/s/ Richard A. O'Leary | Executive Vice President, Chief Financial Officer and Chief Accounting Officer | February 28, 2017 | ||
Richard A. O'Leary | ||||
/s/ Marcello V. Bottoli | Director | February 28, 2017 | ||
Marcello V. Bottoli | ||||
/s/ Linda B. Buck | Director | February 28, 2017 | ||
Linda B. Buck | ||||
/s/ Michael Ducker | Director | February 28, 2017 | ||
Michael Ducker | ||||
/s/ David R. Epstein | Director | February 28, 2017 | ||
David R. Epstein | ||||
/s/ Roger W. Ferguson, Jr. | Director | February 28, 2017 | ||
Roger W. Ferguson, Jr. | ||||
/s/ John F. Ferraro | Director | February 28, 2017 | ||
John F. Ferraro | ||||
/s/ Christina Gold | Director | February 28, 2017 | ||
Christina Gold | ||||
/s/ Henry W. Howell, Jr. | Director | February 28, 2017 | ||
Henry W. Howell, Jr. | ||||
/s/ Katherine M. Hudson | Director | February 28, 2017 | ||
Katherine M. Hudson | ||||
/s/ Dale F. Morrison | Director | February 28, 2017 | ||
Dale F. Morrison | ||||
104
INTERNATIONAL FLAVORS & FRAGRANCES INC. AND SUBSIDIARIES
SCHEDULE II — VALUATION AND QUALIFYING ACCOUNTS AND RESERVES
(IN THOUSANDS)
For the Year Ended December 31, 2016 | |||||||||||||||||||
Balance at beginning of period | Additions (deductions) charged to costs and expenses | Accounts written off | Translation adjustments | Balance at end of period | |||||||||||||||
Allowance for doubtful accounts | $ | 8,229 | $ | 2,452 | $ | (225 | ) | $ | (461 | ) | $ | 9,995 | |||||||
Valuation allowance on credit and operating loss carryforwards and other net deferred tax assets | 339,395 | (171,408 | ) | (1)(4) | — | (15,235 | ) | 152,752 | |||||||||||
For the Year Ended December 31, 2015 | |||||||||||||||||||
Balance at beginning of period | Additions (deductions) charged to costs and expenses | Accounts written off | Translation adjustments | Balance at end of period | |||||||||||||||
Allowance for doubtful accounts | $ | 9,147 | $ | 590 | $ | 60 | $ | (1,568 | ) | $ | 8,229 | ||||||||
Valuation allowance on credit and operating loss carryforwards and other net deferred tax assets | 355,568 | 16,445 | (2) | — | (32,618 | ) | 339,395 | ||||||||||||
For the Year Ended December 31, 2014 | |||||||||||||||||||
Balance at beginning of period | Additions (deductions) charged to costs and expenses | Accounts written off | Translation adjustments | Balance at end of period | |||||||||||||||
Allowance for doubtful accounts | $ | 10,493 | $ | 222 | $ | (554 | ) | $ | (1,014 | ) | $ | 9,147 | |||||||
Valuation allowance on credit and operating loss carryforwards and other net deferred tax assets | 503,990 | (92,204 | ) | (3) | — | (56,218 | ) | 355,568 | |||||||||||
_______________________
(1) The 2016 amount includes an adjustment to the 2015 foreign net operating loss carryforwards in the amount of $7.6 million, as discussed in Note 10 of the Consolidated Financial Statements.
(2) The 2015 amount includes an adjustment to the 2014 foreign net operating loss carryforwards in the amount of $10.0 million, as discussed in Note 10 of the Consolidated Financial Statements.
(3) The 2014 amount includes an adjustment to the 2013 foreign net operating loss carryforwards in the amount of $81.0 million, as discussed in Note 10 of the Consolidated Financial Statements.
(4) The Company executed a legal entity restructuring that resulted in a significant reduction of fully valued deferred tax assets.
S-1
INTERNATIONAL FLAVORS & FRAGRANCES INC.
INVESTOR INFORMATION
ANNUAL MEETING
The Annual Meeting of Shareholders will be held at the offices of the Company, 521 West 57th Street, New York, New York, on May 3, 2017 at 10:00 a.m., EDT.
IFF will be furnishing proxy materials to shareholders on the internet, rather than mailing printed copies of those materials to each shareholder. A Notice of Internet Availability of Proxy Materials will be mailed to each shareholder on or about March 20, 2017, which will provide instructions as to how shareholders may access and review the proxy materials for the 2017 Annual Meeting on the website referred to in the Notice or, alternatively, how to request a printed copy of the proxy materials be sent to them by mail.
TRANSFER AGENT AND REGISTRAR
American Stock Transfer & Trust Company
59 Maiden Lane
New York, New York 10038
800-937-5449
www.amstock.com
LISTED
New York Stock Exchange
Euronext Paris
INDEPENDENT REGISTERED PUBLIC ACCOUNTING FIRM
PricewaterhouseCoopers LLP
WEBSITE
www.iff.com