Attached files
Table of Contents
UNITED STATES SECURITIES AND EXCHANGE COMMISSION
Washington, D.C. 20549
FORM 10-K
| x | ANNUAL REPORT PURSUANT TO SECTION 13 OR 15(d) OF THE SECURITIES EXCHANGE ACT OF 1934 |
For the fiscal year ended December 31, 2009
OR
| ¨ | TRANSITION REPORT PURSUANT TO SECTION 13 OR 15(d) OF THE SECURITIES EXCHANGE ACT OF 1934 |
For the transition period from to
Commission File Number 1-4858
INTERNATIONAL FLAVORS & FRAGRANCES INC.
(Exact name of registrant as specified in its charter)
| NEW YORK | 13-1432060 | |
| (State or other jurisdiction of incorporation or organization) |
(I.R.S. Employer Identification No.) | |
| 521 WEST 57TH STREET, NEW YORK, N.Y. | 10019 | |
| (Address of principal executive offices) | (Zip Code) | |
Registrant’s telephone number, including area code (212) 765-5500
SECURITIES REGISTERED PURSUANT TO SECTION 12(b) OF THE ACT:
| Title of Each Class |
Name of Each Exchange on Which Registered | |
| Common Stock, par value | New York Stock Exchange | |
| 12 1/2¢ per share |
SECURITIES REGISTERED PURSUANT TO SECTION 12(g) OF THE ACT:
None
Indicate by check mark if the registrant is a well-known seasoned issuer, as defined in Rule 405 of the Securities Act. Yes x No ¨
Indicate by check mark if the registrant is not required to file reports pursuant to Section 13 or Section 15(d) of the Act. Yes ¨ No x
Indicate by check mark whether the registrant (1) has filed all reports required to be filed by Section 13 or 15(d) of the Securities Exchange Act of 1934 during the preceding 12 months (or for such shorter period that the registrant was required to file such reports), and (2) has been subject to such filing requirements for the past 90 days. Yes x No ¨
Indicate by check mark whether the registrant has submitted electronically and posted on its corporate Web site, if any, every Interactive Data File required to be submitted and posted pursuant to Rule 405 of Regulation S-T during the preceding 12 months (or for such shorter period that the registrant was required to submit and post such files). Yes ¨ No ¨
Indicate by check mark if disclosure of delinquent filers pursuant to Item 405 of Regulation S-K is not contained herein, and will not be contained, to the best of registrant’s knowledge, in definitive proxy or information statements incorporated by reference in Part III of this Form 10-K or any amendments to this Form 10-K. ¨
Indicate by check mark whether the registrant is a large accelerated filer, an accelerated filer, a non-accelerated filer, or a smaller reporting company. See the definitions of “large accelerated filer,” “accelerated filer” and “smaller reporting company” in Rule 12b-2 of the Exchange Act.
| Large accelerated filer x | Accelerated filer ¨ | Non-accelerated filer ¨ | Smaller reporting company ¨ |
Indicate by check mark whether the registrant is a shell company (as defined in Rule 12b-2 of the Exchange Act). Yes ¨ No x
For the purpose of reporting the following market value of registrant’s outstanding common stock, the term “affiliate” refers to persons, entities or groups which directly or indirectly control, are controlled by, or are under common control with the registrant and does not include individual executive officers, directors or less than 10% shareholders. The aggregate market value of registrant’s common stock not held by affiliates as of June 30, 2009 was $2,584,509,708.
As of February 12, 2010, there were 79,235,120 shares of the registrant’s common stock, par value 12 1/2¢ per share, outstanding.
DOCUMENTS INCORPORATED BY REFERENCE
Portions of the registrant’s proxy statement for the 2010 Annual Meeting (the “IFF 2010 Proxy Statement”) are incorporated by reference in Part III of this Form 10-K.
Table of Contents
INTERNATIONAL FLAVORS & FRAGRANCES INC.
| PAGE | ||||
| PART I | ||||
| ITEM 1. |
3 | |||
| ITEM 1A. |
7 | |||
| ITEM 1B. |
10 | |||
| ITEM 2. |
10 | |||
| ITEM 3. |
11 | |||
| ITEM 4. |
13 | |||
| PART II | ||||
| ITEM 5. |
Market for Registrant’s Common Equity, Related Stockholder Matters and Issuer Purchases of Equity Securities | 14 | ||
| ITEM 6. |
17 | |||
| ITEM 7. |
Management’s Discussion and Analysis of Financial Condition and Results of Operations | 19 | ||
| ITEM 7A. |
38 | |||
| ITEM 8. |
39 | |||
| ITEM 9. |
Changes in and Disagreements with Accountants on Accounting and Financial Disclosure | 40 | ||
| ITEM 9A. |
Controls and Procedures | 40 | ||
| ITEM 9B. |
41 | |||
| PART III | ||||
| ITEM 10. |
42 | |||
| ITEM 11. |
42 | |||
| ITEM 12. |
Security Ownership of Certain Beneficial Owners and Management, and Related Stockholder Matters | 42 | ||
| ITEM 13. |
Certain Relationships and Related Transactions, and Director Independence | 43 | ||
| ITEM 14. |
43 | |||
| PART IV | ||||
| ITEM 15. |
44 | |||
| 82 | ||||
2
Table of Contents
PART I
| ITEM 1. | BUSINESS. |
International Flavors & Fragrances Inc., incorporated in New York in 1909, and its subsidiaries (the “Registrant”, “IFF”, “we”, “us”, and “our”), is a leading creator and manufacturer of flavor and fragrance products used by other manufacturers to impart or improve flavor or fragrance in a wide variety of consumer products. Fragrance products are sold principally to manufacturers of perfumes, cosmetics, personal care products, hair care products, deodorants, soaps, detergents, fabric care and air care products; our flavor products are sold principally to manufacturers of prepared foods, beverages, pharmaceuticals, dairy and confectionery products as well as the food service industry.
We currently have 31 manufacturing facilities with the major manufacturing facilities located in the United States, Great Britain, Ireland, the Netherlands, Spain, Argentina, Brazil, Mexico, Australia, China, India, Indonesia, Japan and Singapore. The remaining manufacturing facilities are located in 8 other countries. We maintain our own sales and distribution facilities in 32 countries and are represented by sales agents and distributors in other countries. Our principal executive offices are located at 521 West 57th Street, New York, New York 10019 (212-765-5500).
MARKETS
Our flavor products are sold principally to the food and beverage industries for use in consumer products such as soft drinks, non-carbonated drinks, candies, baked goods, desserts, prepared foods, dietary foods, dairy products, drink powders, pharmaceuticals, snack foods and alcoholic beverages. Two of our largest customers for flavor products are major producers of prepared foods and beverages in the United States. In the three years ended December 31, 2009, 2008 and 2007, sales of flavor products accounted for 46%, 46% and 44%, respectively, of our total sales.
Our fragrance products are used by customers in the manufacture of various consumer goods in the home and personal care markets. The home market consists of laundry detergents, fabric care, candles, air fresheners and all-purpose cleaners. The personal care market consists of perfumes, colognes, after-shave lotions, skin care, lipsticks, deodorants and hair preparations. Most of the major global and regional manufacturers in each of these categories are our customers. Five of the largest global companies are among our principal customers. In the three years ended December 31, 2009, 2008 and 2007, sales of fragrance products accounted for 54%, 54% and 56%, respectively, of our total sales.
See Note 12, Segment Information, of the Notes to the Consolidated Financial Statements for information concerning the two business segments, Flavors and Fragrances, and our geographic regions.
PRODUCTS
Our principal fragrance and flavor products consist of compounds of large numbers of ingredients blended in proprietary formulas created by our perfumers and flavorists. Most of these compounds contribute the total fragrance or flavor to the consumer products in which they are used. This fragrance or flavor characteristic is often a major factor in the consumer selection and acceptance of the consumer end product. A smaller number of compounds are sold to manufacturers who further blend them to achieve the finished fragrance or flavor in their products. We produce thousands of compounds, and new compounds are constantly being created in order to meet the many and changing characteristics of our customers’ end products. Most of the fragrance and flavor compounds are created and produced for the exclusive use of particular customers. Our products are sold in powder and liquid forms and in amounts ranging from a few pounds to many tons, depending upon the nature of the product.
The ingredients that we use in our compounds are both synthetic and natural. We manufacture a substantial portion of the synthetic ingredients. While a majority of our synthetic ingredients production is used in our
3
Table of Contents
compounds, a substantial portion is also sold to others. Natural ingredients are derived from flowers, fruits and other botanical products as well as from animal products. They contain varying numbers of organic chemicals, which are responsible for the fragrance or flavor of the natural product. The natural products are purchased in processed or semi-processed form. Some are used in compounds in the state in which they are purchased and others after further processing. Natural products, together with various chemicals, are also used as raw materials for the manufacture of synthetic ingredients by chemical processes. Our flavor products also include extracts and seasonings derived from various fruits, vegetables, nuts, herbs and spices as well as microbiologically-derived ingredients.
MARKET DEVELOPMENTS
The demand for consumer products utilizing flavors and fragrances has been stimulated and broadened by changing social habits resulting from various factors such as increases in personal income, dual-earner households, teenage population, leisure time, urbanization, health and wellness concerns, including increased demand for nature based products and by the continued growth of emerging markets. In the fragrance field, these developments expanded the market for hair care, candles and air care products and deodorant and personal wash products with finer fragrance quality, as well as the market for colognes, toilet waters, men’s toiletries and other products beyond traditional luxury items such as perfumes. In the flavor field, similar market characteristics stimulated the demand for products such as convenience foods, soft drinks and low-fat and organic food products that must conform to expected tastes. New and improved methods of packaging, applying and dispensing have been developed for many consumer products that utilize some of our flavor or fragrance products. These developments called for the creation of new compounds and ingredients compatible with the newly introduced materials and methods of application.
PRODUCT DEVELOPMENT AND RESEARCH
The development of new flavors and fragrances is a complex technical and artistic process calling upon the combined knowledge and skill of our creative perfumers and flavorists, and our scientists. With extensive experience, the perfumers and flavorists continuously advance their skills for creating fragrances or flavors best suited to the market requirements of the customers’ products.
Scientists from various disciplines work in project teams with the perfumers and flavorists to develop flavor and fragrance products with consumer preferred performance characteristics. Scientific expertise includes: natural products research, plant science, organic chemistry, analytical chemistry, biochemistry, microbiology, process engineering, food science, material science and sensory science. Analytical and sensory science is applied to understand the complex interactions of the many ingredients in a consumer product in order to optimize the flavor or fragrance performance at all points of use. Material science technology is applied to create controlled release and delivery systems to enhance flavor and fragrance performance in consumer products. An important contribution to the creation of new flavor and fragrances is the discovery and development of new ingredients having improved fragrance or flavor value. The ingredients research program discovers molecules found in natural substances and creates new molecules that are subsequently tested for their fragrance or flavor value. The new molecules that meet rigorous requirements for commercial development are subsequently transferred to manufacturing operations for production.
Creative and technical product development is conducted in 33 fragrance and flavor laboratories in 26 countries. We maintain a research and development center at Union Beach, New Jersey. We spent $194 million in 2009, $209 million in 2008 and $197 million in 2007 on our research and development activities or about 8% to 9% of our revenues each year. We expect these expenditures to remain at this percentage level for 2010. Of the amount expended in 2009 on such activities, 62% was for fragrances and the balance was for flavors. We employed 1,091 persons in 2009 and 1,146 persons in 2008 in such activities.
Our business is not materially dependent upon any patents, trademarks or licenses.
4
Table of Contents
DISTRIBUTION
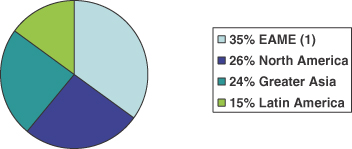
Distribution for both the flavors and fragrances business units is similar in that most of our sales are through our own sales force. The flavors business operates from two sales offices in the United States and 38 sales offices in 30 foreign countries, while the fragrances business operates from two sales offices in the United States and 36 sales offices in 29 foreign countries. Sales in additional countries are made through agents and distributors. For the year ended December 31, 2009, 35% of our sales were to customers in Europe, Africa and Middle East (“EAME”), 26% in North America, 24% in Greater Asia and 15% in Latin America.
During 2009, our 30 largest customers accounted for 57% of our sales. Sales to one customer accounted for 11% of our sales in 2009, 2008 and 2007. These sales were largely in the fragrance business unit.
GOVERNMENTAL REGULATION
The manufacture and sale of our products are subject to regulation in the United States by the Food and Drug Administration, the Department of Agriculture, the Bureau of Alcohol, Tobacco and Firearms, the Environmental Protection Agency, the Occupational Safety and Health Administration, the Drug Enforcement Administration and state authorities. Foreign subsidiaries are subject to similar regulation in a number of countries. In particular, the European Union will require extensive chemical registration and testing over the next 8 years. Compliance with existing governmental requirements regulating the discharge of materials into the environment has not materially affected our operations, earnings or competitive position. In 2010, we expect to spend approximately $6 to $8 million on capital projects and approximately $18 million in operating expenses and governmental charges for the purpose of complying with such requirements.
RAW MATERIAL PURCHASES
We purchase roughly 10,000 different raw materials from many sources all over the world. The principal natural raw materials consist of essential oils, extracts and concentrates which are derived from fruits, vegetables, flowers, woods and other botanicals, animal products and raw fruits. The principal synthetic raw material purchases consist of organic chemicals. We believe that alternate materials or alternate sources of materials are available to enable us to maintain our competitive position in the event of any interruption in the supply of raw materials from present sources.
COMPETITION
We have more than 50 competitors in the world markets. IFF is one of the top four companies, which together represent approximately 70% of the flavors and fragrances industry. While no single factor is responsible, our competitive position is based principally on the creative skills of our perfumers and flavorists, the technological advances resulting from our research and development activities, the quality of our customer service, the support provided by our marketing and application groups, and our understanding of consumers. We believe that we are one of the largest companies producing and marketing, on an international basis, a wide range of fragrance and flavor products for sale to manufacturers of consumer products. In particular countries and localities, we face competition from numerous companies specializing in certain product lines, among which are some companies larger than us and some more important in a particular product line or lines. Most of our customers do not buy all of their fragrance or flavor products from the same supplier, and some customers make their own fragrance or flavor compounds with ingredients supplied by us or others.
EMPLOYEE RELATIONS
At December 31, 2009, we employed approximately 5,400 persons, of whom approximately 1,400 were employed in the United States. We have not experienced a work stoppage or strike and consider our employee relations to be satisfactory.
5
Table of Contents
EXECUTIVE OFFICERS OF REGISTRANT
Effective October 1, 2009, the Company’s Board of Directors appointed Douglas D. Tough, a director of the Company since October 2008, as the Company’s Chairman of the Board. Mr. Tough, age 60, will also assume the role of Chief Executive Officer of the Company on March 1, 2010. Mr. Tough served as Chief Executive Officer and Managing Director of Ansell Limited, a global leader in healthcare barrier protective products, from July 2004 until February 2010.
The current executive officers of the Company, as of February 25, 2010, are listed below.
| Name |
Office and Other Business Experience(1) |
Age | Year First Became Officer | |||
| Kevin C. Berryman |
Member, Temporary Office of the Chief Executive Officer since October 2009 (2); Executive Vice President and Chief Financial Officer since May 2009; Chief Financial Officer, Nestle Professional, Americas, a global foodservice manufacturer, from October 2008 to May 2009; Senior Vice President Group Controller, Nestle S.A., an international food and beverage company, from June 2006 to September 2008; Chief Financial Officer, Nestle Purina Petcare, a manufacturer of pet products, from December 2001 to May 2006. | 51 | 2009 | |||
| Beth E. Ford |
Executive Vice President, Head of Supply Chain since October 2008; Executive Vice President and Chief Operating Officer, Hachette Book Group, a leading US trade publisher, from September 2007 to September 2008; Senior Vice President, Global Operations and Information Technology, Scholastic, Inc., a global publishing, education and media company, prior thereto. | 45 | 2008 | |||
| Nicolas Mirzayantz |
Member, Temporary Office of the Chief Executive Officer since October 2009 (2); Group President, Fragrances since January 2007; Senior Vice President, Fine Fragrance and Beauty Care and Regional Manager, North America Region from April 2005 to December 2006; Senior Vice President, Fine Fragrance and Beauty Care from October 2004 to March 2005; Vice President, Global Business Development, Fine Fragrance and Toiletries, prior thereto. | 47 | 2002 | |||
| Hernan Vaisman |
Member, Temporary Office of the Chief Executive Officer since October 2009 (2); Group President, Flavors since January 2007; Vice President, Latin America Region from October 2004 to December 2006; Regional Finance Director, Latin America Region, prior thereto. | 51 | 2004 | |||
| Angelica T. Cantlon |
Senior Vice President, Human Resources since August 2009; Senior Vice President-International Chief Administrative Officer, MetLife, Inc., an insurance and financial services company, from June 2005 to August 2009 and Senior Vice President-Human Resources Business Leader, prior thereto. | 58 | 2009 | |||
| Dennis M. Meany |
Senior Vice President, General Counsel and Secretary since January 2004. | 62 | 2004 | |||
6
Table of Contents
| Name |
Office and Other Business Experience(1) |
Age | Year First Became Officer | |||
| Richard A. O’Leary |
Vice President and Controller since June 2009; Interim Chief Financial Officer from July 2008 to May 2009; Vice President, Corporate Development from July 2007 to May 2009; Finance Director, International Paper’s, a paper and packaging company, Brazilian affiliate from August 2004 to June 2007; Finance Director, International Paper’s Shorewood Packaging Unit, prior thereto. | 49 | 2007 |
| (1) | Employed by the Company or an affiliated company for the last five years, except as otherwise indicated. |
| (2) | The temporary Office of the Chief Executive Office (CEO) will be in place until Mr. Tough assumes the CEO position. |
We make available free of charge on or through the Investor Relations link on our website, www.iff.com, all materials that we file electronically with the SEC, including our annual report on Form 10-K, quarterly reports on Form 10-Q, current reports on Form 8-K, and amendments to those reports, filed or furnished pursuant to Section 13(a) or 15(d) of the Securities Exchange Act of 1934 as soon as reasonably practicable after electronically filing such materials with, or furnishing them to, the SEC. During the period covered by this Form 10-K, we made all such materials available through our website as soon as reasonably practicable after filing such materials with the SEC.
You may also read and copy any materials filed by us with the SEC at the SEC’s Public Reference Room at 100 F Street, N.E., Washington, DC 20549, and you may obtain information on the operation of the Public Reference Room by calling the SEC in the U.S. at 1-800-SEC-0330. In addition, the SEC maintains an Internet website, www.sec.gov, that contains reports, proxy and information statements and other information that we file electronically with the SEC.
A copy of our Corporate Governance Guidelines, Code of Business Conduct and Ethics, and the charters of the Audit Committee, Compensation Committee, and Nominating and Governance Committee of the Board of Directors are posted on the Investor Relations section of our website, www.iff.com.
| ITEM 1A. | RISK FACTORS. |
The following are some important factors that could cause the Company’s actual results to differ materially from those referred to or implied in any forward-looking statement. These are in addition to the risks and uncertainties discussed elsewhere in this Annual Report of Form 10-K and in the Company’s other filings with the Securities and Exchange Commission.
The current volatility in global economic conditions and the financial markets may adversely affect our industry, business and results of operations.
The volatility and disruption to the capital and credit markets since mid-2008 has rapidly impacted global economic conditions, resulting in significant recessionary pressures and declines in consumer confidence and economic growth. These conditions have led to economic contractions in the developed economies and reduced growth rates in the emerging markets. Despite fiscal and monetary intervention, it is possible that further declines in consumer spending and global growth rates may occur in the foreseeable future. Reduced consumer spending may cause changes in customer order patterns including order cancellations, and changes in the level of inventory at our customers, which may adversely affect our industry, business and results of operations. The impact of the credit crisis and economic slowdown will vary by region and country. The diversity of our geographic customer and operating footprint limits our reliance and exposure to any single economy.
7
Table of Contents
These conditions have also resulted in a substantial tightening of the credit markets, including lending by financial institutions and in the commercial paper market, both of which are sources of credit for our borrowing and liquidity. This tightening of the credit markets has increased the cost of capital and reduced the availability of credit. Based on our latest discussions, we believe that the financial institutions syndicated under our revolving credit facility are able to fulfill their commitments as of our filing date. It is difficult to predict how long the current economic and capital and credit market conditions will continue, whether they will continue to deteriorate and which aspects of our products or business could be adversely affected. However, if current levels of economic and capital and credit market disruption and volatility continue or worsen, there can be no assurance that we will not experience an adverse impact, which may be material, on our business, the cost of and access to capital and credit markets, and our results of operations. In addition, we monitor the financial condition of our customers on a regular basis based on public information or data provided directly to us. If the financial condition of one of our major customers was negatively impacted by market conditions or liquidity, we could be adversely impacted in terms of accounts receivable and/or inventory specifically attributable to them.
Failure to maintain the integrity of our raw materials, supply chain and finished goods may adversely impact sales and our results of operations, IFF’s reputation and litigation costs.
The manufacture and sale of our products are subject to various regulatory requirements in each of the countries in which our products are manufactured and sold. In addition, we are subject to product safety and compliance requirements established by the industry or similar oversight bodies. We use a variety of strategies, methodologies and tools to identify current products standards, assess relative risks in our supply chain that can impact product integrity, monitor internal and external performance and test raw materials and finished goods to minimize the likelihood of product non-compliance.
If a non-compliance event went undetected, we could be subject to customer claims, penalties, litigation costs and/or settlements, remediation costs or loss of sales. These consequences would be exacerbated if our customer did not identify the defect and there was a resulting impact at the consumer level. This could lead to potentially large scale adverse publicity and potential consumer litigation.
Competitive factors may negatively impact our sales and marketability.
The market for flavors and fragrances is fragmented and highly competitive. IFF competes with many companies and some of our competitors specialize in one or more of our product segments while others participate in many of the same segments. In addition, some of our competitors may have greater financial and technical resources. The discovery and development of new flavor and fragrance materials, protection of the Company’s intellectual property and development and retention of key employees are important issues in our ability to compete in our businesses. Increased competition by existing or future competitors, including aggressive price competition, could result in the need for us to reduce prices or increase spending and this could have an impact on sales and profitability.
We are subject to economic and social changes which may impact sales.
Demand for consumer products using flavors and fragrances has been stimulated and broadened by changing social habits resulting from factors such as increases in personal income, dual-earner households, teenage population, leisure time, health concerns and urbanization and by the continued growth in world population. Changes in any number of external economic factors, or changes in social or consumer preferences, could adversely impact our results of operations. Nearly 60% of our sales occur in the developed markets of North America, Western Europe and Australasia with the remainder in emerging markets. Accordingly, the impact on our operations will depend upon consumer spending on products for which we supply the flavor or fragrance in these global markets.
Results may be negatively impacted by the price, quality and availability of raw materials.
Raw materials are purchased from many sources from all over the world, including essential oils, extracts and concentrates derived from fruits, vegetables, flowers, woods and other botanicals, animal products, raw fruits
8
Table of Contents
and organic chemicals. Disruptions in the supply or quality of ingredients or rising prices for ingredients purchased could adversely impact our results of operations and profitability. Historically, we have experienced the greatest amount of volatility in natural products that represent approximately 50% of raw material purchases. Availability and pricing of these products can be impacted by crop size and quality, demand balance or alternative land use. To mitigate our sourcing risk, we maintain strategic stock levels covering multiple periods for critical items and/or time purchases to capitalize on favorable market conditions.
Results may be negatively impacted by the inability to implement our business strategy, including the achievement of anticipated cost savings, profitability or growth targets.
We are committed to those particular business strategies and market segments that have been identified as likely to drive profitable future growth and improve operations and customer service. If we are unable to successfully and timely implement these strategies, it would adversely impact our financial condition and results of operations.
Results may be negatively affected by the impact of currency fluctuation or devaluation in principal foreign markets and the effectiveness of hedging and risk management strategies.
Our operations are conducted in many countries, the results of which are reported in the local currency and then translated into U.S. dollars at applicable exchange rates. The exchange rates between these currencies and the U.S. dollar have fluctuated and may continue to do so in the future. We employ a variety of techniques to reduce the impact of exchange rate fluctuations, including sourcing strategies and a limited number of foreign currency hedging activities. However, volatility in currency exchange rates may adversely impact our reported results of operations, financial condition or liquidity.
Results may be negatively impacted by the outcome of uncertainties related to litigation.
We are involved in a number of legal claims. While we believe that related insurance coverage is adequate with respect to such claims, we cannot predict the ultimate outcome of such litigation. In addition, we cannot provide assurance that future events will not result in an increase in the number of claims or require an increase in the amount accrued for any such claims, or require accrual for one or more claims that has not been previously accrued.
Results and cash flows may be negatively impacted by future pension funding and other postretirement obligations.
We establish assumptions concerning discount rates and actuarial assumptions regarding pension funding and other postretirement benefit obligations based on current market conditions, plan participants, asset returns, interest rates and other factors. Changes in pension and other postretirement benefits, plan assets, and associated expenses may occur in the future due to changes in capital markets, employee demographics and actuarial assumptions. These changes may adversely impact our financial condition, results of operations or liquidity.
Results may be negatively impacted by the effect of legal and regulatory requirements, as well as restrictions imposed on operations by foreign and domestic governmental entities.
The manufacture and sale of our products are subject to regulation in the United States by the Food and Drug Administration, the Department of Agriculture, the Bureau of Alcohol, Tobacco and Firearms, the Environmental Protection Agency, the Occupational Safety and Health Administration, the Drug Enforcement Administration and state authorities. In addition, we are subject to product safety and compliance requirements established by the industry or similar oversight bodies. Our foreign operations are subject to similar substantial governmental regulation and oversight standards in a number of countries, including extensive requirements within the European Union. Costs or investments necessary to maintain compliance with existing or future governmental regulations may adversely impact our financial condition, results of operations or liquidity.
9
Table of Contents
We may face risks associated with events which may affect the world economy.
World events such as terrorist attacks, or regional conflicts have and may in the future weaken world economies. Any resulting weaknesses in these economies may adversely affect our business or the businesses of our customers, with a resultant negative impact on our financial condition, results of operations or liquidity.
Our success depends on attracting and retaining talented people within our business. Any shortfall in recruitment or retention could adversely affect our ability to compete and achieve our strategic goals.
Attracting, developing, and retaining talented employees is essential to the successful delivery of our products and success in the marketplace. However, we cannot be certain that we will be able to attract and retain such employees in the future. Any shortfalls in recruitment or retention could adversely affect our ability to operate successfully, grow our business, and effectively compete with our competitors.
| ITEM 1B. | UNRESOLVED STAFF COMMENTS. |
None.
| ITEM 2. | PROPERTIES. |
Our principal properties are as follows:
| Location |
Operation | |
| United States |
||
| Augusta, GA |
Production of fragrance ingredients. | |
| Carrollton, TX(1) |
Production of flavor compounds; flavor laboratories. | |
| Hazlet, NJ(1) |
Production of fragrance compounds; fragrance laboratories. | |
| Jacksonville, FL |
Production of fragrance ingredients. | |
| New York, NY(1) |
Fragrance laboratories. | |
| South Brunswick, NJ(1) |
Production of flavor compounds and ingredients; flavor laboratories. | |
| Union Beach, NJ |
Research and development center. | |
| France |
||
| Neuilly(1) |
Fragrance laboratories. | |
| Grasse |
Production of flavor and fragrance ingredients; fragrance laboratories. | |
| Great Britain |
||
| Haverhill |
Production of flavor compounds and ingredients, and fragrance ingredients; flavor laboratories. | |
| Ireland |
||
| Drogheda |
Production of fragrance compounds. | |
| Netherlands |
||
| Hilversum |
Flavor and fragrance laboratories. | |
| Tilburg |
Production of flavor compounds and ingredients, and fragrance compounds. | |
| Spain |
||
| Benicarlo |
Production of fragrance ingredients. | |
| Argentina |
||
| Garin |
Production of flavor compounds and ingredients, and fragrance compounds; flavor laboratories. | |
10
Table of Contents
| Location |
Operation | |
| Brazil |
||
| Rio de Janeiro |
Production of fragrance compounds. | |
| São Paulo |
Flavor and fragrance laboratories. | |
| Taubate |
Production of flavor compounds and ingredients. | |
| Mexico |
||
| Tlalnepantla |
Production of flavor and fragrance compounds; flavor and fragrance laboratories. | |
| India |
||
| Chennai(2) |
Production of flavor compounds and ingredients, and fragrance compounds; flavor laboratories. | |
| Australia |
||
| Dandenong |
Production of flavor compounds and flavor ingredients. | |
| China |
||
| Guangzhou(4) |
Production of flavor and fragrance compounds. | |
| Shanghai(6) |
Flavor and fragrance laboratories. | |
| Xin’anjiang(5) |
Production of fragrance ingredients. | |
| Zhejiang(4) |
Production of fragrance ingredients. | |
| Indonesia |
||
| Jakarta(3) |
Production of flavor compounds and ingredients, and fragrance compounds and ingredients; flavor and fragrance laboratories. | |
| Japan |
||
| Gotemba |
Production of flavor compounds. | |
| Tokyo |
Flavor and fragrance laboratories. | |
| Singapore |
||
| Jurong(6) |
Production of flavor and fragrance compounds. | |
| Science Park(1) |
Flavor and fragrance laboratories. | |
| (1) | Leased. |
| (2) | We have a 93.4% interest in the subsidiary company that owns this facility. |
| (3) | Land is leased and building is partially leased and partially owned. |
| (4) | Land is leased and building and machinery and equipment are owned. |
| (5) | We have a 90% interest in the subsidiary company that leases the land and owns the buildings and machinery. |
| (6) | Building is leased and machinery and equipment are owned. |
Our principal executive offices and New York laboratory facilities are located at 521 West 57th Street, New York City.
| ITEM 3. | LEGAL PROCEEDINGS. |
We are subject to various claims and legal actions in the ordinary course of our business. For purposes of reporting these actions, Bush Boake Allen, Inc. (“BBA”), a wholly-owned subsidiary of IFF, and/or IFF are referred to as the “Company”.
In September 2001, the Company was named as a defendant in a purported class action brought against it in the Circuit Court of Jasper County, Missouri, on behalf of employees of a plant owned and operated by Gilster-Mary Lee Corp. in Jasper, Missouri (“Benavides case”). The plaintiffs alleged that they sustained respiratory injuries in the workplace due to the use by Gilster-Mary Lee of a BBA and/or IFF flavor.
11
Table of Contents
In January 2004, the Court ruled that class action status was not warranted. As a result of this decision, each of the 47 plaintiff cases was to be tried separately. Subsequently, 8 cases were tried to a verdict, 4 verdicts resulted for the plaintiffs and 4 verdicts resulted for the Company, all of which were appealed by the losing party. Subsequently all plaintiff cases related to the Benavides case, including those on appeal, were settled.
Seventeen actions based on similar claims of alleged respiratory illness due to workplace exposure to flavor ingredients are currently pending against the Company and other flavor suppliers and related companies.
In July 2004, the Company and another flavor supplier were named defendants, and subsequently 10 third and fourth party defendants were added, in a lawsuit by 4 former workers (and 2 spouses for loss of consortium) at a Ridgeway, Illinois factory in an action brought in the Circuit Court for the Second Judicial Circuit, Gallatin County, Illinois (Batteese case). In August 2005, the Company and 22 other companies were named defendants in a lawsuit by 2 former employees of the Gilster-Mary Lee facility in McBride, Missouri in the Missouri Circuit Court, 32nd Judicial Circuit (Fults case). In August 2006, the Company and 3 other flavor and chemical suppliers were named defendants in a lawsuit by 16 current and former employees of the Gilster-Mary Lee facility in Jasper, Missouri in the Missouri Circuit Court of Jasper County (Arles case) and 2 other current and former employees in the same Court (Bowan case).
In January 2007, the Company and another flavor supplier were named defendants in a lawsuit in Hamilton County, Ohio Court of Common Pleas by 83 current and former employees (plus 35 spousal loss of consortium claims) of two separate Marion, Ohio factories (Aldrich case). Three plaintiff cases were settled by confidential agreement in June 2009. In June 2007, the Company and another flavor supplier were named defendants in a lawsuit filed in Hamilton County, Ohio Court of Common Pleas by 18 current and former employees (plus 5 spousal loss of consortium claims) of a Marion, Ohio facility (Arnold case). In July 2007, the Company and another flavor manufacturer were named defendants in a lawsuit filed in Hamilton County, Ohio Court of Common Pleas by 43 current and former workers (plus 15 spousal loss of consortium claims) of two Marion, Ohio facilities (Adamson case). In July 2007, the Company was joined as a defendant in a case filed in June 2005 against 5 companies and a trade association in the 8th Judicial District Court of Montana by the widow of the former owner/operator of a popcorn business in Montana (Yatsko case).
In March 2008, the Company and another flavor supplier were named defendants in two lawsuits in the Hamilton County, Ohio Court of Common Pleas, one by 9 current and former employees and the spouses of two such employees of a popcorn plant in Marion, Ohio (Ferguson case) and the other by 10 current and former employees and 3 spouses of such employees of the same plant (Brown case). In May 2008, the Company and 6 other companies were named defendants in a lawsuit in the District Court of Colorado by a consumer of microwave popcorn and his spouse (Watson case). In August 2008, the Company and 7 other flavor and material suppliers were named defendants in a lawsuit by 9 plaintiffs (plus 8 loss of consortium claims) in the Hamilton County Court of Common Pleas (Auld case). In September 2008, the Company, three other flavor companies and three other companies were named defendants in a lawsuit in the U.S. District Court for the Eastern District of Washington by a consumer of microwave popcorn and his spouse (Newkirk case). The Company was dismissed from this case in October 2009. In September 2008, the Company, another flavor manufacturer and 2 chemical suppliers were named defendants in a lawsuit by 1 plaintiff in the Missouri Circuit Court of Jasper County (Meredith case). The Company was dismissed from this case in October 2009. In October 2008, the Company, 2 other flavor compounders, 2 chemical companies, a microwave popcorn manufacturer and a distributor were named defendants in a lawsuit by a consumer of microwave popcorn and her spouse in the Circuit Court of Jackson County, Missouri (Khouri case). The Company was dismissed from this case in October 2009.
In September 2009, the Company, another flavor supplier and an employer were named as defendants in a lawsuit by the child of a worker at a Ridgeway, Illinois factory in an action brought in the Circuit Court of Cook County, Illinois (Patton case). In September 2009, the Company and another flavor supplier were named as defendants in a lawsuit by two workers and one spouse (Gerfen case) and by another worker (Bradshaw case) at a Marion, Ohio microwave popcorn plant in actions filed in the Court of Common Pleas, Hamilton County, Ohio.
12
Table of Contents
In October 2009, the Company and another flavor supplier were named as defendants in a lawsuit by a worker at a Marion, Ohio microwave popcorn plant in an action filed in the Court of Common Pleas, Hamilton County, Ohio (Criswell case). In December 2009, the Company, 5 other flavor manufacturers and 5 microwave popcorn manufacturers and distributors were named defendants in a lawsuit in the U.S. District Court for the Northern District of Iowa by a consumer of microwave popcorn and her husband (Daughetee case).
The Company believes that all IFF and BBA flavors at issue in these matters meet the requirements of the U.S. Food and Drug Administration and are safe for handling and use by workers in food manufacturing plants when used according to specified safety procedures. These procedures are detailed in instructions that IFF and BBA provided to all their customers for the safe handling and use of their flavors. It is the responsibility of IFF’s customers to ensure that these instructions, which include the use of appropriate engineering controls, such as adequate ventilation, proper handling procedures and respiratory protection for workers, are followed in the workplace.
At each balance sheet date, or more frequently as conditions warrant, the Company reviews the status of each pending claim, as well as its insurance coverage for such claims with due consideration given to potentially applicable deductibles, retentions and reservation of rights under its insurance policies, and the advice of its outside legal counsel and a third party expert in modeling insurance deductible amounts with respect to all of these matters. While the ultimate outcome of any litigation cannot be predicted, management believes that adequate provision has been made with respect to all known claims. Based on information presently available and in light of the merits of its defenses and the availability of insurance, the Company does not expect the outcome of the above cases, singly or in the aggregate, to have a material adverse effect on the Company’s financial condition, results of operation or liquidity. There can be no assurance that future events will not require the Company to increase the amount it has accrued for any matter or accrue for a matter that has not been previously accrued. See Note 16 of the Notes to the Consolidated Financial Statements.
Over the past 20 years, various federal and state authorities and private parties have claimed that the Company is a Potentially Responsible Party (“PRP”) as a generator of waste materials for alleged pollution at a number of waste sites operated by third parties located principally in New Jersey and have sought to recover costs incurred and to be incurred to clean up the sites.
The Company has been identified as a PRP at ten facilities operated by third parties at which investigation and/or remediation activities may be ongoing. The Company analyzes its liability on a regular basis. The Company accrues for environmental liabilities when they are probable and estimable. The Company estimates its share of the total future cost for these sites to be less than $5 million.
While joint and several liability is authorized under federal and state environmental laws, the Company believes the amounts it has paid and anticipates paying in the future for clean-up costs and damages at all sites are not and will not be material to the Company’s financial condition, results of operations or liquidity. This conclusion is based upon, among other things, the involvement of other PRPs at most sites, the status of proceedings, including various settlement agreements and consent decrees, the extended time period over which payments will likely be made and an agreement reached in July 1994 with three of the Company’s liability insurers pursuant to which defense costs and indemnity amounts payable by the Company in respect of the sites will be shared by the insurers up to an agreed amount.
| ITEM 4. | SUBMISSION OF MATTERS TO A VOTE OF SECURITY HOLDERS. |
None.
13
Table of Contents
PART II
| ITEM 5. | MARKET FOR REGISTRANT’S COMMON EQUITY, RELATED STOCKHOLDER MATTERS AND ISSUER PURCHASES OF EQUITY SECURITIES. |
Market Information.
Our common stock is traded principally on the New York Stock Exchange. The high and low stock prices for each quarter during the last two years were:
| 2009 | 2008 | |||||||||||
| Quarter |
High | Low | High | Low | ||||||||
| First |
$ | 32.35 | $ | 25.30 | $ | 47.20 | $ | 39.48 | ||||
| Second |
33.51 | 29.84 | 46.44 | 39.06 | ||||||||
| Third |
39.15 | 31.21 | 44.47 | 38.27 | ||||||||
| Fourth |
41.85 | 36.85 | 39.33 | 24.90 | ||||||||
Approximate Number of Equity Security Holders.
| (A) Title of Class |
(B) Number of shareholders of record as of February 12, 2010 | |
| Common stock, par value 12 1/2¢ per share | 3,004 |
Dividends.
Cash dividends declared per share for each quarter during the two most recent fiscal years were as follows:
| Quarter |
2009 | 2008 | ||||
| First |
$ | 0.25 | $ | 0.23 | ||
| Second |
0.25 | 0.23 | ||||
| Third |
0.25 | 0.25 | ||||
| Fourth |
0.25 | 0.25 | ||||
Performance Graph.
Total Return To Shareholders(1)
(Includes reinvestment of dividends)
| Annual Return Percentage Years Ending | ||||||||||
| Company Name / Index |
2005 | 2006 | 2007 | 2008 | 2009 | |||||
| International Flavors & Fragrances |
-20.21 | 49.64 | -0.36 | -36.64 | 42.43 | |||||
| S&P 500 Index |
4.91 | 15.79 | 5.49 | -37.00 | 26.46 | |||||
| Peer Group |
4.58 | 18.66 | 22.37 | -16.32 | 18.05 | |||||
| Indexed Returns Years Ending | ||||||||||||||||||
| Company Name / Index |
Base Period 2004 |
2005 | 2006 | 2007 | 2008 | 2009 | ||||||||||||
| International Flavors & Fragrances |
$ | 100 | $ | 79.79 | $ | 119.40 | $ | 118.97 | $ | 75.38 | $ | 107.36 | ||||||
| S&P 500 Index |
100 | 104.91 | 121.48 | 128.16 | 80.74 | 102.11 | ||||||||||||
| Peer Group |
100 | 104.58 | 124.09 | 151.85 | 127.07 | 150.00 | ||||||||||||
14
Table of Contents
| Peer Group Companies(2) |
||||
| Alberto Culver Company | Hormel Foods Corp. | Unilever NV | ||
| Avon Products | Kellogg Co. | YUM Brands, Inc. | ||
| Campbell Soup Co. | Estee Lauder Companies, Inc. | |||
| Church & Dwight Inc. | McCormick & Company, Inc. | |||
| Clorox Company | McDonald’s Corp. | |||
| Coca-Cola Company | Nestle SA | |||
| Colgate-Palmolive Co. | Pepsico Inc. | |||
| ConAgra Foods, Inc. | Procter & Gamble Co. | |||
| General Mills Inc. | Revlon Inc. | |||
| H.J. Heinz Co. | Sara Lee Corp. | |||
| Hershey Company | Sensient Technologies Corp. |
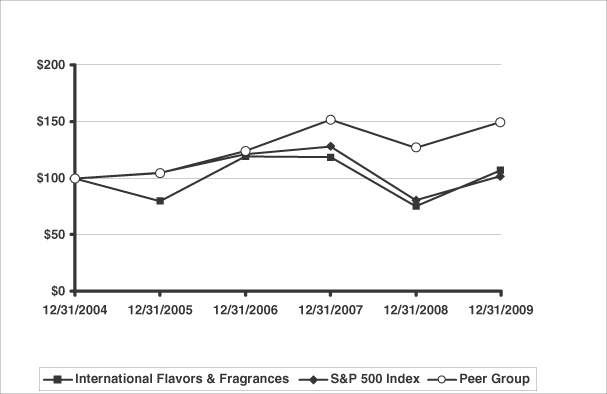
| (1) | The Cumulative Shareholder Return assumes that the value of an investment in our Common Stock and each index was $100 on December 31, 2004, and that all dividends were reinvested. |
| (2) | Due to the international scope and breadth of our business, we believe that a Peer Group comprised of international public companies, which are representative of the customer group to which we sell our products, is the most appropriate group against which to compare shareholder returns. Wm. Wrigley Jr. Company has been eliminated from the Peer Group for all years presented above due to its acquisition by Mars, Incorporated in October 2008. |
15
Table of Contents
Issuer Purchases of Equity Securities.
The following table presents the total number of shares purchased during the fourth quarter of 2009, the average price paid per share, the number of shares that were purchased as part of a publicly announced repurchase program, and the maximum number of shares that may yet be purchased under the program for the quarter ended December 31, 2009.
| Total Number of Shares Purchased(1) |
Average Price Paid per Share |
Total Number of Shares Purchased as Part of Publicly Announced Program(1) |
Maximum Number of Shares That May Yet Be Purchased Under the Program(1) | |||||
| October 1 – 31, 2009 |
— | — | — | 1,949,065 | ||||
| November 1 – 30, 2009 |
— | — | — | 1,949,065 | ||||
| December 1 – 31, 2009 |
— | — | — | 1,949,065 | ||||
| Total shares purchased |
— | — | — |
| (1) | In July 2007 our Board of Directors authorized a stock repurchase plan (the “2007 Share Repurchase Plan”) to repurchase up to 15% (which represents an aggregate 13,350,000 shares) or $750 million worth of our outstanding common stock, whichever is less. As of December 31, 2009, we are subject to the 15% limitation and as such, we still have the ability to repurchase approximately 2 million shares. There is no stated expiration for the July 2007 share repurchase program. |
16
Table of Contents
| ITEM 6. | SELECTED FINANCIAL DATA. |
INTERNATIONAL FLAVORS & FRAGRANCES INC.
QUARTERLY FINANCIAL DATA (UNAUDITED)
(DOLLARS IN THOUSANDS EXCEPT PER SHARE AMOUNTS)
The following selected consolidated financial data is derived from our Consolidated Financial Statements. This data should be read in conjunction with the Consolidated Financial Statements and Notes thereto, and with Item 7, Management’s Discussion and Analysis of Financial Condition and Results of Operations.
| Net Income Per Share(b) | ||||||||||||||||||||||||||||||
| Net Sales | Gross Profit | Net Income(a) | Basic | Diluted | ||||||||||||||||||||||||||
| Quarter |
2009 | 2008 | 2009 | 2008 | 2009 | 2008 | 2009 | 2008 | 2009 | 2008 | ||||||||||||||||||||
| First |
$ | 559,630 | $ | 596,605 | $ | 222,200 | $ | 245,482 | $ | 47,197 | $ | 55,948 | $ | 0.60 | $ | 0.69 | $ | 0.60 | $ | 0.69 | ||||||||||
| Second |
568,261 | 636,126 | 228,097 | 263,781 | 48,083 | 67,032 | 0.61 | 0.84 | 0.60 | 0.83 | ||||||||||||||||||||
| Third |
612,634 | 617,538 | 248,969 | 246,739 | 52,800 | 57,684 | 0.67 | 0.73 | 0.66 | 0.73 | ||||||||||||||||||||
| Fourth |
585,633 | 539,103 | 235,860 | 214,632 | 47,446 | 48,964 | 0.60 | 0.62 | 0.59 | 0.62 | ||||||||||||||||||||
| $ | 2,326,158 | $ | 2,389,372 | $ | 935,126 | $ | 970,634 | $ | 195,526 | $ | 229,628 | $ | 2.48 | $ | 2.89 | $ | 2.46 | $ | 2.86 | |||||||||||
| (a) | Net Income Q2-2009 included $2,685 related to restructuring costs driven by weak economic conditions impacting our Fragrance business and $680 pertaining to employee separation costs. Q3-2009 includes $9,186 of restructuring related costs associated with facility rationalizations within our European Fragrance business. Q3-2009 also includes $3,348 of costs associated with the change in our Chief Executive Officer. Q4-2009 includes $2,892 of additional costs associated with the ongoing reorganization of our European businesses and $4 million of expense related to out-of-period tax adjustments. |
Net Income in the 2008 first and fourth quarters included $4,555 and $8,082 of restructuring costs; the first quarter also included a benefit of $1,612 from insurance recovery related to a 2005 product contamination matter; Net Income in the second, third and fourth quarters of 2008 included $2,217, $1,374 and $211, respectively, of employee separation and implementation costs. Net Income in the 2008 first, second and fourth quarters also include tax benefits of $2,106, $3,897 and $17,067.
| (b) | The sum of the 2009 and 2008 quarters’ Net Income per share does not equal the earnings per share for the full year due to changes in average shares outstanding. |
17
Table of Contents
INTERNATIONAL FLAVORS & FRAGRANCES INC.
FIVE-YEAR SUMMARY
(DOLLARS IN THOUSANDS EXCEPT PER SHARE AMOUNTS)
| 2009 | 2008 | 2007 | 2006 | 2005 | |||||||||||||||
| Consolidated Statement of Income Data |
|||||||||||||||||||
| Net sales |
$ | 2,326,158 | $ | 2,389,372 | $ | 2,276,638 | $ | 2,095,390 | $ | 1,993,393 | |||||||||
| Cost of goods sold(b) |
1,391,032 | 1,418,738 | 1,324,424 | 1,211,259 | 1,168,992 | ||||||||||||||
| Research and development expenses(b)(g) |
193,843 | 209,295 | 196,893 | 183,512 | 179,812 | ||||||||||||||
| Selling and administrative expenses(b) |
376,541 | 381,841 | 375,287 | 351,923 | 339,323 | ||||||||||||||
| Amortization of intangibles |
6,153 | 6,153 | 12,878 | 14,843 | 15,071 | ||||||||||||||
| Curtailment loss |
— | — | 5,943 | — | — | ||||||||||||||
| Restructuring and other charges, net(a) |
18,301 | 18,212 | — | 2,680 | 23,319 | ||||||||||||||
| Interest expense |
61,818 | 74,008 | 41,535 | 25,549 | 23,956 | ||||||||||||||
| Other (income) expense, net |
1,921 | (2,797 | ) | (11,136 | ) | (9,838 | ) | (3,268 | ) | ||||||||||
| 2,049,609 | 2,105,450 | 1,945,824 | 1,779,928 | 1,747,205 | |||||||||||||||
| Income before taxes |
276,549 | 283,922 | 330,814 | 315,462 | 246,188 | ||||||||||||||
| Taxes on income(g) |
81,023 | 54,294 | 83,686 | 88,962 | 53,122 | ||||||||||||||
| Net income |
$ | 195,526 | $ | 229,628 | $ | 247,128 | $ | 226,500 | $ | 193,066 | |||||||||
| Percentage of net sales |
8.4 | 9.6 | 10.9 | 10.8 | 9.7 | ||||||||||||||
| Percentage of average shareholders’ equity |
28.9 | 38.0 | 32.0 | 24.6 | 20.9 | ||||||||||||||
| Net income per share — basic |
$ | 2.48 | $ | 2.89 | $ | 2.84 | $ | 2.50 | $ | 2.06 | |||||||||
| Net income per share — diluted |
$ | 2.46 | $ | 2.86 | $ | 2.81 | $ | 2.48 | $ | 2.04 | |||||||||
| Average number of shares (thousands) |
78,403 | 79,032 | 86,541 | 90,443 | 93,584 | ||||||||||||||
| Consolidated Balance Sheet Data |
|||||||||||||||||||
| Cash and cash equivalents |
$ | 80,135 | $ | 178,467 | $ | 151,471 | $ | 114,508 | $ | 272,545 | |||||||||
| Receivables, net |
444,265 | 400,971 | 400,527 | 357,155 | 304,823 | ||||||||||||||
| Inventories |
444,977 | 479,567 | 484,222 | 446,606 | 430,794 | ||||||||||||||
| Property, plant and equipment, net |
501,293 | 496,856 | 508,820 | 495,124 | 499,145 | ||||||||||||||
| Goodwill and intangible assets, net |
720,530 | 726,683 | 732,836 | 745,716 | 772,651 | ||||||||||||||
| Total assets(d) |
2,644,774 | 2,749,913 | 2,726,314 | 2,478,904 | 2,638,196 | ||||||||||||||
| Bank borrowings, overdrafts and current portion of long-term debt |
76,780 | 101,982 | 152,473 | 15,897 | 819,392 | ||||||||||||||
| Long-term debt |
934,749 | 1,153,672 | 1,060,168 | 791,443 | 131,281 | ||||||||||||||
| Total Shareholders’ equity(b) (c) (d) (f) |
771,910 | 580,642 | 626,359 | 916,056 | 925,808 | ||||||||||||||
| Other Data |
|||||||||||||||||||
| Current ratio(e) |
2.3 | 2.6 | 2.1 | 2.4 | 1.0 | ||||||||||||||
| Gross additions to property, plant and equipment |
$ | 66,819 | $ | 85,395 | $ | 65,614 | $ | 58,282 | $ | 93,433 | |||||||||
| Depreciation and amortization expense |
78,525 | 75,986 | 82,788 | 89,733 | 91,928 | ||||||||||||||
| Cash dividends declared |
78,962 | 75,902 | 76,465 | 68,956 | 68,397 | ||||||||||||||
| per share |
$ | 1.00 | $ | 0.96 | $ | 0.88 | $ | 0.765 | $ | 0.73 | |||||||||
| Number of shareholders of record at year-end |
3,004 | 3,167 | 3,248 | 3,393 | 3,207 | ||||||||||||||
| Number of employees at year-end |
5,377 | 5,338 | 5,315 | 5,087 | 5,160 | ||||||||||||||
| (a) | Restructuring and other charges ($14,763 after tax) in 2009, ($12,583 after tax) in 2008, ($1,982 after tax) in 2006, and ($15,857 after tax) in 2005, were the result of various restructuring and reorganization programs of the Company. |
| (b) | 2006 — 2009 amounts include equity compensation expense in accordance with ASC 718 “Compensation — Stock Compensation”. See Note 11 to the Consolidated Financial Statements for additional details. |
| (c) | The 2006 amounts reflect adoption of ASC 715 “Compensation — Retirement Benefits”. See Note 13 to the Consolidated Financial Statements for additional details. |
| (d) | The 2007 amounts reflect adoption of ASC 740 “Income Taxes”. See Note 9 to the Consolidated Financial Statements for additional details. |
| (e) | Current ratio is equal to current assets divided by current liabilities. |
| (f) | Includes noncontrolling interests for all periods presented. See Note 1 to the Consolidated Financial Statements for additional details. |
| (g) | The 2005 — 2008 periods have been revised to properly recognize R&D expense, net of R&D credits. Previously, these credits were reflected as a reduction of tax expense. |
18
Table of Contents
| ITEM 7. | MANAGEMENT’S DISCUSSION AND ANALYSIS OF FINANCIAL CONDITION AND RESULTS OF OPERATIONS. |
(UNLESS INDICATED OTHERWISE, DOLLARS IN MILLIONS EXCEPT PER SHARE AMOUNTS)
Organization of Information
Management’s Discussion and Analysis provides a narrative on our operating performance, financial condition and liquidity and should be read in conjunction with the accompanying financial statements. It includes the following sections:
| Ÿ | Executive Overview |
| Ÿ | Sales Commentary |
| Ÿ | Consolidated Operating Results |
| Ÿ | Goodwill and Intangible Assets |
| Ÿ | Restructuring and Other Charges |
| Ÿ | Income Taxes |
| Ÿ | Postretirement Benefits |
| Ÿ | Financial Condition |
| Ÿ | Critical Accounting Policies and Use of Estimates |
| Ÿ | New Accounting Standards |
| Ÿ | Non-GAAP Financial Measures |
| Ÿ | Cautionary Statement Under The Private Securities Litigation Reform Act of 1995 |
Executive Overview
We are a leading creator and manufacturer of flavor and fragrance compounds used to impart or improve the flavor or fragrance in a wide variety of consumer products. The precise size of the global market for flavors and fragrances is difficult to determine because the industry is highly fragmented, both geographically and along product lines; there are a limited number of publicly traded companies in the industry; certain customers maintain in-house capabilities fulfilling a portion of their flavor or fragrance needs; and the quality and depth of market information in developing regions of the world is limited. Analysts generally estimate the global market to be $15 billion of which IFF represents 16%; the largest competitor in the industry has approximately a 25% market share. IFF is one of the top four companies, which together represent approximately 70% of the flavors and fragrances industry.
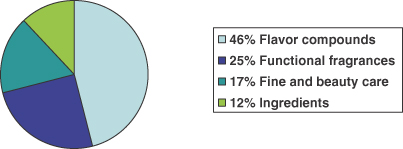
IFF is organized into two units that reflect our flavor and fragrance businesses. Approximately 46% of our 2009 net sales were flavor compounds. Flavor compounds are sold to the food and beverage industries for use in consumer products such as prepared foods, beverages, dairy, food and confectionery products. The remaining 54% of sales, representing the fragrance business unit, were in three fragrance categories: functional fragrances, including fragrance compounds for personal care (e.g., soaps) and household products (e.g., detergents and cleaning agents); fine fragrance and beauty care, including perfumes, colognes and toiletries; and ingredients, consisting of natural and synthetic ingredients that can be combined with other materials to create unique functional and fine fragrance compounds. Major fragrance customers include the cosmetics industry, including perfume and toiletries manufacturers, and the household products industry, including manufacturers of soaps, detergents, fabric care, household cleaners and air fresheners. Approximately 55% of our ingredient production is consumed internally; the balance is sold to third party customers.
The under-pinning of structural growth for the flavor and fragrance industry are population growth, an expanding middle class and technology. Changing social habits resulting from such factors as increases in
19
Table of Contents
personal income, leisure time, health and wellness and urbanization stimulate demand for consumer products utilizing flavors and fragrances. These developments also drive the creation and development of new molecules, technologies and/or solutions that facilitate and improve the end-use consumption of flavors and fragrances in consumer products.
Flavors and fragrances are generally:
| Ÿ | created for the exclusive use by a specific customer; |
| Ÿ | sold in powder or liquid form, in amounts ranging from a few pounds to several tons depending on the nature of the end product in which they are used; |
| Ÿ | a small percentage of the volume and cost of the end product sold to the consumer; and |
| Ÿ | a major factor in consumer selection and acceptance of the product. |
The flavors and fragrances industry is impacted by macroeconomic factors in all product categories and geographic regions. Such factors include the impact of currency on the price of raw materials and operating costs as well as on translation of reported results. In addition, IFF is susceptible to margin pressures due to customers’ cost improvement programs and input cost increases. However, these pressures can often be mitigated through a combination of product reformulation, sourcing strategies and material substitution plus internal cost containment efforts, and the development of innovative and streamlined solutions and processes.
We produce more than 33,000 unique compounds, of which approximately 60% are flavors and 40% fragrances. We continually create new compounds to meet the changing characteristics and needs of our customers’ end products. No single compound represents more than 2% of net sales. Development of flavors and fragrances is a complex artistic and technical process calling upon the combined knowledge and talents of creative perfumers and flavorists, and application and research chemists. An important element of creation is the development of new ingredients. We bear essentially all costs incurred in connection with the creation and development of new flavors and fragrances and such formulae are generally protected under trade secrecy. We are not materially dependent on any patents, trademarks or licenses.
IFF’s success in the flavors and fragrances industry is driven by our ability to create unique sensory experiences that meet evolving consumer needs and expectations. These solutions are delivered in a cost-efficient manner in conjunction with world-class customer service.
STRATEGIC DRIVERS
To increase shareholder value, we pursue and develop a value-creation model that encompasses three main elements: investing in research & development to identify and commercialize new, innovative materials and delivery systems; maintaining a deep understanding of both consumer preferences and consumer product brands; and excellence in our creative capabilities. Our goal is to deliver differentiated solutions that enable our customers’ brands to win in the marketplace.
In order to pursue these strategies, our organization is focused on ensuring that we efficiently create, produce, and sell unique, superior, and economically competitive products through our world class integration of research and development, consumer insight, creativity, via excellence in execution. We believe we are well positioned to achieve success by targeting strategically important global and regional customers in both developed and emerging markets; attracting, developing and retaining top talent; investing in research and development; and fostering a culture of innovation, accountability and continuous improvement.
CHANGE IN MANAGEMENT
Effective September 30, 2009, Robert Amen resigned as Chairman of the Board of Directors (“Chairman”) and Chief Executive Officer (“CEO”) of the Company. Douglas D. Tough, currently a Company Board member,
20
Table of Contents
assumed the position of non-executive Chairman effective October 1, 2009 and will assume the position of executive Chairman and CEO on March 1, 2010. Pending Mr. Tough’s assumption of his title and duties as CEO, beginning October 1, 2009 the Company established a temporary Office of the CEO, which is comprised of three current Company executives, Executive Vice President and Chief Financial Officer, Kevin Berryman; Group President, Fragrances, Nicolas Mirzayantz; and Group President, Flavors, Hernan Vaisman. Each of these executives remains in their current positions while carrying out their Office of the CEO responsibilities. The Office of the CEO reports to the Board of Directors.
Sales Commentary
A breakdown of sales by principal product category is depicted in the graph below.
2009 Sales by Category
Our five largest customers comprise 33% of consolidated sales and our top 30 customers 57%; these percentages have remained fairly constant for several years, although sales to larger customers are trending higher. We have one customer that accounts for 11% of our sales. A key factor for commercial success is inclusion on the strategic customers’ core supplier lists, opening opportunities to win new business. We are on the core supplier lists of a large majority of our strategic customers.
Net sales by business unit for 2009, 2008 and 2007 were as follows:
| Net Sales |
2009 | Percent Change |
2008 | Percent Change |
2007 | ||||||||||
| Flavors |
$ | 1,081 | -1 | % | $ | 1,092 | 9 | % | $ | 1,006 | |||||
| Fragrances |
1,245 | -4 | % | 1,297 | 2 | % | 1,271 | ||||||||
| Total net sales |
$ | 2,326 | -3 | % | $ | 2,389 | 5 | % | $ | 2,277 | |||||
2009 Sales by Destination
We manage our operations by global business units but utilize destination sales as a supplemental performance measure and indicator of underlying market trends. Although reported sales and earnings are affected by the weakening or strengthening of the U.S. dollar, this has not had a long-term effect on the underlying competitiveness of our business.
21
Table of Contents
Net sales by destination for 2009, 2008 and 2007 were as follows:
| Sales by Destination |
2009 | Percent Change |
2008 | Percent Change |
2007 | ||||||||||
| EAME(1) |
$ | 808 | -11 | % | $ | 907 | 6 | % | $ | 858 | |||||
| North America |
600 | 0 | % | 601 | -4 | % | 630 | ||||||||
| Greater Asia |
575 | 5 | % | 547 | 13 | % | 483 | ||||||||
| Latin America |
343 | 3 | % | 334 | 9 | % | 306 | ||||||||
| Total net sales, as reported |
$ | 2,326 | -3 | % | $ | 2,389 | 5 | % | $ | 2,277 | |||||
| (1) | Europe, Africa and Middle East |
2009 in Comparison to 2008
Sales for 2009 totaled $2,326 million, decreasing 3% from the prior year period of $2,389 million, as Flavor sales declined 1% and Fragrance sales decreased 4%. Foreign exchange had a 3% negative impact on reported sales during 2009 as the U.S. dollar was stronger during the first three-quarters of 2009 versus the comparable year-ago period. Market conditions improved during the second half of 2009, as global economic conditions strengthened and customer inventory levels stabilized. Local currency (LC) sales increased over 2% during both the third and fourth quarters compared to a decline of 3% during the first six months of 2009.
Flavors Business Unit
Flavor sales decreased 1% for 2009 compared to 2008 as the effects of a stronger U.S. dollar, soft demand and inventory corrections in Europe and customer specific losses in Latin America more than offset new wins, solid demand and price increases in North America and Greater Asia. Excluding the impact of currencies, sales for the Flavors business increased over 2% during 2009 compared to 2008.
Fragrances Business Unit
Fragrance sales decreased 4% for 2009 compared to 2008 reflecting double-digit LC sales declines for Fine Fragrances, as consumers reduced discretionary spending and the industry significantly reduced inventories across the supply chain. These headwinds were partially offset by solid growth and new wins in beauty care, toiletries and substantially all functional fragrance categories. Excluding the impact of currencies, sales for the Fragrances business declined 1% during 2009 compared to 2008.
Sales by Region and Category
Regional and product category sales performance for 2009 compared to 2008, in reported dollars and local currency, was as follows:
| % Change in Sales — 2009 vs 2008 | ||||||||||||||
| Fine & Beauty Care |
Functional | Ingredients | Total Frag. |
Flavors | Total | |||||||||
| North America |
Reported | -14% | 1% | 5% | -3% | 3% | 0% | |||||||
| EAME |
Reported | -24% | -3% | -11% | -13% | -7% | -11% | |||||||
| Local Currency | -18% | 2% | -6% | -8% | 0% | -5% | ||||||||
| Latin America |
Reported | 8% | 4% | -2% | 5% | 0% | 3% | |||||||
| Local Currency | 9% | 5% | -1% | 5% | 4% | 5% | ||||||||
| Greater Asia |
Reported | 17% | 14% | -1% | 12% | 1% | 5% | |||||||
| Local Currency | 20% | 16% | -3% | 13% | 4% | 7% | ||||||||
| Total |
Reported | -12% | 3% | -4% | -4% | -1% | -3% | |||||||
| Local Currency | -8% | 5% | -2% | -1% | 2% | 0% | ||||||||
22
Table of Contents
Local Currency Sales Drivers
| Ÿ | North America sales were flat as the erosion and volume declines in Fine Fragrance and Flavors compounds offset more than $40 million in new product introductions, plus modest price realization in Flavors and Functional Fragrance. Ingredient sales growth was mainly attributable to cost driven price increases. |
| Ÿ | EAME sales declines in LC were driven by de-stocking and weak underlying demand for Fine Fragrances and Ingredients that more than offset solid win performance in Functional Fragrances. Flavor sales were effectively flat as new wins in Savory and Confectionary plus pricing were offset by customer inventory reductions across most categories. |
| Ÿ | Latin America sales growth was 5% in LC led by near double-digit growth in the Fine Fragrances and Beauty Care and solid performance in the Functional Fragrances and Flavors categories. The growth was primarily driven by new product introductions of approximately $15 million combined with price increases across both businesses. |
| Ÿ | Greater Asia LC sales growth was largely driven by more than $15 million in new product introductions in Fabric and Hair Care, combined with approximately $10 million in new product introductions in Flavors which more than offset the effects of customer inventory reductions in the Ingredients category supply chain. |
2008 in Comparison to 2007
Sales totaled $2,389 million for 2008, up 5% from 2007; Flavor and Fragrance sales increased 9% and 2%, respectively. 2008 sales benefited from the generally weaker U.S. dollar and at comparable exchange rates would have increased 2% over the prior year.
Flavors Business Unit
Flavor sales increased 9% for 2008 based on new wins across all regions, particularly in the beverage category, led by a 21% increase in Latin America. Excluding the impact of currencies, sales growth for the Flavors business was 6%.
Fragrances Business Unit
Fragrance sales increased 2%. Excluding the impact of currencies, Fragrance sales declined 1% as strong growth in emerging markets was offset by weakness in the U.S. market. New product introductions of fragrance compounds were offset by volume declines primarily in the U.S. and EAME. Ingredient sales benefited from price increases, partially offset by volume declines as part of a product rationalization initiative and weaker economies in the U.S. and EAME.
Sales By Region and Category
Regional and product category sales performance for 2008 compared to the prior year, in reported dollars and local currency, was as follows:
| % Change in Sales — 2008 vs 2007 | ||||||||||||||
| Fine & Beauty Care |
Functional | Ingredients | Total Frag. |
Flavors | Total | |||||||||
| North America |
Reported | -14% | -10% | -2% | -10% | 2% | -4% | |||||||
| EAME |
Reported | 2% | 8% | 6% | 5% | 7% | 6% | |||||||
| Local Currency | -4% | 2% | -1% | -1% | 2% | 0% | ||||||||
| Latin America |
Reported | 7% | -2% | 17% | 3% | 21% | 9% | |||||||
| Local Currency | 6% | -2% | 17% | 3% | 18% | 8% | ||||||||
| Greater Asia |
Reported | 19% | 13% | 11% | 14% | 13% | 13% | |||||||
| Local Currency | 17% | 12% | 7% | 12% | 10% | 11% | ||||||||
| Total |
Reported | 0% | 3% | 5% | 2% | 9% | 5% | |||||||
| Local Currency | -4% | 0% | 1% | -1% | 6% | 2% | ||||||||
23
Table of Contents
Local Currency Sales Drivers
| Ÿ | North America flavors new product introductions of $22 million and some benefit from price increases were largely offset by volume declines. Weak economic conditions and significant slowdown in customer order activity led to volume declines in fine and functional fragrance compounds and ingredients. Fine fragrance sales were also negatively impacted by customer inventory corrections in the first half of the year. |
| Ÿ | Flavors sales in EAME were up as new product introductions of $22 million were partially offset by volume declines. Fine and functional fragrance new product introductions of $18 million and $15 million were offset by volume declines. Price increases in ingredients were offset by volume declines. |
| Ÿ | Latin America flavors sales were strong throughout the region, driven mainly by new product introductions of $19 million. Fragrance sales growth was driven by new product introductions of $10 million offset by volume decreases, primarily in functional. Ingredients sales benefited from higher volumes coupled with price increases. |
| Ÿ | Greater Asia sales growth in Flavors was driven by new product introductions of $16 million plus volume and price increases. Fragrance sales benefited from new product introductions of $25 million, partially offset by volume declines. |
Consolidated Operating Results
The percentage relationship of cost of goods sold and other operating expenses to reported sales is detailed as follows:
| 2009 | 2008 | 2007 | ||||
| Cost of goods sold |
59.8% | 59.4% | 58.2% | |||
| Research and development expenses |
8.3% | 8.8% | 8.6% | |||
| Selling and administrative expenses |
16.2% | 16.0% | 16.5% |
Cost of goods sold includes the cost of materials and manufacturing expenses; raw materials generally constitute 70% of the total. Research and development expenses are for the development of new and improved products, technical product support, compliance with governmental regulations, and help in maintaining relationships with customers who are often dependent on technological advances. Selling and administrative expenses support our sales and operating levels.
2009 in Comparison to 2008
Cost of goods sold, as a percentage of sales, was 59.8% in 2009 compared with 59.4% in 2008. This increase reflects higher input costs, a weaker sales mix principally related to Fine Fragrance and slightly lower absorption that could only be partially offset by cost recovery, and productivity and margin improvement efforts, including pricing.
Research and development (R&D) expenses were down $15.5 million in 2009 compared to the prior year, mainly due to increased foreign R&D credits of $8 million driven by program enhancements and additional qualifying expenditures. The remaining reduction was due to tight cost control on applied research and development and the effects of a stronger U.S. dollar, partially offset by higher incentive compensation. During 2008 and the first nine months of 2009, these credits were previously recognized as a reduction of tax expense.
Selling and administrative expenses (S&A), as a percentage of sales, increased to 16.2% of sales during 2009 as compared to 16.0% during 2008. The 2009 results include $6.3 million of employee separation costs and expenses related to the change in CEO whereas the 2008 amount included the benefit of a $2.6 million insurance recovery related to a prior period product liability claim offset by $3.4 million for employee separation costs. Excluding these items, S&A declined $11 million and would have been flat at 15.9% as a percentage of sales. The reduction in S&A dollars reflects a stronger U.S. currency and cost reduction efforts, which more than offset higher pension expense, higher incentive compensation expense, and provision for product claims.
24
Table of Contents
Interest Expense
During 2009, interest expense totaled $61.8 million as compared to $74.0 million in 2008. The 2009 decrease reflects a lower average borrowing cost, the elimination of a cross-currency interest rate swap during the second half of 2008 and debt repayments during 2009. The 2009 amount includes $4 million of interest paid on the close-out of a cross-currency interest rate swap classified as a net investment hedge. Average cost of debt was 5.5% for 2009 compared to 6.1% in 2008.
Other (Income) Expense, Net
Other expense during 2009 was $1.9 million compared to other income of $2.8 million in 2008. Approximately 50% of the change was mainly due to year-over-year changes in foreign exchange gains/(losses) on trade receivables and payables during the year. During 2008, the Company recognized foreign exchange gains, primarily during the fourth quarter, as a result of the rapid strengthening of the U.S. dollar (USD) during the period of financial turmoil. During 2009, we saw a general weakening trend for the USD that has resulted in a higher level of foreign exchange losses on trade receivables and payables. The remaining change was due to less favorable mark-to-market adjustments on our investments.
Income Taxes
The effective tax rate for the year 2009 was 29.3% compared to 19.1% during 2008. The 2008 period included a $23 million reduction in tax expense related primarily to prior period tax settlements versus $2 million during 2009. The 2009 results include $6 million of tax expense due to the recognition of out-of-period tax adjustments arising from periods 2006 and prior. The Company did not adjust the prior periods as it concluded that such adjustments were not material to the prior periods’ consolidated financial statements or to the current year. Excluding these items from both periods, as well as the previously discussed restructuring charges, the tax rate for 2009 was 27.4% compared to 27.5% for 2008. The change reflects $3 million of higher repatriation costs on foreign earnings offset by a net reduction of valuation allowances on certain deferred assets and the mix of earnings between high and low tax jurisdictions.
Operating Results by Business Unit
We evaluate the performance of business units based on operating profit before gains/losses on the disposition of assets, interest expense, other (income) expense, net and income taxes. See Note 12 to our Consolidated Financial Statements for the reconciliation to Income before taxes.
Flavors Business Unit
In 2009, Flavors operating profit totaled $208 million or 19.3% of sales, compared to $198 million or 18.1% of sales in 2008. The operating profit improvement reflects increased prices, ongoing cost discipline, and cost recovery and margin improvement efforts, which more than offset higher input costs and negative currency impacts. The 2008 amount included $3.5 million of restructuring expenses versus $0.6 million in 2009.
Fragrances
In 2009, Fragrance operating profit was $171 million or 13.7% of sales, compared to $202 million or 15.6% of sales in 2008. The 2008 figure has been revised to reflect R&D credits that were previously reflected as a reduction of tax expense. The 2009 amount includes $18 million of restructuring related expenses compared to $4 million in 2008. During 2009, as part of the rationalization of our European fragrance manufacturing footprint, we decided to close our Fragrance compounding facility in Ireland and partially close our ingredients plant in the United Kingdom (UK). In addition, we eliminated 60 positions to improve profitability.
The decline in profit was driven by significantly lower volumes in Fine Fragrances and Ingredients, higher input costs and unfavorable mix, partially offset by improved pricing, margin recovery efforts, lower overhead expenses, and $8 million of additional R&D credits versus the prior year. Excluding the restructuring charges, operating profit margins declined 70 basis points over the comparable prior year period.
25
Table of Contents
Global Expenses
Global expenses represent corporate and headquarters-related expenses which include legal, finance, human resources and other administrative expenses that are not allocated to an individual business unit. In 2009, Global expenses were $39 million compared to $45 million during 2008. In 2009, Global expenses included $6 million of employee separation costs associated with the change in CEO. Global expenses in 2008 included approximately $10 million of restructuring charges and $3 million of employee separation costs and $2 million of implementation costs related to our global shared service structure, partially offset by a $3 million insurance recovery related to prior period product liability claim. Excluding these items, global expenses were flat, indicative of strict cost control measures that offset inflationary pressure.
2008 in Comparison to 2007
Cost of goods sold, as a percentage of sales, was 59.4% compared with 58.2% in 2007. This increase was mainly the result of higher input costs and lower absorption of manufacturing expenses, most notably in North America fragrance compounds. These factors were partially offset by internal efficiencies, reformulation and material substitution efforts. Product mix, notably lower sales of fine and beauty care compounds, also impacted cost of goods sold as a percentage of sales.
Research and development expense, as a percentage of sales, was 8.8%. This increase over the prior year period reflects increasing investments in customer applications and basic research.
Selling and administrative expenses, as a percentage of sales, was 16.0% in the current period compared to 16.5% in the prior year period. The 2008 results included the benefit of a $3 million insurance recovery related to a 2005 product contamination matter offset by $3 million of employee separation costs. The 2007 results included $4 million of business transformation costs that enabled us to better leverage our global SAP software platforms. The decline in selling and administrative expenses, as a percentage of sales, is mainly attributable to lower incentive compensation. This was partially offset by $2 million related to the implementation of our global shared service structure.
Interest Expense
Interest expense totaled $74 million compared to $42 million in 2007, due to higher borrowings incurred in connection with the 2007 share repurchase activities as well as a wider spread between the LIBOR (London InterBank Offer Rate) and EURIBOR (European InterBank Offer Rate) interest rates applicable to our interest rate swaps. Average cost of debt was 6.1% for 2008 compared to 4.5% in 2007.
Other (Income) Expense, Net
Other income was $3 million in 2008 as compared to $11 million in 2007. Other income in 2007 included $11 million related to gains on asset sales.
Income Taxes
The effective tax rate was 19.1% in 2008 as compared to a rate of 25.3% in the prior year. The lower tax rate in 2008 primarily reflects the benefit of $23 million in higher tax settlements related to prior years versus $10 million during the 2007 period. The decrease in 2008 also benefits from a higher proportion of earnings in lower tax jurisdictions.
Operating Results by Business Unit
We evaluate the performance of business units based on operating profit before gains/losses on the disposition of assets, interest expense, other (income) expense, net and income taxes. See Note 12 to our Consolidated Financial Statements for the reconciliation to Income before taxes.
26
Table of Contents
Flavors Business Unit
In 2008, Flavors operating profit totaled $198 million, or 18.1% as a percentage of sales, compared to $187 million or 18.6% in 2007. The 2008 amount includes $3.5 million of restructuring expenses. Excluding the restructuring charge, profitability was comparable year over year as strong sales growth augmented by lower incentive compensation expense was partially offset by unfavorable product mix.
Fragrance Business Unit
In 2008, Fragrance operating profit of $202 million, or 15.6% as a percentage of sales, declined from the $212 million or 16.7% reported in 2007. The 2008 amount includes $4.4 million of restructuring expenses. The decline in profit was driven by unfavorable absorption of manufacturing expenses from the shortfall in sales in North America, as well as unfavorable mix, with declining fine fragrance sales, partially offset by lower incentive compensation expense.
Global Expenses
Global expenses represent corporate and headquarters-related expenses which include legal, finance, human resources and other administrative expenses that are not allocated to an individual business unit, as well as gains on asset sales and a pension curtailment charge. In 2008, Global expenses were $45 million as compared to $27 million in 2007. In 2008, Global expenses included approximately $10 million of restructuring charges, $3 million of employee separation costs and $2 million of implementation costs related to our global shared service structure, partially offset by a $3 million insurance recovery related to a 2005 product contamination. Global expenses in 2007 included a $6 million curtailment loss related to changes to the U.S. defined benefit pension plan and $11 million related to the gains on asset sales.
Goodwill and Intangible Assets
At December 31, 2009 and 2008, goodwill and other intangible assets, net of accumulated amortization, totaled $721 million and $727 million, respectively. Additional details are contained in Note 4 to the Consolidated Financial Statements.
We perform a goodwill impairment test on at least an annual basis, or more frequently in certain circumstances, by assessing the fair value of our reporting units based upon both discounted cash flow and comparison of multiples of comparable companies. We deem goodwill to be impaired if the carrying amount of the reporting unit exceeds the estimated fair value. We completed our annual assessments in 2009 and 2008, concluding there was no impairment of goodwill.
Other intangible assets include patents, trademarks and other intellectual property, valued at acquisition, primarily through independent appraisals, which are amortized on a straight-line basis over periods ranging from 6 to 20 years. We review our other intangible assets for impairment when events or changes in business conditions indicate that their full carrying value may not be recovered.
Restructuring and Other Charges
Restructuring and other charges primarily consist of separation costs for employees including severance, outplacement and other benefit costs.
The Company recorded a net pre-tax charge of $4.1 million during the second quarter ended June 30, 2009. This amount includes $6.6 million for severance and related costs associated with the elimination of approximately 70 positions globally, less a $2.5 million reduction to previously recorded provisions. The reduction in prior reserves was attributable to lower estimated benefit costs on severance paid as well as fewer position eliminations requiring severance.
27
Table of Contents
During September 2009, as part of the rationalization of our European fragrance manufacturing footprint, the Company announced that it had initiated a collective consultation process with employees regarding the closure of its Fragrances compounding facility in Drogheda, Ireland, as well as the partial closure of its Fragrance Ingredients plant in Haverhill, UK. The Company has completed both consultation processes and has communicated its intent to proceed with the closures. The Company has now completed the negotiations with the Haverhill employee representatives and is actively engaged in the negotiation process with the employee representatives in Ireland to determine actual employee separation benefits.
As a result of these plans, approximately 140 employees will be terminated. During the third and fourth quarters of 2009, the Company recorded a provision for severance costs of $12.2 million to “Restructuring and other charges” in our Consolidated Statement of Income, based on reasonable expectations of separation benefits. We expect to conclude the negotiations in early 2010 and will record any necessary adjustment then. The Company also recorded $1.0 million of accelerated depreciation on certain related assets and other restructuring related costs. Other restructuring costs discussed above will be recorded as incurred as the Company moves forward with implementation. In addition, as part of our continual focus to optimize our European operations, the Flavors segment recorded a provision for contract termination costs of $1.0 million in the fourth quarter of 2009.
We expect to incur total costs related to this restructuring plan of approximately $22-$29 million, consisting primarily of $11-$15 million of employee termination costs, $8-$10 million in plant shutdown and business transition costs and $3-$4 million in asset impairments and/or accelerated depreciation of related fixed assets. While some cost savings could be realized in the latter half of 2010, the estimated annual cost savings benefit of $17-$20 million is not expected to be fully realized until 2011.
In 2008, as part of our business transformation initiative to enable us to better leverage our global SAP software platform, we implemented a plan to centralize transaction processing in a global shared service structure that resulted in the elimination of 127 positions globally, largely in the finance area. As a result of these actions, we recognized a pre-tax charge of approximately $7 million in 2008 related to employee separation costs and $2 million in implementation costs. The implementation costs were included in selling and administrative expenses in 2008. In addition, we incurred a pre-tax charge of approximately $12 million in the fourth quarter 2008 principally related to a performance improvement plan covering 91 positions across a variety of activities globally. Annual savings from these 2008 initiatives is expected to be approximately $14 million, realization of which began in 2009.
Positions eliminated and charges, net of reversal, by business segment in 2009 and 2008 are detailed in the table below; there were no such actions undertaken in 2007.
| Restructuring Charges (In Thousands) |
Positions Affected | ||||||||||
| 2009 | 2008 | 2009 | 2008 | ||||||||
| Flavors |
$ | 637 | $ | 3,538 | 7 | 36 | |||||
| Fragrances |
18,046 | 4,396 | 200 | 38 | |||||||
| Global |
(382 | ) | 10,278 | 5 | 144 | ||||||
| Total |
$ | 18,301 | $ | 18,212 | 212 | 218 | |||||
28
Table of Contents
Movements in related accruals in each of the three years in the period ended December 31, 2009 were:
| (In Millions) |
Employee- Related |
Asset- Related and Other |
Total | |||||||||
| Balance January 1, 2007 |
13 | 2 | 15 | |||||||||
| Cash and other costs |
(10 | ) | (2 | ) | (12 | ) | ||||||
| Balance December 31, 2007 |
3 | — | 3 | |||||||||
| Additional charges, net of reversal |
18 | — | 18 | |||||||||
| Cash and other costs |
(6 | ) | — | (6 | ) | |||||||
| Balance December 31, 2008 |
15 | — | 15 | |||||||||
| Additional charges, net of reversal |
17 | 1 | 18 | |||||||||
| Payments and other |
(13 | ) | (1 | ) | (14 | ) | ||||||
| Balance December 31, 2009 |
$ | 19 | $ | — | $ | 19 | ||||||
The remaining employee-related liabilities are expected to be utilized by 2011 as obligations are satisfied.
Income Taxes
Effective utilization of the cash generated by our international operations is a critical component of our tax strategy. Strategic dividend repatriation from foreign subsidiaries creates U.S. taxable income, which enables us to recognize deferred tax assets.
Pursuant to ASC 740 “Income Taxes”, we establish a valuation allowance for net deferred tax assets if, based on the weight of the available evidence, it is more likely than not that some portion or all of the deferred tax assets will not be realized. Historically, we have provided a full valuation allowance against deferred tax assets resulting from state net operating losses and state credits, as well as selective non-U.S. affiliates’ net operating losses. The changes in the valuation allowances from December 31, 2008 are primarily attributable to the current period net operating losses and currency translation adjustments.
Postretirement Benefits
In 2007, we recorded a curtailment loss of $5.9 million to recognize a portion of the unrecognized prior service costs associated with years of service no longer expected to be rendered and credited as service under the plans as a result of an amendment to the U.S. salaried qualified and non-qualified pension plans. We also introduced an enhanced defined contribution plan for those employees affected by the pension curtailment that became effective January 1, 2008.
Financial Condition
Cash and cash equivalents totaled $80 million at December 31, 2009 compared to $178 million at December 31, 2008. Working capital totaled $643 million at year-end 2009 compared to $751 million at December 31, 2008. The 2009 decrease in working capital was primarily related to improvements associated with inventory management, past due balances on receivables and standardized processing of payables. Gross additions to property, plant and equipment were $67 million, $85 million and $66 million in 2009, 2008 and 2007, respectively, and are expected to approximate 4% of sales in 2010. The planned increase in 2010 is mainly attributable to investments needed to support growth in emerging markets.
Our financial condition continues to be strong, as evidenced by substantial cash flow from operations and substantial drawdown capacity of approximately $500 million on our multi-year revolving credit facility. Operating cash flow provides the primary source of funds for operating and capital needs as well as dividends paid to shareholders and share repurchase activities. We anticipate that cash flows from operations and
29
Table of Contents
availability under our existing credit facilities are sufficient to fund our capital spending and other cash requirements for at least the next eighteen months. We regularly assess our capital structure, including both current and long-term debt instruments, as compared to our cash generation and investment needs in order to provide ample flexibility.
Operating cash flow in 2009 was $292 million compared to $221 million and $314 million in 2008 and 2007, respectively. The improvement in operating cash flows during 2009 was led by the reduction of our inventories, which was driven by our internal process improvement initiatives combined with better operating discipline over receivables and payables. We expect to make additional operational gains in working capital management going forward. Operating cash flows in 2008 benefited from the receipt of $18 million on termination of an interest rate swap. The decrease in other assets and liabilities was driven by long-term incentive plan payments, lower deferred taxes, and pension and other postretirement payments.
Net investing activities in 2009 utilized $81 million compared to $90 million and $51 million in 2008 and 2007, respectively. The reduction in 2009 funds used compared to 2008 reflects a $20 million decline in capital spending, partially offset by a $14 million payment to terminate a net investment hedge in Europe.
Compliance with existing governmental requirements regulating the discharge of materials into the environment has not materially affected our operations, earnings or competitive position. In 2009 and 2008, we spent $4 million in each year on capital projects and $17 million and $19 million, respectively, in operating expenses and governmental charges for the purpose of complying with such regulations. Expenditures for these purposes will continue for the foreseeable future. In addition, we are party to a number of proceedings brought under the Comprehensive Environmental Response, Compensation and Liability Act or similar state statutes. It is expected that the impact of any judgments in or voluntary settlements of such proceedings will not be material to our financial condition, results of operations or liquidity.
The dividend paid per share in 2009, 2008 and 2007 was $1.00, $.94 and $.86, respectively. In January 2009, April 2009, July 2009 and October 2009 we funded a quarterly cash dividend of $0.25 per share to shareholders. In January, April and July 2008, we paid a quarterly cash dividend of $.23 per share to shareholders. We paid dividends totaling $79 million, $75 million and $77 million in 2009, 2008 and 2007. Our current intention is to pay dividends approximating 30 – 35% of yearly earnings; however, the payment of dividends is determined by the Board of Directors (“Board”) at its discretion based on various factors, and no assurance can be provided as to future dividends.
We supplement short-term liquidity with access to capital markets, mainly through bank credit facilities and issuance of commercial paper. In 2005, IFF, including certain subsidiaries, entered into a revolving credit agreement (the “Facility”) with certain banks. The Facility provides for a U.S. $350 million (“Tranche A”) and Euro 400 million (“Tranche B”) multi-currency revolving credit facility. Tranche A is available to IFF for commercial paper backstop and general corporate purposes; Tranche B is available to both IFF and the European subsidiaries for general corporate purposes. Borrowings under the Facility bear interest at an annual rate of LIBOR (or in relation to any Euro-denominated loans, EURIBOR) plus a margin, currently 25 basis points, linked to our credit rating. We pay a commitment fee on the aggregate unused commitments and a utilization fee based on amounts outstanding under the Facility; such fees are not material. The Facility expires on November 23, 2012. During 2008 the maximum amount of outstanding commercial paper was $30 million. We did not issue commercial paper during 2009.
At December 31, 2009, we had $1,012 million of debt outstanding compared to $1,256 million outstanding at December 31, 2008. We regularly assess our capital structure, including both current and long-term debt instruments, as compared to our cash generation and investment needs in order to provide ample flexibility. In that connection, in December 2009 we prepaid, without penalty, the remaining outstanding balance (approximately $151 million) of our Japanese Yen loan — 2008, which was scheduled to mature in 2011. Total debt repayments during 2009 amounted to approximately $240 million.
30
Table of Contents
In October 2008, we closed out a $250 million USD LIBOR to EURIBOR interest rate swap and a $250 million fixed to floating interest rate swap at no cost. Additionally, in February 2009 we terminated a $300 million USD LIBOR to EURIBOR interest rate swap which required us to make a payment of $16 million. See Quantitative and Qualitative Disclosures About Market Risk (Item 7A below) for additional information regarding these transactions.
During the year ended December 31, 2009, we repurchased 75,000 shares on the open market at a cost of $2 million or an average of $26.22 per share. For the year ended December 31, 2008, we repurchased .7 million shares of our common stock at a cost of $30 million on the open market. For the year ended December 31, 2007, we repurchased 2.6 million shares of our common stock in the open market at a cost of $127 million, plus an additional 7.6 million shares under the ASR.
In July 2007, our Board authorized us to repurchase up to 15% or $750 million worth of our then outstanding common stock, whichever is less. In September 2007, under the July 2007 Plan, we entered into two agreements to purchase shares of our common stock under a $450 million accelerated share repurchase (“ASR”) program. The ASR concluded in June 2008. Total aggregate shares repurchased under the ASR program were 9.7 million shares at an average purchase price of $46.53. The ASR was primarily funded through the issuance of $500 million of Senior Unsecured Notes (“Senior Notes — 2007”) in four series under a Note Purchase Agreement. See Note 8, Borrowings, to the Consolidated Financial Statements for additional information regarding these notes.
The Facility contains the most restrictive covenant requiring us to maintain, at the end of each fiscal quarter, a ratio of net debt for borrowed money to adjusted EBITDA in respect of the previous 12-month period of not more than 3.25 to 1.
At December 31, 2008, we were in compliance with all financial and other covenants. At December 31, 2009 our Net Debt/adjusted EBITDA(1) was 2.08 to 1 as defined by the debt agreements, well below the financial covenants of existing outstanding debt. Failure to comply with the financial and other covenants under these agreements would constitute default and would allow the lenders to accelerate the maturity of all indebtedness under the related agreement. If such acceleration were to occur, we would not have sufficient liquidity available to repay the indebtedness. We would likely have to seek amendments under the agreements for relief from the financial covenants or repay the debt with proceeds from the issuance of new debt or equity, and/or asset sales, if necessary. We may be unable to amend the agreements or raise sufficient capital to repay such obligations in the event the maturities are accelerated.
| (1) | Adjusted EBITDA and Net Debt, which are non-GAAP measures used for these covenants, are calculated in accordance with the definition in the debt agreements. In this context, these measures are used solely to provide information on the extent to which we are in compliance with debt covenants and may not be comparable to adjusted EBITDA and Net Debt used by other companies. Reconciliations of adjusted EBITDA to net income and net debt to total debt are as follows: |
| 12 Months Ended December 31, | ||||||
| (In Millions) |
2009 | 2008 | ||||
| Net income |
$ | 195.5 | $ | 229.6 | ||
| Interest expense |
61.8 | 74.0 | ||||
| Income taxes |
81.0 | 54.3 | ||||
| Depreciation |
72.3 | 69.8 | ||||
| Amortization |
6.2 | 6.2 | ||||
| Specified items |
24.6 | 22.9 | ||||
| Adjusted EBITDA |
$ | 441.4 | $ | 456.8 | ||
31
Table of Contents
| December 31, | ||||||||
| (In Millions) |
2009 | 2008 | ||||||
| Total debt |
$ | 1,011.5 | $ | 1,255.7 | ||||
| Adjustments: |
||||||||
| Deferred gain on interest rate swaps |
(15.0 | ) | (16.9 | ) | ||||
| Cash and cash equivalents |
(80.1 | ) | (178.5 | ) | ||||
| Net debt |
$ | 916.4 | $ | 1,060.3 | ||||
At December 31, 2009, we had contractual payment obligations due within the time periods as specified in the following table:
| Payments Due | |||||||||||||||
| Contractual Obligations (In Millions) |
Total | 2010 | 2011-2012 | 2013-2014 | 2015 and thereafter | ||||||||||
| Borrowings(1) |
$ | 997 | $ | 77 | $ | 195 | $ | 100 | $ | 625 | |||||
| Interest on borrowings(1) |
428 | 53 | 95 | 83 | 197 | ||||||||||
| Operating leases(2) |
296 | 28 | 47 | 37 | 184 | ||||||||||
| Purchase commitments(3) |
5 | 5 | — | — | — | ||||||||||
| Pension funding obligations(4) |
51 | 19 | 10 | 6 | 16 | ||||||||||
| Postretirement obligations(4) |
64 | 6 | 11 | 12 | 35 | ||||||||||
| Total |
$ | 1,841 | $ | 188 | $ | 358 | $ | 238 | $ | 1,057 | |||||
| (1) | See Note 8 to the Consolidated Financial Statements for a further discussion of our various borrowing facilities. |
| (2) | Operating leases include facility and other lease commitments executed in the normal course of the business. Additional details concerning the United States facilities are contained in Note 7 of the Notes to the Consolidated Financial Statements and further details concerning worldwide aggregate operating leases are contained in Note 16 of the Notes to the Consolidated Financial Statements. |
| (3) | Purchase obligations and capital project commitments are not recorded on our consolidated balance sheet. |
| (4) | See Note 13 to the Consolidated Financial Statements for a further discussion of our retirement plans. Anticipated funding obligations are based on current actuarial assumptions. Minimum funding requirements reported in the above table do not extend beyond 2019. |
The table above does not include $65 million of the total unrecognized tax benefits for uncertain tax positions and approximately $10 million of associated accrued interest. Due to the high degree of uncertainty regarding the timing of potential cash flows, the Company is unable to make a reasonable estimate of the amount and period in which these liabilities might be paid.
Critical Accounting Policies and Use of Estimates
Our accounting policies are more fully described in Note 1 to the Consolidated Financial Statements. As disclosed in Note 1, the preparation of financial statements in conformity with U.S. generally accepted accounting principles (“GAAP”) requires management to make estimates and assumptions that affect reported amounts and accompanying disclosures. These estimates are based on management’s best judgment of current events and actions that we may undertake in the future. Actual results may ultimately differ from estimates.
Those areas requiring the greatest degree of management judgment or deemed most critical to our financial reporting involve:
The periodic assessment of potential impairment of intangible assets acquired in business combinations. We currently have net intangible assets, including goodwill, of $721 million. Goodwill is evaluated for impairment annually. In assessing goodwill, management uses the most current actual and forecasted operating data available, and current market based assumptions. A two-step approach is
32
Table of Contents
employed. The first step involves estimating the value of reporting units based on the present value of estimated future cash flows. The second step, if necessary, is to measure the value of the impairment loss, if any. Management’s most subjective assumptions relate to the estimated/projected sales and operating growth values employed in the forecast.
The analysis and evaluation of income taxes. We account for taxes in accordance with ASC 740. Under ASC 740, deferred tax assets and liabilities are determined based on temporary differences between financial reporting and tax bases of assets and liabilities, based on tax laws as currently enacted. The provision for income taxes is based on statutory income tax rates and planning opportunities available in the various tax jurisdictions where we operate. Significant judgment is required in determining income tax provisions and tax positions. We may be challenged upon review by the applicable taxing authority and positions taken by us may not be sustained. We regularly update these accruals in light of changing facts and circumstances.
In 2007, we adopted guidance presented in ASC 740 (formally “FIN 48”). As a result of this guidance, we recognized a $1 million increase in Other liabilities for unrecognized tax benefits and a corresponding cumulative effect adjustment to Retained earnings.
The evaluation of potential legal and environmental liabilities, where changing circumstances, rules and regulations require regular reassessment of related practices and anticipated costs. We are subject to certain legal claims regarding products and other matters, as well as environmental-related matters. Significant management judgment is involved in determining when it is probable that a liability has been incurred and the extent to which it can be reasonably estimated.
We regularly assess potential liabilities with respect to all legal claims based on the most recent available information, in consultation with outside counsel handling the defense of such matters. To the extent a liability is deemed to have been incurred and can be reasonably estimated, we recognize a corresponding liability; if the reasonably estimated liability is a range, we recognize that amount considered most likely, or in the absence of such a determination, the minimum reasonably expected liability. To the extent such claims are covered by various insurance policies, we separately evaluate the likelihood of recovery and account for any related insurance receivable. Management judgments involve determination as to whether a liability has been incurred, the reasonably estimated amount of that liability, and any potential insurance recovery.
We regularly evaluate potential environmental exposure in terms of total estimated cost and the viability of other potentially responsible parties (“PRP’s”) associated with our exposure. Recorded liabilities are adjusted periodically as remediation efforts progress and additional information becomes available. Critical management assumptions relate to expected total costs to remediate and the financial viability of PRP’s to share such costs.
Determination of the various assumptions employed in the valuation of pension and retiree health care expense and associated obligations. Amounts recognized in the Consolidated Financial Statements related to pension and other postretirement benefits are determined from actuarial valuations. Inherent in such valuations are assumptions including expected return on plan assets, discount rates at which the liabilities could be settled, rates of increase in future compensation levels, mortality rates and health care cost trend rates. These assumptions are updated annually and are disclosed in Note 13 to the Consolidated Financial Statements. In accordance with GAAP, actual results that differ from the assumptions are accumulated and amortized over future periods and, therefore, affect expense recognized and obligations recorded in future periods.
We consider a number of factors in determining and selecting assumptions for the overall expected long-term rate of return on plan assets. We consider the historical long-term return experience of our assets, the current and expected allocation of our plan assets, and expected long-term rates of return. We derive these expected long-term rates of return with the assistance of our investment advisors. We base our expected allocation of plan assets on a diversified portfolio consisting of domestic and international equity securities, fixed income, real estate, and alternative asset classes.
33
Table of Contents
We consider a variety of factors in determining and selecting our assumptions for the discount rate at December 31. For the U.S. plans, the discount rate was based on the internal rate of return for a portfolio of Moody’s Aaa, Aa, and Merrill Lynch AAA-AA high quality bonds with maturities that are consistent with the projected future benefit payment obligations of the plan. The rate of compensation increase for all plans and the medical cost trend rate for the applicable U.S. plans are based on plan experience.
With respect to the U.S. plans, the expected return on plan assets was determined based on an asset allocation model using the current target allocation, real rates of return by asset class and an anticipated inflation rate. The target asset allocation consists of approximately: 60 – 65% in equity securities and 35 – 40% in fixed income securities. The inflation rate assumed in the model was 2.5%. The plan has achieved a compounded annual rate of return of approximately 8% over the previous 20 years. At December 31, 2009, the actual asset allocation was: 67% in equity securities; 30% in fixed income securities; and 3% in cash.
The expected annual rate of return for the non-U.S. plans employs a similar set of criteria adapted for local investments, inflation rates and in certain cases specific government requirements. The target asset allocation, for the non-U.S. plans, consists of approximately: 55 – 60% in fixed income securities, 30 – 35% in equity securities; 5 – 10% in real estate; and up to 5% in cash. At December 31, 2009, the actual asset allocation was: 57% in fixed income investments; 30% in equity investments; 11% in real estate investments; and 2% in cash.
Management establishes the assumptions concerning discount rates and actuarial assumptions based on current market conditions, including asset returns and other factors applicable under the circumstances. Changes in pension and other post-employment benefits, and associated expenses, may occur in the future due to changes in these assumptions. The impact that a .25% decrease in the discount rate or a 1% change in the medical cost trend rate would have on our pension and other post-employment benefit expense, as applicable, is discussed in Note 13 to the Consolidated Financial Statements.
The ongoing assessment of the valuation of inventory, given the large number of natural ingredients employed, the quality of which may be diminished over time. We maintain between 40% and 55% of our inventory as raw materials, providing the greatest degree of flexibility in manufacture and use. Materials are evaluated based on shelf life, known uses and anticipated demand based on forecasted customer order activity and changes in product/sales mix. Management policy provides for an ongoing assessment of inventory with adjustments recorded when an item is deemed to be slow moving or obsolete.
Determination of various assumptions employed in the calculation of equity compensation expense. Amounts recognized in the Consolidated Financial Statements related to equity compensation are determined based on the number of awards and type of award as well as specific assumptions regarding expected life, stock price volatility, risk free interest rate, termination rates, exercise multiple and the dividend yield. These assumptions are employed in the Binomial model used to value certain awards. Management establishes the assumptions based on current market conditions and historical trends related to the equity awards.
Developing the assumptions used in the Binomial model requires significant judgment on our part and, generally, may involve analyzing available historical data, considering whether historical data is relevant to predicting future behavior, making appropriate adjustments to historical data for future expectations, supplementing or replacing company-specific historical data with data from other supportable sources and appropriately weighting each of the inputs. These assumptions are evaluated at each grant date. If factors change and we employ different assumptions for estimating share-based compensation expense in future periods or if we decide to use a different valuation model, the future periods may differ significantly from what we have recorded in the current period and could materially affect operating income, net income and net income per share.
We believe that we have considered relevant circumstances that we may be currently subject to, and the financial statements accurately reflect our best estimate of the results of our operations, financial condition and cash flows for the years presented. We have discussed the decision process and selection of these critical accounting policies with the Audit Committee of the Board of Directors.
34
Table of Contents
New Accounting Standards
In June 2009, the Financial Accounting Standards Board (“FASB”) issued its FASB Accounting Standards Codification and the Hierarchy of Generally Accepted Accounting Principles (the “Codification” or “ASC”). The Codification became the single source of authoritative U.S. generally accepted accounting principles (“GAAP”) recognized by the FASB to be applied by nongovernmental entities. The Codification now supersedes then-existing accounting and reporting standards such as FASB Statements, FASB Staff Positions (“FSP”) and Emerging Issues Task Force Abstracts. The Codification, which is effective for our financial statements beginning with our third quarter of 2009, impacts only our financial statement reference disclosures and does not change application of GAAP.
In May 2009, the FASB issued authoritative guidance which sets forth general standards of accounting for and the disclosure of events that occur after the balance sheet date, but before financial statements are issued or are available to be issued. This guidance was effective beginning with our second quarter of 2009 and has not had a material impact on our Consolidated Financial Statements. In that regard, we have performed an evaluation of subsequent events through February 25, 2010, which is the date the financial statements were issued.
In April 2009, the FASB issued authoritative guidance requiring disclosures about the fair value of financial instruments in annual and interim reporting periods of publicly traded companies. The quarterly disclosures are intended to provide financial statement users with more timely information about the effects of current market conditions on an entity’s financial instruments that are not otherwise reported at fair value. This guidance is effective for interim reporting periods beginning with our second quarter of 2009. The adoption of this guidance had no impact on our financial position or results of operations.
As of December 31, 2009, we adopted new authoritative guidance which expands the disclosure requirements related to the plan assets of our defined benefit pension and other postretirement plans with the intent to provide users of financial statements with an enhanced understanding of: (i) how investment allocation decisions are made, including the investment policies and strategies used, (ii) the major categories of plan assets, (iii) the inputs and valuation techniques used to measure the fair value of plan assets, (iv) the effect of fair value measurements using significant unobservable inputs (Level 3) on changes in plan assets and (v) significant concentrations of risk within plan assets. The additional disclosures required by this guidance are included in Note 13 to the Consolidated Financial Statements.
As of January 1, 2009 we adopted new authoritative guidance issued by the FASB which requires us to classify our noncontrolling interest in consolidated subsidiaries (previously referred to as minority interest) as a separate component of Shareholders’ Equity. Through December 31, 2008, such noncontrolling interest had been included in Other liabilities in our Consolidated Balance Sheet. Any applicable (income) expense attributable to the noncontrolling interest is included in Other (income) expense, net in the accompanying Consolidated Statement of Income due to its immateriality and, as such, is not included separately in comprehensive income.
As of January 1, 2009 we adopted new authoritative guidance issued by the FASB which amends and expands previously required disclosure requirements about derivative instruments and hedging activities. The new guidance requires enhanced disclosures regarding the objectives and strategies for using derivatives, how derivative instruments are accounted for, and how derivative instruments and related hedged items affect an entity’s financial position, financial performance and cash flows. The adoption of the new guidance had no impact on our financial position or results of operations. The additional disclosures required by this guidance are included in Note 14 to the Consolidated Financial Statements.
As of January 1, 2009 we adopted new authoritative guidance issued by the FASB related to “participating securities granted in share-based payment transactions”. This guidance considers unvested share-based payment awards that contain nonforfeitable rights to dividends or dividend equivalents (whether paid or unpaid) as participating securities and requires them to be included in the computation of basic earnings per share pursuant
35
Table of Contents
to the two-class method described in the Codification. The adoption of this guidance did not have a material impact on our Consolidated Financial Statements and is explained in detail in Note 1 to the Consolidated Financial Statements.
Non-GAAP Financial Measures
The Company uses non-GAAP financial operating measures which exclude: employee separation costs (including costs associated with the change in the Chief Executive Officer position in 2009) and restructuring charges (including costs associated with the Company’s ongoing restructuring efforts in Europe in 2009); benefits of favorable tax rulings and settlements relating to prior years; the benefit of an insurance recovery, costs for the implementation of the global shared services structure in 2008 and the gain on the sale of land and a curtailment charge resulting from changes made to our U.S. defined benefit pension plan in 2007. In addition, in certain instances, we exclude the effects of exchange rate fluctuations when discussing our historical performance. The Company also discloses, from time to time, non-GAAP effective tax rates, which exclude the effect of the benefits of tax rulings relating to prior periods, as additional information in seeking to assess and compare our tax rates without the benefit of those tax rulings. Such information is supplemental to information presented in accordance with GAAP and is not intended to represent a presentation in accordance with GAAP. In discussing our historical and expected future results and financial condition, we believe it is meaningful for investors to be made aware of and to be assisted in a better understanding of, on a period-to-period comparative basis, of financial amounts both including and excluding these identified items, as well as the impact of exchange rate fluctuations on operating results and financial condition. We believe such additional non-GAAP information provides investors with an overall perspective of the period-to-period performance of our core business. In addition, management internally reviews each of these non-GAAP measures to evaluate performance on a comparative period-to-period basis in terms of absolute performance, trends and expected future performance with respect to our core continuing business. A material limitation of these non-GAAP measures is that such measures do not reflect actual GAAP amounts, restructuring charges, employee separation costs and implementation costs include actual cash outlays, an insurance recovery is an actual cash recovery and benefits from favorable tax rulings and settlements reflect actual accounting and cash benefits realized; and we compensate for such limitations by presenting the accompanying reconciliation to the most directly comparable GAAP measure. These non-GAAP measures may not be comparable to similarly titled measures used by other companies.
Cautionary Statement Under the Private Securities Litigation Reform Act of 1995
Statements in this Annual Report, which are not historical facts or information, are “forward-looking statements” within the meaning of The Private Securities Litigation Reform Act of 1995. Such forward-looking statements are based on management’s current assumptions, estimates and expectations. Certain of such forward-looking information may be identified by such terms as “expect”, “anticipate”, “believe”, “outlook”, “guidance”, “may” and similar terms or variations thereof. All information concerning future revenues, tax rates or benefits, interest and other savings, earnings and other future financial results or financial position, constitutes forward-looking information. Such forward-looking statements are based on a series of expectations, assumptions, estimates and projections about the Company, are not guarantees of future results or performance, and involve significant risks, uncertainties and other factors, including assumptions and projections, for all forward periods. Actual results of the Company may differ materially from any future results expressed or implied by such forward-looking statements. Such factors include, among others, the following: general economic and business conditions in the Company’s markets, especially given the current disruption in global economic conditions, including economic and recessionary pressures; energy and commodity prices; decline in consumer confidence and spending; significant fluctuations in the value of the U.S. dollar; population health and political uncertainties, and the difficulty in projecting the short and long-term effects of global economic conditions; movements in interest rates; continued volatility and deterioration of the capital and credit markets, including continued disruption in the commercial paper market, and any adverse impact on our cost of and access to capital and credit; fluctuations in the price, quality and availability of raw materials; the Company’s ability to implement its business strategy, including the achievement of anticipated cost savings, profitability and growth targets; the
36
Table of Contents
impact of currency fluctuation or devaluation in the Company’s principal foreign markets, especially given the current disruptions to such currency markets, and the impact on the availability, effectiveness and cost of the Company’s hedging and risk management strategies; the outcome of uncertainties related to litigation; the impact of possible pension funding obligations and increased pension expense on the Company’s cash flow and results of operations; and the effect of legal and regulatory proceedings, as well as restrictions imposed on the Company, its operations or its representatives by U.S. and foreign governments. The Company intends its forward-looking statements to speak only as of the time of such statements and does not undertake or plan to update or revise them as more information becomes available or to reflect changes in expectations, assumptions or results. The Company can give no assurance that such expectations or forward-looking statements will prove to be correct. An occurrence of, or any material adverse change in, one or more of the risk factors or risks and uncertainties referred to in this report or included in our other periodic reports filed with the Commission could materially and adversely impact our operations and our future financial results.
Any public statements or disclosures by IFF following this report that modify or impact any of the forward-looking statements contained in or accompanying this report will be deemed to modify or supersede such outlook or other forward-looking statements in or accompanying this report.
37
Table of Contents
ITEM 7A. QUANTITATIVE AND QUALITATIVE DISCLOSURES ABOUT MARKET RISK.
We operate on a global basis and are exposed to currency fluctuation related to the manufacture and sale of our products in currencies other than the U.S. dollar. The major foreign currencies involve the markets in the European Union, Great Britain, Mexico, Brazil, China, India, Indonesia, Australia and Japan, although all regions are subject to foreign currency fluctuations versus the U.S. dollar. We actively monitor our foreign currency exposures in all major markets in which we operate, and employ a variety of techniques to mitigate the impact of exchange rate fluctuations, including foreign currency hedging activities. We enter into foreign currency forward contracts with the objective of reducing exposure to cash flow volatility associated with foreign currency receivables and payables, and with anticipated purchases of certain raw materials used in operations. These contracts, the counterparties to which are major international financial institutions, generally involve the exchange of one currency for a second currency at a future date, and have maturities not exceeding six months. The notional amount and maturity dates of such contracts match those of the underlying transactions. The gain or loss on the hedging instrument and services is recorded in earnings at the same time as the transaction being hedged is recorded in earnings. In February 2003, we executed a 10-year Yen — U.S. dollar currency swap related to the monthly sale and purchase of products and services between the U.S. and Japan, which is designated as a cash flow hedge. The annual notional value of this swap is approximately $5 million. The associated asset or liability on the open hedge instrument is recorded in Current assets or Current liabilities, as applicable. Gains and losses related to this swap are recorded currently, and the mark-to-market adjustment related to the value of the swap is reflected as a component of Accumulated Other Comprehensive Income (“AOCI”).
In addition to the foreign exchange forward contracts noted above, we have used non-U.S. dollar borrowings and foreign exchange swap agreements, to hedge the foreign currency exposures of our net investment in certain foreign affiliates, primarily in the European Union. These foreign exchange swap agreements are designated as hedges of net investments. In September 2007 and January 2006, we entered into a $250 million and a $300 million Cross Currency Interest Rate Swap, respectively, to hedge a portion of our consolidated EUR net investment. The derivative was structured as a swap of floating USD LIBOR to floating EURIBOR, with both floating interest rates reset and paid semi-annually. Because the derivative is structured as a floating to floating swap, the only value, other than that derived from changes in the spot Foreign Exchange (FX) rate, are interest rate accruals which are reset semi-annually. These accruals are netted and booked in current earnings. Mark-to-market changes due to differences in the underlying FX rate are recorded in AOCI and provide an offset to the cumulative translation adjustment of the underlying Euro net investments being hedged. In October 2008, we closed out the $250 million USD LIBOR to EURIBOR interest rate swap at no cost. In February 2009 we terminated the $300 million USD LIBOR to EURIBOR interest rate swap which required us to make a payment of $16 million. As this swap was designated as a net investment hedge, $12 million of the loss was deferred in AOCI where it will remain until the Euro net investment is divested and $4 million was included as a component of interest expense during the year ended December 31, 2009.
We use derivative instruments as part of our interest rate risk management strategy. The derivative instruments used are comprised principally of fixed to floating rate interest rate swaps. In September 2007, we entered into a $250 million interest rate swap agreement effectively converting the fixed rate on our long-term U.S. dollar borrowings to a variable short-term rate based on USD LIBOR rate plus markup. In March 2008, we realized an $18 million gain on termination of this swap, which has been deferred and is being amortized as a reduction to interest expense over the remaining term of the related debt. During 2008, we entered into a similar interest rate swap and then in October 2008 we liquidated this position at no cost.
In addition, in 2005, we entered into certain interest rate swap agreements effectively converting the fixed rate on our long-term Japanese Yen borrowings to a variable short-term rate based on the Japanese Yen TIBOR rate plus markup. These swaps are designated as qualified fair value hedges. In November 2008, the portion of these swaps related to the 13.3 billion Yen notes refinanced, expired. Swap contracts are generally held to maturity and are intended to create an appropriate balance of fixed and floating rate debt. To the extent we have not received cash or otherwise amended or settled any swap agreements, any applicable mark-to-market adjustment relating to that swap is included as a separate component of debt.
38
Table of Contents
The following table summarizes our derivatives outstanding as of December 31, 2009. These swaps were all effective under ASC 815.
| Notional amount | 1,818,000,000 | 50,000,000 | ||
| Currency | JPY | USD | ||
| Description | Interest Rate Swap | 10 Year Cross Currency Swap (JPY/USD) | ||
| Hedged risk | The risk of changes in fair value attributable to interest rate risk(1) | The variability of cash flows attributable to foreign exchange risk(2) | ||
Method used to test for effectiveness:
| (1) | Changes in fair value attributable to the risk being hedged are expected to be completely offset by the hedging derivative because the critical terms of the Interest Rate Swap and the hedged debt match (i.e., the currency, notional amount, timing and date of interest payments). Quarterly hedge effectiveness testing includes ensuring the terms of the hedging instrument and the debt have not changed and reviewing counterparty creditworthiness. |
| (2) | Changes in cash flow attributable to the risk being hedged are expected to be completely offset by the hedging derivative because the critical terms of the Cross Currency Swap and the forecasted transaction match (i.e., the currency, notional amount and timing). Quarterly hedge effectiveness testing includes reviewing counterparty creditworthiness, ensuring the probability of hedged forecasted transactions has not changed and ensuring the terms of the hedging instrument have not changed. |
We have established a centralized reporting system to evaluate the effects of changes in interest rates, currency exchange rates and other relevant market risks. Our risk management procedures include the monitoring of interest rate and foreign exchange exposures and hedge positions utilizing statistical analyses of cash flows, market value and sensitivity analysis. However, the use of these techniques to quantify the market risk of such instruments should not be construed as an endorsement of their accuracy or the accuracy of the related assumptions. Market exposures are evaluated using a sensitivity model that is intended to measure the potential 10% loss in interest rate and foreign exchange financial instruments, assuming adverse market conditions occur. Historical interest rates and foreign exchange rates are used to estimate the volatility and correlation of future rates.
The estimated maximum potential one-day loss in fair value of interest rate or foreign exchange rate instruments, calculated using the sensitivity model, is not material to our consolidated financial position, results of operations or cash flows in 2009, 2008 and 2007. The estimated maximum yearly loss in earnings due to interest rate or foreign exchange rate instruments, calculated utilizing the sensitivity model, is not material to our results of operations in 2009, 2008 and 2007. Actual results in the future may differ materially from these projected results due to actual developments in the global financial markets.
The foreign currency and interest rate swap contracts existing during 2008 and 2007 were entered into for the purpose of seeking to mitigate the risk of certain specific adverse currency and interest rate risks. As a result of these financial instruments, we reduced financial risk in exchange for foregoing any gain (reward) that might have occurred if the markets moved favorably. In using these contracts, management exchanged the risks of the financial markets for counterparty risk. Counterparty risk arises from the inability of a counterparty to meet its obligations. To mitigate counterparty risk, we entered into derivative contracts with major leading financial institutions that have credit ratings equal to or better than our credit rating.
| ITEM 8. | FINANCIAL STATEMENTS AND SUPPLEMENTARY DATA. |
See index to Consolidated Financial Statements on page 44. See Item 6 on page 17 for supplemental quarterly data.
39
Table of Contents
| ITEM 9. | CHANGES IN AND DISAGREEMENTS WITH ACCOUNTANTS ON ACCOUNTING AND FINANCIAL DISCLOSURE. |
None.
ITEM 9A. CONTROLS AND PROCEDURES.
Evaluation of Disclosure Controls and Procedures and Changes in Internal Control over Financial Reporting.
The members of the temporary office of the Chief Executive Officer, who are comprised of our Executive Vice President and Chief Financial Officer, Group President, Flavors and Group President, Fragrances, with the assistance of other members of our management, have evaluated the effectiveness of our disclosure controls and procedures as of the end of the period covered by this Annual Report on Form 10-K. Based on such evaluation, the temporary office of the Chief Executive Officer has concluded that our disclosure controls and procedures are effective as of the end of the period covered by this Annual Report on Form 10-K.
We have established controls and procedures designed to ensure that information required to be disclosed in the reports that we file or submit under the Exchange Act is recorded, processed, summarized and reported within the time periods specified in the Commission’s rules and forms and is accumulated and communicated to management, including the principal executive officer and the principal financial officer, to allow timely decisions regarding required disclosure.
Our members of the temporary office of the Chief Executive Officer have also concluded that there have not been any changes in our internal control over financial reporting during the fourth quarter that have materially affected, or are reasonably likely to materially affect, our internal control over financial reporting.
Management’s Report on Internal Control Over Financial Reporting.
Our management is responsible for establishing and maintaining adequate internal control over financial reporting as defined in Rules 13a-15(f) and 15d-15(f) under the Securities Exchange Act of 1934. Our internal control over financial reporting is a process designed to provide reasonable assurance regarding the reliability of financial reporting and the preparation of financial statements for external purposes in accordance with generally accepted accounting principles.
Because of its inherent limitations, internal control over financial reporting may not prevent or detect misstatements. Also, projections of any evaluation of effectiveness to future periods are subject to the risk that controls may become inadequate because of changes in conditions, or that the degree of compliance with the policies or procedures may deteriorate.
Management assessed the effectiveness of our internal control over financial reporting as of December 31, 2009. In making this assessment, management used the criteria set forth by the Committee of Sponsoring Organizations of the Treadway Commission (“COSO”) in Internal Control — Integrated Framework.
Based on this assessment, management determined that, as of December 31, 2009, our internal control over financial reporting was effective.
PricewaterhouseCoopers LLP, our independent registered public accounting firm, has audited the effectiveness of our internal control over financial reporting as of December 31, 2009 as stated in their report which is included herein.
40
Table of Contents
Certifications to NYSE and SEC
Certifications for the members of the temporary office of the Chief Executive Officer were timely filed with the NYSE as required by NYSE Rule 303A(12). We have filed the required Sarbanes-Oxley Section 302 certifications for the members of the temporary office of the Chief Executive Officer regarding the quality of our public disclosures as exhibits to our most recently filed Form 10-K.
None.
41
Table of Contents
PART III
ITEM 10. DIRECTORS, EXECUTIVE OFFICERS AND CORPORATE GOVERNANCE.
The information relating to directors and nominees of the Company is set forth under the caption “Item 1 — Election of Directors” in the IFF 2010 Proxy Statement and is incorporated by reference herein. The information under the caption “Section 16(a) Beneficial Ownership Reporting Compliance” that appears in the IFF 2010 Proxy Statement is also incorporated by reference herein. See Part I, Item 1 of this Form 10-K for information relating to the Company’s Executive Officers.
The Company has adopted a Code of Business Conduct and Ethics (the “Code of Ethics”) that applies to the persons serving as the Company’s chief executive officer, principal financial officer, principal accounting officer, and to all other Company directors, officers and employees. The Code of Ethics is available at the Investor Relations / Corporate Governance section on the Company’s website www.iff.com. A waiver from any provision of the Code of Ethics in favor of a director or Executive Officer may only be granted by the Board or the Audit Committee of the Board and any such waiver will be publicly disclosed. The Company will disclose substantive amendments to and any waivers from the Code of Ethics provided to the Company’s chief executive officer, principal financial officer or principal accounting officer, as well as any other executive officer or director, at the Investor Relations / Corporate Governance section on the Company’s Internet website: www.iff.com. On August 15, 2007, the Company initiated an anonymous worldwide Hotline to address the serious concerns of employees. The Company contracted with Global Compliance Services to assist our employees in identifying issues that might compromise the health, safety, or reputation of the Company, employees or shareholders.
The information regarding the Company’s Audit Committee and its designated audit committee financial expert is set forth under the captions “Board and Committee Memberships” and “Audit Committee” in the IFF 2010 Proxy Statement and such information is incorporated by reference herein.
The information concerning procedures by which shareholders may recommend director nominees is set forth under “Director Candidates” in the IFF 2010 Proxy Statement and such information is incorporated by reference herein.
ITEM 11. EXECUTIVE COMPENSATION.
The information relating to executive compensation and the Company’s policies and practices as they relate to the Company’s risk management is set forth under the captions “Executive Compensation”, “Directors’ Compensation” and “Compensation Committee — Process and Procedures Regarding Compensation” in the IFF 2010 Proxy Statement and such information is incorporated by reference herein; except that the information under the caption “Compensation Committee Report” shall be deemed “furnished” with this report and shall not be deemed “filed” with this report, not deemed incorporated by reference into any filing under the Securities Act of 1933 except only as may be expressly set forth in any such filing by specific reference.
| ITEM 12. | SECURITY OWNERSHIP OF CERTAIN BENEFICIAL OWNERS AND MANAGEMENT AND RELATED STOCKHOLDER MATTERS. |
The information relating to security ownership of management and certain beneficial owners is set forth under the caption “Beneficial Ownership Table” in the IFF 2010 Proxy Statement and such information is incorporated by reference herein. The information relating to the Company’s equity plans is set forth under the caption “Equity Compensation Plans” in the IFF 2010 Proxy Statement and such information is incorporated by reference herein.
42
Table of Contents
| ITEM 13. | CERTAIN RELATIONSHIPS AND RELATED TRANSACTIONS, AND DIRECTOR INDEPENDENCE. |
The information regarding certain relationships and related party transactions and director independence is set forth under the caption “Independence of Directors and Committee Members and Related Person Matters” in the IFF 2010 Proxy Statement and such information is incorporated by reference herein.
| ITEM 14. | PRINCIPAL ACCOUNTING FEES AND SERVICES. |
The information regarding the independent registered public accounting firm (“independent accountant”) fees and services and the Company’s pre-approval policies and procedures for audit and non-audit services provided by the Company’s independent accountant are set forth under the captions “Principal Accountant Fees and Services” and “Audit Committee Pre-Approval Policies and Procedures” in the IFF 2010 Proxy Statement and such information is incorporated by reference herein.
43
Table of Contents
PART IV
| ITEM 15. | EXHIBITS AND FINANCIAL STATEMENT SCHEDULES. |
(a)(1) FINANCIAL STATEMENTS: The following consolidated financial statements, related notes, and independent registered public accounting firm’s report are included in this report on Form 10-K:
| 45 | ||
| Consolidated Statement of Income for the three years ended December 31, 2009 |
46 | |
| 47 | ||
| Consolidated Statement of Cash Flows for the three years ended December 31, 2009 |
48 | |
| Consolidated Statement of Shareholders’ Equity for the three years ended December 31, 2009 |
49 | |
| 50-76 | ||
| (a)(2) FINANCIAL STATEMENT SCHEDULES |
||
| S-1 | ||
All other schedules are omitted because they are not applicable or the required information is shown in the financial statements or notes thereto.
44
Table of Contents
REPORT OF INDEPENDENT REGISTERED PUBLIC ACCOUNTING FIRM
To the Board of Directors and Shareholders of International Flavors & Fragrances Inc.:
In our opinion, the consolidated financial statements listed in the index appearing under item 15(a)(1) present fairly, in all material respects, the financial position of International Flavors & Fragrances Inc. and its subsidiaries at December 31, 2009 and December 31, 2008, and the results of their operations and their cash flows for each of the three years in the period ended December 31, 2009 in conformity with accounting principles generally accepted in the United States of America. In addition, in our opinion, the financial statement schedule listed in the index appearing under Item 15(a)(2) presents fairly, in all material respects, the information set forth therein when read in conjunction with the related consolidated financial statements. Also in our opinion, the Company maintained, in all material respects, effective internal control over financial reporting as of December 31, 2009, based on criteria established in Internal Control — Integrated Framework issued by the Committee of Sponsoring Organizations of the Treadway Commission (COSO). The Company’s management is responsible for these financial statements and financial statement schedule, for maintaining effective internal control over financial reporting and for its assessment of the effectiveness of internal control over financial reporting, included in Managements’ Report on Internal Control Over Financial Reporting, appearing under Item 9A. Our responsibility is to express opinions on these financial statements, on the financial statement schedule, and on the Company’s internal control over financial reporting based on our integrated audits. We conducted our audits in accordance with the standards of the Public Company Accounting Oversight Board (United States). Those standards require that we plan and perform the audits to obtain reasonable assurance about whether the financial statements are free of material misstatement and whether effective internal control over financial reporting was maintained in all material respects. Our audits of the financial statements included examining, on a test basis, evidence supporting the amounts and disclosures in the financial statements, assessing the accounting principles used and significant estimates made by management, and evaluating the overall financial statement presentation. Our audit of internal control over financial reporting included obtaining an understanding of internal control over financial reporting, assessing the risk that a material weakness exists, and testing and evaluating the design and operating effectiveness of internal control based on the assessed risk. Our audits also included performing such other procedures as we considered necessary in the circumstances. We believe that our audits provide a reasonable basis for our opinions.
As discussed in Note 9 to the consolidated financial statements, the Company changed the manner in which it accounts for uncertain tax positions in 2007.
A company’s internal control over financial reporting is a process designed to provide reasonable assurance regarding the reliability of financial reporting and the preparation of financial statements for external purposes in accordance with generally accepted accounting principles. A company’s internal control over financial reporting includes those policies and procedures that (i) pertain to the maintenance of records that, in reasonable detail, accurately and fairly reflect the transactions and dispositions of the assets of the company; (ii) provide reasonable assurance that transactions are recorded as necessary to permit preparation of financial statements in accordance with generally accepted accounting principles, and that receipts and expenditures of the company are being made only in accordance with authorizations of management and directors of the company; and (iii) provide reasonable assurance regarding prevention or timely detection of unauthorized acquisition, use, or disposition of the company’s assets that could have a material effect on the financial statements.
Because of its inherent limitations, internal control over financial reporting may not prevent or detect misstatements. Also, projections of any evaluation of effectiveness to future periods are subject to the risk that controls may become inadequate because of changes in conditions, or that the degree of compliance with the policies or procedures may deteriorate.
| /s/ PricewaterhouseCoopers LLP |
| PricewaterhouseCoopers LLP |
| New York, New York |
| February 25, 2010 |
45
Table of Contents
INTERNATIONAL FLAVORS & FRAGRANCES INC.
CONSOLIDATED STATEMENT OF INCOME
| Year Ended December 31, | ||||||||||||
| (DOLLARS IN THOUSANDS EXCEPT PER SHARE AMOUNTS) |
2009 | 2008 | 2007 | |||||||||
| Net sales |
$ | 2,326,158 | $ | 2,389,372 | $ | 2,276,638 | ||||||
| Cost of goods sold |
1,391,032 | 1,418,738 | 1,324,424 | |||||||||
| Research and development expenses |
193,843 | 209,295 | 196,893 | |||||||||
| Selling and administrative expenses |
376,541 | 381,841 | 375,287 | |||||||||
| Amortization of intangibles |
6,153 | 6,153 | 12,878 | |||||||||
| Curtailment loss |
— | — | 5,943 | |||||||||
| Restructuring and other charges, net |
18,301 | 18,212 | — | |||||||||
| Interest expense |
61,818 | 74,008 | 41,535 | |||||||||
| Other (income) expense, net |
1,921 | (2,797 | ) | (11,136 | ) | |||||||
| 2,049,609 | 2,105,450 | 1,945,824 | ||||||||||
| Income before taxes |
276,549 | 283,922 | 330,814 | |||||||||
| Taxes on income |
81,023 | 54,294 | 83,686 | |||||||||
| Net income |
195,526 | 229,628 | 247,128 | |||||||||
| Other comprehensive income: |
||||||||||||
| Foreign currency translation adjustments |
81,240 | (116,856 | ) | (1,136 | ) | |||||||
| Losses (gains) on derivatives qualifying as hedges |
1,091 | (1,989 | ) | 622 | ||||||||
| Pension and postretirement liability adjustment |
(28,200 | ) | (61,913 | ) | 53,039 | |||||||
| Comprehensive income |
$ | 249,657 | $ | 48,870 | $ | 299,653 | ||||||
| 2009 | 2008 | 2007 | ||||||||||
| Net income per share — basic |
$ | 2.48 | $ | 2.89 | $ | 2.84 | ||||||
| Net income per share — diluted |
$ | 2.46 | $ | 2.86 | $ | 2.81 | ||||||
See Notes to Consolidated Financial Statements
46
Table of Contents
INTERNATIONAL FLAVORS & FRAGRANCES INC.
CONSOLIDATED BALANCE SHEET
| December 31, | ||||||||
| (DOLLARS IN THOUSANDS) |
2009 | 2008 | ||||||
| ASSETS |
||||||||
| Current Assets: |
||||||||
| Cash and cash equivalents |
$ | 80,135 | $ | 178,467 | ||||
| Receivables: |
||||||||
| Trade |
454,528 | 412,127 | ||||||
| Allowance for doubtful accounts |
(10,263 | ) | (11,156 | ) | ||||
| Inventories |
444,977 | 479,567 | ||||||
| Deferred income taxes |
55,002 | 52,703 | ||||||
| Prepaid expenses and other current assets |
103,687 | 90,708 | ||||||
| Total Current Assets |
1,128,066 | 1,202,416 | ||||||
| Property, plant and equipment, net |
501,293 | 496,856 | ||||||
| Goodwill |
665,582 | 665,582 | ||||||
| Other intangible assets, net |
54,948 | 61,101 | ||||||
| Deferred income taxes |
129,720 | 131,653 | ||||||
| Other Assets |
165,165 | 192,305 | ||||||
| Total Assets |
$ | 2,644,774 | $ | 2,749,913 | ||||
| LIABILITIES AND SHAREHOLDERS’ EQUITY |
||||||||
| Current Liabilities: |
||||||||
| Bank borrowings, overdrafts and current portion of long-term debt |
$ | 76,780 | $ | 101,982 | ||||
| Accounts payable |
161,027 | 114,997 | ||||||
| Accrued payrolls and bonuses |
49,022 | 40,456 | ||||||
| Dividends payable |
19,786 | 19,666 | ||||||
| Deferred income taxes |
585 | 1,788 | ||||||
| Restructuring and other charges |
18,914 | 14,821 | ||||||
| Other current liabilities |
158,340 | 157,331 | ||||||
| Total Current Liabilities |
484,454 | 451,041 | ||||||
| Other Liabilities: |
||||||||
| Long-term debt |
934,749 | 1,153,672 | ||||||
| Deferred gains |
54,884 | 58,632 | ||||||
| Retirement liabilities |
240,950 | 276,231 | ||||||
| Other liabilities |
157,827 | 229,695 | ||||||
| Total Other Liabilities |
1,388,410 | 1,718,230 | ||||||
| Commitments and Contingencies (Note 16) |
||||||||
| Shareholders’ Equity: |
||||||||
| Common stock 12 1/2¢ par value; authorized 500,000,000 shares; issued 115,761,840 shares as of December 31, 2009 and 2008; and outstanding 79,157,393 and 78,661,062 shares as of December 31, 2009 and 2008 |
14,470 | 14,470 | ||||||
| Capital in excess of par value |
110,374 | 106,073 | ||||||
| Retained earnings |
2,339,205 | 2,222,641 | ||||||
| Accumulated other comprehensive (loss) income: |
||||||||
| Cumulative translation adjustment |
(68,606 | ) | (149,846 | ) | ||||
| Accumulated losses on derivatives qualifying as hedges |
(2,741 | ) | (3,832 | ) | ||||
| Pension and postretirement liability adjustment |
(199,627 | ) | (171,427 | ) | ||||
| 2,193,075 | 2,018,079 | |||||||
| Treasury stock, at cost — 36,604,447 and 37,100,778 shares as of December 31, 2009 and 2008 |
(1,424,072 | ) | (1,444,968 | ) | ||||
| Total Shareholders’ Equity |
769,003 | 573,111 | ||||||
| Noncontrolling interest |
2,907 | 7,531 | ||||||
| Total Shareholders’ Equity including noncontrolling interest |
771,910 | 580,642 | ||||||
| Total Liabilities and Shareholders’ Equity |
$ | 2,644,774 | $ | 2,749,913 | ||||
See Notes to Consolidated Financial Statements
47
Table of Contents
INTERNATIONAL FLAVORS & FRAGRANCES INC.
CONSOLIDATED STATEMENT OF CASH FLOWS
| Year Ended December 31, | ||||||||||||
| (DOLLARS IN THOUSANDS) |
2009 | 2008 | 2007 | |||||||||
| Cash flows from operating activities: |
||||||||||||
| Net income |
$ | 195,526 | $ | 229,628 | $ | 247,128 | ||||||
| Adjustments to reconcile to net cash provided by operating activities |
||||||||||||
| Depreciation and amortization |
78,525 | 75,986 | 82,788 | |||||||||
| Deferred income taxes |
(17,354 | ) | 7,261 | (6,343 | ) | |||||||
| Gain on disposal of assets |
(2,324 | ) | (2,160 | ) | (13,791 | ) | ||||||
| Equity based compensation |
19,652 | 17,246 | 18,168 | |||||||||
| Curtailment loss |
— | — | 5,943 | |||||||||
| Changes in assets and liabilities: |
||||||||||||
| Current receivables |
(27,380 | ) | (34,368 | ) | (21,107 | ) | ||||||
| Inventories |
47,090 | (19,736 | ) | (12,406 | ) | |||||||
| Current payables |
56,676 | (30,585 | ) | 22,298 | ||||||||
| Changes in other assets |
(85,809 | ) | (25,825 | ) | (40,759 | ) | ||||||
| Changes in other liabilities |
27,035 | 3,166 | 32,143 | |||||||||
| Net cash provided by operations |
291,637 | 220,613 | 314,062 | |||||||||
| Cash flows from investing activities: |
||||||||||||
| Additions to property, plant and equipment |
(66,819 | ) | (85,395 | ) | (65,614 | ) | ||||||
| Proceeds from disposal of assets |
1,784 | 2,848 | 16,959 | |||||||||
| Termination of net investment hedge |
(13,604 | ) | — | — | ||||||||
| Proceeds from investments |
— | — | 10,471 | |||||||||
| Purchase of investments |
(2,249 | ) | (7,198 | ) | (13,170 | ) | ||||||
| Net cash used in investing activities |
(80,888 | ) | (89,745 | ) | (51,354 | ) | ||||||
| Cash flows from financing activities: |
||||||||||||
| Cash dividends paid to shareholders |
(78,841 | ) | (74,865 | ) | (76,600 | ) | ||||||
| Net change in bank borrowings and overdrafts |
(37,292 | ) | 2,902 | (129,648 | ) | |||||||
| Net proceeds from long-term debt |
— | 139,167 | 498,569 | |||||||||
| Repayments of long-term debt |
(201,102 | ) | (139,364 | ) | — | |||||||
| Proceeds from issuance of stock under stock plans |
7,010 | 7,353 | 50,116 | |||||||||
| Excess tax benefits on share-based payments |
— | 133 | 6,568 | |||||||||
| Purchase of treasury stock |
(1,967 | ) | (29,995 | ) | (577,001 | ) | ||||||
| Net cash used in financing activities |
(312,192 | ) | (94,669 | ) | (227,996 | ) | ||||||
| Effect of exchange rate changes on cash and cash equivalents |
3,111 | (9,203 | ) | 2,251 | ||||||||
| Net change in cash and cash equivalents |
(98,332 | ) | 26,996 | 36,963 | ||||||||
| Cash and cash equivalents at beginning of year |
178,467 | 151,471 | 114,508 | |||||||||
| Cash and cash equivalents at end of year |
$ | 80,135 | $ | 178,467 | $ | 151,471 | ||||||
| Cash paid for: |
||||||||||||
| Interest |
$ | 70,847 | $ | 87,340 | $ | 36,017 | ||||||
| Taxes |
$ | 58,055 | $ | 50,280 | $ | 60,405 | ||||||
See Notes to Consolidated Financial Statements
48
Table of Contents
INTERNATIONAL FLAVORS & FRAGRANCES INC.
CONSOLIDATED STATEMENT OF SHAREHOLDERS’ EQUITY
| Common stock |
Capital in excess of par value |
Retained earnings |
Accumu- lated other comprehensive (loss) income |
Treasury stock | Noncontrolling Interest |
|||||||||||||||||||||
| (DOLLARS IN THOUSANDS) |
Shares | Cost | ||||||||||||||||||||||||
| Balance at December 31, 2006 |
$ | 14,470 | $ | 96,635 | $ | 1,909,599 | $ | (196,872 | ) | (26,344,638 | ) | $ | (918,664 | ) | $ | 10,888 | ||||||||||
| Net income |
247,128 | (1,726 | ) | |||||||||||||||||||||||
| FIN 48 adoption adjustment |
(1,325 | ) | ||||||||||||||||||||||||
| Cumulative translation adjustment |
(1,136 | ) | ||||||||||||||||||||||||
| Losses on derivatives qualifying as hedges |
622 | |||||||||||||||||||||||||
| Pension liability and postretirement adjustment; net of tax: $25,758 |
53,039 | |||||||||||||||||||||||||
| Cash dividends declared ($0.88 per share) |
(76,465 | ) | ||||||||||||||||||||||||
| Stock options |
4,121 | 1,332,595 | 48,483 | |||||||||||||||||||||||
| Reacquired shares |
(45,000 | ) | (10,198,877 | ) | (532,001 | ) | ||||||||||||||||||||
| Vested restricted stock units and awards |
(16,126 | ) | 234,388 | 7,874 | ||||||||||||||||||||||
| Stock based compensation |
15,365 | 209,920 | 7,450 | |||||||||||||||||||||||
| Balance at December 31, 2007 |
$ | 14,470 | $ | 54,995 | $ | 2,078,937 | $ | (144,347 | ) | (34,766,612 | ) | $ | (1,386,858 | ) | $ | 9,162 | ||||||||||
| Net income |
229,628 | (1,631 | ) | |||||||||||||||||||||||
| EITF 06-4 adoption adjustment; net of tax: $(5,529) |
(10,022 | ) | ||||||||||||||||||||||||
| Cumulative translation adjustment |
(116,856 | ) | ||||||||||||||||||||||||
| Losses on derivatives qualifying as hedges |
(1,989 | ) | ||||||||||||||||||||||||
| Pension liability and postretirement adjustment; net of tax: $(34,159) |
(61,913 | ) | ||||||||||||||||||||||||
| Cash dividends declared ($0.96 per share) |
(75,902 | ) | ||||||||||||||||||||||||
| Stock options |
(299 | ) | 157,376 | 6,295 | ||||||||||||||||||||||
| Reacquired shares |
45,000 | (2,762,058 | ) | (74,995 | ) | |||||||||||||||||||||
| Vested restricted stock units and awards |
(10,003 | ) | 165,277 | 6,826 | ||||||||||||||||||||||
| Stock based compensation |
16,380 | 105,239 | 3,764 | |||||||||||||||||||||||
| Balance at December 31, 2008 |
$ | 14,470 | $ | 106,073 | $ | 2,222,641 | $ | (325,105 | ) | (37,100,778 | ) | $ | (1,444,968 | ) | $ | 7,531 | ||||||||||
| Net income |
195,526 | (4,624 | ) | |||||||||||||||||||||||
| Cumulative translation adjustment |
81,240 | |||||||||||||||||||||||||
| Losses on derivatives qualifying as hedges |
1,091 | |||||||||||||||||||||||||
| Pension liability and postretirement adjustment; net of tax: $(8,876) |
(28,200 | ) | ||||||||||||||||||||||||
| Cash dividends declared ($1.00 per share) |
(78,962 | ) | ||||||||||||||||||||||||
| Stock options |
(1,294 | ) | 207,435 | 8,098 | ||||||||||||||||||||||
| Reacquired shares |
(75,000 | ) | (1,967 | ) | ||||||||||||||||||||||
| Vested restricted stock units and awards |
(13,026 | ) | 236,462 | 9,190 | ||||||||||||||||||||||
| Stock based compensation |
18,621 | 127,434 | 5,575 | |||||||||||||||||||||||
| Balance at December 31, 2009 |
$ | 14,470 | $ | 110,374 | $ | 2,339,205 | $ | (270,974 | ) | (36,604,447 | ) | $ | (1,424,072 | ) | $ | 2,907 | ||||||||||
See Notes to Consolidated Financial Statements
49
Table of Contents
INTERNATIONAL FLAVORS & FRAGRANCES INC.
NOTES TO CONSOLIDATED FINANCIAL STATEMENTS
| NOTE 1. | NATURE OF OPERATIONS AND SUMMARY OF SIGNIFICANT ACCOUNTING POLICIES |
Nature of Operations We are a leading creator and manufacturer of flavor and fragrance compounds used to impart or improve flavor or fragrance in a wide variety of consumer products. Our products are sold principally to manufacturers of perfumes and cosmetics, hair and other personal care products, soaps and detergents, cleaning products, dairy, meat and other processed foods, beverages, snacks and savory foods, confectionery, sweet and baked goods, and pharmaceutical and oral care products.
Fiscal Year End We have historically operated on a 52/53 week fiscal year ending on the Friday closest to the last day of the quarter. For ease of presentation, December 31 is utilized consistently throughout this report and these financial statements and notes to represent the period-end date.
Use of Estimates The preparation of financial statements in conformity with accounting principles generally accepted in the United States requires management to make estimates and assumptions that affect the reported amounts and accompanying disclosures. These estimates are based on management’s best knowledge of current events and actions we may undertake in the future. Actual results may ultimately differ from estimates.
Principles of Consolidation The consolidated financial statements include our accounts and those of our subsidiaries. Significant intercompany balances and transactions have been eliminated. To the extent a subsidiary is not wholly-owned, any related noncontrolling interest is included as a separate component of Shareholders’ Equity. Any applicable (income) expense attributable to the noncontrolling interest is included in Other (income) expense, net in the accompanying Consolidated Statement of Income due to its immateriality and, as such, is not included separately in comprehensive income.
Revenue Recognition We recognize revenue when the earnings process is complete. This generally occurs when (i) products are shipped to the customer in accordance with the terms of sale, (ii) title and risk of loss have been transferred and (iii) collection is reasonably assured. Net sales are reduced, at the time revenue is recognized, by accruing for applicable discounts, rebates and sales allowances based on historical experience. Related accruals are included in accrued liabilities.
Foreign Currency Translation We translate the assets and liabilities of non-U.S. subsidiaries into U.S. dollars at year-end exchange rates. Income and expense items are translated at average exchange rates during the year. Cumulative translation adjustments are shown as a separate component of Shareholders’ Equity.
Research and Development All research and development costs are expensed as incurred and are presented net of applicable R&D credits.
Cash Equivalents Cash equivalents include highly liquid investments with maturities of three months or less at date of purchase.
Inventories Inventories are stated at the lower of cost (on weighted average basis) or market. Our inventories consisted of the following:
| December 31, | ||||||
| (DOLLARS IN THOUSANDS) |
2009 | 2008 | ||||
| Raw materials |
$ | 228,999 | $ | 235,324 | ||
| Work in process |
9,173 | 10,975 | ||||
| Finished goods |
206,805 | 233,268 | ||||
| Total |
$ | 444,977 | $ | 479,567 | ||
50
Table of Contents
Property, Plant and Equipment Property, plant and equipment are recorded at cost. Depreciation is calculated on a straight-line basis, principally over the following estimated useful lives: buildings and improvements, 10 to 40 years; machinery and equipment, 3 to 10 years; information technology hardware and software, 3 to 7 years; and leasehold improvements which are included in buildings and improvements, the estimated life of the improvements or the remaining term of the lease, whichever is shorter. We periodically evaluate whether current events or circumstances indicate that the carrying value of our depreciable assets may not be recoverable.
We review our long-lived assets for impairment when events or changes in business conditions indicate that their full carrying value may not be recovered. An estimate of undiscounted future cash flows produced by an asset or group of assets is compared to the carrying value to determine whether impairment exists. If assets are determined to be impaired, the loss is measured based on an estimate of fair value using various valuation techniques, including a discounted estimate of future cash flows.
Goodwill and Other Intangible Assets Goodwill represents the difference between the total purchase price and the fair value of identifiable assets and liabilities acquired in business acquisitions.
We perform a goodwill impairment test on at least an annual basis or more frequently in certain circumstances, by assessing the fair value of our reporting units based upon both discounted cash flows and comparison of multiples of comparable companies. We deem goodwill to be impaired if the carrying amount of the reporting unit exceeds the estimated fair value. We completed our goodwill impairment assessment as of November 30, 2009, which indicated no impairment of goodwill.
Other intangible assets include patents, trademarks and other intellectual property valued at acquisition, and amortized on a straight-line basis over periods ranging from 6 to 20 years.
Income Taxes Deferred income taxes reflect the impact of temporary differences between the amount of assets and liabilities recognized for financial reporting purposes and such amounts recognized for tax purposes, based on tax laws as currently enacted. Additional taxes which would result from distributions by subsidiary companies to the parent are provided to the extent anticipated. No provision is made for additional taxes on undistributed earnings of subsidiary companies that are intended to be indefinitely invested in such subsidiaries. No income tax benefit is attributed to the currency translation component of Accumulated other comprehensive income (“AOCI”).
Retirement Benefits Current service costs of retirement plans and postretirement health care and life insurance benefits are accrued currently. Prior service costs resulting from plan improvements are amortized over periods ranging from 10 to 20 years.
Financial Instruments We use derivative financial instruments to manage interest and foreign currency exposures. The gain or loss on the hedging instrument is recorded in earnings at the same time as the transaction being hedged is recorded in earnings. The associated asset or liability related to the open hedge instrument is recorded in Current assets or Current liabilities, as applicable.
We record all derivative instruments on the balance sheet at fair value. Changes in a derivative’s fair value are recognized in earnings unless specific hedge criteria are met. If the derivative is designated as a fair value hedge, the changes in the fair value of the derivative and of the hedged item attributable to the hedged risk are recognized in the consolidated statement of earnings. If the derivative is designated as a cash flow hedge, the effective portions of changes in the fair value of the derivative are recorded in AOCI and are subsequently recognized in the consolidated statement of earnings when the hedged item affects earnings. Ineffective portions of changes in the fair value of cash flow hedges, if any, are recognized as a charge or credit to earnings.
51
Table of Contents
Software Costs We capitalize direct internal and external development costs for certain significant projects associated with internal-use software and amortize these costs over 7 years. Neither preliminary evaluation costs nor costs associated with the software after implementation are capitalized. Costs related to projects that are not significant are expensed as incurred.
Shipping and Handling Costs Net sales include shipping and handling charges billed to customers. Cost of goods sold includes all costs incurred in connection with shipping and handling.
Net Income Per Share Net income per share is based on the weighted average number of shares outstanding. A reconciliation of shares used in the computations of basic and diluted net income per share is as follows:
| Number of Shares | ||||||
| (SHARES IN THOUSANDS) |
2009 | 2008 | 2007 | |||
| Basic |
78,403 | 79,032 | 86,541 | |||
| Assumed dilution under stock plans |
691 | 691 | 987 | |||
| Diluted |
79,094 | 79,723 | 87,528 | |||
Net income used in the computation of net income per share is unaffected by the assumed issuance of stock under our stock plans.
Stock options and stock settled appreciation rights (“SSARs”) to purchase 283,000, 798,000 and 248,000 shares were outstanding at December 31, 2009, 2008 and 2007, respectively, but not included in the computation of diluted net income per share because the exercise prices were greater than the average market price of the common shares in the respective years.
We have issued shares of Purchased Restricted Stock (“PRS”) which contain nonforfeitable rights to dividends and thus are considered participating securities which are required to be included in the computation of basic and diluted earnings per share pursuant to the two-class method. We did not present the two-class method since the difference between basic and diluted net income per share for both common shareholders and PRS shareholders was less than $0.01 per share for each year and the number of PRS outstanding as of December 31, 2009, 2008 and 2007 was immaterial (approximately 0.6% of the total number of common shares outstanding). Net income allocated to such PRS during 2009, 2008 and 2007 was approximately $1.3 million, $1.4 million and $1.0 million, respectively. Diluted shares and net income per share for the years ended December 31, 2008 and 2007 have been adjusted to reflect the adoption of the new authoritative guidance described in this note below.
Stock-Based Compensation We have stock-based compensation plans which are described more fully in Note 11 to the Consolidated Financial Statements. We follow the provisions under Accounting Standards Codification 718 “Compensation — Stock Compensation” (“ASC 718”) which requires measurement of compensation cost of all share-based awards at fair value on the date of grant and recognition of compensation expense over the service periods for awards expected to vest. All share-based awards granted subsequent to January 1, 2006 are based on the grant date fair value estimated in accordance with the provisions of ASC 718. The cost of such share-based awards is recognized on a straight-line attribution basis over their respective vesting periods, net of estimated forfeitures.
New Accounting Standards
In June 2009, the Financial Accounting Standards Board (“FASB”) issued its FASB Accounting Standards Codification and the Hierarchy of Generally Accepted Accounting Principles (the “Codification” or “ASC”). The Codification became the single source of authoritative U.S. generally accepted accounting principles (“GAAP”) recognized by the FASB to be applied by nongovernmental entities. The Codification now supersedes then-existing accounting and reporting standards such as FASB Statements, FASB Staff Positions (“FSP”) and
52
Table of Contents
Emerging Issues Task Force Abstracts. The Codification, which was effective for our financial statements beginning with our third quarter of 2009, impacts only our financial statement reference disclosures and does not change application of GAAP.
In May 2009, the FASB issued authoritative guidance which sets forth general standards of accounting for and the disclosure of events that occur after the balance sheet date, but before financial statements are issued or are available to be issued. This guidance was effective beginning with our second quarter of 2009 and has not had a material impact on our Consolidated Financial Statements. In that regard, we have performed an evaluation of subsequent events through February 25, 2010, which is the date the financial statements were issued.
In April 2009, the FASB issued authoritative guidance requiring disclosures about the fair value of financial instruments in annual and interim reporting periods of publicly traded companies. The quarterly disclosures are intended to provide financial statement users with more timely information about the effects of current market conditions on an entity’s financial instruments that are not otherwise reported at fair value. This guidance was effective for interim reporting periods beginning with our second quarter of 2009. The adoption of this guidance had no impact on our financial position or results of operations.
As of December 31, 2009, we adopted new authoritative guidance which expands the disclosure requirements related to the plan assets of our defined benefit pension and other postretirement plans with the intent to provide users of financial statements with an enhanced understanding of: (i) how investment allocation decisions are made, including the investment policies and strategies used, (ii) the major categories of plan assets, (iii) the inputs and valuation techniques used to measure the fair value of plan assets, (iv) the effect of fair value measurements using significant unobservable inputs (Level 3) on changes in plan assets and (v) significant concentrations of risk within plan assets. The additional disclosures required by this guidance are included in Note 13.
As of January 1, 2009 we adopted new authoritative guidance issued by the FASB which requires us to classify our noncontrolling interest in consolidated subsidiaries (previously referred to as minority interest) as a separate component of Shareholders’ Equity. Through December 31, 2008, such noncontrolling interest had been included in Other liabilities in our Consolidated Balance Sheet. Any applicable (income) expense attributable to the noncontrolling interest is included in Other (income) expense, net in the accompanying Consolidated Statement of Income due to its immateriality and, as such, is not included separately in comprehensive income.
As of January 1, 2009 we adopted new authoritative guidance issued by the FASB which amends and expands previously required disclosure requirements about derivative instruments and hedging activities. The new guidance requires enhanced disclosures regarding the objectives and strategies for using derivatives, how derivative instruments are accounted for, and how derivative instruments and related hedged items affect an entity’s financial position, financial performance and cash flows. The adoption of the new guidance had no impact on our financial position or results of operations. The additional disclosures required by this guidance are included in Note 14.
As of January 1, 2009 we adopted new authoritative guidance issued by the FASB related to “participating securities granted in share-based payment transactions”. This guidance considers unvested share-based payment awards that contain nonforfeitable rights to dividends or dividend equivalents (whether paid or unpaid) as participating securities and requires them to be included in the computation of basic earnings per share pursuant to the two-class method described in the Codification. The adoption of this guidance did not have a material impact on our Consolidated Financial Statements and is explained in detail above.
Reclassifications and Revisions Certain reclassifications have been made to the prior years’ financial statements to conform to the 2009 presentation. In addition, as a result of the adoption of new guidance related to the “noncontrolling interests” as discussed above, we reclassified Noncontrolling interest of $7.5 million from Other liabilities to a separate component of Shareholders’ Equity in the Consolidated Balance Sheet. The
53
Table of Contents
Company also revised its method of reporting R&D credits to be properly reflected as a reduction in R&D expense versus a reduction in income tax expense. The revision impacted the first nine months of 2009 and the twelve month periods ended December 31, 2008 and 2007. The revisions had no impact on net income in any period. The associated amounts for 2007, 2008 and the first nine months of 2009 were: $2.1 million, $3.4 million and $4.7 million, respectively.
NOTE 2. RESTRUCTURING AND OTHER CHARGES
During the second quarter 2009, the Company recorded a net pre-tax charge of $4.1 million which included $6.6 million for severance and related costs associated with the elimination of approximately 70 positions globally, offset by a $2.5 million reduction to previously recorded provisions. The reduction in prior reserves was attributable to lower estimated benefit costs on severance paid as well as fewer position eliminations requiring severance.
During September 2009, as part of the rationalization of our European fragrance manufacturing footprint, the Company announced that it had initiated a collective consultation process with employees regarding the closure of its Fragrances compounding facility in Drogheda, Ireland, as well as the partial closure of its Fragrance Ingredients plant in Haverhill, UK. The Company has completed both consultation processes and has communicated its intent to proceed with the closures. The Company has now completed the negotiations with the Haverhill employee representatives and is actively engaged in the negotiation process with the employee representatives in Ireland to determine actual employee separation benefits.
As a result of these plans, approximately 140 employees will be terminated. During the third and fourth quarters of 2009, the Company recorded a provision for severance costs of $12.2 million to “Restructuring and other charges” in our Consolidated Statement of Income, based on reasonable expectations of separation benefits. We expect to conclude the negotiations in early 2010 and will record any necessary adjustment then. The Company also recorded $1.0 million of accelerated depreciation on certain related assets and other restructuring related costs. Other restructuring costs discussed above will be recorded as incurred as the Company moves forward with implementation. In addition, as part of our continual focus to optimize our European operations, the Flavors segment recorded a provision for severance costs of $1.0 million in the fourth quarter of 2009.
We expect to incur total costs related to this restructuring plan of approximately $22-$29 million, consisting primarily of $11-$15 million of employee termination costs, $8-$10 million in plant shutdown and business transition costs and $3-$4 million in asset impairments and/or accelerated depreciation of related fixed assets.
In 2008, as part of our business transformation initiative to enable us to better leverage our global SAP software platform, we implemented a plan to centralize transaction processing in a global shared service structure that resulted in the elimination of 127 positions globally, largely in the finance area. As a result of these actions, we recognized a pre-tax charge of approximately $7 million in 2008 related to employee separation costs and $2 million in implementation costs. The implementation costs were included in selling and administrative expenses in 2008. In addition, we incurred a pre-tax charge of $12 million in the fourth quarter 2008 principally related to a performance improvement plan covering 91 positions across a variety of activities globally.
The balance of the employee-related liabilities is expected to be utilized by the end of 2011 as obligations are satisfied.
54
Table of Contents
Movements in related accruals were:
| (DOLLARS IN THOUSANDS) |
Employee- Related |
Asset- Related and Other |
Total | |||||||||
| Balance January 1, 2007 |
$ | 12,861 | $ | 2,427 | $ | 15,288 | ||||||
| Cash and other costs |
(10,273 | ) | (2,361 | ) | (12,634 | ) | ||||||
| Balance December 31, 2007 |
2,588 | 66 | 2,654 | |||||||||
| Additional charges, net of reversal |
18,212 | — | 18,212 | |||||||||
| Cash and other costs |
(6,045 | ) | — | (6,045 | ) | |||||||
| Balance December 31, 2008 |
14,755 | 66 | 14,821 | |||||||||
| Additional charges, net of reversal |
17,263 | 1,038 | 18,301 | |||||||||
| Cash and other costs |
(13,104 | ) | (1,104 | ) | (14,208 | ) | ||||||
| Balance December 31, 2009 |
$ | 18,914 | $ | — | $ | 18,914 | ||||||
NOTE 3. PROPERTY, PLANT AND EQUIPMENT, NET
| Cost | ||||||
| Asset Type (DOLLARS IN THOUSANDS) |
December 31, | |||||
| 2009 | 2008 | |||||
| Land |
$ | 28,223 | $ | 25,467 | ||
| Buildings and Improvements |
271,970 | 234,746 | ||||
| Machinery and Equipment |
688,007 | 635,138 | ||||
| Information Technology |
225,079 | 219,656 | ||||
| CIP |
52,606 | 56,901 | ||||
| Total |
$ | 1,265,885 | $ | 1,171,908 | ||
| Accumulated Depreciation | ||||||
| Asset Type (DOLLARS IN THOUSANDS) |
December 31, | |||||
| 2009 | 2008 | |||||
| Buildings and Improvements |
$ | 115,031 | $ | 99,449 | ||
| Machinery and Equipment |
456,325 | 400,517 | ||||
| Information Technology |
193,236 | 175,086 | ||||
| Total |
$ | 764,592 | $ | 675,052 | ||
| Net | ||||||
| Asset Type (DOLLARS IN THOUSANDS) |
December 31, | |||||
| 2009 | 2008 | |||||
| Land |
$ | 28,223 | $ | 25,467 | ||
| Buildings and Improvements |
156,939 | 135,297 | ||||
| Machinery and Equipment |
231,682 | 234,621 | ||||
| Information Technology |
31,843 | 44,570 | ||||
| CIP |
52,606 | 56,901 | ||||
| Total |
$ | 501,293 | $ | 496,856 | ||
55
Table of Contents
NOTE 4. GOODWILL AND OTHER INTANGIBLE ASSETS, NET
Goodwill by operating segment for both 2009 and 2008 is as follows:
| DOLLARS IN THOUSANDS |
Amount | ||
| Flavors |
$ | 319,479 | |
| Fragrances |
346,103 | ||
| Total |
$ | 665,582 | |
Trademark and other intangible assets consist of the following amounts:
| December 31, | ||||||
| DOLLARS IN THOUSANDS |
2009 | 2008 | ||||
| Gross carrying value |
$ | 165,406 | $ | 165,406 | ||
| Accumulated amortization |
110,458 | 104,305 | ||||
| Total |
$ | 54,948 | $ | 61,101 | ||
Amortization expense for the years ended December 31, 2009 and 2008 was $6 million and for the year ended December 31, 2007 was $13 million. Estimated annual amortization is $6 million from years 2010 through 2013 and $5 million for 2014.
NOTE 5. OTHER ASSETS
Other assets consist of the following amounts:
| December 31, | ||||||
| (DOLLARS IN THOUSANDS) |
2009 | 2008 | ||||
| Pension assets |
$ | 61,881 | $ | 98,815 | ||
| Other |
103,284 | 93,490 | ||||
| Total |
$ | 165,165 | $ | 192,305 | ||
NOTE 6. OTHER CURRENT LIABILITIES
Other current liabilities consist of the following amounts:
| December 31, | ||||||
| (DOLLARS IN THOUSANDS) |
2009 | 2008 | ||||
| Workers compensation and general liability |
$ | 21,111 | $ | 22,383 | ||
| Interest payable |
17,993 | 21,569 | ||||
| Current pension and other retiree accruals |
7,946 | 6,961 | ||||
| Rebates and incentives |
7,147 | 5,490 | ||||
| Commissions and professional fees payable |
5,568 | 7,452 | ||||
| Other |
98,575 | 93,476 | ||||
| Total |
$ | 158,340 | $ | 157,331 | ||
NOTE 7. SALE AND LEASEBACK TRANSACTIONS
In connection with the disposition of certain real estate in prior years, we entered into long-term operating leases covering the facilities disposed of. The leases are classified as operating leases in accordance with ASC 840, “Leases” and the gains realized have been deferred and are being credited to income over the initial lease
56
Table of Contents
term. Such deferred gains totaled $59 million and $62 million at December 31, 2009 and 2008, respectively, of which $55 million and $59 million, respectively, are reflected in the accompanying balance sheet under the caption Deferred gains, with the remainder included as a component of Other current liabilities.
NOTE 8. BORROWINGS
Debt consists of the following at December 31:
| (DOLLARS IN THOUSANDS) |
Rate | Maturities | 2009 | 2008 | ||||||
| Bank borrowings and overdrafts |
$ | 76,780 | $ | 51,982 | ||||||
| Current portion of long-term debt |
— | 50,000 | ||||||||
| Total current debt |
76,780 | 101,982 | ||||||||
| Senior Notes — 2007 |
6.38% | 2017-27 | 500,000 | 500,000 | ||||||
| Senior Notes — 2006 |
6.06% | 2011-16 | 325,000 | 325,000 | ||||||
| Bank borrowings |
0.43% | 2012 | 75,166 | 141,575 | ||||||
| Japanese Yen loan — 2008 |
— | 149,758 | ||||||||
| Japanese Yen notes |
2.81% | 2011 | 19,614 | 20,422 | ||||||
| Other |
16 | 24 | ||||||||
| Deferred realized gains on interest rate swaps |
14,953 | 16,893 | ||||||||
| Total long-term debt |
934,749 | 1,153,672 | ||||||||
| Total debt |
$ | 1,011,529 | $ | 1,255,654 | ||||||
Commercial paper issued by us generally has terms of 30 days or less. However, there were no outstanding commercial paper borrowings at December 31, 2009 or 2008.
In November 2008, we entered into a credit agreement denominated in Japanese Yen in the original principal amount of ¥13.3 billion due on November 21, 2011 (“Japanese Yen Loan — 2008”). We used the proceeds of this loan to repay our then existing 2.400% (Japanese Yen) Guaranteed Senior Notes, Series A, which matured on such date. The Japanese Yen Loan — 2008 bears interest at a rate based on the TIBOR (Tokyo InterBank Offering Rate) plus an applicable margin as determined based on our credit rating.
We regularly assess our capital structure, including both current and long-term debt instruments, as compared to our cash generation and investment needs in order to provide ample flexibility. In that connection, in December 2009 we prepaid, without penalties, the remaining outstanding balance (approximately $151 million) of our Japanese Yen loan — 2008.
In 2005, IFF, including certain subsidiaries, entered into a revolving credit agreement (the “Facility”) with certain banks. The Facility provides for a five-year US $350 million (“Tranche A”) and Euro 400 million (“Tranche B”) multi-currency revolving credit facility. Tranche A is available to IFF for commercial paper backstop and general corporate purposes; Tranche B is available to both IFF and the European subsidiaries for general corporate purposes. Borrowings under the Facility bear interest at an annual rate of LIBOR (London InterBank Offer Rate) (or in relation to any Euro-denominated loans, EURIBOR, European InterBank Offer Rate) plus a margin, currently 25 basis points, linked to our credit rating. We pay a commitment fee on the aggregate unused commitments and a utilization fee based on amounts outstanding under the Facility; such fees are not material. As permitted by the Facility, in 2007, the termination dates were extended until November 23, 2012. The Facility contains various affirmative and negative covenants, including the requirement for us to maintain, at the end of each fiscal quarter, a ratio of net debt for borrowed money to adjusted EBITDA (Earnings Before Interest, Taxes, Depreciation and Amortization) in respect of the previous 12-month period of not more than 3.25 to 1. We have complied with this covenant at all times. As the Facility is a multi-year revolving credit agreement, we classify the portion we expect to have outstanding longer than 12 months as long-term debt. At December 31, 2009, approximately $75 million of bank borrowings on the Tranche B was classified as long-term debt, and the remaining $76 million was classified as current portion of long-term debt.
57
Table of Contents
Short-term bank loans primarily in the form of overdrafts, in addition to the Facility, were outstanding in several countries and averaged $47 million in 2009, compared with $19 million in 2008. The highest levels were $116 million in 2009, $52 million in 2008, and $66 million in 2007. The 2009 weighted average interest rate of these bank loans, based on balances outstanding at the end of each month, was 2.7% and the average rate on balances outstanding at December 31, 2009 was 1.4%. These rates compare with 4.8% and 6.0%, respectively, in 2008, and 4.6% and 5.1%, respectively, in 2007.
On September 27, 2007, we issued $500 million of Senior Unsecured Notes (“Senior Notes — 2007”) in four series under the Note Purchase Agreement (“NPA”): (i) $250 million in aggregate principal amount of 6.25% Series A Senior Notes due September 27, 2017, (ii) $100 million in aggregate principal amount of 6.35% Series B Notes due September 27, 2019, (iii) $50 million in aggregate principal amount of 6.50% Series C Notes due September 27, 2022, and (iv) $100 million in aggregate principal amount of 6.79% Series D Notes due September 27, 2027. Proceeds of the offering were used primarily to fund an accelerated repurchase of IFF stock.
In 2006, we issued $375 million of Senior Unsecured Notes (“Senior Notes — 2006”) in four series under another NPA: (i) $50 million in aggregate principal amount of 5.89% Series A Senior Notes due July 12, 2009, (ii) $100 million in aggregate principal amount of 5.96% Series B Notes due July 12, 2011, (iii) $100 million in aggregate principal amount of 6.05% Series C Notes due July 12, 2013, and (iv) $125 million in aggregate principal amount of 6.14% Series D Notes due July 12, 2016. Proceeds of the offering were used primarily to repay commercial paper borrowings used to fund our maturing debt. In July 2009 we repaid $50 million in principal in the first series under the Senior Notes — 2006 that became due.
Maturities on debt outstanding at December 31, 2009 are: 2010, $77 million; 2011, $120 million; 2012, $75 million; 2013, $100 million; 2015 and thereafter, $625 million. There is no debt maturing in 2014.
The estimated fair value at December 31, 2009 of our Senior Notes — 2007 and Senior Notes — 2006 was approximately $540 million and $350 million, respectively. At December 31, 2009 the fair value of our senior notes was calculated using discounted cash flows applying current interest rates and current credit spreads based on our own credit risk. The estimated fair value of the remainder of our long-term debt at December 31, 2009 approximated the carrying value.
The estimated fair value of our long-term debt at December 31, 2008 approximated the recorded value, except that our Senior Notes — 2007 had an estimated fair value of approximately $450 million at December 31, 2008. The fair value of our long-term debt was calculated using discounted cash flows applying interest rates of recent issuances of debt with similar terms and maturities for companies with comparable credit risk.
In 2002, we entered into certain interest rate swap agreements effectively converting the fixed rate on our long-term Japanese Yen borrowings to a variable short-term rate based on the Japanese Yen TIBOR rate plus a markup. These swaps were designated as qualified fair value hedges. Prior to 2006 we amended the swaps and the counterparty paid us amounts aggregating $4 million, including accrued interest. Such gains have been deferred and are being amortized over the remaining term of the debt. In November 2008, the portion of these swaps related to the 13.3 billion Yen notes refinanced expired.
In March 2008, we realized an $18 million gain on the termination of an interest rate swap, which has been deferred and is being amortized as a reduction to interest expense over the remaining term of the related debt. The balance of this deferred gain was $15 million at December 31, 2009.
58
Table of Contents
NOTE 9. INCOME TAXES
Earnings before income taxes consisted of the following:
| (DOLLARS IN THOUSANDS) |
2009 | 2008 | 2007 | |||||||||
| U.S. loss before taxes |
$ | (80,345 | ) | $ | (90,819 | ) | $ | (53,159 | ) | |||
| Foreign income before taxes |
356,894 | 374,741 | 383,973 | |||||||||
| Total income before taxes |
$ | 276,549 | $ | 283,922 | $ | 330,814 | ||||||
The income tax provision consisted of the following:
| (DOLLARS IN THOUSANDS) |
2009 | 2008 | 2007 | |||||||||
| Current |
||||||||||||
| Federal |
$ | 3,829 | $ | (8,363 | ) | $ | 9,315 | |||||
| State and local |
413 | (94 | ) | (1,417 | ) | |||||||
| Foreign |
94,135 | 55,490 | 82,131 | |||||||||
| 98,377 | 47,033 | 90,029 | ||||||||||
| Deferred |
||||||||||||
| Federal |
(13,817 | ) | 1,634 | (13,648 | ) | |||||||
| State and local |
6,845 | (1,766 | ) | (1,047 | ) | |||||||
| Foreign |
(10,382 | ) | 7,393 | 8,352 | ||||||||
| (17,354 | ) | 7,261 | (6,343 | ) | ||||||||
| Total income taxes |
$ | 81,023 | $ | 54,294 | $ | 83,686 | ||||||
A reconciliation between the U.S. Federal statutory income tax rate to our actual effective tax rate follows:
| 2009 | 2008 | 2007 | |||||||
| Statutory tax rate |
35.0 | % | 35.0 | % | 35.0 | % | |||
| Difference in effective tax rate on foreign earnings and remittances |
(8.0 | ) | (15.0 | ) | (8.7 | ) | |||
| State and local taxes |
1.7 | (0.7 | ) | (0.6 | ) | ||||
| Other, net |
0.6 | (1) | (0.2 | ) | (0.4 | ) | |||
| Effective tax rate |
29.3 | % | 19.1 | % | 25.3 | % | |||
| (1) | The 2009 results include $6 million of tax expense due to the recognition of out-of-period tax adjustments arising from periods 2006 and prior. The Company did not adjust the prior periods as it concluded that such adjustments were not material to the prior periods’ consolidated financial statements. |
Our effective tax rate reflects the benefit from having significant operations outside the U.S. that are taxed at rates that are lower than the U.S. federal rate of 35%. The 2009 and 2008 effective tax rates were also favorably impacted by the reversals of previously established tax accruals of $2 million and $26 million, respectively.
59
Table of Contents
The components of the deferred tax assets and liabilities included on the balance sheet are as follows:
| December 31, | ||||||||
| (DOLLARS IN THOUSANDS) |
2009 | 2008 | ||||||
| ASSETS |
||||||||
| Employee and retiree benefits |
$ | 116,471 | $ | 130,009 | ||||
| Credit and net operating loss carryforwards |
209,161 | 180,038 | ||||||
| Property, plant and equipment |
2,559 | 3,557 | ||||||
| Trademarks and other |
29,508 | — | ||||||
| Other, net |
16,302 | 23,793 | ||||||
| Gross deferred tax assets |
374,001 | 337,397 | ||||||
| Valuation allowance |
(212,705 | ) | (178,921 | ) | ||||
| Total deferred tax assets |
161,296 | 158,476 | ||||||
| LIABILITIES |
||||||||
| Trademarks and other |
— | (13,009 | ) | |||||
| Total net deferred tax assets |
$ | 161,296 | $ | 145,467 | ||||
In 2007, we adopted guidance in ASC 740 “Income Taxes”. As a result, we recognized a $1 million increase in other liabilities for unrecognized tax benefits and a corresponding cumulative effect adjustment to Retained earnings. Amounts receivable from various tax jurisdictions have been reclassified to Other liabilities.
A reconciliation of the beginning and ending amount of unrecognized tax benefits is as follows:
| (DOLLARS IN THOUSANDS) |
2009 | 2008 | 2007 | |||||||||
| Balance of unrecognized tax benefits at beginning of year |
$ | 57,616 | $ | 80,645 | $ | 71,968 | ||||||
| Gross amount of increases in unrecognized tax benefits as a result of positions taken during a prior year |
— | 4,265 | 7,941 | |||||||||
| Gross amount of decreases in unrecognized tax benefits as a result of positions taken during a prior year |
(26 | ) | (2,200 | ) | (5,756 | ) | ||||||
| Gross amount of increases in unrecognized tax benefits as a result of positions taken during the current year |
8,827 | 8,394 | 13,117 | |||||||||
| The amounts of decreases in unrecognized benefits relating to settlements with taxing authorities |
(509 | ) | (31,877 | ) | (6,549 | ) | ||||||
| Reduction in unrecognized tax benefits due to the lapse of applicable statute of limitation |
(1,235 | ) | (1,611 | ) | (76 | ) | ||||||
| Balance of unrecognized tax benefits at end of year |
$ | 64,673 | $ | 57,616 | $ | 80,645 | ||||||
At December 31, 2009, 2008 and 2007, there are $65 million, $57 million and $79 million, respectively, of unrecognized tax benefits that if recognized, would affect the annual effective tax rate.
We have consistently recognized interest and penalties related to unrecognized tax benefits as a component of income tax expense. For the years ended December 31, 2009, 2008 and 2007 we recognized (reversed) $2 million, $(1) million and $3 million, respectively in interest and penalties. At December 31, 2009, 2008 and 2007, we had accrued $10 million, $8 million and $9 million, respectively, of interest and penalties classified as Other liabilities.
Net operating loss carryforwards were $173 million and $172 million at December 31, 2009 and 2008, respectively. If unused, $3 million will expire between 2010 and 2029. The remainder, totaling $170 million, may be carried forward indefinitely. Tax credit carryforwards were $36 million and $8 million at December 31, 2009 and December 31, 2008, respectively. If unused, the credit carryforwards will expire between 2010 and 2029.
60
Table of Contents
Of the $209 million deferred tax asset for net operating loss carryforwards and credits at December 31, 2009, we consider it unlikely that a portion of the tax benefit will be realized. Accordingly, a valuation allowance of $161 million of net operating loss carryforwards and $6 million of tax credits has been established against these deferred tax assets, respectively. In addition, due to realizability concerns, we established a valuation allowance against certain other net deferred tax assets of $46 million.
Tax benefits credited to Shareholders’ equity totaled less than $1 million for 2009 and 2008.
U.S. income taxes and foreign withholding taxes associated with the repatriation of earnings of foreign subsidiaries were not provided on a cumulative total of $963 million of undistributed earnings of foreign subsidiaries. We intend to reinvest these earnings indefinitely in our foreign subsidiaries.
We have several tax audits in process and have open tax years with various significant taxing jurisdictions that range primarily from 2002 to 2008. Based on currently available information, we do not believe the ultimate outcome of these tax audits and other tax positions related to open tax years, when finalized, will have a material adverse effect on our financial position, results of operations or cash flows.
NOTE 10. SHAREHOLDERS’ EQUITY
On March 9, 2000, we adopted a shareholder protection rights agreement (the “Rights Agreement”) and declared a dividend of one right on each share of common stock outstanding on March 24, 2000 or issued thereafter.
Under the Rights Agreement, as amended, until a person or group acquires 15% or more of our common stock or commences a tender offer that would result in such person’s or group’s owning 15% or more, the rights are evidenced by the common stock certificates, automatically trade with the common stock and are not exercisable.
Thereafter, if we are involved in a merger or sell more than 50% of our assets or earnings power, each right entitles its holder to purchase a certain number of shares for a specified exercise price. Also, under certain circumstances, our Board has the option to redeem or exchange one share of common stock for each right. Finally, in the event a new Board is elected in a successful proxy contest, (i) the rights may not be redeemed and no business combination with us can be effected for 180 days thereafter unless certain procedures are followed to ensure (A) that steps are taken to maximize shareholder value, or (B) that any decision to redeem the rights, if challenged, would meet an “entire fairness” test; and (ii) the Rights Agreement may not be amended during such 180-day period. To establish “entire fairness” in connection with a redemption, the new Board must be able to demonstrate that all aspects of the redemption decision were fair, including the redemption procedure and the financial terms of the redemption. The Rights Agreement expires in March 2010.
Dividends declared per share were $1.00, $0.96 and $0.88 in 2009, 2008 and 2007, respectively.
NOTE 11. STOCK COMPENSATION PLANS
We have various equity plans under which our officers, senior management, other key employees and directors may be granted options to purchase IFF common stock or other forms of equity-based awards. Beginning in 2004, we granted Restricted Stock Units (“RSU’s”) as the principal element of our equity compensation for all eligible U.S. — based employees and a majority of eligible overseas employees. Vesting of the RSU’s is solely time based; the vesting period is primarily three years from date of grant. For a small group of employees, primarily overseas, we had granted stock options prior to 2008.
The cost of all employee share based awards are principally recognized on a straight-line attribution basis over their respective vesting periods, net of estimated forfeitures. Total stock-based compensation expense included in our Consolidated Statement of Income for 2009, 2008 and 2007 was $20 million ($13 net of tax), $17 million ($11 net of tax) and $18 million ($12 net of tax), respectively.
61
Table of Contents
Under our 2000 Stock Award and Incentive Plan (“2000 SAIP”) the issuance of 9 million shares was authorized by the Board and approximately 2 million shares available under a previous plan were rolled into the 2000 SAIP making the total number of available shares approximately 11 million to satisfy awards. At December 31, 2009, 3,226,671 shares were subject to outstanding awards and 825,965 shares remained available for future awards.
In 2006, our Board approved a Long-Term Incentive Plan (“LTIP”) for senior management under our 2000 SAIP for the years 2006-2008 (“Cycle VI”). Under Cycle VI, each participant has a range of awards that would be paid out 50% in cash and 50% in IFF stock at the end of the three-year cycle. The portion that would be paid in equity would not be determined until the end of the LTIP cycle. Because the number of shares is not fixed at the time of the award we account for these awards as liability based awards and recognize compensation expense on a straight-line basis over the three-year period based on the fair value of our stock at the end of each year and the expected payout based on the percent of performance achieved to date. Cycle VI concluded at the end of 2008 and an aggregate 116,247 shares of common stock were issued in February 2009.
Beginning with the LTIP 2007-2009 cycle and thereafter, the targeted payout is 50% cash and 50% IFF stock at the end of the three-year cycle and provides for segmentation in which one-fourth of the award vests during each twelve-month period, with the final one-fourth segment vesting over the full three-year period. These awards are earned based on the achievement of defined EPS targets and our performance ranking of total shareholder return as a percentile of the S&P 500. When the award is granted, 50% of the target dollar value of the award is converted to a number of “notional” shares based on the closing price at the beginning of the cycle. Because the award vests over the three-year cycle, the graded-vesting attribution method is used to recognize compensation expense over the cycle. The 2007-2009 cycle (Cycle VII) concluded at the end of 2009 and an aggregate 53,378 shares of our common stock were issued in February 2010.
In 2006, our Board approved the Equity Choice Program (the “Program”) for senior management under our 2000 SAIP. Under the Program, eligible employees can choose from among three equity alternatives and will be granted such equity awards up to certain dollar awards depending on the participant’s grade level. A participant may choose among (1) SSAR’s, (2) RSU’s or (3) PRS’s. Certain other employees who are not eligible under the Program receive RSU’s.
Stock Options and SSAR’s
Stock options granted vest in periods ranging from one to three years and have a maximum term of ten years. SSAR’s become exercisable on the third anniversary of the grant date and have a maximum term of seven years. We awarded 236,986 and 299,307 SSAR’s during 2009 and 2008, respectively. No stock options were granted in 2009 and 2008. In 2007 we awarded stock options and SSAR’s of 188,000 and 66,493, respectively.
We use the Binomial lattice-pricing as our valuation model for estimating the fair value of options granted. In applying the Binomial model, we utilize historical information to estimate expected term and forfeitures within the model. The expected term of an option is based on historical employee exercise behavior, vesting terms and a contractual life of primarily ten years for options and seven years for SSAR’s. The risk-free interest rate for periods within the expected term of the award is based on the U.S. Treasury yield curve in effect at the time of grant. Expected volatility is based on an average of implied and historical volatility of the price of our common stock over the calculated expected term. We anticipate paying cash dividends in the future and therefore use an expected dividend yield in the valuation model; the cash dividend in effect at the time of grant was employed in this calculation.
62
Table of Contents
Principal assumptions used in applying the Binomial model in 2009, 2008 and 2007 were:
| 2009 | 2008 | 2007 | |||||||
| Weighted average fair value of SSAR’sgranted during the period |
$ | 7.08 | $ | 9.93 | $ | 11.50 | |||
| Assumptions: |
|||||||||
| Risk-free interest rate |
2.5% | 3.2% | 4.7% | ||||||
| Expected volatility |
30.9% | 25.7% | 21.7% | ||||||
| Expected dividend yield |
3.2% | 2.2% | 1.6% | ||||||
| Expected life, in years |
5 | 5 | 5 | ||||||
| Termination rate |
0.91% | 0.46% | 0.40% | ||||||
| Exercise multiple |
1.46 | 1.52 | 1.35 | ||||||
Stock option and SSAR activity was as follows:
| (SHARE AMOUNTS IN THOUSANDS) |
Shares Subject to Options/SSAR’s |
Weighted Average Exercise Price |
Options/ SSAR’s Exercisable | |||||
| Balance at December 31, 2008 |
2,422 | $ | 35.86 | 1,625 | ||||
| Granted |
237 | 26.54 | ||||||
| Exercised |
(171 | ) | 32.88 | |||||
| Cancelled |
(260 | ) | 38.43 | |||||
| Balance at December 31, 2009 |
2,228 | $ | 35.27 | 1,763 | ||||
The weighted average exercise price of our options and SSAR’s exercisable at December 31, 2009, 2008 and 2007 were $34.20, $33.48, and $33.21, respectively. The following tables summarize information concerning currently outstanding and exercisable options and SSAR’s:
Stock options and SSAR’s outstanding at December 31, 2009 were as follows:
| Price Range |
Number Outstanding (in thousands) |
Weighted Average Remaining Contractual Life (in years) |
Weighted Average Exercise Price |
Aggregate Intrinsic Value (in thousands) | ||||||
| $15 – $25 |
1 | 0.9 | $ | 17.94 | ||||||
| $26 – $30 |
622 | 4.5 | 29.57 | |||||||
| $31 – $35 |
939 | 3.7 | 33.65 | |||||||
| $36 – $40 |
242 | 6.5 | 36.89 | |||||||
| $41 – $45 |
235 | 7.6 | 42.17 | |||||||
| $46 – $55 |
189 | 7.4 | 51.43 | |||||||
| 2,228 | $ | 35.27 | $ | 15,276 | ||||||
63
Table of Contents
Stock options and SSAR’s exercisable as of December 31, 2009 were as follows:
| Price Range |
Number Outstanding (in thousands) |
Weighted Average Remaining Contractual Life (in years) |
Weighted Average Exercise Price |
Aggregate Intrinsic Value (in thousands) | ||||||
| $15 – $25 |
1 | 0.9 | $ | 17.94 | ||||||
| $26 – $30 |
457 | 2.8 | 29.24 | |||||||
| $31 – $35 |
939 | 3.7 | 33.65 | |||||||
| $36 – $40 |
206 | 6.0 | 37.03 | |||||||
| $41 – $45 |
58 | 5.2 | 42.12 | |||||||
| $46 – $55 |
102 | 7.4 | 51.35 | |||||||
| 1,763 | $ | 34.20 | $ | 13,345 | ||||||
The total intrinsic value of options exercised during 2009, 2008 and 2007 totaled $1 million, $2 million, and $23 million, respectively.
As of December 31, 2009, there was $2.4 million of total unrecognized compensation cost related to non-vested stock options and SSAR awards granted; such cost is expected to be recognized over a weighted average period of 1.8 years.
Restricted Stock Units
We have granted RSU’s to eligible employees. Such RSU’s are subject to forfeiture if certain employment conditions are not met. RSU’s principally vest 100% at the end of three years and contain no performance criteria provisions. An RSU’s fair value is calculated based on the market price of our stock at date of grant, with an adjustment to reflect the fact that such awards do not participate in dividend rights. The aggregate fair value is amortized to expense ratably over the vesting period.
RSU activity was as follows:
| (SHARE AMOUNTS IN THOUSANDS) |
Number of Shares |
Weighted-Average Grant Date Fair Value Per Share | ||||
| Balance at December 31, 2008 |
893 | $ | 40.09 | |||
| Granted |
474 | 30.57 | ||||
| Vested |
(327 | ) | 34.19 | |||
| Forfeited |
(62 | ) | 38.49 | |||
| Balance at December 31, 2009 |
978 | $ | 37.42 | |||
The total fair value of RSU’s which vested during the year ended December 31, 2009 was $10 million.
As of December 31, 2009, there was $16 million of total unrecognized compensation cost related to non-vested RSU awards granted under the equity incentive plans; such cost is expected to be recognized over a weighted average period of 2.0 years.
Purchased Restricted Stock
PRS provides for eligible employees to purchase restricted shares of IFF stock at 50% of the fair market value on the grant date of the award. The shares generally vest on the third anniversary of the grant date, are subject to employment and other specified conditions, and pay dividends if and when paid by us. Holders of PRS have, in most instances, all of the rights of stockholders, except that they may not sell, assign, pledge or otherwise encumber such shares. RSU’s provide no such rights. We issued 218,134 shares of PRS in 2009 for an aggregate purchase price of $3 million covering 109,067 purchased shares, 102,812 shares of PRS in 2008 for $2 million covering 51,406 purchased shares and 209,920 shares in 2007 for $5 million covering 104,960 purchased shares.
64
Table of Contents
PRS activity was as follows:
| (SHARE AMOUNTS IN THOUSANDS) |
Number of Shares |
Weighted-Average Grant Date Fair Value Per Share | ||||
| Balance at December 31, 2008 |
515 | $ | 21.66 | |||
| Granted |
218 | 15.44 | ||||
| Vested |
(207 | ) | 17.94 | |||
| Forfeited |
(28 | ) | 25.30 | |||
| Balance at December 31, 2009 |
498 | $ | 15.44 | |||
The total fair value of PRS’s which vested during the year ended December 31, 2009 was $3 million.
As of December 31, 2009, there was $3 million of total unrecognized compensation cost related to non-vested PRS awards granted under the equity incentive plans; such cost is expected to be recognized over a weighted average period of 1.8 years.
NOTE 12. SEGMENT INFORMATION
We are organized into two business segments, Flavors and Fragrances; these segments align with the internal structure used to manage these businesses. Flavor compounds are sold to the food and beverage industries for use in consumer products such as prepared foods, beverages, dairy, food and confectionery products. The Fragrance business unit, is comprised of three fragrance categories: functional fragrances, including fragrance compounds for personal care (e.g., soaps) and household products (e.g., detergents and cleaning agents); fine fragrance and beauty care, including perfumes, colognes and toiletries; and ingredients, consisting of synthetic and natural ingredients that can be combined with other materials to create unique functional and fine fragrance compounds. Major fragrance customers include the cosmetics industry, including perfume and toiletries manufacturers, and the household products industry, including manufacturers of soaps, detergents, fabric care, household cleaners and air fresheners.
We evaluate the performance of business units based on operating profit before interest expense, other income (expense), net and income taxes. The Global expense caption represents corporate and headquarters-related expenses which include legal, finance, human resources and other administrative expenses that are not allocated to individual business units. The year ended December 31, 2009 includes $6.4 million principally of employee separation costs partially offset by $0.4 million net reversal related to restructuring costs. The year ended December 31, 2008 Global expenses included approximately $2 million of implementation costs related to the global shared service project, $3 million for employee separation costs and $10 million of restructuring costs offset by a $3 million benefit from an insurance recovery related to a prior year product contamination matter. In the year ended December 31, 2007, Global expenses included a pension curtailment charge of $6 million. Unallocated assets are principally cash and cash equivalents and other corporate and headquarters-related assets.
65
Table of Contents
Our reportable segment information follows:
| Year Ended December 31, | ||||||||||||
| (DOLLARS IN THOUSANDS) |
2009 | 2008 | 2007 | |||||||||
| Net sales |
||||||||||||
| Flavors |
$ | 1,081,488 | $ | 1,092,544 | $ | 1,005,544 | ||||||
| Fragrances |
1,244,670 | 1,296,828 | 1,271,094 | |||||||||
| Consolidated |
$ | 2,326,158 | $ | 2,389,372 | $ | 2,276,638 | ||||||
| Year Ended December 31, | ||||||||||||
| (DOLLARS IN THOUSANDS) |
2009 | 2008 | 2007 | |||||||||
| Operating income (expense) |
||||||||||||
| Flavors |
$ | 208,329 | $ | 197,838 | $ | 187,275 | ||||||
| Fragrances |
170,515 | 202,081 | 211,942 | |||||||||
| Global Expenses |
(38,556 | ) | (44,786 | ) | (26,976 | ) | ||||||
| Consolidated operating income |
$ | 340,288 | $ | 355,133 | $ | 372,241 | ||||||
| Interest expense |
(61,818 | ) | (74,008 | ) | (41,535 | ) | ||||||
| Miscellaneous other income (expense)(1) |
(1,921 | ) | 2,797 | 108 | ||||||||
| Income before taxes |
$ | 276,549 | $ | 283,922 | $ | 330,814 | ||||||
| (1) | Miscellaneous other income (expense) does not agree to the amounts on the Consolidated Statement of Income as gains on assets are included in the operating income of the business segments. |
| At December 31, | ||||||
| (DOLLARS IN THOUSANDS) |
2009 | 2008 | ||||
| Segment assets |
||||||
| Flavors |
$ | 1,154,489 | $ | 1,131,783 | ||
| Fragrances |
1,359,031 | 1,390,979 | ||||
| Global Assets |
131,254 | 227,151 | ||||
| Consolidated Segment assets |
$ | 2,644,774 | $ | 2,749,913 | ||
| Capital Expenditures | Depreciation and Amortization | |||||||||||||||||
| (DOLLARS IN THOUSANDS) |
2009 | 2008 | 2007 | 2009 | 2008 | 2007 | ||||||||||||
| Flavors |
$ | 23,463 | $ | 31,858 | $ | 24,794 | $ | 29,874 | $ | 29,816 | $ | 33,468 | ||||||
| Fragrances |
40,122 | 50,523 | 36,335 | 46,410 | 44,203 | 47,668 | ||||||||||||
| Unallocated assets |
3,234 | 3,014 | 4,485 | 2,241 | 1,967 | 1,652 | ||||||||||||
| Consolidated |
$ | 66,819 | $ | 85,395 | $ | 65,614 | $ | 78,525 | $ | 75,986 | $ | 82,788 | ||||||
| Net Sales | |||||||||
| (DOLLARS IN MILLIONS) |
2009 | 2008 | 2007 | ||||||
| Geographic Areas |
|||||||||
| EAME(1) |
$ | 808 | $ | 898 | $ | 850 | |||
| North America |
600 | 601 | 630 | ||||||
| Greater Asia |
575 | 556 | 491 | ||||||
| Latin America |
343 | 334 | 306 | ||||||
| Total |
$ | 2,326 | $ | 2,389 | $ | 2,277 | |||
| (1) | Europe, Africa and Middle East |
66
Table of Contents
Net sales to external customers are attributed to individual regions based upon the destination of product delivery. Total long-lived assets consist of net property, plant and equipment and amounted to $501 million and $497 million at December 31, 2009 and 2008, respectively. Of this total, at December 31, 2009 and 2008, $158 million and $162 million, respectively, were located in the United States and $73 million and $71 million, respectively, were located in the Netherlands. Sales to one customer accounted for 11% of total sales in 2009, 2008 and 2007.
NOTE 13. POSTRETIREMENT BENEFITS
We, including some of our subsidiaries, have pension and/or other retirement benefit plans covering substantially all employees. Pension benefits are generally based on years of service and on compensation during the final years of employment. Plan assets consist primarily of equity securities and corporate and government fixed income securities. Substantially all pension benefit costs are funded as accrued; such funding is limited, where applicable, to amounts deductible for income tax purposes. Certain other retirement benefits are provided by balance sheet accruals.
We sponsor a qualified defined contribution plan covering substantially all U.S. employees. Under this plan, we match 100% of participants’ contributions up to 4% of compensation and 75% of participants’ contributions from over 4% to 8%. Employees that are still eligible to accrue benefits under the defined benefit plan are limited to a 50% match up to 6% of the participants’ compensation.
In addition to pension benefits, certain health care and life insurance benefits are provided to qualifying United States employees upon retirement from IFF. Such coverage is provided through insurance plans with premiums based on benefits paid. We do not generally provide health care or life insurance coverage for retired employees of foreign subsidiaries; such benefits are provided in most foreign countries by government-sponsored plans, and the cost of these programs is not significant to us.
The plan assets and benefit obligations of our defined benefit pension plans are measured at December 31 of each year.
| U.S. Plans | Non-U.S. Plans | |||||||||||||||||||||||
| (DOLLARS IN THOUSANDS) |
2009 | 2008 | 2007 | 2009 | 2008 | 2007 | ||||||||||||||||||
| Components of net periodic benefit cost |
||||||||||||||||||||||||
| Service cost for benefits earned |
$ | 4,080 | $ | 4,569 | $ | 10,312 | $ | 8,678 | $ | 10,266 | $ | 11,633 | ||||||||||||
| Interest cost on projected benefit obligation |
23,685 | 23,883 | 23,953 | 30,978 | 36,270 | 35,595 | ||||||||||||||||||
| Expected return on plan assets |
(24,616 | ) | (25,101 | ) | (24,266 | ) | (40,589 | ) | (51,256 | ) | (52,604 | ) | ||||||||||||
| Net amortization and deferrals |
6,413 | 4,618 | 6,590 | 3,004 | 3,020 | 6,071 | ||||||||||||||||||
| Settlement and curtailment |
— | — | 5,943 | 440 | — | — | ||||||||||||||||||
| Expense |
9,562 | 7,969 | 22,532 | 2,511 | (1,700 | ) | 695 | |||||||||||||||||
| Defined contribution and other retirement plans |
6,255 | 6,220 | 4,923 | 4,135 | 4,367 | 4,086 | ||||||||||||||||||
| Total pension expense |
$ | 15,817 | $ | 14,189 | $ | 27,455 | $ | 6,646 | $ | 2,667 | $ | 4,781 | ||||||||||||
| Changes in plan assets and benefit obligations recognized in OCI |
||||||||||||||||||||||||
| Net actuarial (gain) loss |
$ | (21,874 | ) | $ | 57,608 | |||||||||||||||||||
| Actuarial loss |
(5,942 | ) | (3,037 | ) | ||||||||||||||||||||
| Prior service cost |
(471 | ) | (518 | ) | ||||||||||||||||||||
| Initial net asset |
— | 111 | ||||||||||||||||||||||
| Currency translation adjustment |
— | 8,017 | ||||||||||||||||||||||
| Total recognized in OCI (before tax effects) |
$ | (28,287 | ) | $ | 62,181 | |||||||||||||||||||
67
Table of Contents
| Postretirement Benefits | ||||||||||||
| (DOLLARS IN THOUSANDS) |
2009 | 2008 | 2007 | |||||||||
| Components of net periodic benefit cost |
||||||||||||
| Service cost for benefits earned |
$ | 1,644 | $ | 2,694 | $ | 2,628 | ||||||
| Interest cost on projected benefit obligation |
6,166 | 7,079 | 5,869 | |||||||||
| Net amortization and deferrals |
(2,012 | ) | (723 | ) | (340 | ) | ||||||
| Expense |
$ | 5,798 | $ | 9,050 | $ | 8,157 | ||||||
| Changes in plan assets and benefit obligations recognized in OCI |
||||||||||||
| Net actuarial loss |
$ | 1,170 | ||||||||||
| Actuarial loss |
(2,707 | ) | ||||||||||
| Prior service credit |
4,719 | |||||||||||
| Total recognized in OCI (before tax effects) |
$ | 3,182 | ||||||||||
The amounts expected to be recognized in net periodic cost in 2010 are:
| (DOLLARS IN THOUSANDS) |
U.S. Plans | Non-U.S. Plans | Postretirement Benefits |
|||||||
| Loss recognition |
$ | 7,031 | $ | 5,330 | $ | 2,763 | ||||
| Prior service cost recognition |
490 | 145 | (4,719 | ) | ||||||
| Net initial obligation/(asset) recognition |
— | — | — | |||||||
| Weighted-average actuarial assumption used to determine expense |
U.S. Plans | Non-U.S. Plans | ||||||||||
| 2009 | 2008 | 2007 | 2009 | 2008 | 2007 | |||||||
| Discount rate |
6.00% | 6.10% | 6.00% | 6.11% | 5.78% | 4.95% | ||||||
| Expected return on plan assets |
8.25% | 8.25% | 8.25% | 6.76% | 7.02% | 7.06% | ||||||
| Rate of compensation increase |
3.50% | 4.00% | 3.75% | 2.56% | 2.98% | 2.54% | ||||||
68
Table of Contents
Changes in the postretirement benefit obligation and plan assets, as applicable, are detailed in the following table:
| U.S. Plans | Non-U.S. Plans | Postretirement Benefits | ||||||||||||||||||||||
| (DOLLARS IN THOUSANDS) |
2009 | 2008 | 2009 | 2008 | 2009 | 2008 | ||||||||||||||||||
| Benefit obligation at beginning of year |
$ | 404,902 | $ | 394,954 | $ | 499,004 | $ | 661,372 | $ | 106,166 | $ | 118,487 | ||||||||||||
| Service cost for benefits earned |
4,080 | 4,569 | 8,678 | 10,266 | 1,644 | 2,694 | ||||||||||||||||||
| Interest cost on projected benefit obligation |
23,685 | 23,883 | 30,978 | 36,270 | 6,166 | 7,079 | ||||||||||||||||||
| Actuarial (gain) loss |
(4,316 | ) | 1,963 | 79,704 | (77,117 | ) | 1,170 | 3,915 | ||||||||||||||||
| Plan amendments |
— | 453 | — | — | — | (20,582 | ) | |||||||||||||||||
| Adjustments for expense/tax contained in service cost |
— | — | (1,694 | ) | (1,730 | ) | — | — | ||||||||||||||||
| Plan participants’ contributions |
— | — | 2,120 | 2,242 | 927 | 1,093 | ||||||||||||||||||
| Benefits paid |
(21,450 | ) | (20,920 | ) | (24,761 | ) | (27,564 | ) | (5,561 | ) | (6,851 | ) | ||||||||||||
| Medicare Rx subsidy |
— | — | — | — | — | 331 | ||||||||||||||||||
| Curtailments/Settlements |
— | — | (1,537 | ) | — | — | — | |||||||||||||||||
| Translation adjustments |
— | — | 28,767 | (104,735 | ) | — | — | |||||||||||||||||
| Benefit obligation at end of year |
$ | 406,901 | $ | 404,902 | $ | 621,259 | $ | 499,004 | $ | 110,512 | $ | 106,166 | ||||||||||||
| Fair value of plan assets at beginning of year |
$ | 248,151 | $ | 349,231 | $ | 574,886 | $ | 756,027 | ||||||||||||||||
| Actual return on plan assets |
42,174 | (89,210 | ) | 60,992 | (56,858 | ) | ||||||||||||||||||
| Employer contributions |
36,015 | 9,050 | 15,848 | 22,279 | ||||||||||||||||||||
| Participants’ contributions |
— | — | 2,120 | 2,242 | ||||||||||||||||||||
| Benefits paid |
(21,450 | ) | (20,920 | ) | (24,761 | ) | (27,564 | ) | ||||||||||||||||
| Settlements |
— | — | (1,537 | ) | — | |||||||||||||||||||
| Translation adjustments |
— | — | 32,628 | (121,240 | ) | |||||||||||||||||||
| Fair value of plan assets at end of year |
$ | 304,890 | $ | 248,151 | $ | 660,176 | $ | 574,886 | ||||||||||||||||
| Funded status at end of year |
$ | (102,011 | ) | $ | (156,751 | ) | $ | 38,917 | $ | 75,882 | ||||||||||||||
| U.S. Plans | Non-U.S. Plans | |||||||||||||||
| (DOLLARS IN THOUSANDS) |
2009 | 2008 | 2009 | 2008 | ||||||||||||
| Amounts recognized in the balance sheet: |
||||||||||||||||
| Non-current assets |
$ | — | $ | — | $ | 61,881 | $ | 98,815 | ||||||||
| Current liabilities |
(3,175 | ) | (2,738 | ) | (636 | ) | (610 | ) | ||||||||
| Non-current liabilities |
(98,836 | ) | (154,013 | ) | (22,328 | ) | (22,323 | ) | ||||||||
| Net amount recognized |
$ | (102,011 | ) | $ | (156,751 | ) | $ | 38,917 | $ | 75,882 | ||||||
| U.S. Plans | Non-U.S. Plans | Postretirement Benefits |
|||||||||||||||||||
| (DOLLARS IN THOUSANDS) |
2009 | 2008 | 2009 | 2008 | 2009 | 2008 | |||||||||||||||
| Amounts recognized in AOCI consist of: | |||||||||||||||||||||
| Net actuarial loss |
$ | 125,975 | $ | 153,791 | $ | 160,738 | $ | 98,199 | $ | 38,130 | $ | 39,667 | |||||||||
| Prior service cost (credit) |
2,536 | 3,007 | 145 | 605 | (33,878 | ) | (38,597 | ) | |||||||||||||
| Unrecognized net initial obligation |
— | — | — | (102 | ) | — | — | ||||||||||||||
| Total AOCI (before tax effects) |
$ | 128,511 | $ | 156,798 | $ | 160,883 | $ | 98,702 | $ | 4,252 | $ | 1,070 | |||||||||
69
Table of Contents
| U.S. Plans | Non-U.S. Plans | |||||||||||||||
| (DOLLARS IN THOUSANDS) |
2009 | 2008 | 2009 | 2008 | ||||||||||||
| Accumulated Benefit Obligation – end of year |
$ | 402,130 | $ | 393,284 | $ | 589,317 | $ | 475,189 | ||||||||
| Information for Pension Plans with an ABO in excess of Plan Assets: |
||||||||||||||||
| Projected benefit obligation |
$ | 406,901 | $ | 404,902 | $ | 46,943 | $ | 43,991 | ||||||||
| Accumulated benefit obligation |
402,130 | 393,284 | 41,636 | 38,475 | ||||||||||||
| Fair value of plan assets |
304,890 | 248,151 | 23,979 | 21,058 | ||||||||||||
| Weighted-average assumptions used to determine obligations at December 31 |
||||||||||||||||
| Discount rate |
6.10 | % | 6.00 | % | 5.66 | % | 6.11 | % | ||||||||
| Rate of compensation increase |
3.25 | % | 3.50 | % | 3.00 | % | 2.56 | % | ||||||||
| 2009 | 2008 | 2009 | 2008 | |||||
| Percentage of assets invested in: |
||||||||
| Equities |
60% | 70% | 30% | 25% | ||||
| Bonds |
40% | 7% | 56% | 57% | ||||
| Property |
n/a | n/a | 12% | 14% | ||||
| Other investments |
n/a | 23% | 2% | 4% |
| (DOLLARS IN THOUSANDS) |
Postretirement Benefits | ||||||||
| U.S. Plans | Non-U.S. Plans | ||||||||
| Estimated Future Benefit Payments |
|||||||||
| 2010 |
$ | 22,319 | $ | 27,084 | $ | 5,553 | |||
| 2011 |
23,145 | 29,505 | 5,929 | ||||||
| 2012 |
24,796 | 30,216 | 6,257 | ||||||
| 2013 |
26,022 | 29,783 | 6,753 | ||||||
| 2014 |
26,911 | 30,767 | 7,247 | ||||||
| 2015-2019 |
152,600 | 171,639 | 41,353 | ||||||
| Contributions |
|||||||||
| Required Company Contributions in the Following Year (2010) |
$ | 3,270 | $ | 16,181 | $ | 5,553 | |||
We consider a number of factors in determining and selecting assumptions for the overall expected long-term rate of return on plan assets. We consider the historical long-term return experience of our assets, the current and expected allocation of our plan assets, and expected long-term rates of return. We derive these expected long-term rates of return with the assistance of our investment advisors. We base our expected allocation of plan assets on a diversified portfolio consisting of domestic and international equity securities, fixed income, real estate, and alternative asset classes. The asset allocation is monitored on an ongoing basis.
We consider a variety of factors in determining and selecting our assumptions for the discount rate at December 31. For the U.S. plans, the discount rate was based on the internal rate of return for a portfolio of Moody’s Aaa, Aa, and Merrill Lynch AAA-AA high quality bonds with maturities that are consistent with the projected future benefit payment obligations of the plan. The rate of compensation increase for all plans and the medical cost trend rate for the applicable U.S. plans are based on plan experience.
With respect to the U.S. plans, the expected return on plan assets was determined based on an asset allocation model using the current target allocation, real rates of return by asset class and an anticipated inflation rate. The target asset allocation consists of approximately: 60 – 65% in equity securities and 35 – 40% in fixed income securities. The inflation rate assumed in the model was 2.5%. The plan has achieved a compounded annual rate of return of approximately 8% over the previous 20 years. At December 31, 2009, the actual asset allocation was: 67% in equity securities; 30% in fixed income securities; and 3% in cash.
70
Table of Contents
The expected annual rate of return for the non-U.S. plans employs a similar set of criteria adapted for local investments, inflation rates and in certain cases specific government requirements. The target asset allocation, for the non-U.S. plans, consists of approximately: 55 – 60% in fixed income securities, 30 – 35% in equity securities; 5 – 10% in real estate; and up to 5% in cash. At December 31, 2009, the actual asset allocation was: 57% in fixed income investments; 30% in equity investments; 11% in real estate investments; and 2% in cash.
The following tables present our plan assets for the U.S. and non-U.S. plans using the fair value hierarchy as of December 31, 2009. Our plans’ assets were accounted for at fair value and are classified in their entirety based on the lowest level of input that is significant to the fair value measurement. Our assessment of the significance of a particular input to the fair value measurement requires judgment, and may affect the valuation of fair value assets and their placement within the fair value hierarchy levels. For more information on a description of the fair value hierarchy, see Note 14.
| U.S. Plans | ||||||||||||
| (DOLLARS IN THOUSANDS) |
Level 1 | Level 2 | Level 3 | Total | ||||||||
| Cash Equivalents |
$ | — | $ | 7,908 | $ | — | $ | 7,908 | ||||
| Equity Securities |
||||||||||||
| IFF Common Stock |
12,095 | — | — | 12,095 | ||||||||
| U.S. Common Stock |
13,850 | — | — | 13,850 | ||||||||
| Non-U.S. Common Stock |
1,160 | — | — | 1,160 | ||||||||
| Mutual Funds |
43,024 | — | — | 43,024 | ||||||||
| Pooled Funds |
— | 136,943 | — | 136,943 | ||||||||
| Fixed Income Securities |
||||||||||||
| Government & Government Agency Bonds |
— | 40,032 | — | 40,032 | ||||||||
| Corporate Bonds |
— | 46,139 | — | 46,139 | ||||||||
| Municipal Bonds |
— | 1,760 | — | 1,760 | ||||||||
| Asset Backed Securities |
— | 573 | — | 573 | ||||||||
| Total |
$ | 70,129 | $ | 233,355 | $ | — | $ | 303,484 | ||||
| Receivables |
$ | 1,406 | ||||||||||
| Total |
$ | 304,890 | ||||||||||
| Non-U.S. Plans | ||||||||||||
| (DOLLARS IN THOUSANDS) |
Level 1 | Level 2 | Level 3 | Total | ||||||||
| Cash |
$ | 13,134 | $ | — | $ | — | $ | 13,134 | ||||
| Equity Securities |
||||||||||||
| U.S. Large Cap |
26,938 | — | — | 26,938 | ||||||||
| Non-U.S. Large Cap |
138,491 | — | — | 138,491 | ||||||||
| Non-U.S. Mid Cap |
7,660 | — | — | 7,660 | ||||||||
| Non-U.S. Small Cap |
1,622 | — | — | 1,622 | ||||||||
| Emerging Markets |
9,786 | — | — | 9,786 | ||||||||
| Pooled Funds |
12,934 | — | — | 12,934 | ||||||||
| Fixed Income Securities |
||||||||||||
| U.S. Treasuries/Government Bonds |
86 | — | — | 86 | ||||||||
| Non-U.S. Treasuries/Government Bonds |
153,892 | — | — | 153,892 | ||||||||
| Non-U.S. Corporate Bonds |
79,659 | 93,671 | — | 173,330 | ||||||||
| Non-U.S. Mortgage-Backed Securities |
8,540 | — | — | 8,540 | ||||||||
| Non-U.S. Asset-Backed Securities |
5,693 | 8,674 | — | 14,367 | ||||||||
| Non-U.S. Other Fixed Income |
4,270 | 20,569 | — | 24,839 | ||||||||
| Alternative Types of Investments |
||||||||||||
| Insurance Contracts |
— | 322 | — | 322 | ||||||||
| Private Equity Funds |
— | — | 2 | 2 | ||||||||
| Real Estate |
||||||||||||
| Non-U.S. Real Estate |
1,202 | 72,655 | 376 | 74,233 | ||||||||
| Total |
$ | 463,907 | $ | 195,891 | $ | 378 | $ | 660,176 | ||||
71
Table of Contents
Cash and cash equivalents are primarily held in registered money market funds which are valued using a market approach based on the quoted market prices of identical instruments. Other cash and cash equivalents are valued daily by the fund using a market approach with inputs that include quoted market prices for similar instruments.
Equity securities are primarily valued using a market approach based on the quoted market prices of identical instruments. Pooled funds are typically common or collective trusts valued at their net asset values (NAVs) that are calculated by the investment manager of the fund.
Fixed income securities are primarily valued using a market approach with inputs that include broker quotes and benchmark yields.
Real estate values are primarily reported by the fund manager and are based on valuation of the underlying investments, which include inputs such as cost, discounted future cash flows, independent appraisals, and market comparable data.
The following table presents a reconciliation of Level 3 non-U.S. plan assets held during the year ended December 31, 2009.
| Non-U.S. Plans | |||||||||||
| (DOLLARS IN THOUSANDS) |
Real Estate |
Private Equity |
Total | ||||||||
| Beginning Balance 12/31/2008 |
$ | 735 | $ | 2 | $ | 737 | |||||
| Actual return on plan assets: |
|||||||||||
| Relating to assets still held at the reporting date |
— | — | — | ||||||||
| Relating to assets sold during the period |
— | — | — | ||||||||
| Purchases, sales, and settlements |
(359 | ) | — | (359 | ) | ||||||
| Transfers in and/or out of Level 3 |
— | — | — | ||||||||
| Ending balance at 12/31/2009 |
$ | 376 | $ | 2 | $ | 378 | |||||
The following weighted average assumptions were used to determine our postretirement benefit expense and obligation for the years ended December 31:
| Expense | Liability | |||||||||||
| 2009 | 2008 | 2009 | 2008 | |||||||||
| Discount rate |
6.00 | % | 6.10 | % | 6.10 | % | 6.00 | % | ||||
| Current medical cost trend rate |
8.00 | % | 8.00 | % | 9.00 | % | 8.00 | % | ||||
| Ultimate medical cost trend rate |
4.75 | % | 4.75 | % | 4.75 | % | 4.75 | % | ||||
| Medical cost trend rate decreases to ultimate rate in year |
2014 | 2013 | 2016 | 2014 | ||||||||
| Sensitivity of Disclosures to Changes in Selected Assumptions | ||||||||||||
| 25 BP Decrease in Discount Rate |
25 BP Decrease in Discount Rate |
25 BP Decrease in Long Term Rate of Return | ||||||||||
| (DOLLARS IN THOUSANDS) |
Change in PBO |
Change in ABO |
Change in pension expense |
Change in pension expense | ||||||||
| U.S. Pension Plans |
$ | 9,975 | $ | 9,784 | $ | 678 | $ | 780 | ||||
| Non-U.S. Pension Plans |
$ | 25,406 | $ | 23,215 | $ | 1,693 | $ | 1,639 | ||||
| Postretirement Benefit Plan |
N/A | $ | 3,252 | $ | 249 | N/A | ||||||
The effect of a 1% increase in the medical cost trend rate would increase the accumulated postretirement benefit obligation, and the annual postretirement expense, by approximately $6.1 million and $0.4 million, respectively; a 1% decrease in the rate would decrease the obligation and expense by approximately $6.1 million and $0.4 million, respectively.
72
Table of Contents
The following table shows the expected benefit payments including payments under the split dollar life insurance.
| (DOLLARS IN THOUSANDS) |
|||
| Expected Benefit Payments |
|||
| 2010 |
$ | 5,553 | |
| 2011 |
5,929 | ||
| 2012 |
6,257 | ||
| 2013 |
6,753 | ||
| 2014 |
7,247 | ||
| 2015 – 2019 |
41,353 | ||
We contributed $36 million and $16 million to our qualified U.S. pension plans and non-U.S. pension plans in 2009. In addition, $4 million of benefit payments were made with respect to the U.S. non-qualified plan.
In 2007, we amended our U.S. salaried qualified and non-qualified pension plans under which accrual of future benefits was suspended for all participants that did not meet the rule of 70 (age plus years of service equal at least 70) at December 31, 2007. As a result of this suspension, we recorded a curtailment loss of $5.9 million to recognize a portion of the unrecognized prior service costs associated with years of service no longer expected to be rendered and credited as service under the plans.
NOTE 14. FINANCIAL INSTRUMENTS
Fair Value
New accounting guidance on fair value measurements specifies a hierarchy of valuation techniques based on whether the inputs to those valuation techniques are observable or unobservable. Observable inputs reflect market data obtained from independent sources, while unobservable inputs reflect our market assumptions. These two types of inputs create the following fair value hierarchy:
| Ÿ | Level 1 — Quoted prices for identical instruments in active markets. |
| Ÿ | Level 2 — Quoted prices for similar instruments in active markets; quoted prices for identical or similar instruments in markets that are not active; and model-derived valuations in which all significant inputs and significant value drivers are observable in active markets. |
| Ÿ | Level 3 — Valuations derived from valuation techniques in which one or more significant inputs or significant value drivers are unobservable. |
This hierarchy requires us to use observable market data, when available, and to minimize the use of unobservable inputs when determining fair value.
When available, we generally use quoted market prices to determine fair value, and classify such items in Level 1. We determine the fair value of structured liabilities (where performance is linked to structured interest rates, inflation or currency risks) using the LIBOR (London InterBank Offer Rate) swap curve and forward interest and exchange rates at period end. Such instruments are classified as Level 2 based on the observability of significant inputs to the model. The fair value of these liabilities was approximately $4.3 million at December 31, 2009. We do not have any instruments classified as Level 3.
The market valuation adjustments include a bilateral or “own” credit risk adjustment applied to reflect our own credit risk when valuing all liabilities measured at fair value, in accordance with the requirements under the accounting guidance. The methodology is consistent with that applied in generating counterparty credit risk adjustments, but incorporates our own credit risk as observed in the credit default swap market. As for counterparty credit risk, our own credit risk adjustments include the impact of credit risk mitigants. The
73
Table of Contents
estimated change in the fair value of these liabilities due to such changes in our own credit risk (or instrument-specific credit risk) was immaterial as of December 31, 2009.
Derivatives
We periodically enter into foreign currency forward contracts with the objective of reducing exposure to cash flow volatility associated with our intercompany loans, foreign currency receivables and payables, and anticipated purchases of certain raw materials used in operations. These contracts generally involve the exchange of one currency for a second currency at a future date, have maturities not exceeding three months and are with counterparties which are major international financial institutions. As of December 31, 2009 we held certain foreign currency forward contracts which were not designated as hedging instruments. The carrying amounts of these contracts were $0.2 million (in an asset position) classified in Prepaid expenses and other current assets and $0.9 million (in a liability position) classified in Other current liabilities in the Consolidated Balance Sheet. During the year ended December 31, 2009 we recognized net losses of $2.0 million, recorded in Other (income) expense, net, related to these foreign currency contracts. These net gains offset any recognized losses arising from the revaluation of the related intercompany loans during the same respective periods.
In 2003, we executed a 10-year Yen – U.S. dollar currency swap related to the monthly sale and purchase of products and services between the U.S. and Japan which has been designated as a cash flow hedge. As of December 31, 2009, this cash flow hedge experienced no ineffectiveness. As of December 31, 2009, the fair value of this foreign currency contract was a liability of $4.5 million classified in Other current liabilities in the Consolidated Balance Sheet. During the year ended December 31, 2009, a gain of $1.1 million, was recognized in Other comprehensive income representing the change in fair value of the remaining hedge balance outstanding which is marked to market in AOCI as a hedge of forecasted future cash flow and released ratably through earnings over term of the hedge. During the year ended December 31, 2009 we reclassified losses of $0.8 million from AOCI to Other (income) expense, net, in the Consolidated Statement of Income.
In 2005, we entered into an interest rate swap agreement effectively converting the fixed rate on our long-term Japanese Yen borrowings to a variable short-term rate based on the Tokyo InterBank Offering Rate (TIBOR) plus an interest markup. This swap was designated as a fair value hedge. As of December 31, 2009, the fair value of this interest rate contract was approximately $0.2 million and is classified in Other assets in the Consolidated Balance Sheet. This fair value hedge experienced no ineffectiveness. Interest income on the periodic settlement and reset of the floating interest rate of less than $0.1 million was recorded in Interest expense in the Consolidated Statement of Income for the year ended December 31, 2009.
In May 2009 we entered into a forward currency contract which qualified as a net investment hedge, in order to protect a portion of our net European investment from foreign currency risk. We recognized a $1.6 million loss during the year ended December 31, 2009, which was deferred as a component of AOCI. The ineffective portion of this net investment hedge was not material. This forward currency contract matured before the end of our second quarter. Upon its maturity, we entered into an intercompany loan payable in the amount of 40 million Euros in order to protect a portion of our net European investment from foreign currency risk. This contract subsequently was terminated during the 2009. This intercompany loan was designated as a net investment hedge and experienced no ineffectiveness while outstanding. We recognized a $3.1 million loss during the year ended December 31, 2009, which was deferred as a component of AOCI.
In September 2007, we entered into a $250 million interest rate swap agreement effectively converting the fixed rate on our long-term U.S. dollar borrowings to a variable short-term rate based on U.S. Dollar (USD) LIBOR rate plus markup. In March 2008, we realized an $18 million gain on termination of this swap, which has been deferred and is being amortized as a reduction to interest expense over the remaining term of the related debt. During 2008, we entered into a similar interest rate swap and then in October 2008 we liquidated this position at no cost.
74
Table of Contents
In September 2007 and January 2006, we entered into a $250 million and a $300 million Cross Currency Interest Rate Swap, respectively, to hedge a portion of our consolidated EUR net investment. The derivative was structured as a swap of floating USD LIBOR to floating EURIBOR, with both floating interest rates reset and paid semi-annually. Because the derivatives are structured as a floating to floating swap, the only value, other than that derived from changes in the foreign exchange (FX) spot rate, are interest rate accruals which are reset semi-annually. These accruals are netted and booked in current earnings. Mark-to-market changes due to differences in the underlying FX rate are recorded in AOCI and provide an offset to the cumulative translation adjustment of the underlying Euro assets being hedged, which are also being valued based on changes in the FX spot rate. Effectiveness is assessed quarterly. At maturity, or if the swap is terminated early, any gain or loss will be recorded to AOCI until the Euro net investment is divested. In October 2008, we closed out the $250 million USD LIBOR to EURIBOR interest rate swap at no cost. In February 2009 we terminated the $300 million USD LIBOR to EURIBOR interest rate swap which required us to make a payment of $16 million. As this swap was designated as a net investment hedge, $12 million of the loss was deferred in AOCI where it will remain until the Euro net investment is divested and $4 million was included as a component of interest expense during the year ended December 31, 2009.
NOTE 15. CONCENTRATIONS OF CREDIT RISK
We have no significant concentrations of risk in financial instruments. Temporary investments are made in a well-diversified portfolio of high-quality, liquid obligations of government, corporate and financial institutions. There are also limited concentrations of credit risk with respect to trade receivables because of the large number of customers spread across many industries and geographic regions.
NOTE 16. COMMITMENTS AND CONTINGENCIES
Minimum rental commitments under non-cancelable operating leases are $28 million in 2010, $25 million in 2011, $22 million in 2012, $20 million in 2013, $17 million in 2014 and from 2015 and thereafter through 2030, the aggregate lease obligations are $184 million. The corresponding rental expense amounted to $30 million, $28 million and $27 million in 2009, 2008 and 2007, respectively. None of our leases contain step rent provisions or escalation clauses and they do not require capital improvement funding.
We are party to a number of lawsuits and claims related primarily to flavoring supplied by us and by other third party suppliers, in most instances to manufacturers of butter flavored popcorn. A total of 17 actions involving 276 claimants are currently pending against us and other flavor suppliers and related companies based on similar claims of alleged respiratory illness. In certain cases, plaintiffs are unable to demonstrate that they have suffered a compensable loss as a result of such exposure, or that injuries incurred in fact resulted from exposure to our flavor products. In most of the complaints, the damages sought by the plaintiffs are not alleged at the pleading stage and may not be specified until a much later time in the proceeding, if at all. During 2009, there have been 5 new actions filed involving 7 claimants and 6 actions involving 18 claimants have been dismissed or settled for a net out-of-pocket amount which is not material to us including insurance recovery. In addition, 105 claimants were voluntarily dismissed from continuing cases based on a determination that their claims lacked merit.
At each balance sheet date, or more frequently as conditions warrant, we review the status of each pending claim, as well as our insurance coverage for such claims with due consideration given to potentially applicable deductibles, retentions and reservation of rights under insurance policies with respect to all these matters. The liabilities are recorded at management’s best estimate of the outcome of the lawsuits and claims, taking into consideration the facts and circumstances of the individual matters as well as past experience on similar matters. Amounts accrued are also based upon our historical experience with these claims, including claims which have been closed with no liability as well as claims settled to date. Settled claims, since the inception of the flavor-related claims, have not been material to us in any reporting period including insurance recovery. At each balance sheet date, the key issues that management assesses are whether it is probable that a loss as to asserted or unasserted claims has been incurred and if so, whether the amount of loss can be reasonably estimated. We are
75
Table of Contents
not able to provide an amount or range of estimated loss in excess of the liability currently accrued at the balance sheet date as to asserted and unasserted claims because such estimate cannot reasonably be made.
While the ultimate outcome of any litigation cannot be predicted, management believes that adequate provision has been made with respect to all known claims. Based on information presently available and in light of the merits of our defenses and the availability of insurance, we do not expect the outcome of the above cases, singly or in the aggregate, to have a material adverse effect on our financial condition, results of operations or liquidity. There can be no assurance that future events will not require us to increase the amount we have accrued for any matter or accrue for a matter that has not been previously accrued.
We periodically assess our insurance coverage for all known claims, taking into account aggregate coverages by occurrence, limits of coverage, self-insured retentions and deductibles, historical claims experience and claims experience with insurers.
We record the expected liability with respect to these claims in Other liabilities and expected recoveries from our insurance carrier group in Other assets. We believe that realization of the insurance receivable is probable due to the terms of the insurance policies and the payment experience to date of the carrier group as it relates to these claims.
Over the past approximately 20 years, various federal and state authorities and private parties have claimed that we are a Potentially Responsible Party (“PRP”) as a generator of waste materials for alleged pollution at a number of waste sites operated by third parties located principally in New Jersey and have sought to recover costs incurred and to be incurred to clean up the sites.
We have been identified as a PRP at ten facilities operated by third parties at which investigation and/or remediation activities may be ongoing. We analyze our liability on a regular basis and accrue for environmental liabilities when they are probable and estimable. At December 31, 2009, we estimated our share of the total future costs for these sites to be less than $5 million.
While joint and several liability is authorized under federal and state environmental laws, we believe that the amounts we have paid and anticipate paying in the future for clean-up costs and damages at all sites are not and will not be material to our financial condition, results of operations or liquidity. This conclusion is based upon, among other things, the involvement of other PRP’s at most sites, the status of the proceedings, including various settlement agreements and consent decrees, the extended time period over which payment will likely be made and an agreement reached in July 1994 with three of our liability insurers pursuant to which defense costs and indemnity amounts payable by us in respect of the sites will be shared by the insurers up to an agreed amount.
76
Table of Contents
(a)(3) EXHIBITS
| Number |
||
| 3(i) |
Restated Certificate of Incorporation of the Company, incorporated by reference to Exhibit 10(g) to Registrant’s Report on Form 10-Q filed on August 12, 2002 (SEC file number reference 001-04858). | |
| 3(ii) |
By-laws of the Registrant, incorporated by reference to Exhibit 3.1 to Registrant’s Report on Form 8-K filed on October 30, 2009. | |
| 4.1 |
Shareholder Protection Rights Agreement, dated as of March 21, 2000, between Registrant and The Bank of New York, as Rights Agent, incorporated by reference to Exhibit 4.1 to Registrant’s Report on Form 10-K filed on March 13, 2006. | |
| 4.1a |
First Amendment dated September 26, 2000, to Shareholder Protection Rights Agreement, incorporated by reference to Exhibit 4.1a to Registrant’s Report on Form 10-K filed on March 13, 2006. | |
| 4.1b |
Letter Agreement between the Registrant and Wachovia Bank, National Association (“Wachovia”), dated as of October 31, 2002, appointing Wachovia as Successor Rights Agent pursuant to the Shareholder Protection Rights Agreement, dated as of March 21, 2000 and amended as of September 26, 2000, incorporated by reference to Exhibit 4(a) to Registrant’s Report on Form 10-Q filed on November 12, 2002 (SEC file number reference 001-04858). | |
| 4.2 |
Specimen Certificate of Registrant’s Common Stock bearing legend notifying of Shareholder Protection Rights Agreement, incorporated by reference to Exhibit 4(b) to Registrant’s Registration Statement on Form S-3 filed on September 29, 2000. (Reg. No. 333-46932). | |
| 4.3 |
Note Purchase Agreement, dated as of July 12, 2006, by and among International Flavors & Fragrances Inc. and the various purchasers named therein, incorporated by reference to Exhibit 4.7 to Registrant’s Report on Form 8-K filed on July 13, 2006. | |
| 4.4 |
Form of Series A, Series B, Series C and Series D Senior Notes incorporated by reference to Exhibit 4.8 to Registrant’s Report on Form 8-K filed on July 13, 2006. | |
| 4.5 |
Note Purchase Agreement, dated as of September 27, 2007, by and among International Flavors & Fragrances Inc. and the various purchasers named therein, incorporated by reference to Exhibit 4.7 to Registrant’s Report on Form 8-K filed on October 1, 2007. | |
| 4.6 |
Form of Series A, Series B, Series C and Series D Senior Notes incorporated by reference to Exhibit 4.8 of Registrant’s Report on Form 8-K filed on October 1, 2007. | |
| 4.7 |
Credit Agreement dated as of November 18, 2008 among International Flavors & Fragrances (Japan) Ltd., as Borrower, International Flavors & Fragrances Inc., as Guarantor, and The Bank of Tokyo-Mitsubishi UFJ, Ltd., as Lender, incorporated by reference to Exhibit 10.1 to Registrant’s Report on Form 8-K filed on November 21, 2008. | |
| *10.1 |
Letter Agreement, dated June 28, 2006, between Registrant and Robert M. Amen, Chairman of the Board of Directors and Chief Executive Officer, incorporated by reference to Exhibit 10. 1 to Registrant’s Report on Form 8-K filed on June 29, 2006. | |
| *10.2 |
Separation Agreement between International Flavors & Fragrances Inc. and Robert M. Amen dated October 14, 2009, incorporated by reference to Registrant’s Report on Form 8-K filed on October 19, 2009. | |
| *10.3 |
Letter Agreement between International Flavors & Fragrances Inc. and Douglas D. Tough, dated September 8, 2009, incorporated by reference to Exhibit 10.1 to the Registrant’s Report on Form 8-K filed on September 14, 2009. | |
77
Table of Contents
| Number |
||
| *10.4 |
Compensation arrangements of Kevin Berryman, effective as of May 15, 2009, incorporated by reference to the Registrant’s report on Form 8-K filed on April 16, 2009. | |
| *10.5 |
Compensation arrangements of Richard A. O’Leary, effective as of April 28, 2009, incorporated by reference to the Registrant’s report on Form 8-K filed on May 1, 2009. | |
| *10.6 |
Compensation arrangements of Nicolas Mirzayantz and Hernan Vaisman, effective as of January 1, 2008, incorporated by reference to Registrant’s Report on Form 8-K filed on December 13, 2007. | |
| *10.7 |
2008 Compensation Arrangements of Robert M. Amen, Douglas J. Wetmore, Nicolas Mirzayantz and Dennis M. Meany incorporated by reference to Registrant’s Report on Form 8-K filed on March 5, 2008. | |
| *10.8 |
Form of Director/Officer Indemnification Agreement incorporated by reference to Exhibit 10.1 to Registrant’s Report on Form 8-K filed on July 28, 2008. | |
| *10.9 |
Supplemental Retirement Plan, adopted by the Registrant’s Board of Directors on October 29, 1986 as amended and restated through October 9, 2007, incorporated by reference to Exhibit 10.5 to Registrant’s Report on Form 10-K filed on February 27, 2008. | |
| *10.10 |
2000 Stock Award and Incentive Plan, adopted by the Registrant’s Board of Directors on March 9, 2000 as amended and restated through October 9, 2007, incorporated by reference to Exhibit 10.6 to Registrant’s Report on Form 10-K filed on February 27, 2008. | |
| *10.11 |
2000 Supplemental Stock Award Plan, adopted by the Registrant’s Board of Directors on November 14, 2000 as amended and restated through October 9, 2007, incorporated by reference to Exhibit 10.7 to Registrant’s Report on Form 10-K filed on February 27, 2008. | |
| *10.12 |
Registrant’s Executive Death Benefit Plan, effective July 1, 1990, incorporated by reference to Exhibit 10.6 to Registrant’s Report on Form 10-K filed on March 13, 2006. | |
| *10.13 |
Registrant’s Vision 2001 Compensation Program, adopted by the Registrant’s Board of Directors on December 12, 2000 and amended in 2005, incorporated by reference to Exhibit 10.2 to Registrant’s Report on Form 8-K filed on January 28, 2005 (SEC file number reference 001-04858). | |
| *10.14 |
Long Term Equity Choice Program Summary, incorporated by reference to Exhibit 10.3 to Registrant’s Report on Form 8-K filed on March 10, 2006. | |
| *10.15 |
Performance Criteria for the 2007-2009 cycle under the Company’s Long Term Incentive Plan, incorporated by reference to Registrant’s Report on Form 8-K filed on March 12, 2007. | |
| *10.16 |
Performance Criteria for the 2008-2010 cycle under the Company’s Long Term Incentive Plan, incorporated by reference to Registrant’s Report on Form 8-K filed on February 1, 2008. | |
| *10.17 |
Performance Criteria for the 2009-2011 cycle under the Company’s Long Term Incentive Plan, incorporated by reference to Registrant’s Report on Form 8-K filed on March 13, 2009. | |
| *10.18 |
Performance Criteria for the Registrant’s Annual Incentive Plan for 2009, incorporated by reference to Exhibit 10.1 to Registrant’s Report on form 8-K filed on March 13, 2009. | |
| *10.19 |
Form of Non-Employee Director’s Restricted Stock Units Agreement under International Flavors & Fragrances Inc. 2000 Stock Award and Incentive Plan, incorporated by reference to Exhibit 10.7 to Registrant’s Report on Form 10-Q filed on October 31, 2007. | |
| *10.20 |
Form of U.S. Restricted Stock Units Agreement under International Flavors & Fragrances Inc. 2000 Stock Award and Incentive Plan incorporated by reference to Exhibit 10.5 to Registrant’s Report on Form 10-Q filed on October 31, 2007. | |
78
Table of Contents
| Number |
||
| *10.21 |
Form of U.S. Purchased Restricted Stock Agreement under International Flavors & Fragrances Inc. 2000 Stock Award and Incentive Plan , incorporated by reference to Exhibit 10.4 to Registrant’s Report on Form 10-Q filed on October 31, 2007. | |
| *10.22 |
Form of U.S. Stock Settled Appreciation Rights Agreement under International Flavors & Fragrances Inc. 2000 Stock Award and Incentive Plan, incorporated by reference to Exhibit 10.6 to Registrant’s Report on Form 10-Q filed on October 31, 2007. | |
| *10.23 |
Non-Employee Director Compensation Arrangements, adopted by the Company’s Board of Directors on March 6, 2007, incorporated by reference to Registrant’s Report on Form 8-K filed on March 12, 2007. | |
| *10.24 |
Form of Restricted Stock Units Agreement under International Flavors & Fragrances Inc. 2000 Stock Award and Incentive Plan incorporated by reference to Registrant’s Report on 10-Q filed on August 5, 2009. | |
| *10.25 |
Form of Purchased Restricted Stock Agreement under International Flavors & Fragrances Inc. 2000 Stock Award and Incentive Plan incorporated by reference to Registrant’s Report on 10-Q filed on August 5, 2009. | |
| *10.26 |
Form of U.S. Performance-Based Restricted Stock Units Agreement under International Flavors & Fragrances Inc. 2000 Stock Award and Incentive Plan, incorporated by reference to Exhibit 10.8b to Registrant’s Report on Form 8-K filed on October 7, 2004 (SEC file number reference 001-04858). | |
| *10.27 |
Form of Employee Stock Option Agreement under International Flavors & Fragrances Inc. 2000 Stock Award and Incentive Plan, incorporated by reference to Exhibit 10.1 to Registrant’s Report on Form 10-Q filed on November 9, 2004 (SEC file number reference 001-04858). | |
| *10.28 |
Form of International Flavors & Fragrances Inc. Stock Option Agreement under 2000 Stock Option Plan for Non-Employee Directors, incorporated by reference to Exhibit 10.2 to Registrant’s Report on Form 10-Q filed on November 9, 2004 (SEC file number reference 001-04858). | |
| *10.29 |
Restated and Amended Executive Separation Policy as amended through and including December 31, 2007, incorporated by reference to Exhibit 10.1 to Registrant’s Report on Form 10-Q filed on July 30, 2008. | |
| *10.30 |
1997 Employee Stock Option Plan, incorporated by reference to Exhibit 10.18 to Registrant’s Report on Form 10-K filed on March 13, 2006. | |
| *10.31 |
Amendment to 1997 Employee Stock Option Plan as amended by Registrant’s Board of Directors on February 8, 2000, incorporated by reference to Exhibit 10.19 to Registrant’s Report on Form 10-K filed on March 13, 2006. | |
| *10.32 |
Resolutions Relating to Equity Awards as approved by the Board of Directors of the Registrant on January 29, 2007 incorporated by reference to Exhibit 10.25 to Registrant’s Report on Form 10-K filed on February 23, 2007. | |
| *10.33 |
Deferred Compensation Plan adopted by Registrant’s Board of Directors on December 12, 2000 as amended and restated through December 9, 2008 incorporated by reference to Exhibit 10.28 to Registrant’s Report on Form 10-K filed on February 26, 2009. | |
| *10.34 |
Trust Agreement dated October 4, 2000 among Registrant, First Union National Bank and Buck Consultants Inc. approved by Registrant’s Board of Directors on September 12, 2000, incorporated by reference to Exhibit 10.21 to Registrant’s Report on Form 10-K filed on March 13, 2006. | |
79
Table of Contents
| Number |
||
| *10.35 |
Amendment dated August 2, 2005 to the Trust Agreement dated October 4, 2000 among Registrant, Wachovia Bank, N.A. (formerly First Union National Bank) and Buck Consultants LLC (formerly Buck Consultants Inc.), incorporated by reference to Exhibit 10.1 to Registrant’s Report on Form 10-Q filed on August 5, 2005. | |
| *10.36 |
1990 Stock Option Plan for Non-Employee Directors, incorporated by reference to Exhibit 10.23 to Registrant’s Report on Form 10-K filed on March 13, 2006. | |
| *10.37 |
2000 Stock Option Plan for Non-Employee Directors as amended and restated as of December 15, 2004, incorporated by reference to Exhibit 10.2 to Registrant’s Report on Form 8-K filed on December 20, 2004 (SEC file number reference 001-04858). | |
| *10.38(a) |
Director Charitable Contribution Program, adopted by the Board of Directors on December 8, 2009. | |
| *10.38(b) |
Summary of director charitable contribution arrangement between the Registrant and Arthur C. Martinez incorporated by reference to Exhibit 10.33(b) to Registrant’s Report on Form 10-K filed on February 27, 2008. | |
| *10.39 |
Resolutions approving Non-Employee Directors’ Annual Stock Grant Program, adopted by Registrant’s Board of Directors on September 12, 2000, incorporated by reference to Exhibit 99(c) to Registrant’s Registration Statement on Form S-3 filed on September 29, 2000 (Reg. No. 333-46932). | |
| *10.40 |
Separation Agreement dated July 22, 2008 between Registrant and Douglas J. Wetmore, former Senior Vice President and Chief Financial Officer, incorporated by reference to Exhibit 10.2 to Registrant’s Report on Form 8-K filed on July 28, 2008. | |
| 10.41 |
Multi-currency Revolving Credit Facility Agreement, dated November 23, 2005, among the Registrant, International Flavors & Fragrances (Luxembourg) S.A.R.L., certain subsidiaries, the banks named therein, including Citigroup Global Markets Limited, Fortis Bank S.A./N.V., Bank of America N.A., Bank of Tokyo-Mitsubishi Trust Company, BNP Paribas, ING Bank N.V., J.P. Morgan Chase and Wachovia Bank, National Association, as mandated lead arrangers, and Citibank International PLC, as Facility Agent, incorporated by reference to Exhibit 4.1 to Registrant’s Report on Form 8-K filed on November 29, 2005. | |
| 10.42 |
Amendment Agreement dated September 17, 2007 to the Multicurrency Revolving Credit Facility Agreement dated November 23, 2005 among the Company, certain subsidiaries of the Company, and Citibank International PLC as agent on behalf of itself and others, incorporated by reference to Exhibit 10.1 to Registrant’s Report on Form 10-Q filed on October 31, 2007. | |
| 10.43 |
Amendment dated September 27, 2007 (and confirmed on November 6, 2007) to the Multi-currency Revolving Credit Facility Agreement dated November 23, 2005, extending the Termination Date for an additional period of 365 days until 2012, incorporated by reference to Exhibit 10.40 to Registrant’s Report on Form 10-Q filed on February 27, 2008. | |
| 10.44 |
Confirmation, dated September 14, 2007, between International Flavors & Fragrances Inc. and Morgan Stanley & Co. Incorporated, incorporated by reference to Exhibit 10.1 to Registrant’s Form 8-K filed with the SEC on September 18, 2007. | |
| 10.45 |
Confirmation, dated September 14, 2007, between International Flavors & Fragrances Inc. and Morgan Stanley & Co. Incorporated, incorporated by reference to Exhibit 10.2 to Registrant’s Form 8-K filed with the SEC on September 18, 2007. | |
| 21 |
List of Principal Subsidiaries. | |
| 23 |
Consent of PricewaterhouseCoopers LLP. | |
80
Table of Contents
| Number |
||
| 31.1 |
Certification of Kevin C. Berryman pursuant to Section 302 of the Sarbanes-Oxley Act of 2002. | |
| 31.2 |
Certification of Nicolas Mirzayantz pursuant to Section 302 of the Sarbanes-Oxley Act of 2002. | |
| 31.3 |
Certification of Hernan Vaisman pursuant to Section 302 of the Sarbanes-Oxley Act of 2002. | |
| 32 |
Certification of Kevin C. Berryman, Nicolas Mirzayantz and Hernan Vaisman pursuant to 18 U.S.C. Section 1350 as adopted pursuant to the Sarbanes-Oxley Act of 2002. | |
| * | Management contract or compensatory plan or arrangement |
81
Table of Contents
Pursuant to the requirements of Section 13 of the Securities Exchange Act of 1934, the Registrant has duly caused this report to be signed on its behalf by the undersigned hereunto duly authorized.
| INTERNATIONAL FLAVORS & FRAGRANCES INC. (Registrant) | ||
| By: | /s/ KEVIN C. BERRYMAN | |
| Kevin C. Berryman | ||
| Member, Temporary Office of the Chief Executive Officer and Executive Vice President and Chief Financial Officer | ||
Dated: February 25, 2010
Pursuant to the requirements of the Securities Exchange Act of 1934, this report has been signed below on February 25, 2010 by the following persons on behalf of the Registrant and in the capacities and on the date indicated:
| Principal Executive Officer and Principal Financial and Accounting Officer: |
| /s/ KEVIN C. BERRYMAN |
| Kevin C. Berryman |
| Member, Temporary Office of the Chief Executive Officer and Executive Vice President and Chief Financial Officer |
| Principal Executive Officer: |
| /s/ NICOLAS MIRZAYANTZ |
| Nicolas Mirzayantz |
| Member, Temporary Office of the Chief Executive Officer and Group President, Fragrances |
| Principal Executive Officer: |
| /s/ HERNAN VAISMAN |
| Hernan Vaisman |
| Member, Temporary Office the Chief Executive Officer and Group President, Flavors |
| Directors: |
| /s/ DOUGLAS D. TOUGH |
| DOUGLAS D. TOUGH |
| /s/ MARGARET HAYES ADAME |
| MARGARET HAYES ADAME |
82
Table of Contents
| /s/ MARCELLO BOTTOLI |
| MARCELLO BOTTOLI |
| /s/ LINDA B. BUCK |
| LINDA B. BUCK |
| /s/ J. MICHAEL COOK |
| J. MICHAEL COOK |
| /s/ PETER A. GEORGESCU |
| PETER A. GEORGESCU |
| /s/ ALEXANDRA A. HERZAN |
| ALEXANDRA A. HERZAN |
| /s/ HENRY W. HOWELL, JR. |
| HENRY W. HOWELL, JR. |
| /s/ KATHERINE M. HUDSON |
| KATHERINE M. HUDSON |
| /s/ ARTHUR C. MARTINEZ |
| ARTHUR C. MARTINEZ |
| /s/ BURTON M. TANSKY |
| BURTON M. TANSKY |
83
Table of Contents
INTERNATIONAL FLAVORS & FRAGRANCES INC. AND SUBSIDIARIES
SCHEDULE II —VALUATION AND QUALIFYING ACCOUNTS AND RESERVES
(IN THOUSANDS)
| For the Year Ended December 31, 2009 | ||||||||||||||||
| Balance at beginning of period |
Additions charged to costs and expenses |
Accounts written off |
Translation adjustments |
Balance at end of period | ||||||||||||
| Allowance for doubtful accounts |
$ | 11,156 | $ | 2,928 | $ | 4,853 | $ | 1,032 | $ | 10,263 | ||||||
| Valuation allowance on credit and operating loss carry forwards and certain net deferred tax assets |
178,921 | 31,651 | — | 2,133 | 212,705 | |||||||||||
| $ | 190,077 | $ | 34,579 | $ | 4,853 | $ | 3,165 | $ | 222,968 | |||||||
| For the Year Ended December 31, 2008 | ||||||||||||||||
| Balance at beginning of period |
Additions charged to costs and expenses |
Accounts written off |
Translation adjustments |
Balance at end of period | ||||||||||||
| Allowance for doubtful accounts |
$ | 11,694 | $ | 4,630 | $ | 3,932 | $ | (1,236 | ) | $ | 11,156 | |||||
| Valuation allowance on credit and operating loss carry forwards |
171,600 | 12,750 | — | (5,429 | ) | 178,921 | ||||||||||
| $ | 183,294 | $ | 17,380 | $ | 3,932 | $ | (6,665 | ) | $ | 190,077 | ||||||
| For the Year Ended December 31, 2007 | ||||||||||||||||
| Balance at beginning of period |
Additions charged to costs and expenses |
Accounts written off |
Translation adjustments |
Balance at end of period | ||||||||||||
| Allowance for doubtful accounts |
$ | 12,715 | $ | 1,369 | $ | 3,407 | $ | 1,017 | $ | 11,694 | ||||||
| Valuation allowance on credit and operating loss carry forwards |
141,200 | 16,818 | — | 13,582 | 171,600 | |||||||||||
| $ | 153,915 | $ | 18,187 | $ | 3,407 | $ | 14,599 | $ | 183,294 | |||||||
S-1
Table of Contents
INTERNATIONAL FLAVORS & FRAGRANCES INC.
INVESTOR INFORMATION
ANNUAL MEETING
The Annual Meeting of Shareholders will be held at the offices of the Company, 521 West 57th Street, New York, New York, on April 27, 2010 at 10:00 a.m., EDT.
IFF will be furnishing proxy materials to shareholders on the internet, rather than mailing printed copies of those materials to each shareholder. A Notice of Internet Availability of Proxy Materials will be mailed to each shareholder on or about March 9, 2010, which will provide instructions as to how shareholders may access and review the proxy materials for the 2010 Annual Meeting on the website referred to in the Notice or, alternatively, how to request a printed copy of the proxy materials be sent to them by mail.
TRANSFER AGENT AND REGISTRAR
American Stock Transfer & Trust Company
59 Maiden Lane
New York, New York 10038
800-937-5449
www.amstock.com
LISTED
New York Stock Exchange
INDEPENDENT REGISTERED PUBLIC ACCOUNTING FIRM
PricewaterhouseCoopers LLP
WEB SITE
www.iff.com
85