Attached files
| file | filename |
|---|---|
| 8-K - CURRENT REPORT - FlexShopper, Inc. | f8k091015_flexshop.htm |
Exhibit 99.1

(FPAY) Rodman & Renshaw September 10, 2015

2 Safe Harbor THIS PRESENTATION INCLUDES FORWARD - LOOKING STATEMENTS THAT ARE MADE PURSUANT TO THE "SAFE HARBOR" PROVISIONS OF THE PRIVATE SECURITIES LITIGATION REFORM ACT OF 1995 . FORWARD - LOOKING STATEMENTS INVOLVE INHERENT RISKS AND UNCERTAINTIES WHICH COULD CAUSE ACTUAL RESULTS TO DIFFER MATERIALLY FROM THOSE IN THE FORWARD - LOOKING STATEMENTS, AS A RESULT OF VARIOUS FACTORS INCLUDING THOSE RISKS AND UNCERTAINTIES DESCRIBED IN THE RISK FACTORS AND IN MANAGEMENT’S DISCUSSION AND ANALYSIS OF FINANCIAL CONDITION AND RESULTS OF OPERATIONS SECTIONS OF THE OFFERING MEMORANDUM AND THE COMPANY’S MOST RECENTLY FILED ANNUAL REPORT ON FORM 10 - K AND OUR SUBSEQUENTLY FILED QUARTERLY REPORTS ON FORM 10 - Q . WE URGE YOU TO CONSIDER THOSE RISKS AND UNCERTAINTIES IN EVALUATING OUR FORWARD - LOOKING STATEMENTS . WE CAUTION READERS NOT TO PLACE UNDUE RELIANCE UPON ANY SUCH FORWARD - LOOKING STATEMENTS, WHICH SPEAK ONLY AS OF THE DATE MADE . IN THIS DOCUMENT, WE REFER TO INFORMATION REGARDING POTENTIAL MARKETS AND OTHER INDUSTRY DATA . WE BELIEVE THAT ALL SUCH INFORMATION HAS BEEN OBTAINED FROM RELIABLE SOURCES THAT ARE CUSTOMARILY RELIED UPON BY COMPANIES IN OUR INDUSTRY . HOWEVER, WE HAVE NOT INDEPENDENTLY VERIFIED ANY SUCH INFORMATION . THIS PRESENTATION INCLUDES A GROSS PROFIT CALCULATION, WHICH IS A FINANCIAL MEASURE NOT CALCULATED OR PRESENTED IN ACCORDANCE WITH US GAAP . WE BELIEVE THIS NON - GAAP MEASURE PROVIDES USEFUL SUPPLEMENTAL INFORMATION FOR PERIOD - TO - PERIOD COMPARISONS OF OUR BUSINESS AND CAN ASSIST INVESTORS AND OTHERS IN UNDERSTANDING AND EVALUATING OUR OPERATING RESULTS . HOWEVER, THIS NON - GAAP MEASURE SHOULD NOT BE CONSIDERED IN ISOLATION OR AS AN ALTERNATIVE TO ANY MEASURES OF FINANCIAL PERFORMANCE CALCULATED AND PRESENTED IN ACCORDANCE WITH GAAP . OTHER COMPANIES MAY CALCULATE THIS NON - GAAP MEASURE DIFFERENTLY THAN WE DO . A RECONCILIATION TO GAAP MEASURES IS INCLUDED IN THE PRESENTATION . THE TRADEMARKS/LOGOS APPEARING IN THIS PRESENTATION BELONG TO THEIR RESPECTIVE OWNERS AND DO NOT PROVIDE OR IMPLY ANY ENDORSEMENT, SPONSORSHIP OR AFFILIATION .

3 Transforming the Lease - to - Own (LTO) Industry through e - Commerce $25B Market Traditional Retail Penetration Evaporation of Subprime credit since 2008 Technology Converging Trends Creating a Market Opportunity

4 Expanding the LTO Market 50+ Million People FPAY With its multiple sales channels, FlexShopper will attract new customers that are not near LTO stores or prefer the selection available on an online or mobile shopping experience Brick and Mortar LTO Stores - customers that want more choices and an online experience Traditional Retail/ Etail - customers that want an LTO payment method

5 FPAY Services

6
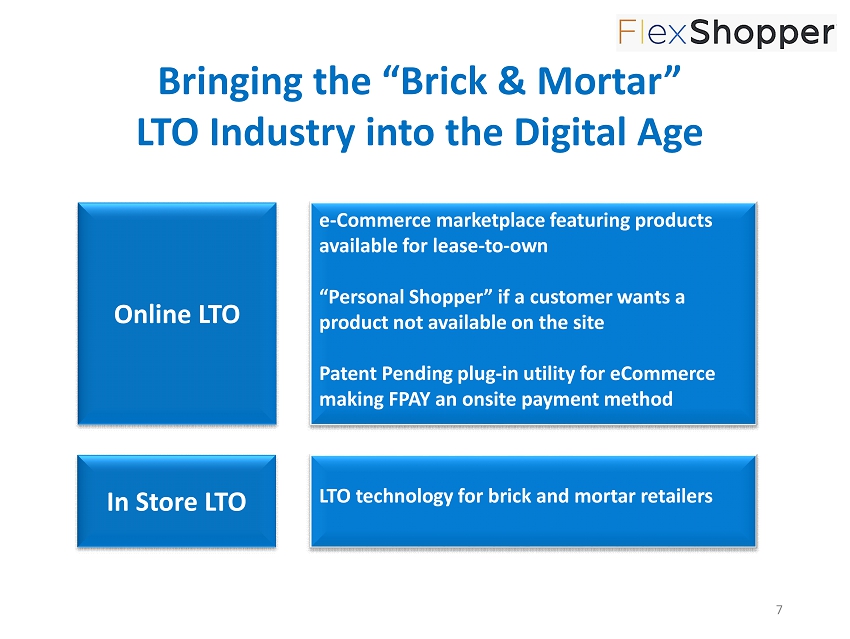
7 Bringing the “Brick & Mortar” LTO Industry into the Digital Age e - Commerce marketplace featuring products available for lease - to - own “Personal Shopper” if a customer wants a product not available on the site Patent Pending plug - in utility for eCommerce making FPAY an onsite payment method Online LTO In Store LTO LTO technology for brick and mortar retailers

8 E - commerce marketplace Product feeds from durable goods retailers Partners get sales with no acquisition costs No inventory risk for FPAY All drop shipped

9 E - commerce Marketplace

10 E - commerce Marketplace

11 “Personal Shopper” Customer provides FPAY with a url /link to a product and FPAY facilitates the transaction

12 Patent Pending LTO Payment Method Plug - in utility for e - Commerce making FPAY LTO an onsite payment method

13 In Store Payment Method Retailers embracing LTO funding methods to save sales LTO technology for brick and mortar retailers

14 Transaction Example Consumer desires a product and doesn’t have the funds and challenged credit FPAY purchases the product from an online vendor FPAY owns the item; transaction is non - recourse to vendor; FPAY handles customer service FPAY leases the product to the consumer; consumer owns after 52 weekly payments Consumer, with up to date payments, may: return the item and terminate the lease at any time or, can purchase early by paying 65% of the remaining payments

15 Benefits Easy access to an online LTO program Freedom of choice: Access to name - brand products at a nationally recognized retailer Consumer not limited to the small selection at retail LTO stores Increased Sales from consumers without funds or challenged credit 100 % of retail price paid Expanded customer base Low or no customer acquisition cost Consumer Benefits Retailer Benefits

16 FPAY Overview
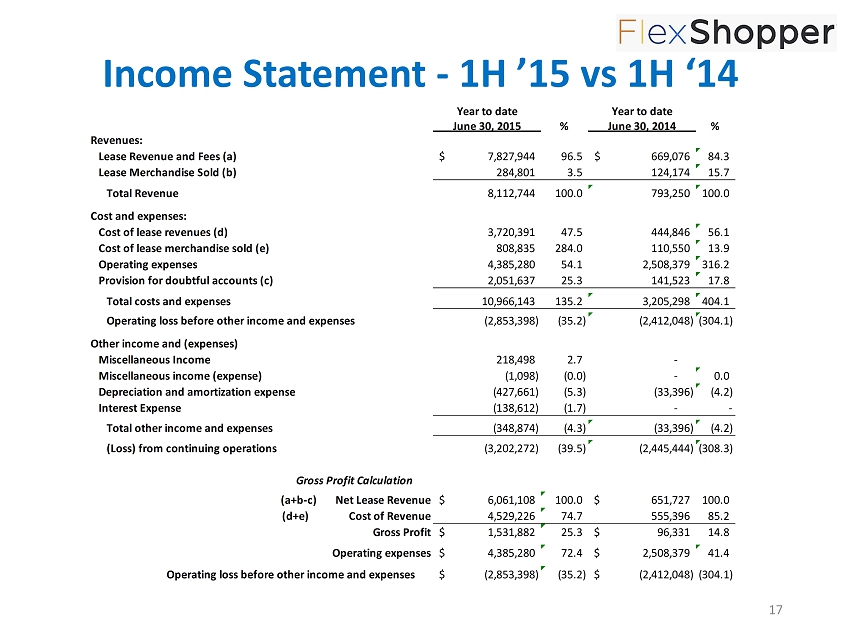
17 Income Statement - 1H ’15 vs 1H ‘14 Year to date Year to date June 30, 2015 % June 30, 2014 % Revenues: Lease Revenue and Fees (a) 7,827,944$ 96.5 669,076$ 84.3 Lease Merchandise Sold (b) 284,801 3.5 124,174 15.7 Total Revenue 8,112,744 100.0 793,250 100.0 Cost and expenses: Cost of lease revenues (d) 3,720,391 47.5 444,846 56.1 Cost of lease merchandise sold (e) 808,835 284.0 110,550 13.9 Operating expenses 4,385,280 54.1 2,508,379 316.2 Provision for doubtful accounts (c) 2,051,637 25.3 141,523 17.8 Total costs and expenses 10,966,143 135.2 3,205,298 404.1 Operating loss before other income and expenses (2,853,398) (35.2) (2,412,048) (304.1) Other income and (expenses) Miscellaneous Income 218,498 2.7 - Miscellaneous income (expense) (1,098) (0.0) - 0.0 Depreciation and amortization expense (427,661) (5.3) (33,396) (4.2) Interest Expense (138,612) (1.7) - - Total other income and expenses (348,874) (4.3) (33,396) (4.2) (Loss) from continuing operations (3,202,272) (39.5) (2,445,444) (308.3) Gross Profit Calculation (a+b-c) Net Lease Revenue 6,061,108$ 100.0 651,727$ 100.0 (d+e) Cost of Revenue 4,529,226 74.7 555,396 85.2 Gross Profit 1,531,882$ 25.3 96,331$ 14.8 Operating expenses 4,385,280$ 72.4 2,508,379$ 41.4 Operating loss before other income and expenses (2,853,398)$ (35.2) (2,412,048)$ (304.1)

18 Lease Trends (#) 34 166 539 584 773 720 1,434 1,416 959 1,449 2,112 2,601 1,180 1,165 1,393 1,904 2,131 2,884 - 500 1,000 1,500 2,000 2,500 3,000 3,500 Jan Feb Mar Apr May Jun July Aug Sep Oct Nov Dec Number of Leases 2014 2015 Note: Lease count, net of cancellations, as of June 30 th , 2015

19 Lease Trends ($000s) 26 173 437 449 591 480 845 781 542 820 1,167 1,362 668 656 775 988 1,036 1,424 - 200 400 600 800 1,000 1,200 1,400 1,600 Jan Feb Mar Apr May Jun July Aug Sep Oct Nov Dec Lease Value ($000s) 2014 2015 Note: Lease value, net of cancellations, as of June 30 th , 2015

20

21 FPAY Highlights Only LTO site with 85,000+ items from recognized national and regional retailers 2 - 3x lease growth over prior year periods FPAY planning to transition from OTCQB to NASDAQ in 2016 Up to $100mm facility from Waterfall Asset Management to support growth

22 Q & A