Attached files
| file | filename |
|---|---|
| 8-K - 8-K - EP Energy Corp | a15-19062_18k.htm |
Exhibit 99.1
|
|
Barclays CEO Energy-Power Conference Brent Smolik Chairman, President and Chief Executive Officer EP Energy Corporation September 9, 2015 |
|
|
Cautionary Statement Regarding Forward-Looking Statements This presentation includes certain forward-looking statements and projections of EP Energy. EP Energy has made every reasonable effort to ensure that the information and assumptions on which these statements and projections are based are current, reasonable, and complete. However, a variety of factors could cause actual results to differ materially from the projections, anticipated results or other expectations expressed, including, without limitation, the supply and demand for oil, natural gas and NGLs; changes in commodity prices and basis differentials for oil and natural gas; EP Energy’s ability to meet production volume targets; the uncertainty of estimating proved reserves and unproved resources; the future level of service and capital costs; the availability and cost of financing to fund future exploration and production operations; the success of drilling programs with regard to proved undeveloped reserves and unproved resources; EP Energy’s ability to comply with the covenants in various financing documents; EP Energy’s ability to obtain necessary governmental approvals for proposed E&P projects and to successfully construct and operate such projects; actions by the credit rating agencies; credit and performance risk of EP Energy’s lenders, trading counterparties, customers, vendors and suppliers; general economic and weather conditions in geographic regions or markets served by EP Energy, or where operations of EP Energy are located, including the risk of a global recession and negative impact on oil and natural gas demand; the uncertainties associated with governmental regulation, including any potential changes in federal and state tax laws and regulation; and other factors described in EP Energy’s Securities and Exchange Commission filings. While EP Energy makes these statements and projections in good faith, neither EP Energy nor its management can guarantee that anticipated future results will be achieved. Reference must be made to those filings for additional important factors that may affect actual results. EP Energy assumes no obligation to publicly update or revise any forward-looking statements made herein or any other forward-looking statements made by EP Energy, whether as a result of new information, future events, or otherwise. This presentation presents certain production and reserves-related information on an "equivalency" basis. Equivalent volumes are computed with natural gas converted to barrels at a ratio of six Mcf to one Bbl. These conversions are based on energy equivalency conversion methods primarily applicable at the burner tip and do not represent value equivalencies at the wellhead. Although these conversion factors are industry accepted norms, they are not reflective of price or market value differentials between product types. This presentation refers to certain non-GAAP financial measures such as “Adjusted EBITDAX” and “Adjusted Cash Operating Costs”. Definitions of these measures and reconciliation between U.S. GAAP and non-GAAP financial measures are included in the Second Quarter 2015 Financial and Operational Reporting Package at epenergy.com. |
|
|
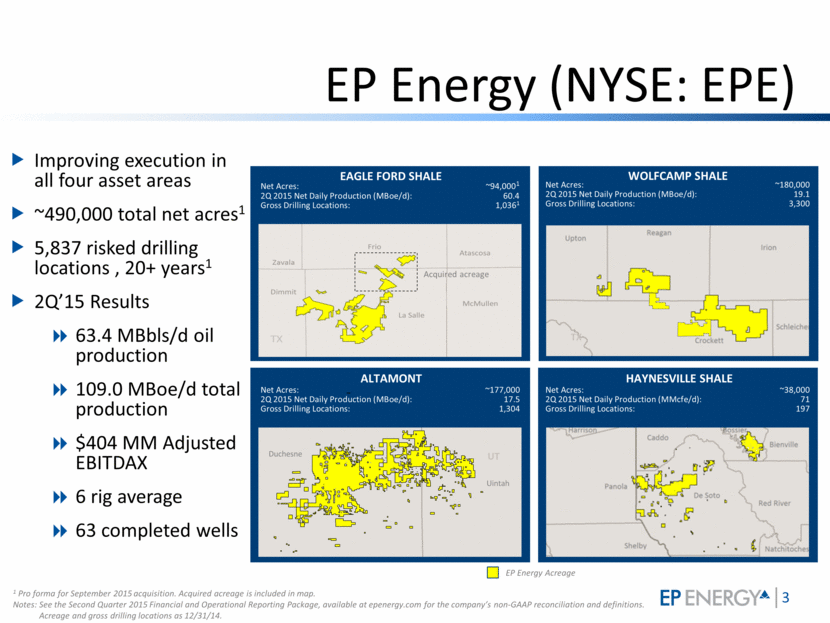
EP Energy (NYSE: EPE) Improving execution in all four asset areas ~490,000 total net acres1 5,837 risked drilling locations , 20+ years1 2Q’15 Results 63.4 MBbls/d oil production 109.0 MBoe/d total production $404 MM Adjusted EBITDAX 6 rig average 63 completed wells 1 Pro forma for September 2015 acquisition. Acquired acreage is included in map. Notes: See the Second Quarter 2015 Financial and Operational Reporting Package, available at epenergy.com for the company’s non-GAAP reconciliation and definitions. Acreage and gross drilling locations as 12/31/14. Net Acres: ~94,0001 2Q 2015 Net Daily Production (MBoe/d): 60.4 Gross Drilling Locations: 1,0361 EAGLE FORD SHALE EP Energy Acreage Net Acres: ~180,000 2Q 2015 Net Daily Production (MBoe/d): 19.1 Gross Drilling Locations: 3,300 HAYNESVILLE SHALE Net Acres: ~38,000 2Q 2015 Net Daily Production (MMcfe/d): 71 Gross Drilling Locations: 197 ALTAMONT Net Acres: ~177,000 2Q 2015 Net Daily Production (MBoe/d): 17.5 Gross Drilling Locations: 1,304 WOLFCAMP SHALE UT TX Acquired acreage |
|
|
EPE: Compelling Value Improving performance of high-quality assets Reducing capital and operating costs Increasing well-level returns and asset value Improving financial position Proven track record of improving performance through market cycles |
|
|
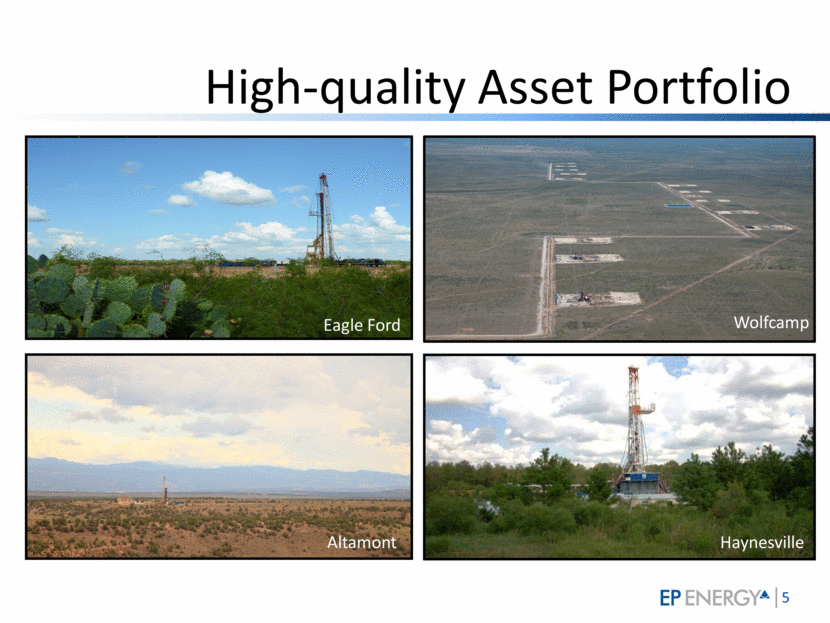
Wolfcamp High-quality Asset Portfolio Altamont Eagle Ford Haynesville |
|
|
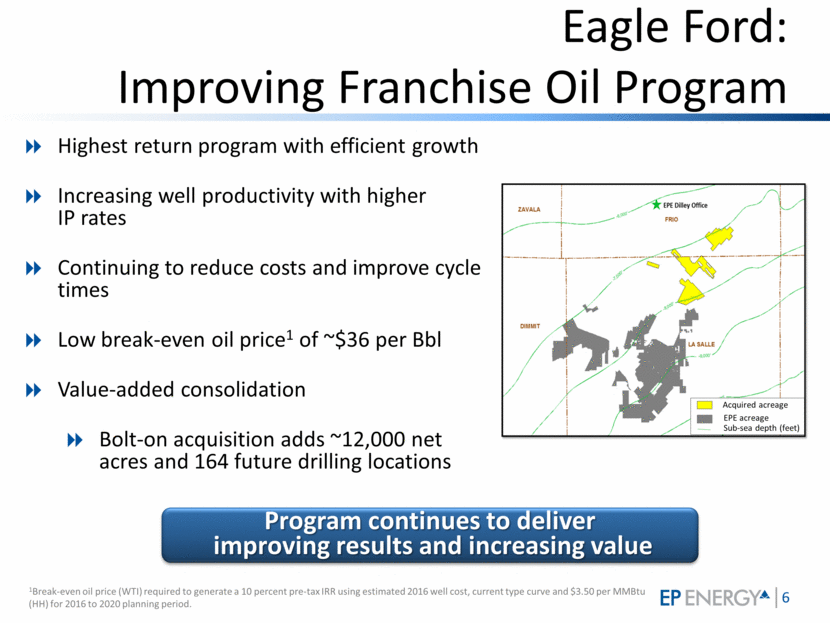
Eagle Ford: Improving Franchise Oil Program Highest return program with efficient growth Increasing well productivity with higher IP rates Continuing to reduce costs and improve cycle times Low break-even oil price1 of ~$36 per Bbl Value-added consolidation Bolt-on acquisition adds ~12,000 net acres and 164 future drilling locations Program continues to deliver improving results and increasing value 1Break-even oil price (WTI) required to generate a 10 percent pre-tax IRR using estimated 2016 well cost, current type curve and $3.50 per MMBtu (HH) for 2016 to 2020 planning period. Sub-sea depth (feet) EPE acreage Acquired acreage |
|
|
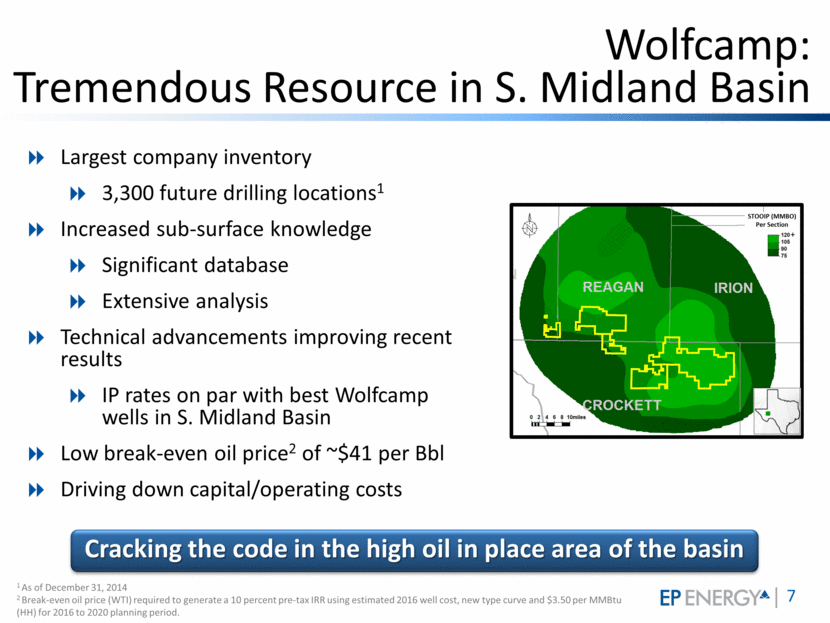
Wolfcamp: Tremendous Resource in S. Midland Basin Largest company inventory 3,300 future drilling locations1 Increased sub-surface knowledge Significant database Extensive analysis Technical advancements improving recent results IP rates on par with best Wolfcamp wells in S. Midland Basin Low break-even oil price2 of ~$41 per Bbl Driving down capital/operating costs Cracking the code in the high oil in place area of the basin 1 As of December 31, 2014 2 Break-even oil price (WTI) required to generate a 10 percent pre-tax IRR using estimated 2016 well cost, new type curve and $3.50 per MMBtu (HH) for 2016 to 2020 planning period. STOOIP (MMBO) Per Section |
|
|
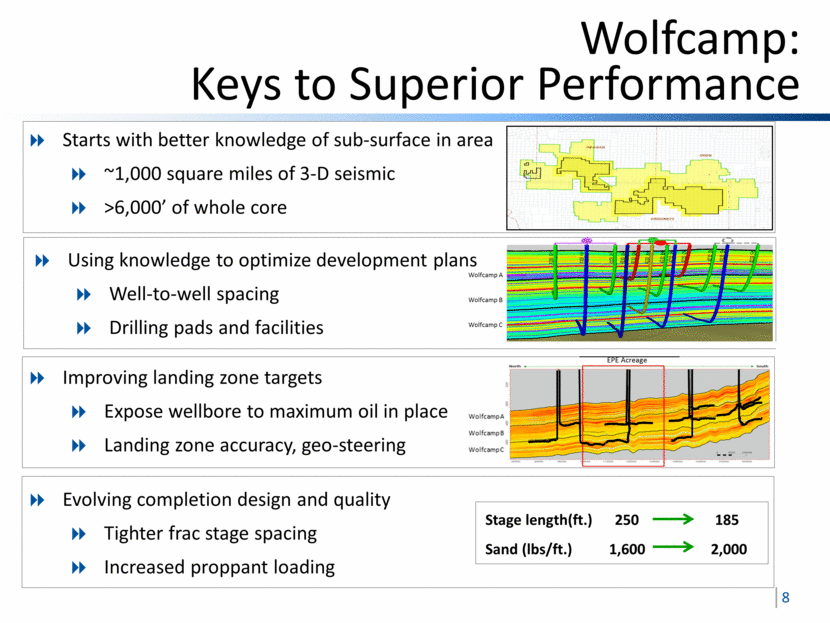
Wolfcamp: Keys to Superior Performance Starts with better knowledge of sub-surface in area ~1,000 square miles of 3-D seismic >6,000’ of whole core Using knowledge to optimize development plans Well-to-well spacing Drilling pads and facilities Improving landing zone targets Expose wellbore to maximum oil in place Landing zone accuracy, geo-steering Evolving completion design and quality Tighter frac stage spacing Increased proppant loading Wolfcamp A Wolfcamp B Wolfcamp C Stage length(ft.) 250 185 Sand (lbs/ft.) 1,600 2,000 EPE Acreage |
|
|
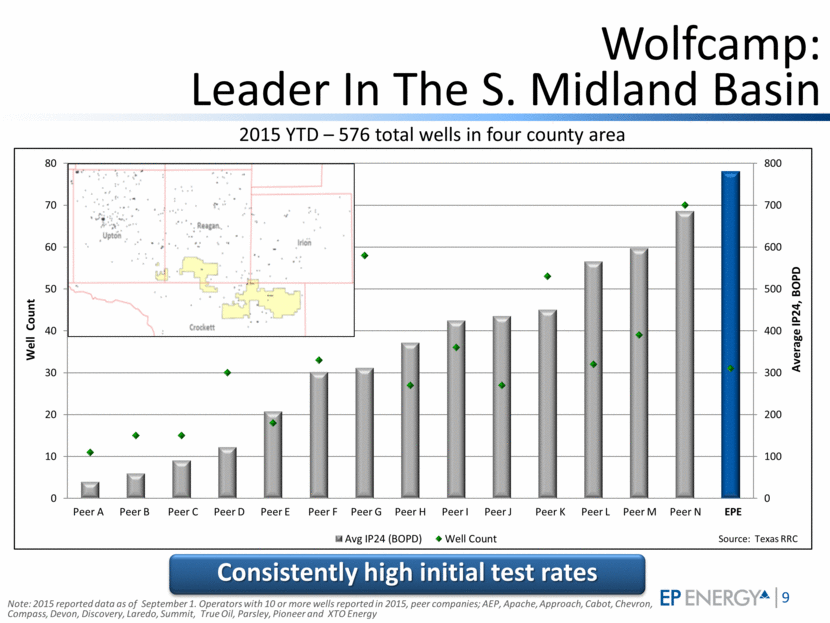
Wolfcamp: Leader In The S. Midland Basin Consistently high initial test rates 2015 YTD – 576 total wells in four county area Note: 2015 reported data as of September 1. Operators with 10 or more wells reported in 2015, peer companies; AEP, Apache, Approach, Cabot, Chevron, Compass, Devon, Discovery, Laredo, Summit, True Oil, Parsley, Pioneer and XTO Energy Source: Texas RRC Peer A Peer B Peer C Peer D Peer E Peer F Peer G Peer H Peer I Peer J Peer K Peer L Peer M Peer N EPE Well Count Average IP24, BOPD 0 100 200 300 400 500 600 700 800 0 10 20 30 40 50 60 70 80 Avg IP24 (BOPD) Well Count |
|
|
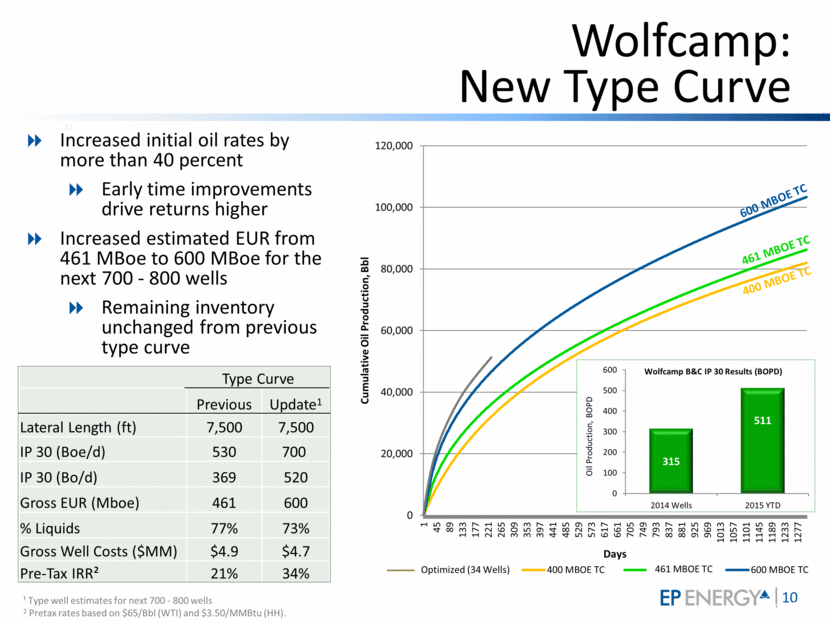
Wolfcamp: New Type Curve 23 Increased initial oil rates by more than 40 percent Early time improvements drive returns higher Increased estimated EUR from 461 MBoe to 600 MBoe for the next 700 - 800 wells Remaining inventory unchanged from previous type curve Type Curve Previous Update1 Lateral Length (ft) 7,500 7,500 IP 30 (Boe/d) 530 700 IP 30 (Bo/d) 369 520 Gross EUR (Mboe) 461 600 % Liquids 77% 73% Gross Well Costs ($MM) $4.9 $4.7 Pre-Tax IRR² 21% 34% ¹ Type well estimates for next 700 - 800 wells 2 Pretax rates based on $65/Bbl (WTI) and $3.50/MMBtu (HH). 461 MBOE TC 400 MBOE TC 600 MBOE TC Oil Production, BOPD Wolfcamp B&C IP 30 Results (BOPD) 461 MBOE TC 0 20,000 40,000 60,000 80,000 100,000 120,000 1 45 89 133 177 221 265 309 353 397 441 485 529 573 617 661 705 749 793 837 881 925 969 1013 1057 1101 1145 1189 1233 1277 Cumulative Oil Production, Bbl Days 400 MBOE TC 450 MBOE TC 600 MBOE TC Optimized (34 Wells) 315 511 0 100 200 300 400 500 600 2014 Wells 2015 YTD |
|
|
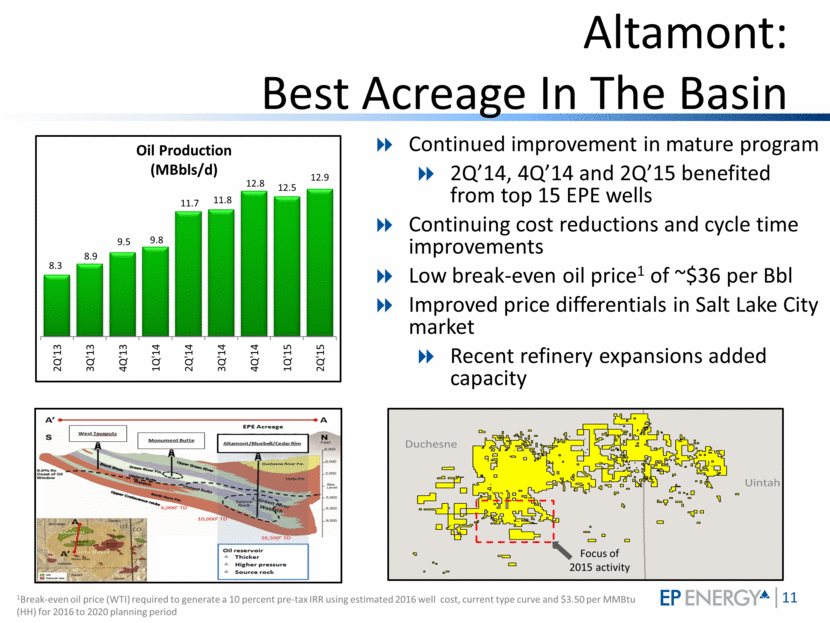
Altamont: Best Acreage In The Basin Continued improvement in mature program 2Q’14, 4Q’14 and 2Q’15 benefited from top 15 EPE wells Continuing cost reductions and cycle time improvements Low break-even oil price1 of ~$36 per Bbl Improved price differentials in Salt Lake City market Recent refinery expansions added capacity Oil Production (MBbls/d) Focus of 2015 activity 1Break-even oil price (WTI) required to generate a 10 percent pre-tax IRR using estimated 2016 well cost, current type curve and $3.50 per MMBtu (HH) for 2016 to 2020 planning period 8.3 8.9 9.5 9.8 11.7 11.8 12.8 12.5 12.9 2Q'13 3Q'13 4Q'13 1Q'14 2Q'14 3Q'14 4Q'14 1Q'15 2Q'15 |
|
|
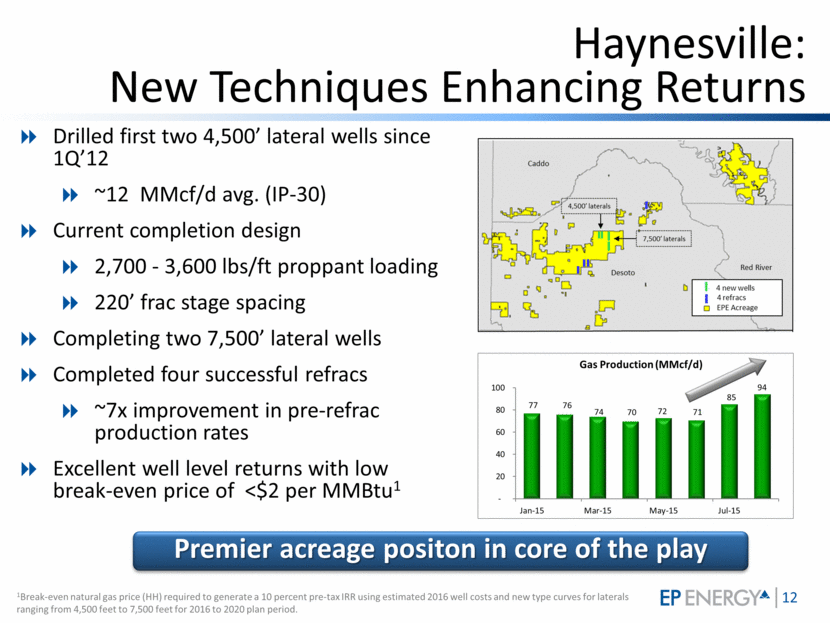
Haynesville: New Techniques Enhancing Returns Drilled first two 4,500’ lateral wells since 1Q’12 ~12 MMcf/d avg. (IP-30) Current completion design 2,700 - 3,600 lbs/ft proppant loading 220’ frac stage spacing Completing two 7,500’ lateral wells Completed four successful refracs ~7x improvement in pre-refrac production rates Excellent well level returns with low break-even price of <$2 per MMBtu1 Premier acreage positon in core of the play 1Break-even natural gas price (HH) required to generate a 10 percent pre-tax IRR using estimated 2016 well costs and new type curves for laterals ranging from 4,500 feet to 7,500 feet for 2016 to 2020 plan period. Gas Production (MMcf/d) 77 76 74 70 72 71 85 94 - 20 40 60 80 100 Jan-15 Mar-15 May-15 Jul-15 |
|
|
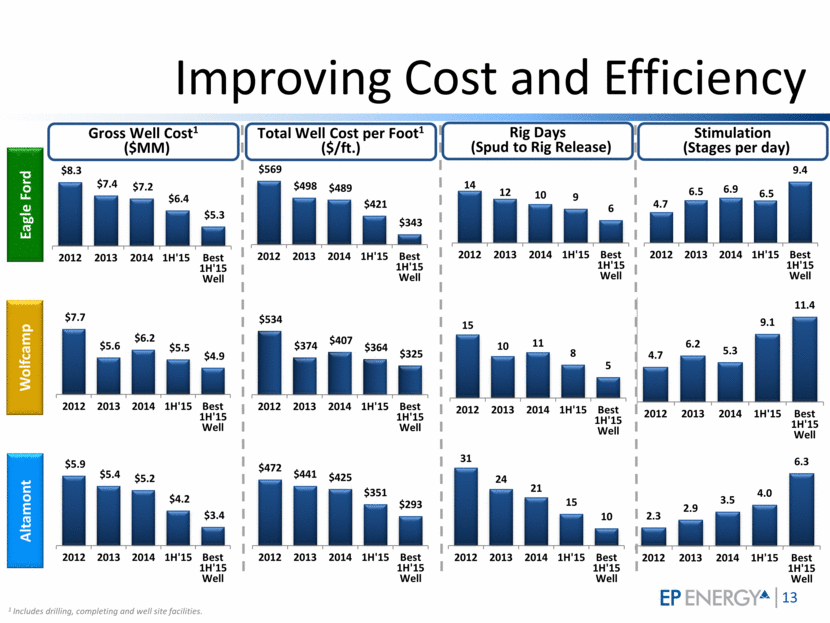
Improving Cost and Efficiency 1 Includes drilling, completing and well site facilities. Eagle Ford Altamont Wolfcamp Gross Well Cost1 ($MM) Rig Days (Spud to Rig Release) Stimulation (Stages per day) Total Well Cost per Foot1 ($/ft.) $8.3 $7.4 $7.2 $6.4 $5.3 2012 2013 2014 1H'15 Best 1H'15 Well $5.9 $5.4 $5.2 $4.2 $3.4 2012 2013 2014 1H'15 Best 1H'15 Well 14 12 10 9 6 2012 2013 2014 1H'15 Best 1H'15 Well 31 24 21 15 10 2012 2013 2014 1H'15 Best 1H'15 Well 15 10 11 8 5 2012 2013 2014 1H'15 Best 1H'15 Well 4.7 6.5 6.9 6.5 9.4 2012 2013 2014 1H'15 Best 1H'15 Well 2.3 2.9 3.5 4.0 6.3 2012 2013 2014 1H'15 Best 1H'15 Well 4.7 6.2 5.3 9.1 11.4 2012 2013 2014 1H'15 Best 1H'15 Well $569 $498 $489 $421 $343 2012 2013 2014 1H'15 Best 1H'15 Well $472 $441 $425 $351 $293 2012 2013 2014 1H'15 Best 1H'15 Well $534 $374 $407 $364 $325 2012 2013 2014 1H'15 Best 1H'15 Well $7.7 $5.6 $6.2 $5.5 $4.9 2012 2013 2014 1H'15 Best 1H'15 Well |
|
|
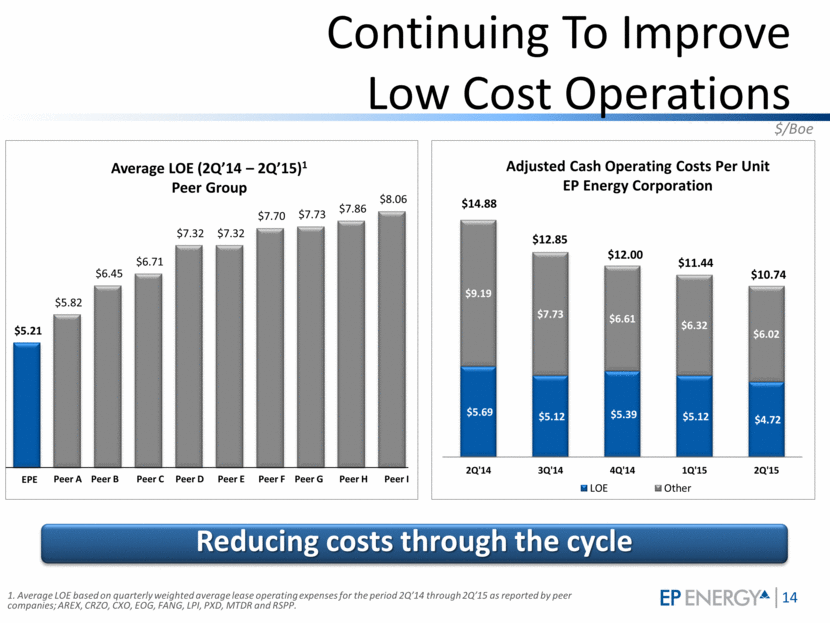
Continuing To Improve Low Cost Operations Average LOE (2Q’14 – 2Q’15)1 Peer Group 1. Average LOE based on quarterly weighted average lease operating expenses for the period 2Q’14 through 2Q’15 as reported by peer companies; AREX, CRZO, CXO, EOG, FANG, LPI, PXD, MTDR and RSPP. Peer A EPE Peer I Peer B Peer C Peer D Peer E Peer G Peer F Peer H Reducing costs through the cycle $/Boe $5.21 $5.82 $6.45 $6.71 $7.32 $7.32 $7.70 $7.73 $7.86 $8.06 $5.69 $5.12 $5.39 $5.12 $4.72 $9.19 $7.73 $6.61 $6.32 $6.02 2Q'14 3Q'14 4Q'14 1Q'15 2Q'15 LOE Other $14.88 $12.85 $12.00 $11.44 Adjusted Cash Operating Costs Per Unit EP Energy Corporation $10.74 |
|
|
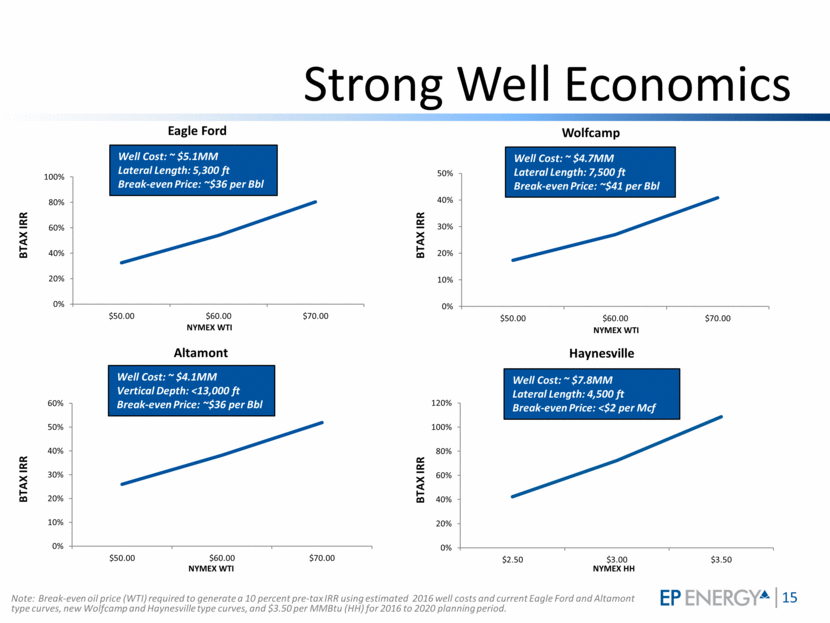
Strong Well Economics Eagle Ford Wolfcamp Altamont Well Cost: ~ $5.1MM Lateral Length: 5,300 ft Break-even Price: ~$36 per Bbl Well Cost: ~ $4.7MM Lateral Length: 7,500 ft Break-even Price: ~$41 per Bbl Well Cost: ~ $4.1MM Vertical Depth: <13,000 ft Break-even Price: ~$36 per Bbl NYMEX WTI NYMEX WTI NYMEX WTI Haynesville NYMEX HH Well Cost: ~ $7.8MM Lateral Length: 4,500 ft Break-even Price: <$2 per Mcf Note: Break-even oil price (WTI) required to generate a 10 percent pre-tax IRR using estimated 2016 well costs and current Eagle Ford and Altamont type curves, new Wolfcamp and Haynesville type curves, and $3.50 per MMBtu (HH) for 2016 to 2020 planning period. BTAX IRR BTAX IRR BTAX IRR BTAX IRR 0% 20% 40% 60% 80% 100% $50.00 $60.00 $70.00 0% 10% 20% 30% 40% 50% $50.00 $60.00 $70.00 0% 10% 20% 30% 40% 50% 60% $50.00 $60.00 $70.00 0% 20% 40% 60% 80% 100% 120% $2.50 $3.00 $3.50 |
|
|
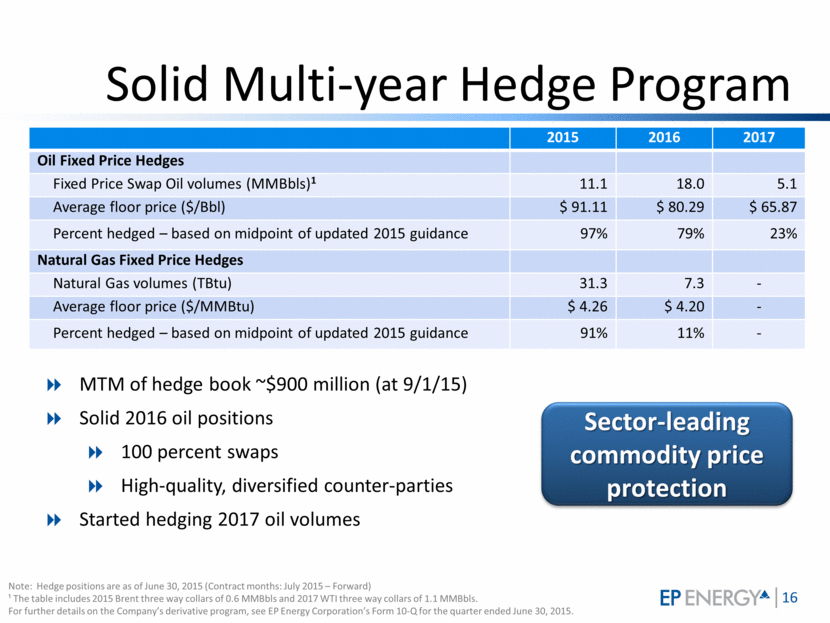
Solid Multi-year Hedge Program 2015 2016 2017 Oil Fixed Price Hedges Fixed Price Swap Oil volumes (MMBbls)1 11.1 18.0 5.1 Average floor price ($/Bbl) $ 91.11 $ 80.29 $ 65.87 Percent hedged – based on midpoint of updated 2015 guidance 97% 79% 23% Natural Gas Fixed Price Hedges Natural Gas volumes (TBtu) 31.3 7.3 - Average floor price ($/MMBtu) $ 4.26 $ 4.20 - Percent hedged – based on midpoint of updated 2015 guidance 91% 11% - Note: Hedge positions are as of June 30, 2015 (Contract months: July 2015 – Forward) ¹ The table includes 2015 Brent three way collars of 0.6 MMBbls and 2017 WTI three way collars of 1.1 MMBbls. For further details on the Company’s derivative program, see EP Energy Corporation’s Form 10-Q for the quarter ended June 30, 2015. Sector-leading commodity price protection MTM of hedge book ~$900 million (at 9/1/15) Solid 2016 oil positions 100 percent swaps High-quality, diversified counter-parties Started hedging 2017 oil volumes |
|
|
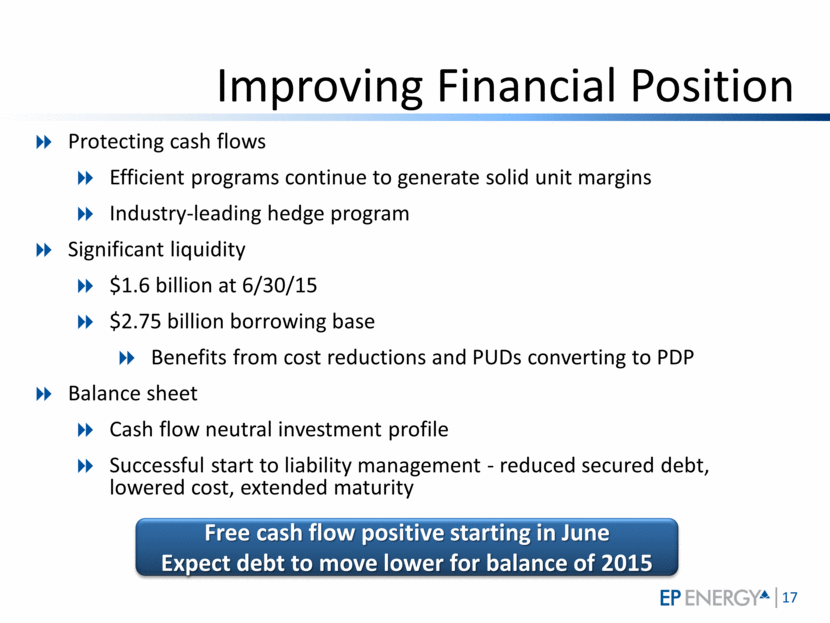
Improving Financial Position Protecting cash flows Efficient programs continue to generate solid unit margins Industry-leading hedge program Significant liquidity $1.6 billion at 6/30/15 $2.75 billion borrowing base Benefits from cost reductions and PUDs converting to PDP Balance sheet Cash flow neutral investment profile Successful start to liability management - reduced secured debt, lowered cost, extended maturity Free cash flow positive starting in June Expect debt to move lower for balance of 2015 |
|
|
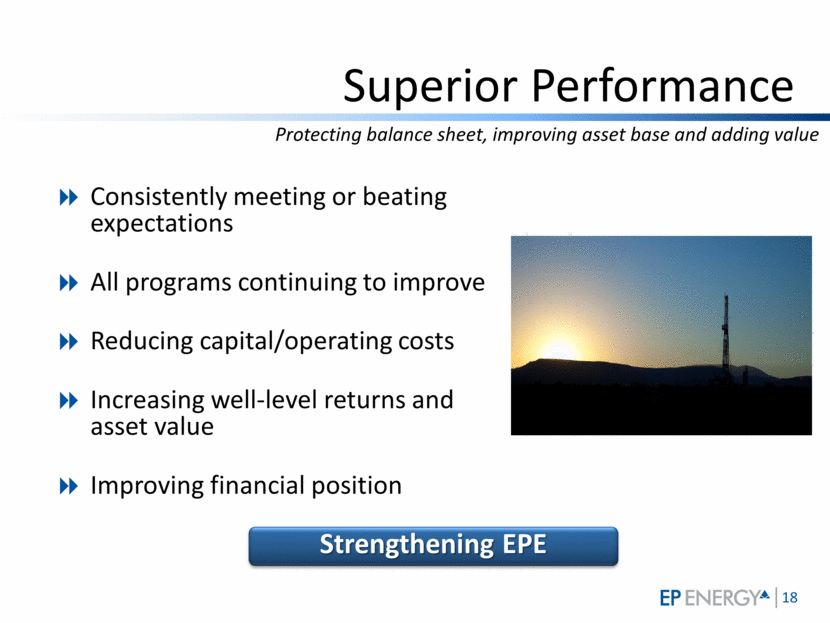
Superior Performance Consistently meeting or beating expectations All programs continuing to improve Reducing capital/operating costs Increasing well-level returns and asset value Improving financial position Strengthening EPE Protecting balance sheet, improving asset base and adding value |
|
|
Barclays CEO Energy-Power Conference Brent Smolik Chairman, President and Chief Executive Officer EP Energy Corporation September 9, 2015 |
|
|
Appendix |
|
|
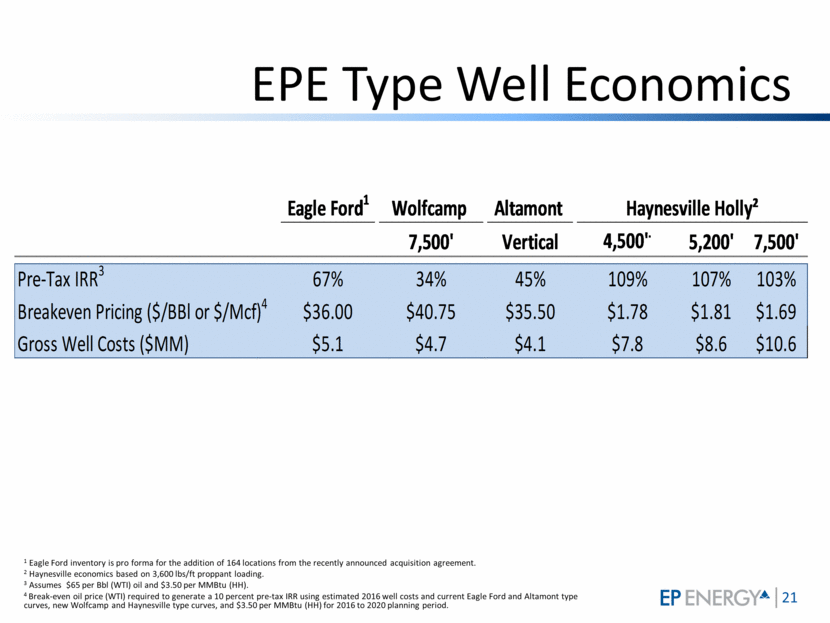
EPE Type Well Economics 1 Eagle Ford inventory is pro forma for the addition of 164 locations from the recently announced acquisition agreement. 2 Haynesville economics based on 3,600 lbs/ft proppant loading. 3 Assumes $65 per Bbl (WTI) oil and $3.50 per MMBtu (HH). 4 Break-even oil price (WTI) required to generate a 10 percent pre-tax IRR using estimated 2016 well costs and current Eagle Ford and Altamont type curves, new Wolfcamp and Haynesville type curves, and $3.50 per MMBtu (HH) for 2016 to 2020 planning period. Eagle Ford 1 Wolfcamp Altamont 7,500' Vertical 4,500' . 5,200' 7,500' Pre-Tax IRR 3 67% 34% 45% 109% 107% 103% Breakeven Pricing ($/BBl or $/Mcf) 4 $36.00 $40.75 $35.50 $1.78 $1.81 $1.69 Gross Well Costs ($MM) $5.1 $4.7 $4.1 $7.8 $8.6 $10.6 Haynesville Holly ² |
|
|
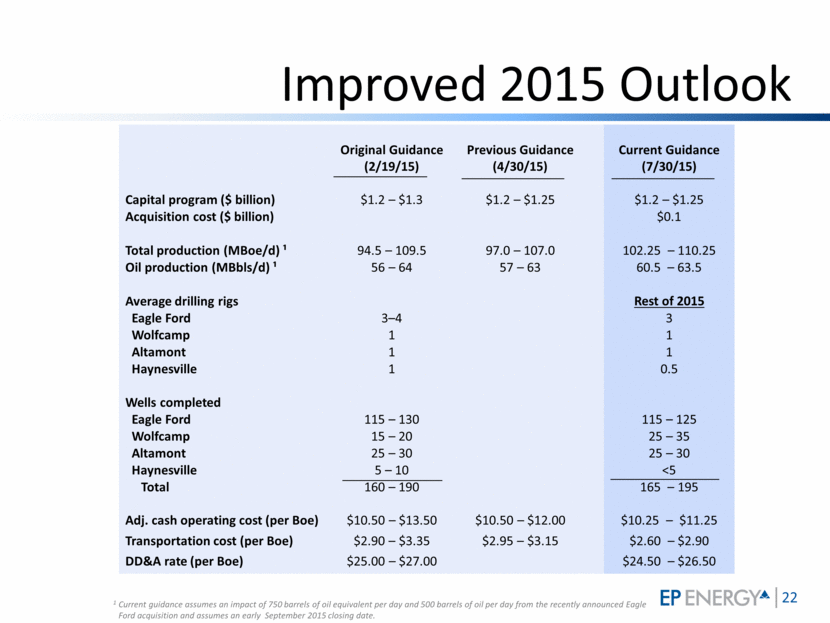
Original Guidance (2/19/15) Previous Guidance (4/30/15) Current Guidance (7/30/15) Capital program ($ billion) $1.2 – $1.3 $1.2 – $1.25 $1.2 – $1.25 Acquisition cost ($ billion) $0.1 Total production (MBoe/d) ¹ 94.5 – 109.5 97.0 – 107.0 102.25 – 110.25 Oil production (MBbls/d) ¹ 56 – 64 57 – 63 60.5 – 63.5 Average drilling rigs Eagle Ford 3–4 3 Wolfcamp 1 1 Altamont 1 1 Haynesville 1 0.5 Wells completed Eagle Ford 115 – 130 115 – 125 Wolfcamp 15 – 20 25 – 35 Altamont 25 – 30 25 – 30 Haynesville 5 – 10 <5 Total 160 – 190 165 – 195 Adj. cash operating cost (per Boe) $10.50 – $13.50 $10.50 – $12.00 $10.25 – $11.25 Transportation cost (per Boe) $2.90 – $3.35 $2.95 – $3.15 $2.60 – $2.90 DD&A rate (per Boe) $25.00 – $27.00 $24.50 – $26.50 Improved 2015 Outlook 1 Current guidance assumes an impact of 750 barrels of oil equivalent per day and 500 barrels of oil per day from the recently announced Eagle Ford acquisition and assumes an early September 2015 closing date. Rest of 2015 |
|
|
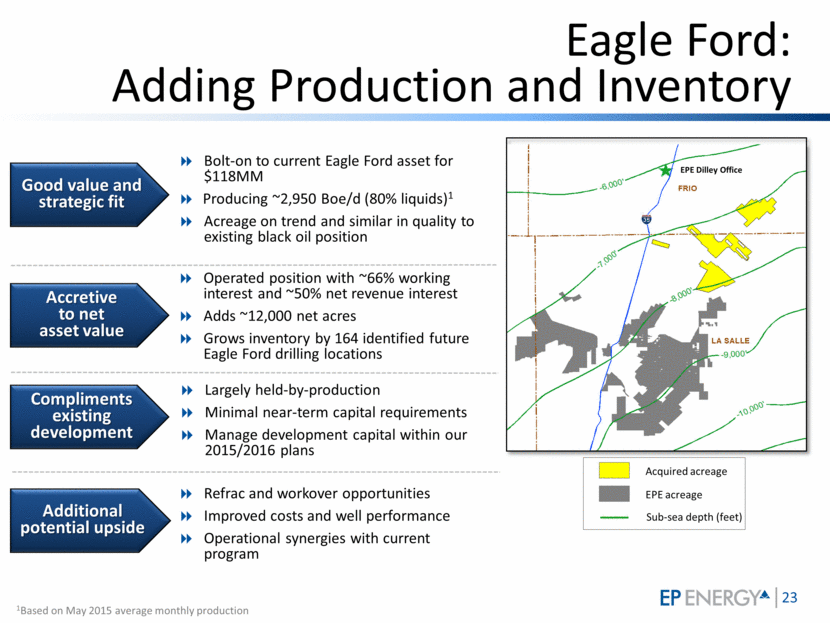
Bolt-on to current Eagle Ford asset for $118MM Producing ~2,950 Boe/d (80% liquids)1 Acreage on trend and similar in quality to existing black oil position Good value and strategic fit Eagle Ford: Adding Production and Inventory Accretive to net asset value Compliments existing development Additional potential upside Operated position with ~66% working interest and ~50% net revenue interest Adds ~12,000 net acres Grows inventory by 164 identified future Eagle Ford drilling locations Largely held-by-production Minimal near-term capital requirements Manage development capital within our 2015/2016 plans Refrac and workover opportunities Improved costs and well performance Operational synergies with current program Acquired acreage EPE acreage 1Based on May 2015 average monthly production Sub-sea depth (feet) EPE Dilley Office |

