Attached files
| file | filename |
|---|---|
| EX-99.1 - EXHIBIT 99.1 - EP Energy Corp | epenergy-12312016ex991.htm |
| EX-32.2 - EXHIBIT 32.2 - EP Energy Corp | epenergycorp-12312016ex322.htm |
| EX-32.1 - EXHIBIT 32.1 - EP Energy Corp | epenergycorp-12312016ex321.htm |
| EX-31.2 - EXHIBIT 31.2 - EP Energy Corp | epenergycorp-12312016ex312.htm |
| EX-31.1 - EXHIBIT 31.1 - EP Energy Corp | epenergycorp-12312016ex311.htm |
| EX-23.2 - EXHIBIT 23.2 - EP Energy Corp | epenergycorp-12312016ex232.htm |
| EX-23.1 - EXHIBIT 23.1 - EP Energy Corp | epenergycorp-12312016ex231.htm |
| EX-21.1 - EXHIBIT 21.1 - EP Energy Corp | epenergycorp-12312016ex211.htm |
| EX-12.1 - EXHIBIT 12.1 - EP Energy Corp | epenergycorp-12312016ex121.htm |
| EX-10.52 - EXHIBIT 10.52 - EP Energy Corp | epenergycorp-12312016ex1052.htm |
| EX-2.6 - EXHIBIT 2.6 - EP Energy Corp | epenergycorp-12312016ex26.htm |
| EX-2.5 - EXHIBIT 2.5 - EP Energy Corp | epenergycorp-12312016ex25.htm |
UNITED STATES SECURITIES AND EXCHANGE COMMISSION
Washington, D.C. 20549
____________________________________________________________
Form 10-K
(Mark One)
x ANNUAL REPORT PURSUANT TO SECTION 13 OR 15(d) OF THE SECURITIES EXCHANGE ACT OF 1934
For the fiscal year ended December 31, 2016
OR
o TRANSITION REPORT PURSUANT TO SECTION 13 OR 15(d) OF THE SECURITIES EXCHANGE ACT OF 1934
For the transition period from to .
Commission File Number 001-36253
____________________________________________________________
EP Energy Corporation
(Exact Name of Registrant as Specified in Its Charter)
Delaware | 46-3472728 | |
(State or Other Jurisdiction of | (I.R.S. Employer | |
Incorporation or Organization) | Identification No.) | |
1001 Louisiana Street | ||
Houston, Texas | 77002 | |
(Address of Principal Executive Offices) | (Zip Code) | |
Telephone Number: (713) 997-1200
Internet Website: www.epenergy.com
Securities registered pursuant to Section 12(b) of the Act:
Name of Each Exchange | ||
Title of Each Class | on which Registered | |
Class A Common Stock, par value $0.01 per share | New York Stock Exchange | |
Securities registered pursuant to Section 12(g) of the Act: None
Indicate by check mark if the registrant is a well-known seasoned issuer, as defined in Rule 405 of the Securities Act. Yes o No x.
Indicate by check mark if the registrant is not required to file reports pursuant to Section 13 or Section 15(d) of the Act. Yes o No x.
Indicate by check mark whether the registrant (1) has filed all reports required to be filed by Section 13 or 15(d) of the Securities Exchange Act of 1934 during the preceding 12 months (or for such shorter period that the registrant was required to file such reports), and (2) has been subject to such filing requirements for the past 90 days. Yes x No o.
Indicate by check mark whether the registrant has submitted electronically and posted on its corporate Web site, if any, every Interactive Data File required to be submitted and posted pursuant to Rule 405 of Regulation S-T during the preceding 12 months (or for such shorter period that the registrant was required to submit and post such files). Yes x No o.
Indicate by check mark if disclosure of delinquent filers pursuant to Item 405 of Regulation S-K is not contained herein, and will not be contained, to the best of registrant’s knowledge, in definitive proxy or information statements incorporated by reference in Part III of this Form 10-K or any amendment to this Form 10-K. x
Indicate by check mark whether the registrant is a large accelerated filer, an accelerated filer, a non-accelerated filer or a smaller reporting company. See the definitions of “large accelerated filer,” “accelerated filer” and “smaller reporting company” in Rule 12b-2 of the Exchange Act. (Check one):
Large accelerated filer o | Accelerated filer x | |
Non-accelerated filer o (Do not check if a smaller reporting company) | Smaller reporting company o | |
Indicate by check mark whether the registrant is a shell company (as defined in Rule 12b-2 of the Act). Yes o No x.
Aggregate market value of the Company’s common stock held by non-affiliates of the registrant as of June 30, 2016, was $195,471,382 based on the closing sale price on the New York Stock Exchange.
Indicate the number of shares outstanding of each of the registrant’s classes of common stock, as of the latest practicable date.
Class A Common Stock, par value $0.01 per share. Shares outstanding as of February 17, 2017: 250,746,362
Class B Common Stock, par value $0.01 per share. Shares outstanding as of February 17, 2017: 776,586
____________________________________________________________
Documents Incorporated by Reference: Portions of the definitive proxy statement for the 2017 Annual Meeting of Stockholders of EP Energy Corporation, which will be held on May 8, 2017, are incorporated by reference into Part III of this Annual Report on Form 10-K.
EP ENERGY CORPORATION
TABLE OF CONTENTS
Caption | Page | |
i
Below is a list of terms that are common to our industry and used throughout this document:
/d | = | per day |
Bbl | = | barrel |
Bcf | = | billion cubic feet |
Boe | = | barrel of oil equivalent |
Gal | = | gallons |
LLS | = | light Louisiana sweet crude oil |
MBoe | = | thousand barrels of oil equivalent |
MBbls | = | thousand barrels |
Mcf | = | thousand cubic feet |
MMBtu | = | million British thermal units |
MMBoe | = | million barrels of oil equivalent |
MMBbls | = | million barrels |
MMcf | = | million cubic feet |
MMcfe | = | million cubic feet of natural gas equivalents |
MMGal | = | million gallons |
Mt. Belvieu | = | Mont Belvieu natural gas liquids pricing index |
NGLs | = | natural gas liquids |
NYMEX | = | New York Mercantile Exchange |
TBtu | = | trillion British thermal units |
WTI | = | West Texas intermediate |
When we refer to oil and natural gas in “equivalents,” we are doing so to compare quantities of oil with quantities of natural gas or to express these different commodities in a common unit. In calculating equivalents, we use a generally recognized standard in which one Bbl of oil and/or NGLs is equal to six Mcf of natural gas. Also, when we refer to cubic feet measurements, all measurements are at a pressure of 14.73 pounds per square inch.
When we refer to “us”, “we”, “our”, “ours”, “the Company”, or “EP Energy”, we are describing EP Energy Corporation and/or its subsidiaries.
All references to “common stock” herein refer to Class A common stock.
ii
CAUTIONARY STATEMENT REGARDING FORWARD-LOOKING STATEMENTS
This report contains forward-looking statements that involve risks and uncertainties, many of which are beyond our control. These forward-looking statements are based on assumptions or beliefs that we believe to be reasonable; however, assumed facts almost always vary from the actual results and such variances can be material. Where we express an expectation or belief as to future results, that expectation or belief is expressed in good faith and is believed to have a reasonable basis. We cannot assure you, however, that the stated expectation or belief will occur. The words “believe”, “expect”, “estimate”, “anticipate”, “intend” and “should” and similar expressions will generally identify forward-looking statements. All of our forward-looking statements are expressly qualified by these and the other cautionary statements in this Annual Report, including those set forth in Item 1A, Risk Factors. Important factors that could cause our actual results to differ materially from the expectations reflected in our forward-looking statements include, among others:
•the volatility of and sustained low oil, natural gas, and NGLs prices;
•the supply and demand for oil, natural gas and NGLs;
•changes in commodity prices and basis differentials for oil and natural gas;
•our ability to meet production volume targets;
•the uncertainty of estimating proved reserves and unproved resources;
•the future level of service and capital costs;
•the availability and cost of financing to fund future exploration and production operations;
•the success of drilling programs with regard to proved undeveloped reserves and unproved resources;
•our ability to comply with the covenants in various financing documents;
• | our ability to obtain necessary governmental approvals for proposed exploration and production projects and to successfully construct and operate such projects; |
•actions by credit rating agencies;
• | credit and performance risks of our lenders, trading counterparties, customers, vendors, suppliers and third party operators; |
• | general economic and weather conditions in geographic regions or markets we serve, or where operations are located, including the risk of a global recession and negative impact on demand for oil and/or natural gas; |
• | the uncertainties associated with governmental regulation, including any potential changes in federal and state tax laws and regulations; |
•competition; and
• | the other factors described under Item 1A, “Risk Factors,” on pages 14 through 33 of this Annual Report on Form 10-K, and any updates to those factors set forth in our subsequent Quarterly Reports on Form 10-Q or Current Reports on Form 8-K. |
In light of these risks, uncertainties and assumptions, the events anticipated by these forward-looking statements may not occur, and, if any of such events do occur, we may not have anticipated the timing of their occurrence or the extent of their impact on our actual results. Accordingly, you should not place any undue reliance on any of these forward-looking statements. These forward-looking statements speak only as of the date made, and we undertake no obligation, other than as required by applicable law, to update or revise its forward-looking statements, whether as a result of new information, subsequent events, anticipated or unanticipated circumstances or otherwise.
iii
PART I
ITEM 1. BUSINESS
Overview
EP Energy Corporation (EP Energy), a Delaware Corporation formed in 2013, is an independent exploration and production company engaged in the acquisition and development of unconventional onshore oil and natural gas properties in the United States.
We operate through a diverse base of producing assets and are focused on creating shareholder value through the development of our low-risk drilling inventory located in three core areas: the Eagle Ford Shale (South Texas), the Wolfcamp Shale (Permian Basin in West Texas) and the Altamont Field in the Uinta Basin (Northeastern Utah). In these areas, we have identified 5,156 drilling locations (including 639 drilling locations to which we have attributed proved undeveloped reserves as of December 31, 2016, of which 100% are considered oil wells). At current activity levels, this represents approximately 53 years of drilling inventory. As of December 31, 2016, we had proved reserves of 432.4 MMBoe (51% oil and 72% liquids) and for the year ended December 31, 2016, we had average net daily production of 87,641 Boe/d (53% oil and 70% liquids).
Each of our core areas is characterized by a long-lived reserve base and high drilling success rates. We have established significant contiguous leasehold positions in each core area, representing approximately 452,000 net (605,000 gross) acres in total.
We evaluate growth opportunities in our portfolio that are aligned with our core competencies and that are in areas that we believe can provide us a competitive advantage. Strategic acquisitions of leasehold acreage or acquisitions of producing assets can provide opportunities to achieve our long-term goals by leveraging existing expertise in our core areas, balancing our exposure to regions, basins and commodities, helping us to achieve risk-adjusted returns competitive with those available within our existing drilling program and by increasing our reserves. We continuously evaluate our asset portfolio and will sell oil and natural gas properties if they no longer meet our long-term goals.
The following table provides a summary of oil, natural gas and NGLs reserves as of December 31, 2016 and production data for the year ended December 31, 2016 for each of our areas of operation.
Estimated Proved Reserves(1) | ||||||||||||||||||||
Oil (MMBbls) | NGLs (MMBbls) | Natural Gas (Bcf) | Total (MMBoe) | Liquids (%) | Proved Developed (%)(2) | Average Net Daily Production (MBoe/d) | ||||||||||||||
Eagle Ford Shale | 73.2 | 24.0 | 140.5 | 120.7 | 81 | % | 63 | % | 43.5 | |||||||||||
Wolfcamp Shale | 81.8 | 66.6 | 439.7 | 221.6 | 67 | % | 33 | % | 21.4 | |||||||||||
Altamont | 64.8 | — | 152.2 | 90.1 | 72 | % | 62 | % | 16.5 | |||||||||||
Other(3) | — | — | — | — | — | % | — | % | 6.2 | |||||||||||
Total | 219.8 | 90.6 | 732.4 | 432.4 | 72 | % | 47 | % | 87.6 | |||||||||||
(1) | Proved reserves were evaluated based on the average first day of the month spot price for the preceding 12-month period of $42.75 per Bbl (WTI) and $2.48 per MMBtu (Henry Hub). |
(2) Includes 15 MMBoe of proved developed non-producing reserves representing 3% of total net proved reserves at December 31, 2016.
(3) | Average net daily production is comprised of Haynesville Shale average net daily production through its sale in May 2016. |
Approximately 190 MMBoe, or 44%, of our total proved reserves are proved developed producing assets, which generated average production of 87.6 MBoe/d in 2016 from approximately 1,470 wells. As of December 31, 2016, we had approximately 220 MMBbls of proved oil reserves, 91 MMBbls of proved NGLs reserves and 732 Bcf of proved natural gas reserves, representing 51%, 21% and 28%, respectively, of our total proved reserves. For the year ended December 31, 2016, 70% of our production was related to oil and NGLs versus 69% in 2015 and over that same period and on that same basis, our oil production decreased by approximately 23% as a result of lower capital spending levels in 2015 and 2016.
We operate 91% of our producing wells and have operational control over approximately 98% of our drilling inventory as of December 31, 2016. This control provides us with flexibility around the amount and timing of capital spending and has allowed us to continually improve our capital and operating efficiencies. In 2016, we realized 17% in capital cost and 12% in operating cost savings across our programs. We also employ a centralized drilling and completion structure to accelerate our internal knowledge transfer around the execution of our drilling and completion programs. In 2016, we drilled 98 wells with a success rate of 100%, adding approximately 64 MMBoe of proved reserves (66% of which were liquids). As of December 31, 2016, we also had a total of 58 wells drilled, but not completed across our programs.
1
Our Properties
Eagle Ford Shale. The Eagle Ford Shale, located in South Texas, is one of the premier unconventional oil plays in the United States. We were an early entrant into this play in late 2008, and since that time have acquired a leasehold position in the core of the oil window, primarily in La Salle County. The Eagle Ford formation in La Salle County has up to 125 feet of net thickness (165 feet gross). Due to its high carbonate content, the formation is also very brittle, and exhibits high productivity when fractured. In 2015, we acquired approximately 12,000 net acres adjacent to our existing Eagle Ford Shale assets. As of December 31, 2016, we had 93,227 net (104,122 gross) acres in the Eagle Ford, and have identified 894 drilling locations.
During 2016, we invested $175 million in capital in our Eagle Ford Shale and operated an average of one drilling rig. As of December 31, 2016, we had 607 net producing wells (598 net operated wells) and are currently running one rig in this program. For the year ended December 31, 2016, our average net daily production was 43,487 Boe/d, representing a decrease of 25% over the same period in 2015 due to natural declines and the slower pace of development from reduced capital spending in 2016. For the year ended December 31, 2016 our average cost per gross well was $4.2 million ($4.1 million per net well), representing a 28% decline from our average cost per gross well (25% per net well) compared to the year ended December 31, 2015.
Wolfcamp Shale. The Wolfcamp Shale is located in the Permian Basin. The Permian Basin is characterized by numerous, stacked oil reservoirs that provide excellent targets for horizontal drilling. In 2009 and 2010, we leased 138,130 net (138,469 gross) acres on the University of Texas Land System in the Wolfcamp Shale, located primarily in Reagan, Crockett, Upton and Irion counties.
Our large, contiguous acreage positions are characterized by stacked pay zones, including the Wolfcamp A, B, and C zones, which combine for over 750 feet of net (approximately 1,000 feet of gross) thickness. The Wolfcamp has high organic content and is composed of interbedded shale, silt, and fine-grained carbonate that respond favorably to fracture stimulation. As of December 31, 2016, we had 178,024 net (178,362 gross) acres in the Wolfcamp, and have identified approximately 2,937 drilling locations in the Wolfcamp A, B, and C zones.
The acreage is also prospective for the Cline Shale, which has approximately 100 feet of net (approximately 200 feet of gross) thickness, and potential vertical drilling locations in the Spraberry and other stacked formations.
During 2016, we invested $233 million in capital in our Wolfcamp Shale and operated an average of approximately one drilling rig. As of December 31, 2016, we had 290 net producing wells (287 net operated wells). We are currently running two rigs in this program. For the year ended December 31, 2016, our average net daily production was 21,371 Boe/d, representing an increase of 8% over 2015 reflecting a higher allocation of capital to this strategic program. For the year ended December 31, 2016, our average cost per gross and net well was $4.6 million, representing a 13% decline from our average cost per gross and net well compared to the year ended December 31, 2015.
In May 2016, we amended our Wolfcamp development agreement with the University Lands to provide flexibility to extend the time frame to hold our acreage by nearly four years to the end of 2021, with an increase in annual well completion requirements from six wells per year to 34, 55 and 55 wells per year in 2016, 2017 and 2018, respectively. In addition, the amendment includes a sliding scale royalty framework that improves well returns in a lower price environment. The royalty rates associated with the sliding scale framework are determined using a rolling average six month price with royalty rates of 12.5% at an average price of $50 per Bbl (WTI) and below, 18.75% at an average price of $60 per Bbl (WTI) and below, 25% at an average price of $80 per Bbl (WTI) and below and 28% above $80 per Bbl (WTI).
In January 2017, we entered into a drilling joint venture to accelerate and fund future oil and natural gas development in our Wolfcamp program. Under the joint venture, our partner is participating in the development of up to 150 wells in two separate 75 well tranches primarily in Reagan and Crockett counties. We will retain operational control of the joint venture assets and the transaction is expected to increase the Company's well-level returns on the jointly developed wells. The first wells under the joint venture began production in January 2017. For a further discussion of this joint venture, see Part II, Item 7, “Management’s Discussion and Analysis of Financial Condition and Results of Operations - Our Business” and Item 8, “Financial Statements and Supplementary Data”, Note 11.
Altamont. The Altamont field is located in the Uinta Basin in northeastern Utah. The Uinta Basin is characterized by naturally fractured, tight-oil sands and carbonates with multiple pay zones. Our operations are primarily focused on developing the Altamont Field Complex (comprised of the Altamont, Bluebell and Cedar Rim fields), which is the largest field in the basin. We own 180,980 net (322,677 gross) acres in Duchesne and Uinta Counties. The Altamont Field Complex has a gross pay interval thickness of over 4,300 feet and we believe the Wasatch and Green River formations are ideal targets for low-risk, infill, vertical drilling and modern fracture stimulation techniques. Our commingled production is from over 1,500 feet of net
2
stimulated rock. Our current activity is mainly focused on the development of our vertical inventory on 80-acre and 160-acre spacing. As of December 31, 2016, we had identified 1,325 drilling locations. Industry activity has also focused on horizontal drilling in the Wasatch and Green River formations testing tight carbonate and sand intervals and has also piloted 80-acre vertical downspacing in these formations. Due to the largely held-by-production nature of our acreage position, if these programs are successful, they will result in additional vertical and horizontal drilling opportunities that could be added to our inventory of drilling locations.
During 2016, we invested $76 million in capital in the Altamont Field and operated an average of one drilling rig. As of December 31, 2016, we had 382 net producing wells (373 net operated wells) and are currently running two rigs in this program. For the year ended December 31, 2016, our average net daily production was 16,498 Boe/d, representing a decrease of 4% over 2015 due to natural declines and slower pace of development from reduced capital spending in 2016. For the year ended December 31, 2016 our average cost per gross well was $4.1 million ($2.8 million per net well), the same as our average cost per gross well (a 22% decline per net well) compared to the year ended December 31, 2015.
Haynesville Shale. In May 2016, we completed the sale of our assets located in the Haynesville and Bossier shales for approximately $420 million (net cash proceeds of $388 million after customary adjustments) and recorded a gain on the sale of approximately $79 million. Prior to its sale, we had invested $3 million in capital in the Haynesville Shale in 2016 and for the year ended December 31, 2016, our average net daily production was 37 MMcf/d.
The following table provides a summary of acreage and inventory data in our core areas as of December 31, 2016:
Acres | Drilling Locations(1) (#) | 2016 Drilling Locations(2) (#) | Inventory (Years)(3) | Working Interest (%) | Net Revenue Interest (%)(4) | |||||||||||||||
Gross | Net | |||||||||||||||||||
Eagle Ford Shale | 104,122 | 93,227 | 894 | 39 | 22.9 | 82 | % | 62 | % | |||||||||||
Wolfcamp Shale | 178,362 | 178,024 | 2,937 | 44 | 66.8 | 97 | % | 73 | % | |||||||||||
Wolfcamp A | 1,055 | 97 | % | 73 | % | |||||||||||||||
Wolfcamp B | 897 | 96 | % | 72 | % | |||||||||||||||
Wolfcamp C | 985 | 97 | % | 73 | % | |||||||||||||||
Altamont | 322,677 | 180,980 | 1,325 | 15 | 88.3 | 73 | % | 62 | % | |||||||||||
Total | 605,161 | 452,231 | 5,156 | 98 | 52.6 | 88 | % | 68 | % | |||||||||||
(1) Our inventory as of December 31, 2016 does not include the following potential additional locations:
• | In the Wolfcamp Shale area, (i) horizontal drilling locations in the Cline Shale and (ii) vertical drilling locations in the Spraberry and other stacked formations; and |
• | In Altamont, (i) additional vertical infill locations and (ii) horizontal drilling locations in the Wasatch and Green River formations. |
(2) Represents gross operated wells completed in 2016.
(3) Calculated as Drilling Locations divided by 2016 Drilling Locations.
(4) | The Wolfcamp net revenue interests are based on a 25% royalty rate on the University Lands and does not reflect the lower royalty rates that can occur in a lower price environment under the sliding scale royalty agreement with the University Lands, further described above. |
We have used the data from our development programs to identify and prioritize our inventory. These drilling locations are only included in our inventory after they have been evaluated technically.
3
Oil and Natural Gas Properties
Oil, Natural Gas and NGLs Reserves and Production
Proved Reserves
The table below presents information about our estimated proved reserves as of December 31, 2016, based on our internal reserve report. The reserve data represents only estimates which are often different from the quantities of oil and natural gas that are ultimately recovered. The risks and uncertainties associated with estimating proved oil and natural gas reserves are discussed further in Item 1A, “Risk Factors”. Net proved reserves exclude royalties and interests owned by others and reflect contractual arrangements and royalty obligations in effect at December 31, 2016.
Net Proved Reserves(1) | ||||||||||||||
Oil (MMBbls) | NGLs (MMBbls) | Natural Gas (Bcf) | Total (MMBoe) | Percent (%) | ||||||||||
Reserves by Classification | ||||||||||||||
Proved Developed | ||||||||||||||
Eagle Ford Shale | 44.4 | 15.7 | 92.1 | 75.5 | 17 | % | ||||||||
Wolfcamp Shale | 24.8 | 23.2 | 153.9 | 73.6 | 17 | % | ||||||||
Altamont | 39.0 | — | 99.9 | 55.5 | 13 | % | ||||||||
Total Proved Developed(2) | 108.2 | 38.9 | 345.9 | 204.6 | 47 | % | ||||||||
Proved Undeveloped | ||||||||||||||
Eagle Ford Shale | 28.8 | 8.3 | 48.4 | 45.2 | 11 | % | ||||||||
Wolfcamp Shale | 57.0 | 43.4 | 285.8 | 148.0 | 34 | % | ||||||||
Altamont | 25.8 | — | 52.3 | 34.6 | 8 | % | ||||||||
Total Proved Undeveloped | 111.6 | 51.7 | 386.5 | 227.8 | 53 | % | ||||||||
Total Proved Reserves | 219.8 | 90.6 | 732.4 | 432.4 | 100 | % | ||||||||
(1) | Proved reserves were evaluated based on the average first day of the month spot price for the preceding 12-month period of $42.75 per Bbl (WTI) and $2.48 per MMBtu (Henry Hub). For a further discussion of our proved reserves and changes therein see Part II, Item 8, Financial Statements and Supplementary Data, under the heading Supplemental Oil and Natural Gas Operations. |
(2) | Includes 190 MMBoe of proved developed producing reserves representing 44% of total net proved reserves and 15 MMBoe of proved developed non-producing reserves representing 3% of total net proved reserves at December 31, 2016. |
Our reserves in the table above are consistent with estimates of reserves filed with other federal agencies except for differences of less than 5% resulting from actual production, acquisitions, property sales, necessary reserve revisions and additions to reflect actual experience. Our estimated net proved reserves were prepared by our internal reserve engineers and audited by Ryder Scott Company, L.P. (Ryder Scott), our independent petroleum engineering consultants.
The table below presents net proved reserves as reported and sensitivities related to our estimated proved reserves based on differing price scenarios as of December 31, 2016.
Net Proved Reserves (MMBoe) | ||
As Reported | 432.4 | |
10 percent increase in commodity prices | 434.7 | |
10 percent decrease in commodity prices | 413.7 | |
The sensitivities in the table above were based on the average first day of the month spot price for the preceding 12-month period of $42.75 per barrel of oil (WTI) and $2.48 per MMBtu of natural gas (Henry Hub) used to determine net proved reserves at December 31, 2016.
We employ a technical staff of engineers and geoscientists that perform technical analysis of each undeveloped location. The staff uses industry accepted practices to estimate, with reasonable certainty, the economically producible oil and natural gas. The practices for estimating hydrocarbons in place include, but are not limited to, mapping, seismic interpretation of two-dimensional and/or three-dimensional data, core analysis, mechanical properties of formations, thermal maturity, well logs of existing penetrations, correlation of known penetrations, decline curve analysis of producing locations with significant production history, well testing, static bottom hole testing, flowing bottom hole pressure analysis and pressure and rate transient analysis.
4
Our primary internal technical person in charge of overseeing our reserves estimates has a B.S. degree in Petroleum Engineering and is a member of the Society of Petroleum Engineers. He is the executive vice president and chief operating officer of the company. In this capacity, he is responsible for the Company’s operating divisions, drilling and completions, and our Marketing group. He also oversees the reserve reporting and technical support groups. He has more than 28 years of industry experience in various domestic and international engineering and management roles. For a discussion of the internal controls over our proved reserves estimation process, see Part II, Item 7. “Management’s Discussion and Analysis of Financial Condition and Results of Operations — Critical Accounting Estimates”.
Ryder Scott conducted an audit of the estimates of net proved reserves that we prepared as of December 31, 2016. In connection with its audit, Ryder Scott reviewed 99% (by volume) of our total net proved reserves on a barrel of oil equivalent basis, representing 98% of the total discounted future net cash flows of these net proved reserves. For the audited properties, 100% of our total net proved undeveloped (PUD) reserves were evaluated. Ryder Scott concluded that the overall procedures and methodologies that we utilized in preparing our estimates of net proved reserves as of December 31, 2016 complied with current SEC regulations and the overall net proved reserves for the reviewed properties as estimated by us are, in aggregate, reasonable within the established audit tolerance guidelines of 10% as set forth in the Society of Petroleum Engineers auditing standards. Ryder Scott’s report is included as an exhibit to this Annual Report on Form 10-K.
The technical person primarily responsible for overseeing the reserves audit by Ryder Scott has a B.S. degree in chemical engineering. He is a Licensed Professional Engineer in the State of Texas, a member of the Society of Petroleum Engineers and has more than 13 years of experience in petroleum reserves evaluation.
In general, the volume of production from oil and natural gas properties declines as reserves are depleted. Except to the extent we conduct successful exploration and development activities or acquire additional properties with proved reserves, or both, our proved reserves will decline as they are produced. Recovery of PUD reserves requires significant capital expenditures and successful drilling operations. The reserve data assumes that we can and will make these expenditures and conduct these operations successfully, but future events, including commodity price changes, may cause these assumptions to change. In addition, estimates of PUD reserves and proved non-producing reserves are inherently subject to greater uncertainties than estimates of proved producing reserves. For further discussion of our reserves, see Part II, Item 8, Financial Statements and Supplementary Data, under the heading Supplemental Oil and Natural Gas Operations.
Proved Undeveloped Reserves (PUDs)
As of December 31, 2016, we have 228 MMBoe of PUD reserves and 639 PUD locations within our areas, all of which are scheduled to be developed or drilled within five years of their initial recording. Estimated capital expenditures to develop our PUD reserves (convert PUD reserves to proved developed reserves) are based upon a long-range plan approved by the Board of Directors. All PUD locations are surrounded by producing properties, and a majority of our PUDs directly offset a producing property. Where we have recorded PUDs beyond one location away from a producing property, reasonable certainty of economic producibility has been established by reliable technology in our areas, including field tests that demonstrate consistent and repeatable results within the formation being evaluated.
5
We assess our PUD reserves on a quarterly basis. The following table summarizes our changes in PUDs for the years ended December 31, 2015 and December 31, 2016, respectively (in MMBoe):
Balance, December 31, 2014 | 384 | |
Purchase of minerals in place | 6 | |
Extensions and discoveries | 58 | |
Revisions due to prices | (3 | ) |
Revisions other than prices | (101 | ) |
Transfers to proved developed | (55 | ) |
Balance, December 31, 2015 | 289 | |
Extensions and discoveries | 55 | |
Revisions due to prices | (4 | ) |
Revisions other than prices | (87 | ) |
Transfers to proved developed | (25 | ) |
Balance, December 31, 2016 | 228 | |
Purchases of minerals in place are PUD reserves acquired in one or more of our core areas in 2015. Extensions and discoveries in 2015 and 2016 are primarily related to drilling activities in the Eagle Ford, Wolfcamp and Altamont areas. Revisions due to prices represent PUD revisions due to decreases in commodity prices (using SEC 12-month average pricing). For the year ended December 31, 2016, revisions other than prices, includes, among other items, negative revisions of 98 MMBoe due to reductions in our estimated capital in our five year development plan, partially offset by positive PUD revisions of 17 MMBoe due to ownership revisions. For the year ended December 31, 2015, revisions other than prices, includes negative PUD revisions of 85 MMBoe due to the impact of the SEC's five-year development rule after reductions in the estimated capital in our 2015 long-range development plan based on the lower price environment.
As of December 31, 2016, 25 MMBoe or 11% of our PUDs had a positive undiscounted value, but a negative value when discounted at 10 percent. A majority of these discounted negative value PUD reserves are due to leasehold commitments associated with continuous drilling clauses. During 2016, 2015 and 2014, we spent approximately $281 million, $835 million and $1,192 million, respectively, to convert approximately 9% or 25 MMBoe, 14% or 55 MMBoe and 20% or 75 MMBoe, respectively, of our prior year-end PUD reserves to proved developed reserves. The lower conversion rates are a result of reductions in actual capital spending compared to what was planned in response to the significant downturn in prices that has continued since the fourth quarter of 2014. In 2017, 2018 and 2019 we estimate we will spend approximately $473 million, $496 million and $541 million to develop our PUD reserves, respectively, based on our December 31, 2016 internal reserve report. At this level of spending from 2017 through 2019, we will develop approximately 60% of our existing PUD reserves with the remaining balance of PUDs to be developed in the succeeding two years. We believe we have the ability and have the intent to develop our PUDs over five years based on our strategic plan. The actual amount and timing of our forecasted expenditures will depend on a number of factors, including actual drilling results, service costs and future commodity prices which are currently and could in the future be lower than those in our projected long-range plan.
6
Acreage and Wells
The following tables detail (i) our interest in developed and undeveloped acreage at December 31, 2016, (ii) our interest in oil and natural gas wells at December 31, 2016 and (iii) our exploratory and development wells drilled during the years 2014 through 2016. Any acreage in which our interest is limited to owned royalty, overriding royalty and other similar interests is excluded.
Acreage | |||||||||||||||||
Developed | Undeveloped | Total | |||||||||||||||
Gross(1) | Net(2) | Gross(1) | Net(2) | Gross(1) | Net(2) | ||||||||||||
Eagle Ford Shale | 40,307 | 36,275 | 63,815 | 56,952 | 104,122 | 93,227 | |||||||||||
Wolfcamp Shale | 18,927 | 18,729 | 159,435 | 159,295 | 178,362 | 178,024 | |||||||||||
Altamont | 84,610 | 61,876 | 238,067 | 119,104 | 322,677 | 180,980 | |||||||||||
Other | 100,656 | 7,152 | 235,799 | 113,128 | 336,455 | 120,280 | |||||||||||
Total Acreage | 244,500 | 124,032 | 697,116 | 448,479 | 941,616 | 572,511 | |||||||||||
(1) Gross interest reflects the total acreage we participate in regardless of our ownership interest in the acreage.
(2) Net interest is the aggregate of the fractional working interests that we have in the gross acreage.
Our net developed acreage is concentrated in Utah (50%) and Texas (49%). Our net undeveloped acreage is concentrated in Texas (49%), Utah (28%), Wyoming (11%) and West Virginia (10%). Approximately 2%, 3% and 2% of our net undeveloped acreage is held under leases that have minimum remaining primary terms expiring in 2017, 2018 and 2019, respectively. We employ various techniques to manage the expiration of leases, including drilling the acreage ourselves prior to lease expiration, entering into farm-out or joint development agreements with other operators or extending lease terms.
Productive Wells | |||||||||||||||||||||||
Oil | Natural Gas | Total | Wells Being Drilled at December 31, 2016(1) | ||||||||||||||||||||
Gross(2) | Net(3) | Gross(2) | Net(3) | Gross(2) | Net(3)(4) | Gross(2) | Net(3) | ||||||||||||||||
Eagle Ford Shale | 675 | 604 | 3 | 3 | 678 | 607 | 37 | 36 | |||||||||||||||
Wolfcamp Shale | 293 | 290 | — | — | 293 | 290 | 23 | 23 | |||||||||||||||
Altamont | 496 | 381 | 3 | 1 | 499 | 382 | 4 | 2 | |||||||||||||||
Total Productive Wells | 1,464 | 1,275 | 6 | 4 | 1,470 | 1,279 | 64 | 61 | |||||||||||||||
(1) Comprised of wells that were spud as of December 31, 2016 and have not been completed.
(2) Gross interest reflects the total wells we participated in, regardless of our ownership interest.
(3) Net interest is the aggregate of the fractional working interests that we have in the gross wells or gross wells drilled.
(4) At December 31, 2016, we operated 1,259 of the 1,279 net productive wells.
Wells Drilled | |||||||||||||||||
Net Exploratory(1) | Net Development(1) | ||||||||||||||||
2016 | 2015 | 2014 | 2016 | 2015(2) | 2014 | ||||||||||||
Productive | — | — | 5 | 94 | 180 | 257 | |||||||||||
Dry | — | — | — | — | — | — | |||||||||||
Total Wells Drilled | — | — | 5 | 94 | 180 | 257 | |||||||||||
(1) Net interest is the aggregate of the fractional working interests that we have in the gross wells or gross wells drilled.
(2) December 31, 2015 includes 4 net development wells in our Haynesville Shale which was sold in May 2016.
The drilling performance above should not be considered indicative of future drilling performance, nor should it be assumed that there is any correlation between the number of productive wells drilled and the amount of oil and natural gas that may ultimately be recovered.
7
Net Production, Sales Prices, Transportation and Production Costs
The following table details our net production volumes, net production volume by area, average sales prices received, average transportation costs, average lease operating expense and average production taxes associated with the sale of oil, natural gas and NGLs for each of the three years ended December 31:
2016 | 2015 | 2014 | |||||||||
Volumes: | |||||||||||
Total Net Production Volumes | |||||||||||
Oil (MBbls) | 17,061 | 22,078 | 19,985 | ||||||||
Natural Gas (MMcf)(1) | 57,799 | 75,533 | 69,434 | ||||||||
NGLs (MBbls) | 5,383 | 5,366 | 4,116 | ||||||||
Total Equivalent Volumes (MBoe) | 32,077 | 40,033 | 35,673 | ||||||||
MBoe/d(2) | 87.6 | 109.7 | 97.7 | ||||||||
Net Production Volumes by Area | |||||||||||
Eagle Ford Shale | |||||||||||
Oil (MBbls) | 9,679 | 14,220 | 12,698 | ||||||||
Natural Gas (MMcf) | 18,442 | 21,212 | 18,215 | ||||||||
NGLs (MBbls) | 3,164 | 3,483 | 2,851 | ||||||||
Total Eagle Ford Shale (MBoe) | 15,916 | 21,238 | 18,585 | ||||||||
Wolfcamp Shale | |||||||||||
Oil (MBbls) | 3,150 | 3,321 | 3,073 | ||||||||
Natural Gas (MMcf) | 14,777 | 12,317 | 7,551 | ||||||||
NGLs (MBbls) | 2,209 | 1,870 | 1,237 | ||||||||
Total Wolfcamp Shale (MBoe) | 7,822 | 7,244 | 5,568 | ||||||||
Altamont | |||||||||||
Oil (MBbls) | 4,224 | 4,532 | 4,208 | ||||||||
Natural Gas (MMcf) | 10,851 | 10,299 | 8,504 | ||||||||
NGLs (MBbls) | 6 | 9 | 21 | ||||||||
Total Altamont (MBoe) | 6,039 | 6,257 | 5,646 | ||||||||
Other(3) | |||||||||||
Natural Gas (MMcf) | 13,556 | 31,521 | 34,907 | ||||||||
Total Other (MBoe) | 2,259 | 5,253 | 5,818 | ||||||||
Prices and Costs per Unit:(4) | |||||||||||
Oil Average Realized Sales Price ($/Bbl) | |||||||||||
Physical Sales | $ | 38.24 | $ | 44.28 | $ | 85.31 | |||||
Including Financial Derivatives(5) | $ | 74.88 | $ | 82.18 | $ | 88.77 | |||||
Natural Gas Average Realized Sales Price ($/Mcf) | |||||||||||
Physical Sales | $ | 1.95 | $ | 2.27 | $ | 3.76 | |||||
Including Financial Derivatives(5) | $ | 2.19 | $ | 3.59 | $ | 3.34 | |||||
NGLs Average Realized Sales Price ($/Bbl) | |||||||||||
Physical Sales | $ | 12.02 | $ | 11.22 | $ | 26.73 | |||||
Including Financial Derivatives(5) | $ | 12.19 | $ | 12.36 | $ | 27.78 | |||||
Average Transportation Costs | |||||||||||
Oil ($/Bbl) | $ | 1.88 | $ | 1.55 | $ | 1.65 | |||||
Natural Gas ($/Mcf) | $ | 1.32 | $ | 0.91 | $ | 0.65 | |||||
NGLs ($/Bbl) | $ | 0.22 | $ | 2.31 | $ | 5.42 | |||||
Average Lease Operating Expenses ($/Boe) | $ | 4.97 | $ | 4.64 | $ | 5.40 | |||||
Average Production Taxes ($/Boe) | $ | 1.37 | $ | 1.83 | $ | 3.39 | |||||
(1) | Natural gas volumes in 2016, 2015 and 2014 include 13,556 MMcf, 31,521 MMcf and 34,907 MMcf, respectively, from the Haynesville Shale which was sold in May 2016. |
(2) | The years ended December 31, 2016, 2015 and 2014 include 6.2 MBoe/d, 14.4 MBoe/d and 15.9 MBoe/d, respectively, from the Haynesville Shale. |
(3) | Represents the Haynesville Shale sold in May 2016. |
(4) | Oil prices for the years ended December 31, 2016 and 2015 reflect operating revenues for oil reduced by $1 million and $3 million, respectively, for oil purchases associated with managing our physical oil sales. Natural gas prices for the years ended December 31, 2016, 2015 and 2014 reflect operating revenues for natural gas reduced by $9 million, $28 million and $23 million, respectively, for natural gas purchases associated with managing our physical sales. |
8
(5) | Includes actual cash settlements related to financial derivatives, including cash premiums. No cash premiums were received or paid for the years ended December 31, 2016 and 2015. For the year ended December 31, 2014, we received approximately $1 million of cash premiums. |
Acquisition, Development and Exploration Expenditures
See Part II, Item 8, Financial Statements and Supplementary Data under the heading Supplemental Oil and Natural Gas Operations in the Total Costs Incurred table for details on our acquisition, development and exploration expenditures.
Transportation, Markets and Customers
Our marketing strategy seeks to ensure maximum deliverability of our physical production at the maximum realized prices. We leverage knowledge of markets and transportation infrastructure to enter into beneficial downstream processing, treating and marketing contracts. We primarily sell our domestic oil and natural gas production to third parties at spot market prices, while we sell our NGLs at market prices under monthly or long-term contracts. We typically sell our oil production to a relatively small number of creditworthy counterparties, as is customary in the industry. For the year ended December 31, 2016, five purchasers accounted for approximately 69% of our oil revenues: Flint Hills Resources, LP (an affiliate of Koch Industries), Shell Trading U.S. Co. (an affiliate of Shell Oil Company), JP Energy Products Supply, LLC, Big West Oil LLC and BP Oil Supply (a division of BP P.L.C). Across all of our areas, we maintain adequate gathering, treating, processing and transportation capacity, as well as downstream sales arrangements, to accommodate our production volumes.
In our Eagle Ford Shale area, we are connected to the Camino Real oil gathering system and to the NuStar Energy system. The vast majority of our oil production flows on Camino Real, a 68-mile long pipeline with over 110,000 Bbls/d of capacity and a gravity bank that allows for oil blending to maintain attractive API levels. We have 80,000 Bbls/d of firm capacity on this oil system, of which we utilized an average of 30% during December 2016 and 38% on average for the year. The system delivers oil to the Storey Oil Terminal on Highway 97 east of Cotulla, Texas, six miles southeast of Gardendale, Texas. From the Storey Terminal, oil can be pumped into Harvest’s Arrowhead #1 and/or #2 pipelines, as well as the Plains All American Pipeline connection to the Gardendale Hub. Oil can also be loaded into trucks out of the Storey Terminal or out of the numerous central tank batteries throughout our field, providing additional deliverability, reliability and flexibility. We currently market our oil either at the Storey Terminal, Gardendale or at our central tank batteries under a combination of short and long-term contracts, ranging from monthly deals to multi-year term sales. With adequate takeaway capacity in the region and close proximity to the Gulf Coast refining complex, we believe we have sufficient capacity on our contracts and do not anticipate any issues with marketing and delivering volumes from the Eagle Ford Shale.
Our Eagle Ford natural gas production flows on either the Camino Real gas gathering system or the Frio LaSalle Pipeline system with the majority flowing on the Camino Real gas gathering system. The Camino Real gas gathering system receives high-pressure, unprocessed wellhead gas into an 83-mile pipeline with capacity up to 150 MMcf/d. The gas is then redelivered into interconnects with Energy Transfer, Enterprise, Regency and Eagle Ford Gathering. We currently have 125 MMcf/d of firm transportation capacity on Camino Real, of which we used an average of 43% during December 2016, and we have additional capacity available as needed. We have firm gas gathering, processing and transportation agreements on three of the interconnected gas pipelines downstream of the Camino Real system, with a minimum capacity of approximately 100 MMBtu/d and rights to increase firm capacity as necessary. In addition, gas produced from our northwest acreage position within the Eagle Ford area is connected to the Frio LaSalle Pipeline system, which provides access to firm H2S treating and processing. Frio LaSalle can either return gas to the Camino Real system or, after processing, deliver to various Texas intrastate pipelines and a mix of interstates, such as Texas Eastern Transmission, Tennessee Gas Pipeline, and Transco. We market our physical gas to various purchasers at spot market prices.
In our Wolfcamp Shale area, we continue to leverage significant legacy gathering, processing and transportation infrastructure. For natural gas, we are connected to the West Texas Gas (WTG), DCP and Lucid Energy Group gathering systems, and we process a majority of our gas at the WTG Benedum & Sonora gas plants. We receive Waha pricing for our natural gas and Mont Belvieu pricing for our NGLs. “Waha pricing” refers to the published index price for spot and monthly physical natural gas purchases and sales made into interstate and intrastate pipelines at the outlet of the Waha header system and in the Waha vicinity in the Permian Basin in West Texas. “Mont Belvieu pricing” refers to the spot market price for NGLs delivered into the Mont Belvieu NGL processing and storage hub in Mont Belvieu, Texas. Our crude oil production facilities are connected to a third party oil gathering system that delivers to a Plains All American Pipeline at Owens Station in Reagan County, Texas, the Centurion Cline Shale Pipeline at Barnhart in Irion County, Texas and to the Magellan Longhorn pipeline in Crockett County, Texas. We sell our pipeline delivered crude to multiple purchasers under both short and long-term contracts at WTI-based pricing. We also maintain the capability to truck crude oil to those same purchasers under similarly-priced contracts to provide additional flow assurance. With new Permian Basin takeaway pipelines now online, we anticipate no limitations moving physical crude oil to market and expect regional pricing to remain correlated with NYMEX/WTI.
In our Altamont area, the wax crude we produce is sold at the wellhead to multiple purchasers who transport the oil via truck to downstream refineries. We sell most of the oil we produce in the basin to Salt Lake City refineries under long-term
9
sales agreements that accommodate our production forecasts. Our produced natural gas is gathered and processed at the Altamont plant, a third-party-owned processing facility, under a long-term sales agreement that provides for residue gas return for operational use.
While most of our physical production is priced off spot market indices, we actively manage the volatility of spot market pricing through our risk management program. We enter into financial derivatives contracts on our oil, natural gas and a portion of our NGLs production to stabilize our cash flows, reduce the risk of downward commodity price movements and protect the economic assumptions associated with our capital investment program. We employ a disciplined risk management program that utilizes risk control processes. For a further discussion of these risk management activities and derivative contracts, see “Management’s Discussion and Analysis of Financial Condition and Results of Operations”.
Competitors
The exploration and production business is highly competitive in the search for and acquisition of additional oil and natural gas reserves and in the sale of oil, natural gas and NGLs. Our competitors include major and intermediate sized oil and natural gas companies, independent oil and natural gas operators and individual producers or operators with varying scopes of operations and financial resources. Competitive factors include financial resources, price and contract terms, our ability to access drilling, completion and other equipment and our ability to hire and retain skilled personnel on a timely and cost effective basis. Ultimately, our future success in this business will be dependent on our ability to find and/or fund the acquisition of additional reserves at costs that yield acceptable returns on the capital invested.
Use of 3-D Seismic Data
Within our areas we have an inventory of approximately 1,268 square miles of 3-D seismic data providing approximately 50% coverage of our leased acreage in those areas. We use our 3-D seismic data to improve our geologic models for each area. In the Eagle Ford and Wolfcamp areas, detailed maps of structural features (e.g. natural fractures, faulting and stratigraphic discontinuities) are used to position well bore laterals to optimally exploit oil bearing zones and navigate drilling hazards. In the Altamont Field, data analytics are run using 3-D seismic attributes to identify ideal locations in the reservoir and estimate resource distribution. Seismic data sets are continually updated to keep pace with technological advancements in seismic processing.
Regulatory Environment
Our oil and natural gas exploration and production activities are regulated at the federal, state and local levels in the United States. These regulations include, but are not limited to, those governing the drilling and spacing of wells, conservation, forced pooling and protection of correlative rights among interest owners. We are also subject to various governmental safety and environmental regulations in the jurisdictions in which we operate.
Our operations under federal oil and natural gas leases are regulated by the statutes and regulations of the Department of the Interior (DOI) that currently impose liability upon lessees for the cost of environmental impacts resulting from their operations. Royalty obligations on all federal leases are regulated by the Office of Natural Resources Revenue within the DOI, which has promulgated valuation guidelines for the payment of royalties by producers. These laws and regulations affect the construction and operation of facilities, water disposal rights and drilling operations, among other items. In addition, we maintain insurance to limit exposure to sudden and accidental pollution liability exposures.
Hydraulic Fracturing. Hydraulic fracturing is a process of pumping fluid and proppant (usually sand) under high pressure into deep underground geologic formations that contain recoverable hydrocarbons. These hydrocarbon formations are typically thousands of feet below the surface. The hydraulic fracturing process creates small fractures in the hydrocarbon formation. These fractures allow natural gas and oil to move more freely through the formation to the well and finally to the surface production facilities. We use hydraulic fracturing to maximize productivity of our oil and natural gas wells in our areas and our proved undeveloped oil and natural gas reserves will be developed using hydraulic fracturing. For the year ended December 31, 2016, we incurred costs of approximately $139 million associated with hydraulic fracturing.
Hydraulic fracturing fluid is typically composed of over 99% water and proppant, which is usually sand. The other 1% or less of the fluid is composed of additives that may contain acid, friction reducer, surfactant, gelling agent and scale inhibitor. We retain service companies to conduct such operations and we have worked with several service companies to evaluate, test and, where appropriate, modify our fluid design to reduce the use of chemicals in our fracturing fluid. We have worked closely with our service companies to provide voluntary and regulatory disclosure of our hydraulic fracturing fluids.
In order to protect surface and groundwater quality during the drilling and completion phases of our operations, we follow applicable industry practices and legal requirements of the applicable state oil and natural gas commissions with regard
10
to well design, including requirements associated with casing steel strength, cement strength and slurry design. Our activities in the field are monitored by state and federal regulators. Key aspects of our field protection measures include: (i) pressure testing well construction and integrity, (ii) casing and cementing practices to ensure pressure management and separation of hydrocarbons from groundwater, and (iii) public disclosure of the contents of hydraulic fracturing fluids.
In addition to these measures, our drilling, casing and cementing procedures are designed to prevent fluid migration, which typically include some or all of the following:
• | Our drilling process executes several repeated cycles conducted in sequence—drill, set casing, cement casing and then test casing and cement for integrity before proceeding to the next drilling interval. |
• | Conductor casing is drilled and cemented or driven in place. This string serves as the structural foundation for the well. Conductor casing is not necessary or required for all wells. |
• | Surface casing is set and is cemented in place. Surface casing is set on all wells. The purpose of the surface casing is to isolate and protect Underground Sources of Drinking Water (USDW) as identified by federal and state regulatory bodies. The surface casing and cement isolates wellbore materials from any potential contact with USDWs. |
• | Intermediate casing is set through the surface casing to a depth necessary to isolate abnormally pressured subsurface formations from normally pressured formations. Intermediate casing is not necessary or required for all wells. Our standard practices include cementing above any hydrocarbon bearing zone and performing casing pressure tests to verify the integrity of the casing and cement. |
• | Production casing is set through the surface and intermediate casing through the depth of the targeted producing formation. Our standard practices include pumping cement above the confining structure of the target zone and performing casing pressure tests and other tests to verify the integrity of the casing and cement. If any problems are detected, then appropriate remedial action is taken. |
• | With the casing set and cemented, a barrier of steel and cement is in place that is designed to isolate the wellbore from surrounding geologic formations. This barrier as designed mitigates against the risk of drilling or fracturing fluids entering potential sources of drinking water. |
In addition to the required use of casing and cement in the well construction, we follow additional regulatory requirements and industry operating practices. These typically include pressure testing of casing and surface equipment and continuous monitoring of surface pressure, pumping rates, volumes of fluids and chemical concentrations during hydraulic fracturing operations. When any pressure differential outside the normal range of operations occurs, pumping is shut down until the cause of the pressure differential is identified and any required remedial measures are completed. Hydraulic fracturing fluid is delivered to our sites in accordance with Department of Transportation (DOT) regulations in DOT approved shipping containers using DOT transporters.
We also have procedures to address water use and disposal. This includes evaluating surface and groundwater sources, commercial sources, and potential recycling and reuse of treated water sources. When commercially and technically feasible, we use recycled or treated water. This practice helps mitigate against potential adverse impacts to other water supply sources. When using raw surface or groundwater, we obtain all required water rights or compensate owners for water consumption. We are evaluating additional treatment capability to augment future water supplies at several of our sites. During our drilling and completions operations, we manage waste water to minimize environmental risks and costs. Flowback water returned to the surface is typically contained in steel tanks or pits. Water that is not treated for reuse is typically piped or trucked to waste disposal injection wells, a number of which we operate. These wells are permitted through Underground Injection Control (UIC) program of the Safe Drinking Water Act. We also use commercial UIC permitted water injection facilities for flowback and produced water disposal.
We have not received regulatory citations or notice of suits related to our hydraulic fracturing operations for environmental concerns. We have not experienced a surface release of fluids associated with hydraulic fracturing that resulted in material financial exposure or significant environmental impact. Consistent with local, state and federal requirements, releases are reported to appropriate regulatory agencies and site restoration completed. No remediation reserve has been identified or anticipated as a result of hydraulic fracturing releases experienced to date.
Spill Prevention/Response Procedures. There are various state and federal regulations that are designed to prevent and respond to any spills or leaks resulting from exploration and production activities. In this regard, we maintain spill prevention control and countermeasures programs, which frequently include the installation and maintenance of spill containment devices
11
designed to contain spill materials on location. In addition, we maintain emergency response plans to minimize potential environmental impacts in the event of a spill or leak or any significant hydraulic fracturing well control issue.
12
Environmental
A description of our environmental remediation activities is included in Part II, Item 8, Financial Statements and Supplementary Data, Note 9.
Employees
As of February 28, 2017, we had 502 full-time employees in the United States.
Executive Officers of the Registrant
Our executive officers as of February 28, 2017, are listed below.
Name | Office | Age | ||
Brent J. Smolik | President, Chief Executive Officer and Chairman of the Board | 55 | ||
Clayton A. Carrell | Executive Vice President and Chief Operating Officer | 51 | ||
Joan M. Gallagher | Senior Vice President, Human Resources and Administrative Services | 53 | ||
Dane E. Whitehead | Executive Vice President and Chief Financial Officer | 55 | ||
Marguerite N. Woung-Chapman | Senior Vice President, General Counsel and Corporate Secretary | 51 | ||
Brent J. Smolik
Mr. Smolik has been our President, Chief Executive Officer and Chairman of the Board since August 30, 2013, President and Chief Executive Officer of EP Energy LLC since May 2012 and previously served as Chairman of the Board of Managers of EPE Acquisition, LLC, from May 2012 to August 2013. He was previously Executive Vice President and a member of the Executive Committee of El Paso Corporation and President of our predecessor, EP Energy Corporation (a/k/a El Paso Exploration & Production Company) from November 2006 to May 2012. Mr. Smolik was President of ConocoPhillips Canada from April 2006 to October 2006. Prior to the Burlington Resources merger with ConocoPhillips, he was President of Burlington Resources Canada from September 2004 to March 2006. From 1990 to 2004, Mr. Smolik worked in various engineering and asset management capacities for Burlington Resources Inc., including the Chief Engineering role from 2000 to 2004. He was a member of Burlington’s Executive Committee from 2001 to 2006. Mr. Smolik currently serves as a director of the American Exploration and Production Council. He previously served on the boards of directors of Cameron International Corporation and the Producers for American Crude Oil Exports. As the President and Chief Executive Officer of EP Energy, Mr. Smolik is the only officer of our company to sit on the board.
Clayton A. Carrell
Mr. Carrell has been our Executive Vice President and Chief Operating Officer since August 30, 2013 and Executive Vice President and Chief Operating Officer of EP Energy LLC since May 2012. He was previously Senior Vice President, Chief Engineer of our predecessor, EP Energy Corporation (a/k/a El Paso Exploration & Production Company) from June 2010 to May 2012. Mr. Carrell joined El Paso Corporation in March 2007 as Vice President, Texas Gulf Coast Division. Prior to that, he was Vice President, Engineering & Operations at Peoples Energy Production from February 2001 to March 2007. Prior to joining Peoples Energy Production, Mr. Carrell worked at Burlington Resources and ARCO Oil and Gas Company from May 1988 to February 2001 in various domestic and international engineering and management roles. He serves on the Industry Board of the Texas A&M Petroleum Engineering Department and is a member of the Society of Petroleum Engineers. Mr. Carrell is also a member of the Center for Hearing and Speech Board of Trustees.
Joan M. Gallagher
Ms. Gallagher has been our Senior Vice President, Human Resources and Administrative Services, since August 30, 2013 and Senior Vice President, Human Resources and Administrative Services, of EP Energy LLC since May 2012. She was previously Vice President, Human Resources of El Paso Corporation from March 2011 to May 2012. From August 2005 until February 2011, she served as Vice President, Human Resources of our predecessor, EP Energy Corporation (a/k/a El Paso Exploration & Production Company). In that capacity, Ms. Gallagher had HR responsibility for El Paso Corporation’s exploration and production business unit and from January 2010 to February 2011 she also had HR responsibilities for shared services and midstream. Prior to 2005, Ms. Gallagher served as Vice President and Chief Administrative Officer of Torch Energy Advisors Incorporated.
13
Dane E. Whitehead
Mr. Whitehead has been our Executive Vice President and Chief Financial Officer since August 30, 2013 and Executive Vice President and Chief Financial Officer of EP Energy LLC since May 2012. He was previously Senior Vice President of Strategy and Enterprise Business Development and a member of the Executive Committee of El Paso Corporation from October 2009 to May 2012. He previously served as Senior Vice President and Chief Financial Officer of our predecessor, EP Energy Corporation (a/k/a El Paso Exploration & Production Company), from May 2006 to October 2009. He was the Vice President and Controller of Burlington Resources Inc. from June 2005 to March 2006. From January 2002 to May 2005 he was Senior Vice President and Chief Financial Officer of Burlington Resources Canada. He was a member of the Burlington Resources Executive Committee from 2000 to 2006. From 1984 to 1993, Mr. Whitehead was an independent accountant with Coopers and Lybrand. He is a member of the American Institute of Certified Public Accountants.
Marguerite N. Woung-Chapman
Ms. Woung-Chapman has been our Senior Vice President, General Counsel and Corporate Secretary since August 30, 2013 and Senior Vice President, General Counsel and Corporate Secretary of EP Energy LLC since May 2012. She was previously Vice President, Legal Shared Services, Corporate Secretary and Chief Governance Officer of El Paso Corporation from November 2009 to May 2012. Ms. Woung-Chapman was Vice President, Chief Governance Officer and Corporate Secretary at El Paso Corporation from May 2007 to November 2009 and from May 2006 to May 2007 served as General Counsel and Vice President of Rates and Regulatory Affairs for El Paso Corporation’s Eastern Pipeline Group. She served as General Counsel of El Paso Corporation’s Eastern Pipeline Group from April 2004 to May 2006. Ms. Woung-Chapman served as Vice President and Associate General Counsel of El Paso Merchant Energy from July 2003 to April 2004. Prior to that time, she held various legal positions with El Paso Corporation and Tenneco Energy starting in 1991. Ms. Woung-Chapman is currently Vice-Chair of the Board of Directors for the Girl Scouts of San Jacinto Council.
Available Information
Our website is http://www.epenergy.com. We make available, free of charge on or through our website, our annual, quarterly and current reports, and any amendments to those reports, as soon as is reasonably possible after these reports are filed with the Securities and Exchange Commission (SEC). Information about each of our Board members, each of our Board’s standing committee charters, and our Corporate Governance Guidelines as well as a copy of our Code of Conduct are also available, free of charge, through our website. Information contained on our website is not part of this report.
14
ITEM 1A. RISK FACTORS
Risks Related to Our Business and Industry
The prices for oil, natural gas and NGLs are highly volatile and sustained lower prices have adversely affected, and may continue to adversely affect, our business, results of operations, cash flows and financial condition.
Our success depends upon the prices we receive for our oil, natural gas and NGLs. These commodity prices historically have been highly volatile and are likely to continue to be volatile in the future, especially given current global geopolitical and economic conditions. For example, during the second half of 2014, NYMEX/WTI oil prices fell from in excess of $100 per Bbl to below $50 per Bbl. NYMEX/WTI oil prices continued to decline in 2015 and early 2016, reaching prices below $30.00 per Bbl. During the latter part of 2016, oil prices experienced a modest recovery and by the end of December were above $50 per Bbl. There is a risk that commodity prices will remain volatile and could remain depressed for a sustained period. The prices for oil, natural gas and NGLs are subject to a variety of factors that are outside of our control, which include, among others:
• | regional, domestic and international supply of, and demand for, oil, natural gas and NGLs; |
• | oil, natural gas and NGLs inventory levels in the United States; |
• | political and economic conditions domestically and in other oil and natural gas producing countries, including the current conflicts in the Middle East and conditions in Africa, Russia and South America; |
• | actions of OPEC and state-controlled oil companies relating to oil, natural gas and NGLs price and production controls; |
• | wars, terrorist activities and other acts of aggression; |
• | weather conditions and weather patterns; |
• | technological advances affecting energy consumption and energy supply; |
• | adoption of various energy efficiency and conservation measures and alternative fuel requirements; |
• | the price and availability of supplies of, and consumer demand for, alternative energy sources; |
• | the price and quantity of U.S. imports and exports of oil, natural gas, including liquefied natural gas, and NGLs; |
• | volatile trading patterns in capital and commodity-futures markets; |
• | the strengthening and weakening of the U.S. dollar relative to other currencies; |
• | changes in domestic governmental regulations, administrative and/or agency actions, and taxes, including potential restrictive regulations associated with hydraulic fracturing operations; |
• | changes in the costs of exploring for, developing, producing, transporting, processing and marketing oil, natural gas and NGLs; |
• | availability, proximity and cost of commodity processing, gathering and transportation and refining capacity; |
• | perceptions of customers on the availability and price volatility of our products, particularly customers' perception of the volatility of oil and natural gas prices over the longer term; and |
• | variations between product prices at sales points and applicable index prices. |
Governmental actions and uncertainty around future actions as a result of the 2016 elections may also affect oil, natural gas and NGL prices.
The negative impact of low commodity prices on our cash flows could limit our cash available for capital expenditures and reduce our drilling opportunities. Any resulting decreases in production could result in an additional shortfall in our expected cash flows and require us to further reduce our capital spending or borrow funds to cover any such shortfall. In addition to reducing our cash flows, the prolonged and substantial decline in commodity prices has and could continue to negatively impact our proved oil and natural gas reserves and could negatively impact the amount of oil and natural gas that we
15
can produce economically in the future. Commodity prices also affect our ability to access funds under our reserve-based revolving credit facility (the RBL Facility) and through the capital markets and may adversely affect our ability to refinance our debt. The amount available for borrowing under the RBL Facility is subject to a borrowing base, which is determined by our lenders taking into account our proved reserves, and is subject to periodic redeterminations (in April and November) based on pricing models determined by the lenders at such time. Declines in oil, natural gas and NGLs prices have and could continue to adversely impact the value of our proved reserves and, in turn, the bank pricing used by our lenders to determine our borrowing base. Upon redetermination, we would be required to repay amounts outstanding under our credit facility should they exceed the redetermined borrowing base. Any of these factors could further negatively impact our liquidity, our ability to replace our production and our future rate of growth. On the other hand, increases in commodity prices may be offset by increases in drilling costs, production taxes and lease operating costs that typically result from any increase in commodity prices. Any of these outcomes could have a material adverse effect on our business, results of operations and financial condition.
We have significant capital programs in our business that may require us to access capital markets, and any inability to obtain access to the capital markets in the future at competitive rates, or any negative developments in the capital markets, could have a material adverse effect on our business.
We have significant capital programs in our business, which may require us to access the capital markets. Since we are rated below investment grade, our ability to access the capital markets or the cost of capital could be negatively impacted in the future, which could require us to forego capital opportunities or could make us less competitive in our pursuit of growth opportunities, especially in relation to many of our competitors that are larger than us or have investment grade ratings. There is a risk that our below investment credit rating may be further adversely affected in the future as the credit rating agencies review their general credit requirements in light of the sustained lower commodity price environment as well as review our leverage, liquidity, credit profile and potential transactions. Reductions in our credit rating could have a negative impact on us. For example, a lower credit rating could limit our available liquidity if we are required to post incremental collateral on transportation contract obligations or other contractual commitments.
In addition, the credit markets for companies in the energy sector in recent years have experienced a period of turmoil and upheaval as commodity prices have been volatile. These circumstances and events have led to reduced credit availability, tighter lending standards and higher interest rates on loans for companies in the energy industry, especially non-investment grade companies. While we cannot predict the future condition of the credit markets, future turmoil in the credit markets could have a material adverse effect on our business, liquidity, financial condition and cash flows, particularly if our ability to borrow money from lenders or access the capital markets to finance our operations were to be impaired. Our primary source of liquidity beyond cash flow from operations is our RBL Facility. At December 31, 2016, we had $370 million outstanding under the facility and a borrowing base of $1.5 billion. In February 2017, as a result of issuing $1 billion senior secured notes, that capacity was reduced to $1.44 billion, and we also paid $111 million of the outstanding balance on the RBL Facility.
Although we believe that the banks participating in the RBL Facility have adequate capital and resources, we can provide no assurance that all of those banks will continue to operate as going concerns in the future, or continue to participate in the facility. If any of the banks in our lending group were to fail, or choose not to participate, it is possible that the borrowing capacity under the RBL Facility would be reduced. In the event of such reduction, we could be required to obtain capital from alternate sources or find additional RBL participants in order to finance our capital needs. Our options for addressing such capital constraints would include, but not be limited to, obtaining commitments from the remaining banks in the lending group or from new banks to fund increased amounts under the terms of the RBL Facility, and accessing the public and private capital markets. In addition, we may delay certain capital expenditures to ensure that we maintain appropriate levels of liquidity. If it became necessary to access additional capital, any such alternatives could have terms less favorable than the current terms under the RBL Facility, which could have a material adverse effect on our business, results of operations, financial condition and cash flows.
Our substantial indebtedness could adversely affect our ability to raise additional capital to fund our operations, limit our ability to react to changes in the economy or our industry and require us to dedicate a substantial portion of cash flows to service our debt payment obligations.
We are a highly leveraged company with significant debt and debt service obligations. Our substantial indebtedness could:
• | require us to dedicate a substantial portion of our cash flow from operations to debt service payments thereby reducing the availability of cash for working capital, capital expenditures, acquisitions or general corporate purposes; |
• | limit our ability to borrow money for our working capital, capital expenditures, debt service requirements, strategic initiatives or other purposes; |
16
• | expose us to more liquidity risks, including breach of covenants and default risks, especially during times of financial and commodity price volatility; |
• | make us more vulnerable to downturns in our business or the economy; |
• | limit our flexibility in planning for, or reacting to, changes in our operations or business; |
• | increase our leverage relative to our competitors, which may place us at a competitive disadvantage; |
• | restrict us from making strategic acquisitions, engaging in development activities, introducing new technologies or exploiting business opportunities; |
• | cause us to make non-strategic divestitures; or |
• | cause us to issue equity thereby diluting existing stockholders. |
The success of our business depends upon our ability to find and replace reserves that we produce.
Similar to our competitors, we have a reserve base that is depleted as it is produced. Unless we successfully replace the reserves that we produce, our reserves will decline, which will eventually result in a decrease in oil and natural gas production and lower revenues and cash flows from operations. We historically have replaced reserves through both drilling and acquisitions. The business of exploring for, developing or acquiring reserves requires substantial capital expenditures. If we do not continue to make significant capital expenditures (for any reason, including our access to capital resources becoming limited) or if our exploration, development and acquisition activities are unsuccessful, we may not be able to replace the reserves that we produce, which would negatively impact us. As a result, our future oil and natural gas reserves and production, and therefore our cash flow and results of operations, are highly dependent upon our success in efficiently developing and exploiting our current properties and economically finding or acquiring additional recoverable reserves. We may not be able to develop, find or acquire additional reserves to replace our current and future production at acceptable costs or at all. If we are unable to replace our current and future production, the value of our reserves will decrease, and our business, results of operations and financial condition would be materially adversely affected.
Our oil and natural gas drilling and producing operations involve many risks, and our production forecasts may differ from actual results.
Our success will depend on our drilling results. Our drilling operations are subject to the risk that (i) we may not encounter commercially productive reservoirs or (ii) if we encounter commercially productive reservoirs, we either may not fully recover our investments or our rates of return will be less than expected. Our past performance should not be considered indicative of future drilling performance. As a result, there remains uncertainty on the results of our drilling programs, including our ability to realize proved reserves or to earn acceptable rates of return on our drilling programs. From time to time, we provide forecasts of expected quantities of future production. These forecasts are based on a number of estimates, including expectations of production from existing wells and the outcome of future drilling activity. Our forecasts could be different from actual results and such differences could be material.
Our decisions to purchase, explore, develop or otherwise exploit prospects or properties will depend in part on the evaluation of data obtained through geophysical and geological analyses, production data and engineering studies, the results of which are often inconclusive or subject to varying interpretations. In addition, the results of our exploratory drilling in new or emerging areas are more uncertain than drilling results in areas that are developed and have established production. Our cost of drilling, completing, equipping and operating wells is often uncertain before drilling commences. Overruns in budgeted expenditures are common risks that can make a particular project uneconomical or less economic than forecasted. Further, many factors may increase the cost of, or curtail, delay or cancel drilling operations, including the following:
• | unexpected drilling conditions; |
• | delays imposed by or resulting from compliance with regulatory and contractual requirements, including requirements on sourcing of materials; |
• | unexpected pressure or irregularities in geological formations; |
• | equipment failures or accidents; |
• | fracture stimulation accidents or failures; |
• | adverse weather conditions; |
17
• | declines in oil and natural gas prices; |
• | surface access restrictions with respect to drilling or laying pipelines; |
• | shortages (or increases in costs) of water used in hydraulic fracturing, especially in arid regions or regions that have been experiencing severe drought conditions; |
• | shortages or delays in the availability of, increases in the cost of, or increased competition for, drilling rigs and crews, fracture stimulation crews, equipment, pipe, chemicals and supplies and transportation, gathering, processing, treating or other midstream services; and |
• | limitations or reductions in the market for oil and natural gas. |
Additionally, the occurrence of certain of these events, particularly equipment failures or accidents, could impact third parties, including persons living in proximity to our operations, our employees and employees of our contractors, leading to possible injuries or death or significant property damage. As a result, we face the possibility of liabilities from these events that could materially adversely affect our business, results of operations and financial condition.
In addition, uncertainties associated with enhanced recovery methods may not allow for the extraction of oil and natural gas in a manner or to the extent that we anticipate and we may be unable to realize an acceptable return on our investments in certain of our projects. The additional production and reserves, if any, attributable to the use of enhanced recovery methods are inherently difficult to predict.
Our drilling locations are scheduled to be drilled over a number of years, making them susceptible to uncertainties that could materially alter the occurrence or timing of their drilling.
Our management has identified and scheduled potential drilling locations as an estimate of our future multi-year drilling activities on our existing acreage. All of our potential drilling locations, particularly our potential drilling locations for oil, represent a significant part of our strategy. Our ability to drill and develop these locations is subject to a number of uncertainties, including the availability of capital, seasonal conditions, regulatory approvals, oil, natural gas and NGLs prices, costs and drilling results. Because of these uncertainties, we do not know if the drilling locations we have identified will ever be drilled or if we will be able to produce oil, natural gas or NGLs from these or any other potential drilling locations. Pursuant to existing SEC rules and guidance, subject to limited exceptions, proved undeveloped reserves may only be booked if they relate to wells where a final investment decision has been made to drill within five years of the date of booking. These rules and guidance may limit our potential to book additional proved undeveloped reserves as we pursue our drilling program.
Drilling locations that we decide to drill may not yield oil, natural gas or NGLs in commercially viable quantities.
We describe potential drilling locations and our plans to explore those potential drilling locations in this Annual Report on Form 10-K. These potential drilling locations are in various stages of evaluation, ranging from a location which is ready to drill to a location that will require substantial additional interpretation. There is no way to predict in advance of drilling and testing whether any particular location will yield oil, natural gas or NGLs in sufficient quantities to recover drilling or completion costs or to be economically viable. The use of technologies and the study of producing fields in the same area will not enable us to know conclusively, prior to drilling, whether oil, natural gas or NGLs will be present or, if present, whether oil, natural gas or NGLs will be present in sufficient quantities to be economically viable. Even if sufficient amounts of oil, natural gas or NGLs exist, we may damage the potentially productive hydrocarbon-bearing formation or experience mechanical difficulties while drilling or completing the well, resulting in a reduction in production from the well or abandonment of the well. We cannot assure you that the analogies we draw from available data from other wells, more fully explored locations or producing fields will be applicable to our other identified drilling locations. Further, initial production rates reported by us or other operators may not be indicative of future or long-term production rates. The cost of drilling, completing and operating any well is often uncertain, and new wells may not be productive.
We require substantial capital expenditures to conduct our operations, engage in acquisition activities and replace our production, and we may be unable to obtain needed financing on satisfactory terms necessary to execute our operating strategy.
We require substantial capital expenditures to conduct our exploration, development and production operations, engage in acquisition activities and increase our proved reserves and production. In 2016, we spent total capital of $488 million. We have established a capital budget for 2017 of approximately $630 million to $730 million and we intend to rely on cash flow from operating activities and available cash and borrowings under the RBL Facility as our primary sources of liquidity. For a discussion of liquidity, see Part II, Item 7. “Management’s Discussion and Analysis of Financial Condition and Results of Operations — Liquidity and Capital Resources”. We also may engage in asset sale transactions to, among other
18
things, fund capital expenditures when market conditions permit us to complete transactions on terms we find acceptable. There can be no assurance that such sources will be available to us or sufficient to fund our exploration, development and acquisition activities. If our revenues and cash flows continue to decrease in the future as a result of sustained declines in commodity prices or a reduction in production levels, and we are unable to obtain additional equity or debt financing in the capital markets or access alternative sources of funds, we may be required to reduce the level of our capital expenditures and may lack the capital necessary to increase or even maintain our reserves and production levels.
Our future revenues, cash flows and spending levels are subject to a number of factors, including commodity prices, the level of production from existing wells and our success in developing and producing new wells. Further, our ability to access funds under the RBL Facility is based on a borrowing base, which is subject to periodic redeterminations (in April and November) based on our proved reserves and prices that will be determined by our lenders using the bank pricing prevailing at such time. If the prices for oil and natural gas decline, if we have a downward revision in estimates of our proved reserves, or if we sell additional oil and natural gas reserves, our borrowing base may be reduced.
Our ability to access the capital markets and complete future asset monetization transactions is also dependent upon oil, natural gas and NGLs prices, in addition to a number of other factors, some of which are outside our control. These factors include, among others, domestic and global economic conditions and conditions in the domestic and global financial markets.
Due to these factors, we cannot be certain that funding, if needed, will be available to the extent required, or on acceptable terms. If we are unable to access funding when needed on acceptable terms, we may not be able to fully implement our business plans, take advantage of business opportunities, respond to competitive pressures or refinance our debt obligations as they come due, any of which could have a material adverse effect on our business, financial condition, cash flows and results of operations.
Our use of derivative financial instruments could result in financial losses or could reduce our income.
We use fixed price financial options and swaps to mitigate our commodity price, basis and interest rate exposures. However, we do not typically hedge all of these exposures, and typically do not hedge any of these exposures beyond several years. Currently, our derivative contracts (primarily fixed price derivatives), will allow us to realize a weighted average price of $61.66 per barrel on 12.8 MMBbls of oil and $3.28 per MMBtu on 32 TBtu of natural gas in 2017 and a weighted average price of $60 per barrel on 3.3 MMBbls of oil and $3.11 per MMBtu on 4 TBtu of natural gas in 2018. However, based on the current price environment, our ability to enter into hedges that provide meaningful protection of our future cash flows is limited. As a result, we have substantial commodity price and basis exposure since our business has multi-year drilling programs for our proved reserves and unproved resources, particularly as our existing hedges roll off.
The derivative contracts we enter into to mitigate commodity price risk are not designated as accounting hedges and are therefore marked to market. As a result, we experience volatility in our revenues and net income as a result of changes in commodity prices, counterparty non-performance risks, correlation factors and changes in the liquidity of the market. Furthermore, the valuation of these financial instruments involves estimates that are based on assumptions that could prove to be incorrect and result in financial losses. Although we have internal controls in place that impose restrictions on the use of derivative instruments, there is a risk that such controls will not be complied with or will not be effective, and we could incur substantial losses on our derivative transactions. The use of derivatives, to the extent they require collateral posting with our counterparties, could impact our working capital and liquidity when commodity prices or interest rates change.
To the extent we enter into derivative contracts to manage our commodity price, basis and interest rate exposures, we may forego the benefits we could otherwise experience if such prices and rates were to change favorably and we could experience losses to the extent that these prices and rates were to increase above the fixed price. In addition, these hedging arrangements also expose us to the risk of financial loss in the following circumstances, among others:
• | when production is less than expected or less than we have hedged; |
• | when the counterparty to the hedging instrument defaults on its contractual obligations; |
• | when there is an increase in the differential between the underlying price in the hedging instrument and actual prices received; and |
• | when there are issues with respect to legal enforceability of such instruments. |
Our derivative counterparties are typically large financial institutions. We are subject to the risk of loss on our derivative instruments as a result of non-performance by counterparties to the terms of their obligations. The risk that a counterparty may default on its obligations is heightened by the continued significant decline in commodity prices. The ability of our counterparties to meet their obligations to us on hedge transactions could reduce our revenue from hedges at a time when
19
we are also receiving a lower price for our oil and natural gas sales. As a result, our business, results of operations and financial condition could be materially adversely affected.
Derivatives reform legislation and related regulations could have an adverse effect on our ability to hedge risks associated with our business.
The July 2010 Dodd-Frank Wall Street Reform and Consumer Protection Act (the Dodd-Frank Act) provided for federal oversight of the over-the-counter derivatives market and entities that participate in that market and mandated that the Commodity Futures Trading Commission (the CFTC), the SEC and certain federal regulators of financial institutions (the Prudential Regulators) adopt rules or regulations to implement the Dodd-Frank Act and provide definitions of terms used in the Dodd-Frank Act. The Dodd-Frank Act established margin requirements and required clearing and trade execution practices for certain market participants and resulted in certain market participants curtailing and/or ceasing their derivatives activities.
Although some of the rules necessary to implement the Dodd-Frank Act remain to be adopted, the CFTC, the SEC and the Prudential Regulators have issued many rules to implement the Dodd-Frank Act, including a rule (the Mandatory Clearing Rule) requiring clearing of hedges, or swaps, that are subject to it (currently, only certain interest rate and credit default swaps, which we do not presently have), a rule establishing an "end user" exception (the End User Exception) to the Mandatory Clearing Rule, a rule (the Margin Rule) setting forth collateral requirements in connection with swaps that are not cleared and also an exception (the Non-Financial End User Exception) to the Margin Rule for end users that are not financial end users and a rule (the Position Limit Rule), subsequently vacated by the United States District Court for the District of Columbia and remanded to the CFTC for further proceedings, imposing position limits. The CFTC proposed a new version of the Position Limit Rule, with respect to which the comment period closed but no final rule was issued, and has re-proposed a new version of the Position Limit Rule (the Re-Proposed Position Limit Rule) with respect to which the comment period is scheduled to close on February 28, 2017. The Re-Proposed Position Limit Rule provides an exemption from the position limits for swaps that constitute “bona fide hedging positions” within the definition of such term under the Re-Proposed Position Limit Rule, subject to the party claiming the exemption complying with the applicable filing, recordkeeping and reporting requirements of the Re-Proposed Position Limit Rule.
We qualify for the End User Exception and will utilize it if the Mandatory Clearing Rule is expanded to cover swaps in which we participate, we qualify for the Non-Financial End User Exception and will not be required to post margin under the Margin Rule and our existing and anticipated hedging positions constitute “bona fide hedging positions” under the Re-Proposed Position Limit Rule and we intend to do the filing, recordkeeping and reporting necessary to utilize the bona fide hedging position exemption under the Re-Proposed Position Limit Rule if and when it becomes effective, so we do not expect to be directly affected by any of such rules. However, most if not all of our hedge counterparties will be subject to mandatory clearing in connection with their hedging activities with parties who do not qualify for the End User Exception and will be required to post margin in connection with their hedging activities with other swap dealers, major swap participants, financial end users and other persons that do not qualify for the Non-Financial End User Exception or another exception to the Margin Rule. In addition, the European Union and other non-U.S. jurisdictions have enacted laws and regulations (collectively, Foreign Regulations, including laws and regulations giving European Union financial authorities the power to write down amounts we may be owed on hedging agreements with counterparties subject to such Foreign Regulations and/or require that we accept equity interests in such counterparties in lieu of cash in satisfaction of such amounts) which may apply to our transactions with counterparties subject to such Foreign Regulations. The Dodd-Frank Act, the rules which have been adopted and not vacated, and, to the extent that the Re-Proposed Position Limit Rule is ultimately effected, such proposed rule could significantly increase the cost of our derivative contracts, materially alter the terms of our derivative contracts, reduce the availability of derivatives to us that we have historically used to protect against risks that we encounter in our business, reduce our ability to monetize or restructure our existing derivative contracts, and increase our exposure to less creditworthy counterparties. The Foreign Regulations could have similar effects. If we reduce our use of derivatives as a result of the Dodd-Frank Act and regulations and Foreign Regulations, our results of operations may become more volatile and our cash flows may be less predictable, which could adversely affect our ability to plan for and fund capital expenditures. Finally, the Dodd-Frank Act was intended, in part, to reduce the volatility of oil and natural gas prices, which some legislators attributed to speculative trading in derivatives and commodity contracts related to oil and natural gas. Our revenues could therefore be adversely affected if a consequence of the Dodd-Frank Act and regulations is to lower commodity prices. Any of these consequences could have a material adverse effect on us, our financial condition, and our results of operations.
20
Estimating our reserves involves uncertainty, our actual reserves will likely vary from our estimates, and negative revisions to our reserve estimates in the future could result in decreased earnings and/or losses and impairments.
All estimates of proved reserves are determined according to the rules prescribed by the SEC. Our reserve information is prepared internally and is audited by an independent petroleum engineering consultant. There are numerous uncertainties involved in estimating proved reserves, which may result in our estimates varying considerably from actual results. Estimating quantities of proved reserves is complex and involves significant interpretation and assumptions with respect to available geological, geophysical and engineering data, including data from nearby producing areas. It also requires us to estimate future economic factors, such as commodity prices, production costs, plugging and abandonment costs, severance, ad valorem and excise taxes, capital expenditures, workover and remedial costs, and the assumed effect of governmental regulation. Due to a lack of substantial production data, there are greater uncertainties in estimating proved undeveloped reserves and proved developed non-producing reserves. There is also greater uncertainty of estimating proved developed reserves that are early in their production life. As a result, our reserve estimates are inherently imprecise. Furthermore, estimates are subject to revision based upon a number of factors, including many factors beyond our control such as reservoir performance, prices (including commodity prices and the cost of oilfield services), economic conditions and government restrictions and regulations. In addition, results of drilling, testing and production subsequent to the date of an estimate may justify revision of that estimate. Therefore, our reserve information represents an estimate and is often different from the quantities of oil and natural gas that are ultimately recovered or proven recoverable.
The SEC rules require the use of a 10% discount factor for estimating the value of our future net cash flows from reserves and the use of a historical 12-month average price. This discount factor may not necessarily represent the most appropriate discount factor, given our costs of capital, actual interest rates and risks faced by our exploration and production business, and the average historical price will not generally represent the future market prices for oil and natural gas over time. Any significant change in commodity prices could cause the estimated quantities and net present value of our reserves to differ and these differences could be material. You should not assume that the present values referred to in this Annual Report on Form 10-K represent the current market value of our estimated oil and natural gas reserves. Finally, the timing of the production and the expenses related to the development and production of oil and natural gas properties will affect both the timing of actual future net cash flows from our proved reserves and their present value.
We account for our activities under the successful efforts method of accounting. Changes in the estimated fair value of these reserves could result in a write-down in the carrying value of our oil and natural gas properties, which could be substantial and could have a material adverse effect on our net income and stockholders’ equity. Changes in the estimated fair value of these reserves could also result in increasing our depreciation, depletion and amortization rates, which could decrease earnings.
A portion of our proved reserves are undeveloped. Recovery of undeveloped reserves requires significant capital expenditures and successful drilling operations. In addition, because our proved reserve base consists primarily of unconventional resources, the costs of finding, developing and producing those reserves may require capital expenditures that are greater than more conventional resource plays. Our estimates of proved reserves assume that we can and will make these expenditures and conduct these operations successfully. However, future events, including commodity price changes and our ability to access capital markets, may cause these assumptions to change.
Our business is subject to competition from third parties, which could negatively impact our ability to succeed.
The oil, natural gas and NGLs businesses are highly competitive. We compete with third parties in the search for and acquisition of leases, properties and reserves, as well as the equipment, materials and services required to explore for and produce our reserves. There has been intense competition for the acquisition of leasehold positions, particularly in many of the oil and natural gas shale plays. Our ability to acquire additional properties and to discover reserves in the future will be dependent upon our ability to evaluate and select suitable properties and to fund and consummate transactions in a highly competitive environment. In addition, because we have fewer financial and human resources than many companies in our industry, we may be at a disadvantage in bidding for exploratory prospects and producing oil properties. Similarly, we compete with many third parties in the sale of oil, natural gas and NGLs to customers, some of which have substantially larger market positions, marketing staff and financial resources than us. Our competitors include major and independent oil and natural gas companies, as well as financial services companies and investors, many of which have financial and other resources that are substantially greater than those available to us. Many of these companies not only explore for and produce oil and natural gas, but also carry on refining operations and market petroleum and other products on a regional, national or worldwide basis. These companies may be able to pay more for productive oil and natural gas properties and exploratory prospects or define, evaluate, bid for and purchase a greater number of properties and prospects than our financial or human resources permit. In addition, these companies may have a greater ability to continue exploration activities during periods of low oil and natural gas market prices.
21
Furthermore, there is significant competition between the oil and natural gas industry and other industries producing energy and fuel, which may be substantially affected by various forms of energy legislation and/or regulation considered from time to time by federal, state and local governments. It is not possible to predict the nature of any such legislation or regulation that may ultimately be adopted or its effects upon our future operations. Such laws and regulations may substantially increase the costs of exploring for, developing or producing oil and natural gas and may prevent or delay the commencement or continuation of a given operation. Our larger competitors may be able to absorb the burden of existing, and any changes to, federal, state and local laws and regulations more easily than we can, which could negatively impact our competitive position.
Our industry is cyclical, and at certain times historically there have been shortages of drilling rigs, equipment, supplies or qualified personnel. A sustained decline in commodity prices can also reduce the number of service providers for such drilling rigs, equipment, supplies or qualified personnel, contributing to or also resulting in the shortages. Alternatively, during periods of high prices, the cost of rigs, equipment, supplies and personnel can fluctuate widely and availability may be limited. These services may not be available on commercially reasonable terms or at all. We cannot predict the extent to which these conditions will exist in the future or their timing or duration. The high cost or unavailability of drilling rigs, equipment, supplies, personnel and other oil field services could significantly decrease our profit margins, cash flows and operating results and could restrict our ability to drill the wells and conduct the operations that we currently have planned and budgeted or that we may plan in the future. Any of these outcomes could have a material adverse effect on our business, results of operations and financial condition.
Our business is subject to operational hazards and uninsured risks that could have a material adverse effect on our business, results of operations and financial condition.
Our oil and natural gas exploration and production activities are subject to all of the inherent risks associated with drilling for and producing natural gas and oil, including the possibility of:
• | Adverse weather conditions, natural disasters, and/or other climate related matters—including extreme cold or heat, lightning and flooding, fires, earthquakes, hurricanes, tornadoes and other natural disasters. Although the potential effects of climate change on our operations (such as hurricanes, flooding, etc.) are uncertain at this time, changes in climate patterns could also have a negative impact upon our operations in the future, particularly with regard to any of our facilities that are located in or near coastal regions; |
• | Acts of aggression on critical energy infrastructure—including terrorist activity or “cyber security” events. We are subject to the ongoing risk that one of these incidents may occur which could significantly impact our business operations and/or financial results. Should one of these events occur in the future, it could impact our ability to operate our drilling and exploration processes, our operations could be disrupted, and/or property could be damaged resulting in substantial loss of revenues, increased costs to respond or other financial loss, damage to reputation, increased regulation and litigation and/or inaccurate information reported from our exploration and production operations to our financial applications, to our customers and to regulatory entities; and |
• | Other hazards—including the collision of third-party equipment with our infrastructure; explosions, equipment malfunctions, mechanical and process safety failures, well blowouts, formations with abnormal pressures and collapses of wellbore casing or other tubulars; events causing our facilities to operate below expected levels of capacity or efficiency; uncontrollable flows of natural gas, oil, brine or well fluids, release of pollution or contaminants (including hydrocarbons) into the environment (including discharges of toxic gases or substances) and other environmental hazards. |
Each of these risks could result in (i) damage to and destruction of our facilities; (ii) damage to and destruction of property, natural resources and equipment; (iii) injury or loss of life; (iv) business interruptions while damaged energy infrastructure is repaired or replaced; (v) pollution and other environmental damage; (vi) regulatory investigations and penalties; and (vii) repair and remediation costs. Any of these results could cause us to suffer substantial losses.
While we maintain insurance against some of these risks in amounts that we believe are reasonable, our insurance coverages have material deductibles, self-insurance levels and limits on our maximum recovery and do not cover all risks. For example, from time to time, we may not carry, or may be unable to obtain, on terms that we find acceptable and/or reasonable, insurance coverage for certain exposures, including, but not limited to certain environmental exposures (including potential environmental fines and penalties), business interruption and, named windstorm/hurricane exposures and, in limited circumstances, certain political risk exposures. The premiums and deductibles we pay for certain insurance policies are also subject to the risk of substantial increases over time that could negatively impact our financial results. In addition, we may not be able to renew existing insurance policies or procure desirable insurance on commercially reasonable terms. There is also a risk that our insurers may default on their insurance coverage obligations or that amounts for which we are insured, or that the
22
proceeds of such insurance, will not compensate us fully for our losses. Any of these outcomes could have a material adverse effect on our business, results of operations and financial condition.
Some of our operations are subject to joint ventures or operations by third parties, which could negatively impact our control over these operations and have a material adverse effect on our business, results of operations, financial condition and prospects.
A small portion of our operations and interests are operated by third-party working interest owners. In such cases, (i) we have limited ability to influence or control the day-to-day operation of such properties, including compliance with environmental, safety and other regulations, (ii) we cannot control the amount of capital expenditures that we are required to fund with respect to properties, (iii) we are dependent on third parties to fund their required share of capital expenditures and (iv) we may have restrictions or limitations on our ability to sell our interests in these jointly owned assets.
The insolvency of an operator of our properties, the failure of an operator of our properties to adequately perform operations or an operator’s breach of applicable agreements could reduce our production and revenue and result in our liability to governmental authorities for compliance with environmental, safety and other regulatory requirements, to the operator's suppliers and vendors and to royalty owners under oil and gas leases jointly owned with the operator or another insolvent owner. As a result, the success and timing of our drilling and development activities on properties operated by others and the economic results derived therefrom depends upon a number of factors outside of our control, including the operator’s timing and amount of capital expenditures, expertise and financial resources, inclusion of other participants in drilling wells and use of technology. Finally, an operator of our properties may have the right, if another non-operator fails to pay its share of costs, to require us to pay our proportionate share of the defaulting party's share of costs.
We currently sell most of our oil production to a limited number of significant purchasers. The loss of one or more of these purchasers, if not replaced, could reduce our revenues and have a material adverse effect on our financial condition or results of operations.
For the year ended December 31, 2016, five purchasers accounted for approximately 69% of our oil revenues. We depend upon a limited number of significant purchasers for the sale of most of our production. The loss of any of these customers, should we be unable to replace them, could adversely affect our revenues and have a material adverse effect on our financial condition and results of operations. We cannot assure you that any of our customers will continue to do business with us or that we will continue to have access to suitably liquid markets for our future production.
We are subject to a complex set of laws and regulations that regulate the energy industry for which we have to incur substantial compliance and remediation costs.
Our operations, and the energy industry in general, are subject to a complex set of federal, state and local laws and regulations over the following activities, among others:
• | the location of wells; |
• | methods of drilling and completing wells; |
• | allowable production from wells; |
• | unitization or pooling of oil and gas properties; |
• | spill prevention plans; |
• | limitations on venting or flaring of natural gas; |
• | disposal of fluids used and wastes generated in connection with operations; |
• | access to, and surface use and restoration of, well properties; |
• | plugging and abandoning of wells, even if we no longer own and/or operate such wells; |
• | air quality and emissions, noise levels and related permits; |
• | gathering, transportation and marketing of oil and natural gas (including NGLs); |
• | taxation; |
• | competitive bidding rules on federal and state lands; and |
23
• | the sourcing and supply of materials needed to operate. |
Generally, the regulations have become more stringent and have imposed more limitations on our operations and, as a result, have caused us to incur more costs to comply. Many required approvals are subject to considerable discretion by the regulatory agencies with respect to the timing and scope of approvals and permits issued. If permits are not issued, or if unfavorable restrictions or conditions are imposed on our drilling activities, we may not be able to conduct our operations as planned or at all. Delays in obtaining regulatory approvals or permits, the failure to obtain a drilling permit for a well, or the receipt of a permit with excessive conditions or costs could have a material negative impact on our operations and financial results. We may also incur substantial costs in order to maintain compliance with these existing laws and regulations, including costs to comply with new and more extensive reporting and disclosure requirements. Failure to comply with such requirements may result in the suspension or termination of operations and may subject us to criminal as well as civil and administrative penalties. We are exposed to fines and penalties to the extent that we fail to comply with the applicable laws and regulations, as well as the potential for limitations to be imposed on our operations. In addition, our costs of compliance may increase if existing laws and regulations are revised or reinterpreted, or if new laws and regulations become applicable to our operations. Such costs could have a material adverse effect on our business, financial condition and results of operations.
Also, some of our assets are located and operate on federal, state, local or tribal lands and are typically regulated by one or more federal, state or local agencies. For example, we have drilling and production operations that are located on federal lands, which are regulated by the U.S. Department of the Interior (DOI), particularly by the Bureau of Land Management (BLM). We also have operations on Native American tribal lands, which are regulated by the DOI, particularly by the Bureau of Indian Affairs (BIA), as well as local tribal authorities. Operations on these properties are often subject to additional regulations and compliance obligations, which can delay our access to such lands and impose additional compliance costs. There are also various laws and regulations that regulate various market practices in the industry, including antitrust laws and laws that prohibit fraud and manipulation in the markets in which we operate. The authority of the Federal Trade Commission and the CFTC to impose penalties for violations of laws or regulations has generally increased over the last few years.
We are exposed to the credit risk of our counterparties, contractors and suppliers.
We have significant credit exposure related to our sales of physical commodities, payments to contractors and suppliers, hedging activities and to the non-operating working interest owners who are counterparties to our operating agreements. If our counterparties become insolvent or otherwise fail to make payments/or perform within the time required under our contracts, our results of operations and financial condition could be materially adversely affected. Although we maintain strict credit policies and procedures and credit insurance in some cases, they may not be adequate to fully eliminate the credit risk associated with our counterparties, contractors and suppliers.
We are exposed to the performance risk of our key contractors and suppliers.
As an owner of drilling and production facilities with significant capital expenditures in our business, we rely on contractors for certain construction, drilling and completion operations and we rely on suppliers for key materials, supplies and services, including steel mills, pipe and tubular manufacturers and oil field service providers. We also rely upon the services of other third parties to explore or analyze our prospects to determine a method in which the prospects may be developed in a cost-effective manner. There is a risk that such contractors and suppliers may experience credit and performance issues triggered by a sustained low or a volatile commodity price environment that could adversely impact their ability to perform their contractual obligations with us, including their performance and warranty obligations. This could result in delays or defaults in performing such contractual obligations and increased costs to seek replacement contractors, each of which could negatively impact us. We could also be exposed to liability that we would otherwise be indemnified for by these counterparties should they become insolvent or are otherwise unable to satisfy their obligations under their indemnities.
The Sponsors and other legacy investors own approximately 84 percent of the equity interests in us and may have conflicts of interest with us and or public investors.
Investment funds affiliated with, and one or more co-investment vehicles controlled by, our Sponsors and other legacy investors collectively own approximately 84 percent of our equity interests and such persons or their designees hold substantially all of the seats on our board of directors. As a result, the Sponsors and such other investors have control over our decisions to enter into certain corporate transactions and have the ability to prevent any transaction that typically would require the approval of stockholders, regardless of whether holders of our notes or stock believe that any such transactions are in their own best interests. For example, the Sponsors and other legacy investors could collectively cause us to make acquisitions that increase the amount of our indebtedness or to sell assets, or could cause us to issue additional equity, debt, or declare dividends or other distributions to our equity holders. So long as investment funds affiliated with the Sponsors and other such investors continue to indirectly own a majority of the outstanding shares of our equity interests or otherwise control a majority of our board of directors, these investors will continue to be able to strongly influence or effectively control our decisions. The
24
indentures governing the notes and the credit agreements governing the RBL Facility and our senior secured term loan permit us, under certain circumstances, to pay advisory and other fees, pay dividends and make other restricted payments to the Sponsors and other investors, and the Sponsors and such other investors or their respective affiliates may have an interest in our doing so.
Additionally, the Sponsors and other legacy investors are in the business of making investments in companies and may from time to time acquire and hold interests in businesses that compete directly or indirectly with us or that supply us with goods and services. These persons may also pursue acquisition opportunities that may be complementary to (or competitive with) our business, and as a result those acquisition opportunities may not be available to us. In addition, the Sponsors’ and other investors’ interests in other portfolio companies could impact our ability to pursue acquisition opportunities.
The loss of the services of key personnel could have a material adverse effect on our business.
Our executive officers and other members of our senior management have been a critical element of our success. These individuals have substantial experience and expertise in our business and have made significant contributions to its growth and success. We do not have key man or similar life insurance covering our executive officers and other members of senior management. The unexpected loss of services of one or more of our executive officers or members of senior management could have a material adverse effect on our business.
Our business requires the retention and recruitment of a skilled workforce and the loss of employees and skilled labor shortages could result in the inability to implement our business plans and could negatively impact our profitability.
Our business requires the retention and recruitment of a skilled workforce including engineers, technical personnel, geoscientists, project managers, land personnel and other professionals. We compete with other companies in the energy and other industries for this skilled workforce. We have developed company-wide compensation and benefit programs that are designed to be competitive among our industry peers and that reflect market-based metrics as well as incentives to create alignment with the Sponsors and other investors, but there is a risk that these programs and those in the future will not be successful in retaining and recruiting these professionals or that we could experience increased costs. If we are unable to (i) retain our current employees, (ii) successfully complete our knowledge transfer and/or (iii) recruit new employees of comparable knowledge and experience, our business, results of operations and financial condition could be negatively impacted. In addition, we could experience increased costs to retain and recruit these professionals.
We may be affected by skilled labor shortages, which we have from time-to-time experienced. There is also a risk that staff reductions, that have and may continue to accompany the downturn in the industry, may adversely impact our ability to conduct our business or respond to new business opportunities. Skilled labor shortages could negatively impact the productivity and profitability of certain projects. Our inability to bid on new and attractive projects, or maintain productivity and profitability on existing projects due to the limited supply of skilled workers and/or increased labor costs could have a material adverse effect on our business, results of operation and financial condition.
Our strategy involves drilling in shale plays using some of the latest available horizontal drilling and completion techniques, the results of which are subject to drilling and completion technique risks, and drilling results may not meet our expectations for reserves or production.
Our operations involve utilizing the latest horizontal drilling and completion techniques in order to maximize cumulative recoveries and therefore optimize our returns. Drilling risks that we face include, but are not limited to, landing our well bore in the desired drilling zone, staying in the desired drilling zone while drilling horizontally through the formation, running our casing the entire length of the well bore and being able to run tools and other equipment consistently through the horizontal well bore. Risks that we face while completing our wells include, but are not limited to, being able to fracture stimulate the planned number of stages, being able to run tools the entire length of the well bore during completion operations and successfully cleaning out the well bore after completion of the final fracture stimulation stage.
Ultimately, the success of these drilling and completion techniques can only be evaluated over time as more wells are drilled and production profiles are established over a sufficiently longer period. If our drilling results are less than anticipated, the return on our investment for a particular project may not be as attractive as we anticipated and we could incur material write-downs of unevaluated properties and the value of our undeveloped acreage could decline in the future.
25
New technologies may cause our current exploration and drilling methods to become obsolete.
The oil and natural gas industry is subject to rapid and significant advancements in technology, including the introduction of new products and services using new technologies. As competitors use or develop new technologies, we may be placed at a competitive disadvantage, and competitive pressures may force us to implement new technologies at a substantial cost. In addition, competitors may have greater financial, technical and personnel resources that allow them to enjoy technological advantages and may in the future allow them to implement new technologies before we can. One or more of the technologies that we currently use or that we may implement in the future may become obsolete. We cannot be certain that we will be able to implement technologies on a timely basis or at a cost that is acceptable to us. If we are unable to maintain technological advancements consistent with industry standards, our business, results of operations and financial condition may be materially adversely affected.
Our business depends on access to oil, natural gas and NGLs processing, gathering and transportation systems and facilities.
The marketability of our oil, natural gas and NGLs production depends in large part on the operation, availability, proximity, capacity and expansion of processing, gathering and transportation facilities owned by third parties. We can provide no assurance that sufficient processing, gathering and/or transportation capacity will exist or that we will be able to obtain sufficient processing, gathering and/or transportation capacity on economic terms. A lack of available capacity on processing, gathering and transportation facilities or delays in their planned expansions could result in the shut-in of producing wells or the delay or discontinuance of drilling plans for properties. A lack of availability of these facilities for an extended period of time could negatively impact our revenues. In addition, we have entered into contracts for firm transportation and any failure to renew those contracts on the same or better commercial terms could increase our costs and our exposure to the risks described above.
Our operations are substantially dependent on the availability of water. Restrictions on our ability to obtain water may have an adverse effect on our financial condition, results of operations and cash flows.
Water currently is an essential component of deep shale oil and natural gas production during both the drilling and hydraulic fracturing processes. Historically, we have been able to purchase water from local land owners for use in our operations. In times of drought, we may be subject to local or state restrictions on the amount of water we procure to help protect local water supply. If we are unable to obtain water to use in our operations from local sources, we may be unable to economically produce our reserves, which could have an adverse effect on our financial condition, results of operations and cash flows.
We may face unanticipated water and other waste disposal costs.
We may be subject to regulation that restricts our ability to discharge water produced as part of our operations. Productive zones frequently contain water that must be removed in order for the oil and natural gas to produce, and our ability to remove and dispose of sufficient quantities of water from the various zones will determine whether we can produce oil and natural gas in commercial quantities. The produced water must be transported from the lease and injected into disposal wells. The availability of disposal wells with sufficient capacity to receive all of the water produced from our wells may affect our ability to produce our wells. Also, the cost to transport and dispose of that water, including the cost of complying with regulations concerning water disposal, may reduce our profitability.
Where water produced from our projects fails to meet the quality requirements of applicable regulatory agencies, our wells produce water in excess of the applicable volumetric permit limits, the disposal wells fail to meet the requirements of all applicable regulatory agencies, or we are unable to secure access to disposal wells with sufficient capacity to accept all of the produced water, we may have to shut in wells, reduce drilling activities, or upgrade facilities for water handling or treatment. The costs to dispose of this produced water may increase if any of the following occur:
• | we cannot obtain future permits from applicable regulatory agencies; |
• | water of lesser quality or requiring additional treatment is produced; |
• | our wells produce excess water; |
• | new laws and regulations require water to be disposed in a different manner; or |
• | costs to transport the produced water to the disposal wells increase. |
26
Our acquisition attempts may not be successful or may result in completed acquisitions that do not perform as anticipated.
We have made and may continue to make acquisitions of businesses and properties. However, suitable acquisition candidates may not continue to be available on terms and conditions we find acceptable or at all. Any acquisition, including any completed or future acquisition, involves potential risks, including, among others:
• | we may not produce revenues, reserves, earnings or cash flow at anticipated levels or could have environmental, permitting or other problems for which contractual protections prove inadequate; |
• | we may assume liabilities that were not disclosed to us and for which contractual protections prove inadequate or that exceed our estimates; |
• | we may acquire properties that are subject to burdens on title that we were not aware of at the time of acquisition that interfere with our ability to hold the property for production and for which contractual protections prove inadequate; |
• | we may be unable to integrate acquired businesses successfully and realize anticipated economic, operational and other benefits in a timely manner, which could result in substantial costs and delays or other operational, technical or financial problems; |
• | we may encounter disruptions to our ongoing business and matters that distract our management or divert resources that make it difficult to maintain our current business standards, controls, procedures and policies; |
• | we may issue (or assume) additional equity or debt securities or debt instruments in connection with future acquisitions, which may affect our liquidity or financial leverage; |
• | we may make mistaken assumptions about costs, including synergies related to an acquired business; |
• | we may encounter difficulties in complying with regulations, such as environmental regulations, and managing risks related to an acquired business; |
• | we may encounter limitations on rights to indemnity from the seller; |
• | we may make mistaken assumptions about the overall costs of equity or debt used to finance any such acquisition; |
• | we may encounter difficulties in entering markets in which we have no or limited direct prior experience and where competitors in such markets have stronger expertise and/or market positions; |
• | we may potentially lose key customers; and |
• | we may lose key employees and/or encounter costly litigation resulting from the termination of those employees. |
Any of the above risks could significantly impair our ability to manage our business, complete or effectively integrate acquisitions and may have a material adverse effect on our business, results of operations and financial condition.
Certain of our undeveloped leasehold acreage is subject to leases that will expire in several years unless production is established on units containing the acreage.
Although many of our reserves are located on leases that are held-by-production or held by continuous development, we do have provisions in a number of our leases that provide for the lease to expire unless certain conditions are met, such as drilling having commenced on the lease or production in paying quantities having been obtained within a defined time period. If commodity prices remain low or we are unable to allocate sufficient capital to meet these obligations in a declining commodity price environment given capital reductions, there is a risk that some of our existing proved reserves and some of our unproved inventory/acreage could be subject to lease expiration or a requirement to incur additional leasehold costs to extend the lease. This could result in impairment of remaining costs, a reduction in our reserves and our growth opportunities (or the incurrence of significant costs) and therefore could have a material adverse effect on our financial results.
27
If oil and/or natural gas prices decrease, we may be required to take write-downs of the carrying values of our properties, which could result in a material adverse effect on our results of operations and financial condition.
Accounting rules require that we review periodically the carrying value of our oil and natural gas properties for impairment. Under the successful efforts method of accounting, we review our oil and natural gas properties periodically (at least annually) to determine if impairment of such properties is necessary. Significant undeveloped leasehold costs are assessed for impairment at a lease level or resource play level based on our current exploration plans, while leasehold acquisition costs associated with prospective areas that have limited or no previous exploratory drilling are generally assessed for impairment by major prospect area. Proved oil and natural gas property values are reviewed when circumstances suggest the need for such a review and may occur if actual discoveries in a field are lower than anticipated reserves, reservoirs produce below original estimates or if commodity prices fall to a level that significantly affects anticipated future cash flows on the property. If required, the proved properties are written down to their estimated fair market value based on proved reserves and other market factors.
As of December 31, 2016, our estimated reserves are based on the average first day of the month spot price for the preceding 12-month period of $42.75 per barrel of oil and $2.48 per MMBtu of natural gas, as required by the SEC Regulation S-X, Rule 4-10 as amended, which are below the forward strip price as of December 31, 2016. We may incur impairment charges on our proved property in the future depending on the fair value of our proved reserves, which are subject to change as a result of factors such as prices, costs and well performance. We could also incur significant impairment charges of our unproved property should low oil prices not justify sufficient capital allocation to the continued development of our unproved properties, among other factors. These impairment charges could have a material adverse effect on our results of operations and financial condition for the periods in which such charges are taken.
Our operations are subject to governmental laws and regulations relating to environmental matters, which may expose us to significant costs and liabilities and could exceed current expectations. In addition, regulations relating to climate change and energy conservation may negatively impact our operations.
Our business is subject to laws and regulations that govern environmental matters. These regulations include compliance obligations for air emissions, water quality, wastewater discharge and solid and hazardous waste disposal, spill prevention, control and countermeasures, as well as regulations designed for the protection of threatened or endangered species. In some cases, our operations are subject to federal requirements for performing or preparing environmental assessments, environmental impact studies and/or plans of development before commencing exploration and production activities. In addition, our activities are subject to state regulations relating to conservation practices and protection of correlative rights. These regulations may negatively impact our operations and limit the quantity of natural gas and oil we produce and sell. We must take into account the cost of complying with such requirements in planning, designing, constructing, drilling, operating and abandoning wells and related surface facilities, including gathering, transportation, storage and waste disposal facilities. The regulatory frameworks govern, and often require permits for, the handling of drilling and production materials, water withdrawal, disposal of produced water, drilling and production wastes, operation of air emissions sources, and drilling activities, including those conducted on lands lying within wilderness, wetlands, ecologically or seismically sensitive areas, Federal and Indian lands and other protected areas. Various governmental authorities, including the U.S. Environmental Protection Agency (EPA), the DOI, the BIA and analogous state agencies and tribal governments, have the power to enforce compliance with these laws and regulations and the permits issued under them, often requiring difficult and costly actions, such as installing and maintaining pollution controls and maintaining measures to address personnel and process safety and protection of the environment and animal habitat near our operations. Failure to comply with these laws, regulations and permits may result in the assessment of administrative, civil and criminal penalties, the imposition of remedial obligations, the imposition of stricter conditions on or revocation of permits, the issuance of injunctions limiting or preventing some or all of our operations, delays in granting permits and cancellation of leases. Liabilities, penalties, suspensions, terminations and increased costs resulting from any failure to comply with regulations and requirements of the type described above, or from the enactment of additional similar regulations or requirements in the future or a change in the interpretation or the enforcement of existing regulations or requirements of this type, could have a material adverse effect on our business, results of operations and financial condition.
Gas pipelines are subject to construction, installation, operation and safety regulation by the U.S. Department of Transportation, or DOT, and various other federal, state and local agencies. Congress has enacted several pipeline safety acts over the years. Currently, the Pipeline and Hazardous Materials Safety Administration (PHMSA) under DOT administers pipeline safety requirements for natural gas and hazardous liquid pipelines. These regulations, among other things, address pipeline integrity management and pipeline operator qualification rules. In June 2016, Congress approved new pipeline safety legislation, the “Protecting Our Infrastructure of Pipelines and Enhancing Safety Act of 2016” (the “PIPES Act”), which provides the PHMSA with additional authority to address imminent hazards by imposing emergency restrictions, prohibitions, and safety measures on owners and operators of gas or hazardous liquids pipeline facilities. Significant expenses could be
28
incurred in the future if additional safety measures are required or if safety standards are raised and exceed the current pipeline control system capabilities.
Recently, the PHMSA has proposed additional regulations for gas pipeline safety. For example, in March 2016, the PHMSA proposed a rule that would expand integrity management requirements beyond High Consequence Areas to gas pipelines in newly defined Moderate Consequence Areas. The public comment period closed in July 2016. Also, in January 2017, the PHMSA approved final rules expanding its safety regulations for hazardous liquid pipelines by, among other things, expanding the required use of leak detection systems, requiring more frequent testing for corrosion and other flaws, and requiring companies to inspect pipelines in areas affected by extreme weather or natural disasters. The final rule will become effective six months after publication in the Federal Register. However, because the current Presidential Administration has prohibited such publication until it has had time to review the pending regulations, it is not clear when, or if, the final rules will become effective.
In December 2009, the EPA published its findings that emissions of carbon dioxide, methane, and other GHGs present an endangerment to public health and the environment because emissions of such gases are, according to the EPA, contributing to the warming of the earth’s atmosphere and other climate changes. In response to its endangerment finding, the EPA has adopted regulations restricting emissions of GHGs from motor vehicles and certain large stationary sources. The EPA adopted the stationary source rule, also known as the “Tailoring Rule,” in May 2010, and it also became effective January 2011, although the U.S. Supreme Court partially invalidated the rule in an opinion issued in June 2014. The Tailoring Rule remains applicable for those facilities considered major sources of six other “criteria” pollutants. In August 2016, the EPA proposed changes needed to bring EPA’s air permitting regulations in line with the Supreme Court’s decision on greenhouse gas permitting. The proposed rule was published in the Federal Register in October 2016 and the public comment period closed in December 2016.
Additionally, in September 2009, the EPA issued a final rule requiring the reporting of GHG emissions from specified large GHG emission sources in the U.S., including NGLs fractionators and local natural gas/distribution companies, beginning in 2011 for emissions occurring in 2010. In November 2010, the EPA expanded its existing GHG reporting rule to include onshore and offshore oil and natural gas production and onshore processing, transmission, storage and distribution facilities, which includes certain of our facilities, beginning in 2012 for emissions occurring in 2011. Amendments to the GHG reporting rule, revising certain calculation methods and clarifying certain terms, became final in early 2015. Effective January 1, 2016, the EPA has extended reporting to include emissions from completions and workovers of oil wells using hydraulic fracturing, as well as emissions from gathering and boosting systems. Additionally, the EPA announced in January 2015 that it will initiate rulemaking to encompass further segments of industry in GHG reporting, as well as explore regulatory opportunity to require use of new measurement and monitoring technology. In addition, the EPA has continued to adopt GHG regulations of the oil and gas and other industries, such as the Clean Power Plan for new coal-fired and natural gas-fired power plants published in October 2015. In February 2016, the Supreme Court stayed the implementation of the Clean Power Plan while legal challenges to the rule proceed. Depending on the ultimate outcome of those challenges, and how various states choose to implement this rule, it may alter the power generation mix between natural gas, coal, oil, and alternative energy sources, which would ultimately affect the demand for natural gas and oil in electric generation. Also, as a result of this continued regulatory focus, future GHG regulations of the oil and natural gas industry remain a possibility.
On November 15, 2016, the BLM finalized a rule for oil and gas facilities on onshore federal and Indian leases to prohibit venting, limit flaring, require leak detection, and allow adjustment of royalty rates for new leases. State and industry groups have challenged the rule in federal court, asserting that the BLM lacks the authority to prescribe air quality regulations. The rule went into effect in January 2017 and will require installation of tank vapor controls at over 70 existing well sites in the Altamont area at an estimated cost of approximately $5 million. On February 2, 2017, the U.S. House of Representatives passed a resolution under the Congressional Review Act to reverse this rule, and a similar resolution has been introduced in the U.S. Senate. Although we are following these legal developments, it is uncertain at this time whether the rule will be reversed.
In December 2015, the United States participated in the 21st Conference of the Parties of the United Nations Framework Convention on Climate Change in Paris, France. The text of the resulting Paris Agreement calls for nations to undertake “ambitious efforts” to “hold the increase in global average temperatures to well below 2 ºC above preindustrial levels and pursue efforts to limit the temperature increase to 1.5 ºC above pre-industrial levels;” reach global peaking of greenhouse gas emissions as soon as possible; and take action to conserve and enhance sinks and reservoirs of greenhouse gases, among other requirements. The Paris Agreement went into effect in November 2016. Also, in June 2016, the leaders of the United States, Canada and Mexico announced an Action Plan to, among other things, boost clean energy, improve energy efficiency, and reduce greenhouse gas emissions. The Action Plan specifically calls for a reduction in methane emissions from the oil and gas sector by 40 to 45 percent by 2025. It is possible that the Paris Agreement and subsequent domestic and international regulations will have adverse effects on the market for crude oil, natural gas and other fossil fuel products. It remains unclear
29
whether and how the results of the 2016 U.S. election could impact the regulation of GHG emissions at the federal and state level.
In addition, the U.S. Congress has from time to time considered adopting legislation to reduce emissions of GHGs and almost one-half of the states have already taken measures to reduce emissions of GHGs primarily through the planned development of GHG emission inventories and/or regional GHG cap-and-trade programs. Most of these cap and trade programs work by requiring major sources of emissions, such as electric power plants or major producers of fuels, such as refineries and natural gas processing plants, to acquire and surrender emission allowances that correspond to their annual emissions of GHGs. The number of allowances available for purchase is reduced each year until the overall GHG emission reduction goal is achieved. As the number of GHG emission allowances declines each year, the cost or value of such allowances is expected to escalate significantly. Although the U.S. Congress has not adopted such legislation at this time, it may do so in the future and many states continue to pursue regulations to reduce GHG emissions.
Regulation of GHG emissions could also result in reduced demand for our products, as oil and natural gas consumers seek to reduce their own GHG emissions. Any regulation of GHG emissions, including through a cap-and-trade system, technology mandate, emissions tax, reporting requirement or other program, could have a material adverse effect on our business, results of operations and financial condition.
Further, there have been various legislative and regulatory proposals at the federal and state levels to provide incentives and subsidies to (i) shift more power generation to renewable energy sources and (ii) support technological advances to drive less energy consumption. These incentives and subsidies could have a negative impact on oil, natural gas and NGLs consumption.
In addition, to the extent climate change results in more severe weather and significant physical effects, such as increased frequency and severity of storms, floods, droughts and other climatic effects, our own, our counterparties’ or our customers’ operations may be disrupted, which could result in a decrease in our available products or reduce our customers’ demand for our products.
Any of the above risks could impair our ability to manage our business and have a material adverse effect on our operations, cash flows and financial position.
Our operations may be exposed to significant delays, costs and liabilities as a result of environmental and health and safety laws and regulations applicable to our business, and new legislation or regulation on safety procedures in exploration and production operations could require us to adopt expensive measures and adversely impact our results of operation.
There is inherent risk in our operations of incurring significant environmental costs and liabilities due to our generation and handling of petroleum hydrocarbons and wastes, because of our air emissions and wastewater discharges, and as a result of historical industry operations and waste disposal practices. Some of our owned and leased properties have been used for oil and natural gas exploration and production activities for a number of years, often by third parties not under our control. During that time, we and/or other owners and operators of these facilities may have generated or disposed of wastes that polluted the soil, surface water or groundwater at our facilities and adjacent properties. For our non-operated properties, we are dependent on the operator for operational and regulatory compliance. We could be subject to claims for personal injury and/or natural resource and property damage (including site clean-up and restoration costs) related to the environmental, health or safety impacts of our oil and natural gas production activities, and we have been from time to time, and currently are, named as a defendant in litigation related to such matters. Under certain laws, we also could be subject to joint and several and/or strict liability for the removal or remediation of contamination regardless of whether such contamination was the result of our activities, even if the operations were in compliance with all applicable laws at the time the contamination occurred and even if we no longer own and/or operate on the properties. Private parties, including the owners of properties upon which our wells are drilled and facilities where our petroleum hydrocarbons or wastes are taken for reclamation or disposal, may also have the right to pursue legal actions to enforce compliance, as well as to seek damages for non-compliance with environmental laws and regulations or for personal injury or property damage. We have been and continue to be responsible for remediating contamination, including at some of our current and former facilities or areas where we produce hydrocarbons. While to date none of these obligations or claims have involved costs that have materially adversely affected our business, we cannot predict with certainty whether future costs of newly discovered or new contamination might result in a materially adverse impact on our business or operations.
There have been various regulations proposed and implemented that could materially impact the costs of exploration and production operations and cause substantial delays in the receipt of regulatory approvals from both an environmental and safety perspective. It is possible that more stringent regulations might be enacted or delays in receiving permits may occur in other areas, such as our onshore regions of the United States (including drilling operations on other federal or state lands).
30
Our operations could result in an equipment malfunction or oil spill that could expose us to significant liability.
Despite the existence of various procedures and plans, there is a risk that we could experience well control problems in our operations. As a result, we could be exposed to regulatory fines and penalties, as well as landowner lawsuits resulting from any spills or leaks that might occur. While we maintain insurance against some of these risks in amounts that we believe are reasonable, our insurance coverages have material deductibles, self-insurance levels and limits on our maximum recovery and do not cover all risks. For example, from time to time we may not carry, or may be unable to obtain on terms that we find acceptable and/or reasonable, insurance coverage for certain exposures including, but not limited to, certain environmental exposures (including potential environmental fines and penalties), business interruption and named windstorm/hurricane exposures and, in limited circumstances, certain political risk exposures. The premiums and deductibles we pay for certain insurance policies are also subject to the risk of substantial increases over time that could negatively impact our financial results. In addition, we may not be able to renew existing insurance policies or procure desirable insurance on commercially reasonable terms. There is also a risk that our insurers may default on their insurance coverage obligations or that amounts for which we are insured, or that the proceeds of such insurance, will not compensate us fully for our losses. Any of these outcomes could have a material adverse effect on our business, results of operations and financial condition.
Although we might also have remedies against our contractors or vendors or our joint working interest owners with regard to any losses associated with unintended spills or leaks, the ability to recover from such parties will depend on the indemnity provisions in our contracts as well as the facts and circumstances associated with the causes of such spills or leaks. As a result, our ability to recover associated costs from insurance coverages or other third parties is uncertain.
Legislation and regulatory initiatives relating to hydraulic fracturing could result in increased costs and additional operating restrictions or delays.
We use hydraulic fracturing extensively in our operations. The hydraulic fracturing process is typically regulated by state oil and natural gas commissions. Hydraulic fracturing involves the injection of water, sand and chemicals under pressure into formations to fracture the surrounding rock and stimulate production. The Safe Drinking Water Act (the SDWA) regulates the underground injection of substances through the Underground Injection Control (UIC) program. While hydraulic fracturing generally is exempt from regulation under the UIC program, the EPA has taken the position that hydraulic fracturing with fluids containing diesel fuel is subject to regulation under the UIC program as “Class II” UIC wells. Also, in June 2016, EPA published a final rule prohibiting the discharge of wastewater from onshore unconventional oil and gas extraction facilities to publicly owned wastewater treatment plants. The EPA is also conducting a study of private wastewater treatment facilities (also known as centralized waste treatment, or CWT, facilities) accepting oil and gas extraction wastewater. The EPA is collecting data and information related to the extent to which CWT facilities accept such wastewater, available treatment technologies (and their associated costs), discharge characteristics, financial characteristics of CWT facilities, and the environmental impacts of discharges from CWT facilities.
In March 2015, the Bureau of Land Management (BLM) published a final rule governing hydraulic fracturing on federal and Indian lands. The rule requires public disclosure of chemicals used in hydraulic fracturing, implementation of a casing and cementing program, management of recovered fluids, and submission to the BLM of detailed information about the proposed operation, including wellbore geology, the location of faults and fractures, and the depths of all usable water. In June 2016, the United States District Court for Wyoming set aside the rule, holding that the BLM lacked Congressional authority to promulgate the rule. The BLM has appealed the decision to the Tenth Circuit Court of Appeals. Although we are examining these proposed regulations, it is uncertain what impact they might have on our operations until they are implemented.
Furthermore, there are certain governmental reviews either underway or being proposed that focus on environmental aspects of hydraulic fracturing practices. The EPA is currently evaluating the potential impacts of hydraulic fracturing on drinking water resources. In December 2016, the EPA released a study examining the potential for hydraulic fracturing activities to impact drinking water resources, finding that, under some circumstances, the use of water in hydraulic fracturing activities can impact drinking water resources. Also, in February 2015, the EPA released a report with findings and recommendations related to public concern about induced seismic activity from disposal wells. The report recommends strategies for managing and minimizing the potential for significant injection-induced seismic events. Other governmental agencies, including the U.S. Department of Energy, the U.S. Geological Survey, and the U.S. Government Accountability Office, have evaluated or are evaluating various other aspects of hydraulic fracturing. These studies, when final and depending on their results, could spur initiatives to regulate hydraulic fracturing under the SDWA or otherwise. Congress has in recent legislative sessions considered legislation to amend the SDWA, including legislation that would repeal the exemption for hydraulic fracturing from the definition of “underground injection” and require federal permitting and regulatory control of hydraulic fracturing, as well as legislative proposals to require disclosure of the chemical constituents of the fluids used in the fracturing process, were proposed in recent sessions of Congress. The U.S. Congress may consider similar SDWA legislation in the future.
31
In August 2012, the EPA published final regulations under the Clean Air Act (CAA) that establish new air emission controls for oil and natural gas production and natural gas processing operations. Specifically, the EPA promulgated New Source Performance Standards establishing emission limits for sulfur dioxide (SO2) and volatile organic compounds (VOCs). The final rule requires a 95% reduction in VOCs emitted by mandating the use of reduced emission completions or “green completions” on all hydraulically-fractured gas wells constructed or refractured after January 1, 2015. Until this date, emissions from fractured and refractured gas wells were to be reduced through reduced emission completions or combustion devices. The rules also establish new requirements regarding emissions from compressors, controllers, dehydrators, storage tanks and other production equipment. In response to numerous requests for reconsideration of these rules from both industry and the environmental community and court challenges to the final rules, the EPA has issued, and will likely continue to issue, revised rules responsive to some of the requests for reconsideration. In particular, in May 2016, the EPA amended its regulations to impose new standards for methane and VOC emissions for certain new, modified, and reconstructed equipment, processes, and activities across the oil and natural gas sector. On the same day, the EPA finalized a plan to implement its minor new source review program in Indian country for oil and natural gas production, and it issued for public comment an information request that will require companies to provide extensive information instrumental for the development of regulations to reduce methane emissions from existing oil and gas sources. These standards, as well as any future laws and their implementing regulations, may require us to obtain pre-approval for the expansion or modification of existing facilities or the construction of new facilities expected to produce air emissions, impose stringent air permit requirements, or mandate the use of specific equipment or technologies to control emissions.
Several states and local jurisdictions in which we operate have adopted, or are considering adopting, regulations that could restrict or prohibit hydraulic fracturing in certain circumstances, impose more stringent operating standards and/or require the disclosure of the composition of hydraulic fracturing fluids. For example, Texas enacted a law requiring oil and natural gas operators to publicly disclose the chemicals used in the hydraulic fracturing process, effective as of September 1, 2011. The Texas Railroad Commission adopted rules and regulations applicable to all wells for which the Texas Railroad Commission issues an initial drilling permit on or after February 1, 2012. The regulations require that well operators disclose the list of chemical ingredients subject to the requirements of the Occupational Safety and Health Administration (OSHA) for disclosure on an internet website and also file the list of chemicals with the Texas Railroad Commission with the well completion report. The total volume of water used to hydraulically fracture a well must also be disclosed to the public and filed with the Texas Railroad Commission. Furthermore, in May 2013, the Texas Railroad Commission issued an updated “well integrity rule,” addressing requirements for drilling, casing and cementing wells. The rule also includes new testing and reporting requirements, such as (i) clarifying the due date for cementing reports after well completion or after cessation of drilling, whichever is earlier, and (ii) the imposition of additional testing on “minimum separation wells” less than 1,000 feet below usable groundwater, which are not found in the Eagle Ford Shale or Permian Basin. The “well integrity rule” took effect in January 2014. Additionally, in October 2014, the Commission adopted disposal well rule amendments designed, amongst other things, to require applicants for new disposal wells that will receive non-hazardous produced water and hydraulic fracturing flowback fluid to conduct seismic activity searches utilizing the U.S. Geological Survey. The searches are intended to determine the potential for earthquakes within a circular area of 100 square miles around a proposed, new disposal well. The disposal well rule amendments, which became effective in November 2014, also clarify the Commission’s authority to modify, suspend or terminate a disposal well permit if scientific data indicates a disposal well is likely to contribute to seismic activity. The Commission has used this authority to deny permits for waste disposal wells. Similarly, Utah’s Division of Oil, Gas and Mining passed a rule in October 2012 requiring all oil and gas operators to disclose the amount and type of chemicals used in hydraulic fracturing operations using the national registry FracFocus.org.
A number of lawsuits and enforcement actions have been initiated across the country alleging that hydraulic fracturing practices have induced seismic activity and adversely impacted drinking water supplies, use of surface water, and the environment generally. If new laws or regulations that significantly restrict hydraulic fracturing, such as amendments to the SDWA, are adopted, such laws could make it more difficult or costly for us to perform fracturing to stimulate production from tight formations as well as make it easier for third parties opposing the hydraulic fracturing process to initiate legal proceedings based on allegations that specific chemicals used in the fracturing process could adversely affect groundwater. In addition, if hydraulic fracturing is further regulated at the federal or state level, our fracturing activities could become subject to additional permitting and financial assurance requirements, more stringent construction specifications, increased monitoring, reporting and recordkeeping obligations, plugging and abandonment requirements and also to attendant permitting delays and potential increases in costs. Such legislative changes could cause us to incur substantial compliance costs, and compliance or the consequences of any failure to comply by us could have a material adverse effect on our financial condition and results of operations. Until such regulations are finalized and implemented, it is not possible to estimate their impact on our business. At this time, no adopted regulations have imposed a material impact on our hydraulic fracturing operations.
32
Any of the above risks could impair our ability to manage our business and have a material adverse effect on our operations, cash flows and financial position.
Legislation or regulatory initiatives intended to address seismic activity could restrict our drilling and production activities, as well as our ability to dispose of produced water gathered from such activities, which could have a material adverse effect on our business.
State and federal regulatory agencies have recently focused on a possible connection between hydraulic fracturing related activities, particularly the underground injection of wastewater into disposal wells, and the increased occurrence of seismic activity, and regulatory agencies at all levels are continuing to study the possible linkage between oil and gas activity and induced seismicity. In addition, a number of lawsuits have been filed in some states, most recently in Oklahoma, alleging that disposal well operations have caused damage to neighboring properties or otherwise violated state and federal rules regulating waste disposal. In response to these concerns, regulators in some states are seeking to impose additional requirements, including requirements regarding the permitting of produced water disposal wells or otherwise to assess the relationship between seismicity and the use of such wells. For example, in October 2014, the Texas Railroad Commission adopted disposal well rule amendments designed to among other things, require applicants for new disposal wells that will receive non-hazardous produced water or other oil and gas waste to conduct seismic activity searches utilizing the U.S. Geological Survey. The searches are intended to determine the potential for earthquakes within a circular area of 100 square miles around a proposed new disposal well. If the permittee or an applicant of a disposal well permit fails to demonstrate that the produced water or other fluids are confined to the disposal zone or if scientific data indicates such a disposal well is likely to be or determined to be contributing to seismic activity, then the agency may deny, modify, suspend or terminate the permit application or existing operating permit for that well. The Commission has used this authority to deny permits for waste disposal wells.
Tax laws and regulations may change over time, including the elimination of federal income tax deductions currently available with respect to oil and gas exploration and development.
Tax laws and regulations are highly complex and subject to interpretation, and the tax laws and regulations to which we are subject may change over time. Our tax filings are based upon our interpretation of the tax laws in effect in various jurisdictions at the time that the filings were made. If these laws or regulations change, or if the taxing authorities do not agree with our interpretation of the effects of such laws and regulations, it could have a material adverse effect on our business and financial condition. In past years, legislation has been proposed that, if enacted into law, would make significant changes to U.S. federal and state income tax laws, including the elimination of certain U.S. federal income tax provisions currently available to oil and gas exploration and production companies. Such changes include, but are not limited to:
• | the repeal of the percentage depletion allowance for oil and gas properties; |
• | the elimination of current expensing of intangible drilling and development costs; |
• | the elimination of the deduction for certain U.S. production activities; and |
• | an extension of the amortization period for certain geological and geophysical expenditures. |
The new administration has also called for comprehensive tax reform that would significantly change U.S. federal tax laws. It is unclear whether any such changes will be enacted or how soon such changes could be effective. The elimination of such U.S. federal tax deductions, as well as any other changes to or the imposition of new federal, state, local or non-U.S. taxes (including the imposition of, or increases in production, severance or similar taxes) could have a material adverse effect on our business, results of operations and financial condition.
We have certain contingent liabilities that could exceed our estimates.
We have certain contingent liabilities associated with litigation, regulatory, environmental and tax matters described in Note 9 to our consolidated financial statements and elsewhere in this Annual Report on Form 10-K. In addition, the positions taken in our federal, state, local and previously in non-U.S. tax returns require significant judgments, use of estimates and interpretation of complex tax laws. Although we believe that we have established appropriate reserves for our litigation, regulatory, environmental and tax matters, we could be required to accrue additional amounts in the future and/or incur more actual cash expenditures than accrued for and these amounts could be material.
33
Retained liabilities associated with businesses or assets that we have sold could exceed our estimates and we could experience difficulties in managing these liabilities.
We have sold various assets and either retained certain liabilities or indemnified certain purchasers against future liabilities relating to businesses and assets sold, including breaches of warranties, environmental expenditures, asset retirements and other representations that we have provided. We may also be subject to retained liabilities with respect to certain divested assets by operation of law. For example, the recent and sustained decline in commodity prices has created an environment where there is an increased risk that owners and/or operators of assets purchased from us may no longer be able to satisfy plugging or abandonment obligations that attach to such assets. In that event, due to operation of law, we may be required to assume these plugging or abandonment obligations on assets no longer owned and operated by us. Although we believe that we have established appropriate reserves for any such liabilities, we could be required to accrue additional amounts in the future and these amounts could be material.
Our debt agreements contain restrictions that limit our flexibility in operating our business.
Our existing debt agreements contain, and any other existing or future indebtedness of ours would likely contain, a number of covenants that impose operating and financial restrictions on us, including restrictions on our and our subsidiaries ability to, among other things:
• | incur additional debt, guarantee indebtedness or issue certain preferred shares; |
• | pay dividends on or make distributions in respect of, or repurchase or redeem, our capital stock or make other restricted payments; |
• | prepay, redeem or repurchase certain debt; |
• | make loans or certain investments; |
• | sell certain assets; |
• | create liens on certain assets; |
• | consolidate, merge, sell or otherwise dispose of all or substantially all of our assets; |
• | enter into certain transactions with our affiliates; |
• | alter the businesses we conduct; |
• | enter into agreements restricting our subsidiaries’ ability to pay dividends; and |
• | designate our subsidiaries as unrestricted subsidiaries. |
In addition, the RBL Facility requires us to comply with certain financial covenants. See Note 8 for additional discussion of the RBL covenants.
As a result of these covenants, we may be limited in the manner in which we conduct our business, and we may be unable to engage in favorable business activities or finance future operations or capital needs.
A failure to comply with the covenants under the RBL Facility or any of our other indebtedness could result in an event of default, which, if not cured or waived, could have a material adverse effect on our business, financial condition and results of operations. In the event of any such default, the lenders thereunder:
• | will not be required to lend any additional amounts to us; |
• | could elect to declare all borrowings outstanding, together with accrued and unpaid interest and fees, to be due and payable and terminate all commitments to extend further credit; or |
• | could require us to apply all of our available cash to repay these borrowings. |
Such actions by the lenders could cause cross defaults under our other indebtedness. If we were unable to repay those amounts, the lenders or holders under the RBL Facility and our other secured indebtedness could proceed against the collateral granted to them to secure that indebtedness. We pledge a significant portion of our assets as collateral under the RBL Facility, our senior secured term loans and our secured notes.
34
ITEM 1B. UNRESOLVED STAFF COMMENTS
None.
ITEM 2. PROPERTIES
A description of our properties is included in Part I, Item 1, Business, and is incorporated herein by reference.
We believe that we have satisfactory title to the properties owned and used in our businesses, subject to liens for taxes not yet payable, liens incident to minor encumbrances, liens for credit arrangements and easements and restrictions that do not materially detract from the value of these properties, our interests in these properties or the use of these properties in our businesses. We believe that our properties are adequate and suitable for the conduct of our business in the future.
ITEM 3. LEGAL PROCEEDINGS
A description of our material legal proceedings is included in Part II, Item 8, Financial Statements and Supplementary Data, Note 9, and is incorporated herein by reference.
ITEM 4. MINE SAFETY DISCLOSURES
Not applicable.
35
PART II
ITEM 5. MARKET FOR REGISTRANT’S COMMON EQUITY, RELATED STOCKHOLDER MATTERS AND ISSUER PURCHASES OF EQUITY SECURITIES.
Our common stock started trading on the New York Stock Exchange under the symbol EPE on January 17, 2014. As of February 17, 2017, we had 54 stockholders of record which does not include beneficial owners whose shares are held by a clearing agency, such as a broker or bank.
Quarterly Stock Prices. The following table reflects the quarterly high and low sales prices for the last two fiscal years for our common stock based on the daily composite listing of stock transactions for the New York Stock Exchange:
2016 | 2015 | |||||||||||||||
High | Low | High | Low | |||||||||||||
Fourth Quarter | $ | 6.80 | $ | 3.40 | $ | 7.82 | $ | 3.48 | ||||||||
Third Quarter | 5.21 | 3.55 | 11.56 | 4.85 | ||||||||||||
Second Quarter | 6.52 | 3.74 | 15.21 | 10.78 | ||||||||||||
First Quarter | 6.84 | 1.65 | 13.36 | 8.71 | ||||||||||||
Stock Performance Graph
The performance graph and the information contained in this section is not “soliciting material”, is being “furnished” not “filed” with the SEC and is not to be incorporated by reference into any of our filings under the Securities Act or the Exchange Act whether made before or after the date hereof and irrespective of any general incorporation language contained in such filing.
The graph below compares the change in the cumulative total shareholder return assuming the investment of $100 on January 17, 2014 (our first trading day) in each of EP Energy’s Common Stock, the S&P 500 Index, and the Dow Jones U.S. Exploration and Production Index. The historical stock performance shown on the graph below is not indicative of future price performance.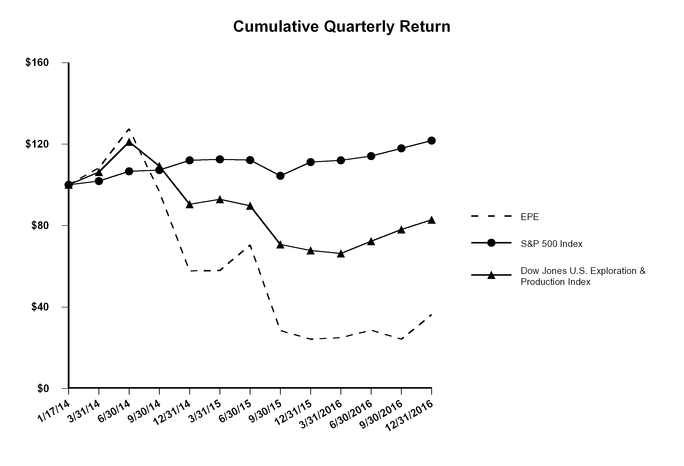
36
March 31, 2016 | June 30, 2016 | September 30, 2016 | December 31, 2016 | |||||||||||||
EP Energy Corporation | $ | 25.00 | $ | 28.65 | $ | 24.23 | $ | 36.23 | ||||||||
S&P 500 Index | 112.02 | 114.15 | 117.92 | 121.76 | ||||||||||||
Dow Jones U.S. Exploration and Production Index | 66.31 | 72.33 | 78.11 | 82.91 | ||||||||||||
March 31, 2015 | June 30, 2015 | September 30, 2015 | December 31, 2015 | |||||||||||||
EP Energy Corporation | $ | 57.96 | $ | 70.41 | $ | 28.48 | $ | 24.23 | ||||||||
S&P 500 Index | 112.46 | 112.20 | 104.42 | 111.16 | ||||||||||||
Dow Jones U.S. Exploration and Production Index | 92.94 | 89.66 | 70.70 | 67.72 | ||||||||||||
January 17, 2014 | March 31, 2014 | June 30, 2014 | September 30, 2014 | December 31, 2014 | ||||||||||||||||
EP Energy Corporation | $ | 100.00 | $ | 108.24 | $ | 127.49 | $ | 96.68 | $ | 57.74 | ||||||||||
S&P 500 Index | 100.00 | 101.83 | 106.61 | 107.27 | 111.98 | |||||||||||||||
Dow Jones U.S. Exploration and Production Index | 100.00 | 106.23 | 121.10 | 109.17 | 90.49 | |||||||||||||||
37
ITEM 6. SELECTED HISTORICAL CONSOLIDATED FINANCIAL DATA
Set forth below is our selected historical consolidated financial data for the periods and as of the dates indicated. We have derived the selected historical consolidated balance sheet data as of December 31, 2016 and December 31, 2015 and the statements of income data and statements of cash flow data for the years ended December 31, 2016, December 31, 2015 and December 31, 2014, from the audited consolidated financial statements of EP Energy Corporation included in this Report on Form 10-K. We have derived the selected historical consolidated balance sheet data as of December 31, 2014, 2013 and 2012, and the statements of income data and statements of cash flow data for the year ended December 31, 2013 and for the period from February 14 to December 31, 2012 and the period from January 1, 2012 through May 24, 2012 from the consolidated financial statements of EP Energy Corporation, which are not included in this Report on Form 10-K. All financial statement periods present our Brazil operations as discontinued operations prior to its sale in August 2014. Financial statement periods after May 24, 2012 (referred to as successor periods) also present certain domestic natural gas assets sold as discontinued operations prior to their sale in May 2014. See Item 8, “Financial Statements and Supplementary Data”, Note 2, for further discussion.
The following selected historical financial data should be read in conjunction with Item 7, “Management’s Discussion and Analysis of Financial Condition and Results of Operations” and Item 8, “Financial Statements and Supplementary Data” included in this Report on Form 10-K.
Successor | Predecessor | |||||||||||||||||||||||
Year ended December 31, | Year ended December 31, | Year ended December 31, | Year ended December 31, | February 14 to December 31, | January 1, to May 24, | |||||||||||||||||||
2016 | 2015 | 2014 | 2013 | 2012 | 2012 | |||||||||||||||||||
(in millions, except per common share amounts) | ||||||||||||||||||||||||
Results of Operations | ||||||||||||||||||||||||
Operating revenues | $ | 767 | $ | 1,908 | $ | 3,084 | $ | 1,576 | $ | 681 | $ | 932 | ||||||||||||
Impairment and ceiling test charges | 2 | 4,299 | 2 | 2 | 1 | 62 | ||||||||||||||||||
Operating (loss) income | (98 | ) | (3,955 | ) | 1,493 | 383 | (72 | ) | 338 | |||||||||||||||
Gain (loss) on extinguishment of debt | 384 | (41 | ) | (17 | ) | (9 | ) | (14 | ) | — | ||||||||||||||
Interest expense | (312 | ) | (330 | ) | (318 | ) | (354 | ) | (219 | ) | (14 | ) | ||||||||||||
(Loss) income from continuing operations | (27 | ) | (3,748 | ) | 727 | (56 | ) | (306 | ) | 187 | ||||||||||||||
Basic and diluted net income (loss) per common share | ||||||||||||||||||||||||
(Loss) income from continuing operations | $ | (0.11 | ) | $ | (15.37 | ) | $ | 3.00 | $ | (0.27 | ) | $ | (1.46 | ) | ||||||||||
Cash Flow | ||||||||||||||||||||||||
Net cash provided by (used in): | ||||||||||||||||||||||||
Operating activities | $ | 784 | $ | 1,327 | $ | 1,186 | $ | 960 | $ | 449 | $ | 580 | ||||||||||||
Investing activities | (144 | ) | (1,543 | ) | (2,044 | ) | (474 | ) | (7,893 | ) | (628 | ) | ||||||||||||
Financing activities | (646 | ) | 220 | 829 | (503 | ) | 7,513 | 110 | ||||||||||||||||
As of December 31, | ||||||||||||||||||||||||
2016 | 2015 | 2014 | 2013 | 2012 | ||||||||||||||||||||
(in millions) | ||||||||||||||||||||||||
Financial Position | ||||||||||||||||||||||||
Total assets | $ | 4,761 | $ | 5,833 | $ | 10,154 | $ | 8,257 | $ | 8,212 | ||||||||||||||
Long-term debt, net of debt issue costs | 3,789 | 4,812 | 4,533 | 4,340 | 4,601 | |||||||||||||||||||
Stockholders’/ Member’s equity | 606 | 619 | 4,348 | 2,937 | 2,748 | |||||||||||||||||||
38
Factors Affecting Trends. In May 2012, our Sponsors acquired our predecessor for approximately $7.2 billion, using approximately $3.3 billion in equity contributions and the proceeds from the issuance of $4.25 billion of debt. In 2014, we completed an initial public offering of approximately $669 million of common stock. Our operating revenues include realized and unrealized gains or losses on financial derivatives. For the year ended December 31, 2016, we recorded realized and unrealized losses on financial derivatives of $73 million, while for the years ended December 31, 2015 and 2014, we recorded realized and unrealized gains on financial derivatives of $667 million and $985 million, respectively. For the year ended December 31, 2013 and the period from February 14 to December 31, 2012, we recorded realized and unrealized losses on financial derivatives of $52 million and $62 million, respectively. The period from January 1 to May 24, 2012, includes realized and unrealized gains on financial derivatives of $365 million. For the year ended December 31, 2015, we recorded non-cash impairment charges of approximately $4.3 billion on our proved and unproved properties, while the period from January 1 to May 24, 2012, includes non-cash ceiling test and other impairment charges of $62 million. Additional items affecting trends were a gain on sale of assets of $78 million and a gain on extinguishment of debt of $384 million recorded during the year ended December 31, 2016 and restructuring costs of $221 million in the period from February 14 to December 31, 2012.
39
ITEM 7. MANAGEMENT’S DISCUSSION AND ANALYSIS OF FINANCIAL CONDITION AND RESULTS OF OPERATIONS
Our Management’s Discussion and Analysis of Financial Condition and Results of Operations (“MD&A”) should be read in conjunction with the financial statements and the accompanying notes presented in Item 8 of this Annual Report on Form 10-K. This discussion contains forward-looking statements and involves numerous risks and uncertainties, including, but not limited to, those described in “Risk Factors”. Actual results may differ materially from those contained in any forward-looking statements. See “Cautionary Statement Regarding Forward-Looking Statements” in the front of this report. The period ended December 31, 2014 included in these financial statements present certain domestic natural gas assets and Brazil operations sold as discontinued operations. Unless otherwise indicated or the context otherwise requires, references in this MD&A section to “we”, “our”, “us” and “the Company” refer to EP Energy Corporation and each of its consolidated subsidiaries.
Our Business
Overview. We are an independent exploration and production company engaged in the development and acquisition of unconventional onshore oil and natural gas properties in the United States. We operate through a diverse base of producing assets and are focused on creating shareholder value through the development of our drilling inventory located in three core areas: the Eagle Ford Shale (South Texas), the Wolfcamp Shale (Permian Basin in West Texas), and the Altamont Field in the Uinta Basin (Northeastern Utah), which are further described in Item I, Business.
We evaluate growth opportunities for our asset portfolio that are aligned with our core competencies and that are in areas that we believe can provide us a competitive advantage. Strategic acquisitions of leasehold acreage or acquisitions of producing assets can provide opportunities to achieve our long-term goals by leveraging existing expertise in our core areas, balancing our exposure to regions, basins and commodities, helping us to achieve risk-adjusted returns competitive with those available within our existing drilling program and by increasing our reserves. We continuously evaluate our asset portfolio and will sell oil and natural gas properties if they no longer meet our long-term goals. Pursuant to this strategy, in May 2016 we completed the sale of our assets located in the Haynesville and Bossier shales for approximately $420 million (net proceeds of $388 million in cash after customary adjustments) and recorded a gain on the sale of approximately $79 million.
In May 2016, we amended our Wolfcamp development agreement with the University Lands to provide flexibility to extend the time frame to hold our acreage by nearly four years to the end of 2021, with an increase in annual well completion requirements from six wells per year to 34, 55 and 55 wells per year in 2016, 2017 and 2018, respectively. In addition, the amendment includes a sliding scale royalty framework that improves well returns in a lower price environment. The royalty rates associated with the sliding scale framework are determined using a rolling average six month price with royalty rates of 12.5% at an average price of $50 per Bbl (WTI) and below, 18.75% at an average price of $60 per Bbl (WTI) and below, 25% at an average price of $80 per Bbl (WTI) and below and 28% above $80 per Bbl (WTI).
In January 2017, we entered into a drilling joint venture to accelerate and fund future oil and natural gas development in our Wolfcamp program. Under the joint venture, our partner is participating in the development of up to 150 wells in two separate 75 well tranches primarily in Reagan and Crockett counties. Our joint venture investor will fund approximately $450 million over the entire program, or approximately 60 percent of the drilling, completion and equipping costs in exchange for a 50 percent working interest in the joint venture wells. Once the investor achieves a 12 percent internal rate of return on its invested capital in each tranche, its working interest will revert to 15 percent. We will retain operational control of the joint venture assets. The first wells under the joint venture began production in January 2017. For a further discussion on this joint venture, see Part II, Item 8, “Financial Statements and Supplementary Data”, Note 11.
Factors Influencing Our Profitability. Our profitability is dependent on the prices we receive for our oil and natural gas, the costs to explore, develop, and produce our oil and natural gas, and the volumes we are able to produce, among other factors. Our long-term profitability will be influenced primarily by:
• | growing our proved reserve base and production volumes through the successful execution of our drilling programs or through acquisitions; |
• | finding and producing oil and natural gas at reasonable costs; |
• | managing operating costs; and |
• | managing commodity price risks on our oil and natural gas production. |
In addition to these factors, our future profitability and performance will be affected by volatility in the financial and commodity markets, changes in the cost of drilling and oilfield services, operating and capital costs, and our debt level and related interest costs. Future commodity price declines may cause changes to our future capital, production rates, levels of proved reserves and development plans, all of which impact performance. Additionally, we may be impacted by weather events, regulatory issues or other third party actions outside of our control.
Forward commodity prices play a significant role in determining the recoverability of proved or unproved property costs on our balance sheet. Future price declines along with changes to our future capital, production rates, levels of proved reserves and development plans may result in an impairment of the carrying value of our proved and/or unproved properties in the future, and such charges could be significant. For a further discussion of our proved and unproved property costs, see Part II, Item 8, "Financial Statements and Supplementary Data", Note 3 and Critical Accounting Estimates for key assumptions and judgments used in these estimations.
We attempt to mitigate certain risks by entering into longer term contractual arrangements to control costs and by entering into derivative contracts to stabilize cash flows and reduce the financial impact of unfavorable movements in both commodity prices and locational price differences. Because we apply mark-to-market accounting on our derivative contracts, our reported results of operations and financial position can be impacted significantly by commodity price movements from period to period. Adjustments to our strategy and the decision to enter into new contracts or positions or to alter existing contracts or positions are made based on the goals of the overall company.
Derivative Instruments. Our realized prices from the sale of our oil and natural gas are affected by (i) commodity price movements, including locational or basis price differences that exist between the commodity index price (e.g., WTI) and the actual price at which we sell our oil and natural gas, and (ii) other contractual pricing adjustments contained in our underlying sales contracts. In order to stabilize cash flows and protect the economic assumptions associated with our capital investment programs, we enter into financial derivative contracts to reduce the financial impact of downward commodity price movements and unfavorable movements in locational prices.
During 2016, we (i) settled commodity index hedges on approximately 96% of our oil production, 75% of our total liquids production and on 34% of our natural gas production at average floor prices of $80.47 per barrel of oil, $0.55 per gallon of NGLs and $3.59 per MMBtu of natural gas, respectively and (ii) hedged basis risk on 100% of our 2016 Eagle Ford oil production. To the extent our oil and natural gas production is unhedged, either from a commodity index price or locational price perspective, our operating revenues will be impacted from period to period. The following table and discussion that follows reflects the contracted volumes and the prices we will receive under derivative contracts we held as of December 31, 2016.
40
2017 | 2018 | ||||||||||||
Volumes(1) | Average Price(1) | Volumes(1) | Average Price(1) | ||||||||||
Oil | |||||||||||||
Fixed Price Swaps | |||||||||||||
WTI | 4,015 | $ | 63.94 | — | $ | — | |||||||
Three Way Collars | |||||||||||||
Ceiling - WTI | 8,833 | $ | 70.37 | 3,285 | $ | 65.00 | |||||||
Floors - WTI(2) (3) | 8,833 | $ | 60.62 | 3,285 | $ | 60.00 | |||||||
Basis Swaps | |||||||||||||
LLS vs. Brent(4) | 3,650 | $ | (3.14 | ) | — | $ | — | ||||||
Midland vs. Cushing(5) | 1,460 | $ | (0.68 | ) | — | $ | — | ||||||
Natural Gas | |||||||||||||
Fixed Price Swaps | 24 | $ | 3.25 | 4 | $ | 3.11 | |||||||
Ceiling | 8 | $ | 3.67 | — | $ | — | |||||||
Floors | 8 | $ | 3.35 | — | $ | — | |||||||
Ethane | |||||||||||||
Fixed Price Swaps | 46 | $ | 0.27 | 62 | $ | 0.30 | |||||||
(1) Volumes presented are MBbls for oil, TBtu for natural gas and MMGal for ethane. Prices presented are per Bbl of oil, MMBtu of natural gas and Gal for ethane.
(2) If market prices settle at or below $46.24 in 2017, we will receive a “locked-in” cash settlement of the market price plus $14.38 per Bbl.
(3) If market prices settle at or below $50.00 in 2018, we will receive a “locked-in” cash settlement of the market price plus $10.00 per Bbl.
(4) | EP Energy receives Brent plus the basis spread listed and pays LLS. These positions listed do not include Brent vs. LLS basis swaps which offset our 3.7 MBbls LLS vs. Brent with an average of $(0.46) per barrel of oil. |
(5) EP Energy receives Cushing plus the basis spread listed and pays Midland.
For the period from January 1, 2017 through February 27, 2017, we entered into additional derivative contracts on approximately 32.1 MMGal of 2017 fixed price swaps on propane with an average price of $0.67 per gallon and 7.3 TBtu of 2018 natural gas fixed price swaps with an average price of $3.11 per MMBtu.
Summary of Liquidity and Capital Resources. As of December 31, 2016, we had available liquidity of approximately $1,131 million, reflecting $1,111 million of available liquidity on our $1.5 billion RBL Facility borrowing base and $20 million of available cash. In 2016, we took a number of steps to maintain or improve our liquidity, strengthen our balance sheet and expand our financial flexibility. These steps included (i) completing the sale of our Haynesville and Bossier Shale assets, using the net proceeds to reduce debt, (ii) repurchasing over $800 million aggregate principal amount of our unsecured notes and term loans for cash at a discount, (iii) amending certain restrictive debt covenants in our RBL Facility through the first quarter of 2018, (iv) exchanging approximately 95% of the outstanding amount of our May 2018 and April 2019 term loans for new term loans of approximately $580 million with amended terms and a maturity date of June 2021, (v) issuing $500 million of 8.00% senior secured notes with a maturity date of November 2024 and using the proceeds to pay down our RBL Facility and (vi) entering into hedge transactions to provide additional 2017 and 2018 price protection on oil and natural gas. In February 2017, we also issued $1 billion of 8.00% senior secured notes which mature in 2025 using the proceeds (less fees and expenses) to repay in full our $580 million senior secured term loans due 2021, repurchase $250 million of our 9.375% senior notes due 2020 in the open market, and repay $111 million of the amounts outstanding under our RBL Facility. As a result of this issuance, our RBL borrowing base was further reduced to $1.44 billion. For a further discussion of our liquidity and capital resources, including factors that could impact our liquidity, see Liquidity and Capital Resources.
Outlook. For 2017, we expect to spend approximately $630 million to $730 million in capital in our programs, with $245 million to $325 million allocated to the Wolfcamp Shale, $260 million to $270 million allocated to the Eagle Ford Shale and $125 million to $135 million allocated to Altamont. We anticipate 175 to 190 gross well completions, and our average daily production volumes for the year to be approximately 75 MBoe/d to 82 MBoe/d, including average daily oil production volumes of approximately 45 MBbls/d to 49 MBbls/d.
41
Production Volumes and Drilling Summary
Production Volumes. Below is an analysis of our production volumes for the years ended December 31:
2016 | 2015 | 2014 | ||||||
United States (MBoe/d) | ||||||||
Eagle Ford Shale | 43.5 | 58.2 | 50.9 | |||||
Wolfcamp Shale | 21.4 | 19.9 | 15.3 | |||||
Altamont | 16.5 | 17.1 | 15.5 | |||||
Other(1) | 6.2 | 14.5 | 16.0 | |||||
Total | 87.6 | 109.7 | 97.7 | |||||
Oil (MBbls/d) | 46.6 | 60.5 | 54.8 | |||||
Natural Gas (MMcf/d)(1) | 158 | 207 | 190 | |||||
NGLs (MBbls/d) | 14.7 | 14.7 | 11.3 | |||||
(1) | Primarily consists of Haynesville Shale which was sold in May 2016. For the years ended December 31, 2016, 2015 and 2014, natural gas volumes included 37 MMcf/d, 87 MMcf/d and 96 MMcf/d, respectively, from the Haynesville Shale. |
• | Eagle Ford Shale—Our Eagle Ford Shale equivalent volumes decreased by 14.7 MBoe/d (approximately 25%) and oil production decreased by 12.5 MBbls/d (approximately 32%) for the year ended December 31, 2016 compared to 2015. During 2016, we completed 39 additional operated wells in the Eagle Ford, for a total of 598 net operated wells as of December 31, 2016. |
• | Wolfcamp Shale—Our Wolfcamp Shale equivalent volumes increased 1.5 MBoe/d (approximately 8%) and oil production decreased by 0.5 MBbls/d (approximately 5%) for the year ended December 31, 2016 compared to 2015. During 2016, we completed 44 additional operated wells, for a total of 287 net operated wells as of December 31, 2016. |
• | Altamont—Our Altamont equivalent volumes decreased 0.6 MBoe/d (approximately 4%) and oil production decreased by 0.9 MBbls/d (approximately 7%) for the year ended December 31, 2016 compared to 2015. During 2016, we completed 15 additional operated oil wells, for a total of 373 net operated wells as of December 31, 2016. During 2016, we also recompleted 52 wells in this area. |
Our production declines in our Eagle Ford and Altamont areas reflect natural declines and the slowed pace of development in our drilling programs due to reduced capital spending in 2015 and in 2016, while increases in Wolfcamp reflect incremental capital allocated to this program in 2016. Future volumes will be impacted by our levels of capital spending and the timing of that spending. In the current commodity price environment, we may continue to have low spending levels which may result in lower reported volumes in the future.
42
Results of Operations
The information below reflects financial results for EP Energy Corporation for the years ended December 31, 2016, 2015 and 2014. Our financial results for the year ended December 31, 2014 reflect the presentation of certain domestic natural gas assets divested and the sale of our Brazilian operations as discontinued operations.
Year ended December 31, | |||||||||||
2016 | 2015 | 2014 | |||||||||
(in millions) | |||||||||||
Operating revenues: | |||||||||||
Oil | $ | 653 | $ | 981 | $ | 1,705 | |||||
Natural gas | 122 | 200 | 284 | ||||||||
NGLs | 65 | 60 | 110 | ||||||||
Total physical sales | 840 | 1,241 | 2,099 | ||||||||
Financial derivatives | (73 | ) | 667 | 985 | |||||||
Total operating revenues | 767 | 1,908 | 3,084 | ||||||||
Operating expenses: | |||||||||||
Oil and natural gas purchases | 10 | 31 | 23 | ||||||||
Transportation costs | 109 | 116 | 100 | ||||||||
Lease operating expense | 159 | 186 | 193 | ||||||||
General and administrative | 146 | 148 | 244 | ||||||||
Depreciation, depletion and amortization | 462 | 983 | 875 | ||||||||
Gain on sale of assets | (78 | ) | — | — | |||||||
Impairment charges | 2 | 4,299 | 2 | ||||||||
Exploration and other expense | 5 | 20 | 25 | ||||||||
Taxes, other than income taxes | 50 | 80 | 129 | ||||||||
Total operating expenses | 865 | 5,863 | 1,591 | ||||||||
Operating (loss) income | (98 | ) | (3,955 | ) | 1,493 | ||||||
Other income | — | — | 1 | ||||||||
Gain (loss) on extinguishment of debt | 384 | (41 | ) | (17 | ) | ||||||
Interest expense | (312 | ) | (330 | ) | (318 | ) | |||||
(Loss) income from continuing operations before income taxes | (26 | ) | (4,326 | ) | 1,159 | ||||||
Income tax expense (benefit) | 1 | (578 | ) | 432 | |||||||
(Loss) income from continuing operations | (27 | ) | (3,748 | ) | 727 | ||||||
Income from discontinued operations, net of tax | — | — | 4 | ||||||||
Net (loss) income | $ | (27 | ) | $ | (3,748 | ) | $ | 731 | |||
43
Operating Revenues
The table below provides our operating revenues, volumes and prices per unit for the years ended December 31, 2016, 2015 and 2014. We present (i) average realized prices based on physical sales of oil, natural gas and NGLs as well as (ii) average realized prices inclusive of the impacts of financial derivative settlements and premiums which reflect cash received or paid during the respective period.
Year ended December 31, | |||||||||||
2016 | 2015 | 2014 | |||||||||
(in millions) | |||||||||||
Operating revenues: | |||||||||||
Oil | $ | 653 | $ | 981 | $ | 1,705 | |||||
Natural gas | 122 | 200 | 284 | ||||||||
NGLs | 65 | 60 | 110 | ||||||||
Total physical sales | 840 | 1,241 | 2,099 | ||||||||
Financial derivatives | (73 | ) | 667 | 985 | |||||||
Total operating revenues | $ | 767 | $ | 1,908 | $ | 3,084 | |||||
Volumes: | |||||||||||
Oil (MBbls) | 17,061 | 22,078 | 19,985 | ||||||||
Natural gas (MMcf)(1) | 57,799 | 75,533 | 69,434 | ||||||||
NGLs (MBbls) | 5,383 | 5,366 | 4,116 | ||||||||
Equivalent volumes (MBoe)(1) | 32,077 | 40,033 | 35,673 | ||||||||
Total MBoe/d(1) | 87.6 | 109.7 | 97.7 | ||||||||
Consolidated prices per unit(2): | |||||||||||
Oil | |||||||||||
Average realized price on physical sales ($/Bbl)(3) | $ | 38.24 | $ | 44.28 | $ | 85.31 | |||||
Average realized price, including financial derivatives ($/Bbl)(3)(4) | $ | 74.88 | $ | 82.18 | $ | 88.77 | |||||
Natural gas | |||||||||||
Average realized price on physical sales ($/Mcf)(3) | $ | 1.95 | $ | 2.27 | $ | 3.76 | |||||
Average realized price, including financial derivatives ($/Mcf)(3)(4) | $ | 2.19 | $ | 3.59 | $ | 3.34 | |||||
NGLs | |||||||||||
Average realized price on physical sales ($/Bbl) | $ | 12.02 | $ | 11.22 | $ | 26.73 | |||||
Average realized price, including financial derivatives ($/Bbl)(4) | $ | 12.19 | $ | 12.36 | $ | 27.78 | |||||
(1) | For the year ended December 31, 2016, 2015 and 2014, Haynesville Shale production volumes were 13,556 MMcf of natural gas and 2,259 MBoe (6.2 MBoe/d) of equivalent volumes, 31,521 MMcf of natural gas and 5,253 MBoe (14.4 MBoe/d) of equivalent volumes and 34,907 MMcf of natural gas and 5,818 MBoe (15.9 MBoe/d) of equivalent volumes, respectively. |
(2) | Oil prices for the years ended December 31, 2016 and 2015 reflect operating revenues for oil reduced by $1 million and $3 million, respectively, for oil purchases associated with managing our physical sales. Natural gas prices for the years ended December 31, 2016, 2015 and 2014 reflect operating revenues for natural gas reduced by $9 million, $28 million and $23 million, respectively, for natural gas purchases associated with managing our physical sales. |
(3) | Changes in realized oil and natural gas prices reflect the effects of unfavorable unhedged locational or basis differentials, unhedged volumes and contractual deductions between the commodity price index and the actual price at which we sold our oil and natural gas. |
(4) | The years ended December 31, 2016, 2015 and 2014 include approximately $625 million, $837 million and $69 million, respectively, of cash received for the settlement of crude oil derivative contracts. The years ended December 31, 2016, 2015 and 2014 include approximately $13 million of cash received, $99 million of cash received and $30 million of cash paid, respectively, for the settlement of natural gas financial derivatives. The years ended December 31, 2016, 2015 and 2014 include approximately $1 million, $6 million and $4 million, respectively, of cash received for the settlement of NGLs derivative contracts. No cash premiums were received or paid for the years ended December 31, 2016 and 2015. Cash premiums received for the year ended December 31, 2014 were approximately $1 million. |
44
Physical sales. Physical sales represent accrual-based commodity sales transactions with customers. For the year ended December 31, 2016, physical sales decreased by $401 million (32%), compared to the year ended December 31, 2015. For the year ended December 31, 2015, physical sales decreased by $858 million (41%) compared to the year ended December 31, 2014. Physical sales have decreased primarily due to lower oil and natural gas prices and reduced volumes reflecting the continued slower pace of development in our drilling programs due to reduced capital spending in 2015 and in 2016 and the sale of our Haynesville Shale assets in May 2016. The table below displays the price and volume variances on our physical sales when comparing the years ended December 31, 2016 and 2015.
Oil | Natural gas | NGLs | Total | ||||||||||||
(in millions) | |||||||||||||||
December 31, 2015 sales | $ | 981 | $ | 200 | $ | 60 | $ | 1,241 | |||||||
Change due to prices | (105 | ) | (31 | ) | 5 | (131 | ) | ||||||||
Change due to volumes | (223 | ) | (47 | ) | — | (270 | ) | ||||||||
December 31, 2016 sales | $ | 653 | $ | 122 | $ | 65 | $ | 840 | |||||||
Oil sales for the year ended December 31, 2016, compared to the year ended December 31, 2015, decreased by $328 million (33%), due primarily to a decline in oil volumes in all of our oil programs and lower oil prices. In 2016, Eagle Ford oil production volumes decreased by 32% (12.5 MBbls/d) compared with the year ended December 31, 2015. In addition, Wolfcamp oil production volumes decreased by 5% (0.5 MBbls/d) and Altamont oil production decreased by 7% (0.9 MBbls/d), reflecting the slowed pace of development of our core areas. For the year ended December 31, 2015, oil sales decreased by $724 million compared to the year ended December 31, 2014 due primarily to lower oil prices partially offset by oil volume growth in 2015 in our oil drilling programs.
Natural gas sales decreased for the year ended December 31, 2016 compared with the year ended December 31, 2015, primarily due to lower volumes and natural gas prices. In May 2016, we sold our Haynesville Shale assets. Our Haynesville Shale assets produced a total of 37 MMcf/d of natural gas for the year ended December 31, 2016 prior to it being sold compared to 87 MMcf/d for the same period in 2015. Partially offsetting this decrease was natural gas volume growth in Wolfcamp and Altamont during 2016. Natural gas sales decreased for the year ended December 31, 2015 compared with the year ended December 31, 2014 primarily due to lower natural gas prices and a decrease in volumes due to natural gas production declines in the Haynesville Shale, offset by natural gas volume growth in Wolfcamp, Eagle Ford and Altamont.
Our oil, natural gas and NGLs are sold at index prices (WTI, LLS, Henry Hub and Mt. Belvieu) or refiners, posted prices at various delivery points across our producing basins. Realized prices received (not considering the effects of hedges) are generally less than the stated index price as a result of fixed or variable contractual deductions, differentials from the index to the delivery point, adjustments for time, and/or discounts for quality or grade.
In the Eagle Ford, our oil is sold at prices tied to benchmark LLS crude oil. In Wolfcamp, physical barrels are generally sold at the WTI Midland Index, which trades at a spread to WTI Cushing. In Altamont, market pricing of our oil is based upon NYMEX based agreements which reflect transportation and handling costs associated with moving wax crude to end users. Across all regions, natural gas realized pricing is influenced by factors such as excess royalties paid on flared gas and the percentage of proceeds retained under processing contracts, in addition to the normal seasonal supply and demand influences and those factors discussed above. The table below displays the weighted average differentials and deducts on our oil and natural gas sales on an average NYMEX price.
Year ended December 31, | |||||||||||||||
2016 | 2015 | ||||||||||||||
Oil (Bbl) | Natural gas (MMBtu) | Oil (Bbl) | Natural gas (MMBtu) | ||||||||||||
Differentials and deducts | $ | (5.14 | ) | $ | (0.52 | ) | $ | (4.91 | ) | $ | (0.40 | ) | |||
NYMEX | $ | 43.32 | $ | 2.46 | $ | 48.80 | $ | 2.67 | |||||||
Net back realization % | 88.1 | % | 78.9 | % | 89.9 | % | 85.0 | % | |||||||
The lower oil realization percentage for the year ended December 31, 2016 was primarily a result of a reduced LLS premium relative to NYMEX in Eagle Ford throughout the year, partially offset by improved physical sales contract pricing in Altamont and Wolfcamp. The lower natural gas realization percentage in the year ended December 31, 2016 was primarily a result of the impact of the sale of our Haynesville assets and its associated lower differentials. Also impacting the lower realization percentage were lower flared volumes in the Eagle Ford and Wolfcamp areas in 2016 compared to the same periods in 2015.
45
NGLs sales increased by $5 million for the year ended December 31, 2016 compared with 2015. While NGLs volumes remained flat in 2016 compared to 2015, average realized prices increased due to higher pricing on all liquids components. For the year ended December 31, 2015 NGLs sales decreased by $50 million compared to 2014, due to lower average realized prices and lower NGLs volumes in 2015 compared to 2014. NGLs pricing is largely tied to crude oil prices.
Future growth in our overall oil and natural gas sales (including the impact of financial derivatives) will largely be impacted by commodity pricing, by our ability to maintain or grow oil volumes, by the location of our production and by the nature of our sales contracts. Based on our hedges in place as of December 31, 2016, we have approximately 12.8 MMBbls of oil hedged for 2017 at a weighted average price of $61.66 per barrel and 32 TBtu of natural gas hedged for 2017 at a weighted average price of $3.28 per MMBtu. Based on the mid-point of our 2017 guidance, our oil and natural gas hedges provide price protection on 75% and 76%, respectively, of our anticipated 2017 oil and natural gas production.
Gains or losses on financial derivatives. We record gains or losses due to changes in the fair value of our derivative contracts based on forward commodity prices relative to the prices in the underlying contracts. We realize such gains or losses when we settle the derivative position. During the year ended December 31, 2016, we recorded $73 million of derivative losses compared to derivative gains of $667 million during the year ended December 31, 2015. Realized and unrealized gains for the year ended December 31, 2014 were $985 million of derivative gains.
Operating Expenses
The tables below provide our operating expenses, volumes and operating expenses per unit for each of the periods presented:
Year ended December 31, | |||||||||||||||||||||||
2016 | 2015 | 2014 | |||||||||||||||||||||
Total | Per Unit(1) | Total | Per Unit(1) | Total | Per Unit(1) | ||||||||||||||||||
(in millions, except per unit costs) | |||||||||||||||||||||||
Operating expenses | |||||||||||||||||||||||
Oil and natural gas purchases | $ | 10 | $ | 0.32 | $ | 31 | $ | 0.79 | $ | 23 | $ | 0.64 | |||||||||||
Transportation costs | 109 | 3.41 | 116 | 2.88 | 100 | 2.81 | |||||||||||||||||
Lease operating expense | 159 | 4.97 | 186 | 4.64 | 193 | 5.40 | |||||||||||||||||
General and administrative(2) | 146 | 4.54 | 148 | 3.71 | 244 | 6.83 | |||||||||||||||||
Depreciation, depletion and amortization | 462 | 14.40 | 983 | 24.54 | 875 | 24.53 | |||||||||||||||||
Gain on sale of assets | (78 | ) | (2.44 | ) | — | — | — | — | |||||||||||||||
Impairment charges | 2 | 0.05 | 4,299 | 107.38 | 2 | 0.05 | |||||||||||||||||
Exploration and other expense | 5 | 0.16 | 20 | 0.50 | 25 | 0.71 | |||||||||||||||||
Taxes, other than income taxes | 50 | 1.58 | 80 | 2.00 | 129 | 3.62 | |||||||||||||||||
Total operating expenses | $ | 865 | 26.99 | $ | 5,863 | $ | 146.44 | $ | 1,591 | $ | 44.59 | ||||||||||||
Total equivalent volumes (MBoe) | 32,077 | 40,033 | 35,673 | ||||||||||||||||||||
(1) | Per unit costs are based on actual amounts rather than the rounded totals presented. |
(2) | For the year ended December 31, 2016, amount includes approximately $15 million or $0.47 per Boe of transition and severance costs related to workforce reductions and $19 million or $0.58 per Boe of non-cash compensation expense. For the year ended December 31, 2015, amount includes approximately $8 million or $0.20 per Boe of transition and severance costs related to workforce reductions and $13 million or $0.32 per Boe of non-cash compensation expense. For the year ended December 31, 2014, amount includes $90 million or $2.53 per Boe of transaction, management and other fees paid to our Sponsors, $11 million or $0.32 per Boe of cash received from an insurance settlement, $5 million or $0.15 per Boe of acquisition costs, $9 million or $0.25 per Boe of non-cash compensation expense and $2 million or $0.06 per Boe of transition and severance costs related to workforce reductions. |
Oil and natural gas purchases. We purchase and sell oil and natural gas on a monthly basis to improve the prices we would otherwise receive for our oil and natural gas or to manage firm transportation agreements. Oil and natural gas purchases for the year ended December 31, 2016 decreased by $21 million compared to 2015 primarily due to the sale of our Haynesville assets in May 2016. Oil and natural gas purchases for the year ended December 31, 2015 increased by $8 million compared to 2014 primarily due to higher natural gas purchases to manage our Haynesville production.
Transportation costs. Transportation costs for the year ended December 31, 2016 decreased by $7 million in 2016 compared to 2015 primarily due to the sale of our Haynesville assets and a decrease in NGLs transportation costs in Eagle Ford, partially offset by higher oil transportation costs in Eagle Ford. Transportation costs increases in 2015 compared to 2014 were
46
primarily due to gas transportation costs associated with Eagle Ford and Wolfcamp as a result of the production growth and new contracts in these areas in 2015, partially offset by a decrease in NGLs transportation costs in Eagle Ford.
Lease operating expense. Lease operating expense for the year ended December 31, 2016 decreased by $27 million compared to 2015 including a decrease of $15 million in Eagle Ford as a result of lower flowback and lower disposal and chemical costs, a decrease of approximately $9 million in Wolfcamp due to lower disposal costs, lower flowback and lower maintenance and repair costs and a $3 million decrease due to the sale of Haynesville. During 2016, we have generally experienced a decrease in operating costs across all programs due to ongoing contract negotiations and operational efficiencies. On a per equivalent unit basis, however, lease operating expense increased 7% from $4.64 per Boe in 2015 to $4.97 per Boe in 2016 due to lower production volumes in 2016.
Total lease operating expense decreased by $7 million in 2015 compared to 2014 due to lower maintenance and repair costs, lower chemical costs and lower power and fuel costs in Altamont, and lower power costs due to releasing rental generators, lower chemical costs from changing the method in which we treated our gas (amine unit vs. chemicals) and lower disposal and labor costs in Eagle Ford. These decreases were partly offset by an increase in Wolfcamp for the year ended December 31, 2015 due to higher maintenance and repair and compression costs associated with production volumes growth in this area in 2015.
General and administrative expenses. General and administrative expense for the year ended December 31, 2016 decreased by $2 million compared to 2015. Lower costs during the year ended December 31, 2016 compared to 2015 included lower payroll, benefits and administrative costs of $15 million, offset by higher severance expense of $7 million and higher legal and professional fees of $6 million. The lower payroll, benefits and administrative costs resulted primarily from a general and administrative headcount reduction of approximately 28% in response to the lower commodity price environment and the sale of Haynesville.
General and administrative expenses for the year ended December 31, 2015 decreased $96 million compared to the year ended December 31, 2014. In 2014, we paid Sponsor-related fees of approximately $90 million under agreements that terminated with the completion of our initial public offering in January 2014. Additionally, for the year ended December 31, 2015, we incurred lower payroll, benefits and administrative costs of $20 million compared to the same periods in 2014 from lower headcount as a result of reductions in response to the lower price environment. Partially offsetting these reductions in 2015 were an $11 million insurance settlement received in 2014 and higher transition and restructuring costs of $6 million in 2015.
Depreciation, depletion and amortization expense. Depreciation, depletion and amortization expense for the year ended December 31, 2016 decreased compared to 2015 due primarily to the impact on depreciation, depletion and amortization of a non-cash impairment charge recorded in the fourth quarter of 2015 on our proved properties in Eagle Ford, the sale of our Haynesville Shale assets in May 2016 and an overall decrease in production volumes. For the year ended December 31, 2016, our depreciation, depletion and amortization expense was also impacted by an adjustment of approximately $29 million ($0.89 per Boe) to accrue for certain non-income tax items that would have been historically capitalized and amortized or impaired in prior periods. Our depreciation, depletion and amortization costs increased from 2014 to 2015 due to increases in production volumes from the ongoing development of higher cost oil programs (e.g. Eagle Ford and Wolfcamp) and slightly higher depletion rates. Our average depreciation, depletion and amortization costs per unit for the year-to-date periods were:
Year ended December 31, | |||||||||||
2016 | 2015 | 2014 | |||||||||
Depreciation, depletion and amortization ($/Boe) | $ | 14.40 | $ | 24.54 | $ | 24.53 | |||||
Our depreciation, depletion and amortization rate in the future will be impacted by the level and timing of capital
spending, overall cost savings on capital and the level and type of reserves recorded on completed projects. For 2017, we currently anticipate our depreciation, depletion and amortization costs per unit to be between $16.00 and $17.00 per Boe.
Gain on sale of assets. For the year ended December 31, 2016, we recorded a $79 million gain related to the
sale of our assets in the Haynesville and Bossier shales completed in May 2016.
Impairment charges. For the year ended December 31, 2015, we recorded non-cash impairment charges of approximately $4.0 billion on our proved properties in the Eagle Ford Shale and $288 million on our unproved properties in the Wolfcamp Shale.
Exploration and other expense. Exploration and other expense for the year ended December 31, 2016 decreased by $15 million from 2015 and by $5 million in 2015 from 2014. Included in exploration expense for the years ended
47
December 31, 2016, 2015 and 2014 were $2 million, $9 million and $18 million of amortization of unproved leasehold costs. In addition, in 2015 and 2014, we recorded approximately $2 million and $3 million, respectively, as other expense in conjunction with the early termination of contracts for drilling rigs, released in response to the lower price environment.
Taxes, other than income taxes. Taxes, other than income taxes for the year ended December 31, 2016 decreased by $30 million from 2015 and by $49 million from 2015 to 2014. The decreases in both periods were due to the significant reduction in severance taxes as a result of lower commodity prices. Lower oil volumes in 2016 also contributed to the decrease from 2015.
Other Income Statement Items.
(Gain) loss on extinguishment of debt. During the year ended December 31, 2016, we paid approximately $407 million in cash to repurchase a total of approximately $812 million in aggregate principal amount of our senior unsecured notes and term loans. We recorded a gain on extinguishment of debt of approximately $393 million for the year ended December 31, 2016 which included $12 million of non-cash expense related to eliminating associated debt issue costs.
For the year ended December 31, 2016, we also recorded losses on extinguishment of debt of $9 million primarily related to eliminating a portion of the unamortized debt issue costs due to the reduction of our RBL borrowing base in May 2016 and November 2016 as further noted in Liquidity and Capital Resources.
For the year ended December 31, 2015, we recorded a $41 million loss ($12 million of which was non-cash) on the extinguishment of debt in conjunction with the early repayment and retirement of $750 million senior secured notes due 2019. For the year ended December 31, 2014, we recorded a $17 million loss on extinguishment of debt for the portion of deferred financing costs written off in conjunction with the repayment and retirement of a PIK toggle note.
Interest expense. Interest expense for the year ended December 31, 2016 was $312 million compared to $330 million in 2015. Interest expense decreased in 2016 primarily due to the effects of our 2016 debt repurchases and the exchange of our term loans maturing in 2018 and 2019 for new loans, partially offset by higher interest expense related to our RBL Facility, our term loan due in 2021 issued in exchange for our existing term loans due in 2018 and 2019 and the issuance of our senior secured notes due in 2024. Interest expense for the year ended December 31, 2015 compared to 2014 increased due primarily to higher interest expense related to our RBL Facility. The increase in interest expense was partially offset by a decrease due to the retirement of a PIK toggle note in early 2014 and lower amortization of debt issuance costs.
Income taxes. For the year ended December 31, 2016, our effective tax rate was (1.9)%. Our effective tax rate differed from the statutory rate as a result of the effects of state income taxes (net of federal income tax effects), non-deductible compensation expense, and adjustments to the valuation allowance on our deferred tax assets, which offset deferred income tax benefits by $9 million for the year ended December 31, 2016. The effective tax rate for the year ended December 31, 2015 was 13.4%, lower than the statutory rate of 35% as a result of recording a valuation allowance of $975 million against our deferred tax assets. The effective tax rate in 2014 differed from the statutory rate primarily due to incremental non-cash income tax expense recorded in conjunction with changing our organizational structure in December 2014.
Income from discontinued operations. Our income from discontinued operations for the year ended December 31, 2014 includes the financial results of assets sold in May 2014 in the Arklatex and South Louisiana Wilcox areas and our Brazilian operations which were sold in August 2014. These assets were classified as discontinued operations and gains or losses recorded on the sale of these assets.
48
Supplemental Non-GAAP Measures
We use the non-GAAP measures “EBITDAX” and “Adjusted EBITDAX” as supplemental measures. We believe these supplemental measures provide meaningful information to our investors. We define EBITDAX as income (loss) from continuing operations plus interest and debt expense, income taxes, depreciation, depletion and amortization and exploration expense. Adjusted EBITDAX is defined as EBITDAX, adjusted as applicable in the relevant period for the net change in the fair value of derivatives (mark-to-market effects of financial derivatives, net of cash settlements and cash premiums related to these derivatives), the non-cash portion of compensation expense (which represents non-cash compensation expense under our long-term incentive programs adjusted for cash payments made under these plans), transition, restructuring and other costs that affect comparability, management and other fees paid to the Sponsors (which ended in 2014), gains and losses on sale of assets, gains and losses on extinguishment of debt and impairment charges.
We believe that the presentation of EBITDAX and Adjusted EBITDAX is important to provide management and investors with additional information (i) to evaluate our ability to service debt, adjusting for items required or permitted in calculating covenant compliance under our debt agreements, (ii) to provide an important supplemental indicator of the operational performance of our business without regard to financing methods and capital structure, (iii) for evaluating our performance relative to our peers, (iv) to measure our liquidity (before cash capital requirements and working capital needs) and (v) to provide supplemental information about certain material non-cash and/or other items that may not continue at the same level in the future. EBITDAX and Adjusted EBITDAX have limitations as analytical tools and should not be considered in isolation or as a substitute for analysis of our results as reported under GAAP or as an alternative to net income (loss), income (loss) from continuing operations, operating income (loss), operating cash flows or other measures of financial performance or liquidity presented in accordance with GAAP.
Below is a reconciliation of our consolidated net (loss) income to EBITDAX and Adjusted EBITDAX:
Year ended December 31, | |||||||||||
2016 | 2015 | 2014 | |||||||||
(in millions) | |||||||||||
Net (loss) income | $ | (27 | ) | $ | (3,748 | ) | $ | 731 | |||
Loss from discontinued operations, net of tax | — | — | (4 | ) | |||||||
(Loss) income from continuing operations | (27 | ) | (3,748 | ) | 727 | ||||||
Income tax expense (benefit) | 1 | (578 | ) | 432 | |||||||
Interest expense, net of capitalized interest | 312 | 330 | 318 | ||||||||
Depreciation, depletion and amortization | 462 | 983 | 875 | ||||||||
Exploration expense | 5 | 18 | 22 | ||||||||
EBITDAX | 753 | (2,995 | ) | 2,374 | |||||||
Mark-to-market on financial derivatives(1) | 73 | (667 | ) | (985 | ) | ||||||
Cash settlements and cash premiums on financial derivatives(2) | 639 | 942 | 44 | ||||||||
Non-cash portion of compensation expense(3) | 19 | 13 | 9 | ||||||||
Transition, restructuring and other costs(4) | 15 | 8 | (4 | ) | |||||||
Fees paid to Sponsors(5) | — | — | 90 | ||||||||
Gain on sale of assets(6) | (78 | ) | — | — | |||||||
(Gain) loss on extinguishment of debt(7) | (384 | ) | 41 | 17 | |||||||
Impairment charges | 2 | 4,299 | 2 | ||||||||
Adjusted EBITDAX | $ | 1,039 | $ | 1,641 | $ | 1,547 | |||||
(1) Represents the income statement impact of financial derivatives.
(2) | Represents actual cash settlements related to financial derivatives. No cash premiums were received or paid for the years ended December 31, 2016 and 2015. For the year ended December 31, 2014, we received approximately $1 million cash premiums. |
(3) For the years ended December 31, 2016, 2015 and 2014, cash payments were approximately $3 million, $8 million and $13 million, respectively.
(4) | Reflects transition and severance costs related to workforce reductions for the years ended December 31, 2016 and 2015. Reflects an $11 million insurance settlement and $5 million of acquisition costs as well as transition and severance costs related to restructuring or asset sales in 2014. |
(5) Represents transaction, management and other fees paid to the Sponsors in 2014.
(6) Represents the gain on the sale of our Haynesville Shale assets sold in May 2016.
(7) Represents the gain on extinguishment of debt recorded related to repurchases of our senior unsecured notes and term loans in 2016. Represents the loss on
extinguishment of debt recorded related to the repayment in May 2015 of our 2019 $750 million senior secured note for the year ended December 31, 2015. Represents the loss on extinguishment of debt recorded related to the retirement of the PIK toggle note in 2014 and the redetermination of the RBL Facility.
49
Liquidity and Capital Resources
Our primary sources of liquidity are cash generated by our operations and borrowings under our RBL Facility. Our primary uses of cash are capital expenditures, debt service including interest, and working capital requirements. Our available liquidity was approximately $1,131 million as of December 31, 2016.
During 2016, we took a number of steps to maintain or improve our liquidity, strengthen our balance sheet and expand our financial flexibility, including (i) completing the sale of our Haynesville and Bossier shale assets for approximately $420 million (net proceeds of approximately $388 million after customary adjustments), (ii) repurchasing for cash a total of $812 million in aggregate principal amount of our unsecured notes and term loans for approximately $407 million in cash, (iii) amending certain restrictive debt covenants in our RBL Facility through the first quarter of 2018, (iv) exchanging
approximately 95% of the outstanding amount of our term loans with a maturity date of May 2018 and April 2019 for an
aggregate principal amount of new terms loans of approximately $580 million with amended terms and a maturity date of June
2021, (v) issuing $500 million of 8.00% senior secured notes with a maturity date of November 2024 and using the proceeds to repay our RBL Facility and (vi) entering into hedge transactions to provide additional 2017 and 2018 commodity price protection.
In February 2017, we issued $1 billion of 8.00% senior secured notes which mature in 2025 and used the proceeds (less fees and expenses) to repay, in full, our $580 million senior secured term loans due 2021, repurchase $250 million of our 9.375% senior notes due 2020 in the open market, and repay $111 million of the amounts outstanding under our RBL Facility.
Our RBL Facility has a borrowing base subject to semi-annual redetermination. In early November 2016, we completed our semi-annual redetermination, maintaining our borrowing base at $1.65 billion. Following that redetermination, in late November 2016, we issued $500 million of 8.00% senior secured notes which triggered a reduction to the RBL Facility's borrowing base to $1.5 billion. In February 2017, as a result of the issuance of our $1 billion senior secured notes due 2025, our RBL borrowing base was further reduced to $1.44 billion. The next redetermination date of our RBL Facility is in April 2017. We do not currently expect a reduction in our current borrowing base as a result of this redetermination based on our internal estimates. Downward revisions of our oil and natural gas reserves volume and value due to declines in commodity prices, the impact of lower estimated capital spending in response to lower prices, performance revisions, or sales of assets, or the incurrence of certain types of additional debt, among other items, could cause a reduction of our borrowing base in the future, and these reductions could be significant.
In May 2016, as part of our semi-annual redetermination, we amended certain restrictive debt covenants for 2017 and through the first quarter of 2018, the most significant of which suspended the requirement that our debt to EBITDAX ratio, as defined in the credit agreement, not exceed 4.5 to 1.0 which was replaced with a requirement that our ratio of first lien debt to EBITDAX not exceed 3.5 to 1.0. As of December 31, 2016 our ratio of first lien debt to EBITDAX was 0.36x. The 4.5 to 1.0 debt to EBITDAX requirement will be reinstated beginning in April 2018. While we are not currently subject to this covenant, as of December 31, 2016, our ratio of debt to EBITDAX is 3.69x which we expect to continue to increase throughout 2017 based on our current outlook and forecasted capital expenditures. As part of the redetermination, we also agreed to limit debt repurchases occurring after the redetermination to $350 million subject to certain future adjustments. Due to refinancing a significant portion of the outstanding balance of our 2018 and 2019 secured term loans in August 2016, the maturity of our RBL Facility will occur in May 2019.
For 2017 and 2018, we have derivative contracts on 12.8 MMBbls and 3.3 MMBbls of our anticipated oil production at a weighted average price of $61.66 and $60.00 per barrel of oil and 32 TBtu and 4 TBtu of our anticipated natural gas production at a weighted average price of $3.28 and $3.11 per MMBtu, respectively. Based on the mid-point of our forecasted 2017 guidance, our oil and natural gas derivative contracts provide price protection on approximately 75% and 76%, respectively, of our anticipated 2017 oil and natural gas production. See "Our Business" for further information on our derivative instruments.
For 2017, we expect to spend approximately $630 million to $730 million in capital in our programs. Based upon our current price and cost assumptions, including the impact of our hedges, we believe that our current capital program will exceed our estimated operating cash flows. We believe the borrowing capacity under our RBL Facility and the expected cash flows from our operations will be sufficient to fund our capital program and meet current obligations and projected working capital requirements through the next twelve months.
Our ability to (i) generate sufficient cash flows from operations or obtain future borrowings under the RBL Facility,
(ii) repay or refinance any of our indebtedness on commercially reasonable terms or at all, or (iii) obtain additional capital if
50
required on acceptable terms or at all to fund our capital programs or any potential future acquisitions, joint ventures or other
similar transactions, will depend on prevailing economic conditions many of which are beyond our control. The ongoing volatility in the energy industry and in commodity prices will likely continue to impact our outlook. Our plans are
intended to address the impacts of the current volatility in commodity prices while (i) maintaining sufficient liquidity to fund
capital in our core drilling programs, (ii) meeting our debt maturities, and (iii) managing and working to strengthen our balance
sheet. In 2016, we continued to implement various cost saving measures to reduce our capital, operating, and general and administrative costs including renegotiating contracts with contractors, suppliers and service providers, reducing the number of staff and contractors and deferring and eliminating various discretionary costs, and will continue to be opportunistic and aggressive in managing our cost structure and in turn, our liquidity to meet our capital and operating needs.
To the extent commodity prices remain low or decline further, or we experience disruptions in the financial markets
impacting our longer-term access to or cost of capital, our ability to fund future growth projects may be further impacted. We
continually monitor the capital markets and our capital structure and may make changes to our capital structure from time to
time, with the goal of maintaining financial flexibility, preserving or improving liquidity and/or achieving cost efficiency. For
example, we could (i) elect to continue to repurchase additional amounts of our outstanding debt in the future for cash through
open market repurchases or privately negotiated transactions with certain of our debtholders subject to the limitation in our
RBL Facility described previously or (ii) issue additional secured debt as permitted under our debt agreements, although there
is no assurance we would do so. It is also possible additional adjustments to our plan and outlook may occur based on market
conditions and the needs of the Company at that time, which could include selling additional assets, liquidating all or a portion
of our hedge portfolio, seeking additional partners to develop our assets, issuing equity, and/or further reducing our planned
capital program.
Capital Expenditures. Our capital expenditures and average drilling rigs for the twelve months ended December 31, 2016 were:
Capital Expenditures(1) (in millions) | Average Drilling Rigs | |||||
Eagle Ford Shale | $ | 175 | 1.0 | |||
Wolfcamp Shale | 233 | 0.7 | ||||
Altamont | 76 | 1.0 | ||||
Haynesville Shale | 3 | 0.0 | ||||
Other | 1 | — | ||||
Total | $ | 488 | 2.7 | |||
(1) Represents accrual-based capital expenditures.
For 2017, we expect that $245 million to $325 million of capital will be allocated to the Wolfcamp Shale, $260 million to $270 million will be allocated to the Eagle Ford Shale and $125 million to $135 million will be allocated to Altamont. These allocations may change based on a number of factors such as price, well results and costs.
Debt. As of December 31, 2016, our total debt was approximately $3.9 billion, comprised of $2.4 billion in senior notes due in 2020, 2022 and 2023, $500 million in senior secured notes due in 2024, $580 million in senior secured term loans due in 2021, $29 million in senior secured term loans with maturity dates in 2018 and 2019 and $370 million outstanding under the RBL Facility which matures in 2019. In February 2017, we issued $1 billion in senior secured notes due in 2025 using the proceeds (less fees and expenses) primarily to repay in full our $580 million in senior secured term loans due in 2021, repurchase $250 million in senior notes due in 2020 in the open market and repay $111 million of the amounts outstanding under the RBL Facility. For additional details on our long-term debt, see Liquidity and Capital Resources above and including restrictive covenants under our debt agreements, see Part II, Item 8, “Financial Statements and Supplementary Data”, Note 8.
51
Overview of Cash Flow Activities. Our cash flows from operations (which include both continuing and discontinued activities) are summarized as follows:
Year ended December 31, | |||||||||||
2016 | 2015 | 2014 | |||||||||
(in millions) | |||||||||||
Cash Inflows | |||||||||||
Operating activities | |||||||||||
Net (loss) income | $ | (27 | ) | $ | (3,748 | ) | $ | 731 | |||
Impairment charges | 2 | 4,299 | 20 | ||||||||
Gain on sale of assets | (78 | ) | — | (2 | ) | ||||||
(Gain) loss on extinguishment of debt | (384 | ) | 41 | 17 | |||||||
Other income adjustments | 498 | 456 | 1,373 | ||||||||
Change in assets and liabilities | 773 | 279 | (953 | ) | |||||||
Total cash flow from operations | $ | 784 | $ | 1,327 | $ | 1,186 | |||||
Investing activities | |||||||||||
Proceeds from the sale of assets | $ | 389 | $ | 1 | $ | 154 | |||||
Financing activities | |||||||||||
Proceeds from issuance of long-term debt | $ | 1,195 | $ | 2,067 | $ | 2,455 | |||||
Proceeds from issuance of stock | — | — | 669 | ||||||||
Cash inflows from financing activities | $ | 1,195 | $ | 2,067 | $ | 3,124 | |||||
Total cash inflows | $ | 2,368 | $ | 3,395 | $ | 4,464 | |||||
Cash Outflows | |||||||||||
Investing activities | |||||||||||
Cash paid for capital expenditures | $ | 533 | $ | 1,433 | $ | 2,033 | |||||
Cash paid for acquisitions, net of cash acquired | — | 111 | 165 | ||||||||
$ | 533 | $ | 1,544 | $ | 2,198 | ||||||
Financing activities | |||||||||||
Repayments and repurchases of long-term debt | $ | 1,804 | $ | 1,826 | $ | 2,293 | |||||
Debt issuance costs | 34 | 20 | 1 | ||||||||
Other | 3 | 1 | 1 | ||||||||
1,841 | 1,847 | 2,295 | |||||||||
Total cash outflows | $ | 2,374 | $ | 3,391 | $ | 4,493 | |||||
Net change in cash and cash equivalents | $ | (6 | ) | $ | 4 | $ | (29 | ) | |||
52
Contractual Obligations
We are party to various contractual obligations. Some of these obligations are reflected in our financial statements, such as liabilities from financing obligations and commodity-based derivative contracts, while other obligations, such as operating leases and capital commitments, are not presently reflected on our consolidated balance sheet. The following table and discussion summarizes our contractual cash obligations as of December 31, 2016, for each of the periods presented:
2017 | 2018- 2019 | 2020 - 2021 | Thereafter | Total | |||||||||||||||
(in millions) | |||||||||||||||||||
Financing obligations: | |||||||||||||||||||
Principal | $ | — | $ | 399 | $ | 2,158 | $ | 1,301 | $ | 3,858 | |||||||||
Interest | 315 | 620 | 323 | 181 | 1,439 | ||||||||||||||
Liabilities from derivatives | 4 | 1 | — | — | 5 | ||||||||||||||
Operating leases | 7 | 10 | 10 | 22 | 49 | ||||||||||||||
Other contractual commitments and purchase obligations: | |||||||||||||||||||
Volume and transportation commitments | 66 | 126 | 109 | 47 | 348 | ||||||||||||||
Other obligations | 46 | 1 | — | — | 47 | ||||||||||||||
Total contractual obligations | $ | 438 | $ | 1,157 | $ | 2,600 | $ | 1,551 | $ | 5,746 | |||||||||
Financing Obligations (Principal and Interest). Debt obligations included in the table above represent stated maturities. Interest payments are shown through the stated maturity date of the related debt based on (i) the contractual interest rate for fixed rate debt and (ii) current market interest rates and the contractual credit spread for variable rate debt. See Note 8 for more information on the maturities of our long-term debt.
Liabilities from Derivatives. These amounts include the fair value of our commodity-based and interest rate derivative liabilities.
Operating Leases. Amounts include leases related to our office space and various equipment.
Other Contractual Commitments and Purchase Obligations. Other contractual commitments and purchase obligations are legally enforceable agreements to purchase goods or services that have fixed or minimum quantities and fixed or minimum variable price provisions. Amounts in the schedule above approximate the timing of the underlying obligations. Included are the following:
• | Volume and Transportation Commitments. Included in these amounts are commitments for demand charges for firm access to natural gas transportation, volume deficiency contracts and firm oil capacity contracts. |
• | Other Obligations. Included in these amounts are commitments for drilling, completions and seismic activities for our operations and various other maintenance, engineering, procurement and construction contracts. Our future commitments under these contracts may change reflecting changes in commodity prices and any related effect on the supply/demand for these services. We have excluded asset retirement obligations and reserves for litigation and environmental remediation, as these liabilities are not contractually fixed as to timing and amount. |
53
Commitments and Contingencies
For a further discussion of our commitments and contingencies, see Part II, Item 8, “Financial Statements and Supplementary Data”, Note 9.
Off-Balance Sheet Arrangements
We have no investments in unconsolidated entities or persons that could materially affect our liquidity or the availability of capital resources. We do not have any material off-balance sheet arrangements that have, or are reasonably likely to have, a material effect on our financial condition or results of operations.
Critical Accounting Estimates
Our significant accounting policies are described in Note 1 of our consolidated financial statements included elsewhere in this Annual Report on Form 10-K. The preparation of financial statements in conformity with generally accepted accounting principles requires management to make estimates and assumptions that affect the reported amount of assets, liabilities, revenue and expense and the disclosures of contingent assets and liabilities. We consider our critical accounting estimates to be those estimates that require complex or subjective judgment in the application of the accounting policy and that could significantly impact our financial results based on changes in those judgments. Changes in facts and circumstances may result in revised estimates and actual results may differ materially from those estimates. Our management has identified the following critical accounting estimates:
Accounting for Oil and Natural Gas Producing Activities. We apply the successful efforts method of accounting for our oil and natural gas exploration and development activities. Under this method, non-drilling exploratory costs and costs of carrying and retaining undeveloped properties are charged to expense as incurred while acquisition costs, development costs and the costs of drilling wells are capitalized. If a well is exploratory in nature, such costs are capitalized, pending the determination of proved oil and gas reserves. As a result, at any point in time, we may have capitalized costs on our consolidated balance sheet associated with exploratory wells that may be charged to exploration expense in a future period. Costs of drilling exploratory wells that do not result in proved reserves are expensed. Under the successful efforts method, we also capitalize salaries and benefits that we determine are directly attributable to our oil and natural gas activities. Depreciation, depletion, amortization and the impairment of oil and natural gas properties is calculated on a depletable unit basis based on estimates of proved quantities of proved oil and natural gas reserves. Revisions to these estimates can alter our depletion rates in the future and affect our future depletion expense or assessment of impairment.
We evaluate capitalized costs related to proved properties at least annually or upon a triggering event (such as a significant continued forward commodity price decline) to determine if impairment of such properties has occurred. Our evaluation of whether costs are recoverable is made based on common geological structure or stratigraphic conditions (for example, we evaluate proved property for impairment separately for each of our operating areas), and the evaluation considers estimated future cash flows for all proved developed (producing and non-producing), proved undeveloped reserves and risk-weighted non-proved reserves in comparison to the carrying amount of the proved properties. Important assumptions in the determination of these cash flows are estimates of future oil and gas production, estimated forward commodity prices as of the date of the estimate, adjusted for geographical location and contractual and quality differentials and estimates of future operating and development costs. If the carrying amount of a property exceeds the estimated undiscounted future cash flows of its reserves, the carrying amount is reduced to estimated fair value through a charge to income. Fair value is calculated by discounting those estimated future cash flows using a risk-adjusted discount rate. The discount rate is based on rates utilized by market participants that are commensurate with the risks inherent in the development and production of the underlying crude oil and natural gas. Each of these estimates involves a high degree of judgment.
As of December 31, 2016, our capitalized costs related to proved properties were approximately $1,217 million for Eagle Ford, $1,812 million for Wolfcamp and $1,280 million for Altamont.
Capitalized costs associated with unproved properties (e.g. leasehold acquisition costs associated with non-producing areas) are also assessed for impairment based on estimated drilling plans and capital expenditures which may also change relative to forward commodity prices and/or potential lease expirations. Generally, economic recovery of unproved reserves in non-producing areas are not yet supported by actual production or conclusive formation tests, but must be confirmed by continued exploration and development activities. Our allocation of capital to the development of unproved properties may be influenced by changes in commodity prices (e.g. the current low oil price environment), the availability of oilfield services and the relative returns of our unproved property development in comparison to the use of capital for other strategic objectives.
For example, in Wolfcamp we have drilling commitments that obligate us to drill a specific number of wells in order to hold all of our acreage. In May 2016, we amended our Wolfcamp development agreement with the University Lands to
54
provide flexibility to extend the time frame to hold our acreage by nearly four years to the end of 2021, with an increase in annual well completion requirements from six wells per year to 34, 55 and 55 wells per year in 2016, 2017 and 2018, respectively. Currently, we have the intent and believe we have the ability to fulfill our annual Wolfcamp drilling commitment and/or develop our unproved areas prior to having to relinquish any acreage. Among other factors, should future oil prices not justify sufficient capital allocation to the continued development of these unproved properties, we could incur impairment charges of our unproved property in the future. Our unproved property costs were approximately $154 million at December 31, 2016, of which approximately $94 million was associated with Wolfcamp and the remainder with Altamont.
Estimates of proved reserves reflect quantities of oil, natural gas and NGLs which geological and engineering data demonstrate, with reasonable certainty, will be recoverable in future years from known reservoirs under existing economic conditions. These estimates of proved oil and natural gas reserves primarily impact our property, plant and equipment amounts on our balance sheets and the depreciation, depletion and amortization amounts, including any impairment charges, on our consolidated income statements, among other items. The process of estimating oil and natural gas reserves is complex and requires significant judgment to evaluate all available geological, geophysical engineering and economic data. Our proved reserves are estimated at a property level and compiled for reporting purposes by a centralized group of experienced reservoir engineers who work closely with the operating groups. These engineers interact with engineering and geoscience personnel in each of our areas and accounting and marketing personnel to obtain the necessary data for projecting future production, costs, net revenues and economic recoverable reserves. Reserves are reviewed internally with senior management quarterly and presented to the board of directors, in summary form on an annual basis. Additionally, on an annual basis each property is reviewed in detail by our centralized and operating divisional engineers to evaluate forecasts of operating expenses, netback prices, production trends and development timing to ensure they are reasonable. Our proved reserves are reviewed by internal committees and the processes and controls used for estimating our proved reserves are reviewed by our internal auditors. In addition, a third-party reservoir engineering firm, which is appointed by and reports to the Audit Committee of the board of directors, conducts an audit of the estimates of a substantial portion of our proved reserves.
As of December 31, 2016, 53% of our total proved reserves were undeveloped and 3% were developed, but non-producing. The data for a given field may change substantially over time as a result of numerous factors, including additional development activity, evolving production history and a continual reassessment of the viability of production under changing economic conditions. As a result, material revisions to existing reserve estimates occur from time to time. In addition, the subjective decisions and variances in available data for various fields increase the likelihood of significant changes in these estimates.
Derivatives. We record derivative instruments at their fair values. We estimate the fair value of our derivative instruments using exchange prices, third-party pricing quotes, interest rates, data and valuation techniques that incorporate specific contractual terms, derivative modeling techniques and present value concepts. One of the primary assumptions used to estimate the fair value of commodity-based derivative instruments is price. Our pricing assumptions are based upon price curves derived from actual prices observed in the market, pricing information supplied by a third-party valuation specialist and independent pricing sources and models that rely on this forward pricing information. The extent to which we rely on pricing information received from third parties in developing these assumptions is based, in part, on whether the information considers the availability of observable data in the marketplace. For example, in relatively illiquid markets we may make adjustments to the pricing information we receive from third parties based on our evaluation of whether third party market participants would use pricing assumptions consistent with these sources.
The table below presents the hypothetical sensitivity of our commodity-based derivatives to changes in fair values arising from immediate selected potential changes in oil and natural gas prices at December 31, 2016:
Change in Price | |||||||||||||||||||
10 Percent Increase | 10 Percent Decrease | ||||||||||||||||||
Fair Value | Fair Value | Change | Fair Value | Change | |||||||||||||||
(in millions) | |||||||||||||||||||
Commodity-based derivatives—net assets (liabilities) | $ | 57 | $ | (24 | ) | $ | (81 | ) | $ | 136 | $ | 79 | |||||||
Other significant assumptions that we use in determining the fair value of our derivative instruments are those related to credit and non-performance risk. We adjust the fair value of our derivative assets based on our counterparty’s creditworthiness and the risk of non-performance. These adjustments are based on applicable credit ratings, bond yields, changes in actively traded credit default swap prices (if available) and other information related to non-performance and credit standing.
55
Deferred Taxes and Uncertain Income Tax Positions. We record deferred income tax assets and liabilities reflecting the tax consequences of differences between the financial statement carrying value of assets and liabilities and the tax basis of those assets and liabilities. Our deferred tax assets and liabilities reflect our conclusions about which positions are more likely than not to be sustained if they are audited by taxing authorities. Uncertain tax positions, including deductions or other positions taken on our tax returns, involve the exercise of significant judgment which could change or be challenged by taxing authorities and could impact our financial condition or results of operations.
Valuation Allowances. We assess the available positive and negative evidence to estimate whether sufficient future taxable income will be generated to permit the use of existing deferred tax assets. When it is more likely than not that we will not be able to realize all or a portion of such asset, we record a valuation allowance. Based upon the evaluation of the available evidence, we maintained a valuation allowance against our deferred tax assets of $985 million as of December 31, 2016. We evaluate our valuation allowances each reporting period and the level of such allowance will change as our deferred tax balances change. Key estimates and assumptions include expectations of future taxable income, the ability and our intent to undertake transactions that will allow us to realize the asset, all of which involve judgment. Changes in these estimates or assumptions can have a significant effect on our operating results.
ITEM 7A. Qualitative and Quantitative Disclosures About Market Risk
We are exposed to market risks in our normal business activities. Market risk is the potential loss that may result from market changes associated with an existing or forecasted financial or commodity transaction. The types of market risks we are exposed to and examples of each are:
Commodity Price Risk
• | changes in oil, natural gas and NGLs prices impact the amounts at which we sell our production and affect the fair value of our oil and natural gas derivative contracts; and |
• | changes in locational price differences also affect amounts at which we sell our oil, natural gas and NGLs production, and the fair values of any related derivative products. |
Interest Rate Risk
• | changes in interest rates affect the interest expense we incur on our variable-rate debt and the fair value of fixed-rate debt; |
• | changes in interest rates result in increases or decreases in the unrealized value of our derivative positions; and |
• | changes in interest rates used to discount liabilities result in higher or lower recorded amount of liabilities and accretion expense over time. |
Risk Management Activities
Where practical, we manage commodity price and interest rate risks by entering into contracts involving physical or financial settlement that attempt to limit exposure related to future market movements on our cash flows. The timing and extent of our risk management activities are based on a number of factors, including our market outlook, risk tolerance and liquidity. Our risk management activities typically involve the use of the following types of contracts:
• | forward contracts, which commit us to purchase or sell energy commodities in the future; |
• | option contracts, which convey the right to buy or sell a commodity, financial instrument or index at a predetermined price; |
• | swap contracts, which require payments to or from counterparties based upon the differential between two prices or rates for a predetermined contractual (notional) quantity; and |
• | structured contracts, which may involve a variety of the above characteristics. |
Many of the contracts we use in our risk management activities qualify as derivative financial instruments. A discussion of our accounting policies for derivative instruments is included in Part II Item 8, Financial Statements and Supplementary data, Note 1 and 6.
56
For information regarding changes in commodity prices and interest rates during 2015, please see “Management’s Discussion and Analysis of Financial Condition and Results of Operations”.
Commodity Price Risk
Oil, Natural Gas and NGLs Derivatives. We attempt to mitigate commodity price risk and stabilize cash flows associated with our forecasted sales of oil and natural gas production through the use of derivative oil and natural gas swaps, basis swaps and option contracts. These contracts impact our earnings as the fair value of these derivatives changes. Our derivatives do not mitigate all of the commodity price risks of our forecasted sales of oil and natural gas production and, as a result, we are subject to commodity price risks on our remaining forecasted production.
Sensitivity Analysis. The table below presents the change in fair value of our commodity-based derivatives due to hypothetical changes in oil and natural gas prices, discount rates and credit rates at December 31, 2016:
Oil, Natural Gas and NGLs Derivatives | |||||||||||||||||||
10 Percent Increase | 10 Percent Decrease | ||||||||||||||||||
Fair Value | Fair Value | Change | Fair Value | Change | |||||||||||||||
(in millions) | |||||||||||||||||||
Price impact(1) | $ | 57 | $ | (24 | ) | $ | (81 | ) | $ | 136 | $ | 79 | |||||||
Oil, Natural Gas and NGLs Derivatives | |||||||||||||||||||
1 Percent Increase | 1 Percent Decrease | ||||||||||||||||||
Fair Value | Fair Value | Change | Fair Value | Change | |||||||||||||||
(in millions) | |||||||||||||||||||
Discount Rate(2) | $ | 57 | $ | 57 | $ | — | $ | 57 | $ | — | |||||||||
Credit rate(3) | $ | 57 | $ | 56 | $ | (1 | ) | $ | 57 | $ | — | ||||||||
(1) Presents the hypothetical sensitivity of our commodity-based derivatives to changes in fair values arising from changes in oil, natural gas and NGLs prices.
(2) Presents the hypothetical sensitivity of our commodity-based derivatives to changes in the discount rates we used to determine the fair value of our derivatives.
(3) Presents the hypothetical sensitivity of our commodity-based derivatives to changes in credit risk. of our counterparties
Interest Rate Risk
Certain of our debt agreements are sensitive to changes in interest rates. The table below shows the maturity of the carrying amounts and related weighted-average effective interest rates on our long-term interest-bearing debt by expected maturity date as well as the total fair value of the debt. The fair value of our long-term debt has been estimated primarily based on quoted market prices for the same or similar issues.
December 31, 2016 | December 31, 2015 | ||||||||||||||||||||||||||||||||||||||
Expected Fiscal Year of Maturity of Carrying Amounts | Fair Value | Carrying Amounts | Fair Value | ||||||||||||||||||||||||||||||||||||
2017 | 2018 | 2019 | 2020 | 2021 | Thereafter | Total | |||||||||||||||||||||||||||||||||
(in millions) | |||||||||||||||||||||||||||||||||||||||
Fixed rate long-term debt | $ | — | $ | — | $ | — | $ | 1,576 | $ | — | $ | 1,301 | $ | 2,877 | $ | 2,630 | $ | 3,150 | $ | 1,797 | |||||||||||||||||||
Average interest rate | 8.4 | % | 8.4 | % | 8.4 | % | 7.9 | % | 7.3 | % | 7.5 | % | |||||||||||||||||||||||||||
Variable rate long-term debt | $ | — | $ | 21 | $ | 378 | $ | — | $ | 580 | $ | — | $ | 979 | $ | 1,007 | $ | 1,719 | $ | 1,582 | |||||||||||||||||||
Average interest rate | 7.5 | % | 7.5 | % | 8.6 | % | 9.8 | % | 9.8 | % | — | % | |||||||||||||||||||||||||||
57
Item 8. FINANCIAL STATEMENTS AND SUPPLEMENTARY DATA
Index
Below is an index to the items contained in Part II, Item 8, Financial Statements and Supplementary Data
Page | |
Supplemental Financial Information | |
Schedules | |
All financial statement schedules have been omitted because they are either not required, not applicable or the information required to be presented is included in the financial statements or related notes thereto.
58
MANAGEMENT’S ANNUAL REPORT ON INTERNAL CONTROL OVER FINANCIAL REPORTING
Our management is responsible for establishing and maintaining adequate internal control over financial reporting, as defined by SEC rules adopted under the Securities Exchange Act of 1934, as amended. Our internal control over financial reporting is designed to provide reasonable assurance regarding the reliability of financial reporting and the preparation of financial statements for external purposes in accordance with generally accepted accounting principles. It consists of policies and procedures that:
• | Pertain to the maintenance of records that, in reasonable detail, accurately and fairly reflect the transactions and dispositions of our assets; |
• | Provide reasonable assurance that transactions are recorded as necessary to permit preparation of the financial statements in accordance with generally accepted accounting principles, and that our receipts and expenditures are being made only in accordance with authorizations of our management and directors; and |
• | Provide reasonable assurance regarding prevention or timely detection of unauthorized acquisition, use or disposition of our assets that could have a material effect on the financial statements. |
Under the supervision and with the participation of management, including the Chief Executive Officer and Chief Financial Officer, we made an assessment of the effectiveness of our internal control over financial reporting as of December 31, 2016. In making this assessment, we used the criteria established in Internal Control — Integrated Framework issued by the Committee of Sponsoring Organizations of the Treadway Commission (2013 framework). Based on our evaluation, we concluded that our internal control over financial reporting was effective as of December 31, 2016. The effectiveness of our internal control over financial reporting as of December 31, 2016 has been audited by Ernst & Young LLP, an independent registered public accounting firm, as stated in their report included herein.
59
Report of Independent Registered Public Accounting Firm
The Board of Directors and Stockholders of
EP Energy Corporation
We have audited EP Energy Corporation’s internal control over financial reporting as of December 31, 2016, based on criteria established in Internal Control-Integrated Framework issued by the Committee of Sponsoring Organizations of the Treadway Commission (2013 framework) (the COSO criteria). EP Energy Corporation’s management is responsible for maintaining effective internal control over financial reporting, and for its assessment of the effectiveness of internal control over financial reporting included in the accompanying Management’s Annual Report on Internal Control over Financial Reporting. Our responsibility is to express an opinion on the Company’s internal control over financial reporting based on our audit.
We conducted our audit in accordance with the standards of the Public Company Accounting Oversight Board (United States). Those standards require that we plan and perform the audit to obtain reasonable assurance about whether effective internal control over financial reporting was maintained in all material respects. Our audit included obtaining an understanding of internal control over financial reporting, assessing the risk that a material weakness exists, testing and evaluating the design and operating effectiveness of internal control based on the assessed risk, and performing such other procedures as we considered necessary in the circumstances. We believe that our audit provides a reasonable basis for our opinion.
A company’s internal control over financial reporting is a process designed to provide reasonable assurance regarding the reliability of financial reporting and the preparation of financial statements for external purposes in accordance with generally accepted accounting principles. A company’s internal control over financial reporting includes those policies and procedures that (1) pertain to the maintenance of records that, in reasonable detail, accurately and fairly reflect the transactions and dispositions of the assets of the company; (2) provide reasonable assurance that transactions are recorded as necessary to permit preparation of financial statements in accordance with generally accepted accounting principles, and that receipts and expenditures of the company are being made only in accordance with authorizations of management and directors of the company; and (3) provide reasonable assurance regarding prevention or timely detection of unauthorized acquisition, use, or disposition of the company’s assets that could have a material effect on the financial statements.
Because of its inherent limitations, internal control over financial reporting may not prevent or detect misstatements. Also, projections of any evaluation of effectiveness to future periods are subject to the risk that controls may become inadequate because of changes in conditions, or that the degree of compliance with the policies or procedures may deteriorate.
In our opinion, EP Energy Corporation maintained, in all material respects, effective internal control over financial reporting as of December 31, 2016, based on the COSO criteria.
We also have audited, in accordance with the standards of the Public Company Accounting Oversight Board (United States), the consolidated balance sheets of EP Energy Corporation as of December 31, 2016 and 2015, and the related consolidated statements of income, cash flows and changes in equity for each of the three years in the period ended December 31, 2016 of EP Energy Corporation and our report dated March 2, 2017 expressed an unqualified opinion thereon.
/s/ Ernst & Young LLP
Houston, Texas
March 2, 2017
60
Report of Independent Registered Public Accounting Firm
The Board of Directors and Stockholders of
EP Energy Corporation
We have audited the accompanying consolidated balance sheets of EP Energy Corporation as of December 31, 2016 and 2015, and the related consolidated statements of income, cash flows and changes in equity for each of the three years in the period ended December 31, 2016. These financial statements are the responsibility of the Company's management. Our responsibility is to express an opinion on these financial statements based on our audits.
We conducted our audits in accordance with the standards of the Public Company Accounting Oversight Board (United States). Those standards require that we plan and perform the audit to obtain reasonable assurance about whether the financial statements are free of material misstatement. An audit includes examining, on a test basis, evidence supporting the amounts and disclosures in the financial statements. An audit also includes assessing the accounting principles used and significant estimates made by management, as well as evaluating the overall financial statement presentation. We believe that our audits provide a reasonable basis for our opinion.
In our opinion, the financial statements referred to above present fairly, in all material respects, the consolidated financial position of EP Energy Corporation at December 31, 2016 and 2015, and the consolidated results of its operations and its cash flows for each of the three years in the period ended December 31, 2016, in conformity with U.S. generally accepted accounting principles.
We also have audited, in accordance with the standards of the Public Company Accounting Oversight Board (United States), EP Energy Corporation’s internal control over financial reporting as of December 31, 2016, based on criteria established in Internal Control-Integrated Framework issued by the Committee of Sponsoring Organizations of the Treadway Commission (2013 framework) and our report dated March 2, 2017 expressed an unqualified opinion thereon.
/s/ Ernst & Young LLP
Houston, Texas
March 2, 2017
61
EP ENERGY CORPORATION
CONSOLIDATED STATEMENTS OF INCOME
(In millions, except per common share amounts)
Year Ended December 31, | |||||||||||
2016 | 2015 | 2014 | |||||||||
Operating revenues | |||||||||||
Oil | $ | 653 | $ | 981 | $ | 1,705 | |||||
Natural gas | 122 | 200 | 284 | ||||||||
NGLs | 65 | 60 | 110 | ||||||||
Financial derivatives | (73 | ) | 667 | 985 | |||||||
Total operating revenues | 767 | 1,908 | 3,084 | ||||||||
Operating expenses | |||||||||||
Oil and natural gas purchases | 10 | 31 | 23 | ||||||||
Transportation costs | 109 | 116 | 100 | ||||||||
Lease operating expense | 159 | 186 | 193 | ||||||||
General and administrative | 146 | 148 | 244 | ||||||||
Depreciation, depletion and amortization | 462 | 983 | 875 | ||||||||
Gain on sale of assets | (78 | ) | — | — | |||||||
Impairment charges | 2 | 4,299 | 2 | ||||||||
Exploration and other expense | 5 | 20 | 25 | ||||||||
Taxes, other than income taxes | 50 | 80 | 129 | ||||||||
Total operating expenses | 865 | 5,863 | 1,591 | ||||||||
Operating (loss) income | (98 | ) | (3,955 | ) | 1,493 | ||||||
Other income | — | — | 1 | ||||||||
Gain (loss) on extinguishment of debt | 384 | (41 | ) | (17 | ) | ||||||
Interest expense | (312 | ) | (330 | ) | (318 | ) | |||||
(Loss) income from continuing operations before income taxes | (26 | ) | (4,326 | ) | 1,159 | ||||||
Income tax expense (benefit) | 1 | (578 | ) | 432 | |||||||
(Loss) income from continuing operations | (27 | ) | (3,748 | ) | 727 | ||||||
Income from discontinued operations, net of tax | — | — | 4 | ||||||||
Net (loss) income | $ | (27 | ) | $ | (3,748 | ) | $ | 731 | |||
Basic and diluted net income (loss) per common share | |||||||||||
(Loss) income from continuing operations | $ | (0.11 | ) | $ | (15.37 | ) | $ | 3.00 | |||
Income from discontinued operations, net of tax | — | — | 0.02 | ||||||||
Net (loss) income | $ | (0.11 | ) | $ | (15.37 | ) | $ | 3.02 | |||
Basic and diluted weighted average common shares outstanding | 245 | 244 | 242 | ||||||||
See accompanying notes.
62
EP ENERGY CORPORATION
CONSOLIDATED BALANCE SHEETS
(In millions)
December 31, 2016 | December 31, 2015 | ||||||
ASSETS | |||||||
Current assets | |||||||
Cash and cash equivalents | $ | 20 | $ | 26 | |||
Accounts receivable | |||||||
Customer, net of allowance of less than $1 in 2016 and $1 in 2015 | 133 | 189 | |||||
Other, net of allowance of $1 in 2016 and 2015 | 16 | 12 | |||||
Materials and supplies | 16 | 24 | |||||
Derivative instruments | 58 | 694 | |||||
Assets held for sale | — | 344 | |||||
Other | 5 | 8 | |||||
Total current assets | 248 | 1,297 | |||||
Property, plant and equipment, at cost | |||||||
Oil and natural gas properties | 7,194 | 6,721 | |||||
Other property, plant and equipment | 85 | 80 | |||||
7,279 | 6,801 | ||||||
Less accumulated depreciation, depletion and amortization | 2,781 | 2,374 | |||||
Total property, plant and equipment, net | 4,498 | 4,427 | |||||
Other assets | |||||||
Derivative instruments | 4 | 85 | |||||
Unamortized debt issue costs - revolving credit facility | 10 | 23 | |||||
Other | 1 | 1 | |||||
15 | 109 | ||||||
Total assets | $ | 4,761 | $ | 5,833 | |||
See accompanying notes.
63
EP ENERGY CORPORATION
CONSOLIDATED BALANCE SHEETS
(In millions)
December 31, 2016 | December 31, 2015 | ||||||
LIABILITIES AND EQUITY | |||||||
Current liabilities | |||||||
Accounts payable | |||||||
Trade | $ | 63 | $ | 69 | |||
Other | 113 | 164 | |||||
Derivative instruments | 4 | — | |||||
Accrued interest | 43 | 47 | |||||
Liabilities related to assets held for sale | — | 24 | |||||
Other accrued liabilities | 98 | 47 | |||||
Total current liabilities | 321 | 351 | |||||
Long-term debt, net of debt issue costs | 3,789 | 4,812 | |||||
Other long-term liabilities | |||||||
Derivative instruments | 1 | 8 | |||||
Asset retirement obligations | 40 | 37 | |||||
Other | 4 | 6 | |||||
Total non-current liabilities | 3,834 | 4,863 | |||||
Commitments and contingencies (Note 9) | |||||||
Stockholders’ equity | |||||||
Class A shares, $0.01 par value; 550 million shares authorized; 251 million shares issued and outstanding at December 31, 2016; 248 million shares issued and outstanding at December 31, 2015 | 2 | 2 | |||||
Class B shares, $0.01 par value; 0.8 million shares authorized, issued and outstanding at December 31, 2016 and December 31, 2015 | — | — | |||||
Preferred stock, $0.01 par value; 50 million shares authorized; no shares issued or outstanding | — | — | |||||
Treasury stock (at cost); 0.5 million shares at December 31, 2016 and 0.1 million shares at December 31, 2015. | (3 | ) | — | ||||
Additional paid-in capital | 3,546 | 3,529 | |||||
Accumulated deficit | (2,939 | ) | (2,912 | ) | |||
Total stockholders’ equity | 606 | 619 | |||||
Total liabilities and equity | $ | 4,761 | $ | 5,833 | |||
See accompanying notes.
64
EP ENERGY CORPORATION
CONSOLIDATED STATEMENTS OF CASH FLOWS
(In millions)
Year Ended December 31, | |||||||||||
2016 | 2015 | 2014 | |||||||||
Cash flows from operating activities | |||||||||||
Net (loss) income | $ | (27 | ) | $ | (3,748 | ) | $ | 731 | |||
Adjustments to reconcile net (loss) income to net cash provided by operating activities | |||||||||||
Depreciation, depletion and amortization | 462 | 983 | 883 | ||||||||
Gain on sale of assets | (78 | ) | — | (2 | ) | ||||||
Deferred income tax (benefit) expense | — | (578 | ) | 435 | |||||||
Impairment charges | 2 | 4,299 | 20 | ||||||||
(Gain) loss on extinguishment of debt | (384 | ) | 41 | 17 | |||||||
Share-based compensation expense | 17 | 19 | 13 | ||||||||
Non-cash portion of exploration expense | 2 | 14 | 19 | ||||||||
Amortization of debt issuance costs | 16 | 18 | 21 | ||||||||
Other | 1 | — | 2 | ||||||||
Asset and liability changes | |||||||||||
Accounts receivable | 71 | 55 | 7 | ||||||||
Accounts payable | (22 | ) | (70 | ) | 13 | ||||||
Derivative instruments | 714 | 277 | (939 | ) | |||||||
Accrued interest | (4 | ) | (6 | ) | — | ||||||
Other asset changes | 8 | 22 | 5 | ||||||||
Other liability changes | 6 | 1 | (39 | ) | |||||||
Net cash provided by operating activities | 784 | 1,327 | 1,186 | ||||||||
Cash flows from investing activities | |||||||||||
Cash paid for capital expenditures | (533 | ) | (1,433 | ) | (2,033 | ) | |||||
Proceeds from the sale of assets, net of cash transferred | 389 | 1 | 154 | ||||||||
Cash paid for acquisitions, net of cash acquired | — | (111 | ) | (165 | ) | ||||||
Net cash used in investing activities | (144 | ) | (1,543 | ) | (2,044 | ) | |||||
Cash flows from financing activities | |||||||||||
Proceeds from issuance of long-term debt | 1,195 | 2,067 | 2,455 | ||||||||
Repayments and repurchases of long-term debt | (1,804 | ) | (1,826 | ) | (2,293 | ) | |||||
Proceeds from issuance of stock | — | — | 669 | ||||||||
Debt issuance costs | (34 | ) | (20 | ) | (1 | ) | |||||
Other | (3 | ) | (1 | ) | (1 | ) | |||||
Net cash (used in) provided by financing activities | (646 | ) | 220 | 829 | |||||||
Change in cash and cash equivalents | (6 | ) | 4 | (29 | ) | ||||||
Cash and cash equivalents | |||||||||||
Beginning of period | 26 | 22 | 51 | ||||||||
End of period | $ | 20 | $ | 26 | $ | 22 | |||||
Supplemental cash flow information | |||||||||||
Interest paid, net of amounts capitalized | $ | 293 | $ | 312 | $ | 289 | |||||
Income tax (refunds) payments | (2 | ) | (22 | ) | 26 | ||||||
See accompanying notes.
65
EP ENERGY CORPORATION
CONSOLIDATED STATEMENTS OF CHANGES IN EQUITY
(In millions)
Class A Stock | Class B Stock | Treasury Stock | Additional Paid-in Capital | Retained Earnings (Accumulated Deficit) | ||||||||||||||||||||||||
Shares | Amount | Shares | Amount | Total | ||||||||||||||||||||||||
Balance at December 31, 2013 | 209 | $ | — | 0.9 | $ | — | — | $ | 2,832 | $ | 105 | $ | 2,937 | |||||||||||||||
Share-based compensation | 1 | — | (0.1 | ) | — | — | 11 | — | 11 | |||||||||||||||||||
Initial public offering of common stock | 35 | 2 | — | — | — | 667 | — | 669 | ||||||||||||||||||||
Net income | — | — | — | — | — | — | 731 | 731 | ||||||||||||||||||||
Balance at December 31, 2014 | 245 | $ | 2 | 0.8 | $ | — | — | $ | 3,510 | $ | 836 | $ | 4,348 | |||||||||||||||
Share-based compensation | 3 | — | — | — | — | 19 | — | 19 | ||||||||||||||||||||
Net loss | — | — | — | — | — | — | (3,748 | ) | (3,748 | ) | ||||||||||||||||||
Balance at December 31, 2015 | 248 | $ | 2 | 0.8 | $ | — | — | $ | 3,529 | $ | (2,912 | ) | $ | 619 | ||||||||||||||
Share-based compensation | 3 | — | — | — | (3 | ) | 17 | — | 14 | |||||||||||||||||||
Net loss | — | — | — | — | — | — | (27 | ) | (27 | ) | ||||||||||||||||||
Balance at December 31, 2016 | 251 | $ | 2 | 0.8 | $ | — | (3 | ) | $ | 3,546 | $ | (2,939 | ) | $ | 606 | |||||||||||||
See accompanying notes.
66
EP ENERGY CORPORATION
NOTES TO THE CONSOLIDATED FINANCIAL STATEMENTS
1. Basis of Presentation and Significant Accounting Policies
Basis of Presentation and Consolidation
Our consolidated financial statements are prepared in accordance with United States generally accepted accounting principles (U.S. GAAP) and include the accounts of all consolidated subsidiaries after the elimination of all significant intercompany accounts and transactions.
We consolidate entities when we have the ability to control the operating and financial decisions of the entity or when we have a significant interest in the entity that gives us the ability to direct the activities that are significant to that entity. The determination of our ability to control, direct or exert significant influence over an entity involves the use of judgment.
We are engaged in the exploration for and the acquisition, development, and production of oil, natural gas and NGLs in the United States. Our oil and natural gas properties are managed as a single operating segment rather than through discrete operating segments or business units. We track basic operational data by area and allocate capital resources on a project-by-project basis across our entire asset base without regard to individual areas. We assess financial performance as a single enterprise and not on a geographical area basis.
New Accounting Pronouncements Issued But Not Yet Adopted
The following accounting standards have been issued but not yet been adopted.
Statement of Cash Flows. In August 2016, the Financial Accounting Standards Board (FASB) issued Accounting
Standards Update (ASU) No. 2016-15, Statement of Cash Flows - Classification of Certain Cash Receipts and Cash Payments,
which addresses eight specific cash flow issues with the objective of reducing the existing diversity in practice in how certain
cash receipts and cash payments are presented and classified in the statement of cash flows. In November 2016, the FASB issued ASU No. 2016-18, Statement of Cash Flows - Restricted Cash, which requires restricted cash and restricted cash equivalents to be included with cash and cash equivalents when reconciling the beginning of period and end of period total amounts shown on the statement of cash flow. Retrospective application of these standards is required for fiscal years beginning after December 15, 2017, including interim periods within those fiscal years, and early adoption is allowed. We do not anticipate that the adoption of these standards will have a material impact on the presentation of our consolidated statement of cash flows.
Stock Compensation. In March 2016, the FASB issued ASU No. 2016-09, Improvements to Employee Share-Based
Payment Accounting, which updates several aspects of the accounting for and disclosure of share-based payment transactions.
Adoption of this standard is required beginning in the first quarter of 2017. We do not anticipate that the adoption of this standard will have a material impact on our financial statements.
Leases. In February 2016, the FASB issued ASU No. 2016-02, Leases, which requires lessees to recognize lease
assets and lease liabilities on the balance sheet and disclose key information about leasing arrangements. Adoption of this
standard is required beginning in the first quarter of 2019 and early adoption is allowed. We continue to evaluate our contracts and other agreements to assess the impact this update will have on our financial statements.
Revenue Recognition. In May 2014, the FASB issued ASU No. 2014-09, Revenue from Contracts with Customers, which clarifies the principles for recognizing revenue and develops a common revenue standard for U.S. GAAP and International Financial Reporting Standards. Adoption of this standard is required beginning in the first quarter of 2018, with the option of early adoption in 2017. Modified or full retrospective application of this standard is required upon adoption. We presently intend to adopt this standard in 2018 and do not anticipate that the adoption of this standard will have a material impact on our financial statements.
Significant Accounting Policies
Use of Estimates
The preparation of our financial statements requires the use of estimates and assumptions that affect the amounts we report as assets, liabilities, revenues and expenses and our disclosures in these financial statements. Actual results can, and often do, differ from those estimates.
67
Revenue Recognition
Our revenues are generated primarily through the physical sale of oil, natural gas and NGLs to third party customers at spot or market prices under both short and long-term contracts. We recognize revenue upon delivery and transfer of control of the product to the customer which occurs at the point in time which delivery and passage of title and risk of loss have occurred. Delivery and transfer of control vary depending on the product and delivery method but typically occurs at a pipeline or gathering line delivery point interconnect when delivered via pipeline or at the wellhead or tank battery to purchasers who transport the oil via truck. Revenue is measured and based upon index prices (WTI, LLS, Henry Hub and Mt. Belvieu) or refiners posted prices at various delivery points across our producing basins. Realized prices received (not considering the effects of hedges) are generally less than the stated index price as a result of contractual deductions, differentials from the index to the delivery point and/or discounts for quality or grade.
Revenue is recorded using the sales method, net of any royalty interests or other profit interests in the produced product. Revenues related to products delivered, but not yet billed, are estimated each month. These estimates are based on contract data, commodity prices and preliminary throughput and allocation measurements. When actual sales volumes exceed our entitled share of sales volumes, an overproduced imbalance occurs. To the extent the overproduced imbalance exceeds our share of the remaining estimated proved natural gas reserves for a given property, we record a liability.
Costs associated with the transportation and delivery of production, generally between the wellhead and its intended sale location are included in transportation costs. We also purchase and sell oil and natural gas on a monthly basis to manage our overall oil and natural gas production and sales. These transactions are undertaken to optimize prices we receive for our oil and natural gas, to physically move oil and gas to its intended sales point, or to manage firm transportation agreements. Revenue related to these transactions are recorded in oil and natural gas sales in operating revenues and associated purchases reflected in oil and natural gas purchases in operating expenses in our consolidated income statements.
For the years ended December 31, 2016, 2015 and 2014, we had two customers that individually accounted for 10 percent or more of our total revenues. The loss of any one customer would not have an adverse effect on our ability to sell our oil, natural gas and NGLs production.
While most of our physical production is priced off of market indices, we actively manage the volatility of market pricing through our risk management program whereby we enter into financial derivatives contracts. All of our derivatives are marked-to-market each period. The change in the fair value of our commodity-based derivatives, as well as any realized amounts, are reflected in operating revenues as financial derivative revenues (see Derivatives below and Note 6).
Cash and Cash Equivalents
We consider short-term investments with an original maturity of less than three months to be cash equivalents. As of December 31, 2016 and 2015, we had no restricted cash.
Allowance for Doubtful Accounts
We establish provisions for losses on accounts receivable and for natural gas imbalances with other parties if we determine that we will not collect all or part of the outstanding balance. We regularly review collectability and establish or adjust our allowance as necessary using the specific identification method.
Oil and Natural Gas Properties
We account for oil and natural gas properties in accordance with the successful efforts method of accounting for oil and natural gas exploration and development activities.
Under the successful efforts method, we capitalize (i) lease acquisition costs, all development costs and exploratory drilling costs until results are determined, (ii) certain internal costs directly identified with the acquisition, successful drilling of exploratory wells and development activities, and (iii) interest costs related to financing oil and natural gas projects actively being developed until the projects are evaluated or substantially complete and ready for their intended use if the projects were evaluated as successful. Non-drilling exploratory costs, including certain geological and geophysical costs such as seismic costs and delay rentals, are expensed as incurred.
We provide for depreciation, depletion, and amortization on the basis of common geological structure or stratigraphic conditions applied to total capitalized costs, plus future abandonment costs, net of salvage value, using the unit of production method. Lease acquisition costs are amortized over total proved reserves, while other exploratory drilling and all developmental costs are amortized over total proved developed reserves.
68
We evaluate capitalized costs related to proved properties upon a triggering event to determine if impairment of such properties is necessary. Our evaluation of recoverability is made on the basis of common geological structure or stratigraphic conditions and considers estimated future cash flows primarily from all proved developed (producing and non-producing) and proved undeveloped reserves in comparison to the carrying amount of the proved properties. Estimated future cash flows are determined based on estimates of future oil and gas production, estimated or published commodity prices as of the date of the estimate, adjusted for geographical location, contractual and quality price differentials, and estimates of future operating and development costs. If the carrying amount of a property exceeds these estimated undiscounted future cash flows, the carrying amount is reduced to its estimated fair value through a charge to income. Fair value is calculated by discounting the estimated future cash flows using a risk-adjusted discount rate. This discount rate is based on rates utilized by market participants that are commensurate with the risks inherent in the development and production of the underlying crude oil and natural gas. Leasehold acquisitions costs associated with non-producing areas are also assessed for impairment based on our estimated drilling plans and anticipated capital expenditures related to potential lease expirations.
Property, Plant and Equipment (Other than Oil and Natural Gas Properties)
Our property, plant and equipment, other than our assets accounted for under the successful efforts method, are recorded at their original cost of construction or, upon acquisition, at the fair value of the assets acquired. We capitalize the major units of property replacements or improvements and expense minor items. We depreciate our non-oil and natural gas property, plant and equipment using the straight-line method over the useful lives of the assets which range from four to 15 years.
Accounting for Asset Retirement Obligations
We record a liability for legal obligations associated with the replacement, removal or retirement of our long-lived assets in the period the obligation is incurred and is estimable. Our asset retirement liabilities are initially recorded at their estimated fair value with a corresponding increase to property, plant and equipment. This increase in property, plant and equipment is then depreciated over the useful life of the asset to which that liability relates. An ongoing expense is recognized for changes in the value of the liability as a result of the passage of time, which we record as depreciation, depletion and amortization expense in our consolidated income statement.
Accounting for Long-Term Incentive Compensation
We measure the cost of long-term incentive compensation based on the fair value of the award on the day it is granted. Awards issued under our incentive compensation programs are recognized as either equity awards or liability awards based on their characteristics. Expense is recognized in our consolidated financial statements as general and administrative expense over the period of service required by the award, net of estimated forfeitures. See Note 10 for further discussion of our long-term incentive compensation.
Environmental Costs, Legal and Other Contingencies
Environmental Costs. We record environmental liabilities at their undiscounted amounts on our consolidated balance sheet in other current and long-term liabilities when we assess that remediation efforts are probable and the costs can be reasonably estimated. Estimates of our environmental liabilities are based on current available facts, existing technology and presently enacted laws and regulations, taking into consideration the likely effects of other societal and economic factors, and include estimates of associated legal costs. These amounts also consider prior experience in remediating contaminated sites, other companies’ clean-up experience and data released by the Environmental Protection Agency (EPA) or other organizations. Our estimates are subject to revision in future periods based on actual costs or new circumstances. We capitalize costs that benefit future periods and expense costs that do not in general and administrative expense.
We evaluate any amounts paid directly or reimbursed by government sponsored programs and potential recoveries or reimbursements of remediation costs from third parties, including insurance coverage, separately from our liability. Recovery is evaluated based on the creditworthiness or solvency of the third party, among other factors. When recovery is assured, we record and report an asset separately from the associated liability on our consolidated balance sheet.
Legal and Other Contingencies. We recognize liabilities for legal and other contingencies when we have an exposure that indicates it is both probable that a liability has been incurred and the amount of the loss can be reasonably estimated. Where the most likely outcome of a contingency can be reasonably estimated, we accrue a liability for that amount. Where the most likely outcome cannot be estimated, a range of potential losses is established and if no one amount in that range is more likely than any other to occur, the low end of the range is accrued.
69
Derivatives
We enter into derivative contracts on our oil and natural gas products primarily to stabilize cash flows and reduce the risk and financial impact of downward commodity price movements on commodity sales. We also use derivatives to reduce the risk of increases in variable interest rates. Derivative instruments are reflected on our consolidated balance sheet at their fair value as assets and liabilities. We classify our derivatives as either current or non-current based on their anticipated settlement date. We net derivative assets and liabilities with counterparties where we have a legal right of offset.
All of our derivatives are marked-to-market each period and changes in the fair value of our commodity based derivatives, as well as any realized amounts, are reflected as operating revenues. Changes in the fair value of our interest rate derivatives are reflected as interest expense. We classify cash flows related to derivative contracts based on the nature and purpose of the derivative. As the derivative cash flows are considered an integral part of our oil and natural gas operations, they are classified as cash flows from operating activities. In our consolidated balance sheet, receivables and payables resulting from the settlement of our derivative instruments are reported as trade receivables and payables. See Note 6 for a further discussion of our derivatives.
Income Taxes
We record current income taxes based on our estimates of current taxable income and provide for deferred income taxes to reflect estimated future income tax payments and receipts. Deferred taxes represent the tax impacts of differences between the financial statement and tax bases of assets and liabilities and carryovers at each year end. We classify all deferred tax assets and liabilities, along with any related valuation allowance, as non-current on the consolidated balance sheet. We account for tax credits under the flow-through method, which reduces the provision for income taxes in the year the tax credits first become available.
The realization of our deferred tax assets depends on recognition of sufficient future taxable income during periods in which those temporary differences are deductible. We reduce deferred tax assets by a valuation allowance when, based on our estimates, it is more likely than not that a portion of those assets will not be realized in a future period. The estimates utilized in recognition of deferred tax assets are subject to revision, either up or down, in future periods based on new facts or circumstances. In evaluating our valuation allowances, we consider cumulative book losses, the reversal of existing temporary differences, the existence of taxable income in carryback years, tax planning strategies and future taxable income for each of our taxable jurisdictions, the latter two of which involve the exercise of significant judgment. Changes to our valuation allowances could materially impact our results of operations.
2. Acquisitions and Divestitures
Divestitures. In May 2016, we completed the sale of our assets located in the Haynesville and Bossier shales for approximately $420 million (net cash proceeds of $388 million after customary adjustments) with the buyer also assuming a transportation commitment totaling $106 million. We recorded a gain on the sale of approximately $79 million. We classified the assets and liabilities associated with the assets sold as held for sale on our consolidated balance sheet as of December 31, 2015.
Discontinued Operations. In 2014, we reflected as discontinued operations domestic natural gas assets in the Arklatex and South Louisiana Wilcox areas sold for approximately $111 million in May 2014 and our Brazilian operations sold in August 2014. We classified the results of operations of these assets prior to their sale as income from discontinued operations.
70
Summarized operating results and financial position data of our assets held for sale and/or for our discontinued operations were as follows (in millions):
Assets Held For Sale | Discontinued Operations | ||||||||||||||
Year Ended December 31, | Year Ended December 31, | ||||||||||||||
2016 | 2015 | 2014 | 2014 | ||||||||||||
Operating revenues | $ | 26 | $ | 78 | $ | 141 | $ | 82 | |||||||
Operating expenses | |||||||||||||||
Transportation costs | 7 | 21 | 20 | 5 | |||||||||||
Lease operating expense | 1 | 6 | 5 | 31 | |||||||||||
Depreciation, depletion and amortization | 16 | 32 | 37 | 8 | |||||||||||
Impairment(1) | — | — | — | 18 | |||||||||||
Other expense | 5 | 12 | 12 | 17 | |||||||||||
Total operating expenses | 29 | 71 | 74 | 79 | |||||||||||
Gain on sale of assets | 79 | — | — | 2 | |||||||||||
Other income | — | — | — | 4 | |||||||||||
Income before income taxes | $ | 76 | $ | 7 | $ | 67 | $ | 9 | |||||||
Income tax expense | 5 | ||||||||||||||
Income from discontinued operations, net of tax | $ | 4 | |||||||||||||
(1) Related to the sale of our Brazilian operations.
Assets Held for Sale | |||
December 31, 2015 | |||
Assets | |||
Current assets | $ | 16 | |
Property, plant and equipment, net | 328 | ||
Total assets held for sale | $ | 344 | |
Liabilities | |||
Accounts payable | $ | 17 | |
Other current liabilities | 4 | ||
Asset retirement obligations | 3 | ||
Total liabilities related to assets held for sale | $ | 24 | |
Other Divestitures. In 2014, we also sold certain non-core acreage in Atascosa County in the Eagle Ford Shale for approximately $28 million. No gain or loss was recorded on the sale of these properties.
Acquisitions. In 2015, we acquired approximately 12,000 net acres adjacent to our existing Eagle Ford Shale acreage for approximately $111 million. In 2014, we acquired producing properties and undeveloped acreage in the Southern Midland Basin, of which 37,000 net acres are adjacent to our existing Wolfcamp Shale position, for approximately $152 million. No goodwill or bargain purchase was recorded on these acquisitions.
71
3. Impairment Charges
We evaluate capitalized costs related to proved properties upon a triggering event (such as a significant continued decline in forward commodity prices) to determine if an impairment of such properties has occurred. Capitalized costs associated with unproved properties (e.g. leasehold acquisition costs associated with non-producing areas) are also assessed upon a triggering event for impairment based on estimated drilling plans and capital expenditures which may also change relative to forward commodity prices and/or potential lease expirations. See Notes 1 and 7 for a further discussion of our oil and natural gas properties and related significant accounting policies.
Proved Properties. During the year ended December 31, 2015, we recorded a non-cash impairment charge of approximately $4.0 billion of our proved properties in the Eagle Ford Shale reflecting a reduction in the net book value of the proved property in this area to its estimated fair value due primarily to a significant decline in estimated forward commodity prices.
Unproved Properties. Generally, economic recovery of unproved reserves in non-producing or unproved areas is not yet supported by actual production or conclusive formation tests, but may be confirmed by continuing exploration and development activities. Our ability to retain our leases and thus recover our non-producing leasehold costs is dependent upon a number of factors including our levels of drilling activity, which may include drilling the acreage on our own behalf or jointly with partners, or our ability to modify or extend our leases. Should commodity prices not justify sufficient capital allocation to the continued development of properties where we have non-producing leasehold costs, we could incur impairment charges of our unproved property costs. During the year ended December 31, 2015, we recorded a non-cash impairment charge of $288 million of our unproved properties in the Wolfcamp Shale based on reduced activity and not having a definitive agreement at that time to extend our Wolfcamp lease.
In May 2016, we amended our Wolfcamp development agreement with the University Lands to provide flexibility to extend the time frame to hold our acreage by nearly four years to the end of 2021, with an increase in annual well completion requirements from six wells per year to 34, 55 and 55 wells per year in 2016, 2017 and 2018, respectively. We fulfilled this requirement in 2016 and have the intent and believe we have the ability to fulfill our 2017 and 2018 commitments prior to having to relinquish any associated acreage.
Commodity price declines may cause changes to our capital spending levels, production rates, levels of proved reserves and development plans, which may result in an additional impairments of the carrying value of our proved and/or unproved properties in the future.
4. Income Taxes
Pretax Income (Loss) and Income Tax Expense (Benefit). The tables below show the pretax income (loss) from continuing operations and the components of income tax expense (benefit) from continuing operations for the following periods:
Year Ended December 31, | |||||||||||
2016 | 2015 | 2014 | |||||||||
(in millions) | |||||||||||
Pretax (Loss) Income | |||||||||||
U.S. | $ | (26 | ) | $ | (4,326 | ) | $ | 1,159 | |||
Components of Income Tax Expense | |||||||||||
Current | |||||||||||
State | $ | 1 | $ | — | $ | — | |||||
1 | — | — | |||||||||
Deferred | |||||||||||
Federal | $ | — | $ | (543 | ) | $ | 415 | ||||
State | — | (35 | ) | 17 | |||||||
Total income tax expense (benefit) | $ | 1 | $ | (578 | ) | $ | 432 | ||||
72
Effective Tax Rate Reconciliation. Income taxes included in net income differs from the amount computed by applying the statutory federal income tax rate of 35% for the following reasons for the following periods:
Year Ended December 31, | |||||||||||
2016 | 2015 | 2014 | |||||||||
(in millions) | |||||||||||
Income taxes at the statutory federal rate of 35% | $ | (9 | ) | $ | (1,514 | ) | $ | 406 | |||
Increase (decrease) | |||||||||||
State income taxes, net of federal income tax effect | (1 | ) | (41 | ) | 12 | ||||||
Non-deductible reorganization costs | — | — | 10 | ||||||||
Valuation allowance | 9 | 975 | — | ||||||||
Other | 2 | 2 | 4 | ||||||||
Income tax expense (benefit) | $ | 1 | $ | (578 | ) | $ | 432 | ||||
The effective tax rate for the year ended December 31, 2016 was (1.9)%, lower than the statutory rate of 35% as a result of the effects of state income taxes (net of federal income tax effects), non-deductible compensation, and adjustments to the valuation allowance on our deferred tax assets which offset a deferred income tax benefit by $9 million. For a further discussion of our valuation allowance, see below.
The effective tax rate for the year ended December 31, 2015 was 13.4%, lower than the statutory rate of 35% as a result of recording a valuation allowance of $975 million against our deferred tax assets. The effective tax rate for the year ended December 31, 2014 differed from the statutory rate primarily due to the result of state income taxes, net of federal income tax effect and non-deductible reorganization costs recorded in conjunction with changing our organizational structure in 2014.
Deferred Tax Assets and Liabilities. The following are the components of net deferred tax assets and liabilities:
December 31, 2016 | December 31, 2015 | ||||||
(in millions) | |||||||
Deferred tax assets | |||||||
Property, plant and equipment | $ | 249 | $ | 471 | |||
Net operating loss carryovers | 692 | 720 | |||||
U.S. tax credit carryovers | 10 | 10 | |||||
Employee benefits | 6 | 4 | |||||
Legal and other reserves | 6 | 7 | |||||
Asset retirement obligations | 15 | 19 | |||||
Transaction costs | 19 | 22 | |||||
Total deferred tax assets | 997 | 1,253 | |||||
Valuation allowance | (985 | ) | (976 | ) | |||
Net deferred tax assets | 12 | 277 | |||||
Deferred tax liabilities | |||||||
Financial derivatives | 12 | 277 | |||||
Total deferred tax liabilities | 12 | 277 | |||||
Net deferred tax liabilities | $ | — | $ | — | |||
Unrecognized Tax Benefits. As of December 31, 2016 there were no unrecognized tax benefits as income taxes in our financial statements. We did not recognize any interest and penalties related to unrecognized tax benefits (classified as income taxes in our consolidated income statements) in 2016, 2015 or 2014, nor do we have any accrued interest and penalties associated with income taxes in our consolidated balance sheets as of December 31, 2016 and December 31, 2015. The Company's and certain subsidiaries income tax years (2013-2016) remain open and subject to examination by both federal and state tax authorities. One of our subsidiary’s 2013 U.S. tax return is under examination by the IRS.
73
Net Operating Loss and Tax Credit Carryovers. The table below presents the details of our federal and state net operating loss carryover periods as of December 31, 2016 (in millions):
Expiration Period | |||
2031 - 2036 | |||
U.S. federal net operating loss carryover | $ | 1,918 | |
2026 - 2036 | |||
State net operating loss carryover | $ | 307 | |
During 2016, we generated a federal net operating loss of $318 million, which does not include a gain we realized on debt repurchases of $405 million. As a result of excluding these amounts from taxable income, we were required to reduce our federal net operating loss carryovers at the end of December 31, 2016 by the amount of those gains. Utilization of $136 million of our federal net operating loss carryovers is subject to the limitations provided under Sections 382 of the Internal Revenue Code. While these limitations restrict the amount of carryovers we could potentially utilize in the next few years, it would not cause any carryovers to expire unused.
In addition to our net operating loss carryovers, we also have (i) U.S. federal alternative minimum tax credit carryovers of $10 million and (ii) capital loss carryovers of $23 million. Our alternative minimum tax credits carry over indefinitely while our capital loss carryovers expire in 2018 if we are unable to generate sufficient capital gains on the sale of assets by that time.
Valuation Allowances. As of December 31, 2016 and 2015, we have a valuation allowance on our deferred tax assets of $985 million and $976 million, respectively. These amounts are recorded based on our evaluation of whether it was more likely than not that our deferred tax assets would be realized. Our evaluations considered cumulative book losses, the reversal of existing temporary differences, the existence of taxable income in prior carryback years, tax planning strategies and future taxable income for each of our taxable jurisdictions.
5. Earnings Per Share
We exclude potentially dilutive securities from the determination of diluted earnings per share (as well as their related income statement impacts) when their impact on income from continuing operations per common share is antidilutive. Potentially dilutive securities consist of our stock options, restricted stock and performance unit awards. For both of the years ended December 31, 2016 and 2015, we incurred net losses and accordingly excluded all potentially dilutive securities from the determination of diluted earnings per share as their impact on loss per common share was antidilutive. Potentially dilutive securities did not have a material effect upon our diluted earnings per share for the year ended December 31, 2014.
6. Fair Value Measurements
We use various methods to determine the fair values of our financial instruments. The fair value of a financial instrument depends on a number of factors, including the availability of observable market data over the contractual term of the instrument. We separate the fair value of our financial instruments into three levels (Levels 1, 2 and 3) based on our assessment of the availability of observable market data and the significance of non-observable data used to determine fair value. Each of the levels are described below:
• | Level 1 instruments’ fair values are based on quoted prices in actively traded markets. |
• | Level 2 instruments’ fair values are based on pricing data representative of quoted prices for similar assets and liabilities in active markets (or identical assets and liabilities in less active markets). |
• | Level 3 instruments’ fair values are partially calculated using pricing data that is similar to Level 2 instruments, but also reflect adjustments for being in less liquid markets or having longer contractual terms. |
74
The following table presents the carrying amounts and estimated fair values of our financial instruments:
December 31, 2016 | December 31, 2015 | ||||||||||||||
Carrying Amount | Fair Value | Carrying Amount | Fair Value | ||||||||||||
(in millions) | |||||||||||||||
Long-term debt | $ | 3,856 | $ | 3,637 | $ | 4,869 | $ | 3,379 | |||||||
Derivative instruments | $ | 57 | $ | 57 | $ | 771 | $ | 771 | |||||||
For the years ended December 31, 2016 and 2015, the carrying amount of cash and cash equivalents, accounts receivable and accounts payable represent fair value because of the short-term nature of these instruments. Our long-term debt obligations (see Note 8) have various terms, and we estimated the fair value of debt (representing a Level 2 fair value measurement) primarily based on quoted market prices for the same or similar issuances, considering our credit risk.
Oil, Natural Gas and NGLs Derivative Instruments. We attempt to mitigate a portion of our commodity price risk and stabilize cash flows associated with forecasted sales of oil, natural gas and NGLs through the use of financial derivatives. As of December 31, 2016, we had derivatives contracts in the form of fixed price swaps and three-way collars on 16 MMBbls of oil (13 MMBbls in 2017 and 3 MMBbls in 2018). In addition to our oil derivatives, we had derivative contracts in the form of fixed price swaps and options on 36 TBtu of natural gas (32 TBtu in 2017 and 4 TBtu in 2018) and 108 MMGal of ethane fixed price swaps (46 MMGal in 2017 and 62 MMGal in 2018). As of December 31, 2015, we had fixed price derivative contracts for 23 MMBbls of oil, 7 TBtu on natural gas and 15 MMGal on propane. In addition to the contracts above, we have derivative contracts related to locational basis differences on our oil production. None of our derivative contracts are designated as accounting hedges.
As of December 31, 2016 and 2015, all derivative financial instruments were classified as Level 2. Our assessment of the level of an instrument can change over time based on the maturity or liquidity of the instrument, which can result in a change in the classification level of the financial instrument.
The following table presents the fair value associated with our derivative financial instruments as of December 31, 2016 and 2015. All of our derivative instruments are subject to master netting arrangements which provide for the unconditional right of offset for all derivative assets and liabilities with a given counterparty in the event of default. We present assets and liabilities related to these instruments in our consolidated balance sheets as either current or non-current assets or liabilities based on their anticipated settlement date, net of the impact of master netting agreements. On derivative contracts recorded as assets in the table below, we are exposed to the risk that our counterparties may not perform.
Level 2 | |||||||||||||||||||||||||||||||
Derivative Assets | Derivative Liabilities | ||||||||||||||||||||||||||||||
Gross Fair Value | Balance Sheet Location | Gross Fair Value | Balance Sheet Location | ||||||||||||||||||||||||||||
Impact of Netting | Current | Non-current | Impact of Netting | Current | Non-current | ||||||||||||||||||||||||||
(in millions) | (in millions) | ||||||||||||||||||||||||||||||
December 31, 2016 | |||||||||||||||||||||||||||||||
Derivative instruments | $ | 79 | $ | (17 | ) | $ | 58 | $ | 4 | $ | (22 | ) | $ | 17 | $ | (4 | ) | $ | (1 | ) | |||||||||||
December 31, 2015 | |||||||||||||||||||||||||||||||
Derivative instruments | $ | 795 | $ | (16 | ) | $ | 694 | $ | 85 | $ | (24 | ) | $ | 16 | $ | — | $ | (8 | ) | ||||||||||||
For the years ended December 31, 2016, 2015 and 2014, we recorded a derivative loss of $73 million and derivative gains of $667 million and $985 million, respectively. Derivative gains and losses on our oil, natural gas and NGLs financial derivative instruments are recorded in operating revenues in our consolidated income statements.
Interest Rate Derivative Instruments. We have interest rate swaps with a notional amount of $600 million that extend through March 2017 and are intended to reduce variable interest rate risk. As of December 31, 2016, we had a net asset of less than $1 million and of $1 million as of December 31, 2015, related to interest rate derivative instruments included in our consolidated balance sheets. For the years ended December 31, 2016, 2015 and 2014, we recorded $2 million, $5 million and $5 million, respectively, of interest expense related to the change in fair market value and cash settlements on our interest rate derivative instruments.
75
Credit Risk. We are subject to a risk of loss on our derivative instruments that could occur if our counterparties do not perform pursuant to the terms of their contractual obligations. We maintain credit policies with regard to our counterparties to minimize our overall credit risk. These policies require that we (i) evaluate potential counterparties’ financial condition to determine their credit worthiness; (ii) monitor our oil, natural gas and NGLs counterparties’ credit exposures; (iii) review significant counterparties' credit from physical and financial transactions on an ongoing basis; (iv) use contractual language that affords us netting or set off opportunities to mitigate risk; and (v) when appropriate, require counterparties to post cash collateral, parent guarantees or letters of credit to minimize credit risk. Our assets related to derivatives as of December 31, 2016 represent financial instruments from eight counterparties, all of which are lenders associated with our $1.5 billion Reserve-based Loan facility (RBL Facility) with an “investment grade” (minimum Standard & Poor’s rating of BBB+ or better) credit rating. Subject to the terms of our $1.5 billion RBL Facility, collateral or other securities are not exchanged in relation to derivatives activities with the parties in the RBL Facility.
Other Fair Value Considerations. During the year ended December 31, 2015, we recorded a non-cash impairment charge on our proved properties in the Eagle Ford Shale. The estimate of fair value of our proved oil and natural gas properties used to determine the impairment represented a Level 3 fair value measurement. See Notes 1 and 3 for a further discussion of our impairment charges.
7. Property, Plant and Equipment
Oil and Natural Gas Properties. As of December 31, 2016 and 2015, we had approximately $4.5 billion and $4.4 billion of total property, plant, and equipment, net of accumulated depreciation, depletion, and amortization on our balance sheet, substantially all of which relates to proved and unproved oil and natural gas properties.
Our capitalized costs related to proved and unproved oil and natural gas properties by area for the periods ended December 31 were as follows:
2016 | 2015 | |||||||
(in millions) | ||||||||
Proved | ||||||||
Eagle Ford | $ | 3,001 | $ | 2,833 | ||||
Wolfcamp | 2,415 | 2,174 | ||||||
Altamont | 1,624 | 1,553 | ||||||
Total Proved | 7,040 | 6,560 | ||||||
Unproved | ||||||||
Wolfcamp | 94 | 97 | ||||||
Altamont | 60 | 64 | ||||||
Total Unproved | 154 | 161 | ||||||
Less accumulated depletion | 2,731 | 2,335 | ||||||
Net capitalized costs for oil and natural gas properties | $ | 4,463 | $ | 4,386 | ||||
During 2016, we transferred approximately $9 million from unproved properties to proved properties. During 2016, 2015 and 2014, we recorded $2 million, $9 million and $18 million, respectively, of amortization of unproved leasehold costs in exploration expense in our consolidated income statement. Suspended well costs were not material as of December 31, 2016 or December 31, 2015.
Asset Retirement Obligations. We have legal asset retirement obligations associated with the retirement of our oil and natural gas wells and related infrastructure. We settle these obligations when production on those wells is exhausted, when we no longer plan to use them or when we abandon them. We accrue these obligations when we can estimate the timing and amount of their settlement.
In estimating the liability associated with our asset retirement obligations, we utilize several assumptions, including a credit-adjusted risk-free rate between 7 and 9 percent on a significant portion of our obligations and a projected inflation rate of 2.5 percent. Changes in estimates in the table below represent changes to the expected amount and timing of payments to settle our asset retirement obligations. Typically, these changes primarily result from obtaining new information about the timing of our obligations to plug and abandon oil and natural gas wells and the costs to do so, or reassessing our assumptions in light of market conditions. The net asset retirement liability as of December 31 on our consolidated balance sheet in other current and
76
non-current liabilities and the changes in the net liability for the periods ended December 31 were as follows:
2016 | 2015 | ||||||
(in millions) | |||||||
Net asset retirement liability at January 1 | $ | 38 | $ | 39 | |||
Liabilities incurred | — | 4 | |||||
Liabilities settled | (1 | ) | (2 | ) | |||
Accretion expense | 3 | 3 | |||||
Changes in estimate | 1 | (6 | ) | ||||
Net asset retirement liability at December 31 | $ | 41 | $ | 38 | |||
Capitalized Interest. Interest expense is reflected in our financial statements net of capitalized interest. We capitalize interest primarily on the costs associated with drilling and completing wells generally until production begins. The interest rate used is the weighted average interest rate of our outstanding borrowings. Capitalized interest for the years ended December 31, 2016, 2015 and 2014, was approximately $4 million, $14 million and $21 million, respectively.
8. Long Term Debt
Listed below are our debt obligations as of the periods presented:
Interest Rate | December 31, 2016 | December 31, 2015 | ||||||||
(in millions) | ||||||||||
RBL credit facility - due May 24, 2019(1) | Variable | $ | 370 | $ | 1,072 | |||||
Senior secured term loan - due May 24, 2018(2)(4) | Variable | 21 | 497 | |||||||
Senior secured term loan - due April 30, 2019(3)(4) | Variable | 8 | 150 | |||||||
Senior secured term loan - due June 30, 2021(5)(6) | Variable | 580 | — | |||||||
Senior secured notes - due November 29, 2024 | 8.00 | % | 500 | — | ||||||
Senior unsecured notes - due May 1, 2020 | 9.375 | % | 1,576 | 2,000 | ||||||
Senior unsecured notes - due September 1, 2022 | 7.75 | % | 250 | 350 | ||||||
Senior unsecured notes - due June 15, 2023 | 6.375 | % | 551 | 800 | ||||||
Total long-term debt | 3,856 | 4,869 | ||||||||
Less unamortized debt issue costs | (67 | ) | (57 | ) | ||||||
Total long-term debt, net | $ | 3,789 | $ | 4,812 | ||||||
(1) | Carries interest at a specified margin over LIBOR of 2.50% to 3.50%, based on borrowing utilization. |
(2) | Issued at 99% of par and carries interest at a specified margin over the LIBOR of 2.75%, with a minimum LIBOR floor of 0.75%. As of December 31, 2016 and 2015, the effective interest rate of the term loan was 3.50%. |
(3) | Carries interest at a specified margin over the LIBOR of 3.50%, with a minimum LIBOR floor of 1.00%. As of December 31, 2016 and 2015, the effective interest rate for the term loan was 4.50%. |
(4) | Secured by a second priority lien on all of the collateral securing the RBL Facility, and effectively ranks junior to any existing and future priority lien secured indebtedness of the Company. |
(5) | Carries an interest rate of LIBOR plus 8.75%, with a minimum LIBOR floor of 1.00%. As of December 31, 2016, the effective interest rate for the term loan was 9.75%. |
(6) | Secured by a priority lien on all of the collateral securing the RBL Facility, and effectively ranks junior to RBL indebtedness and senior priority lien indebtedness. |
In 2016, we (i) issued $500 million of 8.00% senior secured notes due in November 2024 using the net
proceeds from the offering to repay a portion of our outstanding balance on our RBL Facility and (ii) exchanged approximately 95% of the outstanding amount of our term loans maturing in May 2018 and April 2019 for new term loans maturing in 2021 with an aggregate principal amount of approximately $580 million. In February 2017, we issued $1 billion of 8.00% senior secured notes which mature in 2025 and used the proceeds (less fees and expenses) to repay in full our $580 million senior secured term loans due 2021, repurchase $250 million of our 9.375% senior notes due 2020 in the open market, and repay $111 million of the amounts outstanding under our RBL facility.
77
(Gain) Loss on Extinguishment of Debt. During 2016, we paid approximately $407 million in cash to repurchase a total of approximately $812 million in aggregate principal amount of our senior unsecured notes and term loans which resulted in a gain on extinguishment of debt of approximately $393 million for the year ended December 31, 2016 (including $12 million of non-cash expense related to eliminating associated unamortized debt issue costs). For the year ended December 31, 2016, we also recorded losses on the extinguishment of debt of $9 million, primarily related to eliminating a portion of the unamortized debt issue costs upon the reduction of our RBL borrowing base in May 2016 and November 2016 as further noted in Liquidity and Capital Resources.
In 2015, we issued $800 million of 6.375% senior unsecured notes due in June 2023. We used a substantial portion of the proceeds from the offering to purchase for cash our $750 million senior secured notes due in 2019. In conjunction with repurchasing these notes, we recorded a $41 million loss on extinguishment of debt, of which $12 million was a non-cash expense related to eliminating associated unamortized debt issuance costs. In 2014, we repaid and retired our senior PIK toggle note with a portion of the proceeds from our initial public offering recording a $17 million loss on extinguishment of debt.
Unamortized Debt Issue Costs. As of December 31, 2016 and 2015, we had total unamortized debt issue costs of $77 million and $80 million. Of these amounts $10 million and $23 million, respectively, are associated with our RBL Facility and $67 million and $57 million, respectively, are associated with our senior secured term loans and senior notes. During 2016, we (i) recorded an additional $10 million in conjunction with the issuance of our $500 million of 8.00% senior secured notes, (ii) recorded an additional $22 million in conjunction with the exchange of $580 million in new term loans for approximately 95% of the outstanding amount of our 2018 and 2019 term loans and (iii) expensed approximately $21 million in conjunction with the repurchase of a portion of our senior unsecured notes and term loans and the reduction of our RBL borrowing base. During 2016, 2015 and 2014, we amortized $16 million, $18 million and $21 million, respectively, of deferred financing costs into interest expense.
Reserve-based Loan Facility. We have a $1.5 billion credit facility in place which allows us to borrow funds or issue letters of credit (LC's). The facility matures in May 2019. As of December 31, 2016, we had $1,111 million of capacity remaining with approximately $19 million of LC's issued and approximately $370 million outstanding under the facility. Listed below is a further description of our credit facility as of December 31, 2016:
Credit Facility | Maturity Date | Interest Rate | Commitment fees | |||
$1.5 billion RBL | May 24, 2019 | LIBOR + 2.5%(1) 2.5% for LCs | 0.375% commitment fee on unused capacity | |||
(1) | Based on our December 31, 2016 borrowing level. Amounts outstanding under the $1.5 billion RBL Facility bear interest at specified margins over the LIBOR of between 2.50% and 3.50% for Eurodollar loans or at specified margins over the Alternative Base Rate (ABR) of between 1.50% and 2.50% for ABR loans. Such margins will fluctuate based on the utilization of the facility. |
The RBL Facility is collateralized by certain of our oil and natural gas properties and has a borrowing base subject to semi-annual redetermination. In May 2016, we completed our semi-annual redetermination of our RBL Facility and the borrowing base was reduced to $1.65 billion, reflecting significantly lower bank commodity price forecasts, the sale of our Haynesville assets and the roll-off of certain hedge positions. The borrowing base was reaffirmed in our semi-annual redetermination in early November 2016. Following such redetermination in early November 2016, we issued $500 million of 8.00% senior secured notes which triggered an additional automatic reduction to the RBL Facility's borrowing base to $1.5 billion. In February 2017, as a result of the issuance of our $1 billion senior secured notes due 2025, our RBL borrowing base was automatically reduced to $1.44 billion. Our next redetermination date is in April 2017. Downward revisions of our oil and natural gas reserves due to declines in commodity prices, performance revisions, sales of assets or the incurrence of certain types of additional debt, among other items, could cause a reduction of our borrowing base which could negatively impact our borrowing capacity under the RBL Facility in the future.
Restrictive Provisions/Covenants. The availability of borrowings under our credit agreements and our ability to incur additional indebtedness is subject to various financial and non-financial covenants and restrictions. In conjunction with our RBL Facility redetermination in May 2016, we amended certain covenants, the most significant of which suspended the requirement that our debt to EBITDAX ratio, as defined in the credit agreement, not exceed 4.5 to 1.0 and replaced it with a requirement that our ratio of first lien debt to EBITDAX not exceed 3.5 to 1.0. As of December 31, 2016, we were in compliance with our debt covenants, and our ratio of first lien debt to EBITDAX was 0.36x. The 4.5 to 1.0 debt to EBITDAX requirement will be reinstated beginning in April 2018, and while we are not currently subject to this covenant as of December 31, 2016 our ratio of debt to EBITDAX is 3.69x, below the required levels.
78
As part of the amendment, we also agreed to limit debt repurchases occurring after the redetermination to $350 million subject to certain adjustments. Certain other covenants and restrictions, among other things, also limit our ability to incur or guarantee additional indebtedness; make any restricted payments or pay any dividends on equity interests or redeem, repurchase or retire parent entities’ equity interests or subordinated indebtedness; sell assets; make investments; create certain liens; prepay debt obligations; engage in transactions with affiliates; and enter into certain hedge agreements.
9. Commitments and Contingencies
Legal Matters
We and our subsidiaries and affiliates are parties to various legal actions and claims that arise in the ordinary course of our business. For each matter, we evaluate the merits of the case or claim, our exposure to the matter, possible legal or settlement strategies and the likelihood of an unfavorable outcome. If we determine that an unfavorable outcome is probable and can be estimated, we establish the necessary accruals. While the outcome of our current matters cannot be predicted with certainty and there are still uncertainties related to the costs we may incur, based upon our evaluation and experience to date, we believe we have established appropriate reserves for these matters. It is possible, however, that new information or future developments could require us to reassess our potential exposure and adjust our accruals accordingly, and these adjustments could be material. As of December 31, 2016, we had approximately $3 million accrued for all outstanding legal matters.
Indemnifications and Other Matters. We periodically enter into indemnification arrangements as part of the divestiture of assets or businesses. These arrangements include, but are not limited to, indemnifications for income taxes, the resolution of existing disputes, environmental and other contingent matters. In addition, under various laws or regulations, we could be subject to the imposition of certain liabilities. For example, the decline in commodity prices has created an environment where there is an increased risk that owners and/or operators of assets previously purchased from us may no longer be able to satisfy plugging and abandonment obligations that attach to such assets. In that event, under various laws or regulations, we could be required to assume all, or a portion of the plugging or abandonment obligations on assets we no longer own or operate. As of December 31, 2016, we had approximately $8 million accrued related to these indemnifications and other matters.
Sales Tax Audits. We are under a number of other examinations by taxing authorities related to non-income tax matters. During the third and fourth quarters of 2016, we accrued a total of approximately $40 million (included in other accrued liabilities in our consolidated balance sheet) in connection with ongoing examinations related to certain prior period non-income tax matters. In conjunction with recording the accrual, we recorded approximately $29 million in additional depreciation, depletion and amortization expense as certain prior year costs would have been historically capitalized and amortized or impaired in prior periods, $2 million as lease operating expense, $5 million as property, plant and equipment and $4 million as interest expense.
Environmental Matters
We are subject to existing federal, state and local laws and regulations governing environmental quality, pollution control and greenhouse gas (GHG) emissions. Numerous governmental agencies, such as the EPA, issue regulations which often require difficult and costly compliance measures that carry substantial administrative, civil and criminal penalties and may result in injunctive obligations for non-compliance. These laws and regulations may, among other things, (i) require the acquisition of a permit before drilling commences, (ii) restrict the types, quantities and concentrations of various substances that can be released into the environment in connection with drilling and production activities, (iii) limit or prohibit construction or drilling activities on certain lands lying within wilderness, wetlands, ecologically sensitive areas, seismically active areas and other protected areas, (iv) require action to prevent or remediate pollution from current or former operations, such as plugging abandoned wells or closing pits, (v) result in the suspension or revocation of necessary permits, licenses and authorizations and (vi) require that additional pollution controls be installed and impose substantial liabilities for pollution resulting from our operations or relate to our owned or operated facilities. The strict and joint and several liability nature of such laws and regulations could impose liability upon us regardless of fault. Moreover, it is not uncommon for neighboring landowners and other third parties to file claims for personal injury and property damage allegedly caused by the release of hazardous substances, hydrocarbons or other waste products into the environment. Changes in environmental laws and regulations occur frequently, and any changes that result in more stringent and costly pollution control or waste handling, storage, transport, disposal or cleanup requirements could materially adversely affect our operations and financial position, as well as the oil and natural gas industry in general. Our management believes that we are in substantial compliance with applicable environmental laws and regulations and we have not experienced any material adverse effect from compliance with these environmental requirements.
The environmental laws and regulations to which we are subject also require us to remove or remedy the effect on the environment of the disposal or release of specified substances at current and former operating sites. As of December 31, 2016,
79
we had accrued and had exposure of approximately $1 million for related environmental remediation costs associated with onsite, offsite and groundwater technical studies and for related environmental legal costs. Our accrual represents a combination of two estimation methodologies. First, where the most likely outcome can be reasonably estimated, that cost has been accrued. Second, where the most likely outcome cannot be estimated, a range of costs is established and if no one amount in that range is more likely than any other, the lower end of the expected range has been accrued. Our environmental remediation projects are in various stages of completion. The liabilities we have recorded reflect our current estimates of amounts that we will expend to remediate these sites. However, depending on the stage of completion or assessment, the ultimate extent of contamination or remediation required may not be known. As additional assessments occur or remediation efforts continue, we may incur additional liabilities.
Climate Change and Other Emissions. In recent years, federal, state and local governments have taken steps to reduce GHG emissions. The EPA has finalized a series of GHG monitoring, reporting and emission control rules for the oil and natural gas industry, and the U.S. Congress has, from time to time, considered adopting legislation to reduce emissions. In December 2015, the United States participated in the 21st Conference of the Parties (COP-21) of the United Nations Framework Convention on Climate Change in Paris, France. The resulting Paris Agreement calls for the parties to undertake ambitious efforts to limit the average global temperature, and to conserve and enhance sinks and reservoirs of GHGs. The Agreement establishes a framework for the parties to cooperate and report actions to reduce GHG emissions. Any regulations regarding GHG emissions would likely increase our costs of compliance by potentially delaying the receipt of permits and other regulatory approvals; requiring us to monitor emissions, install additional equipment or modify facilities to reduce GHG and other emissions; purchase emission credits; and utilize electric-driven compression at facilities to obtain regulatory permits and approvals in a timely manner.
As part of an effort to reduce methane emissions, the EPA, the Pipeline and Hazardous Materials Safety Administration (PHMSA) and the Bureau of Land Management (BLM) have recently proposed or finalized new regulations affecting the oil and gas industry. On January 10, 2017, the PHMSA approved final rules for oil pipelines, in part requiring inspections in areas affected by natural disasters, expanding use of leak detection systems, and requiring increased use of inline inspection tools. The final rule will become effective six months after publication in the Federal Register. However, because the current Presidential Administration has prohibited such publication until it has had time to review the pending regulations, it is not clear when, or if, the final rules will become effective. In November 2016, the BLM published final rules for oil and gas facilities on onshore federal and Indian leases to prohibit venting, limit flaring, require leak detection to allow adjustment of royalty rates for new leases, and to establish requirements for the measurement of oil and gas. The rules went into effect in January 2017 and will require installation of tank vapor controls at over 70 existing well sites in the Altamont area at an estimated cost of approximately $5 million. On February 2, 2017, the U.S. House of Representatives passed a resolution under the Congressional Review Act to reverse this rule, and a similar resolution has been introduced in the U.S. Senate. Although we are following these legal developments, it is uncertain at this time whether the rule will be reversed.
On June 3, 2016, the EPA published several proposed regulations under the Clean Air Act to reduce methane
and volatile organic compounds emissions, in part through green completions at oil wells, fugitive emission surveys, limits on
pneumatic pumps and controllers, and draft guidelines for controls on equipment in ozone nonattainment areas. These rules
went into effect on August 2, 2016, but we do not expect any material capital expenditure for initial and ongoing compliance with these rules.
Air Quality Regulations. The EPA has promulgated various performance and emission standards that mandate air pollutant emission limits and operating requirements for stationary reciprocating internal combustion engines and process equipment. We do not anticipate material capital expenditures to meet these requirements.
In August 2012, the EPA promulgated additional standards to reduce various air pollutants associated with hydraulic fracturing of natural gas wells and equipment including compressors, storage vessels, and pneumatic valves. Additional amendments to the new standard were finalized in 2013 through 2016. We do not anticipate material capital expenditures to meet these requirements.
The EPA has promulgated regulations to require pre-construction permits for minor sources of air emissions in tribal lands. In September 2015, the EPA proposed a federal implementation plan (FIP), rather than a general permit, to effect these regulations. The FIP was finalized in June 2016. The FIP requires registration of new and modified minor sources beginning October 2015 and incorporates emission limits and other requirements from six standards under the Clean Air Act for the oil and gas industry. Additionally, the FIP requires an operator to document compliance with the Endangered Species Act and National Historic Preservation Act. This rule may delay pad construction and commencement of drilling in the future if the EPA does not timely provide written confirmation that requisites of the FIP have been met.
80
Hydraulic Fracturing Regulations. We use hydraulic fracturing extensively in our operations. Various regulations have been adopted and proposed at the federal, state and local levels to regulate hydraulic fracturing operations. These regulations range from banning or substantially limiting hydraulic fracturing operations, requiring disclosure of the hydraulic fracturing fluids and requiring additional permits for the use, recycling and disposal of water used in such operations. In addition, various agencies, including the EPA and Department of Energy, have been reviewing changes in their regulations to address the environmental impacts of hydraulic fracturing operations. Until such regulations are implemented, it is uncertain what impact they might have on our operations. In March 2015, the BLM published final rules for hydraulic fracturing on federal and certain tribal lands, including use of tanks for recovered water, updated cementing and testing requirements, and disclosure of chemicals used in hydraulic fracturing. Several states and the Ute Indian Tribe have filed suit to challenge these rules. In September 2015, a federal court issued a preliminary injunction suspending the rules and, in June 2016, ordered the rules set aside as exceeding the BLM's authority. The BLM has filed an appeal in the Tenth Circuit Court of Appeals. No material cost is expected for the Company’s 2017 program.
Comprehensive Environmental Response, Compensation and Liability Act (CERCLA) Matters. As part of our environmental remediation projects, we are or have received notice that we could be designated as a Potentially Responsible Party (PRP) with respect to one active site under the CERCLA or state equivalents. As of December 31, 2016, we have estimated our share of the remediation costs at this site to be less than $1 million. Because the clean-up costs are estimates and are subject to revision as more information becomes available about the extent of remediation required, and because in some cases we have asserted a defense to any liability, our estimates could change. Moreover, liability under the federal CERCLA statute may be joint and several, meaning that we could be required to pay in excess of our pro-rata share of remediation costs. Our understanding of the financial strength of other PRPs has been considered, where appropriate, in estimating our liabilities. Accruals for these matters are included in the reserve for environmental matters discussed above.
Waste Handling. Administrative, civil and criminal penalties can be imposed for failure to comply with waste handling requirements imposed under the Resource Conservation and Recovery Act, as amended, and comparable state laws. We believe that we are in substantial compliance with applicable requirements related to waste handling, and that we hold all necessary and up-to-date permits, registrations and other authorizations to the extent that our operations require them under such laws and regulations. Any legislative or regulatory reclassification of oil and natural gas exploration and production wastes could increase our costs to manage and dispose of such wastes.
It is possible that new information or future developments could require us to reassess our potential exposure related to environmental matters. We may incur significant costs and liabilities in order to comply with existing environmental laws and regulations. It is also possible that other developments, such as increasingly strict environmental laws, regulations, and orders of regulatory agencies, as well as claims for damages to property and the environment or injuries to employees and other persons resulting from our current or past operations, could result in substantial costs and liabilities in the future. As this information becomes available, or other relevant developments occur, we will adjust our accrued amounts accordingly. While there are still uncertainties related to the ultimate costs we may incur, based upon our evaluation and experience to date, we believe our reserves are adequate.
Lease Obligations
We maintain operating leases in the ordinary course of our business activities. These leases include those for office space and various equipment. The terms of the agreements, the largest of which relates to our building lease, vary through 2025. Future minimum annual rental commitments under non-cancelable future operating lease commitments at December 31, 2016, were as follows:
Year Ending December 31, | Operating Leases | |||
(in millions) | ||||
2017 | $ | 7 | ||
2018 | 5 | |||
2019 | 5 | |||
2020 | 5 | |||
2021 | 5 | |||
Thereafter | 22 | |||
Total | $ | 49 | ||
Rental expense for the years ended December 31, 2016, 2015 and 2014 was $13 million, $12 million and $13 million, respectively.
81
Other Commercial Commitments
At December 31, 2016, we have various commercial commitments totaling $395 million primarily related to commitments and contracts associated with volume and transportation, completion activities and seismic activities. Our annual obligations under these arrangements are $112 million in 2017, $65 million in 2018, $62 million in 2019, $57 million in 2020, and $99 million thereafter.
10. Long-Term Incentive Compensation / 401(k) Retirement Plan
Overview. Under our current stock-based compensation plan (the EP Energy Corporation 2014 Omnibus Incentive Plan, or omnibus plan), we may issue to our employees and non-employee directors various forms of long-term incentive (LTI) compensation including stock options, stock appreciation rights, restricted stock, restricted stock units, performance shares/units, incentive awards, cash awards, and other stock-based awards. We are authorized to grant awards of up to 24,832,525 shares of our common stock for awards under the omnibus plan, with 17,150,841 shares remaining available for issuance as of December 31, 2016. In addition, in conjunction with the acquisition of certain of our subsidiaries by Apollo and other private equity investors in 2012 (the Acquisition), certain employees received other LTI awards based on their purchased equity interests including, but not limited to Class A “matching” units (subsequently converted into common shares) and Management Incentive Units (subsequently converted into Class B shares) which become payable upon certain liquidity events. We also issued additional Class B shares in 2013 to a subsidiary for grants to current and future employees that likewise become payable upon certain liquidity events. No additional Class B shares are available for issuance. All of these LTI programs are discussed further below.
We record stock-based compensation expense as general and administrative expense over the requisite service period, net of estimates of forfeitures. If actual forfeitures differ from our estimates, additional adjustments to compensation expense will be required in future periods. For the years ended December 31, 2016, 2015 and 2014, we recognized approximately $22 million, $21 million and $22 million, respectively, of pre-tax compensation expense related to our LTI programs and recorded an associated income tax benefit of $9 million, $6 million and $6 million for the years 2016, 2015 and 2014, respectively.
Restricted stock. We grant shares of restricted common stock which carry voting and dividend rights and may not be sold or transferred until they are vested. The fair value of our restricted stock is determined on the date of grant and these shares generally vest in equal amounts over 3 years from the date of the grant. A summary of the changes in our non-vested restricted shares for the year ended December 31, 2016 is presented below:
Number of Shares | Weighted Average Grant Date Fair Value per Share | |||||
Non-vested at December 31, 2015 | 3,987,654 | $ | 10.98 | |||
Granted | 4,676,322 | $ | 6.08 | |||
Vested | (1,255,394 | ) | $ | 11.76 | ||
Forfeited | (1,081,794 | ) | $ | 8.17 | ||
Non-vested at December 31, 2016 | 6,326,788 | $ | 7.69 | |||
The total unrecognized compensation cost related to these arrangements at December 31, 2016 was approximately $32 million, which is expected to be recognized over a weighted average period of 2 years.
Stock Options. In 2014, we granted stock options as compensation for future service at an exercise price equal to the closing share price of our stock on the grant date. No stock options were granted in 2015 or 2016. Stock options granted have contractual terms of 10 years and generally vest in three tranches over a five-year period (with the first tranche vesting on the third anniversary of the grant date, the second tranche vesting on the fourth anniversary of the grant date and the third tranche vesting on the fifth anniversary thereof). We do not pay dividends on unexercised options. A summary of our stock options for the year ended December 31, 2016 is presented below.
82
Number of Shares Underlying Options | Weighted Average Exercise Price per Share | Weighted Average Remaining Contractual Term | Aggregate Intrinsic Value | ||||||||
(in years) | (in millions) | ||||||||||
Outstanding at December 31, 2015 | 214,337 | $ | 19.82 | ||||||||
Granted | — | $ | 19.82 | ||||||||
Vested | (1,514 | ) | $ | 19.82 | |||||||
Forfeited or canceled | (4,933 | ) | $ | 19.82 | |||||||
Outstanding at December 31, 2016 | 207,890 | $ | 19.82 | 7.25 | — | ||||||
Total compensation cost related to non-vested option awards not yet recognized at December 31, 2016 was approximately $1 million, which is expected to be recognized over a weighted average period of 2 years. There were no options exercised during the year.
Fair Value Assumptions. The fair value of each stock option granted in 2014 was estimated on the date of grant using a Black-Scholes option-pricing model based on several assumptions utilizing management’s best estimate at the time of grant. For the year ended December 31, 2014, the weighted average grant date fair value per share of options granted was $9.03. Listed below is the weighted average of each assumption based on the grant in 2014:
2014 | ||
Expected Term in Years | 7.0 | |
Expected Volatility | 40 | % |
Expected Dividends | — | |
Risk-Free Interest Rate | 2.3 | % |
We estimated expected volatility based on an analysis of historical stock price volatility of a group of similar publicly traded peer companies which share similar characteristics with us over the expected term because our stock at that time had been publicly traded for a very short period of time. We estimated the expected term of our option awards based on the vesting period and average remaining contractual term, referred to as the “simplified method.” We used this method to provide a reasonable basis for estimating our expected term based on insufficient historical data prior to 2014.
Cash-Based Long Term Incentive. In 2013, we provided long term cash-based incentives to certain of our employees linking annual performance-based cash incentive payments to the financial performance of the company as approved by the Compensation Committee of our board of directors, and the employee’s individual performance for the year. Beginning in 2014, no further cash-based awards were granted. Cash-based LTI awards granted were amortized primarily on an accelerated basis over the three-year vesting period.
Class A “Matching” Grants. In conjunction with the Acquisition, certain of our employees purchased Class A units. In connection with their purchase of these units, these employees were awarded compensatory awards for accounting purposes including “matching” Class A unit grants with a fair value of $12 million equal to 50% of the Class A units purchased subject to repurchase by the Company in the event of certain termination scenarios. In 2013, each “matching” unit was converted into common stock. For the “matching” Class A unit grant, we recognized the fair value as compensation cost ratably over the period from the date of grant through the period over which the requisite service were provided and the time period at which certain transferability restrictions are removed which occurred in May 2016.
Management Incentive Units (MIPs). In addition to the Class A “matching” awards described above, certain employees were awarded MIPs at the time of the Acquisition. These MIPs are intended to constitute profits interests. Each award of MIPs represents a share in any future appreciation of the Company after the date of grant, subject to certain limitations, and once certain shareholder returns have been achieved. The MIPs vest ratably over 5 years subject to certain forfeiture provisions based on continued employment with the Company, although 25% of any vested awards are forfeitable in the event of certain termination events. The MIPs become payable based on the achievement of certain predetermined performance measures (e.g. certain liquidity events in which our private equity investors receive a return of at least one times their invested capital plus a stated return). The MIPs were issued at no cost to the employees and have value only to the extent the value of the Company increases. For accounting purposes, these awards were treated as compensatory equity awards at the date of grant. The MIPs were subsequently converted into Class B common shares on a one-for-one basis in 2013. On May 24, 2012, the grant date fair value of this award was determined using a non-controlling, non-marketable option pricing model which valued these MIPs assuming a 0.77% risk free rate, a 5 year time to expiration, and a 73% volatility rate. Based on these factors, we determined a grant date fair value of $74 million. As of December 31, 2016, we had unrecognized
83
compensation expense of $14 million. Of this amount, we will recognize $1 million during the remaining requisite service period in 2017. The remaining $13 million of compensation will be recognized should a specified capital transaction occur and the right to such amounts become nonforfeitable.
Performance Units. We grant performance unit awards to certain members of EP Energy's management team. Performance units have a target value of $100 per unit; however, the ultimate value of each performance unit will range from zero to $200 depending on the level of total shareholder return (TSR) relative to that of EP Energy’s peer group of companies for the performance period. The performance units are subject to three separate performance periods starting on January 1, 2016 and ending on December 31, 2016, 2017 and 2018. The performance units vest in three separate tranches over the requisite service period beginning on the grant date. The awards may be settled in either stock or cash at the election of the Board of Directors. Had all performance unit awards vested on December 31, 2016 and been settled in stock, 1.9 million shares would have been issued.
A summary of our performance unit award transactions for the year ended December 31, 2016 is presented below:
Number of Awards | Weighted Average Fair Value | |||||
Non-vested at December 31, 2015 | — | $ | — | |||
Granted | 83,150 | $ | 102.41 | |||
Cancelled/Forfeited | (4,250 | ) | $ | 68.32 | ||
Non-vested at December 31, 2016 | 78,900 | $ | 97.77 | |||
For accounting purposes, the performance unit awards are treated as a liability award with the expense recognized on an accelerated basis and fair value remeasured at each reporting period. The fair value of these awards measured at the grant date and as of December 31, 2016 was approximately $8 million determined using a Monte Carlo simulation based on numerous iterations of random projections of stock price paths. The following table summarizes the significant assumptions used to calculate the grant date fair value of the performance unit awards granted in 2016:
2016 | ||
Expected Term in Years | 3.0 | |
Expected Volatility(1) | 85.9 | % |
Expected Dividends | — | |
Risk-Free Interest Rate(2) | 1.01 | % |
(1) | Expected volatility assumption is based on the historical stock price volatility over approximately the last 3 years. |
(2) | The risk-free rate is based upon the yield on U.S. Treasury STRIPS (Separate Trading of Registered Interest and Principal of Securities) over the expected term as of the grant date. U.S. Treasury STRIPS are fixed-income securities sold at a significant discount to face value and offer no interest payments because they mature at par. |
Total compensation cost related to non-vested performance unit awards not yet recognized at December 31, 2016 was approximately $3 million, which is expected to be recognized over a weighted average period of 1.3 years.
Other. In September 2013, we issued an additional 70,000 shares of Class B common stock to EPE Employee Holdings II, LLC (EPE Holdings II), a subsidiary. EPE Holdings II was formed to hold such shares and serve as an entity through which current and future employee incentive awards would be granted. Holders of the awards do not hold actual Class B common stock or equity in EPE Holdings II, but rather will have a right to receive proceeds paid to EPE Holdings II in respect of such shares which is conditional upon certain events (e.g. certain liquidity events in which our private equity investors receive a return of at least one times their invested capital plus a stated return) that are not yet probable of occurring. As a result, no compensation expense was recognized upon the issuance of the Class B shares to EPE Holdings II, and none will occur until those events that give rise to a payout on such shares becomes probable of occurring. At that time, the full value of the awards issued to EPE Holdings II will be recognized based on actual amounts paid, if any, on the Class B common stock.
401(k) Retirement Plan. We sponsor a tax-qualified defined contribution retirement plan for a broad-based group of employees. We make matching contributions (dollar for dollar up to 6% of eligible compensation) and non-elective employer contributions (5% of eligible compensation) to the plan, and individual employees are also eligible to contribute to the defined contribution plan. During 2016, 2015 and 2014, we contributed $9 million, $10 million and $11 million, respectively, of matching and non-elective employer contributions.
84
11. Related Party Transactions
Joint Venture. In January 2017, we entered into a drilling joint venture with Wolfcamp Drillco Operating L.P. (the Investor), managed and owned by affiliates of Apollo Global Management LLC, to fund future oil and natural gas development in our Wolfcamp program. The Investor will fund approximately $450 million over the entire program, or approximately 60 percent of the drilling, completion and equipping costs in exchange for a 50 percent working interest in the joint venture wells. Once the Investor achieves a 12 percent internal rate of return on its invested capital in each tranche, its working interest will revert to 15 percent. We will retain operational control of the joint venture assets and the transaction is expected to increase well-level returns on the jointly developed wells. The first wells under the joint venture began production in January 2017.
Affiliate Supply Agreement. For the years ended December 31, 2016, 2015 and 2014, we recorded approximately $6 million, $67 million and $112 million, respectively, in capital expenditures for amounts expended under supply agreements entered into with an affiliate of Apollo Management, LLC (Apollo) to provide certain fracturing materials to our Eagle Ford drilling operations. This agreement was terminated effective May 2016.
Management Fee Agreement. In January 2014, we paid a quarterly management fee of $6.25 million to our private equity investors (affiliates of Apollo, Riverstone Holdings LLC, Access Industries and Korea National Oil Corporation, collectively the Sponsors). Additionally, upon the closing of our initial public offering in January 2014, we paid the Sponsors a transaction fee equal to approximately $83 million. We recorded both of these fees in general and administrative expense. Our Management Fee Agreement with the Sponsors, including the obligation to pay the quarterly management fee, terminated automatically in accordance with its terms upon the closing of our initial public offering in January 2014.
85
Supplemental Selected Quarterly Financial Information (Unaudited)
Financial information by quarter is summarized below (in millions, except per common share amounts).
2016 | March 31 | June 30 | September 30 | December 31 | ||||||||||||
Operating revenues | ||||||||||||||||
Physical sales | $ | 182 | $ | 205 | $ | 212 | $ | 241 | ||||||||
Financial derivatives | 42 | (105 | ) | 43 | (53 | ) | ||||||||||
Operating (loss) income | (18 | ) | (27 | ) | 6 | (59 | ) | |||||||||
Income tax expense | — | — | 1 | — | ||||||||||||
Net income (loss) | $ | 94 | $ | 62 | $ | (43 | ) | $ | (140 | ) | ||||||
Basic and diluted net income (loss) per common share | ||||||||||||||||
Net income (loss) | $ | 0.38 | $ | 0.25 | $ | (0.18 | ) | $ | (0.57 | ) | ||||||
2015 | March 31 | June 30 | September 30 | December 31 | ||||||||||||
Operating revenues | ||||||||||||||||
Physical sales | $ | 290 | $ | 368 | $ | 319 | $ | 264 | ||||||||
Financial derivatives | 203 | (179 | ) | 434 | 209 | |||||||||||
Operating income (loss) | 113 | (208 | ) | 355 | (4,215 | ) | ||||||||||
Income tax expense (benefit) | 10 | (118 | ) | 95 | (565 | ) | ||||||||||
Net income (loss) | $ | 19 | $ | (212 | ) | $ | 176 | $ | (3,731 | ) | ||||||
Basic and diluted net income (loss) per common share | ||||||||||||||||
Net income (loss) | $ | 0.08 | $ | (0.87 | ) | $ | 0.72 | $ | (15.29 | ) | ||||||
Below are additional significant items affecting comparability of amounts reported in the respective periods of 2016 and 2015:
September 30, 2016. We recorded a $26 million gain on extinguishment of debt in conjunction with repurchasing a portion of our senior unsecured notes and term loans.
June 30, 2016. We recorded a $170 million gain on extinguishment of debt in conjunction with repurchasing a portion of our senior unsecured notes and term loans. We also recorded a loss on extinguishment of debt of $8 million related to eliminating a portion of the unamortized debt issue costs due to the reduction of our RBL borrowing base in May 2016. In addition, we recorded an $83 million gain on sale of assets related to the sale of our assets in the Haynesville and Bossier shales in May 2016.
March 31, 2016. We recorded a $196 million gain on extinguishment of debt in conjunction with repurchasing a portion of our senior unsecured notes.
December 31, 2015. We recorded a non-cash impairment charge of approximately $4.0 billion of our proved properties and a non-cash impairment charge of $288 million of our unproved properties due to the continued significant decline in commodity prices during the fourth quarter.
June 30, 2015. We recorded a $41 million loss on extinguishment of debt in conjunction with refinancing our $750 million senior secured notes.
86
Supplemental Oil and Natural Gas Operations (Unaudited)
We are engaged in the exploration for, and the acquisition, development and production of oil, natural gas and NGLs, in the United States (U.S.). We also had operations in Brazil that were sold in 2014.
For the period ended December 31, 2014, our total costs incurred and results of operations include as discontinued operations our Brazilian operations and domestic natural gas assets sold in the Arklatex and South Louisiana Wilcox areas.
Capitalized Costs. Capitalized costs relating to domestic oil and natural gas producing activities and related accumulated depreciation, depletion and amortization were as follows at December 31 (in millions):
2016 | 2015(1) | ||||||
Oil and natural gas properties | $ | 7,194 | $ | 6,721 | |||
Less accumulated depreciation, depletion and amortization | 2,731 | 2,335 | |||||
Net capitalized costs | $ | 4,463 | $ | 4,386 | |||
(1) | December 31, 2015 does not include amounts related to Haynesville as these capitalized costs are reflected as assets held for sale on our consolidated balance sheet. |
Total Costs Incurred. Costs incurred in oil and natural gas producing activities, whether capitalized or expensed, were as follows for the years ended December 31, 2016, 2015 and 2014 (in millions):
U.S. | |||
2016 Consolidated: | |||
Property acquisition costs | |||
Unproved properties | $ | 8 | |
Exploration costs (capitalized and expensed) | 4 | ||
Development costs | 472 | ||
Costs expended | 484 | ||
Asset retirement obligation costs | — | ||
Total costs incurred | $ | 484 | |
2015 Consolidated: | |||
Property acquisition costs | |||
Proved properties | $ | 111 | |
Unproved properties | 12 | ||
Exploration costs (capitalized and expensed) | 26 | ||
Development costs | 1,168 | ||
Costs expended | 1,317 | ||
Asset retirement obligation costs | 4 | ||
Total costs incurred | $ | 1,321 | |
2014 Consolidated: | |||
Property acquisition costs | |||
Proved properties | $ | 117 | |
Unproved properties | 62 | ||
Exploration costs (capitalized and expensed) | 57 | ||
Development costs | 1,953 | ||
Costs expended | 2,189 | ||
Asset retirement obligation costs | 10 | ||
Total costs incurred | $ | 2,199 | |
We capitalize salaries and benefits that we determine are directly attributable to our oil and natural gas activities. The table above includes capitalized labor costs of $27 million, $31 million and $38 million for the years ended December 31, 2016, 2015 and 2014, and capitalized interest of $4 million, $14 million and $21 million for the same periods.
Oil and Natural Gas Reserves. Net quantities of proved developed and undeveloped reserves of natural gas, oil and NGLs and changes in these reserves at December 31, 2016 presented in the tables below are based on our internal reserve report. Net proved reserves exclude royalties and interests owned by others and reflect contractual arrangements and royalty
87
obligations in effect at the time of the estimate. Our 2016 proved reserves were consistent with estimates of proved reserves filed with other federal agencies in 2016 except for differences of less than five percent resulting from actual production, acquisitions, property sales, necessary reserve revisions and additions to reflect actual experience.
Ryder Scott Company, L.P. (Ryder Scott), conducted an audit of the estimates of the proved reserves that we prepared as of December 31, 2016. In connection with its audit, Ryder Scott reviewed 99% (by volume) of our total proved reserves on a barrel of oil equivalent basis, representing 98% of the total discounted future net cash flows of these proved reserves. For the audited properties, 100% of our total proved undeveloped (PUD) reserves were evaluated. Ryder Scott concluded the overall procedures and methodologies that we utilized in preparing our estimates of proved reserves as of December 31, 2016 complied with current SEC regulations and the overall proved reserves for the reviewed properties as estimated by us are, in aggregate, reasonable within the established audit tolerance guidelines of 10% as set forth in the Society of Petroleum Engineers auditing standards. Ryder Scott’s report is included as an exhibit to this Annual Report on Form 10-K.
Year Ended December 31, 2016(1) | |||||||||||
Natural Gas (in Bcf) | Oil (in MBbls) | NGLs (in MBbls) | Equivalent Volumes (in MMBoe) | ||||||||
Proved developed and undeveloped reserves | |||||||||||
Beginning of year | 938 | 298,741 | 90,875 | 546.0 | |||||||
Revisions due to prices | (22 | ) | (10,434 | ) | (3,770 | ) | (17.9 | ) | |||
Revisions other than prices(2) | (52 | ) | (75,462 | ) | (8,293 | ) | (92.4 | ) | |||
Extensions and discoveries(3) | 129 | 25,492 | 17,146 | 64.1 | |||||||
Sales of reserves in place | (203 | ) | (1,493 | ) | — | (35.3 | ) | ||||
Production | (58 | ) | (17,061 | ) | (5,383 | ) | (32.1 | ) | |||
End of year | 732 | 219,783 | 90,575 | 432.4 | |||||||
Proved developed reserves: | |||||||||||
Beginning of year | 530 | 131,804 | 36,442 | 256.6 | |||||||
End of year | 346 | 108,133 | 38,887 | 204.6 | |||||||
Proved undeveloped reserves: | |||||||||||
Beginning of year | 408 | 166,937 | 54,432 | 289.4 | |||||||
End of year | 386 | 111,649 | 51,689 | 227.8 | |||||||
(1) | Proved reserves were evaluated based on the average first day of the month spot price for the preceding 12-month period of $42.75 per Bbl (WTI) and $2.48 per MMBtu (Henry Hub). |
(2) | The 92 MMBoe of revisions other than prices includes 98 MMBoe of negative PUD revisions due to reductions in our estimated capital in our five-year development plan and 6 MMBoe of positive revisions. The positive 6 MMBoe of revisions includes a net positive revision of 35 MMBoe in Wolfcamp, a net positive revision of 3 MMBoe in Altamont, a net positive revision of 1 MMBoe in non-core assets and a negative revision of 33 MMBoe in Eagle Ford. |
(3) | Of the 64 MMBoe of extensions and discoveries, 55 MMBoe are in the Wolfcamp Shale, 8 MMBoe are in the Altamont area and 1 MMBoe are in the Eagle Ford Shale. Of the 64 MMBoe of extensions and discoveries, 43 MMBoe were liquids representing 66% of EP Energy’s total extensions and discoveries. |
88
Year Ended December 31, 2015(1) | |||||||||||
Natural Gas (in Bcf) | Oil (in MBbls) | NGLs (in MBbls) | Equivalent Volumes (in MMBoe) | ||||||||
Proved developed and undeveloped reserves | |||||||||||
Beginning of year | 1,243 | 320,813 | 94,226 | 622.2 | |||||||
Revisions due to prices | (44 | ) | (16,288 | ) | (3,880 | ) | (27.5 | ) | |||
Revisions other than prices(2) | (294 | ) | (32,778 | ) | (6,422 | ) | (88.2 | ) | |||
Extensions and discoveries(3) | 100 | 41,189 | 11,065 | 68.9 | |||||||
Purchase of reserves | 9 | 7,883 | 1,252 | 10.6 | |||||||
Production | (76 | ) | (22,078 | ) | (5,366 | ) | (40.0 | ) | |||
End of year | 938 | 298,741 | 90,875 | 546.0 | |||||||
Proved developed reserves: | |||||||||||
Beginning of year | 464 | 128,396 | 32,474 | 238.1 | |||||||
End of year | 530 | 131,804 | 36,442 | 256.6 | |||||||
Proved undeveloped reserves: | |||||||||||
Beginning of year | 779 | 192,417 | 61,752 | 384.1 | |||||||
End of year | 408 | 166,937 | 54,432 | 289.4 | |||||||
(1) | Proved reserves were evaluated based on the average first day of the month spot price for the preceding 12-month period of $50.28 per Bbl (WTI) and $2.59 per MMBtu (Henry Hub). |
(2) | Of the 88 MMBoe of revisions other than prices, 85 MMBoe were negative PUD revisions due to the impact of reductions in estimated capital in our long-range development plan based on the lower price environment. |
(3) | Of the 69 MMBoe of extensions and discoveries, 18 MMBoe are in the Eagle Ford Shale, 32 MMBoe are in the Wolfcamp Shale, 19 MMBoe are in the Altamont area and less than 1 MMBoe are in the Haynesville Shale. Of the 69 MMBoe of extensions and discoveries, 52 MMBoe were liquids representing 76% of EP Energy’s total extensions and discoveries. |
Year Ended December 31, 2014(1)(2) | |||||||||||
Natural Gas (in Bcf) | Oil (in MBbls) | NGLs (in MBbls) | Equivalent Volumes (in MMBoe) | ||||||||
Proved developed and undeveloped reserves | |||||||||||
Beginning of year | 1,070 | 293,201 | 75,605 | 547.2 | |||||||
Revisions due to prices | 205 | (1,720 | ) | (538 | ) | 31.9 | |||||
Revisions other than prices | (31 | ) | (8,310 | ) | 3,702 | (9.8 | ) | ||||
Extensions and discoveries(3) | 146 | 59,242 | 19,805 | 103.3 | |||||||
Purchase of reserves | 9 | 4,079 | 1,530 | 7.1 | |||||||
Sales of reserves in place | (83 | ) | (5,615 | ) | (1,738 | ) | (21.2 | ) | |||
Production | (73 | ) | (20,064 | ) | (4,140 | ) | (36.3 | ) | |||
End of year | 1,243 | 320,813 | 94,226 | 622.2 | |||||||
Proved developed reserves: | |||||||||||
Beginning of year | 484 | 83,811 | 17,647 | 182.1 | |||||||
End of year | 464 | 128,396 | 32,474 | 238.1 | |||||||
Proved undeveloped reserves: | |||||||||||
Beginning of year | 586 | 209,391 | 57,958 | 365.1 | |||||||
End of year | 779 | 192,417 | 61,752 | 384.1 | |||||||
(1) | Proved reserves were evaluated based on the average first day of the month spot price for the preceding 12-month period of $94.99 per Bbl (WTI) and $4.34 per MMBtu (Henry Hub). |
(2) | Reflects only U.S. oil and natural gas reserves. In 2014, we sold our Brazilian operations with a December 31, 2013 balance of proved developed and undeveloped reserves of 11.6 MMBoe, during 2014 our production was (1.1) MMBoe, positive revisions of 0.4 MMBoe, for a total sales of reserves in place of (10.9) MMBoe. |
(3) | Of the 103 MMBoe of extensions and discoveries, 2 MMBoe were from assets sold, 68 MMBoe are in the Eagle Ford Shale, 19 MMBoe are in the Wolfcamp Shale, 14 MMBoe are in the Altamont area and 2 MMBoe are in the Haynesville Shale. Of the 103 MMBoe of extensions and discoveries, 79 MMBoe were liquids representing 77% of EP Energy’s total extensions and discoveries. |
89
In accordance with SEC Regulation S-X, Rule 4-10 as amended, we use the 12-month average price calculated as the unweighted arithmetic average of the spot price on the first day of each month preceding the 12-month period prior to the end of the reporting period. The first day 12-month average price used to estimate our proved reserves at December 31, 2016 was $42.75 per barrel of oil (WTI) and $2.48 per MMBtu for natural gas (Henry Hub).
All estimates of proved reserves are determined according to the rules prescribed by the SEC in existence at the time estimates were made. These rules require that the standard of “reasonable certainty” be applied to proved reserve estimates, which is defined as having a high degree of confidence that the quantities will be recovered. A high degree of confidence exists if the quantity is much more likely to be achieved than not, and, as more technical and economic data becomes available, a positive or upward revision or no revision is much more likely than a negative or downward revision. Estimates are subject to revision based upon a number of factors, including many factors beyond our control such as reservoir performance, prices, economic conditions and government restrictions. In addition, as a result of drilling, testing and production subsequent to the date of an estimate; a revision of that estimate may be necessary.
Reserve estimates are often different from the quantities of oil and natural gas that are ultimately recovered. Estimating quantities of proved oil and natural gas reserves is a complex process that involves significant interpretations and assumptions and cannot be measured in an exact manner. It requires interpretations and judgment of available technical data, including the evaluation of available geological, geophysical, and engineering data. The accuracy of any reserve estimate is highly dependent on the quality of available data, the accuracy of the assumptions on which they are based upon economic factors, such as oil and natural gas prices, production costs, severance and excise taxes, capital expenditures, workover and remedial costs, and the assumed effects of governmental regulation. In addition, due to the lack of substantial, if any, production data, there are greater uncertainties in estimating proved undeveloped reserves, proved developed non-producing reserves and proved developed reserves that are early in their production life. As a result, our reserve estimates are inherently imprecise.
The meaningfulness of reserve estimates is highly dependent on the accuracy of the assumptions on which they were based. In general, the volume of production from oil and natural gas properties we own declines as reserves are depleted. Except to the extent we conduct successful exploration and development activities or acquire additional properties containing proved reserves, or both, our proved reserves will decline as reserves are produced. Subsequent to December 31, 2016, there have been no major discoveries, favorable or otherwise, on our proved reserves volumes that may be considered to have caused a significant change in our estimated proved reserves at December 31, 2016.
90
Results of Operations. Results of operations for oil and natural gas producing activities for the years ended December 31, 2016, 2015 and 2014 (in millions):
U.S. | |||
2016 Consolidated: | |||
Net Revenues(1) — Sales to external customers | $ | 840 | |
Costs of products and services | (136 | ) | |
Production costs(2) | (203 | ) | |
Depreciation, depletion and amortization(3) | (450 | ) | |
Exploration and other expense | (5 | ) | |
46 | |||
Income tax expense | (17 | ) | |
Results of operations from producing activities | $ | 29 | |
2015 Consolidated: | |||
Net Revenues(1) — Sales to external customers | $ | 1,241 | |
Costs of products and services | (169 | ) | |
Production costs(2) | (259 | ) | |
Impairment charges | (4,297 | ) | |
Depreciation, depletion and amortization(3) | (971 | ) | |
Exploration and other expense | (20 | ) | |
(4,475 | ) | ||
Income tax benefit | 1,607 | ||
Results of operations from producing activities | $ | (2,868 | ) |
2014 Consolidated: | |||
Net Revenues(1) — Sales to external customers | $ | 2,099 | |
Costs of products and services | (147 | ) | |
Production costs(2) | (314 | ) | |
Depreciation, depletion and amortization(3) | (863 | ) | |
Exploration and other expense | (25 | ) | |
750 | |||
Income tax expense | (270 | ) | |
Results of operations from producing activities | $ | 480 | |
(1) Excludes the effects of oil and natural gas derivative contracts.
(2) Production costs include lease operating expense and production related taxes, including ad valorem and severance taxes.
(3) | Includes accretion expense on asset retirement obligations of $3 million for each of the years ended December 31, 2016, 2015 and 2014. |
91
Standardized Measure of Discounted Future Net Cash Flows. The standardized measure of discounted future net cash flows relating to our consolidated proved oil and natural gas reserves at December 31 is as follows (in millions):
U.S. | |||
2016 Consolidated: | |||
Future cash inflows(1) | $ | 10,507 | |
Future production costs | (5,061 | ) | |
Future development costs | (2,824 | ) | |
Future income tax expenses | (140 | ) | |
Future net cash flows | 2,482 | ||
10% annual discount for estimated timing of cash flows | (1,455 | ) | |
Standardized measure of discounted future net cash flows | $ | 1,027 | |
2015 Consolidated: | |||
Future cash inflows(1) | $ | 16,416 | |
Future production costs | (6,903 | ) | |
Future development costs | (4,668 | ) | |
Future income tax expenses | (280 | ) | |
Future net cash flows | 4,565 | ||
10% annual discount for estimated timing of cash flows | (2,581 | ) | |
Standardized measure of discounted future net cash flows | $ | 1,984 | |
2014 Consolidated: | |||
Future cash inflows(1) | $ | 35,028 | |
Future production costs | (9,628 | ) | |
Future development costs | (6,488 | ) | |
Future income tax expenses | (5,565 | ) | |
Future net cash flows | 13,347 | ||
10% annual discount for estimated timing of cash flows | (6,449 | ) | |
Standardized measure of discounted future net cash flows | $ | 6,898 | |
(1) | The company had no commodity-based derivative contracts designated as accounting hedges at December 31, 2016, 2015 and 2014. Amounts also exclude the impact on future net cash flows of derivatives not designated as accounting hedges. |
92
Changes in Standardized Measure of Discounted Future Net Cash Flows. The following are the principal sources of change in our consolidated worldwide standardized measure of discounted future net cash flows (in millions):
Year Ended December 31,(1) | |||||||||||
2016 | 2015 | 2014 | |||||||||
Consolidated: | |||||||||||
Sales and transfers of oil and natural gas produced net of production costs | $ | (637 | ) | $ | (982 | ) | $ | (1,785 | ) | ||
Net changes in prices and production costs | (1,068 | ) | (7,085 | ) | (762 | ) | |||||
Extensions, discoveries and improved recovery, less related costs | 57 | 145 | 1,728 | ||||||||
Changes in estimated future development costs | 1,267 | 997 | 63 | ||||||||
Previously estimated development costs incurred during the period | 281 | 835 | 1,192 | ||||||||
Revision of previous quantity estimates | (812 | ) | (1,008 | ) | 441 | ||||||
Accretion of discount | 281 | 954 | 833 | ||||||||
Net change in income taxes | 24 | 2,428 | 384 | ||||||||
Purchase of reserves in place | — | 48 | 137 | ||||||||
Sales of reserves in place | (75 | ) | — | (229 | ) | ||||||
Change in production rates, timing and other | (275 | ) | (1,246 | ) | (613 | ) | |||||
Net change | $ | (957 | ) | $ | (4,914 | ) | $ | 1,389 | |||
Representative NYMEX prices:(2) | |||||||||||
Oil (Bbl) | $ | 42.75 | $ | 50.28 | $ | 94.99 | |||||
Natural gas (MMBtu) | $ | 2.48 | $ | 2.59 | $ | 4.34 | |||||
(1) This disclosure reflects changes in the standardized measure calculation excluding the effects of hedging activities.
(2) | Average first day of the month spot price for the preceding 12-month period before price differentials and deducts. Price differentials and deducts were applied when the estimated future cash flows from estimated production from proved reserves were calculated. |
93
ITEM 9. CHANGES IN AND DISAGREEMENTS WITH ACCOUNTANTS ON ACCOUNTING AND FINANCIAL DISCLOSURE
None.
ITEM 9A. CONTROLS AND PROCEDURES
Evaluation of Disclosure Controls and Procedures
As of December 31, 2016, we carried out an evaluation under the supervision and with the participation of our management, including our Chief Executive Officer (CEO) and our Chief Financial Officer (CFO), as to the effectiveness, design and operation of our disclosure controls and procedures. This evaluation considered the various processes carried out under the direction of our disclosure committee in an effort to ensure that information required to be disclosed in the U.S. Securities and Exchange Commission reports we file or submit under the Exchange Act is accurate, complete and timely. Our management, including our CEO and our CFO, does not expect that our disclosure controls and procedures or our internal controls will prevent and/or detect all errors and all fraud. A control system, no matter how well conceived and operated, can provide only reasonable, not absolute, assurance that the objectives of the control system are met. Further, the design of a control system must reflect the fact that there are resource constraints, and the benefits of controls must be considered relative to their costs. Because of the inherent limitations in all control systems, no evaluation of controls can provide absolute assurance that all control issues and instances of fraud, if any, within our company have been detected. Our disclosure controls and procedures are designed to provide reasonable assurance of achieving their objectives and our CEO and CFO concluded that our disclosure controls and procedures (as defined in Exchange Act Rules 13a-15(e) and 15d-15(e)) were effective as of December 31, 2016. See Item 8, “Financial Statements and Supplementary Data” under Management’s Annual Report on Internal Control Over Financial Reporting.
Changes in Internal Control over Financial Reporting
There were no changes in our internal control over financial reporting during the fourth quarter of 2016 that have materially affected or are reasonably likely to materially affect our internal control over financial reporting.
ITEM 9B. OTHER INFORMATION
None.
94
PART III
Item 10. Directors, Executive Officers and Corporate Governance
Pursuant to General Instruction G(3) to Form 10-K, we incorporate by reference into this Item the information to be disclosed in our definitive proxy statement for our 2017 Annual Meeting of Stockholders.
Item 11. Executive Compensation
Pursuant to General Instruction G(3) to Form 10-K, we incorporate by reference into this Item the information to be disclosed in our definitive proxy statement for our 2017 Annual Meeting of Stockholders.
Item 12. Security Ownership of Certain Beneficial Owners and Management and Related Stockholder Matters
Pursuant to General Instruction G(3) to Form 10-K, we incorporate by reference into this Item the information to be disclosed in our definitive proxy statement for our 2017 Annual Meeting of Stockholders.
Item 13. Certain Relationships and Related Transactions and Director Independence
Pursuant to General Instruction G(3) to Form 10-K, we incorporate by reference into this Item the information to be disclosed in our definitive proxy statement for our 2017 Annual Meeting of Stockholders.
Item 14. Principal Accountant Fees and Services
Pursuant to General Instruction G(3) to Form 10-K, we incorporate by reference into this Item the information to be disclosed in our definitive proxy statement for our 2017 Annual Meeting of Stockholders.
95
PART IV
ITEM 15. EXHIBITS AND FINANCIAL STATEMENT SCHEDULES
(a) The following documents are filed as a part of this report:
1. Financial statements: Refer to Item 8. “Financial Statements and Supplementary Data” in this Annual Report on Form 10-K.
2. Financial statement schedules: Refer to Item 8. “Financial Statements and Supplementary Data” in this Annual Report on Form 10-K.
Page | |||
3. and (b). Exhibits | 98 | ||
The Exhibit Index, which follows the signature page to this report and is hereby incorporated herein by reference, sets forth a list of those exhibits filed herewith, and includes and identifies management contracts or compensatory plans or arrangements required to be filed as exhibits to this Form 10-K by Item 601(b)(10)(iii) of Regulation S-K.
The agreements included as exhibits to this report are intended to provide information regarding their terms and not to provide any other factual or disclosure information about us or the other parties to the agreements. The agreements may contain representations and warranties by the parties to the agreements, including us, solely for the benefit of the other parties to the applicable agreements and:
•should not in all instances be treated as categorical statements of fact, but rather as a way of allocating the risk to one of the parties if those statements prove to be inaccurate;
•may have been qualified by disclosures that were made to the other party in connection with the negotiation of the applicable agreement, which disclosures are not necessarily reflected in the agreement;
•may apply standards of materiality in a way that is different from what may be viewed as material to certain investors; and
•were made only as of the date of the applicable agreement or such other date or dates as may be specified in the agreement and are subject to more recent developments. Accordingly, these representations and warranties may not describe the actual state of affairs as of the date they were made or at any other time.
(c) Financial statement schedules
Financial statement schedules have been omitted because they are either not required or not applicable.
96
SIGNATURES
Pursuant to the requirements of Section 13 or 15(d) of the Securities Exchange Act of 1934, EP Energy Corporation has duly caused this report to be signed on its behalf by the undersigned, thereunto duly authorized on the 2nd day of March 2017.
EP ENERGY CORPORATION | ||
By: | /s/ Brent J. Smolik | |
Brent J. Smolik | ||
President and Chief Executive Officer | ||
Pursuant to the requirements of the Securities Exchange Act of 1934, this report has been signed below by the following persons on behalf of EP Energy Corporation and in the capacities and on the dates indicated:
Signature | Title | Date | ||
/s/ Brent J. Smolik | ||||
Brent J. Smolik | President and Chief Executive Officer and Chairman of the Board (Principal Executive Officer) | March 2, 2017 | ||
/s/ Dane E. Whitehead | ||||
Dane E. Whitehead | Executive Vice President and Chief Financial Officer (Principal Financial Officer) | March 2, 2017 | ||
/s/ Francis C. Olmsted III | ||||
Francis C. Olmsted III | Vice President and Chief Accounting Officer (Principal Accounting Officer) | March 2, 2017 | ||
/s/ Gregory A. Beard | ||||
Gregory A. Beard | Director | March 2, 2017 | ||
/s/ Scott R. Browning | ||||
Scott R. Browning | Director | March 2, 2017 | ||
/s/ Wilson B. Handler | ||||
Wilson B. Handler | Director | March 2, 2017 | ||
/s/ John J. Hannan | ||||
John J. Hannan | Director | March 2, 2017 | ||
/s/ Michael S. Helfer | ||||
Michael S. Helfer | Director | March 2, 2017 | ||
/s/ Thomas R. Hix | ||||
Thomas R. Hix | Director | March 2, 2017 | ||
/s/ Keith O. Rattie | ||||
Keith O. Rattie | Director | March 2, 2017 | ||
/s/ M. Cliff Ryan Jr. | ||||
M. Cliff Ryan Jr. | Director | March 2, 2017 | ||
/s/ Giljoon Sinn | ||||
Giljoon Sinn | Director | March 2, 2017 | ||
/s/ Robert M. Tichio | ||||
Robert M. Tichio | Director | March 2, 2017 | ||
/s/ Donald A. Wagner | ||||
Donald A. Wagner | Director | March 2, 2017 | ||
/s/ Rakesh Wilson | ||||
Rakesh Wilson | Director | March 2, 2017 | ||
97
EP ENERGY CORPORATION
EXHIBIT INDEX
Each exhibit identified below is filed as part of this report. Exhibits filed with this Report are designated by “*”. All exhibits not so designated are incorporated herein by reference to a prior filing as indicated. Exhibits designated with a “+” constitute a management contract or compensatory plan or arrangement. Exhibits designated with a “†” indicate that a confidential treatment has been granted with respect to certain portions of the exhibit. Omitted portions have been filed separately with the SEC.
Exhibit No. | Exhibit Description | |
2.1 | Purchase and Sale Agreement among EP Energy Corporation, EP Energy Holding Company and El Paso Brazil, L.L.C., as sellers, and EPE Acquisition, LLC, as purchaser, dated as of February 24, 2012 (Exhibit 2.1 to EP Energy LLC’s Registration Statement on Form S-4, filed with the SEC on September 11, 2012). | |
2.2 | Amendment No. 1 to Purchase and Sale Agreement, dated as of April 16, 2012, among EP Energy, L.L.C. (f/k/a EP Energy Corporation), EP Energy Holding Company, El Paso Brazil, L.L.C. and EPE Acquisition, LLC (Exhibit 2.2 to EP Energy LLC’s Registration Statement on Form S-4, filed with the SEC on September 11, 2012). | |
2.3 | Amendment No. 2 to Purchase and Sale Agreement, dated as of May 24, 2012, among EP Energy, L.L.C. (f/k/a EP Energy Corporation), EP Energy Holding Company, El Paso Brazil, L.L.C., EP Production International Cayman Company, EPE Acquisition, LLC and solely for purposes of Sections 2 and 5 thereunder, El Paso LLC (Exhibit 2.3 to EP Energy LLC’s Registration Statement on Form S-4, filed with the SEC on September 11, 2012). | |
2.4 | Purchase and Sale Agreement, dated as of March 18, 2016, by and among EP Energy E&P Company, L.P., EP Energy Management, L.L.C., and Crystal E&P Company, L.L.C., as Seller and Covey Park Gas LLC (Exhibit 2.1 to Company’s Current Report on Form 8-K, filed with the SEC on May 4, 2016). | |
2.5* | Participation and Development Agreement, dated as of January 24, 2017, by and among EP Energy E&P Company, L.P. and Wolfcamp DrillCo Operating L.P. | |
2.6* | Letter Agreement, dated as of January 24, 2017, by and among EP Energy E&P Company, L.P. and Wolfcamp DrillCo Operating L.P. | |
3.1 | Second Amended and Restated Certificate of Incorporation of EP Energy Corporation (Exhibit 3.1 to Company’s Current Report on Form 8-K, filed with the SEC on January 23, 2014). | |
3.2 | Amended and Restated Bylaws of EP Energy Corporation (Exhibit 3.2 to Company’s Current Report on Form 8-K, filed with the SEC on January 23, 2014). | |
4.1 | Indenture, dated as of April 24, 2012, between EP Energy LLC (f/k/a Everest Acquisition LLC) and Everest Acquisition Finance Inc., as Co-Issuers, and Wilmington Trust, National Association, as Trustee, in respect of 9.375% Senior Notes due 2020 (Exhibit 4.2 to EP Energy LLC’s Registration Statement on Form S-4, filed with the SEC on September 11, 2012). | |
4.2 | Indenture, dated as of August 13, 2012, between EP Energy LLC and Everest Acquisition Finance Inc., as Co-Issuers, and Wilmington Trust, National Association, as Trustee, in respect of 7.750% Senior Notes due 2022 (Exhibit 4.3 to EP Energy LLC’s Registration Statement on Form S-4, filed with the SEC on September 11, 2012). | |
4.3 | Indenture, dated as of May 28, 2015, between EP Energy LLC and Everest Acquisition Finance Inc., as Co-Issuers, and Wilmington Trust, National Association, as Trustee, in respect of 6.375% Senior Notes due 2023 (Exhibit 4.3 to EP Energy LLC’s Registration Statement on Form S-4, filed with the SEC on June 24, 2015). | |
4.4 | Indenture, dated as of November 29, 2016, by and among EP Energy LLC, Everest Acquisition Finance Inc., the Guarantors party thereto and Wilmington Trust, National Association, as trustee and collateral agent (Exhibit 4.1 to Company’s Current Report on Form 8-K, filed with the SEC on November 30, 2016). | |
4.5 | Registration Rights Agreement, dated as of May 28, 2015, between EP Energy LLC, Everest Acquisition Finance Inc. and RBC Capital Markets, LLC, as representative of the several initial purchasers, in respect of 6.375% Senior Notes due 2023 (Exhibit 4.5 to EP Energy LLC’s Registration Statement on Form S-4, filed with the SEC on June 24, 2015). | |
4.6 | Registration Rights Agreement, dated as of April 24, 2012, between EP Energy LLC (f/k/a Everest Acquisition LLC), Everest Acquisition Finance Inc. and Citigroup Global Markets Inc. and J.P. Morgan Securities LLC, as representatives of the several initial purchasers, in respect of 9.375% Senior Notes due 2020 (Exhibit 4.5 to EP Energy LLC’s Registration Statement on Form S-4, filed with the SEC on September 11, 2012). | |
98
Exhibit No. | Exhibit Description | |
4.7 | Registration Rights Agreement, dated as of August 13, 2012, between EP Energy LLC, Everest Acquisition Finance Inc. and Citigroup Global Markets Inc., as representative of the several initial purchasers, in respect of 7.750% Senior Notes due 2022 (Exhibit 4.6 to EP Energy LLC’s Registration Statement on Form S-4, filed with the SEC on September 11, 2012). | |
4.8 | Registration Rights Agreement, dated as of August 30, 2013, between EP Energy Corporation and the stockholders party thereto (Exhibit 4.8 to the Company’s Registration Statement on Form S-1, filed with the SEC on September 4, 2013). | |
10.1 | Credit Agreement, dated as of May 24, 2012, by and among EPE Holdings, LLC, as Holdings, EP Energy LLC (f/k/a Everest Acquisition LLC), as the Borrower, the Lenders party thereto, JPMorgan Chase Bank, N.A., as Administrative Agent and Collateral Agent, and the other parties party thereto (Exhibit 10.1 to EP Energy LLC’s Registration Statement on Form S-4, filed with the SEC on September 11, 2012). | |
10.2 | Guarantee Agreement, dated as of May 24, 2012, by and among EPE Holdings LLC, the Domestic Subsidiaries of the Borrower signatory thereto and JPMorgan Chase Bank, N.A., as collateral agent for the Secured Parties referred to therein (Exhibit 10.2 to EP Energy LLC’s Registration Statement on Form S-4, filed with the SEC on September 11, 2012). | |
10.3 | Collateral Agreement, dated as of May 24, 2012, by and among EPE Holdings LLC, EP Energy LLC (f/k/a Everest Acquisition LLC), each Subsidiary of EP Energy LLC identified therein and JPMorgan Chase Bank, N.A., as Collateral Agent (Exhibit 10.3 to EP Energy LLC’s Registration Statement on Form S-4, filed with the SEC on September 11, 2012). | |
10.4 | Pledge Agreement, dated as of May 24, 2012, by and among EP Energy LLC (f/k/a Everest Acquisition LLC), each Subsidiary of EP Energy LLC identified therein and JPMorgan Chase Bank, N.A., as Collateral Agent (Exhibit 10.4 to EP Energy LLC’s Registration Statement on Form S-4, filed with the SEC on September 11, 2012). | |
10.5 | Pledge Agreement, dated as of May 24, 2012, by and among El Paso Brazil, L.L.C., as Pledgor, and JPMorgan Chase Bank, N.A., as Collateral Agent (Exhibit 10.5 to EP Energy LLC’s Registration Statement on Form S-4, filed with the SEC on September 11, 2012). | |
10.6 | Amendment, dated as of August 17, 2012, to the Credit Agreement, dated as of May 24, 2012, among EPE Holdings LLC, EP Energy LLC, the lenders party thereto and JPMorgan Chase Bank, N.A., as administrative agent and collateral agent (Exhibit 10.15 to EP Energy LLC’s Registration Statement on Form S-4, filed with the SEC on September 11, 2012). | |
10.7 | Second Amendment, dated as of March 27, 2013, to the Credit Agreement, dated as of May 24, 2012, among EPE Holdings LLC, EP Energy LLC, the lenders party thereto and JPMorgan Chase Bank, N.A., as administrative agent and collateral agent (Exhibit 10.1 to EP Energy LLC’s Quarterly Report on Form 10-Q for the quarterly period ended March 31, 2013, filed with the SEC on May 9, 2013). | |
10.8 | Third Amendment, dated as of October 27, 2014, to the Credit Agreement, dated as of May 24, 2012, among EPE Acquisition, LLC, EP Energy LLC, the lenders party thereto and JPMorgan Chase Bank, N.A., as administrative agent and collateral agent (Exhibit 10.1 to Company’s Quarterly Report on Form 10-Q for the quarterly period ended March 31, 2013, filed with the SEC on April 30, 2015). | |
10.9 | Fourth Amendment, dated as of April 6, 2014, to the Credit Agreement, dated as of May 24, 2012, among EPE Acquisition, LLC, EP Energy LLC, the lenders party thereto and JPMorgan Chase Bank, N.A., as administrative agent and collateral agent (Exhibit 10.1 to Company’s Current Report on Form 8-K, filed with the SEC on April 6, 2015). | |
10.10 | Fifth Amendment, dated as of May 2, 2016, to the Credit Agreement, dated as of May 24, 2012, among EPE Acquisition, LLC, EP Energy LLC, the lenders party thereto and JPMorgan Chase Bank, N.A., as administrative agent and collateral agent (Exhibit 10.1 to Company’s Current Report on Form 8-K, filed with the SEC on May 6, 2016). | |
10.11 | Consent and Agreement to Credit Agreement, dated as of June 7, 2013, among EPE Holdings LLC, EP Energy LLC, the lenders party thereto and JPMorgan Chase Bank, N.A., as administrative agent and collateral agent (Exhibit 10.3 to EP Energy LLC’s Quarterly Report on Form 10-Q for the quarterly period ended June 30, 2013, filed with the SEC on August 14, 2013). | |
10.12 | Assumption and Ratification Agreement, dated as of April 30, 2014, entered into by EPE Acquisition, LLC, in favor of the Secured Parties (as defined in the Credit Agreement) (Exhibit 10.9 to Company’s Annual Report on Form 10-K filed with the SEC on February 23, 2015). | |
10.13 | Senior Lien Intercreditor Agreement, dated as of May 24, 2012, among JPMorgan Chase Bank, N.A., as RBL Facility Agent and Applicable First Lien Agent, Citibank, N.A., as Term Facility Agent, Senior Secured Notes Collateral Agent and Applicable Second Lien Agent, Wilmington Trust, National Association, as Trustee under the Senior Secured Notes Indenture, EP Energy LLC and the Subsidiaries of EP Energy LLC named therein (Exhibit 10.6 to EP Energy LLC’s Registration Statement on Form S-4, filed with the SEC on September 11, 2012). | |
Exhibit No. | Exhibit Description | |
99
10.14 | Term Loan Agreement, dated as of April 24, 2012, by and among EP Energy LLC (f/k/a Everest Acquisition LLC), as Borrower, the Lenders party thereto, Citibank, N.A., as Administrative Agent and Collateral Agent, and Citigroup Global Markets Inc. and J.P. Morgan Securities LLC, as Co-Lead Arrangers (Exhibit 10.7 to EP Energy LLC’s Registration Statement on Form S-4, filed with the SEC on September 11, 2012). | |
10.15 | Guarantee Agreement, dated as of April 24, 2012, by and between Everest Acquisition Finance Inc., as Guarantor, and Citibank, N.A., as collateral agent for the Secured Parties referred to therein (Exhibit 10.8 to EP Energy LLC’s Registration Statement on Form S-4, filed with the SEC on September 11, 2012). | |
10.16 | Collateral Agreement, dated as of May 24, 2012, by and among EP Energy LLC (f/k/a Everest Acquisition LLC), each Subsidiary of EP Energy LLC identified therein and Citibank, N.A., as Collateral Agent (Exhibit 10.9 to EP Energy LLC’s Registration Statement on Form S-4, filed with the SEC on September 11, 2012). | |
10.17 | Pledge Agreement, dated as of May 24, 2012, by and among EP Energy LLC (f/k/a Everest Acquisition LLC), each Subsidiary of EP Energy LLC identified therein and Citibank, N.A., as Collateral Agent (Exhibit 10.10 to EP Energy LLC’s Registration Statement on Form S-4, filed with the SEC on September 11, 2012). | |
10.18 | Amendment No. 1, dated as of August 21, 2012, to the Term Loan Agreement, dated as of April 24, 2012, among EP Energy LLC, the lenders party thereto and Citibank, N.A., as administrative agent and collateral agent (Exhibit 10.16 to EP Energy LLC’s Registration Statement on Form S-4, filed with the SEC on September 11, 2012). | |
10.19 | Joinder Agreement, dated as of August 21, 2012, among Citibank, N.A., as Additional Tranche B-1 Lender, EP Energy LLC and Citibank, N.A., as administrative agent (Exhibit 10.17 to EP Energy LLC’s Registration Statement on Form S-4, filed with the SEC on September 11, 2012). | |
10.20 | Incremental Facility Agreement, dated October 31, 2012, to the Term Loan Agreement, dated as of April 24, 2012 and amended by that certain Amendment No. 1 dated as of August 21, 2012, among EP Energy LLC, the lenders from time to time party thereto and Citibank, N.A., as administrative agent and collateral agent (Exhibit 10.1 to EP Energy LLC’s Current Report on Form 8-K, filed with the SEC on October 31, 2012). | |
10.21 | Reaffirmation Agreement, dated as of October 31, 2012, among EP Energy LLC, each Subsidiary Party party thereto and Citibank, N.A., as administrative agent and collateral agent (Exhibit 10.2 to EP Energy LLC’s Current Report on Form 8-K, filed with the SEC on October 31, 2012). | |
10.22 | Amendment No. 2, dated as of May 2, 2013, to the Term Loan Agreement, dated as of April 24, 2012, among EP Energy LLC, the lenders party thereto and Citibank, N.A., as administrative agent and collateral agent (Exhibit 10.1 to EP Energy LLC’s Current Report on Form 8-K filed with the SEC on May 28, 2013). | |
10.23 | Joinder Agreement, dated as of May 2, 2013, among Citibank, N.A., as Additional Tranche B-1 Lender, EP Energy LLC and Citibank, N.A., as administrative agent (Exhibit 10.2 to EP Energy LLC’s Current Report on Form 8-K filed with the SEC on May 28, 2013). | |
10.24 | Pari Passu Intercreditor Agreement, dated as of May 24, 2012, among Citibank, N.A., as Second Lien Agent, Citibank, N.A., as Authorized Representative for the Term Loan Agreement, Wilmington Trust, National Association, as the Initial Other Authorized Representative and each additional Authorized Representative from time to time party hereto (Exhibit 10.12 to EP Energy LLC’s Registration Statement on Form S-4, filed with the SEC on September 11, 2012). | |
10.25 | Consent and Exchange Agreement, dated as of August 24, 2016, among EP Energy LLC, the other credit parties party thereto, the lenders party thereto, the additional lender party thereto, and Citibank, N.A. (Exhibit 10.1 to Company’s Current Report on Form 8-K, filed with the SEC on August 26, 2016). | |
10.26 | Guarantee Agreement, dated as of August 24, 2016, among each Subsidiary of EP Energy LLC listed therein and Citibank, N.A., as collateral agent (Exhibit 10.2 to Company’s Current Report on Form 8-K, filed with the SEC on August 26, 2016). | |
10.27 | Collateral Agreement, dated as of August 24, 2016, among EP Energy LLC, each Subsidiary of EP Energy LLC identified therein and Citibank, N.A., as collateral agent (Exhibit 10.3 to Company’s Current Report on Form 8-K, filed with the SEC on August 26, 2016). | |
10.28 | Pledge Agreement, dated as of August 24, 2016, among EP Energy LLC, each Subsidiary of EP Energy LLC identified therein and Citibank, N.A., as collateral agent (Exhibit 10.4 to Company’s Current Report on Form 8-K, filed with the SEC on August 26, 2016). | |
10.29 | Amended and Restated Senior Lien Intercreditor Agreement, dated as of August 24, 2016, among JP Morgan Chase Bank, N.A., as RBL Facility Agent and Applicable First Lien Agent, Citibank, N.A., as Term Facility Agent and Applicable Second Lien Agent, Citibank, N.A., as Priority Lien Term Facility Agent, EP Energy LLC and the Subsidiaries of EP Energy LLC named therein (Exhibit 10.5 to Company’s Current Report on Form 8-K, filed with the SEC on August 26, 2016). | |
Exhibit No. | Exhibit Description | |
100
10.30 | Priority Lien Intercreditor Agreement, dated as of August 24, 2016, among JP Morgan Chase Bank, N.A., as RBL Facility Agent and Applicable First Lien Agent, Citibank, N.A., as Term Facility Agent and Applicable Second Lien Agent, EP Energy LLC and the Subsidiaries of EP Energy LLC named therein (Exhibit 10.6 to Company’s Current Report on Form 8-K, filed with the SEC on August 26, 2016). | |
10.31 | Additional Priority Lien Intercreditor Agreement, dated as of November 29, 2016, by and among JPMorgan Chase Bank, N.A., as RBL Facility Agent and Applicable First Lien Agent, Wilmington Trust, National Association, as Notes Facility Agent and Applicable Second Lien Agent, EP Energy LLC and the Subsidiaries of EP Energy LLC named therein (Exhibit 10.1 to Company’s Current Report on Form 8-K filed with the SEC on November 30, 2016). | |
10.32 | Consent and Acknowledgement, dated as of November 29, 2016, by Wilmington Trust, National Association, as an Other First-Priority Lien Obligations Agent, and acknowledged by JPMorgan Chase Bank, N.A., as Applicable First Lien Agent, Citibank, N.A., as Applicable Second Lien Agent, and EP Energy LLC, with respect to the Priority Lien Intercreditor Agreement dated as of August 24, 2016 (Exhibit 10.2 to Company’s Current Report on Form 8-K filed with the SEC on November 30, 2016). | |
10.33 | Consent and Acknowledgement, dated as of November 29, 2016, by Wilmington Trust, National Association, as an Other First-Priority Lien Obligations Agent, and acknowledged by JPMorgan Chase Bank, N.A., as Applicable First Lien Agent, Citibank, N.A., as Applicable Second Lien Agent, and EP Energy LLC, with respect to the Amended and Restated Senior Lien Intercreditor Agreement dated as of August 24, 2016 (Exhibit 10.3 to Company’s Current Report on Form 8-K filed with the SEC on November 30, 2016). | |
10.34 | Collateral Agreement, dated as of November 29, 2016, by and among EP Energy LLC, the Subsidiaries of EP Energy LLC party thereto and Wilmington Trust, National Association, as collateral agent (Exhibit 10.4 to Company’s Current Report on Form 8-K filed with the SEC on November 30, 2016). | |
10.35 | Pledge Agreement, dated as of November 29, 2016, by and among EP Energy LLC, the Subsidiaries of EP Energy LLC party thereto and Wilmington Trust, National Association, as collateral agent (Exhibit 10.5 to Company’s Current Report on Form 8-K filed with the SEC on November 30, 2016). | |
10.36 | Amended and Restated Management Fee Agreement, dated as of December 20, 2013, among EP Energy Corporation, EP Energy Global LLC, EPE Acquisition, LLC, Apollo Management VII, L.P., Apollo Commodities Management, L.P., With Respect to Series I, Riverstone V Everest Holdings, L.P., Access Industries, Inc. and Korea National Oil Corporation (Exhibit 10.23 to Amendment No. 4 to the Company’s Registration Statement on Form S-1, filed with the SEC on January 6, 2014). | |
10.37+ | Employment Agreement dated May 24, 2012 for Clayton A. Carrell (Exhibit 10.18 to EP Energy LLC’s Registration Statement on Form S-4, filed with the SEC on September 11, 2012). | |
10.38+ | Employment Agreement dated May 24, 2012 for Brent J. Smolik (Exhibit 10.20 to EP Energy LLC’s Registration Statement on Form S-4, filed with the SEC on September 11, 2012). | |
10.39+ | Employment Agreement dated May 24, 2012 for Dane E. Whitehead (Exhibit 10.21 to EP Energy LLC’s Registration Statement on Form S-4, filed with the SEC on September 11, 2012). | |
10.40+ | Employment Agreement dated May 24, 2012 for Marguerite N. Woung-Chapman (Exhibit 10.22 to EP Energy LLC’s Registration Statement on Form S-4, filed with the SEC on September 11, 2012). | |
10.41+ | Employment Agreement dated May 24, 2012 for Joan M. Gallagher (Exhibit 10.30 to Company’s Annual Report on Form 10-K filed with the SEC on February 23, 2015). | |
10.42+ | Senior Executive Survivor Benefit Plan adopted as of May 24, 2012 (Exhibit 10.23 to EP Energy LLC’s Registration Statement on Form S-4, filed with the SEC on September 11, 2012). | |
10.43+ | Management Incentive Plan Agreement, dated as of August 30, 2013, between EP Energy Corporation and EPE Employee Holdings, LLC (Exhibit 10.31 to Amendment No. 2 to the Company’s Registration Statement on Form S-1, filed with the SEC on November 1, 2013).† | |
10.44+ | Form of EPE Employee Holdings, LLC Management Incentive Unit Agreement (Exhibit 10.26 to EP Energy LLC’s Registration Statement on Form S-4 filed with the SEC on September 11, 2012). | |
10.45+ | Form of Notice to MIPs Holders regarding Corporate Reorganization (Exhibit 10.33 to the Company’s Registration Statement on Form S-1, filed with the SEC on September 4, 2013). | |
10.46+ | Third Amended and Restated Limited Liability Company Agreement of EPE Employee Holdings, LLC dated as of August 30, 2013 (Exhibit 10.34 to Amendment No. 2 to the Company’s Registration Statement on Form S-1, filed with the SEC on November 1, 2013).† | |
10.47+ | Form of EP Energy Employee Holdings II, LLC Class B Incentive Pool Program Award Agreement (Exhibit 10.37 to Amendment No. 1 to the Company’s Registration Statement on Form S-1, filed with the SEC on October 11, 2013). | |
Exhibit No. | Exhibit Description | |
10.48+ | EP Energy Corporation 2014 Omnibus Incentive Plan, as amended and restated effective May 11, 2016 (Exhibit 10.1 to EP Energy Corporation’s Current Report on Form 8-K, filed with the SEC on May 13, 2016). | |
101
10.49+ | Form of Notice Stock Option Grant and Stock Option Award Agreement under EP Energy Corporation 2014 Omnibus Incentive Plan (Exhibit 10.39 to Company’s Annual Report on Form 10-K filed with the SEC on February 27, 2014). | |
10.50+ | Form of Notice Restricted Stock Grant and Restricted Stock Award Agreement under EP Energy Corporation 2014 Omnibus Incentive Plan (Exhibit 10.40 to Company’s Annual Report on Form 10-K filed with the SEC on February 27, 2014). | |
10.51+ | Form of Performance Unit Award Agreement under EP Energy Corporation 2014 Omnibus Incentive Plan. (Exhibit 10.42 to Company’s Annual Report on Form 10-K filed with the SEC on February 22, 2016). | |
10.52+* | Form of 2017 Performance Unit Award Agreement under EP Energy Corporation 2014 Omnibus Incentive Plan. | |
10.53 | Stockholders Agreement, dated as of August 30, 2013, between EP Energy Corporation and the stockholders party thereto (Exhibit 10.39 to Amendment No. 1 to the Company’s Registration Statement on Form S-1, filed with the SEC on October 11, 2013). | |
10.54 | Addendum Agreement, dated as of September 18, 2013, to the Stockholders Agreement, between EP Energy Corporation and EP Energy Employee Holdings II, LLC (Exhibit 10.40 to Amendment No. 1 to the Company’s Registration Statement on Form S-1, filed with the SEC on October 11, 2013). | |
10.55 | Form of Director and Officer Indemnification Agreement between EP Energy Corporation and each of the officers and directors thereof (Exhibit 10.41 to Amendment No. 4 to the Company’s Registration Statement on Form S-1, filed with the SEC on January 6, 2014). | |
12.1* | Ratio of Earnings to Fixed Charges | |
21.1* | Subsidiaries of EP Energy Corporation. | |
23.1* | Consent of Ernst & Young LLP, an independent registered public accounting firm. | |
23.2* | Consent of Ryder Scott Company, L.P. | |
31.1* | Certification of Chief Executive Officer pursuant to Section 302 of the Sarbanes-Oxley Act of 2002. | |
31.2* | Certification of Chief Financial Officer pursuant to Section 302 of the Sarbanes-Oxley Act of 2002. | |
32.1* | Certification of Chief Executive Officer pursuant to Section 906 of the Sarbanes-Oxley Act of 2002. | |
32.2* | Certification of Chief Financial Officer pursuant to Section 906 of the Sarbanes-Oxley Act of 2002. | |
99.1* | Ryder Scott Company, L.P. reserve audit report for EP Energy Corporation as of December 31, 2016. | |
101.INS* | XBRL Instance Document. | |
101.SCH* | XBRL Schema Document. | |
101.CAL* | XBRL Calculation Linkbase Document. | |
101.DEF* | XBRL Definition Linkbase Document. | |
101.LAB* | XBRL Labels Linkbase Document. | |
101.PRE* | XBRL Presentation Linkbase Document. | |
102