Attached files
| file | filename |
|---|---|
| EX-99.2 - EX-99.2 - GigPeak, Inc. | d92864dex992.htm |
| 8-K - 8-K - GigPeak, Inc. | d92864d8k.htm |
Exhibit 99.1
|
|
NYSE MKT: GIG
Powering High Speed Networks
August, 2015
© 2015 GigOptix, Inc. All Rights Reserved
|
|
Disclaimer
Forward Looking Statements:
This presentation contains statements regarding operating trends, future results, new projects, and other market, business and product trends that are forward-looking. We undertake no obligation to update or revise the forward-looking statements, whether as a result of new information, future events or otherwise. Additional factors that could cause actual results to differ are discussed under the heading “Risk Factors” and in other sections of the GigOptix filings with the SEC, and in GigOptix’s other current and periodic reports filed or furnished from time to time with the SEC.
Use of Non-GAAP and Adjusted EBITDA Financial Measures:
These materials include references to non-GAAP revenue, non-GAAP net income/loss, Adjusted consolidated non-GAAP net income/loss, and Adjusted EBITDA. GigOptix believes that these non-GAAP financial measures are important indicators of the ongoing operations of its business and provide better comparability between reporting periods and provide a better baseline for analyzing trends in GigOptix’s operations. GigOptix does not, nor does it suggest that investors should, consider such non-GAAP and Adjusted EBITDA financial measures in isolation from, or as a substitute for, financial information prepared in accordance with GAAP. GigOptix believes the disclosure of the effects of these items increases the reader’s understanding of the underlying performance of the business and that such non-GAAP and Adjusted EBITDA financial measures provide investors with an additional tool to evaluate our financial results and assess our prospects for future performance.
2 © 2015 GigOptix, Inc. All Rights Reserved
|
|
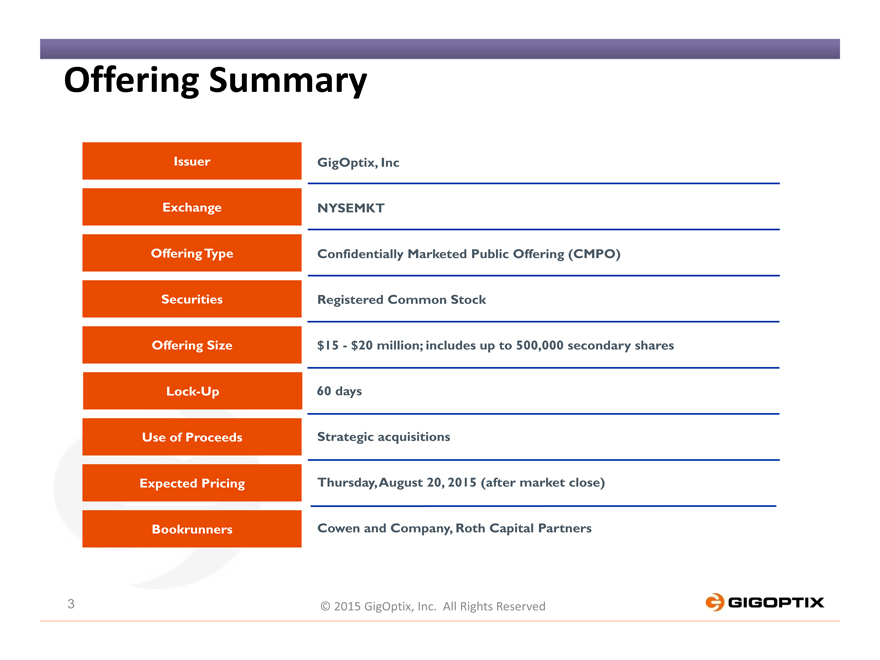
Offering Summary
Issuer GigOptix, Inc
Exchange NYSEMKT
Offering Type Confidentially Marketed Public Offering (CMPO)
Securities Registered Common Stock
Offering Size $15—$20 million; includes up to 500,000 secondary shares Lock-Up 60 days Use of Proceeds Strategic acquisitions Expected Pricing Thursday, August 20, 2015 (after market close) Bookrunners Cowen and Company, Roth Capital Partners
3 © 2015 GigOptix, Inc. All Rights Reserved
|
|
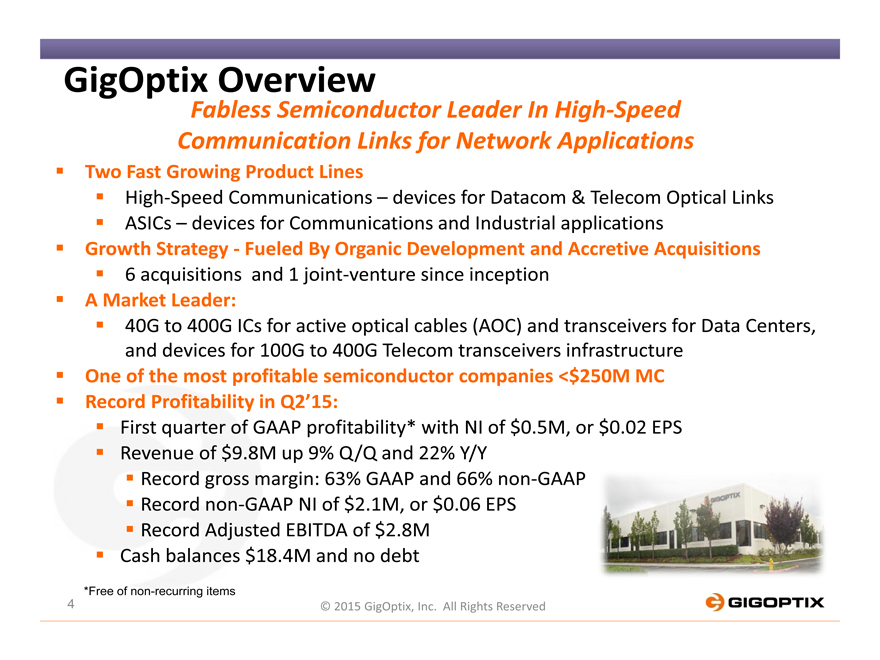
GigOptix Overview
Fabless Semiconductor Leader In High-Speed Communication Links for Network Applications
Two Fast Growing Product Lines
High-Speed Communications – devices for Datacom & Telecom Optical Links ASICs – devices for Communications and Industrial applications
Growth Strategy—Fueled By Organic Development and Accretive Acquisitions
6 acquisitions and 1 joint-venture since inception
A Market Leader:
40G to 400G ICs for active optical cables (AOC) and transceivers for Data Centers, and devices for 100G 400G Telecom transceivers infrastructure
One of the most profitable semiconductor companies <$250M MC
Record Profitability in Q2’15:
First quarter of GAAP profitability* with NI of $0.5M, or $0.02 EPS Revenue of $9.8M up 9% Q/Q and 22% Y/Y
Record gross margin: 63% GAAP and 66% non-GAAP ??Record non-GAAP NI of $2.1M, or $0.06 EPS Record Adjusted EBITDA of $2.8M
Cash balances $18.4M and no debt
*Free of non-recurring items
4 © 2015 GigOptix, Inc. All Rights Reserved
|
|
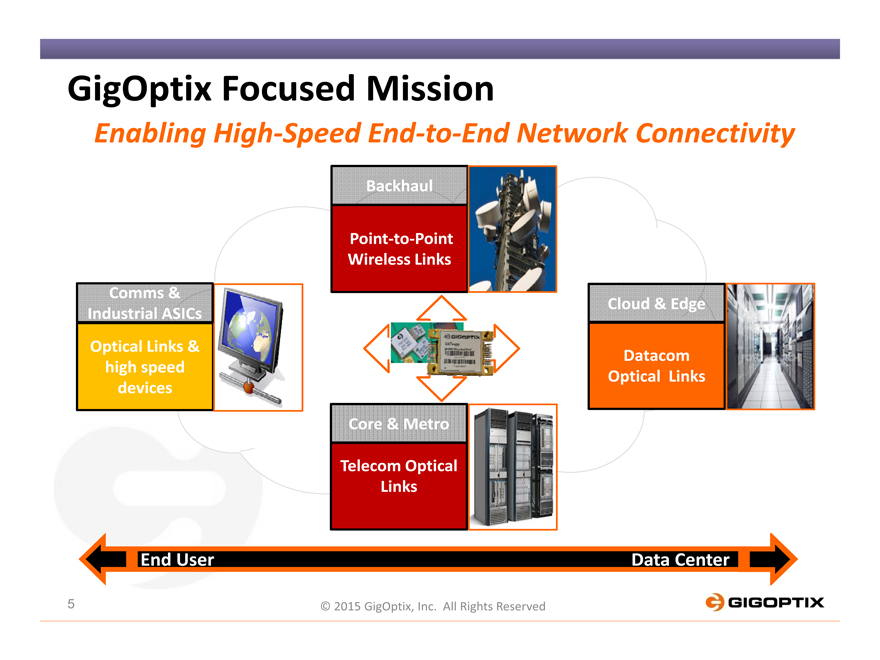
GigOptix Focused Mission
Enabling High-Speed End-to-End Network Connectivity
Backhaul
Point-to-Point Wireless Links Comms &
Cloud & Edge Industrial ASICs
Optical Links &
Datacom high speed Optical Links devices
Core & Metro
Telecom Optical Links
End User Data Center
5 © 2015 GigOptix, Inc. All Rights Reserved
|
|
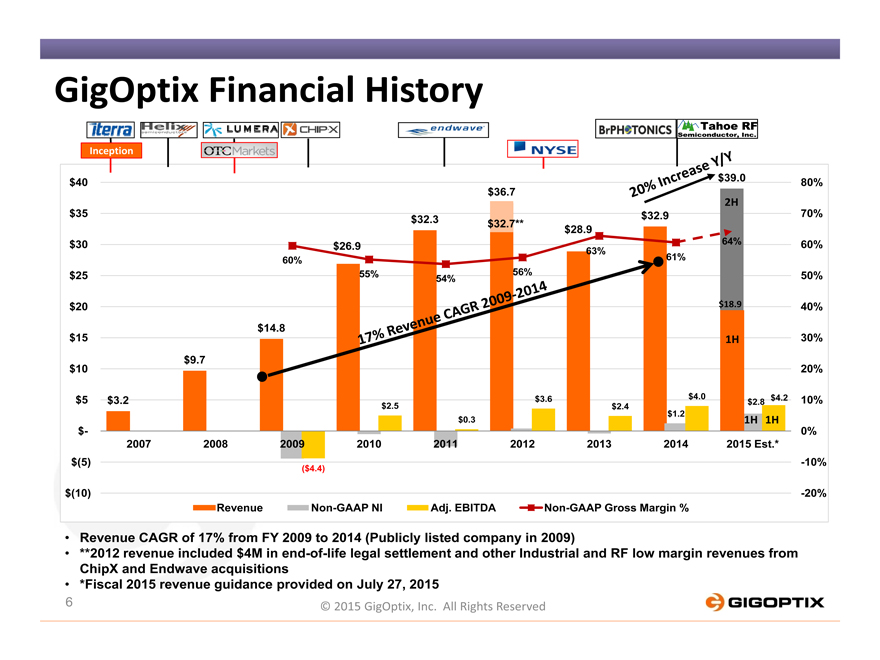
GigOptix Financial History
Inception
$40 $39.0 80%
$36.7
2H
$35 $32.3 $32.9 70%
$32.7** $28.9
$30 $26.9 64% 60%
63%
60% 61%
$25 55% 54% 56% 50%
$20 $18.9 40%
$14.8
$15 1H 30%
$9.7
$10 20%
$5 $3.2 $3.6 $4.0 $2.8 $4.2 10%
$2.5 $2.4
$1.2
$0.3 1H 1H
$- 0%
2007 2008 2009 2010 2011 2012 2013 2014 2015 Est.*
$(5) -10%
($4.4)
$(10) -20%
Revenue Non-GAAP NI Adj. EBITDA Non-GAAP Gross Margin %
Revenue CAGR of 17% from FY 2009 to 2014 (Publicly listed company in 2009)
**2012 revenue included $4M in end-of-life legal settlement and other Industrial and RF low margin revenues from ChipX and Endwave acquisitions
*Fiscal 2015 revenue guidance provided on July 27, 2015
6 © 2015 GigOptix, Inc. All Rights Reserved
|
|
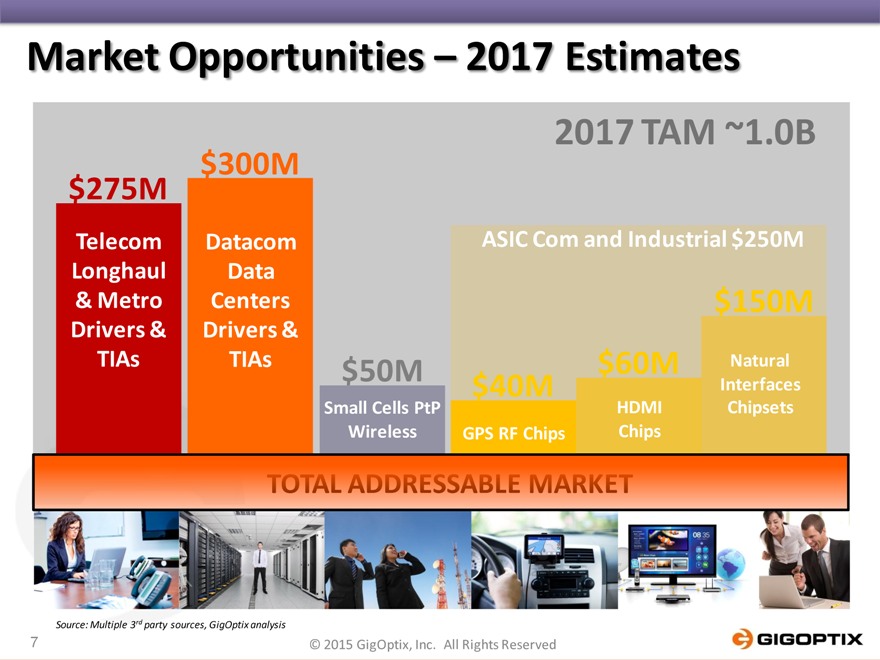
Market Opportunities – 2017 Estimates
2017 TAM ~1.0B
$275M $300M
Telecom Datacom ASIC Com and Industrial $250M Longhaul Data
& Metro Centers $150M
Drivers & Drivers &
TIAs TIAs $50M $60M Natural
$40M Interfaces Small Cells PtP HDMI Chipsets Wireless GPS RF Chips Chips
Source: Multiple 3rd party sources, GigOptix analysis
7 © 2015 GigOptix, Inc. All Rights Reserved
|
|
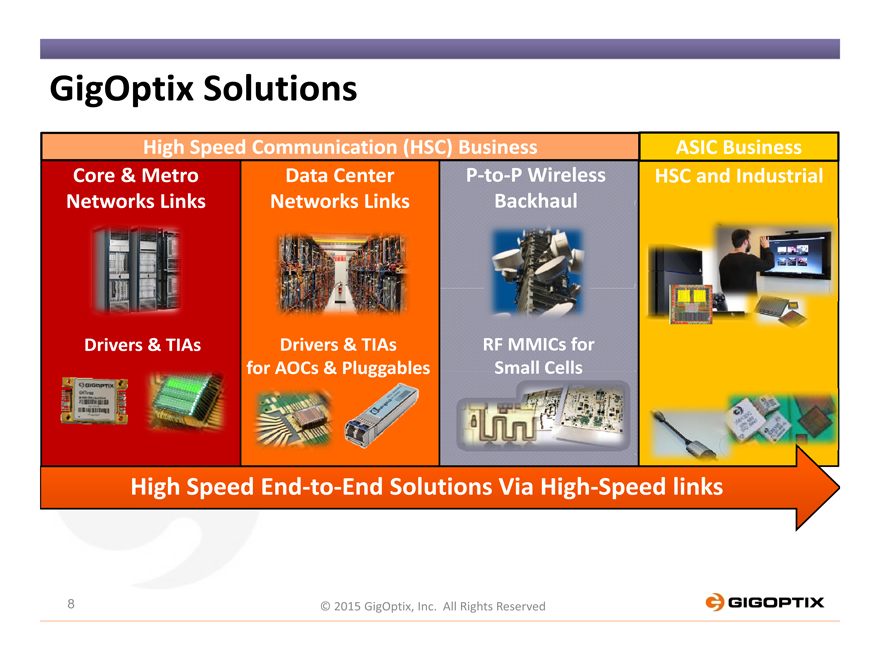
GigOptix Solutions
High Speed Communication (HSC) Business ASIC Business Core & Metro Data Center P-to-P Wireless HSC and Industrial Networks Links Networks Links Backhaul
Drivers & TIAs Drivers & TIAs RF MMICs for for AOCs & Pluggables Small Cells
High Speed End-to-End Solutions Via High-Speed links
8 © 2015 GigOptix, Inc. All Rights Reserved
|
|
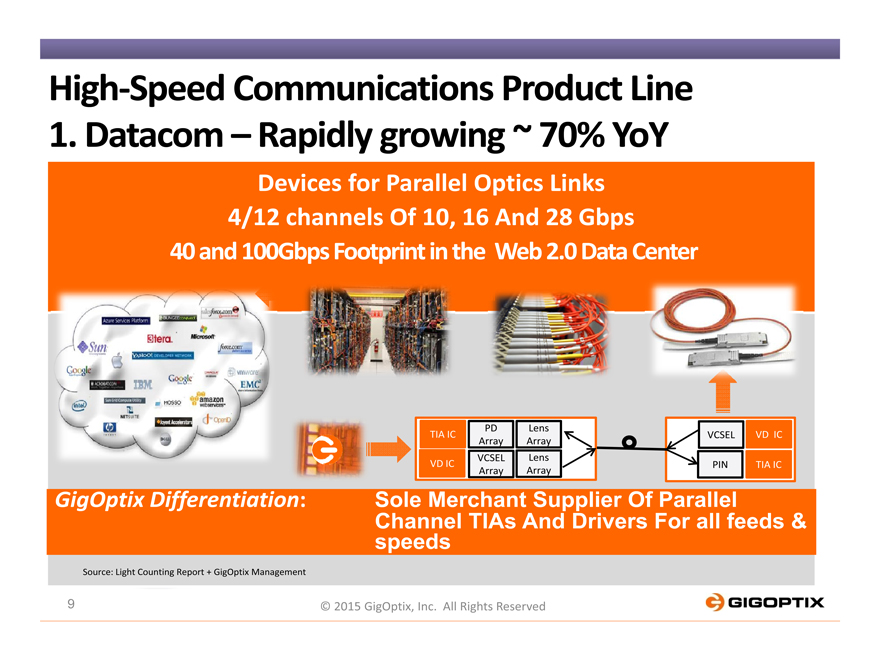
High-Speed Communications Product Line
1. Datacom – Rapidly growing ~ 70% YoY
Devices for Parallel Optics Links 4/12 channels Of 10, 16 And 28 Gbps 40 and 100Gbps Footprint in the Web 2.0 Data Center
PD Lens
TIA IC VCSEL VD IC Array Array VCSEL Lens VD IC PIN TIA IC
Array Array
GigOptix Differentiation: Sole Merchant Supplier Of Parallel Channel TIAs And Drivers For all feeds & speeds
Source: Light Counting Report + GigOptix Management
9 © 2015 GigOptix, Inc. All Rights Reserved
|
|
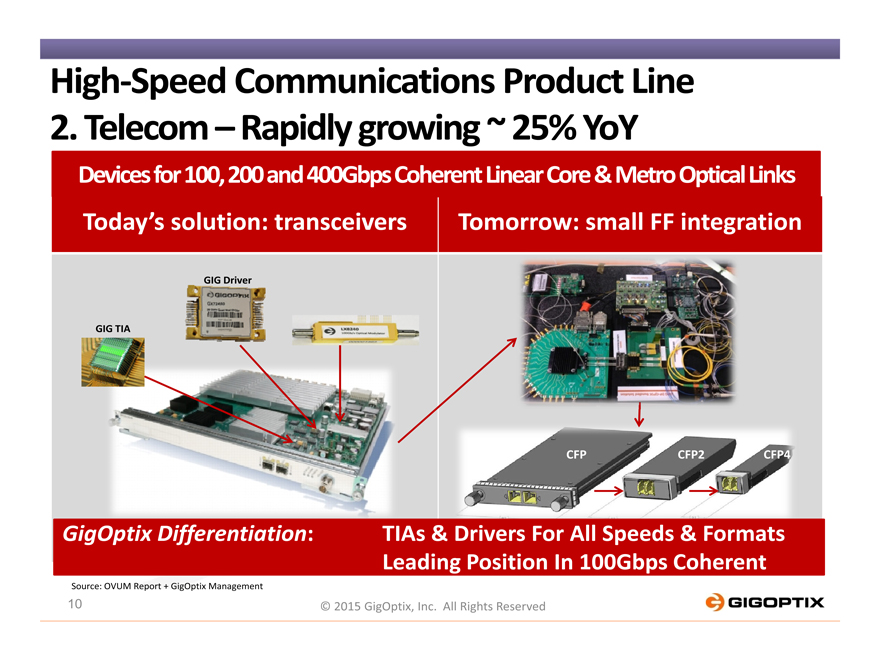
High-Speed Communications Product Line
2. Telecom – Rapidly growing ~ 25% YoY
Devices for 100, 200 and 400Gbps Coherent Linear Core & Metro Optical Links
Today’s solution: transceivers Tomorrow: small FF integration
GIG Driver
GIG TIA
CFP CFP2 CFP4
GigOptix Differentiation: TIAs & Drivers For All Speeds & Formats Leading Position In 100Gbps Coherent
Source: OVUM Report + GigOptix Management
10 © 2015 GigOptix, Inc. All Rights Reserved
|
|
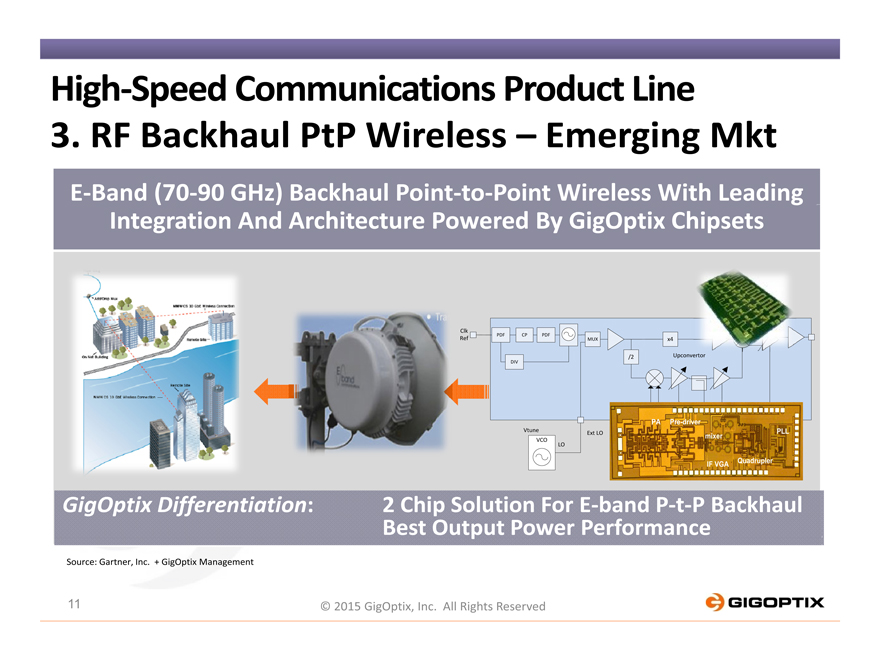
High-Speed Communications Product Line
3. RF Backhaul PtP Wireless – Emerging Mkt
E-Band (70-90 GHz) Backhaul Point-to-Point Wireless With Leading Integration And Architecture Powered By GigOptix Chipsets
Clk PDF CP PDF
Ref MUX x4
/2 Upconvertor
DIV
PA Pre-driver
Vtune I/Q Vc1 IF Vc2 Vctrl PLL Ext LO mixer VCO LO
Quadrupler IF VGA
GigOptix Differentiation: 2 Chip Solution For E-band P-t-P Backhaul Best Output Power Performance
Source: Gartner, Inc. + GigOptix Management
All Rights Reserved
11
|
|
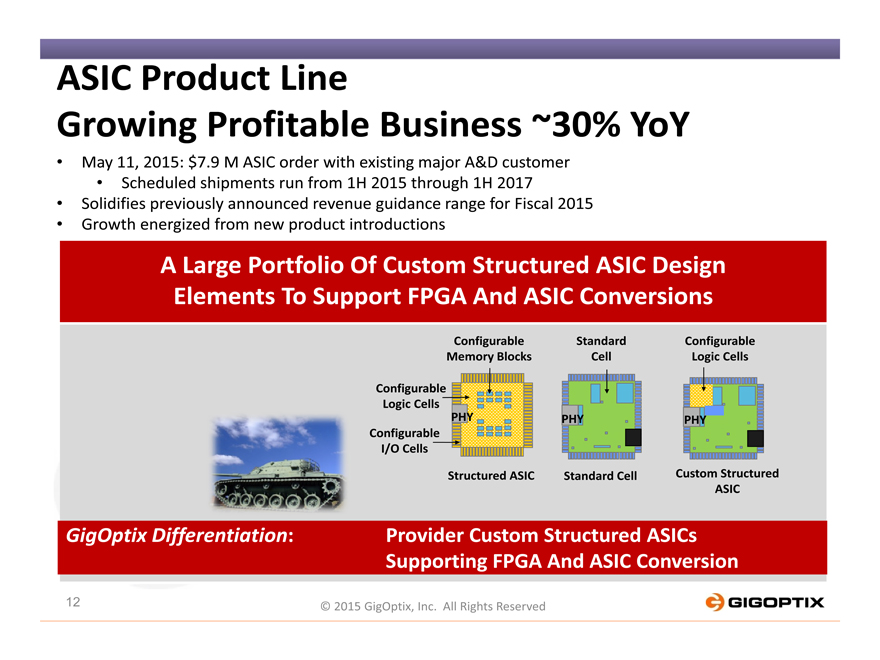
ASIC Product Line
Growing Profitable Business ~30% YoY
May 11, 2015: $7.9 M ASIC order with existing major A&D customer
Scheduled shipments run from 1H 2015 through 1H 2017
Solidifies previously announced revenue guidance range for Fiscal 2015
Growth energized from new product introductions
A Large Portfolio Of Custom Structured ASIC Design Elements To Support FPGA And ASIC Conversions
Configurable Standard Configurable
Memory Blocks Cell Logic Cells
Configurable Logic Cells
PHY PHY PHY
Configurable
I/O Cells
Structured ASIC Standard Cell Custom Structured ASIC
GigOptix Differentiation: Provider Custom Structured ASICs Supporting FPGA And ASIC Conversion
12 © 2015 GigOptix, Inc. All Rights Reserved
|
|
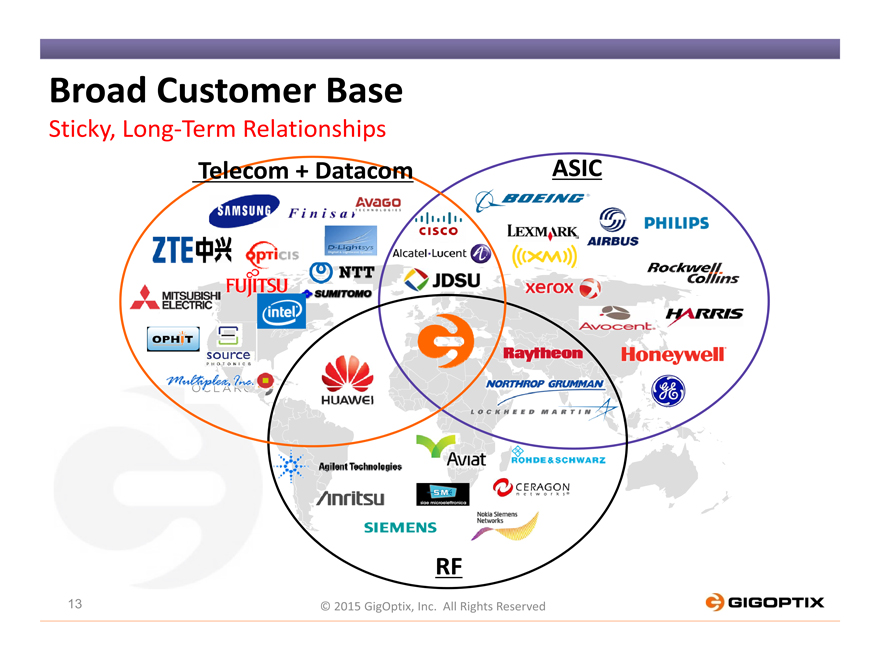
Broad Customer Base
Sticky, Long-Term Relationships
Telecom + Datacom ASIC
RF
13 © 2015 GigOptix, Inc. All Rights Reserved
|
|
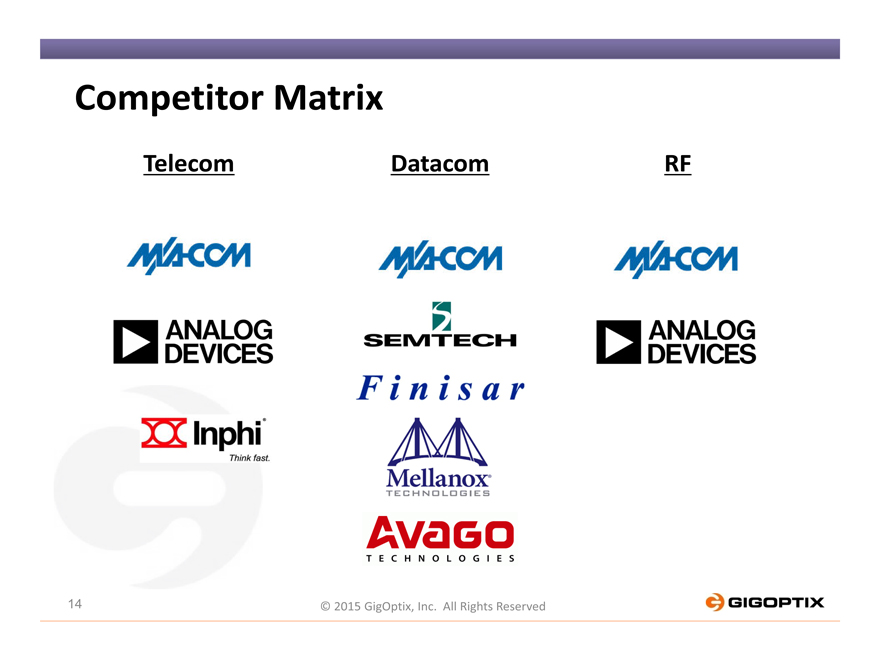
Competitor Matrix
Telecom Datacom RF
14 © 2015 GigOptix, Inc. All Rights Reserved
|
|
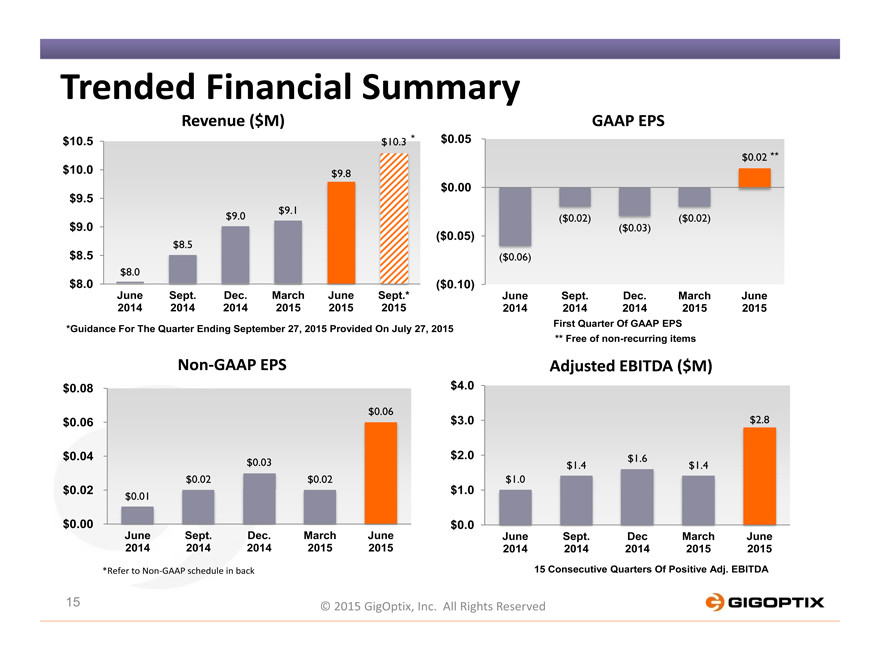
Trended Financial Summary
Revenue ($M) GAAP EPS
$10.5 $10.3 * $0.05
$0.02 **
$10.0 $9.8
$0.00
$9.5
$9.1
$9.0 ($0.02) ($0.02)
$9.0 ($0.03)
($0.05)
$8.5
$8.5 ($0.06)
$8.0
$8.0 ($0.10)
June Sept. Dec. March June Sept.* June Sept. Dec. March June
2014 2014 2014 2015 2015 2015 2014 2014 2014 2015 2015
*Guidance For The Quarter Ending September 27, 2015 Provided On July 27, 2015 First Quarter Of GAAP EPS
** Free of non-recurring items
Non-GAAP EPS Adjusted EBITDA ($M)
$0.08 $4.0
$0.06
$0.06 $3.0 $2.8
$0.04 $2.0 $1.6
$0.03 $1.4 $1.4
$0.02 $0.02 $1.0
$0.02 $1.0
$0.01
$0.00 $0.0
June Sept. Dec. March June June Sept. Dec March June
2014 2014 2014 2015 2015 2014 2014 2014 2015 2015
*Refer to Non-GAAP schedule in back 15 Consecutive Quarters Of Positive Adj. EBITDA
15 © 2015 GigOptix, Inc. All Rights Reserved
|
|
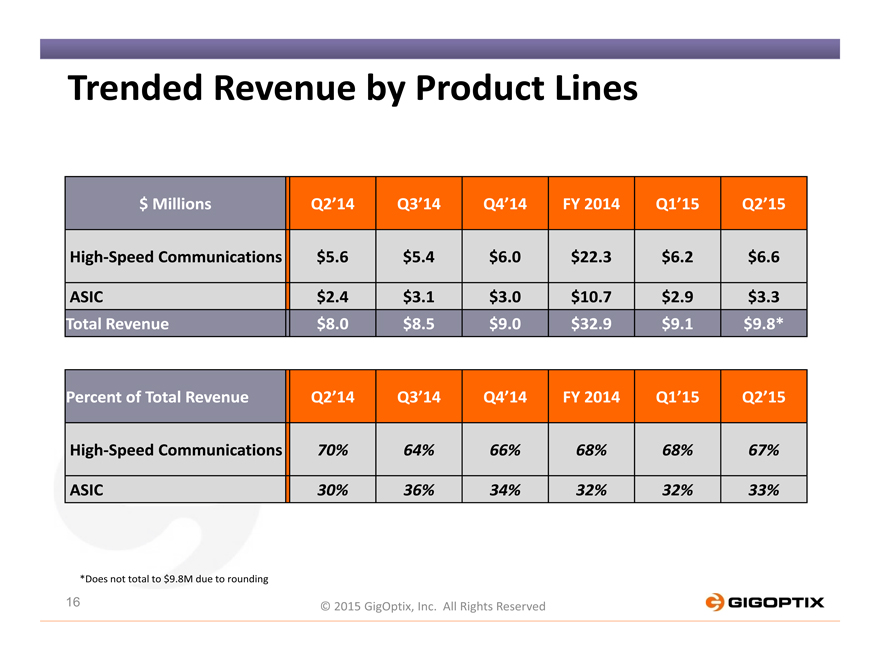
Trended Revenue by Product Lines
$ Millions Q2’14 Q3’14 Q4’14 FY 2014 Q1’15 Q2’15
High-Speed Communications $ 5.6 $ 5.4 $ 6.0 $ 22.3 $ 6.2 $6.6
ASIC $ 2.4 $ 3.1 $ 3.0 $ 10.7 $ 2.9 $3.3
Total Revenue $ 8.0 $ 8.5 $ 9.0 $ 32.9 $ 9.1 $9.8*
Percent of Total Revenue Q2’14 Q3’14 Q4’14 FY 2014 Q1’15 Q2’15
High-Speed Communications 70% 64% 66% 68% 68% 67%
ASIC 30% 36% 34% 32% 32% 33%
*Does not total to $9.8M due to rounding
16 © 2015 GigOptix, Inc. All Rights Reserved
|
|
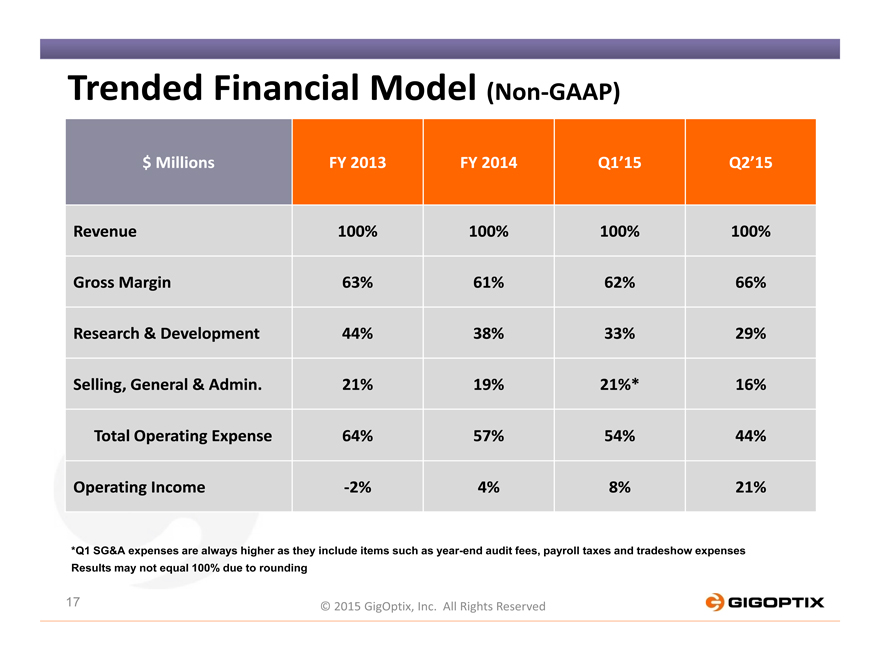
Trended Financial Model (Non-GAAP)
$ Millions FY 2013 FY 2014 Q1’15 Q2’15
Revenue 100% 100% 100% 100%
Gross Margin 63% 61% 62% 66%
Research & Development 44% 38% 33% 29%
Selling, General & Admin. 21% 19% 21%* 16%
Total Operating Expense 64% 57% 54% 44%
Operating Income -2% 4% 8% 21%
*Q1 SG&A expenses are always higher as they include items such as year-end audit fees, payroll taxes and tradeshow expenses
Results may not equal 100% due to rounding
17 © 2015 GigOptix, Inc. All Rights Reserved
|
|
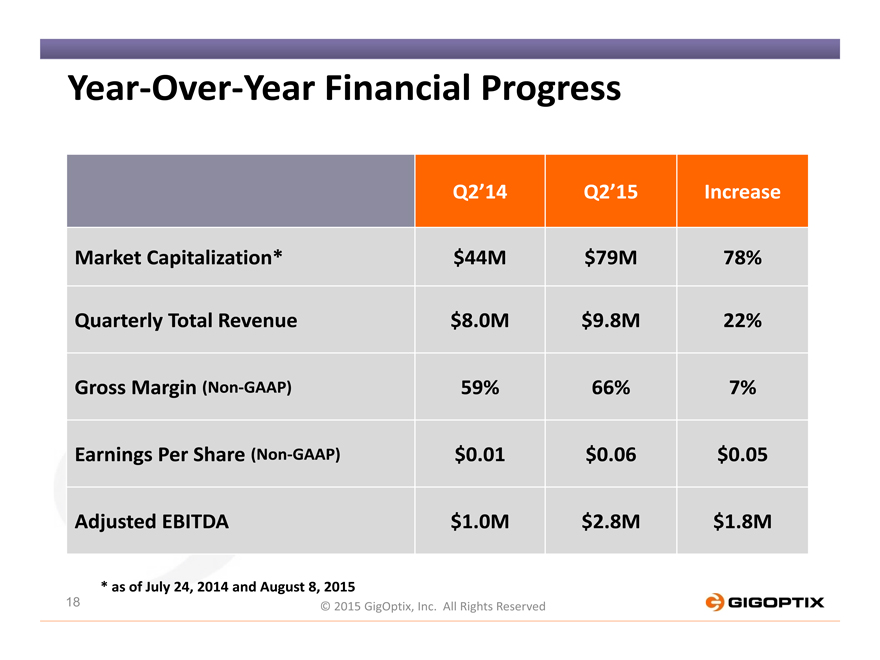
Year-Over-Year Financial Progress
Q2’14 Q2’15 Increase
Market Capitalization* $44M $79M 78%
Quarterly Total Revenue $8.0M $9.8M 22%
Gross Margin (Non-GAAP) 59% 66% 7%
Earnings Per Share (Non-GAAP) $0.01 $0.06 $0.05
Adjusted EBITDA $1.0M $2.8M $1.8M
* as of July 24, 2014 and August 8, 2015
18 © 2015 GigOptix, Inc. All Rights Reserved
|
|
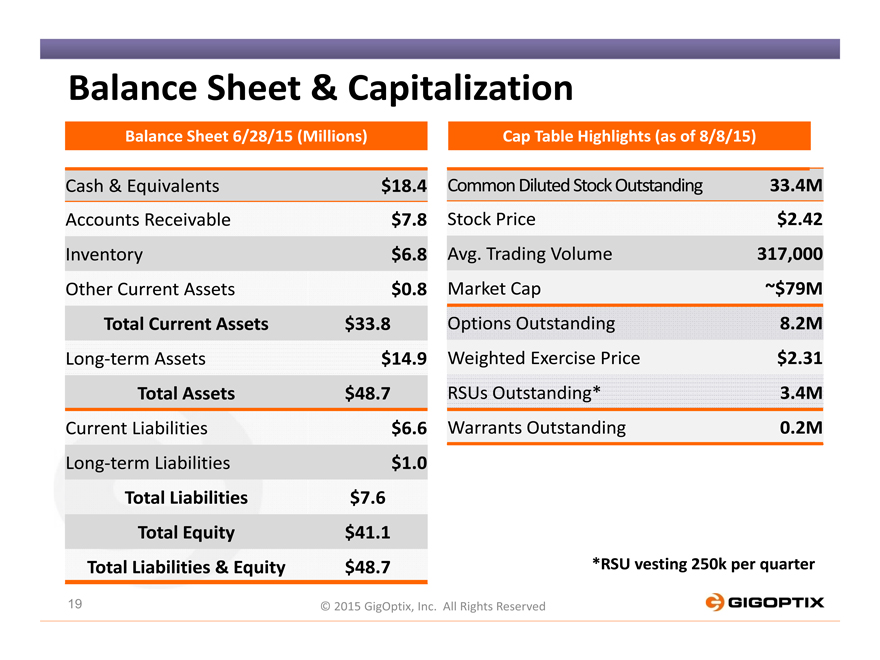
Balance Sheet & Capitalization
Balance Sheet 6/28/15 (Millions) Cap Table Highlights (as of 8/8/15)
Cash & Equivalents $18.4 Common Diluted Stock Outstanding 33.4M
Accounts Receivable $7.8 Stock Price $2.42
Inventory $6.8 Avg. Trading Volume 317,000
Other Current Assets $0.8 Market Cap ~$79M
Total Current Assets $33.8 Options Outstanding 8.2M
Long-term Assets $14.9 Weighted Exercise Price $2.31
Total Assets $48.7 RSUs Outstanding* 3.4M
Current Liabilities $6.6 Warrants Outstanding 0.2M
Long-term Liabilities $1.0
Total Liabilities $7.6
Total Equity $41.1
Total Liabilities & Equity $48.7 *RSU vesting 250k per quarter
19 © 2015 GigOptix, Inc. All Rights Reserved
|
|
GigOptix Growth Catalysts & Summation
Very profitable small cap semiconductor company growing at ~20% CAGR
(3 years) with positive record of “meet or beat” on all provided guidance
Data Center Connectivity Infrastructure
Sole 40G device merchant supplier for Active Optical Cables and Pluggables
A pioneer and leading supplier of 100G optical links
~70% YoY continuous growth rate in Datacom and Telecom
Telecom Core & Metro Network Connectivity (100G-400G)
Lead supplier of 100G and 200 G Coherent Linear MCMs and devices for Core Long-Haul and Metro Telecom applications
Sole supplier of 400G MCMs and devices for Core long-haul Telecom
Emerging supplier of V-Band (60GHz) and E-Band (70GHz-90GHz) MMICs for wireless PtP backhaul networks
Track record of quality and successful acquisition of companies and IP that are leveraged to enhance the high speed device market domination success
Management owns about 20% and has demonstrated solid fiscal management
20 © 2015 GigOptix, Inc. All Rights Reserved
|
|
NYSE MKT: GIG
Powering High Speed Networks
August 17, 2015 Road show
© 2015 GigOptix, Inc. All Rights Reserved
|
|
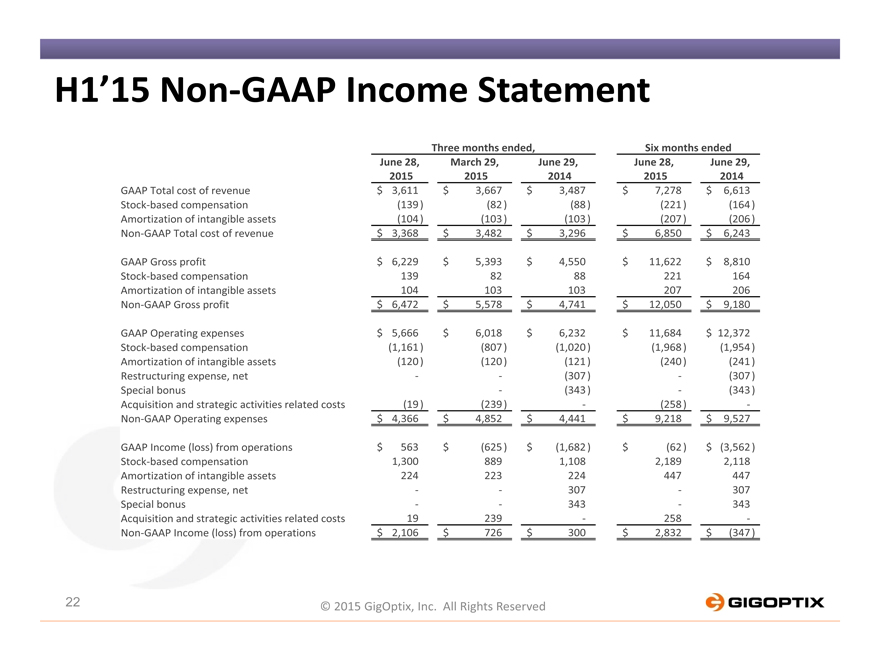
H1’15 Non-GAAP Income Statement
Three months ended, Six months ended
June 28, March 29, June 29, June 28, June 29,
2015 2015 2014 2015 2014
GAAP Total cost of revenue $ 3,611 $ 3,667 $ 3,487 $ 7,278 $ 6,613
Stock-based compensation (139 ) (82 ) (88 ) (221 ) (164 )
Amortization of intangible assets (104 ) (103) (103 ) (207 ) (206 )
Non-GAAP Total cost of revenue $ 3,368 $ 3,482 $ 3,296 $ 6,850 $ 6,243
GAAP Gross profit $ 6,229 $ 5,393 $ 4,550 $ 11,622 $ 8,810
Stock-based compensation 139 82 88 221 164
Amortization of intangible assets 104 103 103 207 206
Non-GAAP Gross profit $ 6,472 $ 5,578 $ 4,741 $ 12,050 $ 9,180
GAAP Operating expenses $ 5,666 $ 6,018 $ 6,232 $ 11,684 $ 12,372
Stock-based compensation (1,161 ) (807) (1,020 ) (1,968 ) (1,954 )
Amortization of intangible assets (120 ) (120) (121 ) (240 ) (241 )
Restructuring expense, net — — (307 ) — (307 )
Special bonus — (343 ) — (343 )
Acquisition and strategic activities related costs (19 ) (239) — (258 ) -
Non-GAAP Operating expenses $ 4,366 $ 4,852 $ 4,441 $ 9,218 $ 9,527
GAAP Income (loss) from operations $ 563 $ (625) $ (1,682 ) $ (62 ) $ (3,562 )
Stock-based compensation 1,300 889 1,108 2,189 2,118
Amortization of intangible assets 224 223 224 447 447
Restructuring expense, net — — 307 — 307
Special bonus — — 343 — 343
Acquisition and strategic activities related costs 19 239 — 258 -
Non-GAAP Income (loss) from operations $ 2,106 $ 726 $ 300 $ 2,832 $ (347 )
22 © 2015 GigOptix, Inc. All Rights Reserved
|
|
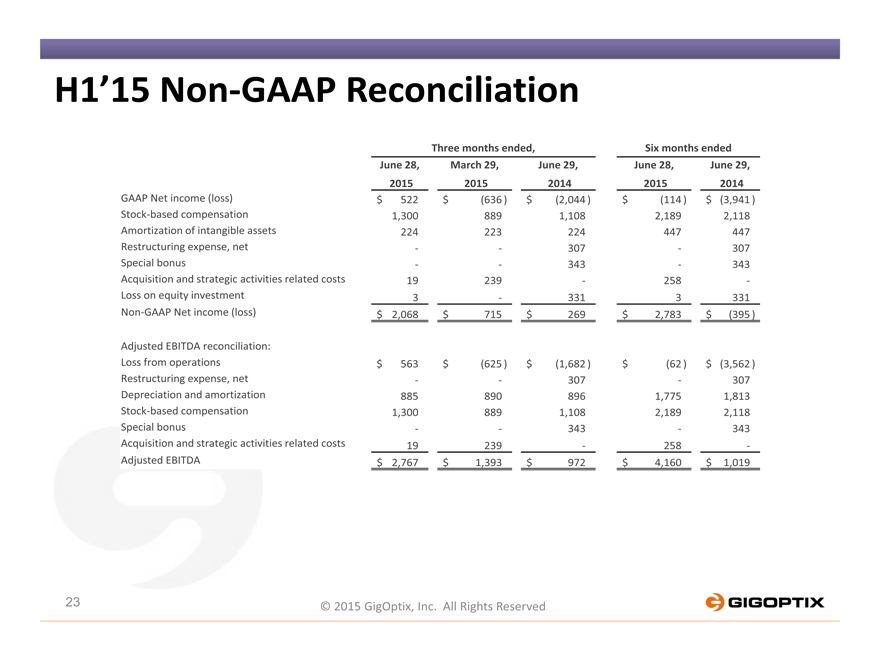
H1’15 Non-GAAP Reconciliation
Three months ended, Six months ended
June 28, March 29, June 29, June 28, June 29,
2015 2015 2014 2015 2014
GAAP Net income (loss) $ 522 $ (636 ) $ (2,044 ) $ (114 ) $ (3,941)
Stock-based compensation 1,300 889 1,108 2,189 2,118
Amortization of intangible assets 224 223 224 447 447
Restructuring expense, net — — 307 — 307
Special bonus — — 343 — 343
Acquisition and strategic activities related costs 19 239 — 258 -
Loss on equity investment 3 — 331 3 331
Non-GAAP Net income (loss) $ 2,068 $ 715 $ 269 $ 2,783 $ (395 )
Adjusted EBITDA reconciliation:
Loss from operations $ 563 $ (625 ) $ (1,682 ) $ (62 ) $ (3,562)
Restructuring expense, net — — 307 — 307
Depreciation and amortization 885 890 896 1,775 1,813
Stock-based compensation 1,300 889 1,108 2,189 2,118
Special bonus — — 343 — 343
Acquisition and strategic activities related costs 19 239 — 258 -
Adjusted EBITDA $ 2,767 $ 1,393 $ 972 $ 4,160 $ 1,019
23 © 2015 GigOptix, Inc. All Rights Reserved