Attached files
| file | filename |
|---|---|
| EX-32.1 - EXHIBIT 32.1 - GigPeak, Inc. | ex32_1.htm |
| EX-32.2 - EXHIBIT 32.2 - GigPeak, Inc. | ex32_2.htm |
| EX-31.2 - EXHIBIT 31.2 - GigPeak, Inc. | ex31_2.htm |
| EX-31.1 - EXHIBIT 31.1 - GigPeak, Inc. | ex31_1.htm |
| EX-23.1 - EXHIBIT 23.1 - GigPeak, Inc. | ex23_1.htm |
| EX-21 - EXHIBIT 21 - GigPeak, Inc. | ex21.htm |
UNITED STATES
SECURITIES AND EXCHANGE COMMISSION
WASHINGTON, D.C. 20549
FORM 10-K
(Mark One)
| ☒ |
ANNUAL REPORT PURSUANT TO SECTION 13 OR 15(D) OF THE SECURITIES EXCHANGE ACT OF 1934
|
For the fiscal year ended December 31, 2016
or
| ☐ |
TRANSITION REPORT UNDER SECTION 13 OR 15(D) OF THE SECURITIES EXCHANGE ACT OF 1934
|
For the transition period from to
Commission file number: 001-35520
GIGPEAK, INC.
(Exact name of registrant as specified in its charter)
|
Delaware
|
26-2439072
|
|
|
(State or Other Jurisdiction of Incorporation or Organization)
|
(I.R.S. Employer Identification No.)
|
130 Baytech Drive
San Jose, CA 95134
Registrant’s telephone number: (408-522-3100)
Securities registered pursuant to Section 12(b) of the Exchange Act:
|
Title of each class
|
Name of each exchange on which registered
|
|
|
Common Stock ($0.001 par value)
|
NYSE MKT
|
Securities registered pursuant to Section 12(g) of the Exchange Act: None
Indicate by check mark if the registrant is a well-known seasoned issuer, as defined in Rule 405 of the Securities Act. Yes ☐ No ☒
Indicated by check mark if the registrant is not required to file reports pursuant to Section 13 or Section 15(d) of the Act. Yes ☐ No ☒
Indicate by check mark whether the registrant (1) has filed all reports required to be filed by Section 13 or 15(d) of the Securities Exchange Act of 1934 during the preceding 12 months (or for such shorter period that the registrant was required to file such reports), and (2) has been subject to such filing requirements for the past 90 days. Yes ☒ No ☐
Indicate by check mark whether the registrant has submitted electronically and posted on its corporate Web site, if any, every Interactive Data File required to be submitted and posted pursuant to Rule 405 of Regulation S-T (§ 232.405 of this chapter) during the preceding 12 months (or for such shorter period that the registrant was required to submit and post such files). Yes ☒ No ☐
Indicate by check mark if disclosure of delinquent filers pursuant to Item 405 of Regulation S-K is not contained herein, and will not be contained, to the best of registrant’s knowledge, in definitive proxy or information statements or any amendment to this Form 10-K. ☒
Indicate by check mark whether the registrant is a large accelerated filer, an accelerated filer, a non-accelerated filer, or a smaller reporting company. See the definitions of “large accelerated filer,” “accelerated filer” and “smaller reporting company” in Rule 12b-2 of the Exchange Act. (Check one):
|
Large accelerated filer
|
☐
|
Accelerated filer
|
☒
|
|
Non-accelerated filer
|
☐ (Do not check if a smaller reporting company)
|
Smaller reporting Company
|
☒
|
Indicate by check mark whether the registrant is a shell company (as defined in Rule 12b-2 of the Exchange Act). Yes ☐ No ☒
The aggregate value of the registrant’s common stock held by non-affiliates as of June 26, 2016, the last business day of the registrant’s most recently completed second fiscal quarter was approximately $126.5 million.
The number of shares of common stock outstanding as of March 1, 2017, the most recent practicable date prior to the filing of this Annual Report on Form 10-K, was 67,641,585 shares.
GIGPEAK, INC.
ANNUAL REPORT ON FORM 10-K
FOR FISCAL YEAR ENDED DECEMBER 31, 2016
|
PAGE NO
|
|||
|
SPECIAL NOTE REGARDING FORWARD-LOOKING STATEMENTS
|
|||
|
PART I
|
|||
|
ITEM 1
|
6
|
||
|
ITEM 1A
|
19
|
||
|
ITEM 2
|
44
|
||
|
ITEM 3
|
45
|
||
|
ITEM 4
|
46
|
||
|
PART II
|
|||
|
ITEM 5
|
47
|
||
|
ITEM 6
|
50
|
||
|
ITEM 7
|
51
|
||
|
ITEM 8
|
67
|
||
|
ITEM 9
|
108
|
||
|
ITEM 9A
|
108
|
||
|
ITEM 9B
|
110
|
||
|
PART III
|
|||
|
ITEM 10
|
111
|
||
|
ITEM 11
|
114
|
||
|
ITEM 12
|
126
|
||
|
ITEM 13
|
128
|
||
|
ITEM 14
|
129
|
||
|
PART IV
|
|||
|
ITEM 15
|
130
|
||
|
131
|
|||
References in this Annual Report on Form 10-K to “we,” “us,” “our,” “Company,” “GigPeak” and “GigOptix,” mean GigPeak, Inc., formerly known as GigOptix, Inc. until the second quarter of 2016, and all entities owned or controlled by GigPeak, Inc.
All brand names, trademarks and trade names referred to in this report are the property of their respective holders.
SPECIAL NOTE REGARDING FORWARD-LOOKING STATEMENTS
This Annual Report on Form 10-K and the documents incorporated herein by reference include “forward-looking statements” within the meaning and protections of the Private Securities Litigation Reform Act of 1995, as amended, Section 27A of the Securities Act of 1933, as amended, or the Securities Act, and Section 21E of the Securities Exchange Act of 1934, as amended, or the Exchange Act. Forward-looking statements include statements with respect to our beliefs, plans, objectives, goals, expectations, anticipations, assumptions, estimates, intentions, and future performance, and involve known and unknown risks, uncertainties and other factors, which may be beyond our control, and which may cause our actual results, performance or achievements to be materially different from future results, performance or achievements expressed or implied by such forward-looking statements.
All statements other than statements of historical fact are statements that could be forward-looking statements. You can identify these forward-looking statements through our use of words such as “may,” “will,” “anticipate,” “assume,” “should,” “indicate,” “would,” “believe,” “contemplate,” “expect,” “estimate,” “continue,” “plan,” “project,” “could,” “intend,” “target” and other similar words and expressions of the future. These forward-looking statements may not be realized due to a variety of factors, including, without limitation:
| · |
we have had a history of incurring losses;
|
| · |
our ability to remain competitive in the markets we serve;
|
| · |
the effects of future economic, business and market conditions;
|
| · |
consolidation in the industries we serve;
|
| · |
our ability to continue to develop, manufacture and market innovative products and services that meet customer requirements for performance and reliability;
|
| · |
our ability to expand into new product and customer markets and opportunities;
|
| · |
our ability to establish and maintain effective internal controls over our financial reporting;
|
| · |
risks relating to the transaction of business internationally;
|
| · |
our failure to realize anticipated benefits from acquisitions or the possibility that such acquisitions could adversely affect us, and risks relating to the prospects for future acquisitions;
|
| · |
the loss of key employees and the ability to retain and attract key personnel, including technical and managerial personnel;
|
| · |
investments in research and development;
|
| · |
protection and enforcement of our intellectual property rights and proprietary technologies;
|
| · |
costs associated with potential intellectual property infringement claims asserted by a third party against us or asserted by us against a third party;
|
| · |
our exposure to product liability claims resulting from the use of our products;
|
| · |
the loss of one or more of our significant customers, or the diminished demand for our products;
|
| · |
the loss of one or more of our critical vendors, particularly sole source suppliers of key components and wafers;
|
| · |
our dependence on overseas and domestic foundries, contract manufacturing and outsourced supply chain, as well as the costs of materials;
|
| · |
our reliance on third parties to provide services for the operation of our business;
|
| · |
our ability to be successful in identifying, acquiring and consolidating new acquisitions;
|
| · |
our ability to successfully complete inception and funding of new joint ventures that we establish globally;
|
| · |
the effects of war, terrorism, natural disasters or other catastrophic events;
|
| · |
our success at managing the risks involved in the foregoing items;
|
| · |
our ability to consummate the acquisition of the company by Integrated Device Technology, Inc. (“IDT”) in a tender offer and merger as previously announced;
|
| · |
being actively involved in class-action litigation pertaining to the acquisition by IDT;
|
| · |
the effect of the extensive cash and resources use as part of the anticipated acquisition of the Company by IDT, in case of the acquisition being delayed or canceled; and
|
| · |
other risks and uncertainties, including those listed under the heading “Risk Factors” herein
|
The forward-looking statements are based upon management’s beliefs and assumptions and are made as of the date of this Annual Report on Form 10-K. We undertake no obligation to publicly update or revise any forward-looking statements included or incorporated by reference in this Annual Report on Form 10-K or to update the reasons why actual results could differ from those contained in such statements, whether as a result of new information, future events or otherwise, except to the extent required by federal securities laws. These forward looking statements are found at various places throughout this Annual Report on Form 10-K. Any investor should consider all risks and uncertainties disclosed in our filings with the Securities and Exchange Commission, or the SEC, described below under the heading “Where You Can Find More Information,” all of which is accessible on the SEC’s website at www.sec.gov.
PART I
Overview
GigPeak, Inc. (“GigPeak”), formerly known as GigOptix, Inc. until the second quarter of 2016, is a leading innovator of semiconductor integrated circuits (“ICs”) and software solutions for high-speed connectivity and high-quality video compression. Our focus is to develop and deliver products that enable lower power consumption, higher quality information video content, and faster data connectivity, more efficient use of network infrastructure and broader connectivity to the Cloud, reducing the total cost of ownership for the network’s operators. We address both the speed of data transmission and the amount of bandwidth the data consumes within the network, while enhancing the streamed and broadcasted content quality, and our products also help to improve the efficiency of various Cloud-connected enterprise applications. The GigPeak product portfolio provides flexibility to support on-going changes in the connectivity that customers and markets require by deploying a wider offering of solutions from various kinds of semiconductor materials, ICs and Multi-Chip-Modules (“MCMs”), through cost-effective application-specific- integrated-circuits (“ASICs”) and system-on-chips (“SoCs”), and into full software programmable open-platform offerings.
Most of our products are highly customized and typically developed in partnership with key “Lighthouse” customers, occasionally generating some engineering project revenues through the development stage, but generating the majority of revenue from future device product shipments and sales through these customers and general market availability.
Since inception in 2007, we have expanded our customer base through our sales and marketing activities, and by acquiring and integrating eight (8) companies with complementary and synergistic products and customers. Our worldwide direct sales force is supported by a significant number of channel representatives and distributors that sell our products throughout North America, Europe and Asia.
On April 5, 2016, we completed our acquisition of Magnum Semiconductor, Inc. (“Magnum”), and simultaneously renamed ourselves as GigPeak, Inc., to reflect the extension of our solution offering into wider Cloud-connectivity applications. Magnum was a privately-held fabless semiconductor manufacturer and software solution developer, and brought a well-developed and comprehensive portfolio of video broadcasting, streaming and compression solutions to GigPeak, including silicon ICs, SoCs and software solutions, high-end compression encoding and video-quality algorithm and software products, and a comprehensive library of intellectual property. The Magnum products, now marketed as GigPeak’s MX product-line, are offered solely for the professional and enterprise video broadcast infrastructure applications, yet are extendable to a variety of enterprise and end-user high-quality video streaming applications, such as a variety of cloud-connected interactive camera and server applications. Those products are the top of the line products, tools and technologies that can be deployed for the entire universe of video content creation and the associated distribution chain, from contribution and production through distribution over cable, telecom, satellite and over-the-top (“OTT”) video streaming.
Today’s video service providers, which include cable operators, telecommunications companies, and satellite TV providers, are continuously seeking to perfect their linear and nonlinear workflows and improve the quality of their video content, while simultaneously optimizing the efficiency of their networks and improving content quality in a constantly reducing bitrate environment. This enables the video service providers to stream and broadcast larger amount of video and media data and increase channel density through the existing network pipes infrastructure. Our products, tools, and technologies are currently used in the entire video content creation and distribution chain. Specifically, our solutions are used to address challenges in video contribution, video production, primary and secondary distribution, and enterprise wide solutions.
This rich networking, streaming and broadcasting blend of products and technologies gives GigPeak the capability to address both the speed of data transmission and the amount of bandwidth the data consumes within a network, driven in particular by high-quality video content, which is the source of a majority of the datacenter traffic and storage in today’s networks. Through this unique combination, we provide solutions to enhance the footprint utilization and reduce the total cost of ownership of existing network pipes from the core to the end user. Our wide product portfolio and exceptional customer support practices will continue to serve the enterprise networking and broadcasting original equipment manufacturers (“OEMs”), as well as potentially a variety of cloud-connected interactive camera and server applications, and is very unique among all other fabless semiconductor companies in the industry.
Historically, since inception in 2007 and through 2014, we have incurred net losses. We started to report net income in 2015. For the years ended December 31, 2016 and 2015, we recorded net income of $2.2 million and $1.2 million, respectively. For the years ended December 31, 2016 and 2015, we had cash inflows from operations of $3.3 million and $3.0 million, respectively. As of December 31, 2016 and 2015, we had an accumulated deficit of $98.8 million and $101.0 million, respectively.
On February 13, 2017, we announced that we had entered into a merger agreement to be acquired by Glider Merger Sub., Inc. (“Purchaser”), a wholly-owned subsidiary of IDT (the “Merger Agreement”). Pursuant to the terms of the Merger Agreement, Purchaser made a tender offer to acquire all of the outstanding shares of our common stock and the associated purchase rights (the “Rights”) for our Series A Junior Preferred Stock, par value $0.001 per share (“Series A Junior Preferred Stock”), issued under the Rights Agreement, dated as of December 16, 2014, as amended, between GigPeak and American Stock Transfer & Trust Company, LLC, as rights agent (such Rights, together with the commom stock, the “Shares”) on March 7, 2017 (the “Offer”). The Offer is scheduled to expire one minute following 11:59 P.M. (12:00 midnight) New York Time, on Monday April 3, 2017, unless the Offer is extended or terminated.
The Merger Agreement provides that, among other things, subject to the satisfaction or waiver of certain conditions, following completion of the Offer, and in accordance with the Delaware General Corporation Law, as amended (the “DGCL”), Purchaser will be merged with and into the Company (the “Merger”) (collectively, the Offer, the Merger, and the transactions contemplated by the Merger Agreement constitute the “Transaction”). Following the consummation of the Merger, the Company will continue as the surviving corporation and as a wholly-owned subsidiary of IDT. The Merger will be governed by Section 251(h) of the DGCL which provides that, as soon as practicable following consummation of a successful tender offer for the outstanding voting stock of a corporation whose shares are listed on a national securities exchange, and subject to certain statutory provisions, if the acquiror holds at least the amount of shares of each class or series of stock of the acquired corporation that would otherwise be required to adopt a merger agreement providing for the merger of the acquired corporation, and each outstanding share of each class or series of stock of the acquired corporation subject to, but not tendered in, the tender offer is subsequently converted by virtue of such a merger into, or into the right to receive, the same amount and kind of consideration for their stock in the merger as was payable in the tender offer, the acquiror can effect such a merger without any vote of the stockholders of the acquired corporation. Accordingly, if Purchaser consummates the Offer, the Merger Agreement contemplates that the parties thereto will affect the closing of the Merger without a vote of the stockholders of GigPeak in accordance with Section 251(h) of the DGCL.
The obligation of Purchaser to purchase the Shares validly tendered pursuant to the Offer and not validly withdrawn prior to the expiration of the Offer is subject to the satisfaction or waiver of a number of conditions set forth in the Merger Agreement, including (i) that there will have been validly tendered and not validly withdrawn a number of Shares that, when added to the Shares then owned by IDT and its wholly-owned direct or indirect subsidiaries, represents at least a majority of the Shares then outstanding (on a fully-diluted basis) and no less than a majority of the voting power of the shares of capital stock of GigPeak then outstanding (on a fully-diluted basis) and entitled to vote upon the adoption of the Merger Agreement and the approval of the Merger, excluding from the number of tendered Shares, but not from the number of outstanding Shares, Shares tendered pursuant to guaranteed delivery procedures, to the extent such procedures are permitted by Purchaser, that have not yet been delivered in settlement of such guarantee, (ii) the expiration or termination of any applicable waiting period (and any extension thereof) and the receipt of any approval or clearance applicable to the Offer or consummation of the Merger under the Hart-Scott-Rodino Antitrust Improvements Act of 1976, as amended, (iii) the accuracy of the representations and warranties and compliance with covenants contained in the Merger Agreement, subject to certain materiality standards, (iv) the absence of any law, order, injunction or decree by any government, court or other governmental entity that would make illegal or otherwise prohibit the Offer or the Merger, (v) there not having been a material adverse effect with respect to GigPeak, and (vi) other customary conditions.
The foregoing description of the Merger Agreement does not purport to be complete and is qualified in its entirety by reference to the Merger Agreement, which we filed as Exhibit 2.1 to our Current Report on Form 8-K with the SEC on February 13, 2017 and which is incorporated herein by reference as Exhibit 2.4.
Industry Background
Over the past several years, communications networks have undergone significant challenges as network operators have been pursuing more profitable service offerings while reducing operating costs. The growing demand by enterprises and consumers for bandwidth due to the explosion of data, voice and video usage across networks has driven service providers to continuously add higher speed access through Wi-Fi, 4G and 5G long term evolution (“LTE”), digital subscriber line (“DSL”), and cable and fiber to the destination (“FTTx”), as well as converge their separate data, voice and video-media networks into a single IP-based high capacity integrated network to more easily manage and provide these services. High bandwidth applications such as content downloading, video streaming, high-resolution and big-data, social networks, online gaming, cloud services and Internet protocol television (“IPTV”) are challenging network service providers to supply increasing bandwidth to their customers and results in increased network utilization across the entire core and edge of wire-line, wireless and cable networks. Additionally, enterprises and institutions are managing their rapidly escalating demand for data and bandwidth and are upgrading and deploying higher speed local, storage and wide area networks (“LANs,” “SANs” and “WANs,” respectively). The U.S. government, defense and homeland security efforts also add to the demand for bandwidth, as vast amounts of data are generated through sophisticated surveillance and defense network applications that are then transferred via a myriad of terrestrial and satellite communications channels. The U.S. government and its contractors are incorporating optical and high frequency wireless and satellite communications technologies into their systems and infrastructure to address these challenges.
Optical and wireless networking technologies support higher speeds and added features, and offer greater interoperability to accommodate higher bandwidth requirements at lower cost. Leading network systems vendors are producing optical systems for carriers increasingly based on 100 Gbps and up to 400 Gbps speeds including multi-service switches, dense wave division multiplexing (“DWDM”) transport terminals, access multiplexers, routers, Ethernet switches and other networking systems. Moreover, these network system vendors now also offer wireless communications systems to address mobile access and backhaul demands with increased bandwidths capable of more than 1 Gbps, more so for the last kilometer connectivity applications in dense urban areas. Mirroring the convergence of telecom and datacom networks, these systems vendors are increasingly addressing both telecom and datacom applications and are also looking to integrate their network equipment offerings into a single product. Faced with the technological and cost challenges of building fully integrated systems that can handle data, voice and video, original equipment manufacturers (“OEMs”) are re-focusing on core competencies of software and systems integration, and relying on outside module and component suppliers for the design, development and supply of critical electro–optic and wireless products that perform the critical transmit and receive functions. In addition, the carriers are increasing their demands from the OEMs to also provide systems that enable the streaming of high-speed and high-quality information through their entire network which includes both optical and wireless equipment.
Networking Solutions
We offer a comprehensive portfolio of 1 Gbps to 400 Gbps electro-optical products as we gear up toward the future generation of those products at even higher speeds of 1 terabit per second (“Tbps”). We provide bundled solutions that combine multiple chips and drivers. We also offer a comprehensive portfolio of monolithic microwave integrated circuit (“MMIC”) products to support E-band wireless communications and defense markets. We also offer ultra-wide-bandwidth (“UWB”) ASIC, Wi-Fi and wireless ASIC, mixed-signal ASIC, optical ASIC, and RF ASIC devices, which cater to the ever growing demand for advanced applications such as in-door and out-door point-to-point, point-to-multipoint and cloud connectivity. We combine high performance analog and mixed signal design skills, with experience in integrated systems, interoperability, power management and size optimization. We believe customers choose to work with us for several reasons including:
Superior Performance: We believe that our performance advantage is derived from industry-leading MMICs, MCMs, drivers, amplifiers and design capabilities. Our technology expertise allows us to design products that often exceed the current performance, power, size, temperature and reliability requirements of our customers.
Broad Product Line: We have a comprehensive portfolio of products for telecom, datacom, consumer electronics high speed links and interactive interfaces, and defense and industrial applications designed for optical speeds from 3 Gbps to over 400 Gbps and for wireless frequencies up to 86GHz. Our products support a wide range of data rates, protocols, transmission distances and industry standards. This wide product offering allows us to serve as a “one-stop shop” to our customers in offering a comprehensive product arsenal, as well as allows us to reduce costs as we leverage existing design building-blocks into new applications. Our portfolio comprises a wide family of products and includes mainly, the following products:
| ● |
Telecom laser drivers for 10 Gbps, 40 Gbps, 100 Gbps and 400 Gbps applications;
|
| ● |
Telecom receiver TIAs for 10 Gbps, 40 Gbps, 100 Gbps and 200 Gbps applications;
|
| ● |
Datacom vertical-cavity-surface-emitting-laser (“VCSEL”) driver & receiver chipsets for single, 4 and 12 channel parallel optics applications from 2 Gbps to 28 Gbps/channel;
|
| ● |
Direct-modulated-laser (“DML”) drivers for single and 4 channels of 28 Gbps/channel;
|
| ● |
Clock-data-recovery (“CDR”) devices for single and 4 channel implementations of 28 Gbps/channel;
|
| ● |
Wideband RF MMIC amplifiers with flat gain response;
|
| ● |
High Frequency RF MMIC Power Amplifiers with high gain and output power; and
|
| ● |
Ultra-wide-bandwidth (“UWB”) ASIC, Wi-Fi and wireless ASIC, mixed-signal ASIC, optical ASIC, and RF ASIC devices.
|
Power Consumption and Size Reduction: We design and enable technologies which utilize efficient circuit techniques and material technology to reduce energy usage without compromising performance. Our designs also typically have smaller footprints than competing products enabling an overall smaller transponder design.
Cost Reduction: We are a material-agnostic, fabless design-house and are skilled in designing and utilizing a number of packaging and semiconductor process technologies such as indium phosphide (“InP”), gallium arsenide (“GaAs”), silicon germanium (“SiGe”) and CMOS silicon. This portfolio of enabling technologies provides the flexibility to optimize the cost/performance of our products to meet the challenge at hand and to provide the best of breed solutions to meet our customers’ needs. We believe that this, coupled with the ability to integrate more complex logic functions into the TIA designs, offers compelling value to our customers. By providing a broad portfolio of products to our customers we are able to achieve production efficiencies which allows us to offer attractive pricing.
Partnership: Through a deep understanding both of the system level challenges faced by our customers developing devices, MCMs, and optical transponders and wireless transceivers and of the capabilities of our technology, we are able to suggest and implement new system partitioning concepts to provide innovative new products that provide enhanced features and functionality, ease manufacturing, increase yields and reduce power and cost.
Technology Leadership and Innovation: Our products are built on a foundation of semiconductor technologies supported by over 20 years of innovation and research and development experience that has resulted in more than 76 patents awarded and patent applications pending worldwide. Our technological innovation extends from the design of ultra-high speed semiconductor integrated circuits, monolithic microwave integrated circuit design, multi-chip modules, and optical device design. These areas of competence include signal integrity, thermal modeling, power consumption and integration of multiple ICs into sub-system multi-chip module components. Our many years of experience allow us to design high-performance solutions and we conduct our development both independently and in close, cooperative partnership with lead “Lighthouse” customers. For these reasons, we have been selected as a partner for many Tier-1 customers in Japan, the USA and Europe. For example, we were a partner with a leading global equipment supplier to develop 100 Gbps coherent limiting drivers for the first commercially available 100 Gbps system that was launched in 2010. This partnership has grown to encompass the development of new generations of drivers such as the 100, 200 and 400 Gbps coherent linear drivers, as well as 100 and 200 Gbps trans-impedance amplifiers (“TIAs”), that we launched in 2014. Furthermore, our high performance wideband amplifiers are utilized in a number of mission critical military applications.
Horizontal Business Model: We deploy a fabless semiconductor device horizontal business model as opposed to a vertical integration model since it is our mission to serve a broad customer base in the optical and wireless communications and defense markets with the best-in-class semiconductor components. We believe this will be driven by the system vendor end-customers’ desire for continuing price reduction with increasing volumes and will be enabled by the growth of capable component suppliers such as GigPeak as well as the availability of high quality electronics contract manufacturers (“ECMs”). We cultivate a “Virtual Vertical Integrated” (“VVITM”) model, which is based on strong relationships with our customers, ECMs and other component vendors in the supply chain with aligned objectives. We enable flattening and simplifying of the supply chain for faster, more cost-efficient and more effective development and delivery of products to the marketplace which results in more attractive prices.
Broadcasting and Streaming Solutions
Our broadcast and streaming solutions include a family of IC modules, software, algorithms and IP for the professional broadcast and streaming infrastructure market. We provide top of the line products, tools and technologies for the entire high-quality video content creation and distribution chain, from contribution and production through distribution over cable, satellite and OTT video streaming, such as:
| 1. |
Video Contribution: We were the first to market with a single chip to address all market needs, from legacy MPEG-2 4:2:0/4:2:2 8-bit to H.264 4:2:0/4:2:2 10-bit to AVC-I 50, AVC-I 100 and into future deployment of high efficiency video coding (“HEVC”), encoding and decoding applications. With over a decade of video quality leadership and technology innovation behind it, our D7Pro offers advanced encoding and decoding solution for video contribution and news gathering. In addition, the D7Pro offers a complete video-audio-ancillary data-mux integrated solution enabling high video quality, low latency at low bit rates for video encoding and decoding.
|
| 2. |
Video Production: As a market leader in professional video processing devices and software, we offer system vendors the market’s leading solutions for baseband video, audio and data processing. We enable a single design solution for all products within a production domain – routers, channel branding, video filtering, chroma/luma leveling, audio leveling and down mixing, format conversion, rescaling, low latency switching and more. Our solution is a dual channel 4:2:2 10-bit native solution with embedded memory and support for various I/O interfaces from storage, networking and peripheral component interconnect express (“PCIe”) to 1080p baseband video.
|
| 3. |
Primary Video Distribution: Content originators are rapidly adopting advanced technologies such as H.264 and efficient statistical multiplexing systems as well as H.265 compression for higher compression efficiency while continuing to support legacy MPEG-2 formats. Vendors of encoding, decoding and transcoding equipment for primary distribution must quickly bring to market solutions that support high video quality H.264 SD/HD, H.265 SD/HD as well as MPEG-2 SD/HD. Ideally, to minimize an operator’s operating expenses, these systems should enable both types of services to be aggregated in single bundle without compromising video quality.
|
Products
Networking: We design and market products that amplify electrical signals using amplifiers such as VCSEL and DML drivers for laser devices and modulator, and CDR devices, and TIAs, in the transmission path of data for all networking distances used in telecom and Datacom. In addition, we offer microwave and millimeter wave amplifiers to enable amplification of small signal radio signals into more powerful signals that can be transmitted over long distances to establish high throughput data connections or enable radar based applications. We have a comprehensive product portfolio, particularly at data rates that exceed 1 Gbps. The primary target markets and applications for our products include optical interface modules such as line-cards, transponders and transceivers within telecom and datacom switches and routers, and high speed wireless point-to-point millimeter wave systems. Our products are critical blocks used in telecom and datacom optical communications networks. For telecom, these networks range from long-haul to metro systems, and for datacom, from access to data-links to the consumers, where in all cases our devices satisfy and enable the conversion of data from the electrical domain to the optical domain, and vice-versa. Our optical drivers amplify the input digital data stream that is used to directly modulate the laser or to drive an external modulator that acts as a precise shutter to switch on and off the light that creates the modulated optical data stream. At the other end of the optical fiber, our sensitive receiver TIAs detect and amplify the small currents generated by photo-diodes converting the received light into an electrical current. The TIAs amplify the small current signals into a larger voltage signal that can be read by the electronics and processors in the network servers. We supply an optimized component for each type of laser and photo-diode depending upon the speed, reach and required cost. Generally, a shorter reach applications result in higher volume and lower average sales price, due to the less demanding electrical product specifications to support the required integrity preservation of the traveled optical signal.
Broadcasting: We offer the market’s foremost advanced enterprise video broadcasting algorithmic and software solutions that are made available as a stand-alone software stacked package that can be deployed to industry standard silicon processors or customized FPGAs, or provided on our proprietary digital-signal-processor (“DSP”) silicon device. Our silicon and software are all-complete system solutions with rich features including high video quality SD/HD H.265, H.264, MPEG-2, VBR/CBR, ABR, video statistical multiplexing, digital ad-insertion, low latency encoding and complete video, audio and data multiplexing.
Growth Strategy
Our objective is to be the leading provider of high performance electronic and electro-optic components for the optically and wirelessly connected digital world enabling the end-to-end high speed information streaming on the network through telecom, datacom and consumer-electronic infrastructure, growing through both organic and strategic means. Elements of our strategy include the following:
Focus on High Growth Emerging Market Opportunities. We will continue to focus our product development resources on high growth emerging market segments both within the markets we currently serve as well as in new markets that utilize our core technologies. We will continue to invest substantially in high performance products for 100 Gbps, 400 Gbps and beyond optical communications applications, where we have constantly enhanced and will continue to enhance our device portfolio offering. We intend to leverage our extensive knowledge in fiber-optics telecom and datacom communications systems to continue to develop lead devices for high speed links for various emerging consumer electronic applications, such as optical connections, virtual and augment reality (“VR” and “AR”), ultra-wide bandwidth in-door devices, Wi-Fi and wireless connected security sensors, natural interfaces and 3D cameras such as time-of-flight (“TOF”) cameras. We will also focus on emerging high speed wireless point-to-point E-band and V-band communications enabled by our millimeter 71GHz to 86GHz, and 60GHz, respectively, MMIC solutions. We believe that high growth opportunities exist even within more established communications segments by virtue of introducing innovative device and system architectures as well as business models to disrupt the established players and value chain relationships. Outside of telecom and datacom, we are able to leverage the same designs re-characterized for RF systems for use in defense applications such as phased array radars and super-computers and in certain emerging areas of the consumer electronics market.
Grow Our Customer Base. We intend to continue to broaden our strategic relationship with certain key customers by maximizing design wins across their product lines. We intend to continue to leverage the approved vendor status we have with these key customers to qualify our products into additional optical and wireless systems, a process that is accelerated when we have already been qualified in a customer’s systems. We intend to add to our number of strategic relationships by selectively targeting certain customers with whom we are not yet a strategic vendor. We will expand our development efforts with these customers through initiatives including providing specialized sales and support resources, holding technology forums to align our product development effort with the customers’ needs and implementing custom manufacturing linkages.
Engage Customers Early in their Product Planning Cycle. By engaging our customers early in their system design process, we gain critical information regarding their system requirements and objectives that influence our component design. Our sales force, product marketing teams and development engineers engage regularly with our customers to understand their product development plans. Likewise, our early involvement in their system development processes also enables us to influence standards and introduce differentiated products early to market. Moreover, we believe that this interaction between ourselves and our customers provides us a competitive advantage, valuable insight and a close customer relationship that grows over each generation of products introduced by our customers and allows us to enhance and constantly improve our support and service to those customers.
Partner for Innovation. Over the past few years, we have successfully partnered with lead “Lighthouse” commercial customers and contract manufacturers on research and development efforts for our electronic components. We see this as a core element of our strategy both to support the investment required to maintain our innovation as well as to align our research and development with the future needs of commercial and defense markets. In order to maintain our position at the forefront of next generation optical modules and components, we intend to continue these relationships. These partnerships with “Lighthouse” customers are generally done for the development of products required in a one to two-year time horizon and often on a shared investment basis. We believe that this helps us stay aligned with market needs when considering the sometimes significant investment in a new development.
Strategic Acquisitions and Joint Ventures. To augment our organic growth strategy, we actively pursue acquisitions that provide an efficient alternative to in-house development of technology, products or revenue. The synergies we search for include efficient extensions of our product offerings to strengthen our market position, enhancing our technology base, increasing our revenue base and expanding our customer base in selected markets to provide cross selling opportunities and to enhance our geographic or market segment presence. We continuously evaluate potential acquisitions against the above criteria. As an example, on April 5, 2016, we acquired Magnum, a privately-held fabless semiconductor manufacturer and software solution developer, and brought a well-developed and comprehensive portfolio of video broadcasting and compression solutions to GigPeak, including silicon ICs, SoCs and software solutions, including high-end compression encoding and video-quality algorithm products, and a comprehensive library of intellectual property. The Magnum products, now marketed as GigPeak’s MX product-line, are offered solely for the professional and enterprise video broadcast infrastructure applications. Those products are the top of the line products, tools and technologies that can be deployed for the entire universe of video content creation and the associated distribution chain, from contribution and production through distribution over cable, telecom, satellite and OTT video streaming.
Strategic Minor Investments in Small Early Stage Companies. To augment our organic growth strategy and access critical software (“SW”) and hardware (“HW”) building blocks that can add to the differentiation of our emerging products, we execute minor financial investments from time to time in unique early stage companies that allow us to potentially create synergies in our respective future product development and to more effectively cooperate in developing new differentiated product roadmaps and addressing new markets for those products. For example, on January 25, 2016, we invested $1.2 million to obtain a minority stake in Anagog Ltd. (“Anagog”), based in Israel, which is the developer of the world’s largest crowdsourced parking network. Anagog is perfecting the mobility status algorithms that allow for advanced on-phone machine learning capabilities for the best user experience with ultra-low battery consumption and a high level of privacy protection. The exceptional software capabilities of Anagog, particularly in conjunction with indoor location tracking and navigation, provides a unique layer of applications that can be added to the applications tool-kit which can provide opportunities for future SoCs addressing new applications such as ultra-wide bandwidth video and media content streaming.
Technology and Research and Development
We utilize proprietary technology at many levels within our product development, ranging from basic materials research to sophisticated design concepts, integration and optimization techniques. In addition, we have a proven record of successfully productizing this research and bringing it to market in a swift and seamless manner. Our technology is protected by our patent portfolio and trade secrets developed in deployments with our extensive customer base. Our technologies include ultra-broadband MMIC design, MCM design, innovative ultra-low power laser driver and receiver IC design in silicon germanium, high speed analog and RF IC design, mixed signal IC design, structured and hybrid ASIC infrastructure, RF-ASICs, Optical-ASICs, HW, SW and algorithmic video streaming and broadcasting solutions..
Customers
We have a global enterprise customer base in the telecom, datacom, wireless, consumer electronics, defense and industrial electronics, broadcasting and video streaming markets. Our customers include many of the leading network system vendors worldwide. During 2016, we sold to major “Tier-One” equipment vendors in the United States, Europe, and Asia, as well as to leading industrial, aerospace and defense companies. The number of leading network systems vendors which supply the global telecom, datacom and wireless markets is concentrated, and so, in turn, is our customer base. The vast majority of our customers are in the telecom, datacom, broadcasting, streaming, industrial and commercial markets and consist of a broader range of enterprises that design and manufacture predominantly electro-optics and high speed information management products.
As part of our strategy, we market and sell our products through third-party distributors in certain markets such as China, Taiwan and Japan where the ability to make sales to end-user customers is dependent upon such a channel. Although we develop relationships with distributors in these markets that further our sales efforts, we do not control the activities of our distributors with respect to the marketing and sale of our products. Therefore, the reputation and performance of our distributors and their ability and willingness to sell our products, uphold our brand reputation, and expand their businesses and sales channels are essential to the growth of our business in these markets. Similarly, factors which are under our control, such as the development of our products, are essential to the growth of our business in these markets. Consistent with our relationship with individual customers, we do not have long-term purchase commitments from these distributor customers, and certain distributor agreements provide for semi-annual stock rotation privileges of 5 to 10 percent of net sales for the previous six-month period. As product sales have continued to grow in Asia, primarily in China and Taiwan, the distributors in those markets are making sales to multiple end-user customers. Maintaining distributors in these markets is necessary to our ability to make sales in such jurisdictions, however, due to the nature of our customer relationships with the distributors and the structure of the distribution market, it is possible to cease business operations with any particular distributor and put in place an alternative distribution arrangement without materially impacting our sales, provided we have an appropriately planned transition.
In addition, certain end-user customers in the Asia, United States and Europe do not make direct purchases of our products from us. Rather, purchases are made by distributors that are engaged by the end-user customers to manage their long-term inventory needs.
In fiscal year 2016, there were no customers or distributors who accounted for 10% or more of total revenue. In fiscal year 2015, one customer, Alcatel-Lucent, now Nokia, and three distributors, Pangaea (H.K.) Limited, in China, 3A, Inc., in the United States, and Litrax Technology Co., Ltd, in Taiwan, accounted for 23%, 16%, 11% and 10% of our total revenue, respectively.
Of our total revenue in 2016, 49%, 26% and 25% were generated by customers located in North America, Asia and Europe, respectively, compared with 33%, 35% and 30%, respectively, for the year ended December 31, 2015. For the year ended December 31, 2016, 94% of our revenue was contributed by product revenue and 6% of our revenue was contributed by development fees and other revenue. For the year ended December 31, 2015, 95% of our revenue was contributed by product revenue and 5% of our revenue was contributed by development fees and other revenue.
Manufacturing
During 2011, we received an ISO9001:2008 certification and have maintained it seamlessly, including successful completion of a complete renewal audit during 2014 and adding our subsidiary in Zurich in 2015. Our foundry and contract manufacturing partners are located in China, Japan, the Philippines, Taiwan, Thailand, and the United States. Some of our contract manufacturing partners that assemble or produce are strategically located close to our customers’ contract manufacturing facilities to shorten lead times and enhance flexibility.
We follow established new product introduction (“NPI”) processes that help to ensure product reliability and manufacturability by controlling when new products move from the sampling stage to mass production. We have stringent quality control processes in place for both internal and contract manufacturing. We utilize manufacturing planning systems to coordinate procurement and manufacturing to our customers’ forecasts. These processes and systems help us closely coordinate with our customers, support their purchasing needs and product release plans, and streamline our supply chain.
Electronic components: ICs and MCMs: For our ICs and MCMs, we use an outsourced contract manufacturing model. We have a clean-room equipped prototype manufacturing and testing facility in our San Jose location which is used to optimize manufacturing and test procedures to achieve internal yield and quality requirements before transferring volume production to our contract manufacturing partners. We develop long-term relationships with strategic contract manufacturing partners to reduce assembly costs and provide greater manufacturing flexibility. The manufacture of some products such as certain low volume, high complexity or customized multi-chip modules may remain in-house during the full production stage to speed time to market and bypass manufacturing transfer costs. We also have well-equipped testing laboratory facilities in our Zurich and Korea locations which are used to develop and optimize our developed devices in those locations.
For our less complex packaged chips and bare die products, we typically move new product designs directly to contract manufacturing partners. These products fit easily into a standard fabless semiconductor production flow and ramp up to greater volumes in mass production.
Sales, Marketing and Technical Support
In the communications market, we primarily sell our products through our direct sales force supported by a network of manufacturer representatives and distributors. Our sales force works closely with our engineers, product marketing and sales operations teams in an integrated approach to address a customer’s current and future needs. We assign account managers for each strategic customer account to provide a clear interface for our customers. The support provided by our engineers is critical in the product qualification stage. Optical transceiver modules and point-to-point microwave and millimeter wireless backhaul transceivers are complex products that are subject to rigorous qualification procedures of both the product and the supplier and these procedures differ from customer to customer. Also, many customers have custom requirements in order to differentiate their products and meet design constraints. Our sales, product marketing and general management personnel interface with our customers’ product development staff to address customization requests, collect market intelligence to define future product development, and represent us in pertinent standards bodies.
For our key customers, we hold periodic technology forums for their product development teams to interact directly with our research and development teams. These forums provide us insight into our customers’ longer term needs while helping our customers to adjust their plans to the product advances we can deliver. Also, our customers are increasingly utilizing contract manufacturers while retaining design and key component qualification activities. As this trend matures, we continually upgrade our sales operations and manufacturing support to maximize our efficiency, flexibility and coordination with our customers.
In the industrial market, we sell directly to key customers and also sell through a network of manufacturing representatives and distributors to address the broad range of applications and industries in which our products are used. The sales effort is managed by an internal sales team and supported by engineers and our general management and marketing team. Through our customer interactions, we believe that we continually increase our knowledge of each application’s requirements and utilize this information to improve our sales effectiveness and guide product development.
Since inception, we have actively communicated our brand worldwide through participation at trade shows and industry conferences, publication of research papers, bylined articles in trade media, and advertisements in trade publications and interactive media, interactions with industry press and analysts, press releases and our company website, as well as through print and electronic sales material.
Competition
The market for high-speed semiconductor and electro-optic devices is characterized by price competition, rapid technological change, short product life cycles, an ever-increasing number of customers and suppliers, and global competition. While no one company competes against us in all of our product areas, or offers the breadth of our product portfolio, our competitors range from large, international companies offering a wide range of products to smaller companies specializing in narrow markets. Due to the increasing market demand for high-speed, high-frequency and high-streaming and broadcasting components, we expect the entry of new competitors into our target markets both from existing semiconductor suppliers and from the internal operations of some companies producing products similar to ours for their own requirements.
We believe the principal competitive factors impacting all of our products are:
| · |
product performance including size, speed, functionality, operating temperature range, power consumption and reliability;
|
| · |
advanced features and functionality being bundled into our algorithmic and software stack solutions;
|
| · |
price to performance characteristics;
|
| · |
delivery performance and lead times;
|
| · |
development relationships with customers;
|
| · |
time to market;
|
| · |
breadth of product solutions;
|
| · |
strong customer relationships;
|
| · |
sales, technical and post-sales service and support;
|
| · |
technical partnership in the early stages of product development;
|
| · |
sales channels;
|
| · |
ability to drive standards and comply with new industry Multi Source Agreements (“MSAs”) and other standards;
|
| · |
ability to partner with emerging companies to provide differentiating, innovative solutions; and
|
| · |
business and financial stability.
|
GX Products - In the telecom and datacom segments, we compete with Qorvo, InPhi, Semtech, MicroSemi, Vitesse, MaxLinear and M/A-Com. We compete with Qorvo (formerly TriQuint) and MaxLinear predominantly in the 10 Gbps, 40 Gbps and 100 Gbps Mach Zehnder driver space; Oki, MicroSemi (formerly Centellax and Vitesse, respectively) predominantly in the 10 Gbps EML driver space; InPhi predominately in the 100 and 200 Gbps linear drivers and TIA spaces; Semtech predominately in the datacom space; MicroSemi (formerly Vitesse) in the 10 Gbps TIA receiver space, and M/A-Com predominately in the telecom driver and TIA space.
HX Products - In the market for physical medium dependent (“PMD”) ICs we compete with M/A-Com, Broadcom Limited (via their merger with Avago), Finisar, TE Connectivity (formerly Zarlink), Mellanox, and Semtech. It should be noted that out of the above list of competitors, Broadcom Limited, Mellanox, Finisar and TE Connectivity are vertically integrated transceiver module manufacturers with in-house PMD IC design capability.
EX Products - Our MMICs compete in the microwave and millimeter wave radio markets, an industry that is intensely competitive. We compete with Qorvo, ADI, RFMD, Northrop Grumman (for internal use), Sumitomo and M/A-Com in this product area.
CX Products - Our ASICs compete in the custom integrated circuit industry, an industry that is intensely competitive. In the low to medium volume market, the primary competitors include FPGA manufacturers like Xilinx, Intel via their acquisition of Altera, Lattice Semiconductor and Actel Corporation. In the medium to high volume market, there are over 30 companies competing in this market. Companies that we compete with most often include ON Semiconductor, eSilicon, Open Silicon, Faraday, Toshiba and eASIC.
MX Products - Our direct competition are the customized FPGA devices that are furnished with either open-source or proprietary available codecs and software solutions from variety of software design houses, as well as complete chip and system solutions like Harmonic, Ericsson, Ateme, Elemental and Vitec.
Patents and Other Intellectual Property Rights
We rely on patent, trademark, copyright and trade secret laws and internal controls and procedures to protect our technology. We believe that a robust technology portfolio that is assessed and refreshed periodically is an essential element of our business strategy. We believe that our success will depend in part on our ability to:
| · |
obtain patent and other proprietary protection for the materials, processes and device designs that we develop;
|
| · |
enforce and defend patents and other rights in technology, once obtained;
|
| · |
operate without infringing the patents and proprietary rights of third parties; and
|
| · |
preserve our company’s trade secrets.
|
As of December 31, 2016, we and our subsidiaries have 60 active patents and have 16 patent applications pending. Patents have been issued in various countries with the main concentration in the United States. Our patent portfolio covers a broad range of intellectual property including semiconductor design and manufacturing, device packaging, module design and manufacturing and electrical circuit design. We follow well-established procedures for patenting intellectual property. The portfolio also represents a balanced compilation of intellectual property that has been filed by the various companies we have acquired, and hence protects all of our product lines. As of December 31, 2016, we also licensed patented technology from IBM. Many of the pending and issued U.S. patents have one or more corresponding international or foreign patents or applications. Our existing significant U.S. patents will expire between August 2021 and November 2035.
We take extensive measures to protect our intellectual property rights and information. For example, every employee enters into a confidential information, non-competition and invention assignment agreement with us when they join and are reminded of their responsibilities when they leave. We also enter into and enforce a confidential information and invention assignment agreement with contractors.
We have patents and patents pending covering technologies relating to:
High-Speed Integrated Circuits
| · |
circuit topology to achieve ultra-large frequency bandwidth;
|
| · |
efficient voltage control circuitry for broadband high voltage drivers; and
|
| · |
control circuitry to stabilize gain control functionality over temperature.
|
RF Millimeter wave circuits
| · |
waveguide transitions;
|
| · |
component interconnect; and
|
| · |
impedance compensating circuits
|
RF Communications systems
| · |
impedance compensating circuits;
|
| · |
sectorized communications systems;
|
| · |
sectorized multi-function communications systems; and
|
| · |
wireless point to multi-point communications systems.
|
ASICs
| · |
wireless point to multi-point communications;
|
| · |
customizable integrated circuit devices;
|
| · |
single metal programmability in a customizable integrated circuit device;
|
| · |
configurable cells for customizable logic array device;
|
| · |
an in-circuit device, system and method to parallelize design and verification; and
|
| · |
methods of developing application specific integrated circuit devices.
|
Video Broadcasting and Streaming
| · |
compression algorithms for high quality AVC encoder;
|
| · |
video processing for noise removal and high quality video display;
|
| · |
global buffer-based statistical multiplex control for efficient video transmission; and
|
| · |
compression algorithms for high quality HEVC encoder.
|
Although we believe our patent portfolio is a valuable asset, the discoveries or technologies covered by the patents, patent applications or licenses may not have commercial value. Issued patents may not provide commercially meaningful protection against competitors. Other parties may be able to design around our issued patents or independently develop technology having effects similar or identical to our patented technology. The scope of our patents and patent applications is subject to uncertainty and competitors or other parties may obtain similar patents of uncertain scope.
Third parties may infringe the patents that we own or license, or claim that our potential products or related technologies infringe their patents. Any patent infringement claims that might be brought by or against our company may cause us to incur significant expenses, divert the attention of our management and key personnel from other business concerns and, if successfully asserted against us, require us to pay substantial damages. In addition, a patent infringement suit against us could force us to stop or delay developing, manufacturing or selling potential products that are claimed to infringe a patent covering a third party’s intellectual property.
We periodically evaluate our patent portfolio based on our assessment of the value of the patents and the cost of maintaining such patents, and may choose from time to time to let various patents lapse, terminate or be sold.
Employees
As of December 31, 2016, we had 132 full-time employees, including 74 engineers, mainly electrical and materials; 22 employees in manufacturing, operations, and quality,16 employees in global sales and marketing and 20 employees in general and administrative. In addition, we utilize the service of a number of independent contractors for various administrative, development, testing and manufacturing functions. Our employees in the United States are not covered by collective bargaining agreements. We consider our employee relations worldwide to be favorable.
Environmental
Our operations involve the use, generation and disposal of hazardous substances and are regulated under international, federal, state and local laws governing health and safety and the environment. We believe that our products and operations at our facilities comply in all material respects with applicable environmental laws and worker health and safety laws, however, the risk of environmental liabilities cannot be completely eliminated.
Government Regulations
We are subject to federal, state and local laws and regulations relating to the generation, handling, treatment, storage and disposal of certain toxic or hazardous materials and waste products that we use or generate in our operations. We regularly assess our compliance with environmental laws and management of environmental matters, and we believe that our products and operations at our facilities comply in all material respects with applicable environmental laws.
We are also subject to federal procurement regulations associated with U.S. government contracts. Violations of these regulations can result in civil, criminal or administrative proceedings involving fines, compensatory and punitive damages, restitution and forfeitures as well as suspensions or prohibitions from entering into government contracts. The reporting and appropriateness of costs and expenses under government contracts are subject to extensive regulation and audit by the Defense Contract Audit Agency, an agency of the U.S. Department of Defense. The contracts and subcontracts to which we are a party are also subject to potential profit and cost limitations and standard provisions that allow the U.S. government to terminate such contracts at its convenience. We are entitled to reimbursement of our allowable costs and to an allowance for earned profit if the contracts are terminated by the U.S. government for convenience.
Sales of our products and services internationally may be subject to the policies and approval of the U.S. Department of State and Department of Commerce. Any international sales may also be subject to United States and foreign government regulations and procurement policies, including regulations relating to import-export control such as ITAR, investments, exchange controls and repatriation of earnings.
Where You Can Find More Information
Our Annual Reports on Form 10-K, Quarterly Reports on Form 10-Q, recently filed Schedule 14D-9, Current Reports on Form 8-K and amendments to those reports filed or furnished pursuant to Section 13(a) or 15(d) of the Securities Exchange Act of 1934, as amended, are available free of charge as soon as possible after we electronically file them with, or furnish them to, the SEC. You can access our filings with the SEC by visiting our website. The information on our website is not, and shall not be deemed to be, a part of this Annual Report on Form 10-K or incorporated into any other filings we make with the SEC. Additionally, the Annual Reports on Form 10-K, Quarterly Reports on Form 10-Q, Current Reports on Form 8-K and amendments to those reports filed or furnished pursuant to Section 13(a) or 15(d) of the Securities Exchange Act of 1934, as amended, by our predecessor registrant Lumera are available at www.sec.gov.
Investors and others should note that we announce material financial information to our investors using our investor relations website, press releases, SEC filings and public conference calls and webcasts. We intend to also use the following social media channels as a means of disclosing information about the company, our services and other matters and for complying with our disclosure obligations under Regulation FD:
| · |
GigPeak Twitter Account (https://twitter.com/GigPeak)
|
The information we post through these social media channels may be deemed material. Accordingly, investors should monitor these accounts, in addition to following our press releases, SEC filings and public conference calls and webcasts. This list may be updated from time to time. The information we post through these channels is not a part of this Annual Report on Form 10-K. Further, the references to the URLs for these websites are intended to be inactive textual references only.
You can also read and copy any document that we file, including this Annual Report on Form 10-K, at the SEC’s Public Reference Room at 100 F Street, N.E., Washington, D.C. 20549. Call the SEC at 1-800-SEC-0330 for information on the operation of the Public Reference Room. In addition, the SEC maintains an Internet site at www.sec.gov that contains reports, proxy and information statements, and other information regarding issuers that file electronically with the SEC. You can electronically access our SEC filings there.
You should carefully consider the risks described below as well as the other information contained in this Form 10-K before making an investment decision. In addition to the risks described below, there may be additional risks and uncertainties not currently known to us or that we currently deem to be immaterial that may become material risks. Any of these risks could materially affect our businesses, financial condition or results of operations. In such case, you may lose all or part of your original investment.
We have incurred substantial operating losses in the past and we may not be able to achieve profitability in the future.
Historically, since inception in 2007 and through 2014, we have incurred net losses. We started to report net income in 2015. For the years ended December 31, 2016 and 2015, we recorded net income of $2.2 million and $1.2 million, respectively. For the years ended December 31, 2016 and 2015, we had cash inflows from operations of $3.3 million and $3.0 million, respectively. As of December 31, 2016 and 2015, we had an accumulated deficit of $98.8 million and $101.0 million, respectively. We expect development, sales and other operating expenses to increase in the future as we expand our business. If our revenue does not grow to offset these current expenses, we may not be profitable. In fact, in future quarters we may not have any revenue growth and our revenues could decline. Furthermore, if our operating expenses exceed expectations, financial performance will be adversely affected and we may continue to incur significant losses in the future.
We face intense competition and expect competition to increase in the future, which could have an adverse effect on our revenue, revenue growth rate, if any, and market share.
The global semiconductor market, in general, is highly competitive. Increased competition could result in price pressure, reduced profitability and loss of market share, any of which could materially and adversely affect our business, revenue, revenue growth rates and operating results. We compete in different target markets to various degrees on the basis of a number of principal competitive factors, including our products’ performance, features and functionality, energy efficiency, size, ease of system design, customer support, products, reputation, reliability, price and the quality of our product roadmap. We expect competition to increase and intensify as more and larger semiconductor companies, as well as the internal resources of large, integrated original equipment manufacturers, or OEMs, enter our markets.
Although we believe we currently compete favorably with our competitors, we cannot be certain that we will be able to compete successfully against either current or new competitors in the future. Our competitors range from large, international companies offering a wide range of semiconductor products to smaller companies specializing in narrow markets and internal engineering groups within device manufacturers, some of which may be our customers. Some of our competitors which are large public companies have longer operating histories and greater financial, technical, marketing resources than we have. Our primary competitors include Qorvo, Vitesse, Oki, Inphi, M/A-Com, Semtech, Microsemi, Broadcom Limited (via their merger with Avago), Finisar, MaxLinear, TE Connectivity (formerly Zarlink), Mellanox and Ambarella. We expect competition in the markets in which we participate to increase in the future as existing competitors improve or expand their product offerings. In addition, we believe that a number of other public and private companies are in the process of developing competing products for various broadband communications applications. Because our products often are “building block” semiconductors which provide functions that in some cases can be integrated into more complex integrated circuits, we also face competition from manufacturers of integrated circuits, some of which may be existing customers that develop their own integrated circuit products.
Our ability to compete successfully depends on elements both within and outside of our control, including industry and general economic trends. During past periods of downturns in our industry, competition in the markets in which we operate intensified as manufacturers of semiconductors reduced prices in order to combat production overcapacity and high inventory levels. Many of our competitors have substantially greater financial and other resources with which to withstand similar adverse economic or market conditions in the future. Moreover, the competitive landscape is changing as a result of consolidation within our industry as some of our competitors have merged with or been acquired by other competitors, and other competitors have begun to collaborate with each other. These developments may materially and adversely affect our current and future target markets and our ability to compete successfully in those markets.
We derive a significant portion of our revenue from a small number of customers and the loss of one or more of these key customers, the diminished demand for our products from a key customer, or the failure to obtain certifications from a key customer or its distribution channel could significantly reduce our revenue and profits.
A relatively small number of customers account for a significant portion of our revenue in any particular period. One or more of our key customers may discontinue operations as a result of consolidation, liquidation or otherwise, or reduce significantly its business with us due to the current economic conditions or their current situation. Reductions, delays and cancellation of orders from our key customers or the loss of one or more key customers could significantly reduce our revenue and profits. There is no assurance that our current customers will continue to place orders with us, that orders by existing customers will continue at current or historical levels or that we will be able to obtain orders from new customers.
Furthermore, as part of our strategy, we market and sell our products through third-party distributors in certain markets such as China, Taiwan and Japan where the ability to make sales to end-user customers is dependent upon such channels. Although we develop relationships with distributors in these markets that further our sales efforts, we do not control the activities of our distributors with respect to the marketing and sale of our products. Therefore, the reputation and performance of our distributors and their ability and willingness to sell our products, uphold our brand reputation, and expand their businesses and sales channels are essential to the growth of our business in these markets. Similarly, factors which are under our control, such as the development of our products, are essential to the growth of our business in these markets. Consistent with our relationship with individual customers, we do not have long-term purchase commitments from these distributor customers, and certain distributor agreements provide for semi-annual stock rotation privileges of 5 to 10 percent of net sales for the previous six-month period. As product sales have continued to grow in Asia, primarily in China and Taiwan, the distributors in those markets are making sales to multiple end-user customers. Maintaining distributors in these markets is necessary to our ability to make sales in such jurisdictions, however, due to the nature of our customer relationships with the distributors and the structure of the distribution market, it is possible to cease business operations with any particular distributor and put in place an alternative distribution arrangement without materially impacting our sales, provided we have an appropriately planned transition. However, we cannot provide assurances that we can adequately plan for all such needs to replace any of our distributors in these markets, or that any changes will not result in delay of shipment of our product or disruptions of distribution arrangements in the future, and loss of a key distributor could have an adverse effect on our business, revenue and operating results.
In addition, certain end-user customers in the United States do not make direct purchases of our products from us. Rather, purchases are made by distributors that are engaged by the end-user customers to manage their long-term inventory needs. Unlike the distributors we engage, these distributors have no stock rotation rights and, in some cases, may pay in advance of shipment. Since purchase commitments are dependent upon the purchasing decisions of the end-user customers supported by these distributors, there are no long-term purchase commitments necessary from these distributor customers, and the risks that exist with individual customers apply equally to these customer relationships.
For the year ended December 31, 2016, there were no customers or distributors who accounted for 10% or more of total revenue. For the year ended December 31, 2015, one customer, Alcatel-Lucent, now Nokia, and three distributors, Pangaea (H.K.) Limited, in China, 3A, Inc., in the United States, and Litrax Technology Co., Ltd, in Taiwan, accounted for 23%, 16%, 11% and 10% of our total revenue, respectively. No other customer accounted for more than 10% of total revenue.
Average selling prices of our products could decrease rapidly, which could have a material adverse effect on our revenue and gross margins.
We may experience substantial period-to-period fluctuations in future operating results due to the erosion of our average selling prices. From time to time, we have reduced the average unit price of our products in anticipation of competitive pricing pressures, new product introductions by us or our competitors and for other reasons. We expect that we will have to do so again in the future. If we are unable to offset any reductions in our average selling prices by increasing our sales volumes or introducing new products with higher operating margins, our revenue and gross margins will suffer. To maintain our gross margins, we must develop and introduce new products and product enhancements on a timely basis and continually reduce our and our customers’ costs. Failure to do so could cause our revenue and gross margins to decline.
There may be a possible effect from the acquisition of Magnum on our future revenue recognition policy.
Historically, one of the primary revenue recognition models used by Magnum is to recognize license royalty revenue based upon reports received by customers during the quarter, assuming all other revenue recognition criteria are met. The customers generally report shipment information typically within 45 days following the end of their respective quarters. If there is a reliable basis upon which we can estimate royalty revenue prior to obtaining the customers’ reports, we will recognize the royalty revenues in the quarter in which they are earned. If there is not a reliable basis for estimating royalties, we will recognize revenue in the following quarter when the shipment report is received. Because we have not previously sold software or had license royalty revenue, this is a different type of revenue and revenue recognition policy than previously used by us. The application of revenue recognition or other accounting methodologies, assumptions, and estimates that are different from those we have historically used in our business could complicate our financial statements, expose us to additional accounting and audit costs, and increase the risk of accounting errors in our estimates and financial statements. In addition, this revenue recognition policy can lead to volatility from quarter to quarter in the amount of revenue recognized from license royalties.
If increasing use of our software fails to grow adequately such that we do not see growing license royalty revenues from our customers, our business may suffer. Our future growth and financial performance will depend in part on broad market acceptance and use of our software.
We could suffer unrecoverable losses on our customers’ accounts receivable, which would adversely affect our financial results.
Our operating cash flows are dependent on the continued collection of receivables. Our accounts receivable as of December 31, 2016 increased by $4.7 million or 44% compared to the balance as of December 31, 2015. Historically, we have not had significant uncollectible accounts. However, if a customer is unable or refuses to pay we could suffer additional accounting losses as well as a reduction in liquidity. A significant increase in uncollectible accounts would have an adverse impact on our business, liquidity and financial results.
If we fail to develop and introduce new or enhanced products on a timely basis, our ability to attract and retain customers could be impaired and our competitive position could be harmed.
We operate in a dynamic environment characterized by rapidly changing technologies and industry standards and technological obsolescence. To compete successfully, we must design, develop, market and sell new or enhanced products that provide increasingly higher levels of performance and reliability and meet the cost expectations of our customers. The introduction of new products by our competitors, the market acceptance of products based on new or alternative technologies, or the emergence of new industry standards could render our existing or future products obsolete. Our failure to anticipate or develop in a timely manner new or enhanced products or technologies in response to technological shifts could result in decreased revenue. In particular, we may experience difficulties with product design, manufacturing, marketing or certification that could delay or prevent our development, introduction or marketing of new or enhanced products. If we fail to introduce new or enhanced products that meet the needs of our customers or penetrate new markets in a timely fashion, we will lose market share and our operating results will be adversely affected.
Our business is subject to foreign currency risk.
Sales to customers located outside the United States comprised 54% and 70% of our revenue for the years ended December 31, 2016 and 2015, respectively. In addition, we have four subsidiaries overseas (Switzerland, Japan, Canada and Korea) that record their operating expenses in a foreign currency. Since sales of our products have been denominated to date primarily in U.S. dollars, increases in the value of the U.S. dollar could increase the price of our products so that they become relatively more expensive to customers in the local currency of a particular country, leading to a reduction in sales. Future international activity may result in increased foreign currency denominated sales. Gains and losses on the conversion to U.S. dollars of accounts receivable, accounts payable and other monetary assets and liabilities arising from international operations may contribute to fluctuations in our results of operations. We currently do not have hedging or other programs in place to protect against adverse changes in the value of the U.S. dollar as compared to other currencies to minimize potential adverse effects.
If our customers do not design our solutions into their product offerings, or if our customers’ product offerings are not commercially successful, our business would suffer.
With the acquisition of Magnum, we sell video processing SoC solutions to original equipment manufacturers, or OEMs, who include our SoCs in their products, and to original design manufacturers, or ODMs, who include our SoCs in the products that they supply to OEMs. We refer to ODMs as our customers and OEMs as our end customers, except as otherwise indicated or as the context otherwise requires. Our video processing SoCs are generally incorporated into our customers’ products at the design stage, which is referred to as a design win. As a result, we rely on OEMs to design our solutions into the products that they design and sell. Without these design wins, our business would be harmed. We often incur significant expenditures developing a new SoC solution without any assurance that an OEM will select our solution for design into its own product. Once an OEM designs a competitor’s device into its product, it becomes significantly more difficult for us to sell our SoC solutions to that OEM because changing suppliers involves significant cost, time, effort and risk for the OEM. Furthermore, even if an OEM designs one of our SoC solutions into its product, we cannot be assured that the OEM’s product will be commercially successful over time or at all or that we will receive or continue to receive any revenue from that OEM. If products or other product categories incorporating our SoC solutions are not commercially successful or experience rapid decline, our revenue and business will suffer.
We rely on a limited number of third parties to manufacture, assemble and test our products, and the failure to manage our relationships with our third-party contractors successfully could adversely affect our ability to market and sell our products.
In addition to our in-house manufacturing facilities, we operate an outsourced manufacturing business model that utilizes third-party foundry, assembly and test capabilities. As a result, we rely on third-party foundry wafer fabrication, assembly and test capacity, including sole sourcing, for many components or products. Currently, our semiconductor devices are manufactured by foundries operated by IBM Corp., WIN Semiconductors Cayman Islands Co., Ltd., Qorvo, UMC Group, Global Communication Semiconductors LLC., Sumitomo Electric Device, Tower Semiconductor Ltd., Taiwan Semiconductor Manufacturing Company, Limited and Northrop Grumman Space & Mission Systems. We also use third-party contractors for our assembly and test operations, which include, Bourns, SPEL Semiconductor Limited, ASE Group, and Fabrinet.
Relying on third party manufacturing, assembly and testing presents significant risks to us, including the following:
| · |
failure by us, or our customers or their end customers to qualify a selected supplier;
|
| · |
capacity shortages during periods of high demand;
|
| · |
reduced control over delivery schedules and quality;
|
| · |
shortages of materials and potential lack of adequate capacity during periods of excess demand;
|
| · |
misappropriation of our intellectual property;
|
| · |
limited warranties on wafers or products supplied to us;
|
| · |
potential increases in prices;
|
| · |
inadequate manufacturing yields and excessive costs;
|
| · |
difficulties selecting and integrating new subcontractors; and
|
| · |
political instability in countries where third-party manufacturers are located.
|
The ability and willingness of our third-party contractors to perform is largely outside our control. If one or more of our contract manufacturers or other outsourcers fails to perform its obligations in a timely manner or at satisfactory quality levels, our ability to bring products to market and our reputation could suffer. For example, in the event that manufacturing capacity is reduced or eliminated at one or more facilities, we could have difficulties fulfilling our customer orders and our net revenue could decline. In addition, if these third parties fail to deliver quality products and components on time and at reasonable prices, we could have difficulties fulfilling our customer orders, our net revenue could decline and our business, financial condition and results of operations would be adversely affected.
The loss of our relationship with any third-party semiconductor foundry without adequate notice would adversely impact our ability to fill customer orders and could damage our customer relationships.
The loss of our relationship with or access to any of the semiconductor foundries we currently use for the fabrication of custom designed components and any resulting delay or reduction in the supply to us of semiconductor devices, would severely impact our ability to fulfill customer orders and could damage our relationships with our customers. For example, we may not be successful in forming alternative supply arrangements that provide us with a sufficient supply of GaAs devices. GaAs devices are used in many of the products we manufacture. Because there are a limited number of semiconductor foundries that use the gallium arsenide process technologies we select for our products and that have sufficient capacity to meet our needs, using alternative or additional semiconductor foundries would require an extensive qualification process that could prevent or delay product shipments and revenues. We estimate that it may take up to nine to twelve months to shift production of a given semiconductor circuit design to a new foundry.
We do not have long-term supply contracts with most of our contract manufacturers or suppliers, and any disruption in our supply of products or materials could have a material adverse effect on our business, revenue and operating results.
We currently do not have long-term supply contracts with most of our third-party vendors. We make substantially all of our purchases on a purchase order basis, and our contract manufacturers are not required to supply us products for any specific period or in any specific quantity. We expect that it would take approximately nine to twelve months to transition performance of our foundry or assembly services to new providers. Such a transition would likely require a qualification process by our customers or their end customers. We generally place orders for products with some of our suppliers approximately four to five months prior to the anticipated delivery date, with order volumes based on our forecasts of demand from our customers. Accordingly, if we inaccurately forecast demand for our products, we may be unable to obtain adequate and cost-effective foundry or assembly capacity from our third-party contractors to meet our customers’ delivery requirements, or we may accumulate excess inventories. Our third-party contractors have not provided any assurance to us that adequate capacity will be available to us within the time required to meet additional demand for our products. In addition, the effects of war, terrorism, natural disaster or other catastrophic events could disrupt our supply of products or materials which could have a material adverse effect on our business, revenue and operating results.
Because of the shortages of some materials and components and our dependence on single source suppliers and custom components for our products for the optical communications, wireless and ASIC markets, we may be unable to obtain an adequate supply of materials and components of sufficient quality in a timely fashion, or may be required to pay higher prices or to purchase components of lesser quality.
Many of our products for the optical communications, wireless and ASIC markets are customized and must be qualified with our customers. This means that we cannot change suppliers, materials and components used in our products easily without the risks and delays associated with requalification. Accordingly, while a number of the components we use in our products are made by multiple suppliers, we may effectively have single source suppliers for many of these materials components. Further, we have recently experienced extended lead times for some components.
In addition, we currently purchase a number of materials and components, some from single source suppliers, including, but not limited to:
| · |
semiconductor wafers;
|
| · |
semiconductor devices;
|
| · |
application-specific monolithic microwave integrated circuits;
|
| · |
voltage regulators;
|
| · |
passive components;
|
| · |
unusual or low usage components;
|
| · |
surface mount components compliant with the EU’s Restriction of Hazardous Substances (“RoHS”),Directive;
|
| · |
packages, substrates, housings, component and custom metal parts;
|
| · |
high-frequency circuit boards; and
|
| · |
custom connectors.
|
Any delay or interruption in the supply of these or other components could impair our ability to manufacture and deliver these products, harm our reputation and cause a reduction in our revenues. In addition, any increase in the cost of the components that we use in these products could make these products less competitive and lower our margins. Shortages and quality issues could adversely impact our revenues. Our single source suppliers could enter into exclusive agreements with or be acquired by one of our competitors, increase their prices, refuse to sell their products to us, discontinue products or go out of business. Even to the extent alternative suppliers are available to us and their components are qualified with our customers on a timely basis, identifying them and entering into arrangements with them may be difficult and time consuming, and they may not meet our quality standards. We may not be able to obtain sufficient quantities of required components on the same or substantially the same terms.
Our customers require our products and our third-party contractors to undergo a lengthy and expensive qualification process which does not assure product sales.
Prior to purchasing our products, our customers require that both our products and our third-party contractors undergo extensive qualification processes, which involve testing of the products in the customer’s system and rigorous reliability testing. This qualification process may continue for six months or more. However, qualification of a product by a customer does not assure any sales of the product to that customer. Even after successful qualification and sales of a product to a customer, a subsequent revision to the product, changes in our customer’s manufacturing process or our selection of a new supplier may require a new qualification process, which may result in delays and in us holding excess or obsolete inventory. After our products are qualified, it can take an additional six months to a full year or even more before the customer commences volume production of components or devices that incorporate our products. Despite these uncertainties, we devote substantial resources, including design, engineering, sales, marketing and management efforts, to qualifying our products with customers in anticipation of sales. If we are unsuccessful or delayed in qualifying any of our products with a customer, sales of that product to the customer may be precluded or delayed, which may impede our growth and cause our business to suffer.
We are subject to order and shipment uncertainties, as well as unstable and unpredicted delivery schedule commitments, and differences between our estimates of customer demand and product mix and our actual results could negatively affect our inventory levels, sales and operating results.
Our revenue is generated on the basis of purchase orders with our customers rather than long-term purchase commitments. In addition, our customers can cancel purchase orders or defer the shipments of our products under certain circumstances. Our products are manufactured using semiconductor foundry partners according to our estimates of customer demand, which requires us to make separate demand forecast assumptions for every customer, each of which may introduce significant variability into our aggregate estimate. We have limited visibility into future customer demand and the product mix that our customers will require, which could adversely affect our revenue forecasts and operating margins. Moreover, because our target markets are relatively new, many of our customers have difficulty accurately forecasting their product requirements and estimating the timing of their new product introductions, which ultimately affects their demand for our products. In addition, the rapid pace of innovation in our industry could render significant portions of our inventory obsolete. Excess or obsolete inventory levels could result in unexpected expenses or increases in our reserves that could adversely affect our business, operating results and financial condition. Conversely, if we were to underestimate customer demand or if sufficient manufacturing capacity were unavailable, we could forego revenue opportunities, potentially lose market share and damage our customer relationships. In addition, any significant future cancellations or deferrals of product orders or the return of previously sold products due to manufacturing defects could materially and adversely impact our profit margins, increase our write-offs due to product obsolescence and restrict our ability to fund our operations.
Winning business is subject to lengthy competitive selection processes that require us to incur significant expenditures and meaningful resource allocation. Even if we begin a product design, a customer may decide to cancel or change its product plans, which could cause us to generate reduced and/or delayed revenue from a product along with unrecoverable expenses and adversely affect our results of operations.
The selection process for obtaining new business typically is lengthy and can require us to incur significant design and development expenditures and dedicate scarce engineering resources in pursuit of a single customer opportunity. We may not win the competitive selection process and may never generate any revenue despite incurring significant design and development expenditures. These risks are exacerbated by the fact that some of our customers’ products likely will have short life cycles. Failure to obtain business in a new product design could prevent us from offering an entire generation of a product, even though this has not occurred to date. This could cause us to lose revenue and require us to write off obsolete inventory, and could weaken our position in future competitive selection processes.
After securing new business, we may experience delays in generating revenue from our products as a result of the lengthy development cycle typically required. Our customers generally take a considerable amount of time to evaluate our products. The typical time from early engagement by our sales force to actual product introduction could run from 12 to 24 months. The delays inherent in these lengthy sales cycles increase the risk that a customer will decide to cancel, curtail, reduce or delay its product plans, causing us to lose anticipated sales. In addition, any delay or cancellation of a customer’s plans could materially and adversely affect our financial results, as we may have incurred significant expense and generated no revenue. Finally, our customers’ failure to successfully market and sell their products could reduce demand for our products and materially and adversely affect our business, financial condition and results of operations. If we were unable to generate revenue after incurring substantial expenses to develop any of our products, our business would suffer.
Many of our products will have long sales cycles, which may cause us to expend resources without an acceptable financial return and which makes it difficult to plan our expenses and forecast our revenue.
Many of our products will have long sales cycles that involve numerous steps, including initial customer contacts, specification writing, engineering design, prototype fabrication, pilot testing, regulatory approvals (if needed), sales and marketing and commercial manufacture. During this time, we may expend substantial financial resources and management time and effort without any assurance that product sales will result. The anticipated long sales cycle for some of our products makes it difficult to predict the quarter in which sales may occur.
Delays in sales may cause us to expend resources without an acceptable financial return and make it difficult to plan expenses and forecast revenues.
We are subject to the cyclical nature of the semiconductor industry.
The semiconductor industry is highly cyclical and is characterized by constant and rapid technological change, rapid product obsolescence and price erosion, evolving standards, short product life cycles and wide fluctuations in product supply and demand. The industry experienced a significant downturn during the recent global recession. These downturns have been characterized by diminished product demand, production overcapacity, and high inventory levels and accelerated erosion of average selling prices. The recent downturn and any future downturns could have a material adverse effect on our business and operating results. Furthermore, any upturn in the semiconductor industry could result in increased competition for access to third-party foundry and assembly capacity. We are dependent on the availability of this capacity to manufacture and assemble our products, and our third-party manufacturers have not provided assurances that adequate capacity will be available to us in the future. Those delivery cycles can be in some cases longer than 6 months.
A large proportion of our products are directed at the telecom, datacom, consumer electronics and networking markets, which continue to be subject to overcapacity and seasonality.
The technology equipment industry is cyclical and has experienced significant and extended downturns in the past, often in connection with, or in anticipation of, maturing product cycles, and capital spending cycles and declines in general economic conditions. The cyclical nature of these markets has led to significant imbalances in demand, inventory levels and production capacity. It has also accelerated the decrease of average selling prices per unit. We may experience periodic fluctuations in our financial results because of these or other industry-wide conditions. Developments that adversely affect the telecom, datacom, consumer electronics and networking markets, including delays in traffic growth and changes in U.S. government regulation, could halt our efforts to generate revenue or cause revenue growth to be slower than anticipated from sales of electro-optic devices, semiconductors and related products. Reduced spending and technology investment by telecom companies may make it more difficult for our products to gain market acceptance. Our potential customers may be less willing to purchase new technology such as our technology or invest in new technology development when they have reduced capital expenditure budgets.
We may require additional capital to continue to fund our operations. If we need but do not obtain additional capital, we may be required to substantially limit operations.
We may not generate sufficient cash from our operations to finance our anticipated operations for the foreseeable future from such operations. We could require additional financing sooner than expected if we have poor financial results, including unanticipated expenses, or an unanticipated drop in projected revenues. Such financing may be unavailable when needed or may not be available on acceptable terms. If we raise additional funds by issuing equity or convertible debt securities, the percentage ownership of our current stockholders will be reduced, and these securities may have rights superior to those of its common stock. If adequate funds are not available to satisfy either short-term or long-term capital requirements, or if planned revenues are not generated, we may be required to limit our operations substantially. These limitations of operations may include a possible sale or shutdown of portions of our business, reductions in capital expenditures and reductions in staff and discretionary costs.
We have incurred significant losses since inception, attributable to our efforts to design and commercialize our products, and only started to report net income in 2015. We have managed our liquidity during this time through a series of cost reduction initiatives and through increasing our line of credit with our bank. We had $35.8 million in cash and cash equivalents as of December 31, 2016. However, while we have additional cash available, our ability to continue as a going concern may be dependent on many events some of which are outside of our direct control, including, among other things, obtaining additional financing either privately or through public markets, should this be necessary, and customers purchasing our products in substantially higher volumes.
Restrictive covenants under our credit facility with Silicon Valley Bank may adversely affect our operations.
If we utilize our loan and security agreement with Silicon Valley Bank, it contains a number of restrictive covenants that will impose significant operating and financial restrictions on our ability to, without prior written approval from Silicon Valley Bank:
| · |
merge or consolidate, or permit any of our subsidiaries to merge or consolidate, with or into any other business organization, or acquire, or permit any of our subsidiaries to acquire, all or substantially all of the capital stock or property of another person or company;
|
| · |
sell, lease, or otherwise transfer, or permit any of our subsidiaries to sell, lease or otherwise transfer, all or any part of our business or property, except in the ordinary course of business or in connection with certain indebtedness or investments permitted under the loan and security agreement;
|
| · |
create, incur, or assume any indebtedness, other than certain indebtedness permitted under the loan and security agreement with Silicon Valley Bank;
|
| · |
pay any dividends (except in the form of our equity securities) or make any distributions or payment on, or redeem, retire or repurchase any capital stock; and
|
| · |
make any investment, other than certain investments permitted under the loan and security agreement.
|
As of December 31, 2016, we did not have an outstanding balance on our line of credit, but we did owe $13.0 million on our term loan. A failure to comply with the covenants contained in our loan and security agreement could result in an event of default under the agreement that, if not cured or waived, could result in the acceleration of the indebtedness and have a material adverse effect on our business, financial condition and results of operations.
The spending cuts imposed by the Budget Control Act of 2011 (“BCA”) could impact our operating results and profit.
The U.S. government continues to focus on developing and implementing spending, tax and other initiatives to stimulate the economy, create jobs, and reduce the deficit. One of these initiatives, the BCA, imposed greater constraints around government spending. In an attempt to balance decisions regarding defense, homeland security, and other federal spending priorities, the BCA immediately imposed spending caps that contain approximately $487 billion in reductions to the Department of Defense base budgets over the next ten years (2013 to 2021). Additionally, the BCA triggered an automatic sequestration process, effective March 1, 2013, that would have reduced planned defense spending by an additional $500 billion over a nine-year period that began in the U.S. government’s 2013 fiscal year.
On November 2, 2015, the President signed into law the Bipartisan Budget Act of 2015 (“BBA 2015”). BBA 2015 raises the limit on the government’s debt until March 2017 and raises the sequester caps imposed by the BCA by $80 billion, split equally between defense and non-defense spending over the next two years ($50 billion in the U.S. government’s 2016 fiscal year and $30 billion in the U.S. government’s 2017 fiscal year). On December 18, 2015, the President signed into law the Consolidated Appropriations Act of 2016, funding the government through September 30, 2016 and on February 9, 2016, the President submitted a budget proposal for the U.S. government’s 2017 fiscal year, consistent with BBA 2015 funding levels. BBA 2015 includes discretionary funding for Department of Defense of approximately $580 billion in the U.S. government’s 2016 fiscal year and $583 billion in the U.S. government’s 2017 fiscal year. This funding includes a base budget for the Department of Defense of approximately $521 billion in the U.S. government’s 2016 fiscal year and $524 billion in the U.S. government’s 2017 fiscal year. BBA 2015 also provides approximately $59 billion for Department of Defense Overseas Contingency Operations (“OCO”) spending in each of the U.S. government’s 2016 and 2017 fiscal years.
The Bipartisan Budget Act of 2013 (“BBA 2013”) passed by Congress in December 2013 alleviated some budget cuts that would have otherwise been instituted through sequestration in the U.S. government’s 2014 and 2015 fiscal years. Together, BBA 2013 and BBA 2015 (collectively, the “Bipartisan Budget Acts”) increased discretionary spending limits through the U.S. government’s 2017 fiscal year. However, the Bipartisan Budget Acts retained sequestration cuts for the U.S. government’s 2018 through 2021 fiscal years, including the across the- board spending reduction methodology provided for in the BCA. As a result, there remains uncertainty regarding how, or if, sequestration cuts will be applied in the U.S. government’s 2018 fiscal year and beyond. Department of Defense and other agencies may have significantly less flexibility in how to apply budget cuts in future years. While the defense budget sustained the largest single reductions under the BCA, other civil agencies and programs have also been impacted by significant spending reductions. In light of the BCA and deficit reduction pressures, it is likely that discretionary spending by the U.S. government will remain constrained for a number of years. Additionally, if an annual appropriations bill is not enacted for the U.S. government’s 2017 fiscal year or beyond, the U.S. government may operate under a continuing resolution, restricting new contract or program starts and government shutdowns could arise. We anticipate there will continue to be significant debate within the U.S. government over defense spending throughout the budget appropriations process for the U.S. government’s 2017 fiscal year and beyond. The outcome of these debates could have long-term consequences for our industry and company.
Although we cannot predict where any cuts that occur will be made or how long they may last, we believe our portfolio of product offerings are well positioned and will not be materially impacted by the Department of Defense budget cuts. However, the possibility remains that any Department of Defense budget cuts could have an impact on sales of our products which can be used downstream in military applications, and thus, the revenues which we derive from such sales.
Our future success depends in large part on the continued service of our key senior management, design engineering, sales, marketing, and technical personnel and our ability to identify, hire and retain additional, qualified personnel.
Our future success depends to a significant extent upon the continued service of our senior management personnel, including our Chairman of the Board and Chief Executive Officer, Dr. Avi Katz, our Chief Technical Officer, Andrea Betti-Berutto and our Chief Operating Officer, Dr. Raluca Dinu. We do not maintain key person life insurance on any of our executive officers. The loss of key senior executives could have a material adverse effect on our business. There is intense competition for qualified personnel in the semiconductor industries, and we may not be able to continue to attract and retain engineers or other qualified personnel necessary for the development of our business, or to replace engineers or other qualified personnel who may leave our employment in the future. There may be significant costs associated with recruiting, hiring and retaining personnel. Periods of contraction in our business may inhibit our ability to attract and retain our personnel. Loss of the services of, or failure to recruit, key design engineers or other technical and management personnel could be significantly detrimental to our product development or other aspects of our business.
Our business, financial condition and operating results would be harmed if we do not achieve anticipated revenues.
In response to anticipated long lead times to obtain inventory and materials from outside contract manufacturers, suppliers and foundries, we may need to order materials in advance of anticipated customer demand. This advance ordering may result in excess inventory levels or unanticipated inventory write-downs if expected orders fail to materialize, or other factors render our products less marketable. If we are forced to hold excess inventory or incur unanticipated inventory write-downs, our financial condition and operating results could be materially harmed.
Our expense levels are relatively fixed and are based on our expectations of future revenue. We have a limited ability to reduce expenses quickly in response to any revenue shortfalls. Changes to production volumes and impact of overhead absorption may result in a decline in our financial condition or liquidity.
Our strategy of growth through acquisitions and spin-outs could harm our business.
It is our intent to continue to grow through strategic acquisitions. Successful integration of newly acquired target companies may place a significant burden on our management and internal resources. The diversion of management’s attention and any difficulties encountered in the transition and integration processes could harm our business, financial condition and operating results. In addition, we may be unable to execute our acquisition strategy, resulting in under-utilized resources and a failure to achieve anticipated growth. Our operating results and financial condition will be adversely affected if we are unable to achieve, or achieve on a timely basis, cost savings or revenue opportunities from any future acquisitions, or incur unforeseen costs and expenses or experience unexpected operating difficulties from the integration of acquired businesses.
Our strategy of growth through establishing joint ventures with third-parties could harm our business.
It is our intent to continue to grow through strategic partnerships and joint ventures. Successful inception and funding of new strategic ventures may place a significant burden on our management and internal resources. The diversion of management’s attention and any difficulties encountered in the establishment of any joint venture could harm our business, financial condition and operating results. Furthermore, a joint venture involves certain risks including:
| · |
It may not be possible to maintain good relationships with a joint venture partner;
|
| · |
Our joint venture partners may in the future have economic or business interests that are inconsistent with our interests;
|
| · |
Funding, planned for or otherwise, may not come to fruition or be sufficient for operation of a joint venture;
|
| · |
Parties to a joint venture may fail to fulfill commitments, including providing accurate and timely accounting and financial information;
|
| · |
It is possible that a joint venture may experience operating difficulties and financial losses, which may lead to asset write-downs or impairment charges that could negatively impact the operating results of the joint venture or us, or impose unforeseen costs and expenses to remedy; and
|
| · |
It is possible that a joint venture could lose key personnel.
|
The occurrence of any of the foregoing risks or other failure of a joint venture may mean that we are unable to execute our partnership strategy or achieve on a timely basis revenue opportunities from a joint venture or anticipated growth, or may result in under-utilized resources.
We have made and continue to make strategic investments and enter into strategic licensing and collaborative partnerships and relationships with third parties. The anticipated benefits of these investments, partnerships and relationships may never materialize and these investments, partnerships and relationships may instead disrupt our business and harm our financial condition.
We have made and will continue to make strategic investments (most recently in January 2016 into Anagog Ltd.) in and enter into strategic licensing and collaborative partnerships and relationships with third parties with the goal of acquiring or gaining access to new and innovative semiconductor products and technologies, as well as other technologies which can be used to add to the differentiation of our emerging products, on a timely basis. Negotiating and performing under these arrangements involves significant time and expense, and we cannot assure you that the anticipated benefits of these arrangements will ever materialize or that the products or technologies involved will ever be commercialized or that, as a result, we will not have write down a portion or all of our investment. We may end up with investments in, or owing various obligations and commitments to, third parties related to these arrangements. Such arrangements can magnify several risks for us, including loss of control over the development and development timeline of products being developed with third parties. Accordingly, we face increased risk that development activities may result in products that are not commercially successful or that are not available in a timely fashion. In addition, any third party with whom we enter into a development, product collaboration or technology licensing arrangement may fail to commit sufficient resources to the project, change its policies or priorities and abandon or fail to perform its obligations related to the collaboration. The failure to timely develop commercially successful products through our development projects or strategic investment activities as a result of any of these and other challenges could have a material adverse effect on our business, results of operations and financial condition. Other challenges and risks presented by use of strategic partnerships include:
| · |
The acquisition of a partner with which we have an investment or strategic relationship by an unaffiliated
|
| · |
third party that either delays or jeopardizes the original intent of the partnering relationship or investment; and
|
| · |
Our inability to liquidate an investment in a privately held company when we believe it is prudent to do so which results in a significant reduction in value or loss of our entire investment.
|
We are subject to the risks frequently experienced by small public companies.
The likelihood of our success must be considered in light of the risks frequently encountered by small public companies, especially those formed to develop and market new technologies. These risks include our potential inability to:
| · |
establish product sales and marketing capabilities;
|
| · |
establish and maintain markets for our potential products;
|
| · |
identify, attract, retain and motivate qualified personnel;
|
| · |
continue to develop and upgrade our technologies to keep pace with changes in technology and the growth of markets using semiconductors;
|
| · |
develop expanded product production facilities and outside contractor relationships;
|
| · |
maintain our reputation and build trust with customers;
|
| · |
improve existing and implement new transaction processing, operational and financial systems;
|
| · |
scale up from small pilot or prototype quantities to large quantities of product on a consistent basis;
|
| · |
contract for or develop the internal skills needed to master large volume production of our products; and
|
| · |
fund the capital expenditures required to develop volume production due to the limits of available financial resources.
|
Our future growth will suffer if we do not achieve sufficient market acceptance of our products.
Our success depends, in part, upon our ability to maintain and gain market acceptance of our products. To be accepted, these products must meet the quality, technical performance and price requirements of our existing customers and potential new customers. The optical communications industry is currently fragmented with many competitors developing different technologies. Some of these technologies may not gain market acceptance. Our products may not be accepted by OEMs and systems integrators of optical communications networks and consumer electronics. In addition, even if we achieve some degree of market acceptance for our potential products in one industry, we may not achieve market acceptance in other industries for which we are developing products, where market acceptance is critical to meeting our financial targets.
Many of our current products are either in the final stages of development or are being tested by potential customers. We cannot be assured that our development efforts or customer tests will be successful or that they will result in actual material sales, or that such products will be commercially viable.
Achieving market acceptance for our products will require marketing efforts and the expenditure of financial and other resources to create product awareness and demand by customers. It will also require the ability to provide excellent customer service. We may be unable to offer products that compete effectively due to our limited resources and operating history. Also, certain large corporations may be predisposed against doing business with a company of our limited size and operating history. Failure to achieve broad acceptance of our products by customers and to compete effectively would harm our operating results.
Successful commercialization of current and future products will require us to maintain a high level of technical expertise.
Technology in our target markets is undergoing rapid change. To succeed in these target markets, we will have to establish and maintain a leadership position in the technology supporting those markets. Accordingly, our success will depend on our ability to: accurately predict the needs of target customers and develop, in a timely manner, the technology required to support those needs;
| · |
accurately predict the needs of target customers and develop, in a timely manner, the technology required to support those needs;
|
| · |
provide products that are not only technologically sophisticated but are also available at a price acceptable to customers and competitive with comparable products;
|
| · |
establish and effectively defend our intellectual property; and
|
| · |
enter into relationships with other companies that have developed complementary technology into which our products may be integrated.
|
We cannot be certain that we will be able to achieve any of these objectives.
The failure to compete successfully could harm our business.
We face competitive pressures from a variety of companies in our target markets. The telecom, datacom, and consumer opto-electronics markets are highly competitive and we expect that domestic and international competition will increase in these markets, due in part to deregulation, rapid technological advances, price erosion, changing customer preferences and evolving industry standards. Increased competition could result in significant price competition, reduced revenues or lower profit margins. Many of our competitors and potential competitors have or may have substantially greater research and product development capabilities, financial, scientific, marketing, and manufacturing and human resources, name recognition and experience than we do. As a result, these competitors may:
| · |
succeed in developing products that are equal to or superior to our products or that will achieve greater market acceptance than our products;
|
| · |
devote greater resources to developing, marketing or selling their products;
|
| · |
respond more quickly to new or emerging technologies or scientific advances and changes in customer requirements, which could render our technologies or potential products obsolete;
|
| · |
introduce products that make the continued development of our potential products uneconomical;
|
| · |
obtain patents that block or otherwise inhibit our ability to develop and commercialize potential products;
|
| · |
withstand price competition more successfully than us;
|
| · |
establish cooperative relationships among themselves or with third parties that enhance their ability to address the needs of prospective customers better than us; and
|
| · |
take advantage of acquisitions or other opportunities more readily than us.
|
Competitors may offer enhancements to existing products, or offer new products based on new technologies, industry standards or customer requirements that are available to customers on a much timelier basis than comparable products from our company or that have the potential to replace or provide lower cost alternatives to our products. The introduction of enhancements or new products by competitors could render our existing and future products obsolete or unmarketable. Each of these factors could have a material adverse effect on our company’s business, financial condition and results of operations.
We may be unable to obtain effective intellectual property protection for our trade secrets, potential products, technology and know-how.
Any intellectual property that we have or may acquire, license or develop in the future may not provide meaningful competitive advantages. Our patents and patent applications, including those we license, may be challenged by competitors, and the rights granted under such patents or patent applications may not provide meaningful proprietary protection. For example, there are patents held by third parties that relate to electro-optic devices. These patents could be used as a basis to challenge the validity or limit the scope of our patents or patent applications. A successful challenge to the validity or limitation of the scope of our patents or patent applications could limit our ability to commercialize the technology and, consequently, reduce revenues. Moreover, competitors may infringe our patents or those that we license, or successfully avoid these patents through design innovation. To combat infringement or unauthorized use, we may need to resort to litigation, which can be expensive, time-consuming and may not succeed in protecting our proprietary rights. In addition, in an infringement proceeding, a court may decide that our patents or other intellectual property rights are not valid or are unenforceable, or may refuse to stop the other party from using the intellectual property at issue on the grounds that it is non-infringing. Policing unauthorized use of our intellectual property is difficult and expensive, and we may not be able to, or have the resources to, prevent misappropriation of our proprietary rights, particularly in countries where the laws may not protect these rights as fully as the laws of the United States.
We also rely on the law of trade secrets to protect unpatented technology and know-how. We protect this technology and know-how by limiting access to those employees, contractors and strategic partners with a need to know this information and by entering into confidentiality agreements with these parties. Any of these parties could breach the agreements and disclose our trade secrets or confidential information to competitors, or such competitors might learn of the information in other ways. Disclosure of any trade secret not protected by a patent could materially harm our business.
We may be subject to patent infringement claims, or we may be required to defend or indemnify claims of patent infringements by others, which could result in substantial costs and liability and prevent us from commercializing potential products.
Third parties may claim that our potential products or related technologies infringe their patents. Any patent infringement claims brought against us may cause us to incur significant expenses, divert the attention of management and key personnel from other business concerns and, if successfully asserted, require us to pay substantial damages. In addition, as a result of a patent infringement suit, we may be forced to stop or delay developing, manufacturing or selling potential products that are claimed to infringe a patent covering a third party’s intellectual property unless that party grants us rights to use its intellectual property. We may be unable to obtain these rights on acceptable terms, if at all. Even if we are able to obtain rights to a third party’s patented intellectual property, these rights may be non-exclusive, and therefore competitors may obtain access to the same intellectual property. Ultimately, we may be unable to commercialize our potential products or may have to cease some business operations as a result of patent infringement claims, which could severely harm our business.
If our potential products infringe the intellectual property rights of others, we may be required to indemnify customers for any damages they suffer. Third parties may assert infringement claims against our current or potential customers. These claims may require us to initiate or defend protracted and costly litigation on behalf of customers, regardless of the merits of these claims. If any of these claims succeed, we may be forced to pay damages on behalf of these customers or may be required to obtain licenses for the products they use. If we cannot obtain all necessary licenses on commercially reasonable terms, we may be unable to continue selling such products.
The technology that we license from various third parties may be subject to government rights and retained rights of the originating research institution.
We license technology from various companies and entities. Many of these partners and licensors have obligations to government agencies or universities. Under their agreements, a government agency or university may obtain certain rights over the technology that we have developed and licensed, including the right to require that a compulsory license be granted to one or more third parties selected by the government agency.
In addition, our partners often retain certain rights under their licensing agreements, including the right to use the technology for noncommercial academic and research use, to publish general scientific findings from research related to the technology, and to make customary scientific and scholarly disclosures of information relating to the technology. It is difficult to monitor whether such partners limit their use of the technology to these uses, and we could incur substantial expenses to enforce our rights to this licensed technology in the event of misuse.
If we fail to develop and maintain the quality of our manufacturing processes, our operating results would be harmed.
The manufacture of our products is a multi-stage process that requires the use of high-quality materials and advanced manufacturing technologies. Manufacturing must occur in a highly controlled, clean room environment to minimize particles and other yield- and quality-limiting contaminants. In spite of stringent quality controls, weaknesses in process control or minute impurities in materials may cause a substantial percentage of the product in a lot to be defective. If we are unable to develop and continue to improve on our manufacturing processes or to maintain stringent quality controls, or if contamination problems arise, our operating results would be harmed.
The complexity of our products may lead to errors, defects and bugs, which could result in the necessity to redesign products or even recall them after shipment and could negatively impact our reputation with customers and our financial performance.
Products as complex as ours may contain errors, defects and bugs when first introduced or as new versions are released. Delivery of products with production defects, reliability, quality, or compatibility problems could significantly delay or hinder market acceptance of our products or result in a costly recall and could damage our reputation and adversely affect our ability to retain existing customers and to attract new customers, as well as create a material financial harm. In particular, certain products are customized or designed for integration into specific network systems. If our products experience defects, we may need to undertake a redesign of the product, a process that may result in significant additional expenses.
We may also be required to make significant expenditures of capital and resources to resolve such problems. There is no assurance that problems will not be found in new products after commencement of commercial production, despite testing by us, our suppliers and our customers.
Our products may contain component, manufacturing or design defects or may not meet our customers’ performance criteria, which could cause us to incur significant expenses to repair, harm our customer relationships and industry reputation, and reduce our revenues and profitability.
Our product warranties typically last twelve months. As a result of component, manufacturing or design defects, we may be required to repair or replace a substantial number of products under our product warranties, incurring significant expenses as a result. Further, our customers may discover latent defects in our products that were not apparent when the warranty period expired. These latent defects may cause us to incur significant repair or replacement expenses beyond the normal warranty period. In addition, any component, manufacturing or design defect could cause us to lose customers or revenues or damage our customer relationships and industry reputation.
We could be exposed to significant product liability claims that could be time-consuming and costly and impair our ability to obtain and maintain insurance coverage.
We may be subject to product liability claims if any of our products are alleged to be defective or harmful. Product liability claims or other claims related to our potential products, regardless of their outcome, could require us to spend significant time and money in litigation, divert management’s time and attention from other business concerns, require us to pay significant damages, harm our reputation or hinder acceptance of our products. Any successful product liability claim may prevent us from obtaining adequate product liability insurance in the future on commercially reasonable terms. Any inability to obtain sufficient insurance coverage at an acceptable cost or otherwise to protect against potential product liability claims could impair our ability to commercialize our products. In addition, certain of our products are sold under warranties. The failure of our products to meet the standards set forth in such warranties could result in significant expenses to us.
Our data and information systems and network infrastructure may be subject to hacking or other cyber security threats. If our security measures are breached and an unauthorized party obtains access to our customer data or our proprietary business information, our information systems may be perceived as being unsecure, which could harm our business and reputation, and our proprietary business information could be misappropriated which could have an adverse effect on our business and results of operations.
In our operations, we store and transmit our proprietary information and that of our customers. We have offices, research and development, and production facilities throughout the world, including key research and development facilities outside of the United States. Our operations are dependent upon the connectivity and continuity of our facilities and operations throughout the world. Despite our security measures, our information systems and network infrastructure may be vulnerable to cyber-attacks or could be breached due to an employee error or other disruption that could result in unauthorized disclosure of sensitive information which has the potential to significantly interfere with our business operations. Breaches of our security measures could expose us to a risk of loss or misuse of this information, litigation and potential liability. Since techniques used to obtain unauthorized access or to sabotage information systems change frequently and generally are not recognized until launched against a target, we may be unable to anticipate these techniques or to implement adequate preventive measures in advance of such an attack on our systems. In addition, we use a vendor that uses cyber or “Cloud” storage of information as part of their service or product offerings, and despite our attempts to validate the security of such services, our proprietary information may be misappropriated by third parties. In the event of an actual or perceived breach of our security, or the security of one of our vendors, the market perception of the effectiveness of our security measures could be harmed and we could suffer damage to our reputation or our business, or lose existing customers and lose our ability to obtain new customers. Additionally, misappropriation of our proprietary business information could prove competitively harmful to our business.
Our video processing SoC product strategy, which is targeted at markets demanding superior video quality, may not address the demands of our target customers and may not lead to increased revenue in a timely manner or at all, or even may deteriorate significantly, which could materially adversely affect our results of operations and limit our ability to grow.
We have adopted a product strategy for our video processing SoCs that focuses on our core competencies in video processing and delivering high levels of video quality. With this strategy, we continue to make further investments in the development of our video processor architecture. This strategy is designed to address the needs of customers in the market for video processing SoCs. Such markets may not develop, may take longer to develop than we expect, or may change direction altogether. We cannot assure you that the products we are currently selling and developing will adequately address the demands of our target customers, or that we will be able to produce our new products at costs that enable us to price these products competitively.
Rapidly changing industry standards could make our video processing solutions obsolete, which would cause our operating results to suffer.
We design our video processing solutions to conform to video compression standards, including MPEG-2, H.264 and H.265, set by industry standards setting bodies such as ITU-T Video Coding Experts Group and the ISO/IEC Moving Picture Experts Group. Generally, our solutions comprise only a part of a camera or broadcast infrastructure equipment device. All components of these devices must uniformly comply with industry standards in order to operate efficiently together. We depend on companies that provide other components of the devices to support prevailing industry standards. Many of these companies are significantly larger and more influential in driving industry standards than we are. Some industry standards may not be widely adopted or implemented uniformly, and competing standards may emerge that may be preferred by our customers or by consumers. If our customers or the suppliers that provide other device components adopt new or competing industry standards with which our solutions are not compatible, or if the industry groups fail to adopt standards with which our solutions are compatible, or adopt free open source codecs, our existing solutions would become less desirable to our customers. As a result, our sales would suffer or even completely vanish, and not only would we lose a major source of revenue, but we could be required to make significant expenditures to develop new SoC solutions. For example, if the new H.265 video compression standard is not broadly adopted by our customers or potential customers, sales of our H.265 compliant solutions would suffer and we may be required to expend substantial resources to comply with an alternative video compression standard. In addition, existing standards may be challenged as infringing upon the intellectual property rights of other companies or may be superseded by new innovations or standards.
Products for communications applications are based on industry standards that are continually evolving. Our ability to compete in the future will depend on our ability to identify and ensure compliance with these evolving industry standards, including any new video compression standards, and our ability to deliver superior products against potential open source free products that will be made available in the market. The emergence of new industry standards could render our solutions incompatible with products developed by other suppliers. As a result, we could be required to invest significant time and effort and to incur significant expense to redesign our solutions to ensure compliance with relevant standards. If our solutions are not in compliance with prevailing industry standards for a significant period of time, we could miss opportunities to achieve crucial design wins, which could harm our business.
The complexity of our video processing SoC solutions could result in unforeseen delays or expenses from undetected defects, errors or bugs in hardware or software which could reduce the market adoption of our new solutions, damage our reputation with current or prospective customers and adversely affect our operating costs.
Highly complex video processing SoC solutions such as ours frequently contain defects, errors and bugs when they are first introduced or as new versions are released. We have in the past and may in the future experience these defects, errors and bugs. If any of our solutions have reliability, quality or compatibility problems, we may not be able to successfully correct these problems in a timely manner or at all. In addition, if any of our proprietary features contain defects, errors or bugs when first introduced or as new versions of our solutions are released, we may be unable to timely correct these problems. Consequently, our reputation may be damaged and customers may be reluctant to buy our solutions, which could harm our ability to retain existing customers and attract new customers, and could adversely affect our financial results. In addition, these defects, errors or bugs could interrupt or delay sales to our customers. If any of these problems are not found until after we have commenced commercial production of a new product, we may incur significant additional development costs and product recall, repair or replacement costs. These problems may also result in claims against us by our customers or others.
Unknowing use of open source software in our products, processes and technology may expose us to additional risks and compromise our proprietary intellectual property.
We may unknowingly utilize and incorporate software that is subject to an open source license in our products, processes and technology in a manner that could create unintended risks. Open source software is typically freely accessible, usable and modifiable. Certain open source software licenses, such as the GNU General Public License, require a user who distributes the open source software as a component of the user’s software to disclose publicly part or all of the source code to the user’s software. In addition, certain open source software licenses require the user of such software to make any derivative works of the open source code available to others on terms unfavorable to us or at no cost. This can subject previously proprietary software to open source license terms.
While we monitor the use of open source software in our products, processes and technology and try to ensure that no open source software is used in such a way as to require us to disclose the source code to the related product, processes or technology when we do not wish to do so, such use could inadvertently occur. Additionally, if a third-party software provider has incorporated certain types of open source software into software we license from such third-party for our products, processes or technology, we could, under certain circumstances, be required to disclose the source code to our products, processes or technology. This could harm our intellectual property position and our business, results of operations and financial condition.
If we fail to effectively manage our growth, and effectively transition from our focus on research and development activities to commercially successful products, our business could suffer.
Failure to manage growth of operations could harm our business. To date, a large number of our activities and resources have been directed at the research and development of our technologies and development of potential related products. The transition from a focus on research and development to being a vendor of products requires effective planning and management. Additionally, growth arising from the expected synergies from future acquisitions will require effective planning and management. Future expansion will be expensive and will likely strain management and other resources.
In order to effectively manage growth, we must:
| · |
continue to develop an effective planning and management process to implement our business strategy;
|
| · |
hire, train and integrate new personnel in all areas of our business; and
|
| · |
expand our facilities and increase capital investments.
|
There is no assurance that we will be able to accomplish these tasks effectively or otherwise effectively manage our growth.
The industry and markets in which we compete are subject to constant consolidation, which may result in stronger competitors, fewer customers and reduced demand.
There has been continuous industry consolidation during the last few years among communications IC companies, network equipment companies and telecom companies. This consolidation is expected to continue as companies attempt to strengthen or hold their positions in evolving markets. Consolidation may result in stronger competitors, fewer customers and reduced demand, which in turn could have a material adverse effect on our business, operating results, and financial condition.
Our operating results are subject to volume and price fluctuations because we have international sales.
International sales account for a large portion of our revenue and may account for an increasing portion of future revenue. The revenue derived from international sales may be subject to certain risks, including:
| · |
foreign currency exchange fluctuations;
|
| · |
changes in regulatory requirements;
|
| · |
tariffs and other barriers;
|
| · |
timing and availability of export licenses;
|
| · |
political and economic instability;
|
| · |
difficulties in accounts receivable collections;
|
| · |
difficulties in staffing and managing foreign operations;
|
| · |
difficulties in managing distributors;
|
| · |
different and flexible holiday and vacation periods;
|
| · |
difficulties in obtaining governmental approvals for communications and other products;
|
| · |
reduced or uncertain protection for intellectual property rights in some countries;
|
| · |
longer payment cycles to collect accounts receivable in some countries;
|
| · |
the burden of complying with a wide variety of complex foreign laws and treaties; and
|
| · |
potentially adverse tax consequences.
|
We are subject to regulatory compliance related to our operations.
We are subject to various U.S. governmental regulations related to occupational safety and health, labor and business practices. Failure to comply with current or future regulations could result in the imposition of substantial fines, suspension of production, alterations of our production processes, cessation of operations, or other actions, which could harm our business.
Regulations related to “conflict minerals” may force us to incur additional expenses, may result in damage to our business reputation and may adversely impact our ability to conduct our business.
In August 2012, under the Dodd-Frank Wall Street Reform and Consumer Protection Act of 2010, the SEC adopted new requirements for companies that use certain minerals and derivative metals (referred to as “conflict minerals,” regardless of their actual country of origin) in their products. Some of these metals are commonly used in electronic equipment and devices, including our products. These new requirements will require companies to investigate, disclose and report whether or not such metals originated from the Democratic Republic of Congo or adjoining countries. We have a complex supply chain for the components and parts used in each of our products. We have numerous foreign suppliers, many of whom are not obligated by the new law to investigate their own supply chains. As a result, we may incur significant costs to comply with the diligence and disclosure requirements, including costs related to determining the source of any of the relevant metals used in our products. In addition, because our supply chain is complex, we may not be able to sufficiently verify the origin of all the relevant metals used in our products through the due diligence procedures we implement, which may harm our business reputation. We may have customers who will need to know our conflict mineral status to satisfy their own SEC reporting obligations (if any), and as a result we may also face difficulties in satisfying customers if they require that we prove or certify that our products are “conflict free.” Key components and parts that can be shown to be “conflict free” may not be available to us in sufficient quantity, or at all, or may only be available at significantly higher cost to us. If we are not able to meet customer requirements, customers may choose to disqualify us as a supplier. Any of these outcomes could adversely impact our business, financial condition or operating results.
Although the SEC has provided temporary relief for products deemed to be “DRC Conflict Undeterminable” if we are unable to determine whether the minerals in our products originated from a covered country or were used to finance or benefit armed groups in the covered countries for a temporary two year period, or in the case of smaller reporting companies such as GigPeak for a period of four years, we will still be required to file a Conflict Minerals Report and include certain disclosures similar to those required for “Not DRC Conflict Free” products, but we will not be required to obtain an audit of that report. We will nonetheless be required to disclose the steps we have taken or intend to take to mitigate the risk that the conflict minerals in our products are benefitting armed groups in the covered countries. This additional reporting and compliance burden may increase our expenses and costs related to our supply chain and disclosure requirements.
We may incur a liability arising from our use of hazardous materials.
Our business and facilities are subject to a number of federal, state and local laws and regulations relating to the generation, handling, treatment, storage and disposal of certain toxic or hazardous materials and waste products that are used or generated in our operations. Many of these environmental laws and regulations subject current or previous owners or occupiers of land to liability for the costs of investigation, removal or remediation of hazardous materials. In addition, these laws and regulations typically impose liability regardless of whether the owner or occupier knew of, or were responsible for, the presence of any hazardous materials and regardless of whether the actions that led to their presence were taken in compliance with the law. Our domestic facilities use various chemicals in manufacturing processes that may be toxic and covered by various environmental controls. These hazardous materials may be stored on site. The waste created by use of these materials is transported off- site by an unaffiliated waste hauler. Many environmental laws and regulations require generators of waste to take remedial actions at an off-site disposal location even if the disposal was conducted lawfully. The requirements of these laws and regulations are complex, change frequently and could become more stringent in the future. Failure to comply with current or future environmental laws and regulations could result in the imposition of substantial fines, suspension of production, alteration of production processes, cessation of operations or other actions, which could severely harm our business.
Government regulation of the communications industry could limit the growth of the markets that we serve or could require costly alterations of our current or future products.
The markets that we serve are highly regulated. Communications service providers must obtain regulatory approvals to operate broadband wireless access networks within specified licensed bands of the frequency spectrum. Further, the Federal Communications Commission and foreign regulatory agencies have adopted regulations that impose stringent RF emissions standards on the communications industry that could limit the growth of the markets that we serve or could require costly alterations of our current or future products.
We may be unable to export some of our potential products or technology to other countries, convey information about our technology to citizens of other countries or sell certain products commercially, if the products or technology are subject to U.S. export or other regulations.
We are developing certain products that we believe the U.S. government and other governments may be interested in using for military, information gathering or antiterrorism activities. U.S. government export regulations may restrict us from selling or exporting these potential products into other countries, exporting our technology to those countries, conveying information about our technology to citizens of other countries or selling these potential products to commercial customers. We may be unable to obtain export licenses for products or technology if necessary. We currently cannot assess whether national security concerns would affect our potential products and, if so, what procedures and policies we would have to adopt to comply with applicable existing or future regulations.
We are subject to risks associated with the imposition of legislation and regulations relating to the import or export of high technology products. We cannot predict whether quotas, duties, taxes or other charges or restrictions upon the importation or exportation of our products will be implemented by the United States or other countries.
Various laws and regulations potentially affect the import and export of our products, including export control, tax and customs laws. We are also at risk of being out of compliance with certain of these regulations. For example, we recently self-reported certain voluntary disclosures to the Office of Defense Trade Compliance relating to certain ITAR controlled ASICs. Furthermore, some customer purchase orders and agreements are governed by foreign laws, which may differ significantly from laws in the United States. As a result, our ability to enforce our rights under such agreements may be limited compared with our ability to enforce our rights under agreements governed by laws in the United States.
Our worldwide operations are subject to political, legal and economic risks and natural disasters, which could have a material adverse effect on us.
We maintain operations around the world, including in North America, Europe and Asia. We rely on third party wafer foundries in the United States and Asia. Nearly all product assembly and final testing of our products that we do not perform is performed at third-party facilities in Asia. We also have international sales operations and expect that international sales will continue to be a significant portion of total sales in the foreseeable future. The political, legal and economic risks associated with our operations in foreign countries include, without limitation:
| · |
expropriation;
|
| · |
changes in a specific country’s or region’s political or economic conditions;
|
| · |
geopolitical and security issues, such as armed conflict and civil or military unrest, crime, political instability, and terrorist activity;
|
| · |
changes in tax laws, trade protection measures and import or export licensing requirements;
|
| · |
difficulties in protecting our intellectual property;
|
| · |
difficulties in managing staffing and exposure to different employment practices and labor laws;
|
| · |
changes in foreign currency exchange rates;
|
| · |
restrictions on transfers of funds and other assets of our subsidiaries between jurisdictions;
|
| · |
changes in freight and interest rates;
|
| · |
disruption in air transportation between the United States and our overseas facilities;
|
| · |
loss or modification of exemptions for taxes and tariffs; and
|
| · |
compliance with U.S. laws and regulations related to international operations, including export control and economic sanctions laws and regulations and the Foreign Corrupt Practices Act.
|
In addition, our worldwide operations (or those of our business partners) could be subject to natural disasters, public health issues and other catastrophic events, such as earthquakes, tsunamis, flooding, typhoons and volcanic eruptions that disrupt manufacturing or other operations. For example, our San Jose operations are located near major earthquake fault lines in California. Any conflict or uncertainty in the countries in which we operate, including public health issues (for example, an outbreak of a contagious disease such as Avian Influenza, measles or Ebola), safety issues, natural disasters, fire, disruptions of service from utilities, nuclear power plant accidents or general economic or political factors, could have a material adverse effect on our business. Any of the above risks, should they occur, could result in an increase in the cost of components, production delays, general business interruptions, delays from difficulties in obtaining export licenses for certain technology, tariffs and other barriers and restrictions, longer payment cycles, increased taxes, restrictions on the repatriation of funds and the burdens of complying with a variety of foreign laws, any of which could ultimately have a material adverse effect on our business.
Worldwide political conditions may create uncertainties that could adversely affect our business. The United States has been and may continue to be involved in armed conflicts that could have a further impact on our sales and our supply chain. The consequences of armed conflict, political instability or civil or military unrest are unpredictable, and we may not be able to foresee events that could have a material adverse effect on us. Terrorist attacks or other hostile acts may negatively affect our operations, or adversely affect demand for our products, and such attacks or related armed conflicts may impact our physical facilities or those of our suppliers or customers. Furthermore, these attacks or hostile acts may make travel and the transportation of our products more difficult and more expensive, which could materially adversely affect us. Any of these events could cause consumer spending to decrease or result in increased volatility in the United States economy and worldwide financial markets.
We face substantial political risk associated with doing business in South Korea because of tensions in the political relationship between South Korea and North Korea.
As we have a South Korean subsidiary, GigOptix-Terasquare-Korea (“GTK”) Co., Ltd., as a result of our acquisition of Terasquare in September of 2015, we face substantial political risk associated from tensions in political relationship between South Korea and North Korea. Relations between South Korea and North Korea have been tense throughout Korea’s modern history. The level of tension between the two Koreas has fluctuated and may increase abruptly as a result of current and future events. In particular, since the death of Kim Jong-il, the former North Korean ruler, in mid-December 2011, there has been increased uncertainty with respect to the future of North Korea’s political leadership and concern regarding its implications for political and economic stability in the region. Although Kim Jong-il’s third son, Kim Jong-eun, has assumed power as his father’s designated successor, the long-term outcome of such leadership transition remains uncertain. In addition, in recent years, there have been heightened security concerns stemming from North Korea’s nuclear weapon and long-range missile programs and increased uncertainty regarding North Korea’s actions and possible responses from the international community. Some of the significant incidents in recent years include the following:
| · |
In August 2015, two Korean soldiers were injured in a landmine explosion near the Korean demilitarized zone. Claiming the landmines were set by North Koreans, the Korean army re-initiated its propaganda program toward North Korea utilizing loudspeakers near the demilitarized zone.
|
| · |
In January 2016, North Korea claimed that it had successfully conducted a nuclear bomb test. In February 2016, North Korea launched what it claimed was a satellite rocket, but what is viewed by others as a front for a ballistic missile test that could ultimately be used to carry a nuclear bomb. In response to the launch, it has been reported that Korea and the United States are discussing the deployment of the Terminal High Altitude Area Defense (“THAAD”) missile defense system to United States forces stationed in Korea. It has been reported that the United Nations Security Council adopted a unanimous resolution condemning the missile launch.
|
| · |
Following North Korea’s nuclear bomb test and rocket launch, in February 2016, the Korean government announced that it will shut down Kaesong Industrial Complex, a joint venture area with North Korea where over 100 South Korean companies run manufacturing facilities. North Korea responded by declaring Kaesong Industrial Complex a military control zone, ordering South Koreans to leave the complex, and forbidding them to take assets other than personal belongings. The shutdown is the second one since operations commenced at Kaesong Industrial Complex in 2005; the complex had been shut down once before, for five months in 2013. In addition, North Korea cut off all 48 telephone lines between North Korean and South Korean agencies.
|
| · |
In March 2016, South Korea announced unilateral sanctions against North Korea for North Korea’s missile and nuclear programs, and North Korean cyberattacks against South Korean officials and agencies. The sanctions were issued after North Korea threatened pre-emptive nuclear strikes against both the United States and South Korea.
|
| · |
In February 2017, Kim Jong-nam, the estranged older brother of Kim Jong-eun, was assassinated with VX nerve agent at an airport in Malaysia. Since taking power in 2011, Kim Jong-eun has executed at least 140 senior officials, often through the use of anti-aircraft artillery, most recently with the execution of five senior officials on February 27, 2017.
|
| · |
In March 2017, North Korea for the first time simultaneously launched four missiles into the Sea of Japan successfully in what may have been an attempt at simulating a “saturation attack” to overwhelm existing or planned missile defense capabilities in the region.
|
North Korea’s economy also faces severe challenges, and any adverse economic developments may further aggravate social and political tensions within North Korea. North Korea has also historically sought to test new presidential administrations in the United States. Although we do not derive any revenue from, nor sell any products in, North Korea, any future increase in tensions between South Korea and North Korea that may occur, for example, if North Korea experiences a leadership crisis, high-level contacts between South Korea and North Korea break down further, or if military hostilities occur between North Korea, South Korea, Japan and/or the United States, these could have a material adverse effect on the South Korean economy and on our business, financial condition, results of operations and the market value of our common stock.
There may be a limited public market for our common shares, and the ability of our stockholders to dispose of their common shares may be limited.
Our common shares are traded on the New York Stock Exchange. We cannot foresee the degree of liquidity that will be associated with our common shares. A holder of our common shares may not be able to liquidate his, her or its investment in a short time period or at the market prices that currently exist at the time the holder decides to sell. The market price for our common stock may fluctuate in the future, and such volatility may bear no relation to our performance.
Substantial future sales of our common stock in the public market could cause our stock price to fall.
The sale of our outstanding common stock or shares issuable upon exercise of options or warrants, or the perception that such sales could occur, could cause the market price of our common stock to decline. As of March 1, 2017, we had approximately 67,641,585 shares of common stock outstanding, 1,781,142 treasury shares, options to purchase 6,894,399 shares of our common stock, restricted stock units to issue 5,470,038 shares of our common stock outstanding, 3,770,516 shares of common stock reserved for future issuance under our equity incentive plans an warrants to purchase 161,554 shares of our common stock outstanding. These shares of common stock, including shares of common stock issued upon exercise of options and warrants, have either been registered under the Securities Act, and as such are freely tradable without further restriction, or are otherwise freely tradable without restriction (subject to the requirements of Rule 144 under the Securities Act), unless the shares are purchased by “affiliates” as that term is defined in Rule 144 under the Securities Act. Any shares purchased by an affiliate may not be resold except pursuant to an effective registration statement or an applicable exemption from registration, including an exemption under Rule 144 of the Securities Act. We may issue additional shares of our common stock in the future in private placements, public offerings or to finance mergers or acquisitions.
The exercise of options and warrants and other issuances of shares of common stock or securities convertible into common stock would dilute the interest of our stockholders.
As of March 1, 2017, there were outstanding options to purchase an aggregate of 6,894,399 shares of our common stock at a weighted-average exercise price of $2.26. As of March 1, 2017, there were outstanding restricted stock units to issue an aggregate of 5,470,038 shares of our common stock. As of March 1, 2017, there were warrants outstanding to purchase 161,554 shares of our common stock, at a weighted-average exercise price of $3.57 per share. The exercise of options and warrants at prices below the market price of our common stock could adversely affect the price of shares of our common stock. Additional dilution may result from the issuance of shares of our capital stock in connection with vesting of restricted stock units, acquisitions or in connection with other financing efforts.
Any issuance of our common stock that is not made solely to then-existing stockholders proportionate to their interests, such as in the case of a stock dividend or stock split, will result in dilution to each stockholder by reducing his, her or its percentage ownership of the total outstanding shares. Moreover, if we issue options or warrants to purchase our common stock in the future and those options or warrants are exercised, or if we issue restricted stock, stockholders may experience further dilution.
Our stockholder rights agreement may deter or adversely affect an attempt to acquire us or otherwise prevent a change in control.
On December 16, 2014, we entered into an Amended and Restated Rights Agreement (the “Amended Rights Agreement”) to extend the expiration date of our initial stockholder rights plan that was put in place on December 16, 2011. The Amended and Restated Rights Agreement amends the Rights Agreement previously adopted by us by (i) extending the expiration date by three years to December 16, 2017, (ii) decreasing the exercise price per right issued to stockholders pursuant to the stockholder rights plan from $8.50 to $5.25, and (iii) making certain other technical and conforming changes. Under the Rights Agreement, we issued a dividend of one preferred share purchase right for each share of our common stock held by stockholders of record as of January 6, 2012, and we will issue one preferred stock purchase right to each share of common stock issued by us between January 6, 2012 and the earlier of either the rights’ exercisability or the expiration of the Rights Agreement, as amended by the Amended Rights Agreement. Each right entitles stockholders to purchase one one-thousandth of our Series A Junior Preferred Stock. In addition, in connection with the Amended Rights Agreement, on December 15, 2014, we adopted an Amended and Restated Certificate of Designation of Series A Junior Preferred Stock, which increased the number of authorized shares of Series A Junior Preferred Stock from 300,000 shares to 750,000 shares, and sets forth the rights, preferences and privileges of the Series A Junior Preferred Stock. Each share of Series A Junior Preferred Stock retains the rights, preferences and privileges set forth above from the Original Certificate of Designation regarding redemption, dividends, voting rights, and liquidation preference.
In general, the exercisability of the rights to purchase preferred stock will be triggered if any person or group, including persons knowingly acting in concert to affect our control, is or becomes a beneficial owner of 10% or more of the outstanding shares of our common stock after the adoption date of the rights plan. Stockholders or beneficial ownership groups who owned 10% or more of the outstanding shares of our common stock on or before the adoption date will not trigger the preferred share purchase rights unless they acquire an additional 1% or more of the outstanding shares of our common stock. Each right entitles a holder with the right upon exercise to purchase one one-thousandth of a share of preferred stock at an exercise price that is currently set at $5.25 per right, subject to purchase price adjustments as set forth in the Amended Rights Agreement. Each share of preferred stock has voting rights equal to one thousand shares of common stock. In the event that exercisability of the rights is triggered, each right held by an acquiring person or group would become void. As a result, upon triggering of exercisability of the rights, there would be significant dilution in the ownership interest of the acquiring person or group, making it difficult or unattractive for the acquiring person or group to pursue an acquisition of us. These rights expire in December of 2017, unless earlier redeemed or exchanged by us.
In connection with our entry into the Merger Agreement, we entered into Amendment No. 1 to the Rights Agreement, dated February 10, 2017 (the “Rights Amendment”), amending the Amended Rights Agreement. The effect of the Rights Amendment is to permit the Offer, the Merger and the other transactions contemplated by the Merger Agreement. The Rights Amendment provides that: (i) neither IDT nor the Purchaser nor any of their respective affiliates shall be deemed to be an Acquiring Person (as such term is defined in the Amended Rights Agreement), (ii) neither a Distribution Date nor a Stock Acquisition Date (as each such term is defined in the Amended Rights Agreement) shall be deemed to have occurred, and the Rights (as such term is defined in the Amended Rights Agreement) will not detach from the shares of common stock or become non-redeemable, as a result of the execution, delivery or performance of the Merger Agreement, the Offer and/or the Merger, including the acquisition of shares of common stock pursuant thereto, the Tender and Support Agreements entered into in conjunction with the Merger Agreement or any other transaction contemplated by the Merger Agreement and (iii) the Rights (as such term is defined in the Amended Rights Agreement) and the Amended Rights Agreement shall expire and terminate immediately prior to the acceptance time for the Offer.
Our quarter-to-quarter performance may vary substantially, and this variance, as well as general market conditions, may cause our stock price to fluctuate greatly and potentially expose us to litigation.
The revenues for our product lines and our quarterly operating results may vary significantly based on many factors, including:
| · |
additions of new customers or loss of existing customers;
|
| · |
fluctuating demand for our products and technologies;
|
| · |
announcements or implementation by competitors of technological innovations or new products;
|
| · |
the status of particular development programs and the timing of performance under specific development agreements;
|
| · |
timing and amounts relating to the expansion of operations;
|
| · |
costs related to possible future acquisitions of technologies or businesses;
|
| · |
communications, information technology and semiconductor industry conditions;
|
| · |
fluctuations in the timing and amount of customer requests for product shipments;
|
| · |
the reduction, rescheduling or cancellation of orders by customers, including as a result of slowing demand for our products or our customers’ products;
|
| · |
changes in the mix of products that our customers buy;
|
| · |
competitive pressures on selling prices;
|
| · |
the ability of our customers to obtain components from their other suppliers;
|
| · |
fluctuations in manufacturing output, yields or other problems or delays in the fabrication, assembly, testing or delivery of our products or our customers’ products;
|
| · |
increases in the costs of products or discontinuance of products by suppliers; and
|
| · |
change in product and technology trends and demands by the market.
|
We base our current and future expense estimates, in large part, on estimates of future revenue, which is difficult to predict. We expect to continue to make significant operating and capital expenditures in the area of research and development and to invest in and expand production, sales, marketing and administrative systems and processes. We may be unable to, or may elect not to, adjust spending quickly enough to offset any unexpected revenue shortfall. If our increased expenses are not accompanied by increased revenue in the same quarter, our quarterly operating results would be harmed.
In future quarters, our results of operations may fall below the expectations of investors and the trading price of our common stock may decline as a consequence. We believe that quarter-to-quarter comparisons of our operating results will not be a good indication of future performance and should not be relied upon to predict the future performance of our stock price. In the past, companies that have experienced volatility in the market price of their stock have often been subject to securities class action litigation. We may be the target of this type of litigation in the future. Securities litigation could result in substantial costs and divert our attention from other business concerns, which could seriously harm our business.
Provisions in our amended and restated certificate of incorporation and amended and restated bylaws may prevent takeover attempts that could be beneficial to our stockholders.
Provisions of our certificate of incorporation and bylaws could discourage a takeover of our company even if a change of control would be beneficial to the interests of our stockholders. These charter provisions include the following:
| · |
a requirement that our Board of Directors (our “Board” of our “Board of Directors”) be divided into three classes, with approximately one-third of the directors to be elected each year; and
|
| · |
supermajority voting requirements (two-thirds of outstanding shares) applicable to the approval of any merger or other change of control transaction that is not approved by our continuing directors. The continuing directors are all of the directors as of the effective time of a merger or who are elected to the board upon the recommendation of a majority of the continuing directors.
|
We have never paid dividends on our capital stock, and we do not anticipate paying cash dividends for the foreseeable future.
We have never declared or paid cash dividends on our capital stock. We do not anticipate paying any cash dividends on our common stock for the foreseeable future. We currently intend to retain all available funds and future earnings, if any, to fund the development and growth of our business. As a result, capital appreciation, if any, of our common stock will be our stockholders’ sole source of potential gain for the foreseeable future.
Although we expect to realize certain benefits as a result of the acquisition of Magnum, there is the possibility that we may be unable to successfully integrate the business of our historical acquisitions and in particular that of last year’s Magnum acquisition, realize the anticipated benefits of the acquisition of Magnum or do so within the intended timeframe.
We devote significant management attention and resources to integrating the business practices and operations of all of our acquired entities with ours. We are still determining the exact nature of how the business and operations of in particular Magnum will be run. Potential difficulties we may encounter as part of the integration process include the following:
| · |
the costs of integration and compliance and the possibility that the full benefits anticipated to result from the acquisition of Magnum will not be realized;
|
| · |
lack of going forward commitment of Magnum customers, based on fatigue, loss of trust, or disapproval of the directions of Magnum pre-acquisition, or GigPeak post-acquisition;
|
| · |
loss of customers that will consider GigPeak to be a competitor post-acquisition, or due to the acquisition of a customer by a competitor to GigPeak;
|
| · |
differences in business backgrounds, corporate cultures and management philosophies that may delay successful integration;
|
| · |
differences in business backgrounds, corporate cultures and management philosophies that may delay successful integration;
|
| · |
the ability to create and enforce uniform standards, controls, procedures, policies and information systems; and
|
| · |
the disruption of, or the loss of momentum in, our ongoing businesses.
|
Any of these factors could adversely affect the ability of GigPeak following the acquisition of Magnum to benefit financially from the acquisition, maintain relationships with customers, suppliers, employees and other constituencies or our ability to achieve the anticipated benefits of the acquisition or could reduce or even completely diminish the earnings or otherwise adversely affect the business and financial results of GigPeak after the acquisition.
We may not have discovered undisclosed liabilities and product deficiencies of Magnum.
Our due diligence review of Magnum may not have discovered undisclosed liabilities and product deficiencies of Magnum. If Magnum has undisclosed liabilities or product deficiencies, we as a successor owner may be responsible for such undisclosed liabilities. we have tried to control its exposure to undisclosed liabilities by obtaining certain protections under the merger agreement for the acquisition of Magnum, including representations and warranties from Magnum regarding undisclosed liabilities, however, such representations and warranties expired by their terms on the completion of the Merger. There can be no assurance that such provisions in the merger agreement for the acquisition of Magnum will protect us against any undisclosed liabilities or product deficiencies being discovered or provide an adequate remedy for any undisclosed liabilities that are discovered. Such undisclosed liabilities could have an adverse effect on our business and results of operations and may adversely affect the value of our common stock after the consummation of the acquisition.
The conditions under the Merger Agreement to IDT’s consummation of the Offer and the subsequent Merger may not be satisfied at all or in the anticipated timeframe.
On February 13, 2017, we entered into the Merger Agreement with IDT and the Purchaser pursuant to which, the Purchaser commenced an offer to purchase all the outstanding Shares, for $3.08 per Share and an overall transaction value of approximately $250,000,000 (the “Merger Consideration”). The obligation of Purchaser to purchase the Shares validly tendered pursuant to the Offer and not validly withdrawn prior to the expiration of the Offer is subject to the satisfaction or waiver of a number of conditions set forth in the Merger Agreement, including (i) that there will have been validly tendered and not validly withdrawn a number of Shares that, when added to the Shares then owned by IDT and its wholly-owned direct or indirect subsidiaries, represents at least a majority of the Shares then outstanding (on a fully-diluted basis) and no less than a majority of the voting power of the shares of capital stock of GigPeak then outstanding (on a fully-diluted basis) and entitled to vote upon the adoption of the Merger Agreement and the approval of the Merger, excluding from the number of tendered Shares, but not from the number of outstanding Shares, Shares tendered pursuant to guaranteed delivery procedures, to the extent such procedures are permitted by Purchaser, that have not yet been delivered in settlement of such guarantee, (ii) the expiration or termination of any applicable waiting period (and any extension thereof) and the receipt of any approval or clearance applicable to the Offer or consummation of the Merger under the Hart-Scott-Rodino Antitrust Improvements Act of 1976, as amended, (iii) the accuracy of the representations and warranties and compliance with covenants contained in the Merger Agreement, subject to certain materiality standards, (iv) the absence of any law, order, injunction or decree by any government, court or other governmental entity that would make illegal or otherwise prohibit the Offer or the Merger, (v) there not having been a material adverse effect with respect to GigPeak, and (vi) other customary conditions. These conditions are described in more detail in the Merger Agreement, which we filed as Exhibit 2.1 to our Current Report on Form 8-K with the SEC on February 13, 2017 and which is incorporated herein by reference as Exhibit 2.4.
We intend to pursue all required approvals in accordance with the Merger Agreement. However, no assurance can be given that the required approvals will be obtained and, even if all such approvals are obtained, no assurance can be given as to the terms, conditions and timing of the approvals or that they will satisfy the terms of the Merger Agreement. In addition, there can be no assurances that our stockholders will tender their shares, or that any or all of the other conditions will be satisfied. If the Offer and Merger are not completed, or are not completed in a timely manner, our business, financial condition, results of operations and cash flows may be adversely affected.
Furthermore, we, and certain of our directors are named as defendants in litigation brought by purported holders of our common stock challenging our board of directors’ actions in connection with the proposed Merger and seeking, among other things, injunctive relief to enjoin the defendants from completing the Merger on the agreed-upon terms. See Part I, Item 3. “Legal Proceedings” for more information regarding such litigation. If a settlement or other resolution is not reached in this litigation and the plaintiffs secure injunctive or other relief prohibiting, delaying or otherwise adversely affecting our ability to consummate the Merger, then such injunctive or other relief may prevent the Merger from becoming effective within the expected timeframe or at all.
The announcement of, or a failure to complete, the Offer and the Merger could negatively impact our business, financial condition, results of operations or our stock price.
Our announcement of having entered into the Merger Agreement could cause a material disruption to our business and there can be no assurance that the conditions to the completion of the Offer and the Merger will be satisfied. The Merger Agreement also contains certain termination rights for us and IDT, including that either party may terminate the Merger Agreement if the Offer expires or is terminated or withdrawn pursuant to its terms without any Shares being purchased thereunder. Upon termination of the Merger Agreement under specified circumstances, GigPeak may be required, at IDT’s option, to reimburse IDT for up to $4,000,000 of expenses related to the Transaction (the “Expense Reimbursement”). GigPeak may also be required to pay to IDT a termination fee of $9,250,000 in certain circumstances, including if IDT terminates the Merger Agreement due to a change in the recommendation of our Board of Directors (the “Breakup Fee”). The Breakup Fee would be reduced by the amount of any Expense Reimbursement previously paid to IDT.
Accordingly, there is no assurance that the Merger will occur on the terms and timeline currently contemplated or at all, or that the conditions to the Merger will be satisfied in a timely manner or at all. We may be subject to several risks as a result of the announcement of, a failure to consummate, or a significant delay in consummating the Merger Agreement and the Offer, including, but not limited to, the following:
| · |
if the Offer and the Merger are not completed, the share price of our common stock may decline to the extent that the current market price of our common stock reflects an assumption that the Offer and the Merger will be completed;
|
| · |
certain costs related to the Offer and the Merger, including the fees and/or expenses of our legal, accounting and financial advisors, must be paid even if the Merger is not completed;
|
| · |
pursuant to the Merger Agreement, we are subject to certain restrictions on the conduct of our business prior to the completion of the Merger, which restrictions could adversely affect our ability to realize certain of our business strategies or take advantage of certain business opportunities;
|
| · |
the inability to retain certain key employees who may have sought and obtained different employment in anticipation of the completion of the Offer and the Merger;
|
|
·
|
sales of our products may be negatively impacted if we experience sales force turnover as a result of the announcement of the Offer and the Merger;
|
| · |
the announcement and pendency of the Offer and Merger may make it more difficult to establish or maintain relationships with employees, customers, vendors and other business partners;
|
| · |
the attention of our management may be directed toward the completion of the Offer and the Merger, and related matters, and may be diverted from day-to-day business operations, including from other opportunities that might otherwise be beneficial to us;
|
| · |
stockholder litigation in connection with the Offer or the Merger may result in significant costs of defense, indemnification and liability; and
|
| · |
a failure of the Offer and the Merger may result in negative publicity or a negative impression of us in the investment community or business community generally.
|
Should any of these matters occur, they could adversely affect our business, financial condition, results of operations, or stock price.
Some of our directors and executive officers have interests in the Offer and the Merger that are different from, or in addition to, those of our other stockholders.
Our stockholders should be aware that certain of our directors and executive officers have arrangements that provide them with interests in the Offer and the Merger that may be different from, or in addition to, those of other stockholders. Our executive officers are party to existing employment agreements that provide for certain severance and bonus payments in the event of their qualifying termination in connection with the proposed Merger and certain of our executive officers have entered into agreements with IDT for the employment of such individuals by IDT contingent upon the consummation of the Merger. In addition, our directors and executive officers hold stock options and restricted stock units that will vest immediately prior to the effective time of the Merger. Our directors and executive officers also have certain rights to indemnification and directors’ and officers’ liability insurance that will remain following the completion of the proposed Merger.
The Merger Agreement contains provisions that could make it difficult for a third party to acquire us prior to the completion of the Offer and the Merger.
The Merger Agreement contains restrictions on our ability to obtain a third-party proposal for an acquisition of our Company. These provisions include our agreement not to solicit or initiate any additional discussions with third parties regarding other proposals to acquire us, as well as restrictions on our ability to respond to such proposals, subject to fulfillment of certain fiduciary requirements of our board of directors. The Merger Agreement also contains certain termination rights, including, under certain circumstances, a requirement for us to pay to IDT the Breakup Fee.
These provisions might discourage an otherwise-interested third party from considering or proposing an acquisition of our company, even one that may be deemed of greater value to our stockholders than the Offer. Furthermore, even if a third party elects to propose an acquisition, the concept of a Breakup Fee may result in that third party’s offering a lower value to our stockholders than such third-party might otherwise have offered.
The price of our stock may be volatile during the pending acquisition by IDT, and you could lose all or part of your investment.
The trading price of our common stock may at times be highly volatile and could be subject to wide fluctuations in response to various factors, some of which are beyond our control. In addition to other factors, these factors may include the timing and process for completion of Merger, including potential delays, such as those potentially caused by pending lawsuit(s) brought by purported holders of our common stock challenging our Board of Directors’ actions in connection with the proposed Merger, which may cause significant fluctuations in the price of our stock.
Our principal properties as of December 31, 2016 are set forth below:
|
Location
|
Square
Feet
|
Principal Use
|
Ownership
|
Lease Expiration
|
||||
|
Zurich, Switzerland
|
2,724
|
Research and Development, Operations
|
Lease
|
12-month notice on either March 31 or September 30
|
||||
|
Seoul, South Korea
|
5,460
|
Research and Development, Operations
|
Lease
|
December 6, 2018
|
||||
|
San Jose, California
|
32,805
|
Administration, Sales, Marketing, Research and Development, Operations
|
Lease
|
June 30, 2022
|
||||
|
Milpitas, California
|
20,749
|
Administration, Sales, Marketing, Research and Development, Operations
|
Lease
|
February 28, 2017
|
||||
|
Ontario, Canada
|
10,763
|
Research and Development
|
Lease
|
April 30, 2020
|
||||
|
Auburn, California
|
6,100
|
Research and Development, Operations
|
Lease
|
October 31, 2020
|
We believe our existing facilities are adequate to meet our current needs and we can renew our existing leases or obtain alternate space on terms that would not have a material impact on our financial results.
From time to time, we may become involved in legal proceedings, claims and litigation arising in the ordinary course of business. When we believe a loss is probable and can be reasonably estimated, we accrue the estimated loss in our consolidated financial statements. Where the outcome of these matters is not determinable, we do not make a provision in our financial statements until the loss, if any, is probable and can be reasonably estimated or the outcome becomes known.
On February 17, 2017, a purported stockholder class action was filed in the Superior Court of the State of California in the County of Santa Clara (the “Santa Clara Action”), by Michael Carbajal (“Carbajal”), on behalf of himself and all other public stockholders of GigPeak, against GigPeak, IDT, Purchaser and each member of our Board of Directors, who were collectively named as the defendants (the “Santa Clara Defendants”). The complaint in the Santa Clara Action (the “Santa Clara Complaint”) alleges that the members of the Board breached their fiduciary duties of loyalty, good faith, due care and disclosure by, inter alia, (i) agreeing to sell GigPeak without first taking steps to ensure that Carbajal and all the other public shareholders of GigPeak would obtain adequate, fair and maximum consideration under the circumstances and (ii) engineering the Offer and the Merger Agreement to benefit themselves and/or IDT without regard for the public shareholders of GigPeak, and alleges that GigPeak, IDT and Purchaser aided and abetted such breaches of fiduciary duties. The Santa Clara Complaint seeks to enjoin any transaction, declaratory relief, certain other equitable relief, and unspecified damages and attorneys’ fees and costs. On February 24, 2017, Carbajal requested voluntary dismissal of the Santa Clara Action. On March 7, 2017, the Santa Clara Action was dismissed without prejudice.
On March 8, 2017, a purported stockholder class action complaint was filed in the United States District Court of the District of Delaware (the “Delaware Action”), by Vladimir Gusinsky Rev. Trust (the “Gusinsky Trust”), on behalf of himself and all other public stockholders of GigPeak, against GigPeak, IDT, Purchaser and each member of our Board of Directors, who were collectively named as the defendants (the “Delaware Defendants”). The complaint alleges that the Solicitation/Recommendation Statement on Schedule 14D-9 (the “Solicitation Statement”) filed by GigPeak with the SEC on March 7, 2017, violates Sections 14(e), 14(d) and 20(a) of the Exchange Act. The complaint in the Delaware Action (the “Delaware Complaint”) alleges, first, that, under the Merger Agreement, GigPeak will be acquired for inadequate consideration, which is materially less than the intrinsic value of GigPeak and does not adequately compensate stockholders for the significant synergies resulting from the Merger. The Delaware Complaint says that certain provisions in the Merger Agreement effectively prohibit the Board from soliciting alternative proposals and severely constrain their ability to communicate and negotiate with potential buyers who wish to submit unsolicited alternative proposals, while other provisions confer substantial benefit upon GigPeak’s officers and directors. The Delaware Complaint alleges, secondly, that the Solicitation Statement omits material information regarding the transactions contemplated by the Merger Agreement, which renders the Solicitation Statement false and misleading. The Gusinsky Trust seeks an injunction on the Delaware Defendants from proceeding with, consummating or closing the transactions contemplated by the Merger Agreement, and an order directing the Board to file a Solicitation Statement that does not contain any untrue statements of material fact and that states all material facts required in it or necessary to make the statements contained therein not misleading. The Gusinsky Trust seeks, further, a declaration that the Delaware Defendants have violated Sections 14(e), 14(d) and 20(a) of the Exchange Act and an award of the costs of the Delaware Action.
On March 13, 2017, a purported stockholder class action was filed in the United States District Court in the Northern District of California (the “Northern District Action”), by Felix Mendoza on behalf of himself and all other public stockholders of GigPeak, against GigPeak and each member of our Board of Directors, who were collectively named as the defendants (the “Northern District Defendants”). The complaint in the Northern District Action (the “Northern District Complaint”) alleges that the Solicitation Statement, filed by the Company in connection with the transactions contemplated by the Merger Agreement, is materially deficient and misleading because, inter alia, it fails to disclose material information about the financial projections prepared by GigPeak and relied upon by GigPeak’s financial advisors, as well as about certain conflicts of interest of our officers and directors. It further alleges that such failure to adequately disclose such material information constitutes a violation of Sections 14(d)(4), 14(e) and 20(a) of the Exchange Act. The Northern District Complaint seeks to enjoin the transactions contemplated by the Merger Agreement, or, if the Offer and the Merger are consummated, to recover damages resulting from the forgoing alleged violations of the Exchange Act.
GigPeak and the members of the Board have not yet been served with the Delaware Complaint, and to the best of the knowledge of GigPeak, neither has IDT or Purchaser. GigPeak and the members of the Board intend to vigorously defend the foregoing litigation. However, whether or not determined in our favor or settled, such litigation could be costly and time-consuming and could divert management’s attention and resources, which could adversely affect our business. Furthermore, we are currently unable to predict the final outcome of this litigation.
Not Applicable
PART II
| ITEM 5. |
MARKET FOR REGISTRANT’S COMMON EQUITY, RELATED STOCKHOLDER MATTERS AND ISSUER PURCHASES OF EQUITY SECURITIES
|
Our common stock is traded on the NYSE MKT under the symbol “GIG” starting from April 25, 2012. Prior to that time, our common stock traded on the OTC Bulletin Board under the symbol “GGOX” beginning on December 10, 2008. There was no public market for our common stock prior to December 10, 2008. The following table sets forth the low and high sale price of our common stock, based on the last daily sale, in each of our last eight fiscal quarters as quoted on the NYSE MKT and OTC.
|
Price per Share of Common
Stock
|
||||||||
|
High
|
Low
|
|||||||
|
Fiscal 2016 quarter ended:
|
||||||||
|
3/27/2016
|
$
|
3.33
|
$
|
2.13
|
||||
|
6/26/2016
|
$
|
3.01
|
$
|
1.90
|
||||
|
9/25/2016
|
$
|
2.13
|
$
|
1.71
|
||||
|
12/31/2016
|
$
|
2.85
|
$
|
1.88
|
||||
|
Fiscal 2015 quarter ended:
|
||||||||
|
3/29/2015
|
$
|
1.40
|
$
|
1.12
|
||||
|
6/28/2015
|
$
|
1.65
|
$
|
1.14
|
||||
|
9/27/2015
|
$
|
2.42
|
$
|
1.61
|
||||
|
12/31/2015
|
$
|
3.20
|
$
|
1.73
|
||||
Also, on March 1, 2017, the most recent practicable date prior to the filing of this Annual Report on Form 10-K, we had approximately 114 stockholders of record and the last reported sale price of our common stock on the NYSE MKT was $3.06 per share.
We have never declared or paid cash dividends on our common stock. We currently anticipate that we will retain any future earnings to fund our operations and do not anticipate paying dividends on the common stock in the foreseeable future.
On August 21, 2015, we entered into an underwriting agreement (the “2015 Underwriting Agreement”) with selling stockholders and Cowen and Company, LLC and Roth Capital Partners, LLC as representative of several underwriters to the 2015 Underwriting Agreement relating to (i) a public primary offering of an aggregate of 9,218,000 shares of our common stock, par value $0.001 per share at a public offering price of $1.70 per share and (ii) a public secondary offering by the Selling Stockholders of an aggregate of 282,000 shares of common stock at $1.70 per share. The shares were accompanied by the associated rights to purchase shares of Series A Junior Preferred Stock, which we created by the Rights Agreement, dated December 16, 2011, between us and the American Stock Transfer & Trust Company, LLC, as Rights Agent, as amended by the Amended Rights Agreement. Under the terms of the 2015 Underwriting Agreement, we also granted the underwriters a 30 day option to purchase up to an additional 1,425,000 shares of common stock to cover over-allotments, which the underwriters subsequently exercised on September 10, 2015.
On September 10, 2015, we completed our public offering of 10,643,000 newly issued shares of common stock at a price to the public of $1.70 per share. The number of shares sold in the offering included the underwriter’s full exercise on September 10, 2015 of their over-allotment option of 1,425,000 shares of common stock. The net proceeds to us from the offering was approximately $16.5 million which consisted of $16.9 million after underwriting discounts, commissions and expenses less an additional $420,000 for legal, accounting, registration and other transaction costs related to the public offering.
On March 21, 2016, we entered into a Securities Purchase Agreement (the “PDSTI Agreement”) with Pudong Science and Technology Investment (Cayman) Co., Ltd., an affiliate of Shanghai Pudong Science and Technology Investment Co., Ltd. (collectively, “PDSTI”), pursuant to which PDSTI will purchase approximately $5.0 million of our common stock. Under the PDSTI Agreement, on March 24, 2016, we issued 1,754,385 shares of our common stock to PDSTI in a private placement at a purchase price of $2.85 per share. The net proceeds from the PDSTI Agreement was approximately $4.6 million which consisted of the purchase price of $5.0 million net of related costs of $382,000.
On June 10, 2016, we entered into an underwriting agreement (the “2016 Underwriting Agreement”) with selling stockholders and Cowen and Company, LLC, Raymond James & Associates, Inc. and Needham & Company, LLC relating to (i) a public primary offering of an aggregate of 11,319,643 shares of our common stock, par value $0.001 per share, at a public offering price of $2.00 per share; (ii) a public secondary offering by certain of our officers and our directors of an aggregate of 684,600 shares of common stock at $2.00 per share; and (iii) a public secondary offering by certain of our stockholders who were former stockholders of Magnum of an aggregate of 495,757 shares of common stock at $2.00 per share. The shares were accompanied by the associated rights to purchase shares of Series A Junior Preferred Stock. Under the terms of the 2016 Underwriting Agreement, we granted the underwriters a 30 day option to purchase up to an additional 1,875,000 shares of common stock to cover overallotments, which the underwriters subsequently exercised on June 15, 2016.
On June 15, 2016, we completed our public offering of the 13,194,643 newly issued shares of common stock. The net proceeds from the offering was approximately $24.3 million which consisted of proceeds of $24.7 million after underwriting discounts, commissions and expenses, less an additional $0.4 million for legal, accounting, registration and other transaction costs related to the public offering.
Equity Compensation Plan Information
The following table reflects information for our equity compensation plans as of December 31, 2016.
|
(a)
|
(b)
|
(c)
|
||||||||||
|
Plan Category
|
Number of
securities to be
issued upon exercise
of outstanding
options and
Restricted Stock
Units
|
Weighted-average
exercise price of
outstanding
options
|
Number of securities
remaining available
for future issuance
under equity
compensation plan
(excluding securities
reflected in
column)
|
|||||||||
|
Equity compensation plans approved by security holders*
|
11,785,668
|
$
|
2.28
|
1,817,570
|
||||||||
| * |
The terms of our 2008 Equity Incentive Plan provide for an annual increase in the number of shares of our common stock authorized under the plan, effective as of the first day of each subsequent fiscal year, pursuant to the terms and conditions underlined in the plan. On January 1, 2016, the number of additional shares available for issuance under our 2008 Equity Incentive Plan was automatically increased by 2,260,527 shares. On January 1, 2017, the number of additional shares available for issuance under our 2008 Equity Incentive Plan was automatically increased by 3,442,885 shares.
|
Performance Measurement Comparison
The graph below shows the cumulative total stockholder return of an investment of $100 (and the reinvestment of any dividends thereafter) on December 31, 2011 in (i) our common stock, (ii) the NASDAQ Stock Market Index (U.S. Companies) and (ii) the NASDAQ Telecommunications Index. Our stock price performance shown in the graph below is not indicative of future stock price performance.
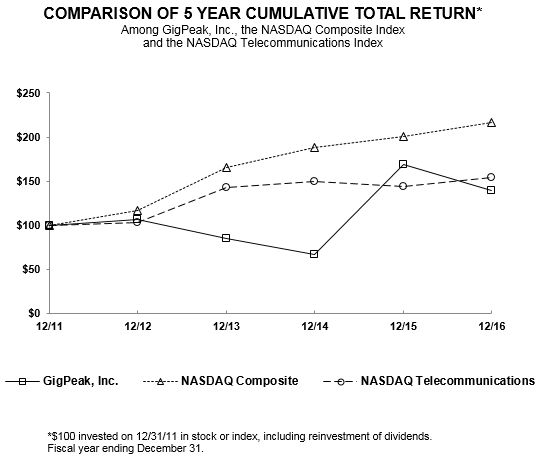
|
12/11
|
12/12
|
12/13
|
12/14
|
12/15
|
12/16
|
|||||||||||||||||||
|
GigPeak, Inc.
|
100.00
|
106.67
|
85.00
|
66.67
|
168.89
|
140.00
|
||||||||||||||||||
|
NASDAQ Composite
|
100.00
|
116.41
|
165.47
|
188.69
|
200.32
|
216.54
|
||||||||||||||||||
|
NASDAQ Telecommunications
|
100.00
|
102.78
|
143.40
|
149.42
|
144.02
|
153.88
|
Not Applicable.
You should read the following discussion and analysis in conjunction with our consolidated financial statements and the related notes included elsewhere in this Annual Report on Form 10-K. This discussion and analysis contains forward-looking statements that involve risks, uncertainties and assumptions. Our actual results may differ materially from those anticipated in these forward-looking statements as a result of certain factors, including, but not limited to, those set forth under “Risk Factors” in Item 1A of this Annual Report on Form 10-K and our consolidated financial statements and related notes appearing elsewhere in this Annual Report on Form 10-K,including Note 1—Organization and Basis of Presentation, to such consolidated financial statements and elsewhere as set forth in this Annual Report on Form 10-K. We assume no obligation to update the forward-looking statements or such risk factors. Please see “Special Note Regarding Forward-Looking Statements” above.
Overview
GigPeak, Inc. (“GigPeak” or the “Company”), formerly known as GigOptix, Inc. until the second quarter of 2016, is a leading innovator of semiconductor integrated circuits (“ICs”) and software solutions for high-speed connectivity and high-quality video compression. Our focus is to develop and deliver products that enable lower power consumption, higher quality information video content, and faster data connectivity, more efficient use of network infrastructure and broader connectivity to the Cloud, reducing the total cost of ownership for the network’s operators. We address both the speed of data transmission and the amount of bandwidth the data consumes within the network, while enhancing the streamed and broadcasted content quality, and our products also help to improve the efficiency of various Cloud-connected enterprise applications. The GigPeak product portfolio provides flexibility to support on-going changes in the connectivity that customers and markets require by deploying a wider offering of solutions from various kinds of semiconductor materials, ICs and Multi-Chip-Modules (“MCMs”), through cost-effective application-specific- integrated-circuits (“ASICs”) and system-on-chips (“SoCs”), and into full software programmable open-platform offerings.
Most of our products are highly customized and typically developed in partnership with key “Lighthouse” customers, occasionally generating some engineering project revenues through the development stage, but generating the majority of revenue from future device product shipments and sales through these customers and general market availability.
Since inception in 2007, we have expanded our customer base through our sales and marketing activities, and by acquiring and integrating eight (8) companies with complementary and synergistic products and customers. Our worldwide direct sales force is supported by a significant number of channel representatives and distributors that sell our products throughout North America, Europe and Asia.
On April 5, 2016, we completed our most recent acquisition of Magnum Semiconductor, Inc. (“Magnum”), and simultaneously renamed ourselves as GigPeak, Inc., to reflect the extension of our solution offering into wider Cloud-connectivity applications. Magnum was a privately-held fabless semiconductor manufacturer and software solution developer, and brought a well-developed and comprehensive portfolio of video broadcasting and streaming and compression solutions to GigPeak, including silicon ICs, SoCs and software solutions, high-end compression encoding and video-quality algorithm and software products, and a comprehensive library of intellectual property. The Magnum products, now marketed as GigPeak’s MX product-line, are offered solely for the professional and enterprise video broadcast infrastructure applications, yet are extendable to a variety of enterprise and end-user high-quality video streaming applications, such as a variety of cloud-connected interactive camera and server applications. Those products are the top of the line products, tools and technologies that can be deployed for the entire universe of video content creation and the associated distribution chain, from contribution and production through distribution over cable, telecom, satellite and over-the-top (“OTT”) video streaming.
Today’s video service providers, which include cable operators, telecommunications companies, and satellite TV providers, are continuously seeking to perfect their linear and nonlinear workflows and improve the quality of their video content, while simultaneously optimizing the efficiency of their networks and improving content quality in a constantly reducing bitrate environment. This enables the video service providers to stream and broadcast larger amount of video and media data and increase channel density through the existing network pipes infrastructure. Our products, tools, and technologies are currently used in the entire video content creation and distribution chain. Specifically, our solutions are used to address challenges in video contribution, video production, primary and secondary distribution, and enterprise wide solutions.
This rich networking, streaming and broadcasting blend of products and technologies gives GigPeak the capability to address both the speed of data transmission and the amount of bandwidth the data consumes within a network, driven in particular by high-quality video content, which is the source of a majority of the datacenter traffic and storage in today’s networks. Through this unique combination, we provide solutions to enhance the footprint utilization and reduce the total cost of ownership of existing network pipes from the core to the end user. Our wide product portfolio and exceptional customer support practices will continue to serve the enterprise networking and broadcasting original equipment manufacturers (“OEMs”), as well as potentially a variety of cloud-connected interactive camera and server applications, and is very unique among all other fabless semiconductor companies in the industry.
Historically, since inception in 2007 and through 2014, we have incurred net losses. We started to report net income in 2015. For the years ended December 31, 2016 and 2015, we recorded net income of $2.2 million and $1.2 million, respectively. For the years ended December 31, 2016 and 2015, we had cash inflows from operations of $3.3 million and $3.0 million, respectively. As of December 31, 2016 and 2015, we had an accumulated deficit of $98.8 million and $101.0 million, respectively.
We market and sell our products in Asia, North America, Europe and other locations through our direct sales force, distributors and sales representatives. The percentage of our sales shipped outside the United States was approximately 54% and 70% in fiscal 2016 and fiscal 2015, respectively. We measure sales location by the shipping destination, even if the customer is headquartered in the U.S. We anticipate that sales to international customers will continue to represent a significant percentage of our net sales.
Our sales are generally made by purchase orders, either directly from our customers or designated distributors world-wide. Since industry practice allows customers to reschedule or cancel orders on relatively short notice, backlog may not be a good indicator of our future sales. Cancellations of customer orders or changes in product specifications could result in the loss of anticipated sales without allowing us sufficient time to reduce our inventory and operating expenses.
Since a significant portion of our revenue is from the telecom and datacom markets, our business may be subject to seasonality, with increased revenues in the third and fourth calendar quarters of each year, when customers place orders to meet year-end demand. However, our expanding scope of products and market verticals has allowed us to largely mitigate the seasonality risk pertaining to specific market segments. Due to the complex nature of the markets we serve and the broad fluctuations in economic conditions in the U.S. and other countries, it is difficult for us to assess the impact of seasonal factors on our business.
We are subject to the risks of conducting business internationally, including economic conditions in Asia, particularly Taiwan, Japan and China, changes in trade policy and regulatory requirements, duties, tariffs and other trade barriers and restrictions, the burdens of complying with foreign laws and, possibly, political instability. Most of our foundries and assembly and test subcontractors are located in Asia. Although our international sales are largely denominated in U.S. dollars, we have foreign operations where expenses are generally denominated in the local currency. Such transactions expose us to the risk of exchange rate fluctuations. We monitor our exposure to foreign currency fluctuations, but have not adopted any hedging strategies to date. There can be no assurance that exchange rate fluctuations will not harm our business and operating results in the future.
Due to the continued uncertain economic conditions in the markets which we serve, our current or potential customers may delay or reduce purchases of our products, which would adversely affect our revenues and harm our business and financial results. We expect our business to be adversely impacted by any future downturn in the U.S. or global economies. In the past, industry downturns have resulted in reduced demand and declining average selling prices for our products which adversely affected our business. We expect to continue to experience these adverse business conditions in the event of further downturns.
Critical Accounting Policies and Estimates
Management’s Discussion and Analysis of Financial Condition and Results of Operations discusses our consolidated financial statements, which have been prepared in accordance with accounting principles generally accepted in the United States of America (“US GAAP”). The preparation of these consolidated financial statements requires management to make estimates and assumptions that affect the reported amounts of assets and liabilities at the date of the consolidated financial statements and the reported amounts of revenues and expenses during the reporting period. On an ongoing basis, management evaluates its estimates and judgments, including those related to product returns, bad debts, inventories, asset impairments, deferred tax assets, accrued warranty reserves, restructuring costs, contingencies and litigation. Management bases its estimates and judgments on historical experience and on various other factors that are believed to be reasonable under the circumstances, the results of which form the basis for making judgments about the carrying values of assets and liabilities that are not readily apparent from other sources. Actual results may differ from these estimates under different assumptions or conditions.
Management believes the following critical accounting policies, among others, affect our more significant judgments and estimates used in the preparation of our consolidated financial statements.
An accounting policy is deemed to be critical if it requires an accounting estimate to be made based on assumptions about matters that are highly uncertain at the time the estimate is made, and if different estimates that reasonably could have been used or changes in the accounting estimate that are reasonably likely to occur could materially change the financial statements. We also have other key accounting policies that are less subjective, and therefore, their application would not have a material impact on our reported results of operations. The following is a discussion of our critical accounting policies, as well as the estimates and judgments involved.
Revenue Recognition
Our revenue is mainly derived from the following sources: (i) product revenue, which includes hardware, software and perpetual software license revenue; (ii) services revenue, which include post contract support (“PCS”), professional services, and training; (iii) royalty revenue based on the number of ICs the customers sold during a particular period by the agreed-upon royalty rate; and (iv) engineering project revenues associated with product development.
Revenue from sales of optical communication drivers and receivers and multi-chip modules, broadcasting SoCs for video broadcasting, distribution and contribution applications, networking ICs and MCMs for high-speed information streaming, and other hardware and software products is recognized when persuasive evidence of a sales arrangement exists, transfer of title occurs, the sales price is fixed or determinable and collection of the resulting receivable is reasonably assured. We generally provide a standard product warranty on our products and warranty reserves are made at the time revenue is recorded.
Customer purchase orders are generally used to determine the existence of an arrangement. Transfer of title and risk of ownership occur based on defined terms in customer purchase orders, and generally pass to the customer upon shipment, at which point goods are delivered to a carrier. There are no formal customer acceptance terms or further obligations, outside of a standard product warranty. We assess whether the sales price is fixed or determinable based on the payment terms associated with the transaction. Collectibility is assessed based primarily on the credit worthiness of the customer as determined through ongoing credit evaluations of the customer’s financial condition as well as consideration of the customer’s payment history.
We sell some products to distributors at the price listed in our price book for that distributor. Certain of our distributor agreements provide for semi-annual stock rotation privileges of 5% to 10% of net sales for the previous six-month period. At the time of sale, we record a sales reserve against revenues for stock rotations approved by management. Each month we adjust the sales reserve for the estimated stock rotation privilege anticipated to be utilized by the distributors. When the distributors pay our invoices, they may claim stock rotations when appropriate. Once claimed, we process the requests against the prior authorizations and reduce the reserve previously established for that customer. As of December 31, 2016 and 2015, the reserve for stock rotations was $283,000 and $490,000, respectively, and is recorded in other current liabilities in the consolidated balance sheets.
We record transaction-based taxes including, but not limited to, sales, use, value added, and excise taxes, on a net basis in its consolidated statements of operations.
Service revenue includes customer support services, primarily software maintenance contract services and professional services. Revenue from service contracts is recognized ratably over the contract term, generally ranging from one to three years. Professional services, such as training services, are offered under time and material or fixed-fee contracts. Professional services revenue is recognized as services are performed.
We recognize royalty revenue based on reports received from customers during the quarter, assuming that all other revenue recognition criteria are met. The customers generally report shipment information typically within 45 days following the end of their respective quarters. If there is a reliable basis on which we can estimate our royalty revenues prior to obtaining the customers’ reports, we will recognize royalty revenues in the quarter in which they are earned. If there is not a reliable basis for estimating royalties, we will recognize revenue in the following quarter when the shipment report is received.
We also enter into product development arrangements with certain customers. In general, non-recurring engineering (“NRE”) projects require complex technology development and achievement of the development milestones is dependent on our performance. The milestone payment is generally commensurate with our effort or the value of the deliverable and is nonrefundable. Although development milestones are typically accepted by the customers, we do not have certainty about our ability to achieve these milestones. As such, revenue from product development arrangements are recorded when development milestones are achieved. These revenues are typically recorded at 100% gross margin because the costs associated with NRE projects are recorded in research and development as expenses are incurred. The development efforts related to NRE projects generally benefit our overall product development programs beyond the specific project requested by our customers.
Allowance for Doubtful Accounts
We make ongoing assumptions relating to the collectibility of our accounts receivable in our calculation of the allowance for doubtful accounts. In determining the amount of the allowance, we make judgments about the creditworthiness of customers based on ongoing credit evaluations and assess current economic trends affecting our customers that might impact the level of credit losses in the future and result in different rates of bad debts than previously seen. We also consider our historical level of credit losses. As of December 31, 2016 and 2015, our allowances for doubtful accounts were $77,000 and $63,000, respectively.
Inventories
Inventories are stated at the lower of standard cost, which approximates actual cost on a first in, first out basis, or market (net realizable value). Cost includes labor, material and overhead costs. Determining fair market value of inventories involves numerous judgments, including projecting average selling prices and sales volumes for future periods and costs to complete products in work in process inventories. As a result of this analysis, when fair market values are below our costs, we record a charge to cost of revenue in advance of when the inventory is scrapped or sold.
We evaluate our ending inventories for excess quantities and obsolescence on a quarterly basis. This evaluation includes an analysis of historical and forecasted sales quantities by product. Inventories on hand in excess of estimated future demand are written down. In addition, we write-off inventories that are considered obsolete. Obsolescence is determined from several factors, including competitiveness of product offerings, market conditions and product life cycles when determining obsolescence. Increases to the reserve for excess and obsolete inventory are charged to cost of revenue. At the point of the loss recognition, a new, lower-cost basis for that inventory is established, and subsequent changes in facts and circumstances do not result in the restoration or increase in that newly established cost basis. If this lower-cost inventory is subsequently sold, the related reserve is matched to the movement of related product inventory, which may result in lower costs and higher gross margins for those products.
Our inventories include high-technology parts that may be subject to rapid technological obsolescence and which are sold in a highly competitive industry. If actual product demand or selling prices are less favorable than we estimate, we may be required to take additional inventory write-downs.
Business Combination
We apply the purchase method of accounting to our acquisitions. Under this method, all assets acquired and liabilities assumed are recorded at their respective fair values at the date of the completion of the transaction. Determining the fair value of assets acquired and liabilities assumed requires management’s judgment and often involves the use of significant estimates and assumptions, including assumptions with respect to future cash inflows and outflows, discount rates, intangibles and other asset lives, among other items. Fair value is defined as the price that would be received in a sale of an asset or paid to transfer a liability in an orderly transaction between market participants at the measurement date (an exit price). Market participants are assumed to be buyers and sellers in the principal (most advantageous) market for the asset or liability. Additionally, fair value measurements for an asset assume the highest and best use of that asset by market participants. As a result, we may have been required to value the acquired assets at fair value measurements that do not reflect its intended use of those assets. Use of different estimates and judgments could yield different results. Any excess of the purchase price over the fair value of the net assets acquired is recognized as goodwill.
The accounting for the acquisition of Magnum is based on currently available information. Although we believe that the assumptions and estimates made are reasonable and appropriate, they are based in part on historical experience and information that may be obtained from management of the acquired company and are inherently uncertain. Unanticipated events and circumstances may occur that may affect the accuracy or validity of such assumptions, estimates, or actual results. As a result, during the measurement period, which may be up to one year from the acquisition date, we may record adjustments to the assets acquired and liabilities assumed with the corresponding offset to goodwill. Upon the conclusion of the measurement period or final determination of the values of assets acquired or liabilities assumed, whichever comes first, any subsequent adjustments will be recorded in our consolidated statements of operations.
Long-Lived Assets and Intangible Assets
Long-lived assets include equipment, furniture and fixtures, licenses, leasehold improvements, semiconductor masks used in production and intangible assets. When events or changes in circumstances indicate that the carrying amount of long-lived assets may not be recoverable, we test for recoverability based on an estimate of undiscounted cash flows as compared to the asset’s carrying amount. If the carrying value exceeds the estimated future cash flows, the asset is considered to be impaired. The amount of impairment is measured as the difference between the carrying amount and the fair value of the impaired asset. Factors we consider important that could trigger an impairment review include continued operating losses, significant negative industry trends, significant underutilization of the assets and significant changes in the way we plan to use the assets. In addition, we must use our judgment in determining the groups of assets for which impairment tests are separately performed.
The estimation of future cash flows involves numerous assumptions, which require our judgment, including, but not limited to, future use of the assets for our operations versus sale or disposal of the assets, future-selling prices for our products and future production and sales volumes.
Finite-lived intangible assets resulting from business acquisitions or technology licenses are amortized on a straight-line basis over their estimated economic lives of six to seven years for existing technology, acquired in business combinations; sixteen years for patents acquired in business combinations, based on the term of the patent or the estimated useful life, whichever is shorter; one year for order backlog, acquired in business combinations; ten years for trade name, acquired in business combinations; and six to eight years for customer relationships, acquired in business combinations. The assigned useful lives are consistent with our historical experience with similar technology and other intangible assets owned by us.
In-process research and development is recorded at fair value as of the date of acquisition as an indefinite-lived intangible asset until the completion or abandonment of the associated research and development efforts or impairment. Upon completion of development, acquired in-process research and development assets are transferred to finite-lived intangible assets and amortized over their useful lives. We review indefinite-lived intangible assets for impairment on an annual basis in conjunction with goodwill or whenever events or changes in circumstances indicate the carrying value may not be recoverable.
Goodwill
Goodwill is recorded when the purchase price of an acquisition exceeds the fair value of the net purchased tangible and intangible assets acquired and is carried at cost. Goodwill is not amortized, but is reviewed annually for impairment. We perform our annual goodwill impairment analysis in the fourth quarter of each year or more frequently if we believe indicators of impairment exist. Factors that we consider important which could trigger an impairment review include the following:
| · |
significant underperformance relative to historical or projected future operating results;
|
| · |
significant adverse change in the extent or manner in which a long-lived asset is being used or in its physical condition;
|
| · |
significant negative industry or economic trends; and
|
| · |
significant decline in our market capitalization.
|
When evaluating goodwill for impairment, we may initially perform a qualitative assessment which includes a review and analysis of certain quantitative factors to estimate if a reporting units’ fair value significantly exceeds its carrying value. When the estimate of a reporting unit’s fair value appears more likely than not to be less than its carrying value based on this qualitative assessment, we continue to the first step of a two-step impairment test. The first step requires a comparison of the fair value of the reporting unit to its net book value, including goodwill. The fair value of the reporting unit is determined based on a weighting of income and market approaches. Under the income approach, we calculate the fair value of a reporting unit based on the present value of estimated future cash flows. Under the market approach, we estimate the fair value based on market multiples of revenue or earnings for comparable companies. Determining the fair value of a reporting unit is judgmental in nature and involves the use of significant estimates and assumptions. These estimates and assumptions include revenue growth rates and operating margins used to calculate projected future cash flows, risk-adjusted discount rates, and future economic and market conditions and determination of appropriate market comparables. We base these fair value estimates on reasonable assumptions, but they are unpredictable and inherently uncertain. Actual future results may differ from those estimates. A potential impairment exists if the fair value of the reporting unit is lower than its net book value. The second step of the process is only performed if a potential impairment exists, and it involves determining the difference between the fair values of the reporting unit’s net assets, other than goodwill, and the fair value of the reporting unit, and, if the difference is less than the net book value of goodwill, an impairment charge is recorded. In the event that we determine that the value of goodwill has become impaired, we will record a charge for the amount of impairment during the fiscal quarter in which the determination is made. We operate in one reporting unit. We conducted our 2016 annual goodwill impairment analysis in the fourth quarter of 2016 and no goodwill impairment was indicated.
Income Taxes
As part of the process of preparing our consolidated financial statements, we are required to estimate our income taxes in each of the jurisdictions in which we operate. This process involves estimating our current tax exposure and assessing temporary differences resulting from differing treatment of items, such as deferred revenues, for tax and accounting purposes. These differences result in deferred tax assets and liabilities. We then assess the likelihood that our deferred tax assets will be recovered from future taxable income and to the extent we establish a valuation allowance or increase this allowance in a period; we will include an additional tax provision in our consolidated statement of operations.
We consider many factors when evaluating and estimating our tax positions and tax benefits, which may require periodic adjustments and which may not accurately anticipate actual outcomes. The first step is to evaluate the tax position for recognition by determining if the weight of available evidence indicates that it is more likely than not that the position will be sustained on audit, including resolution of related appeals or litigation processes, if any. The second step is to measure the tax benefit as the largest amount that is more than 50% likely of being realized upon ultimate settlement. Whether the more-likely-than-not recognition threshold is met for a tax position is a matter of judgment based on the individual facts and circumstances of that position evaluated in light of all available evidence.
Stock-based Compensation
Stock-based compensation is measured at the date of grant, based on the fair value of the award. For options, we amortize the compensation costs on a straight-line basis over the requisite service period of the option, which is generally the option vesting term of four years. For restricted stock units (“RSUs”), we amortize the compensation costs on a straight-line basis over the requisite service period of the RSU grant, which is generally the vesting term of one to four years. The benefits of tax deductions in excess of recognized compensation expense must be reported as a financing cash flow, rather than as an operating cash flow. This may reduce future net cash flows from operations and increase future net financing cash flows. All of our stock compensation is accounted for as equity instruments. We estimate the fair value of stock options granted using a Black-Scholes option-pricing model. This model requires the input of highly subjective assumptions, along with certain policy elections, including the options’ expected life and the price volatility of our underlying stock. Actual volatility, expected lives, interest rates and forfeitures may be different from our assumptions, which would result in an actual value of the options being different from estimated.
Expected Term—Our expected term used in the Black-Scholes option-pricing model represents the period that the Company’s stock options are expected to be outstanding.
Expected Volatility—Our expected volatility used in the Black-Scholes option-pricing model is derived from historical volatility of our stock prices.
Expected Dividend—We have never paid dividends and currently do not intend to do so, and accordingly, the dividend yield percentage is zero for all periods.
Risk-Free Interest Rate—We base the risk-free interest rate used in the Black-Scholes option-pricing model on the implied yield currently available on U.S. Treasury constant maturities issued with a term equivalent to the expected term of the option.
We make an estimate of expected forfeitures and recognize compensation costs only for those equity awards expected to vest. When estimating forfeitures, we consider voluntary termination behavior as well as an analysis of actual option forfeitures.
For RSUs, stock-based compensation is based on the fair value of our common stock on the grant date. The fair value of RSUs granted is the product of the number of shares granted and the grant date fair value of our common stock. RSUs are converted into shares of our common stock upon vesting on a one-for-one basis. Typically, vesting of RSUs is subject to the employee's continuing service.
Recent Accounting Pronouncements
In January 2017, the Financial Accounting Standards Board (“FASB”) issued Accounting Standards Update (“ASU”) No. 2017-01, Business Combinations (Topic 805) to clarify the definition of a business to assist entities with evaluating whether transactions should be accounted for as acquisitions (or disposals) of assets or businesses. The guidance is effective for fiscal years beginning after December 15, 2017 including interim periods within those fiscal years. Early adoption is permitted under certain circumstances. We are currently evaluating the impact of the adoption of this standard.
In January 2017, the FASB issued ASU No. 2017-04, Intangibles – Goodwill and Other (Topic 350). ASU 2017-04 simplifies how an entity is required to test goodwill for impairment by eliminating the Step 2 from the goodwill impairment test. Step 2 measures goodwill impairment loss by comparing the implied fair value of a reporting unit's goodwill with the carrying amount of that goodwill. Under the amendments in ASU No. 2017-04, an entity should perform its annual or interim goodwill impairment test by comparing the fair value of a reporting unit with its carrying amount and recognize an impairment charge for the amount by which the carrying amount exceeds the reporting unit's fair value; however, that loss recognized should not exceed the total amount of goodwill allocated to that reporting unit. ASU No. 2017-04 also requires an entity to consider income tax effects from any tax deductible goodwill on the carrying amount of the reporting unit when measuring the goodwill impairment loss, if applicable. The guidance is effective for annual or interim goodwill impairment tests in fiscal years beginning after December 15, 2019 including interim periods within those fiscal years. Early adoption is permitted. We are currently evaluating the impact of the adoption of this standard.
In November 2016, the FASB issued ASU No. 2016-18, Statement of Cash Flows (Topic 230): Restricted Cash, which requires that a statement of cash flows explain the change during the period in the total cash, cash equivalents, and amounts generally described as restricted cash or restricted cash equivalents. Therefore, amounts generally described as restricted cash and restricted cash equivalents should be included with cash and cash equivalents when reconciling the beginning and ending balances shown on the statement of cash flows. ASU No. 2016-18 is effective for interim and annual reporting periods beginning after December 15, 2017. We are currently evaluating the impact of the adoption of this standard.
In August 2016, the FASB issued ASU No. 2016-15, Statement of Cash Flows (Topic 230): Classification of Certain Cash Receipts and Cash Payments. ASU No. 2016-15 eliminates the diversity in practice related to the classification of certain cash receipts and payments for debt prepayment or extinguishment costs, the maturing of a zero coupon bond, the settlement of contingent liabilities arising from a business combination, proceeds from insurance settlements, distributions from certain equity method investees and beneficial interests obtained in a financial asset securitization. ASU No. 2016-15 designates the appropriate cash flow classification, including requirements to allocate certain components of these cash receipts and payments among operating, investing and financing activities. The retrospective transition method, requiring adjustment to all comparative periods presented, is required unless it is impracticable for some of the amendments, in which case those amendments would be prospectively as of the earliest date practicable. ASU No. 2016-15 is effective for interim and annual reporting periods beginning after December 15, 2017. We are currently evaluating the impact of the adoption of this standard.
In June 2016, the FASB issued ASU No. 2016-13, Financial Instruments - Credit Losses (Topic 326): Measurement of Credit Losses on Financial Instruments, which requires entities to use a current expected credit loss (“CECL”) model which is a new impairment model based on expected losses rather than incurred losses. Under this model an entity would recognize an impairment allowance equal to its current estimate of all contractual cash flows that the entity does not expect to collect from financial assets measured at amortized cost. The entity’s estimate would consider relevant information about past events, current conditions, and reasonable and supportable forecasts, which will result in recognition of lifetime expected credit losses upon loan origination. ASU 2016-13 is effective for interim and annual reporting periods beginning after December 15, 2019, with early adoption permitted for annual reporting periods beginning after December 15, 2018. We are currently evaluating the impact of the adoption of this standard.
In March 2016, the FASB issued ASU No. 2016-08, Revenue from Contracts with Customers (Topic 606): Principal versus Agent Considerations (Reporting Revenue Gross versus Net) which clarified the revenue recognition implementation guidance on principal versus agent considerations. In April 2016, the FASB issued ASU No. 2016-10, Revenue from Contracts with Customers (Topic 606): Identifying Performance Obligations and Licensing which clarified the revenue recognition guidance regarding the identification of performance obligations and the licensing implementation. In May 2016, the FASB issued ASU No. 2016-12, Revenue from Contracts with Customers (Topic 606): Narrow-Scope Improvements and Practical Expedients which narrowly amended the revenue recognition guidance regarding collectibility, noncash consideration, presentation of sales tax and transition. ASU No. 2016-08, ASU No. 2016-10 and ASU No. 2016-12 are effective during the same period as ASU No. 2014-09, Revenue from Contracts with Customers, which is effective for annual reporting period beginning after December 15, 2017, with the option to adopt one year earlier. We are currently evaluating the impact of the adoption of these standards.
In March 2016, the FASB issued ASU No. 2016-09, Compensation – Stock Compensation (Topic 718): Improvements to Employee Share-Based Payment Accounting. The standard identifies areas for simplification involving several aspects of accounting for share-based payment transactions, including the income tax consequences, classification of awards as either equity or liabilities, an option to recognize gross stock compensation expense with actual forfeitures recognized as they occur, as well as certain classifications on the statement of cash flows. ASU No. 2016-09 is effective for interim and annual reporting periods beginning after December 15, 2016, with early adoption permitted. We plan to adopt this standard beginning in 2017. We do not expect the adoption of this ASU to have a material impact on our financial position and results of operations due to the full valuation allowance on the deferred tax asset. Upon adoption, we will increase our deferred tax asset with respect to net operating loss carryforwards related to excess tax benefits, with an equal offsetting increase to our valuation allowance. As such, we do not believe that a cumulative effect adjustment will be recorded in the year of adoption.
In March 2016, the FASB issued ASU No. 2016-07, Investments—Equity Method and Joint Ventures (Topic 323): Simplifying the Transition to the Equity Method of Accounting. This guidance eliminates the requirement that when an investment qualifies for use of the equity method as a result of an increase in the level of ownership interest or degree of influence, an investor must adjust the investment, results of operations, and retained earnings retroactively on a step-by step basis as if the equity method had been in effect during all previous periods that the investment had been held. ASU No. 2016-07 is effective for interim and annual reporting periods beginning after December 15, 2016. We plan to adopt this standard beginning in 2017 and we do not expect the adoption will have a material impact on our consolidated financial statements.
In February 2016, the FASB issued ASU No. 2016-02, Leases (Topic 842), which supersedes Topic 840, Leases. The guidance in this new standard requires lessees to recognize assets and liabilities arising from operating leases on the balance sheet. For operating leases, a lessee is required to recognize a right-of-use asset and a lease liability, initially measured at the present value of the lease payments, in the statement of financial position, to recognize a single lease cost, calculated so that the cost of the lease is allocated over the lease term on a generally straight-line basis, and to classify all cash payments within operating activities in the statement of cash flows. ASU No. 2016-02 is effective for interim and annual reporting periods beginning after December 15, 2018. We are currently evaluating the impact of the adoption of this standard.
In July 2015, the FASB issued ASU No. 2015-11, Inventory (Topic 330): Simplifying the Measurement of Inventory applicable to inventory that is measured using first-in, first-out (FIFO) or average cost. An entity should measure inventory at the lower of cost and net realizable value. Net realizable value is the estimated selling price in the ordinary course of business, less reasonably predictable costs of completion, disposal, and transportation. ASU No. 2015-11 is effective for annual reporting periods beginning after December 15, 2016 and early adoption is permitted. We plan to adopt this standard beginning in 2017 and we do not expect the adoption will have a material impact on our consolidated financial statements.
In May 2014, the FASB issued ASU No. 2014-09, Revenue from Contracts with Customers (Topic 606), which supersedes the revenue recognition requirements in Accounting Standards Codification 605, Revenue Recognition. The core principle of the guidance is that an entity should recognize revenue to depict the transfer of promised goods or services to customers in an amount that reflects the consideration to which the entity expects to be entitled in exchange for those goods or services. An entity should disclose sufficient information to enable users of financial statements to understand the nature, amount, timing, and uncertainty of revenue and cash flows arising from contracts with customers. In August 2015, the FASB issued an amendment to defer the effective date of this accounting standard for all entities by one year, to annual reporting periods beginning after December 15, 2017 and early adoption is not permitted. We do not expect the adoption will have a material impact on our consolidated financial statements.
Results of Operations
Year Ended December 31, 2016 Compared to Year Ended December 31, 2015
The following table sets forth our consolidated results of operations for the fiscal years ended December 31, 2016 and 2015, and the year-over-year increase (decrease) in our results, expressed both in dollar amounts (thousands) and as a percentage of total revenues, except where indicated:
|
Years Ended December 31,
|
||||||||||||||||||||||||
|
2016
|
2015
|
|||||||||||||||||||||||
|
Amount
(in thousands)
|
% of
Revenue
|
Amount
(in thousands)
|
% of
Revenue
|
Change
(in thousands)
|
%
Change
|
|||||||||||||||||||
|
Revenue
|
$
|
58,743
|
100
|
%
|
$
|
40,394
|
100
|
%
|
$
|
18,349
|
45
|
%
|
||||||||||||
|
Cost of revenue
|
18,730
|
32
|
%
|
14,898
|
37
|
%
|
3,832
|
26
|
%
|
|||||||||||||||
|
Gross profit
|
40,013
|
68
|
%
|
25,496
|
63
|
%
|
14,517
|
57
|
%
|
|||||||||||||||
|
Operating expenses:
|
||||||||||||||||||||||||
|
Research and development
|
20,314
|
35
|
%
|
12,955
|
32
|
%
|
7,359
|
57
|
%
|
|||||||||||||||
|
Selling, general and administrative
|
16,336
|
28
|
%
|
11,127
|
28
|
%
|
5,209
|
47
|
%
|
|||||||||||||||
|
Total operating expenses
|
36,650
|
62
|
%
|
24,082
|
60
|
%
|
12,568
|
52
|
%
|
|||||||||||||||
|
Income from operations
|
3,363
|
6
|
%
|
1,414
|
4
|
%
|
1,949
|
138
|
%
|
|||||||||||||||
|
Interest expense, net
|
674
|
1
|
%
|
19
|
0
|
%
|
655
|
3,447
|
%
|
|||||||||||||||
|
Other expense, net
|
217
|
0
|
%
|
76
|
0
|
%
|
141
|
186
|
%
|
|||||||||||||||
|
Income before provision for income taxes
|
2,472
|
4
|
%
|
1,319
|
3
|
%
|
1,153
|
87
|
%
|
|||||||||||||||
|
Provision for income taxes
|
239
|
0
|
%
|
67
|
0
|
%
|
172
|
257
|
%
|
|||||||||||||||
|
Income from consolidated companies
|
2,233
|
4
|
%
|
1,252
|
3
|
%
|
981
|
78
|
%
|
|||||||||||||||
|
Loss on equity investment
|
—
|
0
|
%
|
3
|
0
|
%
|
(3
|
)
|
100
|
%
|
||||||||||||||
|
Net income
|
$
|
2,233
|
4
|
%
|
$
|
1,249
|
3
|
%
|
$
|
984
|
79
|
%
|
||||||||||||
Revenue
Revenue for the years reported was as follows (in thousands, except percentages):
|
Years Ended December 31,
|
||||||||
|
2016
|
2015
|
|||||||
|
Revenue
|
$
|
58,743
|
$
|
40,394
|
||||
|
Increase, period over period
|
$
|
18,349
|
||||||
|
Percentage increase, period over period
|
45
|
%
|
||||||
Total revenue for the year ended December 31, 2016 was $58.7 million, an increase of $18.3 million or 45%, compared with $40.4 million for the year ended December 31, 2015. The increase in revenue during 2016 was primarily due to increased growth resulting from the Magnum acquisition and meaningful continuous organic growth from our existing products.
Gross Profit and Cost of Revenue
Cost of revenue and gross profit for the years presented was as follows (in thousands, except percentages):
|
Years Ended December 31,
|
||||||||
|
2016
|
2015
|
|||||||
|
Total cost of revenue
|
$
|
18,730
|
$
|
14,898
|
||||
|
Gross profit
|
$
|
40,013
|
$
|
25,496
|
||||
|
Gross margin
|
68
|
%
|
63
|
%
|
||||
|
Increase period over period
|
$
|
14,517
|
||||||
|
Percentage increase, period over period
|
57
|
%
|
||||||
Gross profit consists of revenue less cost of revenue. Cost of revenue consists primarily of the costs to manufacture saleable components, including outsourced wafer fabrication and testing; costs of direct materials; equipment depreciation; costs associated with procurement, production control and quality assurance; fees paid to our offshore manufacturing vendors; reserves for potential excess or obsolete material; allocated facilities costs; costs related to stock-based compensation; accrued costs associated with potential warranty returns; and amortization of certain identified intangible assets. Amortization expense of identified intangible assets, namely existing technology, is presented within cost of revenue, as the intangible assets were determined to be directly attributable to revenue generating activities.
Gross profit for the year ended December 31, 2016 was $40.0 million, or a gross margin of 68%, compared to a gross profit of $25.5 million, or a gross margin of 63%, for the year ended December 31, 2015. The increase in gross margin is primarily due to increased growth resulting from the Magnum acquisition, and organically from our existing products and meaningful change in product mix in favor of higher margin products, while executing an end-of-life process for products with rapidly declining margins.
We record revenue from non-recurring engineering (“NRE”) projects associated with product development that we enter into with certain customers. In general, these projects are associated with complex technology development, and as such NRE enhances our technology, intellectual property buildup, and product offering abilities, though we do not have certainty about our ability to achieve the program milestones. Achievement of the milestone is typically dependent on our performance and acceptance by the customer. The payment associated with achieving the milestone is generally commensurate with our effort or the value of the deliverable and is nonrefundable. Therefore, we record the expenses related to these projects in the periods incurred and recognize revenue only when we have earned the revenue and achieved the development milestones. Revenue from these projects is typically recorded at 100% gross margin because the costs associated with these projects are expensed as incurred and generally included in research and development expense. These efforts generally benefit our overall product development programs beyond the specific project requested by our customer. The NRE revenues represents typically about 5-10% of our total revenue.
Research and Development Expense
Research and development (“R&D”) expense for the years presented was as follows (in thousands, except percentages):
|
Years Ended December 31,
|
||||||||
|
2016
|
2015
|
|||||||
|
Research and development expense
|
$
|
20,314
|
$
|
12,955
|
||||
|
Percentage of revenue
|
35
|
%
|
32
|
%
|
||||
|
Increase period over period
|
$
|
7,359
|
||||||
|
Percentage increase, period over period
|
57
|
%
|
||||||
R&D expenses are expensed as incurred. R&D expense consists primarily of salaries and related expenses for R&D personnel, consulting and engineering design, non-capitalized tools and equipment, engineering related semiconductor masks, depreciation for equipment, engineering expenses paid to outside technology development suppliers, allocated facilities costs and expenses related to stock-based compensation.
R&D expense for the year ended December 31, 2016 was $20.3 million compared to $13.0 million for the year ended December 31, 2015, an increase of $7.4 million or 57%. R&D expenses increased in absolute dollars compared to 2015 primarily due to a $3.6 million increase in personnel related expenses, a $1.2 million increase in consultant and outside service expenses, both of which are attributed primarily to the added resources pertaining to the Magnum acquisition, a $910,000 increase in facility related expenses, an $858,000 increase in expense related to amortization of software and intangible assets, and $447,000 increase in material and project-related expenses. The majority of those other increased expenses are also due to the integration of the R&D resources and projects of Magnum as of the closing of the acquisition on April 5, 2016, and the continuous meaningful investment in our networking products and technology developments.
Selling, General and Administrative Expense
Selling, general and administrative (“SG&A”) expense for the years presented was as follows (in thousands, except percentages):
|
Years Ended December 31,
|
||||||||
|
2016
|
2015
|
|||||||
|
Selling, general and administrative expense
|
$
|
16,336
|
$
|
11,127
|
||||
|
Percentage of revenue
|
28
|
%
|
28
|
%
|
||||
|
Increase period over period
|
$
|
5,209
|
||||||
|
Percentage increase, period over period
|
47
|
%
|
||||||
SG&A consist primarily of salaries and related expenses for executive, accounting, finance, sales, marketing and administration personnel, professional fees, allocated facilities costs, promotional activities and expenses related to stock-based compensation.
SG&A expense for the year ended December 31, 2016 was $16.3 million compared to $11.1 million for the year ended December 31, 2015, an increase of $5.2 million or 47%. SG&A expenses increased in absolute dollars compared to 2015 primarily due to a $1.5 million increase in personnel related expenses, a $1.2 million increase in legal expenses, a $614,000 increase in public company costs, a $710,000 increase in stock-based compensation expenses, $271,000 in expenses related to amortization of software and intangible assets, $226,000 in facility related expenses, and an increase of $201,000 in marketing samples. The majority of those increased expenses are due to the integration of the SG&A resources of Magnum as of the closing of the acquisition on April 5, 2016, and the continuous increase in the overall company’s scale driving higher global operations, sales, financial and legal management investments.
Interest Expense, Net, and Other Expense, Net
Interest expense, net and other expense, net for the years presented was as follows (in thousands):
|
Years Ended December 31,
|
||||||||
|
2016
|
2015
|
|||||||
|
Interest expense, net
|
$
|
674
|
$
|
19
|
||||
|
Other expense, net
|
217
|
76
|
||||||
|
Total
|
$
|
891
|
$
|
95
|
||||
Interest expense, net and other expense, net consist primarily of gains and losses related to foreign currency transactions, gains and losses related to property and equipment disposals, interest on line of credit, interest on capital leases and amortization of loan fees in connection with our Silicon Valley Bank line of credit and loan.
Interest expense, net for the year ended December 31, 2016 was $674,000 compared to $19,000 for the year ended December 31, 2015. Interest expense, net increased compared to 2015 primarily due to interest on the line of credit and term loan with SVB. This increased expense is solely attributable to the loan we incurred to support the Magnum acquisition payment.
62
Other expense, net for the year ended December 31, 2016 was an expense of $217,000 which primarily consisted of $247,000 foreign currency exchange loss and other non-operating expenses partially offset by a $30,000 change in fair value of warrants. Other expense, net for the year ended December 31, 2015 was an expense of $76,000 which primarily consisted of $32,000 of loss on foreign currency exchange and $31,000 of change in fair value of warrants.
Provision for Income Taxes
Tax provision for the years presented was as follows (in thousands, except percentages):
|
Years Ended December 31,
|
||||||||
|
2016
|
2015
|
|||||||
|
Provision for income taxes
|
$
|
239
|
$
|
67
|
||||
|
Increase period over period
|
$
|
172
|
||||||
|
Percentage increase, period over period
|
257
|
%
|
||||||
The provision for income taxes was $239,000 and $67,000 for the years ended December 31, 2016 and 2015, respectively, and our effective tax rate was approximately 10% and 5% for those periods. The income tax provision for the years ended December 31, 2016 and 2015 were due primarily to state taxes, United States withholding taxes and foreign taxes due. We have incurred book losses in Israel and Germany and have a full valuation allowance against such losses.
Liquidity and Capital Resources
Cash and cash equivalents and cash flow data for the periods presented were as follows (in thousands):
|
As of and the Years Ended
December 31,
|
||||||||
|
2016
|
2015
|
|||||||
|
Cash and cash equivalents
|
$
|
35,757
|
$
|
30,245
|
||||
|
Years Ended December 31,
|
||||||||
|
2016
|
2015
|
|||||||
|
Net cash provided by operating activities
|
$
|
3,254
|
$
|
2,957
|
||||
|
Net cash used in investing activities
|
$
|
(38,541
|
)
|
$
|
(6,744
|
)
|
||
|
Net cash provided by financing activities
|
$
|
40,679
|
$
|
15,536
|
||||
Public Offering
On August 21, 2015, we entered into an underwriting agreement (the “2015 Underwriting Agreement”) with selling stockholders and Cowen and Company, LLC and Roth Capital Partners, LLC as representative of several underwriters to the 2015 Underwriting Agreement relating to (i) a public primary offering of an aggregate of 9,218,000 shares of our common stock, par value $0.001 per share at a public offering price of $1.70 per share and (ii) a public secondary offering by the Selling Stockholders of an aggregate of 282,000 shares of common stock at $1.70 per share. The shares were accompanied by the associated rights to purchase shares of Series A Junior Preferred Stock, par value $0.001 per share (the “Series A Junior Preferred Stock”), which we created by the Rights Agreement, dated December 16, 2011, between us and the American Stock Transfer & Trust Company, LLC, as Rights Agent, as amended by the Amended and Restated Rights Agreement, dated December 16, 2014 (The “Amended Rights Agreement”). Under the terms of the 2015 Underwriting Agreement, we also granted the underwriters a 30 day option to purchase up to an additional 1,425,000 shares of common stock to cover over-allotments, which the underwriters subsequently exercised on September 10, 2015.
On September 10, 2015, we completed our public offering of 10,643,000 newly issued shares of common stock at a price to the public of $1.70 per share. The number of shares sold in the offering included the underwriter’s full exercise on September 10, 2015 of their over-allotment option of 1,425,000 shares of common stock. The net proceeds to us from the offering was approximately $16.5 million which consisted of $16.9 million after underwriting discounts, commissions and expenses less an additional $420,000 for legal, accounting, registration and other transaction costs related to the public offering.
On June 10, 2016, we entered into an underwriting agreement (the “2016 Underwriting Agreement”) with selling stockholders and Cowen and Company, LLC, Raymond James & Associates, Inc. and Needham & Company, LLC relating to (i) a public primary offering of an aggregate of 11,319,643 shares of our common stock, par value $0.001 per share, at a public offering price of $2.00 per share; (ii) a public secondary offering by certain of our officers and our directors of an aggregate of 684,600 shares of common stock at $2.00 per share; and (iii) a public secondary offering by certain of our stockholders who were former stockholders of Magnum of an aggregate of 495,757 shares of common stock at $2.00 per share. The shares were accompanied by the associated rights to purchase shares of Series A Junior Preferred Stock. Under the terms of the 2016 Underwriting Agreement, we granted the underwriters a 30 day option to purchase up to an additional 1,875,000 shares of common stock to cover overallotments, which the underwriters subsequently exercised on June 15, 2016.
On June 15, 2016, we completed our public offering of the 13,194,643 newly issued shares of common stock. The net proceeds from the offering was approximately $24.3 million which consisted of proceeds of $24.7 million after underwriting discounts, commissions and expenses, less an additional $0.4 million for legal, accounting, registration and other transaction costs related to the public offering.
Private Equity Placement
On March 21, 2016, we entered into a Securities Purchase Agreement (the “PDSTI Agreement”) with Pudong Science and Technology Investment (Cayman) Co., Ltd., an affiliate of Shanghai Pudong Science and Technology Investment Co., Ltd. (collectively, “PDSTI”), pursuant to which PDSTI will purchase approximately $5.0 million of our common stock. Under the PDSTI Agreement, on March 24, 2016, we issued 1,754,385 shares of our common stock to PDSTI in a private placement at a purchase price of $2.85 per share. The net proceeds from the PDSTI Agreement was approximately $4.6 million which consisted of the purchase price of $5.0 million net of related costs of $382,000.
Pursuant to the PDSTI Agreement, we agreed to file a registration statement on Form S-3 to provide registration rights to PDSTI in respect of the shares. The SEC declared the registration statement effective on June 3, 2016. The PDSTI Agreement provided that if the registration statement was not declared effective by July 7, 2016, we would pay to PDSTI, as liquidated damages, 0.4% of the aggregate purchase price on a monthly, prorated basis, until the registration statement was declared effective, with interest on these liquidated damages to accrue at the rate of 1.0% per month until paid in full. In the event that any U.S. governmental body or agency took any action or issued any order within six months that would have prevented PDSTI from holding the shares or invalidated our issuance of the shares to PDSTI, we had agreed to return PDSTI’s full purchase price, plus 0.4% interest on the purchase price (accruing monthly until paid in full), and to reimburse PDSTI’s expenses in connection with negotiating the private placement, up to $15,000. As of September 25, 2016, both of the loss contingencies on liquidated damages and the contingent redemption feature expired.
Credit Facilities
In April 2016, SVB and the Prior Borrowers, with newly acquired Magnum, entered into the Third Amended and Restated Loan and Security Agreement (the “Third Restated Loan Agreement”), amending and restating the Loan Agreement, as amended, in its entirety. Pursuant to the Third Restated Loan Agreement, the total aggregate amount that the Company is entitled to borrow from SVB has increased to an amount not to exceed $29.0 million, which is split into two different credit facilities, comprised of (i) the existing Revolving Loan facility which was amended to provide that the Company is entitled to borrow from SVB up to an amount not to exceed $14.0 million, based on net eligible accounts receivable after an 80% advance rate and subject to limits based on the Company’s eligible accounts as determined by SVB (the “Amended Revolving Loan”) and (ii) a second facility under which the Company is entitled to borrow from SVB up to $15.0 million without reference to accounts receivable, and which must be repaid in sixty equal installments, unless the Company exercises its right to prepay the loan (the “Term Loan”). The interest rate for the revolving line is Prime Rate plus 0.4%, or 4.15% as of December 31, 2016. The interest rate for the term loan is Prime Rate plus 1.25%, or 5.00% as of December 31, 2016. The Amended Revolving Loan has a term of 24 months, and no balance is outstanding as of December 31, 2016. The outstanding principal balance of the Term Loan as of December 31, 2016 was $13.0 million, of which $3.0 million was recorded in the consolidated balance sheet as notes payable, current.
Operating Activities
Operating activities provided $3.3 million of cash in the year ended December 31, 2016. Our net income adjusted for depreciation, stock-based compensation, loss on equity investment, acquisition related expense and other non-cash items, was $13.1 million. The remaining use of $9.8 million of cash in 2016 was due to an increase in accounts receivable of $3.6 million, an increase in inventories of $5.1 million, an increase in prepaid and other current assets of $0.7 million, a decrease in other current liabilities of $2.5 million, a decrease in other long-term liabilities of $0.3 million, partially offset by an increase in accounts payable of $2.2 million, and an increase in accrued compensation of $0.2 million.
Operating activities provided $3.0 million of cash in the year ended December 31, 2015. Our net income adjusted for depreciation, stock-based compensation, loss on equity investment, acquisition related expense and other non-cash items, was $8.7 million. The remaining use of $5.8 million of cash in 2015 was due to an increase in accounts receivable of $2.7 million, an increase in inventories of $1.7 million, an increase in prepaid and other current assets of $1.2 million, a decrease in other current liabilities of $1.1 million, a decrease in accounts payable of $0.1 million and an increase in other assets of $0.1 million which were partially offset by an increase in accrued compensation of $1.0 million, and an increase in other long-term liabilities of $0.1 million.
Investing Activities
Net cash used in investing activities for year ended December 31, 2016 was $38.5 million and consisted of $35.4 million spent to acquire Magnum net of cash acquired, $2.1 million of purchases of property and equipment, $1.2 million equity investment in Anagog, Ltd., which were partially offset by a $0.2 million change in restricted cash.
Net cash used in investing activities for year ended December 31, 2015 was $6.7 million and consisted of $4.4 million spent to acquire Terasquare Co. Ltd., net of cash acquired, $2.1 million of purchases of property and equipment and $0.2 million change in restricted cash.
Financing Activities
Financing activities provided $40.7 million of cash during the year ended December 31, 2016 and consisted primarily of $24.3 million proceeds from public offering of stock, net of costs, $12.8 million from debt financing, net of repayments, $4.6 million from a private offering of stock, and $0.7 million of proceeds from exercises of stock options, which were partially offset by $1.7 million of taxes paid related to net share settlement of equity awards.
Financing activities provided $15.5 million of cash during the year ended December 31, 2015 and consisted primarily of $16.5 million proceeds from public offering of stock, net of costs, and $0.4 million of proceeds from exercises of stock options, which were partially offset by $1.3 million of taxes paid related to net share settlement of equity awards.
Historically, since inception in 2007 and through 2014, we have incurred net losses. We started to report net income in 2015. For the years ended December 31, 2016 and 2015, we recorded net income of $2.2 and $1.2 million, respectively. For the years ended December 31, 2016 and 2015, we had cash inflows from operations of $3.3 and $3.0 million, respectively. As of December 31, 2016 and 2015, we had an accumulated deficit of $98.8 and $101.0 million, respectively. We have incurred significant losses since inception, attributable to our efforts to design and commercialize our products. We have managed our liquidity during this time through a series of cost reduction initiatives, raising cash through the sale of our stock, and through increasing our line of credit with our bank and sales of our securities.
Material Commitments
The following table summarizes our future cash obligations for current debt, operating leases, and capital leases, in thousands of dollars, as of December 31, 2016:
|
Contractual Obligations
|
Total
|
Less than
One Year
|
One to Three
Years
|
More than
Three Years
|
||||||||||||
|
Operating lease obligations
|
$
|
4,928
|
$
|
896
|
$
|
2,007
|
$
|
2,025
|
||||||||
|
Current debt obligations (including interest)
|
14,455
|
3,589
|
6,722
|
4,144
|
||||||||||||
|
Capital lease obligations (including interest)
|
9
|
9
|
—
|
—
|
||||||||||||
|
Total
|
$
|
19,392
|
$
|
4,494
|
$
|
8,729
|
$
|
6,169
|
||||||||
We did not have any material commitments for capital expenditures as of December 31, 2016.
Impact of Inflation and Changing Prices on Net Sales, Revenue and Income
Inflation and changing prices have not had a material impact on the materials used in our production process during the periods and at balance sheet dates presented in this report.
Off-Balance Sheet Arrangements
We do not use off-balance-sheet arrangements with unconsolidated entities, nor do we use other forms of off-balance-sheet arrangements such as special purpose entities and research and development arrangements. Accordingly, we are not exposed to any financing or other risks that could arise if we had such relationships.
INDEX TO CONSOLIDATED FINANCIAL STATEMENTS
|
Report of Independent Registered Public Accounting Firm
|
68
|
|
Financial Statements:
|
|
|
Consolidated Balance Sheets—December 31, 2016 and 2015
|
69
|
|
Consolidated Statements of Operations—Years Ended December 31, 2016 and 2015
|
70
|
|
Consolidated Statements of Comprehensive Income—Years Ended December 31, 2016 and 2015
|
71
|
|
Consolidated Statements of Stockholders’ Equity—Years Ended December 31, 2016 and 2015
|
72
|
|
Consolidated Statements of Cash Flows—Years Ended December 31, 2016 and 2015
|
73
|
|
Notes to Consolidated Financial Statements
|
74
|
REPORT OF INDEPENDENT REGISTERED PUBLIC ACCOUNTING FIRM
To the Board of Directors and
Stockholders of GigPeak, Inc.
We have audited the accompanying consolidated balance sheets of GigPeak, Inc. (a Delaware Corporation) and its subsidiaries (the “Company”) as of December 31, 2016 and 2015, and the related consolidated statements of operations, comprehensive income, stockholders’ equity, and cash flows for each of the two years in the period ended December 31, 2016. These consolidated financial statements are the responsibility of the Company’s management. Our responsibility is to express an opinion on these consolidated financial statements based on our audits.
We conducted our audits in accordance with the standards of the Public Company Accounting Oversight Board (United States). Those standards require that we plan and perform the audit to obtain reasonable assurance about whether the financial statements are free of material misstatement. An audit includes examining, on a test basis, evidence supporting the amounts and disclosures in the financial statements. An audit also includes assessing the accounting principles used and significant estimates made by management, as well as evaluating the overall financial statement presentation. We believe that our audits provide a reasonable basis for our opinion.
In our opinion, the consolidated financial statements referred to above present fairly, in all material respects, the financial position of GigPeak, Inc. and its subsidiaries as of December 31, 2016 and 2015, and the results of their operations and their cash flows for each of the two years in the period ended December 31, 2016 in conformity with accounting principles generally accepted in the United States of America.
We also have audited, in accordance with the standards of the Public Company Accounting Oversight Board (United States), the Company’s internal control over financial reporting as of December 31, 2016, based on criteria established in Internal Control—Integrated Framework (2013 Framework) issued by the Committee of Sponsoring Organizations of the Treadway Commission, and our report dated March 15, 2017, expressed an unqualified opinion thereon.
/s/ BPM LLP
San Jose, California
March 15, 2017
GIGPEAK, INC.
CONSOLIDATED BALANCE SHEETS
(In thousands, except share and per share amounts)
|
December 31,
|
||||||||
|
2016
|
2015
|
|||||||
|
ASSETS
|
||||||||
|
Current assets:
|
||||||||
|
Cash and cash equivalents
|
$
|
35,757
|
$
|
30,245
|
||||
|
Accounts receivable, net
|
15,258
|
10,596
|
||||||
|
Inventories
|
13,687
|
6,880
|
||||||
|
Prepaid and other current assets
|
658
|
580
|
||||||
|
Total current assets
|
65,360
|
48,301
|
||||||
|
Property and equipment, net
|
3,840
|
3,133
|
||||||
|
Intangible assets, net
|
26,717
|
4,530
|
||||||
|
Goodwill
|
42,977
|
12,565
|
||||||
|
Restricted cash
|
87
|
330
|
||||||
|
Other assets
|
1,454
|
251
|
||||||
|
Total assets
|
$
|
140,435
|
$
|
69,110
|
||||
|
LIABILITIES AND STOCKHOLDERS’ EQUITY
|
||||||||
|
Current liabilities:
|
||||||||
|
Accounts payable
|
$
|
7,093
|
$
|
3,659
|
||||
|
Accrued compensation
|
3,166
|
1,782
|
||||||
|
Note payable, current
|
2,898
|
—
|
||||||
|
Other current liabilities
|
2,872
|
2,219
|
||||||
|
Total current liabilities
|
16,029
|
7,660
|
||||||
|
Pension liabilities
|
345
|
349
|
||||||
|
Note payable, net of current portion
|
9,853
|
—
|
||||||
|
Other long term liabilities
|
3,896
|
912
|
||||||
|
Total liabilities
|
30,123
|
8,921
|
||||||
|
Commitments and contingencies (Note 8)
|
||||||||
|
Stockholders’ equity:
|
||||||||
|
Preferred stock, $0.001 par value; 1,000,000 shares authorized; no shares issued and outstanding as of December 31, 2016 and 2015, respectively
|
—
|
—
|
||||||
|
Common stock, $0.001 par value; 100,000,000 shares authorized; 68,857,716 and 45,221,397 shares issued and outstanding as of December 31, 2016 and 2015
|
69
|
45
|
||||||
|
Additional paid-in capital
|
213,557
|
163,036
|
||||||
|
Treasury stock, at cost; 1,781,142 and 701,754 shares as of December 31, 2016 and 2015
|
(4,972
|
)
|
(2,209
|
)
|
||||
|
Accumulated other comprehensive income
|
440
|
332
|
||||||
|
Accumulated deficit
|
(98,782
|
)
|
(101,015
|
)
|
||||
|
Total stockholders’ equity
|
110,312
|
60,189
|
||||||
|
Total liabilities and stockholders’ equity
|
$
|
140,435
|
$
|
69,110
|
||||
See accompanying Notes to Consolidated Financial Statements
GIGPEAK, INC.
CONSOLIDATED STATEMENTS OF OPERATIONS
(In thousands, except per share amounts)
|
Years Ended December 31,
|
||||||||
|
2016
|
2015
|
|||||||
|
Revenue
|
$
|
58,743
|
$
|
40,394
|
||||
|
Cost of revenue
|
18,730
|
14,898
|
||||||
|
Gross profit
|
40,013
|
25,496
|
||||||
|
Operating expenses:
|
||||||||
|
Research and development
|
20,314
|
12,955
|
||||||
|
Selling, general and administrative
|
16,336
|
11,127
|
||||||
|
Total operating expenses
|
36,650
|
24,082
|
||||||
|
Income from operations
|
3,363
|
1,414
|
||||||
|
Interest expense, net
|
674
|
19
|
||||||
|
Other expense, net
|
217
|
76
|
||||||
|
Income before provision for income taxes
|
2,472
|
1,319
|
||||||
|
Provision for income taxes
|
239
|
67
|
||||||
|
Income from consolidated companies
|
2,233
|
1,252
|
||||||
|
Loss on equity investment
|
—
|
3
|
||||||
|
Net income
|
$
|
2,233
|
$
|
1,249
|
||||
|
Net income per share—basic
|
$
|
0.04
|
$
|
0.03
|
||||
|
Net income per share—diluted
|
$
|
0.04
|
$
|
0.03
|
||||
|
Weighted-average number of shares used in basic net income per share calculations
|
58,713
|
36,624
|
||||||
|
Weighted-average number of shares used in diluted net income per share calculations
|
61,412
|
38,114
|
||||||
See accompanying Notes to Consolidated Financial Statements
GIGPEAK, INC.
CONSOLIDATED STATEMENTS OF COMPREHENSIVE INCOME
(In thousands)
|
Years Ended December 31,
|
||||||||
|
2016
|
2015
|
|||||||
|
Net income
|
$
|
2,233
|
$
|
1,249
|
||||
|
Other comprehensive income, net of tax
|
||||||||
|
Foreign currency translation adjustment
|
80
|
32
|
||||||
|
Change in pension liability in connection with actuarial gain
|
28
|
15
|
||||||
|
Other comprehensive income, net of tax
|
108
|
47
|
||||||
|
Comprehensive income
|
$
|
2,341
|
$
|
1,296
|
||||
See accompanying Notes to Consolidated Financial Statements
GIGPEAK, INC.
CONSOLIDATED STATEMENTS OF STOCKHOLDERS’ EQUITY
(In thousands, except share amounts)
|
Common Stock
|
Treasury Stock
|
Accumulated
|
||||||||||||||||||||||||||||||
|
Shares
|
Amount
|
Shares
|
Amount
|
Additional
Paid-In
Capital
|
Other
Comprehensive
Income
|
Accumulated
Deficit
|
Total
Stockholder’s
Equity
|
|||||||||||||||||||||||||
|
Balance as of December 31, 2014
|
33,112,086
|
$
|
32
|
701,754
|
$
|
(2,209
|
)
|
$
|
143,661
|
$
|
285
|
$
|
(102,264
|
)
|
$
|
39,505
|
||||||||||||||||
|
Stock-based compensation
|
—
|
—
|
—
|
—
|
3,848
|
—
|
—
|
3,848
|
||||||||||||||||||||||||
|
Issuance of common stock in connection with exercise of options
|
226,464
|
1
|
—
|
—
|
376
|
—
|
—
|
377
|
||||||||||||||||||||||||
|
Issuance of restricted stock to employees, net of taxes paid related to net share settlement of equity awards
|
1,239,847
|
1
|
—
|
—
|
(1,288
|
)
|
—
|
—
|
(1,287
|
)
|
||||||||||||||||||||||
|
Issuance of common stock in connection with the public offering, net of issuance costs
|
10,643,000
|
11
|
—
|
—
|
16,439
|
—
|
—
|
16,450
|
||||||||||||||||||||||||
|
Foreign currency translation adjustment, net of tax
|
—
|
—
|
—
|
—
|
—
|
32
|
—
|
32
|
||||||||||||||||||||||||
|
Change in pension liability in connection with actuarial loss, net of tax
|
—
|
—
|
—
|
—
|
—
|
15
|
—
|
15
|
||||||||||||||||||||||||
|
Net income
|
—
|
—
|
—
|
—
|
—
|
—
|
1,249
|
1,249
|
||||||||||||||||||||||||
|
Balance as of December 31, 2015
|
45,221,397
|
45
|
701,754
|
(2,209
|
)
|
163,036
|
332
|
(101,015
|
)
|
60,189
|
||||||||||||||||||||||
|
Stock-based compensation
|
4,587
|
4,587
|
||||||||||||||||||||||||||||||
|
Issuance of common stock in connection with exercise of options
|
454,526
|
—
|
—
|
—
|
727
|
—
|
—
|
727
|
||||||||||||||||||||||||
|
Issuance of restricted stock to employees, net of taxes paid related to net share settlement of equity awards
|
1,242,111
|
2
|
—
|
—
|
(1,721
|
)
|
—
|
—
|
(1,719
|
)
|
||||||||||||||||||||||
|
Issuance of common stock in connection with the public offering, net of issuance costs
|
13,194,643
|
13
|
—
|
—
|
24,280
|
—
|
—
|
24,293
|
||||||||||||||||||||||||
|
Issuance of common stock in connection with the private equity placement, net of issuance costs
|
1,754,385
|
2
|
—
|
—
|
4,616
|
—
|
—
|
4,618
|
||||||||||||||||||||||||
|
Issuance of common stock in connection with Magnum acquisition, net of shares returned for net working capital adjustment (Note 4)
|
6,990,654
|
7
|
1,079,388
|
(2,763
|
)
|
17,889
|
—
|
—
|
15,133
|
|||||||||||||||||||||||
|
Incremental fair value of warrants modified in connection with SVB credit facilities
|
—
|
—
|
—
|
—
|
143
|
—
|
—
|
143
|
||||||||||||||||||||||||
|
Foreign currency translation adjustment, net of tax
|
—
|
—
|
—
|
—
|
—
|
80
|
—
|
80
|
||||||||||||||||||||||||
|
Change in pension liability in connection with actuarial loss, net of tax
|
—
|
—
|
—
|
—
|
—
|
28
|
—
|
28
|
||||||||||||||||||||||||
|
Net income
|
—
|
—
|
—
|
—
|
—
|
—
|
2,233
|
2,233
|
||||||||||||||||||||||||
|
Balance as of December 31, 2016
|
68,857,716
|
$
|
69
|
1,781,142
|
$
|
(4,972
|
)
|
$
|
213,557
|
$
|
440
|
$
|
(98,782
|
)
|
$
|
110,312
|
||||||||||||||||
See accompanying Notes to Consolidated Financial Statements
GIGPEAK, INC.
CONSOLIDATED STATEMENTS OF CASH FLOWS
(In thousands)
|
Years Ended December 31,
|
||||||||
|
2016
|
2015
|
|||||||
|
Cash flows from operating activities:
|
||||||||
|
Net income
|
$
|
2,233
|
$
|
1,249
|
||||
|
Adjustments to reconcile net income to net cash provided by operating activities:
|
||||||||
|
Depreciation and amortization
|
6,152
|
3,595
|
||||||
|
Stock-based compensation
|
4,587
|
3,848
|
||||||
|
Change in fair value of warrants
|
(30
|
)
|
31
|
|||||
|
Amortization of debt discount
|
94
|
—
|
||||||
|
Loss on equity investment
|
—
|
3
|
||||||
|
Provision for doubtful accounts
|
19
|
14
|
||||||
|
Changes in operating assets and liabilities:
|
||||||||
|
Accounts receivable
|
(3,635
|
)
|
(2,655
|
)
|
||||
|
Inventories
|
(5,055
|
)
|
(1,741
|
)
|
||||
|
Prepaid and other current assets
|
(740
|
)
|
(1,238
|
)
|
||||
|
Other assets
|
8
|
(51
|
)
|
|||||
|
Accounts payable
|
2,236
|
(135
|
)
|
|||||
|
Accrued compensation
|
183
|
1,023
|
||||||
|
Other current liabilities
|
(2,525
|
)
|
(1,051
|
)
|
||||
|
Other long-term liabilities
|
(273
|
)
|
65
|
|||||
|
Net cash provided by operating activities
|
3,254
|
2,957
|
||||||
|
Cash flows from investing activities:
|
||||||||
|
Acquisition, net of cash acquired
|
(35,443
|
)
|
(4,425
|
)
|
||||
|
Purchases of long-term investment
|
(1,200
|
)
|
—
|
|||||
|
Purchases of property and equipment
|
(2,139
|
)
|
(2,106
|
)
|
||||
|
Change in restricted cash
|
241
|
(213
|
)
|
|||||
|
Net cash used in investing activities
|
(38,541
|
)
|
(6,744
|
)
|
||||
|
Cash flows from financing activities:
|
||||||||
|
Proceeds from public offering of stock, net of issuance costs
|
24,273
|
16,450
|
||||||
|
Proceeds from revolving loan
|
7,100
|
—
|
||||||
|
Proceeds from term loan, net of issuance costs
|
14,800
|
—
|
||||||
|
Proceeds from private offering of stock, net of issuance costs
|
4,618
|
—
|
||||||
|
Proceeds from exercise of stock options
|
727
|
377
|
||||||
|
Taxes paid related to net share settlement of equity awards
|
(1,719
|
)
|
(1,287
|
)
|
||||
|
Repayments on term loan
|
(2,000
|
)
|
—
|
|||||
|
Repayments on revolving loan
|
(7,100
|
)
|
—
|
|||||
|
Repayments on capital lease
|
(20
|
)
|
(4
|
)
|
||||
|
Net cash provided by financing activities
|
40,679
|
15,536
|
||||||
|
Effect of exchange rates on cash and cash equivalents
|
120
|
58
|
||||||
|
Net increase in cash and cash equivalents
|
5,512
|
11,807
|
||||||
|
Cash and cash equivalents at beginning of year
|
30,245
|
18,438
|
||||||
|
Cash and cash equivalents at end of year
|
$
|
35,757
|
$
|
30,245
|
||||
|
Supplemental disclosure of cash flow information:
|
||||||||
|
Interest paid
|
$
|
654
|
$
|
23
|
||||
|
Taxes paid
|
$
|
117
|
$
|
15
|
||||
|
Supplemental disclosure of non-cash investing and financing information:
|
||||||||
|
Issuance of common stock in conjunction with acquisition
|
$
|
15,133
|
$
|
—
|
||||
|
Purchase of property and equipment included in accounts payable
|
$
|
632
|
$
|
625
|
||||
|
Offering costs included in accounts payable and other current liabilities
|
$
|
12
|
$
|
32
|
||||
|
Incremental fair value of warrants modified in connection with SVB credit facilities
|
$
|
143
|
$
|
—
|
||||
See accompanying Notes to Consolidated Financial Statements
GIGPEAK, INC.
NOTES TO CONSOLIDATED FINANCIAL STATEMENTS
NOTE 1—ORGANIZATION AND BASIS OF PRESENTATION
Organization
GigPeak, Inc. (“GigPeak” or the “Company”), formerly known as GigOptix, Inc. until the second quarter of 2016, is a leading innovator of semiconductor integrated circuits (“ICs”) and software solutions for high-speed connectivity and high-quality video compression. The Company’s focus is to develop and deliver products that enable lower power consumption, higher quality information video content and faster data connectivity, more efficient use of network infrastructure and broader connectivity to the Cloud, reducing the total cost of ownership for the network’s operators. GigPeak addresses both the speed of data transmission and the amount of bandwidth the data consumes within the network, while enhancing the streamed and broadcasted content quality, and its products also help to improve the efficiency of various Cloud-connected enterprise applications. The GigPeak product portfolio provides flexibility to support on-going changes in the connectivity that customers and markets require by deploying a wider offering of solutions from various kinds of semiconductor materials, ICs and Multi-Chip-Modules (“MCMs”), through cost-effective application-specific-integrated-circuits (“ASICs”) and system-on-chips (“SoCs”), and into full software programmable open-platform offerings.
The Company was formed as a Delaware corporation in March 2008 in order to facilitate a combination between GigOptix LLC and Lumera Corporation (“Lumera”). Since inception, the Company has expanded its customer base through its sales and marketing activities, and by acquiring and integrating eight (8) companies with complementary and synergistic products and customers. GigPeak established a worldwide direct sales force which is supported by a number of channel representatives and distributors that sell its products throughout North America, Europe and Asia.
On February 13, 2017, the Company entered into an Agreement and Plan of Merger (the “Merger Agreement”) with Integrated Device Technology, Inc. (“IDT”) and IDT’s Wholly-owned subsidiary Glider Merger sub, Inc. (the “Purchaser”), Pursuant to the terms of the Merger Agreement, Purchaser made a tender offer to acquire all of the outstanding shares of the Company’s common and associated purchase rights for the Company’s Series A Junior Preffered Stock, (the “Shares”) on March 7, 2017 (the “Offer”). The Offer is scheduled to expire one minute following 11:59 P.M. (12:00 midnight ) New York Time, on Monday April 3, 2017, unless the Offer is extended or terminated. See Note 14- Subsequent Events.
Basis of Presentation
The Company’s fiscal year ends on December 31. The consolidated financial statements include the accounts of the Company and its wholly owned subsidiaries. All significant intercompany accounts and transactions have been eliminated.
Use of Estimates
The preparation of consolidated financial statements in conformity with accounting principles generally accepted in the United States of America (“US GAAP”) requires management to make estimates, judgments and assumptions that affect the reported amount of assets and liabilities, disclosure of contingent assets and liabilities at the date of the financial statements, and the reported amounts of revenue and expenses during the reported periods. Such estimates include, but are not limited to, allowances for doubtful accounts, reserves for stock rotation rights, warranty accrual, inventory write-downs, fair value of acquired intangible assets and goodwill, assumptions used in the valuation of stock-based awards and common stock warrants, valuation of deferred taxes and contingencies. Actual results could differ from these estimates.
Certain Significant Risks and Uncertainties
The Company operates in a dynamic industry and, accordingly, its business can be affected by a variety of factors. For example, changes in any of the following areas could have a negative effect in terms of its future financial position, results of operations or cash flows: a downturn in the overall semiconductor industry or communications semiconductor market; regulatory changes; fundamental changes in the technology underlying telecom products or incorporated in customers’ products; market acceptance of its products under development; litigation or other claims against the Company; litigation or other claims made by the Company; the hiring, training and retention of key employees; integration of businesses acquired; successful and timely completion of product development efforts; and new product introductions by competitors.
Fair Value of Financial Instruments
The Company’s financial instruments consist primarily of cash and cash equivalents, accounts receivable, accounts payable, accrued compensation, other accrued liabilities, common stock warrant liability, term loan and capital lease obligations.
The Company regularly reviews its investment portfolio to identify and evaluate investments that have indications of possible impairment. Factors considered in determining whether a loss is temporary include: the length of time and extent to which fair value has been lower than the cost basis; the financial condition, credit quality and near-term prospects of the investee; and whether it is more likely than not that the Company will be required to sell the security prior to any anticipated recovery in fair value. When there is no readily available market data, fair value estimates may be made by the Company, which may not necessarily represent the amounts that could be realized in a current or future sale of these assets.
Revenue Recognition
The Company’s revenue is mainly derived from the following sources: (i) product revenue, which includes hardware, software and perpetual software license revenue; (ii) services revenue, which include post contract support (“PCS”), professional services, and training; (iii) royalty revenue based on the number of ICs the customers sold during a particular period by the agreed-upon royalty rate; and (iv) engineering project revenues associated with product development, non-recurring engineering projects (“NRE”).
Revenue from sales of optical communication drivers and receivers and multi-chip modules, broadcasting SoCs for video broadcasting, distribution and contribution applications, networking ICs and MCMs for high-speed information streaming, and other hardware and software products is recognized when persuasive evidence of a sales arrangement exists, transfer of title occurs, the sales price is fixed or determinable and collection of the resulting receivable is reasonably assured. The Company generally provides a standard product warranty on its products and warranty reserves are made at the time revenue is recorded. See Note 8—Commitments and Contingencies for further detail related to the warranty reserve.
Customer purchase orders are generally used to determine the existence of an arrangement. Transfer of title and risk of ownership occur based on defined terms in customer purchase orders, and generally pass to the customer upon shipment, at which point goods are delivered to a carrier. There are no formal customer acceptance terms or further obligations, outside of a standard product warranty. The Company assesses whether the sales price is fixed or determinable based on the payment terms associated with the transaction. Collectibility is assessed based primarily on the credit worthiness of the customer as determined through ongoing credit evaluations of the customer’s financial condition as well as consideration of the customer’s payment history.
The Company sells some products to distributors at the price listed in its price book for that distributor. Certain of the Company’s distributor agreements provide for semi-annual stock rotation privileges of 5% to 10% of net sales for the previous six-month period. At the time of sale, the Company records a sales reserve against revenues for stock rotations approved by management. Each month the Company adjusts the sales reserve for the estimated stock rotation privilege anticipated to be utilized by the distributors. When the distributors pay the Company’s invoices, they may claim stock rotations when appropriate. Once claimed, the Company processes the requests against the prior authorizations and reduces the reserve previously established for that customer. As of December 31, 2016, and 2015, the reserve for stock rotations was $283,000 and $490,000, respectively, and is recorded in other current liabilities in the consolidated balance sheets.
The Company records transaction-based taxes including, but not limited to, sales, use, value added, and excise taxes, on a net basis in its consolidated statements of operations.
Service revenue includes customer support services, primarily software maintenance contract services and professional services. Revenue from service contracts is recognized ratably over the contract term, generally ranging from one to three years. Professional services, such as training services, are offered under time and material or fixed-fee contracts. Professional services revenue is recognized as services are performed.
The Company recognizes royalty revenue based on reports received from customers during the quarter, assuming that all other revenue recognition criteria are met. The customers generally report shipment information typically within 45 days following the end of their respective quarters. If there is a reliable basis on which the Company can estimate its royalty revenues prior to obtaining the customers’ reports, the Company will recognize royalty revenues in the quarter in which they are earned. If there is not a reliable basis for estimating royalties, the Company will recognize revenue in the following quarter when the shipment report is received.
The Company also enters in to product development arrangements with certain customers. In general, NRE projects require complex technology development and achievement of the development milestones is dependent on the Company’s performance. The milestone payment is generally commensurate with the Company’s effort or the value of the deliverable and is nonrefundable. Although development milestones are typically accepted by the customers, the Company does not have certainty about its ability to achieve these milestones. As such, revenue from product development arrangements are recorded when development milestones are achieved. These revenues are typically recorded at 100% gross margin because the costs associated with NRE projects are recorded in research and development as expenses are incurred. The development efforts related to NRE projects generally benefit the Company’s overall product development programs beyond the specific project requested by its customers.
Deferred Revenue
Deferred revenue primarily represents PCS contracts billed in advance but yet to be recognized. The current portion of deferred revenue represents the amounts that are expected to be recognized as revenue within one year of the balance sheet date. As of December 31, 2016, the current portion of deferred revenue of $928,000 is included in other current liabilities and the noncurrent portion of deferred revenue of $2.3 million is included in other long-term liabilities in the consolidated balance sheets. As of December 31, 2015, there was no deferred revenue.
Accounts Receivable and Allowance for Doubtful Accounts
Accounts receivable are recorded at the invoiced amount and are not interest bearing. The Company maintains an allowance for doubtful accounts for estimated losses resulting from the inability of its customers to make required payments. The Company makes ongoing assumptions relating to the collectibility of its accounts receivable in its calculation of the allowance for doubtful accounts. In determining the amount of the allowance, the Company makes judgments about the creditworthiness of customers based on ongoing credit evaluations and assesses current economic trends affecting its customers that might impact the level of credit losses in the future and result in different rates of bad debts than previously seen. The Company also considers its historical level of credit losses. As of December 31, 2016, the Company’s accounts receivable balance was $15.3 million, which was net of an allowance for doubtful accounts of $77,000. As of December 31, 2015, the Company’s accounts receivable balance was $10.6 million, which was net of an allowance for doubtful accounts of $63,000.
Cash and Cash Equivalents
The Company considers all highly liquid investments with an original maturity of 90 days or less at the date of purchase to be cash equivalents. Cash and cash equivalents are maintained at various financial institutions.
Restricted Cash
Restricted cash as of December 31, 2016 was $87,000 which includes $36,000 in government subsidy funding for GTK which is primarily subject to withdrawal restrictions to government-sponsored research and development projects and other activities, and a $51,000 security deposit held in an escrow account related to the Company’s facility lease in Zurich, Switzerland. Restricted cash as of December 31, 2015 was $330,000 which includes $278,000 in government subsidy funding for GTK, which is primarily subject to withdrawal restrictions to government-sponsored research and development projects and other activities, and a $53,000 security deposit held in an escrow account related to the Company’s facility lease in Zurich, Switzerland.
Concentration of Credit Risk
Financial instruments that potentially subject the Company to significant concentrations of credit risk consist primarily of cash, cash equivalents, and accounts receivable. The Company maintains cash and cash equivalents with various financial institutions that management believes to be of high credit quality. At any time, amounts held at any single financial institution may exceed federally insured limits. The Company believes that the concentration of credit risk in its accounts receivable is substantially mitigated by its credit evaluation process, relatively short collection terms and the high level of credit worthiness of its customers. The Company performs ongoing credit evaluations of its customers’ financial condition and limits the amount of credit extended when deemed necessary but generally requires no collateral.
As of December 31, 2016, two customers accounted for 16% and 16% of total accounts receivable. As of December 31, 2015, five customers accounted for 20%, 19%, 13%, 12% and 11% of total accounts receivable.
For the year ended December 31, 2016, no customer accounted for 10% or more of total revenue. For the year ended December 31, 2015, four customers accounted for 23%, 16%, 11% and 10% of total revenue.
Concentration of Supply Risk
The Company relies on third parties to manufacture its products, and depends on them for the supply and quality of its products. Quality or performance failures of the Company’s products or changes in its manufacturers’ financial or business condition could disrupt the Company’s ability to supply quality products to its customers and thereby have a material and adverse effect on its business and operating results. Some of the components and technologies used in the Company’s products are purchased and licensed from a single source or a limited number of sources. The loss of any of these suppliers may cause the Company to incur additional transition costs, result in delays in the manufacturing and delivery of its products, or cause it to carry excess or obsolete inventory or redesign its products. The Company relies on a third party for the fulfillment of its customer orders, and the failure of this third party to perform could have an adverse effect upon the Company’s reputation and its ability to distribute its products, which could adversely affect the Company’s business.
Inventories
Inventories are stated at the lower of standard cost, which approximates actual cost on a first-in, first-out basis, or market (net realizable value). Cost includes labor, material and overhead costs. Determining fair market value of inventories involves numerous judgments, including projecting average selling prices and sales volumes for future periods and costs to complete products in work-in-process inventories. As a result of this analysis, when fair market values are below costs, the Company records a charge to cost of revenue in advance of when the inventory is scrapped or sold.
The Company evaluates its ending inventories for excess quantities and obsolescence on a quarterly basis. This evaluation includes analysis of historical and forecasted sales levels by product against inventories on-hand. Inventories on-hand in excess of estimated future demand are reviewed by management to determine if a write-down is required. In addition, the Company writes-off inventories that are considered obsolete. Obsolescence is determined from several factors, including competitiveness of product offerings, market conditions and product life cycles when determining obsolescence. Excess and obsolete inventories are charged to cost of revenue and a new, lower-cost basis for that inventory is established and subsequent changes in facts and circumstances do not result in the restoration or increase in that newly established cost basis.
The Company’s inventories include high-technology parts that may be subject to rapid technological obsolescence and which are sold in a highly competitive industry. If actual product demand or selling prices are less favorable than forecasted amounts, the Company may be required to take additional inventory write-downs.
Property and Equipment, net
Property and equipment, including leasehold improvements, are recorded at cost and depreciated using the straight-line method over their estimated useful lives, ranging from one to seven years. Leasehold improvements and assets acquired under capital leases are depreciated over the shorter of their estimated useful lives or the remaining lease term of the respective assets. Repairs and maintenance costs are charged to expenses as incurred.
Business Combination
The Company applied the purchase method of accounting to its acquisitions. Under this method, all assets acquired and liabilities assumed are recorded at their respective fair values at the date of the completion of the transaction. Determining the fair value of assets acquired and liabilities assumed requires management’s judgment and often involves the use of significant estimates and assumptions, including assumptions with respect to future cash inflows and outflows, discount rates, intangibles and other asset lives, among other items. Fair value is defined as the price that would be received in a sale of an asset or paid to transfer a liability in an orderly transaction between market participants at the measurement date (an exit price). Market participants are assumed to be buyers and sellers in the principal (most advantageous) market for the asset or liability. Additionally, fair value measurements for an asset assume the highest and best use of that asset by market participants. As a result, the Company may have been required to value the acquired assets at fair value measurements that do not reflect its intended use of those assets. Use of different estimates and judgments could yield different results. Any excess of the purchase price over the fair value of the net assets acquired is recognized as goodwill.
The accounting for the acquisition of Magnum Semiconductor, Inc. (“Magnum”) is based on currently available information. Although the Company believes that the assumptions and estimates made are reasonable and appropriate, they are based in part on historical experience and information that may be obtained from management of the acquired company and are inherently uncertain. Unanticipated events and circumstances may occur that may affect the accuracy or validity of such assumptions, estimates, or actual results. As a result, during the measurement period, which may be up to one year from the acquisition date, the Company may record adjustments to the assets acquired and liabilities assumed with the corresponding offset to goodwill. Upon the conclusion of the measurement period or final determination of the values of assets acquired or liabilities assumed, whichever comes first, any subsequent adjustments will be recorded in the Company’s consolidated statements of operations.
Long-lived Assets and Intangible Assets, net
Long-lived assets include equipment, furniture and fixtures, licenses, leasehold improvements, semiconductor masks used in production and intangible assets. When events or changes in circumstances indicate that the carrying amount of long-lived assets may not be recoverable, the Company tests for recoverability by comparing the estimate of undiscounted cash flows to be generated by the assets against the assets’ carrying amount. If the carrying value exceeds the estimated future cash flows, the assets are considered to be impaired. The amount of impairment equals the difference between the carrying amount of the assets and their fair value. Factors the Company considers important that could trigger an impairment review include continued operating losses, significant negative industry trends, significant underutilization of the assets and significant changes in how it plans to use the assets.
Finite-lived intangible assets resulting from business acquisitions or technology licenses are amortized on a straight-line basis over their estimated economic lives of six to seven years for developed technology, acquired in business combinations; sixteen years for patents acquired in business combinations, based on the term of the patent or the estimated useful life, whichever is shorter; one year for order backlog, acquired in business combinations; ten years for trade name, acquired in business combinations; and six to eight years for customer relationships, acquired in business combinations. The assigned useful lives are consistent with the Company’s historical experience with similar technology and other intangible assets owned by the Company.
In-process research and development (“IPR&D”) is recorded at fair value as of the date of acquisition as an indefinite-lived intangible asset until the completion or abandonment of the associated research and development efforts or impairment. Upon completion of development, acquired in-process research and development assets are transferred to finite-lived intangible assets and amortized over their useful lives. The Company reviews indefinite-lived intangible assets for impairment on an annual basis in conjunction with goodwill or whenever events or changes in circumstances indicate the carrying value may not be recoverable.
Goodwill
Goodwill is recorded when the purchase price of an acquisition exceeds the fair value of the net purchased tangible and intangible assets acquired and is carried at cost. Goodwill is not amortized, but is reviewed annually for impairment. The Company performs its annual goodwill impairment analysis in the fourth quarter of each year or more frequently if it believes indicators of impairment exist. Factors that it considers important which could trigger an impairment review include the following:
| · |
significant underperformance relative to historical or projected future operating results;
|
| · |
significant adverse change in the extent or manner in which a long-lived asset is being used or in its physical condition;
|
| · |
significant negative industry or economic trends; and
|
| · |
significant decline in the Company’s market capitalization.
|
When evaluating goodwill for impairment, the Company may initially perform a qualitative assessment which includes a review and analysis of certain quantitative factors to estimate if a reporting units’ fair value significantly exceeds its carrying value. When the estimate of a reporting unit’s fair value appears more likely than not to be less than its carrying value based on this qualitative assessment, the Company continues to the first step of a two-step impairment test. The first step requires a comparison of the fair value of the reporting unit to its net book value, including goodwill. The fair value of the reporting units is determined based on a weighting of income and market approaches. Under the income approach, the Company calculates the fair value of a reporting unit based on the present value of estimated future cash flows. Under the market approach, the Company estimates the fair value based on market multiples of revenue or earnings for comparable companies. Determining the fair value of a reporting unit is judgmental in nature and involves the use of significant estimates and assumptions. These estimates and assumptions include revenue growth rates and operating margins used to calculate projected future cash flows, risk-adjusted discount rates, and future economic and market conditions and determination of appropriate market comparables. The Company bases these fair value estimates on reasonable assumptions but that are unpredictable and inherently uncertain. Actual future results may differ from those estimates. A potential impairment exists if the fair value of the reporting unit is lower than its net book value. The second step of the process is only performed if a potential impairment exists, and it involves determining the difference between the fair values of the reporting unit’s net assets, other than goodwill, and the fair value of the reporting unit, and, if the difference is less than the net book value of goodwill, an impairment charge is recorded. In the event that the Company determines that the value of goodwill has become impaired, it will record a charge for the amount of impairment during the fiscal quarter in which the determination is made. The Company operates in one reporting unit. The Company conducted its 2016 annual goodwill impairment analysis in the fourth quarter of 2016 and no goodwill impairment was indicated.
Pension Liabilities
The Company maintains a defined benefit pension plan covering minimum requirements according to Swiss law for its Zurich, Switzerland employees. The Company recognizes the funded status of its defined benefit pension plan on its consolidated balance sheets and changes in the funded status are reflected in accumulated other comprehensive income, net of tax, a component of stockholders’ equity.
Net periodic pension costs are calculated based upon a number of actuarial assumptions, including a discount rate for plan obligations, assumed rate of return on pension plan assets and assumed rate of compensation increases for plan employees. All of these assumptions are based upon management’s judgment, considering all known trends and uncertainties. Actual results that differ from these assumptions would impact the future expense recognition and cash funding requirements of its pension plans.
Foreign Currency
The financial position and results of operations of the Company’s foreign subsidiaries are measured using the local currency as their functional currency. Accordingly, all assets and liabilities for these subsidiaries are translated into U.S. dollars at the current exchange rates as of the respective balance sheet date. Revenue and expense items are translated at the average exchange rates prevailing during the period. Cumulative gains and losses from the translation of these subsidiaries’ financial statements are reported as a separate component of accumulated other comprehensive income, net of tax, a component of stockholders’ equity. The Company records foreign currency transaction gains and losses, realized and unrealized, in other expense, net in the consolidated statements of operations. The Company recorded approximately $80,000 and $32,000 of net transaction loss in 2016 and 2015, respectively.
Product Warranty
The Company’s products typically carry a standard warranty period of approximately one year which provides for the repair, rework or replacement of products (at its option) that fail to perform within stated specification. The Company provides for the estimated cost to repair or replace the product at the time of sale. The warranty accrual is estimated based on historical claims and assumes that it will replace products subject to claims.
Shipping Costs
The Company charges shipping costs to cost of revenue as incurred.
Research and Development Expense
Research and development expenses are expensed as incurred. Research and development expense consists primarily of salaries and related expenses for research and development personnel, consulting and engineering design, non-capitalized tools and equipment, engineering related semiconductor masks, depreciation for equipment, engineering expenses paid to outside technology development suppliers, allocated facilities costs and expenses related to stock-based compensation.
Advertising Expense
Advertising costs are expensed as incurred. Advertising expenses, which are recorded in selling, general and administrative expenses, were $5,000 for the year ended December 31, 2016. The Company had no advertising expenses for the year ended December 31, 2015.
Stock-Based Compensation
Stock-based compensation for employees is measured at the date of grant, based on the fair value of the award. For options, the Company amortizes the compensation costs on a straight-line basis over the requisite service period of the option, which is generally the option vesting term of four years. For restricted stock units (“RSUs”), the Company amortizes the compensation costs on a straight-line basis over the requisite service period of the RSU grant, which is generally the vesting term of one to four years. The benefits of tax deductions in excess of recognized compensation expense are reported as a financing cash flows on the consolidated statement of cash flows. All of the stock-based compensation is accounted for as equity instruments.
For options, the Company uses the Black-Scholes option-pricing model to measure the fair value of its stock-based awards utilizing various assumptions with respect to expected holding period, risk-free interest rates, stock price volatility and dividend yield.
For RSUs, stock-based compensation is based on the fair value of the Company’s common stock at the grant date.
Management estimates expected forfeitures and records the stock-based compensation expense only for those equity awards expected to vest. When estimating forfeitures, the Company considers voluntary termination behavior as well as an analysis of actual option forfeitures. Forfeitures are required to be estimated at the time of grant and revised if necessary in subsequent periods if actual forfeitures or vesting differ from those estimates. Such revisions could have a material effect on its operating results. The assumptions the Company uses in the valuation model are based on subjective future expectations combined with management judgment. If any of the assumptions used in the Black-Scholes option-pricing model changes significantly, stock-based compensation for future awards may differ materially compared to the awards granted previously.
Warrants
Warrants issued as equity awards are recorded based on the estimated fair value of the awards at the grant date. The Company uses the Black-Scholes option-pricing model to measure the fair value of its equity warrant awards utilizing various assumptions with respect to expected holding period, risk-free interest rates, stock price volatility and dividend yield.
Warrants with certain features, including down-round protection, are recorded as liability awards. These warrants are valued using a Black-Scholes option-pricing model which requires various assumptions with respect to expected holding period, risk-free interest rates, stock price volatility and dividend yield. The warrants are re-measured each reporting period, and the change in the fair value of the liability is recorded as other expense, net, on the consolidated statements of operations until the warrant is exercised or cancelled.
Net Income per Share
Basic net income per share is computed using the weighted-average number of common shares outstanding. Diluted net income per share is computed using the weighted-average number of common shares outstanding and potentially dilutive common shares outstanding during the periods. The dilutive effect of outstanding stock options, warrants, and RSUs is reflected in diluted earnings per share by application of the treasury stock method. For purposes of the diluted earnings per share calculation, RSUs, stock options to purchase common stock and warrants to purchase common stock are considered to be dilutive securities.
Income Taxes
The provision for income taxes is determined using the asset and liability approach of accounting for income taxes. Under this approach, deferred taxes represent the future tax consequences expected to occur when the reported amounts of assets and liabilities are recovered or paid. The provision for income taxes represents income taxes paid or payable for the current year plus the change in deferred taxes during the year. Deferred taxes result from differences between the financial and tax basis of the Company’s assets and liabilities and are adjusted for changes in tax rates and tax laws when changes are enacted. Valuation allowances are recorded to reduce deferred tax assets when it is more likely than not that a tax benefit will not be realized.
The Company must assess the likelihood that the Company’s deferred tax assets will be recovered from future taxable income, and to the extent the Company believes that recovery is not likely, the Company establishes a valuation allowance. Management judgment is required in determining the Company’s provision for income taxes, deferred tax assets and liabilities, and any valuation allowance recorded against the net deferred tax assets. The Company recorded a full valuation allowance as of December 31, 2016 and 2015. Based on the available evidence, the Company believes, it is more likely than not that it will not be able to utilize its deferred tax assets in the future. The Company intends to maintain valuation allowances until sufficient evidence exists to support the reversal of such valuation allowances. The Company makes estimates and judgments about its future taxable income that are based on assumptions that are consistent with its plans. Should the actual amounts differ from the Company’s estimates, the carrying value of the Company’s deferred tax assets could be materially impacted.
The Company recognizes in the financial statements the impact of a tax position, if that position is more likely than not of being sustained on audit, based on the technical merits of the position. The Company’s policy is to recognize interest and penalties accrued on any unrecognized tax benefits as a component of income tax expense. The Company does not believe there are any tax positions for which it is reasonably possible that the total amounts of unrecognized tax benefits will significantly increase or decrease within 12 months of the reporting date.
Comprehensive Income
Comprehensive income is comprised of two components: net income and other comprehensive income. Other comprehensive income refers to revenues, expenses, gains and losses that under US GAAP are recorded as an element of stockholders’ equity, but are excluded from net income. Accumulated other comprehensive income in the accompanying consolidated balance sheets includes foreign currency translation adjustments arising from the consolidation of the Company’s foreign subsidiaries and its changes in pension liabilities. Comprehensive income is presented net of income tax and the tax impact is immaterial.
The components of accumulated other comprehensive income were as follows (in thousands):
|
December 31,
|
||||||||
|
2016
|
2015
|
|||||||
|
Accumulated comprehensive income:
|
||||||||
|
Foreign currency translation adjustment, net of tax
|
$
|
410
|
$
|
330
|
||||
|
Change in pension liability in connection with actuarial gain, net of tax
|
30
|
2
|
||||||
|
Total accumulated other comprehensive income
|
$
|
440
|
$
|
332
|
||||
Recent Accounting Pronouncements
In January 2017, the Financial Accounting Standards Board (“FASB”) issued Accounting Standards Update (“ASU”) No. 2017-01, Business Combinations (Topic 805) to clarify the definition of a business to assist entities with evaluating whether transactions should be accounted for as acquisitions (or disposals) of assets or businesses. The guidance is effective for fiscal years beginning after December 15, 2017 including interim periods within those fiscal years. Early adoption is permitted under certain circumstances. The Company is currently evaluating the impact of the adoption of this standard.
In January 2017, the FASB issued ASU No. 2017-04, Intangibles – Goodwill and Other (Topic 350). ASU 2017-04 simplifies how an entity is required to test goodwill for impairment by eliminating the Step 2 from the goodwill impairment test. Step 2 measures goodwill impairment loss by comparing the implied fair value of a reporting unit's goodwill with the carrying amount of that goodwill. Under the amendments in ASU No. 2017-04, an entity should perform its annual or interim goodwill impairment test by comparing the fair value of a reporting unit with its carrying amount and recognize an impairment charge for the amount by which the carrying amount exceeds the reporting unit's fair value; however, that loss recognized should not exceed the total amount of goodwill allocated to that reporting unit. ASU No. 2017-04 also requires an entity to consider income tax effects from any tax deductible goodwill on the carrying amount of the reporting unit when measuring the goodwill impairment loss, if applicable. The guidance is effective for annual or interim goodwill impairment tests in fiscal years beginning after December 15, 2019 including interim periods within those fiscal years. Early adoption is permitted. The Company is currently evaluating the impact of the adoption of this standard.
In November 2016, the FASB issued ASU No. 2016-18, Statement of Cash Flows (Topic 230): Restricted Cash, which requires that a statement of cash flows explain the change during the period in the total cash, cash equivalents, and amounts generally described as restricted cash or restricted cash equivalents. Therefore, amounts generally described as restricted cash and restricted cash equivalents should be included with cash and cash equivalents when reconciling the beginning and ending balances shown on the statement of cash flows. ASU No. 2016-18 is effective for interim and annual reporting periods beginning after December 15, 2017. The Company is currently evaluating the impact of the adoption of this standard.
In August 2016, the FASB issued ASU No. 2016-15, Statement of Cash Flows (Topic 230): Classification of Certain Cash Receipts and Cash Payments. ASU No. 2016-15 eliminates the diversity in practice related to the classification of certain cash receipts and payments for debt prepayment or extinguishment costs, the maturing of a zero coupon bond, the settlement of contingent liabilities arising from a business combination, proceeds from insurance settlements, distributions from certain equity method investees and beneficial interests obtained in a financial asset securitization. ASU No. 2016-15 designates the appropriate cash flow classification, including requirements to allocate certain components of these cash receipts and payments among operating, investing and financing activities. The retrospective transition method, requiring adjustment to all comparative periods presented, is required unless it is impracticable for some of the amendments, in which case those amendments would be prospectively as of the earliest date practicable. ASU No. 2016-15 is effective for interim and annual reporting periods beginning after December 15, 2017. The Company is currently evaluating the impact of the adoption of this standard.
In June 2016, the FASB issued ASU No. 2016-13, Financial Instruments - Credit Losses (Topic 326): Measurement of Credit Losses on Financial Instruments, which requires entities to use a current expected credit loss (“CECL”) model which is a new impairment model based on expected losses rather than incurred losses. Under this model an entity would recognize an impairment allowance equal to its current estimate of all contractual cash flows that the entity does not expect to collect from financial assets measured at amortized cost. The entity’s estimate would consider relevant information about past events, current conditions, and reasonable and supportable forecasts, which will result in recognition of lifetime expected credit losses upon loan origination. ASU 2016-13 is effective for interim and annual reporting periods beginning after December 15, 2019, with early adoption permitted for annual reporting periods beginning after December 15, 2018. The Company is currently evaluating the impact of the adoption of this standard.
In March 2016, the FASB issued ASU No. 2016-08, Revenue from Contracts with Customers (Topic 606): Principal versus Agent Considerations (Reporting Revenue Gross versus Net) which clarified the revenue recognition implementation guidance on principal versus agent considerations. In April 2016, the FASB issued ASU No. 2016-10, Revenue from Contracts with Customers (Topic 606): Identifying Performance Obligations and Licensing which clarified the revenue recognition guidance regarding the identification of performance obligations and the licensing implementation. In May 2016, the FASB issued ASU No. 2016-12, Revenue from Contracts with Customers (Topic 606): Narrow-Scope Improvements and Practical Expedients which narrowly amended the revenue recognition guidance regarding collectibility, noncash consideration, presentation of sales tax and transition. ASU No. 2016-08, ASU No. 2016-10 and ASU No. 2016-12 are effective during the same period as ASU No. 2014-09, Revenue from Contracts with Customers, which is effective for annual reporting period beginning after December 15, 2017, with the option to adopt one year earlier. The Company is currently evaluating the impact of the adoption of these standards.
In March 2016, the FASB issued ASU No. 2016-09, Compensation – Stock Compensation (Topic 718): Improvements to Employee Share-Based Payment Accounting. The standard identifies areas for simplification involving several aspects of accounting for share-based payment transactions, including the income tax consequences, classification of awards as either equity or liabilities, an option to recognize gross stock compensation expense with actual forfeitures recognized as they occur, as well as certain classifications on the statement of cash flows. ASU No. 2016-09 is effective for interim and annual reporting periods beginning after December 15, 2016, with early adoption permitted. The Company plans to adopt this standard beginning in 2017. The Company does not expect the adoption of this ASU to have a material impact on its financial position and results of operations due to the full valuation allowance on the deferred tax asset. Upon adoption, the Company will increase its deferred tax asset with respect to net operating loss carryforwards related to excess tax benefits, with an equal offsetting increase to its valuation allowance. As such, the Company does not believe that a cumulative effect adjustment will be recorded in the year of adoption.
In March 2016, the FASB issued ASU No. 2016-07, Investments—Equity Method and Joint Ventures (Topic 323): Simplifying the Transition to the Equity Method of Accounting. This guidance eliminates the requirement that when an investment qualifies for use of the equity method as a result of an increase in the level of ownership interest or degree of influence, an investor must adjust the investment, results of operations, and retained earnings retroactively on a step-by step basis as if the equity method had been in effect during all previous periods that the investment had been held. ASU No. 2016-07 is effective for interim and annual reporting periods beginning after December 15, 2016. The Company plans to adopt this standard beginning in 2017 and the Company does not expect the adoption will have a material impact on its consolidated financial statements.
In February 2016, the FASB issued ASU No. 2016-02, Leases (Topic 842), which supersedes Topic 840, Leases. The guidance in this new standard requires lessees to recognize assets and liabilities arising from operating leases on the balance sheet. For operating leases, a lessee is required to recognize a right-of-use asset and a lease liability, initially measured at the present value of the lease payments, in the statement of financial position, to recognize a single lease cost, calculated so that the cost of the lease is allocated over the lease term on a generally straight-line basis, and to classify all cash payments within operating activities in the statement of cash flows. ASU No. 2016-02 is effective for interim and annual reporting periods beginning after December 15, 2018. The Company is currently evaluating the impact of the adoption of this standard.
In July 2015, the FASB issued ASU No. 2015-11, Inventory (Topic 330): Simplifying the Measurement of Inventory applicable to inventory that is measured using first-in, first-out (FIFO) or average cost. An entity should measure inventory at the lower of cost and net realizable value. Net realizable value is the estimated selling price in the ordinary course of business, less reasonably predictable costs of completion, disposal, and transportation. ASU No. 2015-11 is effective for annual reporting periods beginning after December 15, 2016 and early adoption is permitted. The Company plans to adopt this standard beginning in 2017 and the Company does not expect the adoption will have a material impact on its consolidated financial statements.
In May 2014, the FASB issued ASU No. 2014-09, Revenue from Contracts with Customers (Topic 606), which supersedes the revenue recognition requirements in Accounting Standards Codification 605, Revenue Recognition. The core principle of the guidance is that an entity should recognize revenue to depict the transfer of promised goods or services to customers in an amount that reflects the consideration to which the entity expects to be entitled in exchange for those goods or services. An entity should disclose sufficient information to enable users of financial statements to understand the nature, amount, timing, and uncertainty of revenue and cash flows arising from contracts with customers. In August 2015, the FASB issued an amendment to defer the effective date of this accounting standard for all entities by one year, to annual reporting periods beginning after December 15, 2017 and early adoption is not permitted. The Company does not expect the adoption will have a material impact on its consolidated financial statements.
NOTE 2—BALANCE SHEET COMPONENTS
Accounts Receivable, net
Accounts receivable, net, consisted of the following (in thousands):
|
December 31,
|
||||||||
|
2016
|
2015
|
|||||||
|
Accounts receivable
|
$
|
15,335
|
$
|
10,659
|
||||
|
Allowance for doubtful accounts
|
(77
|
)
|
(63
|
)
|
||||
|
Total accounts receivable, net
|
$
|
15,258
|
$
|
10,596
|
||||
Inventories
Inventories consisted of the following (in thousands):
|
December 31,
|
||||||||
|
2016
|
2015
|
|||||||
|
Raw materials
|
$
|
5,532
|
$
|
2,379
|
||||
|
Work in process
|
4,816
|
2,710
|
||||||
|
Finished goods
|
3,339
|
1,791
|
||||||
|
Total inventory
|
$
|
13,687
|
$
|
6,880
|
||||
Property and Equipment, net
Property and equipment, net consisted of the following (in thousands, except depreciable life):
|
Life
|
December 31,
|
|||||||||||
|
(In Years)
|
2016
|
2015
|
||||||||||
|
Network and laboratory equipment
|
3 – 5
|
$
|
15,582
|
$
|
13,520
|
|||||||
|
Computer software and equipment
|
2 – 3
|
4,320
|
4,207
|
|||||||||
|
Furniture and fixtures
|
3 – 7
|
186
|
165
|
|||||||||
|
Office equipment
|
3 – 5
|
142
|
142
|
|||||||||
|
Leasehold improvements
|
1 – 5
|
382
|
316
|
|||||||||
|
20,612
|
18,350
|
|||||||||||
|
Accumulated depreciation and amortization
|
(16,772
|
)
|
(15,217
|
)
|
||||||||
|
Property and equipment, net
|
$
|
3,840
|
$
|
3,133
|
||||||||
Depreciation and amortization expense related to property and equipment was $1.6 million and $1.5 million for the years ended December 31, 2016 and 2015, respectively.
In addition to the property and equipment above, the Company has prepaid licenses. For the years ended December 31, 2016 and 2015, amortization related to these prepaid licenses was $1.7 million and $1.1 million, respectively.
Other Current Liabilities
Other current liabilities consisted of the following (in thousands):
|
December 31,
|
||||||||
|
2016
|
2015
|
|||||||
|
Deferred revenue
|
$
|
928
|
$
|
—
|
||||
|
Warranty liability
|
417
|
325
|
||||||
|
Customer deposits
|
326
|
342
|
||||||
|
Sales return reserve
|
283
|
490
|
||||||
|
Amounts billed to the U.S. government in excess of approved rates
|
191
|
191
|
||||||
|
Other
|
727
|
871
|
||||||
|
Total other current liabilities
|
$
|
2,872
|
$
|
2,219
|
||||
Other Long-Term liabilities
Other long-term liabilities consisted of the following (in thousands):
|
December 31,
|
||||||||
|
2016
|
2015
|
|||||||
|
Deferred revenue
|
$
|
2,337
|
$
|
—
|
||||
|
Deferred tax liabilities
|
355
|
318
|
||||||
|
Income taxes payable for unrecognized tax benefits
|
977
|
434
|
||||||
|
Other
|
227
|
160
|
||||||
|
Total other long-term liabilities
|
$
|
3,896
|
$
|
912
|
||||
NOTE 3—FAIR VALUE MEASUREMENTS
The Company’s financial assets and liabilities are valued using market prices on active markets (“Level 1”), less active markets (“Level 2”) and unobservable markets (“Level 3”). Level 1 instrument valuations are obtained from real-time quotes for transactions in active exchange markets involving identical assets. Level 2 instrument valuations are obtained from readily-available pricing sources for comparable instruments. Level 3 instruments are valued using unobservable market values in which there is little or no market data, and which require the Company to apply judgment to determine the fair value.
The Company’s financial instruments measured at fair value on a recurring basis consist of Level I assets and Level III liabilities. Level I assets include highly liquid money market funds that are included in cash and cash equivalents. Level III liabilities consist of common stock warrants liability that are included in other current liabilities. For the years ended December 31, 2016 and 2015, the Company did not have any significant transfers between Level 1, Level 2 and Level 3.
The following table summarizes the Company’s financial assets and liabilities measured at fair value on a recurring basis as of December 31, 2016 and 2015 (in thousands):
|
Fair Value Measurements Using
|
||||||||||||||||
|
Carrying Value
|
Quoted
Prices in
Active
Markets for
Identical
Assets
(Level 1)
|
Significant
Other
Observable
Inputs
(Level 2)
|
Significant
Unobservable
Inputs
(Level 3)
|
|||||||||||||
|
December 31, 2016:
|
||||||||||||||||
|
Financial Assets:
|
||||||||||||||||
|
Money market funds
|
$
|
12,401
|
$
|
12,401
|
$
|
—
|
$
|
—
|
||||||||
|
Financial liabilities:
|
||||||||||||||||
|
Common stock warrants liability
|
$
|
9
|
$
|
—
|
$
|
—
|
$
|
9
|
||||||||
|
December 31, 2015:
|
||||||||||||||||
|
Financial Assets:
|
||||||||||||||||
|
Money market funds
|
$
|
12,364
|
$
|
12,364
|
$
|
—
|
$
|
—
|
||||||||
|
Financial liabilities:
|
||||||||||||||||
|
Common stock warrants liability
|
$
|
39
|
$
|
—
|
$
|
—
|
$
|
39
|
||||||||
Cash equivalents are stated at amortized cost, which approximates fair value at the balance sheet dates, due to the short period of time to maturity. Accounts receivable, accounts payable, accrued compensation, and other accrued liabilities are stated at their carrying value, which approximates fair value due to the short time to the expected receipt or payment date. The carrying amount of the Company’s term loan and capital lease obligations approximates fair value as the stated borrowing rates approximate market rates currently available to the Company for loans and capital leases with similar terms.
Common Stock Warrants Liability
The Company issued warrants to purchase common stock in connection with a waiver of certain events of default that arose under a November 2009 loan and security agreement with Bridge Bank. Certain provisions in the warrant agreements provided for down-round protection if the Company raised equity capital at a per share price less than the per share price of the warrants. Such down-round protection requires the Company to classify the common stock warrants as a liability. Common stock warrants are initially measured at their estimated fair value on the issuance date. At the end of each reporting period, changes in the fair value of common stock warrants are recorded in other expense, net on the consolidated statements of operations. The Company will continue to adjust the common stock warrants liability to its estimated fair value until the earlier of the exercise or expiration of the warrants.
In July 2010, December 2013 and September 2015, the Company raised additional capital through offerings of common stock of 2,760,000 shares, 9,573,750 shares and 10,643,000 shares at a price of $1.75 per share, $1.42 per share and $1.70 per share, respectively. In June 2016, the Company completed another round of equity financing through an offering of common stock of 13,194,643 shares at $2.00 per share. All of these equity financing transactions triggered the down-round protection and adjustment of the number of warrants issued to Bridge Bank.
The following table summarizes the warrants subject to liability accounting as of December 31, 2016 and 2015 (in thousands, except share and per share amounts):
|
Number of Common Stock Warrants
|
Fair Value
|
||||||||||||||||||||||||||
|
Holder
|
Upon
Issuance
|
As of
December 31,
2016
|
As of
December 31,
2015
|
Grant Date
|
Expiration
Date
|
Exercise
Price per
Share
|
As of
December 31,
2016
|
As of
December 31,
2015
|
|||||||||||||||||||
|
Bridge Bank
|
20,000
|
32,429
|
31,573
|
April 7, 2010
|
April 7, 2017
|
$
|
2.25
|
$
|
9
|
$
|
39
|
||||||||||||||||
The fair value of common stock warrants was determined using a Black-Scholes option-pricing model, which requires the use of significant unobservable market values. As a result, common stock warrants with down-round protection are classified as Level III financial instruments.
The fair value of the warrants was estimated using the following assumptions:
|
As of December 31,
|
||||||||
|
2016
|
2015
|
|||||||
|
Stock price
|
$
|
2.52
|
$
|
3.04
|
||||
|
Exercise price
|
$
|
2.25
|
$
|
2.31
|
||||
|
Expected life
|
0.27 years
|
1.27 years
|
||||||
|
Risk-free interest rate
|
0.85
|
%
|
0.86
|
%
|
||||
|
Volatility
|
20
|
%
|
62
|
%
|
||||
|
Fair value per share
|
$
|
0.29
|
$
|
1.23
|
||||
The change in the fair value of the Level 3 common stock warrants liability during the years ended December 31, 2016 and 2015 is as follows (in thousands):
|
Fair value as of December 31, 2014
|
$
|
8
|
||
|
Change in fair value
|
31
|
|||
|
Fair value as of December 31, 2015
|
39
|
|||
|
Change in fair value
|
(30
|
)
|
||
|
Fair value as of December 31, 2016
|
$
|
9
|
The warrant liability is included in other current liabilities on the consolidated balance sheets.
NOTE 4—ACQUISITIONS
Acquisition of Magnum Semiconductor, Inc.
On April 5, 2016, the Company completed its acquisition of Magnum pursuant to the terms of that certain Agreement and Plan of Merger. Magnum was a fabless semiconductor manufacturer and software solution developer, and provided a well-developed and comprehensive portfolio of video broadcasting and compression solutions to GigPeak. The total purchase consideration was a combination of equity and cash, including 6,990,654 shares of common stock with a fair value of $17.9 million and a cash payment of $37.2 million of which a significant portion was used to repay Magnum’s outstanding debt and other liabilities. Pursuant to the merger agreement for the acquisition of Magnum, $6.0 million of the purchase consideration was to remain in escrow for a period of up to at least 12 months and relates to certain indemnification obligations of Magnum’s former equity holders. Of this $6.0 million, $5.0 million was to be held for a period of up to at least 12 months, with the remainder held for an additional 12 months. After the end of the Company’s second quarter, in June 2016, the Company submitted a claim to the stockholder representative for a net working capital adjustment pursuant to the terms of the merger agreement for the acquisition of Magnum. In November 2016, the Company and the stockholder representative agreed on the amount of the net working capital adjustment in satisfaction of the claim. As a result, joint instructions were given by the Company and the stockholder representative to the escrow agent to release 1,079,388 shares of the Company’s common stock representing $2.8 million using the valuation of these shares as set by the merger agreement for the acquisition of Magnum, to the Company from the escrow fund and such released shares are held by the Company as treasury stock. As of December 31, 2016, 1,243,621 shares remain in escrow, representing $3.2 million using the valuation of these shares as set by the merger agreement for the acquisition of Magnum. After this release, the Company adjusted the total purchase consideration by $2.8 million during the quarter ended December 31, 2016. The Magnum acquisition was partially funded by borrowings of $22.1 million from Silicon Valley Bank (See Note 7—Credit Facilities).
The total purchase consideration of $52.3 million has been allocated to tangible and intangible assets acquired and liabilities assumed on the basis of their respective estimated fair values on the acquisition date. The Company will continue to evaluate certain assets, liabilities and tax estimates that are subject to change within the measurement period (up to one year from the acquisition date).
The following table summarizes the fair values of assets acquired and liabilities assumed (in thousands):
|
December 31,
2016
|
||||
|
Tangible assets acquired:
|
||||
|
Cash and cash equivalents
|
$
|
1,707
|
||
|
Accounts receivable
|
1,046
|
|||
|
Inventories
|
1,255
|
|||
|
Other current assets
|
1,069
|
|||
|
Property and equipment
|
233
|
|||
|
Other long-term assets
|
15
|
|||
|
Liabilities assumed:
|
||||
|
Accounts payable
|
(1,279
|
)
|
||
|
Accrued and other current liabilities
|
(2,190
|
)
|
||
|
Deferred revenue, net of associated costs
|
(4,912
|
)
|
||
|
Other long-term liabilities
|
(593
|
)
|
||
|
Identifiable intangible assets acquired:
|
||||
|
Developed technology
|
16,710
|
|||
|
IPR&D
|
7,680
|
|||
|
Customer relationships
|
800
|
|||
|
Trade name
|
330
|
|||
|
Goodwill arising from the acquisition:
|
||||
|
Goodwill
|
30,412
|
|||
|
Total purchase consideration
|
$
|
52,283
|
||
The Company determined the valuation of the identifiable intangible assets using established valuation techniques. The developed technology was valued using the forward looking multi-period excess earnings method under the income approach. The IPR&D was valued using the cost to recreate method under the asset approach. Customer relationships and trade name were valued under the distributor method and under the relief from royalty method, respectively. Identifiable intangible assets acquired are amortized on a straight line basis over their respective estimated useful lives of 15 months to 7 years.
The amount of acquired intangible assets at Magnum acquisition were comprised of the following (in thousands):
|
Amount
|
Life, in Years
|
|||||||
|
Developed technology
|
$
|
16,710
|
7
|
|||||
|
IPR&D
|
7,680
|
Indefinite
|
||||||
|
Customer relationships
|
800
|
7
|
||||||
|
Trade name
|
330
|
1.3
|
||||||
|
Total
|
$
|
25,520
|
||||||
Goodwill represents the excess of the purchase consideration over the fair value of the net tangible and identifiable intangible assets acquired and represents the future economic benefits arising from other assets acquired that could not be individually identified and separately recognized. The goodwill arising from the Magnum acquisition primarily consisted of the business synergies expected from the combined entities.
For the year ended December 31, 2016, the Company incurred acquisition-related transaction costs of $1.5 million, which were recorded in selling, general and administrative expenses in the consolidated statements of operations.
Pro Forma Financial Information (unaudited)
The following table presents the unaudited pro forma financial information for the combined entity of GigPeak and Magnum, as if the acquisition had occurred at the beginning of fiscal 2015 after giving effect to certain purchase accounting adjustments (in thousands, except per share amounts):
|
Years Ended December 31,
|
||||||||
|
2016
|
2015
|
|||||||
|
Net revenue
|
$
|
62,619
|
$
|
57,478
|
||||
|
Net loss
|
$
|
(2,221
|
)
|
$
|
(12,674
|
)
|
||
|
Net loss per share - basic and diluted
|
$
|
(0.04
|
)
|
$
|
(0.29
|
)
|
||
Acquisition of Terasquare Co., Ltd.
On September 30, 2015, the Company completed its acquisition of all of the outstanding shares of Terasquare Co., Ltd. (“Terasquare”) from the four former stockholders of Terasquare. Terasquare has low power, CMOS high speed communication interface semiconductors for 100Gbps Ethernet, Fiber Channel, and EDR Infiniband applications. Its quad channel Clock Data Recovery (“CDR”) technology and products for 100GbE data communication applications are applicable to 100Gbps Ethernet (QSFP28, CFP2, CFP4), OTU-4, 32G Fiber Channel, and EDR Infiniband.
The aggregate purchase price for all of the shares of the stock of Terasquare was $4.4 million, comprised solely of cash, subject to certain adjustments. The Company furnished the purchase price to the former Terasquare stockholders from cash on hand that it had raised in a previously disclosed secondary offering of its common stock that closed last month. In addition, the Company paid or assumed liabilities of Terasquare in the amount of $1.1 million.
The transaction was accounted for under the purchase method of accounting and, accordingly, the results of operations are included in the accompanying consolidated statement of operations subsequent to September 30, 2015.
The net tangible assets acquired and liabilities assumed in the acquisition were recorded at fair value. The Company determined the valuation of the identifiable intangible assets using established valuation techniques.
The fair values of identifiable intangible assets related to developed technology and IPR&D were determined under the income and asset approaches, respectively. The developed technology was valued using the forward looking multi-period excess earnings method under the income approach. The IPR&D was valued using the cost to recreate method under the asset approach. The fair value of the intangibles is management’s best estimate.
Goodwill represents the excess of the purchase price over the fair value of the net tangible and identifiable intangible assets acquired and represents the future economic benefits arising from other assets acquired that could not be individually identified and separately recognized. The goodwill arising from the transaction with Terasquare primarily consisted of the synergies expected from the merger with Terasquare.
The total purchase price of $4.4 million was allocated to the tangible and identifiable intangible assets acquired and liabilities assumed based on their estimated fair values at the date of acquisition as follows (in thousands):
|
December 31,
2016
|
||||
|
Tangible assets acquired:
|
||||
|
Cash and cash equivalents
|
$
|
22
|
||
|
Other current assets
|
55
|
|||
|
Property and equipment
|
22
|
|||
|
Restricted cash
|
67
|
|||
|
Others assets
|
86
|
|||
|
Liabilities assumed:
|
||||
|
Accounts payable
|
(504
|
)
|
||
|
Accrued compensation
|
(29
|
)
|
||
|
Other current liabilities
|
(252
|
)
|
||
|
Other long-term liabilities
|
(317
|
)
|
||
|
Identifiable intangible assets acquired:
|
||||
|
Developed technology
|
2,744
|
|||
|
IPR&D
|
383
|
|||
|
Goodwill acquired:
|
||||
|
Goodwill
|
2,170
|
|||
|
Total purchase price
|
$
|
4,447
|
||
The amount of acquired intangible assets at Terasquare acquisition were comprised of the following (in thousands):
|
Amount
|
Life, in Years
|
|||||||
|
Developed technology
|
$
|
2,744
|
7
|
|||||
|
IPR&D
|
383
|
Indefinite
|
||||||
|
Total
|
$
|
3,127
|
||||||
NOTE 5—INTANGIBLE ASSETS, NET AND GOODWILL
Intangible assets, net consist of the following (in thousands):
|
As of December 31, 2016
|
As of December 31, 2015
|
|||||||||||||||||||||||||||
|
Life
(years)
|
Gross
|
Accumulated
Amortization
|
Net
|
Gross
|
Accumulated
Amortization
|
Net
|
||||||||||||||||||||||
|
Definite-lived intangible assets:
|
||||||||||||||||||||||||||||
|
Customer relationships
|
6-8
|
$
|
4,077
|
(3,050
|
)
|
$
|
1,027
|
$
|
3,277
|
$
|
(2,542
|
)
|
$
|
735
|
||||||||||||||
|
Existing technology
|
6-7
|
23,237
|
(5,951
|
)
|
17,286
|
6,527
|
(3,386
|
)
|
3,141
|
|||||||||||||||||||
|
Patents
|
5-16
|
457
|
(412
|
)
|
45
|
457
|
(407
|
)
|
50
|
|||||||||||||||||||
|
Trade name
|
1-10
|
989
|
(693
|
)
|
296
|
659
|
(438
|
)
|
221
|
|||||||||||||||||||
|
Total definite-lived intangible assets
|
28,760
|
(10,106
|
)
|
18,654
|
10,920
|
(6,773
|
)
|
4,147
|
||||||||||||||||||||
|
Indefinite-lived intangible assets:
|
||||||||||||||||||||||||||||
|
IPR&D
|
indefinite
|
8,063
|
—
|
8,063
|
383
|
—
|
383
|
|||||||||||||||||||||
|
Total intangible assets
|
$
|
36,823
|
$
|
(10,106
|
)
|
$
|
26,717
|
$
|
11,303
|
$
|
(6,773
|
)
|
$
|
4,530
|
||||||||||||||
During the year ended December 31, 2016 and 2015, amortization of intangible assets was as follows (in thousands):
|
Years Ended December 31,
|
||||||||
|
2016
|
2015
|
|||||||
|
Cost of revenue
|
$
|
1,681
|
$
|
413
|
||||
|
Research and development expense
|
391
|
98
|
||||||
|
Selling, general and administrative expense
|
764
|
480
|
||||||
|
$
|
2,836
|
$
|
991
|
|||||
As of December 31, 2016, amortization of certain developed technologies of $497,000 was capitalized in inventory, and no amortization of intangible assets was capitalized in inventory as of December 31, 2015.
Estimated future amortization expense related to definite-lived intangible assets as of December 31, 2016 is as follows (in thousands):
|
Years Ending December 31,
|
||||
|
2017
|
$
|
3,512
|
||
|
2018
|
2,955
|
|||
|
2019
|
2,946
|
|||
|
2020
|
2,897
|
|||
|
2021
|
2,897
|
|||
|
Thereafter
|
3,447
|
|||
|
Total
|
$
|
18,654
|
||
The Company performs a review of the carrying value of its intangible assets, if circumstances warrant. In its review, it compares the gross, undiscounted cash flows expected to be generated by the underlying assets against the carrying value of those assets. To the extent such cash flows do not exceed the carrying value of the underlying asset; it will record an impairment charge. The Company did not record an impairment charge on any intangibles, including goodwill, during the years ended December 31, 2016 and 2015.
As of December 31, 2015, the Company had $12.6 million of goodwill in connection with its previous acquisitions. The changes in the carrying amount of goodwill for the years ended December 31, 2016 and 2015 are as follows (in thousands):
|
Amount
|
||||
|
Balance as of December 31, 2014
|
$
|
10,306
|
||
|
Goodwill adjustment from Tahoe RF acquisition
|
89
|
|||
|
Goodwill addition from Terasquare acquisition
|
2,170
|
|||
|
Balance as of December 31, 2015
|
12,565
|
|||
|
Goodwill addition from Magnum acquisition
|
30,412
|
|||
|
Balance as of December 31, 2016
|
$
|
42,977
|
||
On April 5, 2016, the Company completed its acquisition of Magnum, a fabless semiconductor manufacturer and software solution developer, with a well-developed and comprehensive portfolio of video broadcasting and compression solutions, which resulted in $30.4 million of goodwill. The acquisition closed for a total purchase consideration of $52.3 million, which included assumed liabilities of $9.0 million.
On September 30, 2015, the Company completed its acquisition of Terasquare, a Seoul, Korea-based, fabless semiconductor company and provider of low power, CMOS high speed communication interface semiconductors for 100Gbps Ethernet, Fiber Channel, and EDR Infiniband applications, and CDR devices, which resulted in $2.2 million of goodwill. The acquisition closed for a total purchase price of $4.4 million and assumed liabilities of $1.1 million.
NOTE 6— INVESTMENT IN UNCONSOLIDATED AFFILIATES
In January 2016, the Company invested $1.2 million for a minority stake in Anagog Ltd. (“Anagog”), the developer of the world’s largest crowdsourced parking network. Anagog perfects the mobility status algorithms that allow for advanced on-phone machine learning capabilities for the best user experience with ultra-low battery consumption and a high level of privacy protection. As of December 31, 2016, this cost method investment of $1.2 million is recorded in other assets on the consolidated balance sheets.
In February 2014, together with CPqD, the Company incepted a joint venture, originally named BrPhotonics Produtos Optoeletrônicos LTDA and after an investment in May 2016 by Inova Empresa Fundo De Investimento Em Participaçơes, now named BrPhotonics Produtos Optoeletrônicos S/A (“BrP”), of which the Company owns 37.9% of equity interest. BrP is a provider of advanced high-speed devices for optical communications and integrated transceiver components for information networks, and is based in Campinas, Brazil. The Company transferred into BrP its knowledge-base and intellectual property of TFPS TM technology. The Company transferred its inventory related to the TFPS TM platform and the complete set of production line equipment that previously resided at its Bothell, Washington, facility to CPqD, for use on the BrP joint venture. As of the transfer date, the Company’s net book value of the inventory and property and equipment was $245,000 and $211,000, respectively. During the second quarter of 2015, the Company made an additional capital contribution of $3,000 pursuant to BrP’s Amended Articles of Association which resulted in a total investment in BrP of $459,000.
For the year ended December 31, 2015, the Company had losses of $3,000 for its allocated portion of BrP’s results. Since the Company’s share of the loss exceeded its carrying cost of the investment in BrP, the Company’s investment in an unconsolidated affiliate was written down to zero as of December 31, 2015. The Company has not made any further investment in BrP.
NOTE 7—CREDIT FACILITIES
In March 25, 2013, the Company and its wholly owned subsidiaries, ChipX, Incorporated and Endwave Corporation (together with the Company, the “Prior Borrowers”) entered into a Second Amended and Restated Loan and Security Agreement (“Loan Agreement”) with Silicon Valley Bank (“SVB”) to replace the Amended and Restated Loan and Security Agreement entered in December 2011.
In May 2015, SVB and the Prior Borrowers amended the Loan Agreement by entering into a Second Amendment to the Second Restated Loan Agreement (the “Second Amendment”). Pursuant to the Second Amendment, the total aggregate amount that the Company was entitled to borrow from SVB under a Revolving Loan facility was $7.0 million, based on net eligible accounts receivable after an 80% advance rate and subject to limits based on the Company’s eligible accounts as determined by SVB. In addition, the applicable interest rate was decreased from Prime Rate plus 0.6% to Prime Rate plus 0.4%. The terms of the Second Amendment, were set to expire on May 6, 2016.
In April 2016, SVB and the Prior Borrowers, with newly acquired Magnum, entered into the Third Amended and Restated Loan and Security Agreement (the “Third Restated Loan Agreement”) , amending and restating the Loan Agreement, as amended, in its entirety. Pursuant to the Third Restated Loan Agreement, the total aggregate amount that the Company is entitled to borrow from SVB has increased to an amount not to exceed $29.0 million, which is split into two different credit facilities, comprised of (i) the existing Revolving Loan facility which was amended to provide that the Company is entitled to borrow from SVB up to an amount not to exceed $14.0 million, based on net eligible accounts receivable after an 80% advance rate and subject to limits based on the Company’s eligible accounts as determined by SVB (the “Amended Revolving Loan”) and (ii) a second facility under which the Company is entitled to borrow from SVB up to $15.0 million without reference to accounts receivable, and which must be repaid in sixty equal installments, unless the Company exercises its right to prepay the loan (the “Term Loan”). The interest rate for the revolving line is Prime Rate plus 0.4%, or 4.15% as of December 31, 2016. The interest rate for the term loan is Prime Rate plus 1.25%, or 5.00% as of December 31, 2016. The Amended Revolving Loan has a term of 24 months, and no balance is outstanding as of December 31, 2016. The outstanding principal balance of the Term Loan as of December 31, 2016 was $13.0 million, of which $3.0 million was recorded in the consolidated balance sheet as note payable, current.
Future principal payments under the Term Loan are as follows (in thousands):
|
Years Ending December 31,
|
||||
|
2017
|
$
|
3,000
|
||
|
2018
|
3,000
|
|||
|
2019
|
3,000
|
|||
|
2020
|
3,000
|
|||
|
2021
|
1,000
|
|||
|
Total Payments
|
13,000
|
|||
|
Less: unamortized debt discounts
|
(249
|
)
|
||
|
Less: current portion
|
(2,898
|
)
|
||
|
Note Payable, net of current portion
|
$
|
9,853
|
||
SVB had two outstanding existing warrants to purchase common stock of the Company: (i) a warrant to purchase 4,125 shares of common stock at an exercise price of $0.73, with an expiration date of October 5, 2017; and (ii) a warrant to purchase 125,000 shares of common stock at an exercise price of $4.00 per share, with an expiration date of April 23, 2017. In connection with the Third Restated Loan Agreement, these warrants have been amended and restated to extend the expiration date to October 5, 2022 and April 22, 2022, respectively. The change in the fair value of the common stock warrants related to the extension of the expiration date was $143,000 and was recorded as a debt discount on the SVB term loan.
In connection with the Third Restated Loan Agreement, the Company incurred legal and administrative expenses of $200,000 which was recorded as a discount on the SVB Term Loan. The debt discount will be amortized to interest expense during the life of the term loan using the effective interest method. For the years ended December 31, 2016 and 2015, the Company recorded amortization of debt discount of $94,000 and $0, respectively.
The Third Restated Loan Agreement with SVB is collateralized by all of the Company’s assets, including all accounts, equipment, inventory, receivables, and general intangibles. The Third Restated Loan Agreement contains certain restrictive covenants that will impose significant operating and financial restrictions on its operations, including, but not limited to restrictions that limit its ability to:
| · |
Sell, lease, or otherwise transfer, or permit any of its subsidiaries to sell, lease or otherwise transfer, all or any part of its business or property, except in the ordinary course of business or in connection with certain indebtedness or investments permitted under the amended and restated loan agreement;
|
| · |
Merge or consolidate, or permit any of its subsidiaries to merge or consolidate, with or into any other business organization, or acquire, or permit any of its subsidiaries to acquire, all or substantially all of the capital stock or property of another person;
|
| · |
Create, incur, assume or be liable for any indebtedness, other than certain indebtedness permitted under the amended and restated loan and security agreement;
|
| · |
Pay any dividends or make any distribution or payment on, or redeem, retire, or repurchase, any capital stock; and
|
| · |
Make any investment, other than certain investments permitted under the amended and restated loan and security agreement.
|
The Company is in compliance with the covenants as of December 31, 2016.
NOTE 8—COMMITMENTS AND CONTINGENCIES
Commitments
Leases
In July 2016, the Company entered into a Fifth Amendment to Lease Agreement related to its headquarters located at 130 Baytech Drive, San Jose, CA 95134. The amendment extended the term of the lease by another 64 months from March 1, 2017 to June 30, 2022. The amended lease provides for a rent holiday of four months and an option to further extend the lease term for five years with monthly rent at the then fair market value. The Company recognizes rent expense on a straight-line basis over the term of the lease with the difference between the expense and the payments recorded as deferred rent on the consolidated balance sheets. Any reimbursements by the landlord for tenant improvements are considered lease incentives, the balance of which is recorded as a lease incentive obligation within deferred rent on the consolidated balance sheets and amortized as a reduction of rent expense over the life of the lease. Lease renewal periods are considered on a lease-by-lease basis in determining the lease term.
The Company leases its domestic and foreign sales offices under non-cancelable operating leases. These leases contain various expiration dates and renewal options. The Company also leases certain software licenses under operating leases. Total facilities rent expense for the years ended December 31, 2016 and 2015 was $890,000 and $494,000, respectively.
Aggregate non-cancelable future minimum rental payments under capital and operating leases are as follows (in thousands):
|
Capital Leases
|
Operating
Leases
|
|||||||
|
Years Ending December 31,
|
Minimum
Lease
Payments
|
Minimum
Lease
Payments
|
||||||
|
2017
|
$
|
9
|
$
|
896
|
||||
|
2018
|
--
|
1,065
|
||||||
|
2019
|
--
|
942
|
||||||
|
2020
|
--
|
858
|
||||||
|
2021
|
--
|
772
|
||||||
|
Thereafter
|
--
|
395
|
||||||
|
Total minimum lease payments
|
9
|
$
|
4,928
|
|||||
|
Less: amount representing interest
|
--
|
|||||||
|
Total capital lease obligations
|
9
|
|||||||
|
Less: current portion
|
(9
|
)
|
||||||
|
Long-term portion of capital lease obligations
|
$
|
--
|
||||||
The gross and net book value of the fixed assets under capital lease was as follows (in thousands):
|
December 31,
|
||||||||
|
2016
|
2015
|
|||||||
|
Acquired cost
|
$
|
36
|
$
|
13
|
||||
|
Accumulated amortization
|
(27
|
)
|
(7
|
)
|
||||
|
Net book value
|
$
|
9
|
$
|
6
|
||||
The amortization of fixed assets acquired under capital lease is included in depreciation expense.
Contingencies
Tax Contingencies
The Company’s income tax calculations are based on application of the respective U.S. federal, state or foreign tax law. Its tax filings, however, are subject to audit by the respective tax authorities. Accordingly, the Company recognizes tax liabilities based upon its estimate of whether, and the extent to which, additional taxes will be due.
Legal Contingencies
From time to time, the Company may become involved in legal proceedings, claims and litigation arising in the ordinary course of business. When it believes a loss is probable and can be reasonably estimated, the Company accrues the estimated loss in its consolidated financial statements. Where the outcome of these matters is not determinable, the Company does not make a provision in its consolidated financial statements until the loss, if any, is probable and can be reasonable estimated or the outcome becomes known.
Product Warranties
The Company’s products typically carry a standard warranty period of approximately one year. The Company records a liability based on estimates of the costs that may be incurred under its warranty obligations and charges such costs to the cost of revenue at the time revenues are recognized. The warranty obligation is affected by product failure rates, material usage and service delivery costs incurred in correcting a product failure. The estimates of anticipated rates of warranty claims and costs per claim are primarily based on historical information and future forecasts.
The table below summarizes the activities related to accrued product warranties, which is included as a component of other current liabilities, for the years ended December 31, 2016 and 2015 (in thousands):
|
December 31,
|
||||||||
|
2016
|
2015
|
|||||||
|
Accrued product warranties — beginning of period
|
$
|
325
|
$
|
334
|
||||
|
Warranty charges
|
695
|
452
|
||||||
|
Warranty from Magnum acquisition
|
68 | - | ||||||
|
Warranties settled
|
(671
|
)
|
(461
|
)
|
||||
|
Accrued product warranties — end of period
|
$
|
417
|
$
|
325
|
||||
NOTE 9—STOCKHOLDERS’ EQUITY AND STOCK-BASED COMPENSATION
Public Offering
On August 21, 2015, the Company entered into an underwriting agreement (the “2015 Underwriting Agreement”) with selling stockholders and Cowen and Company, LLC and Roth Capital Partners, LLC as representative of several underwriters to the 2015 Underwriting Agreement relating to (i) a public primary offering of an aggregate of 9,218,000 shares of the Company’s common stock, par value $0.001 per share at a public offering price of $1.70 per share and (ii) a public secondary offering by the selling stockholders of an aggregate of 282,000 shares of common stock at $1.70 per share. The shares were accompanied by the associated rights to purchase shares of Series A Junior Preferred Stock, par value $0.001 per share (the “Series A Junior Preferred Stock”), which the Company created by the Rights Agreement, dated December 16, 2011, between the Company and the American Stock Transfer & Trust Company, LLC, as Rights Agent, as amended by the Amended and Restated Rights Agreement, dated December 16, 2014 (the “Amended Rights Agreement”). Under the terms of the 2015 Underwriting Agreement, the Company granted the underwriters a 30 day option to purchase up to an additional 1,425,000 shares of common stock to cover overallotments, which the underwriters subsequently exercised on September 10, 2015.
On September 10, 2015, the Company completed its public offering of 10,643,000 newly issued shares of common stock at a price to the public of $1.70 per share. The number of shares sold in the offering included the underwriter’s full exercise on September 10, 2015 of their over-allotment option of 1,425,000 shares of common stock. The net proceeds to the Company from the offering was approximately $16.5 million which consisted of $16.9 million after underwriting discounts, commissions and expenses less an additional $420,000 for legal, accounting, registration and other transaction costs related to the public offering.
On June 10, 2016, the Company entered into an underwriting agreement (the “2016 Underwriting Agreement”) with selling stockholders and Cowen and Company, LLC, Raymond James & Associates, Inc. and Needham & Company, LLC relating to (i) a public primary offering of an aggregate of 11,319,643 shares of the Company’s common stock, par value $0.001 per share, at a public offering price of $2.00 per share; (ii) a public secondary offering by certain of its officers and its directors of an aggregate of 684,600 shares of common stock at $2.00 per share; and (iii) a public secondary offering by certain of its stockholders who were former stockholders of Magnum of an aggregate of 495,757 shares of common stock at $2.00 per share. The shares were accompanied by the associated rights to purchase shares of Series A Junior Preferred Stock, which the Company created by the Rights Agreement. Under the terms of the 2016 Underwriting Agreement, the Company granted the underwriters a 30 day option to purchase up to an additional 1,875,000 shares of common stock to cover overallotments, which the underwriters subsequently exercised on June 15, 2016.
On June 15, 2016, the Company completed its public offering of the 13,194,643 newly issued shares of common stock. The net proceeds to the Company from the offering was approximately $24.3 million which consisted of proceeds of $24.7 million after underwriting discounts, commissions and expenses, less an additional $0.4 million for legal, accounting, registration and other transaction costs related to the public offering.
Private Equity Placement
On March 21, 2016, the Company entered into a Securities Purchase Agreement (the “PDSTI Agreement”) with Pudong Science and Technology Investment (Cayman) Co., Ltd., an affiliate of Shanghai Pudong Science and Technology Investment Co., Ltd. (collectively, “PDSTI”), pursuant to which PDSTI will purchase approximately $5.0 million of the Company’s common stock. Under the PDSTI Agreement, on March 24, 2016, the Company issued 1,754,385 shares of its common stock to PDSTI in a private placement at a purchase price of $2.85 per share.
Pursuant to the PDSTI Agreement, the Company agreed to file a registration statement on Form S-3 to provide registration rights to PDSTI in respect of the shares. The SEC declared the registration statement effective on June 3, 2016. The PDSTI Agreement provided that if the registration statement was not declared effective by July 7, 2016, the Company would pay to PDSTI, as liquidated damages, 0.4% of the aggregate purchase price on a monthly, prorated basis, until the registration statement was declared effective, with interest on these liquidated damages to accrue at the rate of 1.0% per month until paid in full. In the event that any U.S. governmental body or agency took any action or issued any order within six months that would have prevented PDSTI from holding the shares or invalidated the Company’s issuance of the shares to PDSTI, the Company had agreed to return PDSTI’s full purchase price, plus 0.4% interest on the purchase price (accruing monthly until paid in full), and to reimburse PDSTI’s expenses in connection with negotiating the private placement, up to $15,000. As a result, upon issuance of the shares to PDSTI, the Company classified the proceeds as mezzanine equity. As of September 2016 both of the loss contingencies on liquidated damages and the contingent redemption feature expired, and the net proceeds from the PDSTI Agreement of $4.6 million, comprised of the purchase price of $5.0 million net of $382,000 of related costs, were reclassified to permanent equity on the consolidated balance sheets.
Common and Preferred Stock
In December 2008, the Company’s stockholders approved an amendment to the Certificate of Incorporation to authorize 50,000,000 shares of common stock, par value $0.001 per share. In November 2014, the Company’s stockholders approved an amendment to the Amended and Restated Certificate of Incorporation to increase the number of authorized shares of common stock from 50,000,000 shares to 100,000,000 shares, par value $0.001 per share. In addition, the Company is authorized to issue 1,000,000 shares of preferred stock, par value $0.001 per share, of which 750,000 shares have been designated Series A Junior Preferred Stock with powers, preferences and rights as set forth in the amended and restated certificate of designation dated December 15, 2014; the remainder of the shares of preferred stock are undesignated, for which the Board of Directors is authorized to fix the designation, powers, preferences and rights. As of December 31, 2016 and 2015, there were no shares of preferred stock issued or outstanding.
On December 16, 2014, the Company entered into an Amended Rights Agreement to extend the expiration date of its stockholder rights plan that may have the effect of deterring, delaying, or preventing a change in control. The Amended Rights Agreement amends the Rights Agreement previously adopted by (i) extending the expiration date by three years to December 16, 2017, (ii) decreasing the exercise price per right issued to stockholders pursuant to the stockholder rights plan from $8.50 to $5.25, and (iii) making certain other technical and conforming changes. The Amended and Restated Rights Agreement was not adopted in response to any acquisition proposal. Under the rights plan, the Company issued a dividend of one preferred share purchase right for each share of common stock held by stockholders of record as of January 6, 2012, and the Company will issue one preferred stock purchase right to each share of common stock issued between January 6, 2012 and the earlier of either the rights’ exercisability or the expiration of the Rights Agreement, as amended by the Amended Rights Agreement. Each right entitles stockholders to purchase one one-thousandth of the Company’s Series A Junior Preferred Stock.
In general, the exercisability of the rights to purchase preferred stock will be triggered if any person or group, including persons knowingly acting in concert to affect the control of the Company, is or becomes a beneficial owner of 10% or more of the outstanding shares of the Company’s common stock after the Adoption Date. Stockholders or beneficial ownership groups who owned 10% or more of the outstanding shares of common stock of the Company on or before the Adoption Date will not trigger the preferred share purchase rights unless they acquire an additional 1% or more of the outstanding shares of the Company’s common stock. Each right entitles a holder with the right upon exercise to purchase one one-thousandth of a share of preferred stock at an exercise price that is currently set at $5.25 per right, subject to purchase price adjustments as set forth in the Amended Rights Agreement. Each share of preferred stock has voting rights equal to one thousand shares of common stock. In the event that exercisability of the rights is triggered, each right held by an acquiring person or group would become void. As a result, upon triggering of exercisability of the rights, there would be significant dilution in the ownership interest of the acquiring person or group, making it difficult or unattractive for the acquiring person or group to pursue an acquisition of the Company. These rights expire in December 2017, unless earlier redeemed or exchanged by the Company.
Warrants
As of December 31, 2016 and 2015, the Company had a total of 161,554 and 160,698 warrants to purchase common stock outstanding under all warrant agreements. These warrants have a weighted-average exercise price of $3.57 per share and expire between April 7, 2017 and October 5, 2022. During the year ended December 31, 2016, no warrants were exercised or expired. During the year ended December 31, 2015, no warrants were exercised and 500,000 warrants expired. Some of the warrants have anti-dilution provisions which adjust the number of warrants available to the holder such as, but not limited to, stock dividends, stock splits and certain reclassifications, exchanges, combinations or substitutions. These provisions are specific to each warrant agreement (see Note 3 – Fair Value Measurements).
Equity Incentive Plan
As of December 31, 2016 and 2015, there were 7,274,988 options and 7,918,584 options outstanding under all stock option plans. As of December 31, 2016 and 2015, there were 4,510,680 and 4,361,833 RSUs outstanding under the 2008 Equity Incentive Plan.
2008 Equity Incentive Plan
In December 2008, the Company adopted the 2008 Equity Incentive Plan (the “2008 Plan”) for directors, employees, consultants and advisors to the Company or its affiliates. Under the 2008 Plan, 2,500,000 shares of common stock were reserved for issuance upon the completion of a merger with Lumera Corporation (“Lumera”) on December 9, 2008. On January 1 of each year, starting in 2009, the aggregate number of shares reserved for issuance under the 2008 Plan increase automatically by the lesser of (i) 5% of the number of shares of common stock outstanding as of the Company’s immediately preceding fiscal year, or (ii) a number of shares determined by the Board of Directors. The maximum number of shares of common stock to be granted is up to 21,000,000 shares. Forfeited options or awards generally become available for future awards. As of December 31, 2016, the stockholders had approved 20,540,765 shares for future issuance. On January 1, 2016, there was an automatic increase of 2,260,527 shares. As of December 31, 2016, 11,427,032 options to purchase common stock and RSUs were outstanding and 1,817,570 shares are authorized for future issuance under the 2008 equity incentive plan.
Under the 2008 Plan, the exercise price of a stock option is at least 100% of the stock’s fair market value on the date of grant, and if an incentive stock option (“ISO”) is granted to a 10% stockholder at least 110% of the stock’s fair market value on the date of grant. Vesting periods for awards are recommended by the chief executive officer and generally provide for stock options to vest over a four-year period, with a one year vesting cliff of 25%, and have a maximum life of ten years from the date of grant. The Company has also issued RSUs which generally vest over a three quarters to four year period.
2007 Equity Incentive Plan
In August 2007, GigOptix LLC adopted the GigOptix LLC Equity Incentive Plan (the "2007 Plan"). The 2007 Plan provided for grants of options to purchase membership units, membership awards and restricted membership units to employees, officers and non-employee directors, and upon the completion of the merger with Lumera were converted into grants of up to 632,500 shares of stock. Vesting periods are determined by the Board of Directors and generally provide for stock options to vest over a four-year period and expire ten years from date of grant. Vesting for certain shares of restricted stock is contingent upon both service and performance criteria. The 2007 Plan was terminated upon the completion of merger with Lumera on December 9, 2008 and the remaining 864 stock options not granted under the 2007 Plan were cancelled. No shares of the Company’s common stock remain available for issuance of new grants under the 2007 Plan other than for satisfying exercises of stock options granted under this plan prior to its termination. As of December 31, 2016, options to purchase a total of 321,450 shares of common stock and 4,125 warrants to purchase common stock were outstanding.
Lumera 2000 and 2004 Stock Option Plan
In December 2008, in connection with the merger with Lumera, the Company assumed the existing Lumera 2000 Equity Incentive Plan and the Lumera 2004 Stock Option Plan (the “Lumera Plan”). All unvested options granted under the Lumera Plan were assumed by the Company as part of the merger. All contractual terms of the assumed options remain the same, except for the converted number of shares and exercise price based on merger conversion ratio of 0.125. As of December 31, 2016, no additional options can be granted under the Lumera Plan, and options to purchase a total of 37,186 shares of common stock were outstanding.
Stock-based Compensation Expense
The following table summarizes the Company’s stock-based compensation expense for the years ended December 31 2016 and 2015 (in thousands):
|
Years Ended December 31,
|
||||||||
|
2016
|
2015
|
|||||||
|
Cost of revenue
|
$
|
293
|
$
|
387
|
||||
|
Research and development expense
|
1,195
|
1,072
|
||||||
|
Selling, general and administrative expense
|
3,099
|
2,389
|
||||||
|
Total stock-based compensation expense
|
$
|
4,587
|
$
|
3,848
|
||||
Stock-based compensation expense capitalized to inventory was immaterial for the years ended December 31, 2016 and 2015.
The Company did not grant any options during the years ended December 31, 2016 and 2015.
Stock Options
The following table summarizes option activities under the Company’s equity incentive plans for the year ended December 31, 2016:
|
Options
|
Weighted-
Average
Exercise
Price
|
Weighted-
Average
Remaining
Contractual
Term
|
Aggregate
Intrinsic
Value
|
|||||||||||||
|
(in years)
|
(in thousands)
|
|||||||||||||||
|
Outstanding—December 31, 2015
|
7,918,584
|
$
|
2.32
|
4.82
|
$
|
7,422
|
||||||||||
|
Exercised
|
(454,526
|
)
|
1.60
|
|||||||||||||
|
Forfeited/Expired
|
(189,070
|
)
|
5.77
|
|||||||||||||
|
Outstanding—December 31, 2016
|
7,274,988
|
$
|
2.28
|
3.79
|
$
|
3,429
|
||||||||||
|
Vested and exercisable, December 31, 2016
|
7,240,820
|
$
|
2.28
|
3.77
|
$
|
3,373
|
||||||||||
|
Vested and exercisable and expected to vest, December 31, 2016
|
7,272,682
|
$
|
2.28
|
3.79
|
$
|
3,426
|
||||||||||
The aggregate intrinsic value reflects the difference between the exercise price of stock options and the fair value of the underlying common stock as determined by the Company’s closing stock price. The total intrinsic value of options exercised during the years ended December 31, 2016 and 2015 was $538,000 and $133,000, respectively.
As of December 31, 2016, the unrecognized stock-based compensation cost related to stock options, net of estimated forfeitures, was $15,000, which is expected to be recognized over a weighted-average period of 0.4 years.
The Company generally estimates the fair value of stock options granted using a Black-Scholes option-pricing model. This model requires the input of highly subjective assumptions, including the options expected life and the price volatility of the Company’s underlying stock. Actual volatility, expected lives, interest rates and forfeitures may be different from the Company’s assumptions, which would result in an actual value of the options being different from estimated. This fair value of stock option grants is amortized on a straight-line basis over the requisite service period of the awards, which is generally the vesting period.
The majority of the stock options that the Company grants to its employees provide for vesting over a specified period of time, normally a four-year period, with no other conditions to vesting. However, the Company may also grant stock options for which vesting occurs not only on the basis of elapsed time, but also on the basis of specified Company performance criteria being satisfied. In this case, the Company makes a determination regarding the probability of the performance criteria being achieved and uses a Black-Scholes option-pricing model to value the options incorporating management’s assumptions for the expected holding period, risk-free interest rate, stock price volatility and dividend yield. Compensation expense is recognized ratably over the vesting period, if it is expected that the performance criteria will be met.
RSUs
RSUs are converted into shares of the Company’s common stock upon vesting on a one-for-one basis. Typically, vesting of RSUs is subject to the employee’s continuing service to the Company. RSUs generally vest over a period of one to four years and are expensed ratably on a straight line basis over their respective vesting period net of estimated forfeitures. The fair value of the RSUs granted is the product of the number of shares granted and the grant date fair value of the Company’s common stock.
The following table summarizes RSU activities under the Company’s 2008 Plan for the year ended December 31, 2016:
|
Number of
Shares
|
Weighted-
Average
Grant Date
Fair Value
|
|||||||
|
Unvested balance—December 31, 2015
|
4,361,833
|
$
|
1.64
|
|||||
|
Granted
|
3,072,443
|
2.66
|
||||||
|
Released
|
(1,943,934
|
)
|
1.85
|
|||||
|
Forfeited/expired
|
(979,662
|
)
|
2.12
|
|||||
|
Unvested balance—December 31, 2016
|
4,510,680
|
$
|
2.14
|
|||||
As of December 31, 2016, the unrecognized stock-based compensation cost related to RSUs, net of estimated forfeitures, was $8.0 million, which is expected to be recognized over a weighted-average period of 2.6 years.
The majority of the RSUs that vested in the year ended December 31, 2016 were net-share settled such that the Company withheld shares with value equivalent to the employees’ minimum statutory obligation for the applicable income and other employment taxes, and remitted the cash to the appropriate taxing authorities. The total shares withheld were based on the value of the RSUs on their vesting date as determined by the Company’s closing stock price. These net-share settlements had the effect of share repurchases by the Company as they reduced and retired the number of shares that would have otherwise been issued as a result of the vesting and did not represent an expense to the Company. For the year ended December 31, 2016, 1,943,934 shares of RSUs vested and the Company withheld 701,823 shares to satisfy approximately $1.7 million of employees’ minimum tax obligation on the vested RSUs.
On July 19, 2016, the Company rescinded certain RSUs granted to Dr. Avi S. Katz, its Chief Executive Officer, as the total number of RSUs granted to Dr. Katz in 2015 were in excess of the 1,000,000 share per calendar year per person award limit as required by the 2008 Plan. As a result, Dr. Katz offered to rescind certain RSUs from two separate grants made to him in 2015, and the Company, upon the recommendation of the Compensation Committee of the Board of Directors, (i) rescinded 401,250 shares of unvested RSUs and concurrently issued an equal number of RSUs with the same vesting term; and (ii) rescinded 60,106 shares of unvested RSUs and concurrently issued 39,121 shares of RSUs with the same vesting term as the rescinded grant but a reduced number of shares vesting in each tranche as compared to the rescinded grant of RSUs. The Company accounted for the rescission and subsequent grant of RSUs to Dr. Katz as a modification with no incremental fair value. As a result, the Company continued to record stock-based compensation expenses based on the original grant date fair value prior to the modification, and no additional expense was recorded by the Company.
NOTE 10—BENEFIT PLANS
In connection with the Company’s Swiss subsidiary, the Company maintains a pension plan covering minimum requirements according to Swiss law. It has set up the occupational benefits by means of an affiliation to a collective foundation, the Swisscanto Collective Foundation.
Funding Policy
The Company’s practice is to fund the pension plan in an amount at least sufficient to meet the minimum requirements of Swiss law.
Benefit Obligations and Plan Assets
The following tables summarize changes in the benefit obligation, the plan assets and the funded status of the pension benefit plan as well as the components of net periodic benefit costs, including key assumptions (in thousands):
|
Years Ended December 31,
|
||||||||
|
2016
|
2015
|
|||||||
|
Change in projected benefit obligation:
|
||||||||
|
Beginning benefit obligation
|
$
|
781
|
$
|
822
|
||||
|
Service cost
|
55
|
62
|
||||||
|
Interest cost
|
8
|
12
|
||||||
|
Plan participants contributions
|
18
|
23
|
||||||
|
Foreign exchange adjustments
|
(20
|
)
|
(1
|
)
|
||||
|
Actuarial loss (gain)
|
51
|
(28
|
)
|
|||||
|
Transfer in/(out)
|
(120
|
)
|
(109
|
)
|
||||
|
Ending benefit obligation
|
$
|
773
|
$
|
781
|
||||
|
Change in plan assets:
|
||||||||
|
Beginning fair value of plan assets
|
$
|
432
|
$
|
496
|
||||
|
Employer contributions
|
18
|
23
|
||||||
|
Plan participants' contributions
|
18
|
23
|
||||||
|
Foreign exchange adjustments
|
(11
|
)
|
1
|
|||||
|
Expected return on plan assets
|
91
|
(2
|
)
|
|||||
|
Transfer in/(out)
|
(120
|
)
|
(109
|
)
|
||||
|
Ending fair value of plan assets
|
$
|
428
|
$
|
432
|
||||
|
Benefits paid
|
$
|
—
|
$
|
—
|
||||
The following table summarizes the funding status as of December 31, 2016 and 2015 (in thousands):
|
Years Ended December 31,
|
||||||||
|
2016
|
2015
|
|||||||
|
Projected benefit obligation
|
$
|
(773
|
)
|
$
|
(781
|
)
|
||
|
Fair value of plan assets
|
428
|
432
|
||||||
|
Funded status of the plan at the end of the year, recorded as a long-term liability
|
$
|
(345
|
)
|
$
|
(349
|
)
|
||
Assumptions
Weighted-average assumptions used to determine benefit obligations as of December 31, 2016 for the plan were a discount rate of 0.30%, a rate of compensation increase of 2.00%, and an expected return on assets of 1.00%. The GigOptix-Helix Plan is reinsured with the Helvetia Swiss Life Insurance Company via the Swisscanto Collective Foundation. The expected return on assets is derived as follows: Swiss pension law requires that the insurance company pay an interest rate of at least 1.25% per annum on legal minimum old-age savings accounts.
Weighted-average assumptions used to determine costs for the plan as of December 31, 2015 were a discount rate of 1.00%, rate of compensation increase of 2.00%, and expected return on assets of 1.00%.
Net Periodic Benefit Cost
The net periodic benefit cost for the plan included the following components (in thousands):
|
Years Ended December 31,
|
||||||||
|
2016
|
2015
|
|||||||
|
Service cost (net)
|
$
|
55
|
$
|
62
|
||||
|
Interest cost
|
8
|
12
|
||||||
|
Net periodic benefit cost
|
$
|
63
|
$
|
74
|
||||
The total net periodic pension cost for the year ending December 31, 2017 is expected to be approximately $66,000.
The following are the components of estimated net periodic pension cost in 2017 (in thousands):
|
Year Ending
December 31,
2017
|
||||
|
Service cost (net)
|
$
|
68
|
||
|
Interest cost
|
2
|
|||
|
Expected return on plan assets
|
(4
|
)
|
||
|
Net periodic benefit cost
|
$
|
66
|
||
Plan Assets
The benefits are fully insured. There are no retirees and the plan assets are equal to the sum of the old-age savings and of various other accounts within the affiliation contract.
The allocation of the assets of the plan at the measurement dates were in cash, bonds, stocks, mutual funds, hedge funds, and commodities. The Company is required by Swiss law to contribute to retirement funds for the employees of its Swiss subsidiary. Funds are managed by third parties according to statutory guidelines. Cash equivalents may be valued using quoted prices in markets that are not active, resulting in a Level 2 fair value measurement within the hierarchy set forth in the accounting guidance for fair value measurements.
Contributions
The Company anticipates contributions to the plan of approximately $23,000 in the year ending December 31, 2017. Actual contributions may differ from expected contributions due to various factors, including performance of plan assets, interest rates and potential legislative changes. The Company is not able to estimate expected contributions beyond fiscal year 2017.
Estimated Future Benefit Payments
The Company does not expect benefit payments through 2024.
Israel Severance Plan liability
Under Israeli law, the Company is required to make severance payments to its retired or dismissed Israeli employees and Israeli employees leaving its employment in certain other circumstances. The Company’s severance pay liability to its Israeli employees is calculated based on the salary of each employee multiplied by the number of years of such employee’s employment and is presented in other long-term liabilities on the consolidated balance sheets, as if it was payable at each balance sheet date on an undiscounted basis. This liability is partially funded by the purchase of insurance policies in the name of the employees. The surrender value of the insurance policies of $10,000 is presented in other long-term assets on the consolidated balance sheets. There were no severance pay expenses for the years ended December 31, 2016 and 2015. As of December 31, 2016 and 2015, accrued severance liabilities were $12,000. As of December 31, 2016 and 2015, severance assets were $8,000 and $10,000, respectively.
GigPeak 401(k) Plan
The Company has a 401(k) retirement plan which was adopted by GigOptix LLC as of January 4, 2008. In December 2011, the GigOptix 401k plan merged into the Endwave 401k plan and renamed as GigPeak 401k plan in April 2016. This plan is intended to be a qualified retirement plan under the Internal Revenue Code. It is a defined contribution as opposed to a defined benefit plan. The Company made $86,000 and $71,000 matching contributions during the years ended December 31, 2016 and 2015, respectively.
GigOptix Terasquare Korea Defined Contribution Plan
The Company adopted a contribution pension plan for its Korean employees, where the Company pays fixed contributions to each employee who participates in the plan each year. The Company has no further payment obligations once the contributions have been paid. The contributions are recognized as employee benefit expense when they are due. The total contribution made for the year ended December 31, 2016 was $51,000. The total contribution made for the year 2015 since the acquisition of Terasquare on September 30, 2015 was $12,000.
Magnum Canada Registered Retirement Savings Plan
The Company adopted a Registered Retirement Savings Plan (“RRSP”) for its Canada employees. The Company made $20,000 in matching contribution for the year ended December 31, 2016 since the acquisition of Magnum Canada on April 5, 2016.
NOTE 11—INCOME TAXES
The components of income before provision for income taxes are as follows (in thousands):
|
Years Ended December 31,
|
||||||||
|
2016
|
2015
|
|||||||
|
United States
|
$
|
2,154
|
$
|
1,189
|
||||
|
International
|
318
|
130
|
||||||
|
Income before provision for income taxes
|
$
|
2,472
|
$
|
1,319
|
||||
Components of provision for income taxes are as follows (in thousands):
|
Years Ended December 31,
|
||||||||
|
2016
|
2015
|
|||||||
|
Current:
|
||||||||
|
United States
|
$
|
83
|
$
|
20
|
||||
|
International
|
67
|
37
|
||||||
|
State
|
20
|
10
|
||||||
|
Total
|
170
|
67
|
||||||
|
Deferred:
|
||||||||
|
United States
|
69
|
—
|
||||||
|
International
|
—
|
—
|
||||||
|
Total
|
69
|
—
|
||||||
|
Provision for income taxes
|
$
|
239
|
$
|
67
|
||||
Provision for income taxes differs from the amount computed by applying the statutory United States federal income tax rate to gain (loss) before taxes as follows:
|
Years Ended December 31,
|
||||||||
|
2016
|
2015
|
|||||||
|
Income tax at the federal statutory rate
|
34.00
|
%
|
34.00
|
%
|
||||
|
State tax, net of federal benefit
|
1.04
|
%
|
0.75
|
%
|
||||
|
Foreign tax rate differential
|
(2.83
|
)%
|
(0.51
|
)%
|
||||
|
True-up and other
|
3.74
|
%
|
—
|
|||||
|
Permanent items and other
|
3.34
|
%
|
1.48
|
%
|
||||
|
Losses not benefited
|
(29.62
|
)%
|
(30.73
|
)%
|
||||
|
Effective tax rate
|
9.67
|
%
|
4.99
|
%
|
||||
The components of the net deferred tax assets and liabilities are as follows (in thousands):
|
December 31,
|
||||||||
|
2016
|
2015
|
|||||||
|
Deferred tax asset (liability), net
|
||||||||
|
Net operating loss carry forwards
|
$
|
20,037
|
$
|
17,577
|
||||
|
Tax credits
|
1,960
|
3,051
|
||||||
|
Accrued and reserves
|
6,461
|
2,575
|
||||||
|
Foreign deferred
|
—
|
—
|
||||||
|
Fixed assets
|
905
|
824
|
||||||
|
Other
|
2,587
|
2,222
|
||||||
|
Total deferred tax asset
|
31,950
|
26,249
|
||||||
|
Valuation allowance
|
(28,245
|
)
|
(25,977
|
)
|
||||
|
Net deferred tax asset
|
3,705
|
272
|
||||||
|
Foreign intangibles and pension other comprehensive income
|
(296
|
)
|
(318
|
)
|
||||
|
Intangible assets
|
(3,764
|
)
|
(272
|
)
|
||||
|
Deferred tax liability
|
(4,060
|
)
|
(590
|
)
|
||||
|
Net deferred tax liability
|
$
|
(355
|
)
|
$
|
(318
|
)
|
||
For the years ended December 31, 2016 and 2015, the deferred tax liability is included in other long-term liabilities on the consolidated balance sheets.
The Company has a full valuation allowance on its deferred tax assets in excess of deferred tax liabilities. Because of its limited operating history and cumulative losses, management believes it is more likely than not that the remaining deferred tax assets will not be realized.
The Company’s valuation allowance increased by approximately $2.3 million and decreased by approximately $1.7 million during the years ended December 31, 2016 and December 31, 2015, respectively.
The Company has approximately $47.3 million of federal net operating loss (“NOL”) carryforwards as of December 31, 2016. The NOLs expire beginning in 2027. The Company has approximately $1.5 million of federal research and development (“R&D”) tax credit carryforwards as of December 31, 2016. The federal tax credit carryforwards expire through 2036. The Company has approximately $32.5 million of state NOL carryforwards as of December 31, 2016. The NOLs expire through 2036. The Company has approximately $3.7 million of state R&D tax credit carryforwards as of December 31, 2016. The state R&D tax credits do not expire. Utilization of a portion of the NOL and credit carryforwards are subject to an annual limitation due to the ownership change provision of the IRC of 1986, as amended, and similar state provisions. The annual limitation may result in the expiration of NOLs and credits before utilization. The Company also has approximately $13.2 million of NOL carryforwards in Israel related to its acquisition of ChipX. The losses in that jurisdiction can be carried forward indefinitely.
Any interest and penalties incurred on the settlement of outstanding tax positions would be recorded as a component of income tax expense. The Company recorded $47,000 and $14,000 of interest and penalty expenses during the years ended December 31, 2016 and 2015, respectively.
The Company’s unrecognized tax benefits as of December 31, 2016 relate to various domestic and foreign jurisdictions. As of December 31, 2016, the Company had total gross unrecognized tax benefits of $8.5 million, which if recognized would affect the effective interest rate. As of December 31, 2016 and 2015, the amount of long-term income taxes payable for unrecognized tax benefits, including accrued interest, was $977,000 and $434,000, respectively.
A reconciliation of the beginning and ending amount of unrecognized tax benefits is as follows (in thousands):
|
Total
|
||||
|
Balance as of December 31, 2014
|
$
|
3,004
|
||
|
Increases related to current year tax positions
|
181
|
|||
|
Increases related to prior year tax positions
|
—
|
|||
|
Decreases related to prior year tax positions
|
(94
|
)
|
||
|
Balance as of December 31, 2015
|
3,091
|
|||
|
Increases related to current year tax positions
|
574
|
|||
|
Increases related to prior year tax positions-acquisition
|
4,809
|
|||
|
Increases related to prior year tax positions
|
—
|
|||
|
Decreases related to prior year tax positions
|
—
|
|||
|
Balance as of December 31, 2016
|
$
|
8,474
|
||
The Company files tax returns in the U.S. federal, U.S. state and foreign tax jurisdictions. The Company’s major tax jurisdictions are the U.S., California, Switzerland, Korea, Japan, Canada, China and Israel. The Company’s fiscal years through 2016 remain subject to examination by the tax authorities for U.S. federal, U.S. state and foreign tax purpose.
NOTE 12—NET INCOME PER SHARE
The computations for basic and diluted net income per share are as follows (in thousands, except per share data):
|
Years Ended December 31,
|
||||||||
|
2016
|
2015
|
|||||||
|
Net income
|
$
|
2,233
|
$
|
1,249
|
||||
|
Weighted-average common shares used in basic net income per share
|
58,713
|
36,624
|
||||||
|
Effect of dilutive securities:
|
||||||||
|
Stock options
|
1,631
|
876
|
||||||
|
RSUs
|
1,063
|
612
|
||||||
|
Warrants
|
5
|
2
|
||||||
|
Weighted-average common shares used in diluted net income per share
|
61,412
|
38,114
|
||||||
|
Net income per share – basic
|
$
|
0.04
|
$
|
0.03
|
||||
|
Net income per share – diluted
|
$
|
0.04
|
$
|
0.03
|
||||
The following table summarizes total securities outstanding which were not included in the calculation of diluted net income per share because to do so would have been anti-dilutive:
|
December 31,
|
||||||||
|
2016
|
2015
|
|||||||
|
Stock options and RSUs
|
6,279,602
|
3,986,961
|
||||||
|
Common stock warrants
|
125,000
|
156,573
|
||||||
|
Total
|
6,404,602
|
4,143,534
|
||||||
NOTE 13—SEGMENT AND GEOGRAPHIC INFORMATION
The Company’s chief operating decision maker is its Chief Executive Officer. The chief operating decision maker reviews financial information presented on a consolidated basis for purposes of allocating resources and evaluating financial performance. Accordingly, the Company has determined that it operates as a single operating and reportable segment.
The following table summarizes revenue by geographic region (in thousands, except percentages):
|
Years Ended December 31,
|
||||||||||||||||
|
2016
|
2015
|
|||||||||||||||
|
North America
|
$
|
28,577
|
49
|
%
|
$
|
13,468
|
33
|
%
|
||||||||
|
Asia
|
15,428
|
26
|
%
|
14,125
|
35
|
%
|
||||||||||
|
Europe
|
14,738
|
25
|
%
|
12,143
|
30
|
%
|
||||||||||
|
Rest of World
|
—
|
—
|
658
|
2
|
%
|
|||||||||||
|
Total
|
$
|
58,743
|
100
|
%
|
$
|
40,394
|
100
|
%
|
||||||||
The Company determines geographic location of its revenue based upon the destination of shipments of its products.
The following table summarizes long-lived assets by geography (in thousands, except percentages):
|
December 31,
|
||||||||||||||||
|
2016
|
2015
|
|||||||||||||||
|
Americas
|
$
|
3,299
|
86
|
%
|
$
|
2,680
|
85
|
%
|
||||||||
|
Europe
|
422
|
11
|
%
|
435
|
14
|
%
|
||||||||||
|
Asia
|
119
|
3
|
%
|
18
|
1
|
%
|
||||||||||
|
Total
|
$
|
3,840
|
100
|
%
|
$
|
3,133
|
100
|
%
|
||||||||
Long-lived assets, comprised of property and equipment, net are reported based on the location of the assets at each balance sheet date.
NOTE 14—SUBSEQUENT EVENTS
On February 13, 2017, the Company entered into an Agreement and Plan of Merger (the “Merger Agreement”) with Integrated Device Technology, Inc. (“IDT”) and IDT’s wholly-owned subsidiary Glider Merger Sub, Inc. (the “Purchaser”), Pursuant to the terms of the Merger Agreement, Purchaser made a tender offer to acquire all of the outstanding shares of the Company’s common and associated purchase rights for the Company’s Series A Junior Preferred Stock (collectively the “Shares”) on March 7, 2017 (the “Offer”). The Offer is scheduled to expire one minute following 11:59 P.M. (12:00 midnight) New York Time, on Monday April 3, 2017, unless the Offer is extended or terminated.
The Merger Agreement provides that, among other things, subject to the satisfaction or waiver of certain conditions, following completion of the Offer, and in accordance with the Delaware General Corporation Law, as amended (the “DGCL”), Purchaser will be merged with and into the Company (the “Merger”) (collectively, the Offer, the Merger, and the transactions contemplated by the Merger Agreement constitute the “Transaction”). Following the consummation of the Merger, the Company will continue as the surviving corporation and as a wholly-owned subsidiary of IDT. The Merger will be governed by Section 251(h) of the DGCL which provides that, as soon as practicable following consummation of a successful tender offer for the outstanding voting stock of a corporation whose shares are listed on a national securities exchange, and subject to certain statutory provisions, if the acquiror holds at least the amount of shares of each class or series of stock of the acquired corporation that would otherwise be required to adopt a merger agreement providing for the merger of the acquired corporation, and each outstanding share of each class or series of stock of the acquired corporation subject to, but not tendered in, the tender offer is subsequently converted by virtue of such a merger into, or into the right to receive, the same amount and kind of consideration for their stock in the merger as was payable in the tender offer, the acquiror can effect such a merger without any vote of the stockholders of the acquired corporation. Accordingly, if Purchaser consummates the Offer, the Merger Agreement contemplates that the parties thereto will affect the closing of the Merger without a vote of the stockholders of GigPeak in accordance with Section 251(h) of the DGCL.
The obligation of Purchaser to purchase the Shares validly tendered pursuant to the Offer and not validly withdrawn prior to the expiration of the Offer is subject to the satisfaction or waiver of a number of conditions set forth in the Merger Agreement, including (i) that there will have been validly tendered and not validly withdrawn a number of Shares that, when added to the Shares then owned by IDT and its wholly-owned direct or indirect subsidiaries, represents at least a majority of the Shares then outstanding (on a fully-diluted basis) and no less than a majority of the voting power of the shares of capital stock of GigPeak then outstanding (on a fully-diluted basis) and entitled to vote upon the adoption of the Merger Agreement and the approval of the Merger, excluding from the number of tendered Shares, but not from the number of outstanding Shares, Shares tendered pursuant to guaranteed delivery procedures, to the extent such procedures are permitted by Purchaser, that have not yet been delivered in settlement of such guarantee, (ii) the expiration or termination of any applicable waiting period (and any extension thereof) and the receipt of any approval or clearance applicable to the Offer or consummation of the Merger under the Hart-Scott-Rodino Antitrust Improvements Act of 1976, as amended, (iii) the accuracy of the representations and warranties and compliance with covenants contained in the Merger Agreement, subject to certain materiality standards, (iv) the absence of any law, order, injunction or decree by any government, court or other governmental entity that would make illegal or otherwise prohibit the Offer or the Merger, (v) there not having been a material adverse effect with respect to GigPeak, and (vi) other customary conditions.
In connection with the Merger Agreement, the members of the Board of Directors of the Company entered into a Tender and Support Agreement (the “Tender and Support Agreement”) with the Purchaser pursuant to which the members of the Board of Directors have agreed to tender their shares of the Company’s common stock in the Offer and to support the Merger and the other transactions contemplated by the Merger Agreement.
Upon the occurrence of certain termination events, the Company may be required to pay IDT a breakup fee and/or expense reimbursement.
In connection with the Company’s entry into the Merger Agreement, the Company entered into Amendment No. 1 to the Rights Agreement, dated February 10, 2017 (the “Rights Amendment”), amending the Amended Rights Agreement. The effect of the Rights Amendment is to permit the Offer, the Merger and the other transactions contemplated by the Merger Agreement. The Rights Amendment provides that: (i) neither IDT nor the Purchaser nor any of their respective affiliates shall be deemed to be an Acquiring Person (as such term is defined in the Amended Rights Agreement), (ii) neither a Distribution Date nor a Stock Acquisition Date (as each such term is defined in the Amended Rights Agreement) shall be deemed to have occurred, and the Rights (as such term is defined in the Amended Rights Agreement) will not detach from the shares of common stock or become non-redeemable, as a result of the execution, delivery or performance of the Merger Agreement, the Offer and/or the Merger, including the acquisition of shares of common stock pursuant thereto, the Tender and Support Agreements entered into in conjunction with the Merger Agreement or any other transaction contemplated by the Merger Agreement and (iii) the Rights (as such term is defined in the Amended Rights Agreement) and the Amended Rights Agreement shall expire and terminate immediately prior to the acceptance time for the Offer.
None.
Evaluation of Disclosure Controls and Procedures
We maintain “disclosure controls and procedures,” as such term is defined in Rule 13a-15(e) under the Securities Exchange Act of 1934 (the “Exchange Act”), that are designed to ensure that information required to be disclosed by us in reports that we file or submit under the Exchange Act is recorded, processed, summarized, and reported within the time periods specified in Securities and Exchange Commission rules and forms, and that such information is accumulated and communicated to our management, including our Chief Executive Officer (“CEO”) and Chief Financial Officer (“CFO”), as appropriate, to allow timely decisions regarding required disclosure.
Our management is responsible for establishing and maintaining our disclosure controls and procedures. Our CEO and CFO have evaluated the effectiveness of our disclosure controls and procedures as of December 31, 2016 and have concluded that these controls and procedures were effective. We believe that a control system, no matter how well designed and operated, can only provide reasonable assurance and cannot provide absolute assurance that the objectives of the control system are met, and no evaluation of controls can provide absolute assurance that all control issues and instances of fraud, if any, within a company have been detected. Our CEO and CFO have concluded that our consolidated financial statements for the periods covered by and included in this Annual Report on Form 10-K are fairly stated in all material respects in accordance with generally accepted accounting principles in the United States.
Management’s Report on Internal Control over Financial Reporting
Our management is responsible for establishing and maintaining adequate internal control over financial reporting as defined in Rule 13a-15(f) and 15d-15(f) of the Exchange Act. Because of its inherent limitations, internal control over financial reporting may not prevent or detect misstatements. Also, projections of any evaluation of effectiveness to future periods are subject to the risk that controls may become inadequate because of changes in conditions, or that the degree of compliance with the policies or procedures may deteriorate.
Internal control over financial reporting includes those policies and procedures that (i) pertain to the maintenance of records that in reasonable detail accurately and fairly reflect the transactions and dispositions of our assets; (ii) provide reasonable assurance that transactions are recorded as necessary to permit preparation of financial statements in accordance with generally accepted accounting principles, and that our receipts and expenditures are being made only in accordance with authorizations of our management and directors; and (iii) provide reasonable assurance regarding prevention or timely detection of unauthorized acquisition, use or disposition of our assets that could have a material effect on the financial statements.
Our management assessed the effectiveness of our internal control over financial reporting as of December 31, 2016 based upon the framework in “Internal Control – Integrated Framework” (2013 Framework) issued by the Committee of Sponsoring Organizations of the Treadway Commission and concluded that our internal control over financial reporting was effective as of that date.
Our independent registered public accounting firm, BPM LLP, which audited the consolidated financial statements in this Annual Report on Form 10-K, independently assessed the effectiveness of the Company’s internal control over financial reporting. BPM LLP has issued an attestation report, which appears as part of this Annual Report on Form 10-K.
Changes in Internal Control over Financial Reporting
There were no changes in our internal controls over financial reporting that occurred during our most recent fiscal quarter that have materially affected, or are reasonably likely to materially affect, our internal control over financial reporting.
To the Board of Directors and
Stockholders of GigPeak, Inc.
We have audited the internal control over financial reporting of GigPeak, Inc. (a Delaware Corporation) and its subsidiaries (the “Company”) as of December 31, 2016, based on criteria established in Internal Control—Integrated Framework (2013 Framework) issued by the Committee of Sponsoring Organizations of the Treadway Commission (“COSO”). The Company’s management is responsible for maintaining effective internal control over financial reporting and for its assessment of the effectiveness of internal control over financial reporting included in the accompanying Management’s Report on Assessment of Internal Controls Over Financial Reporting. Our responsibility is to express an opinion on the Company’s internal control over financial reporting based on our audit.
We conducted our audit in accordance with the standards of the Public Company Accounting Oversight Board (United States). Those standards require that we plan and perform the audit to obtain reasonable assurance about whether effective internal control over financial reporting was maintained in all material respects. Our audit of internal control over financial reporting included obtaining an understanding of internal control over financial reporting, assessing the risk that a material weakness exists, and testing and evaluating the design and operating effectiveness of internal control based on the assessed risk. Our audit also included performing such other procedures as we considered necessary in the circumstances. We believe that our audit provides a reasonable basis for our opinion.
A company’s internal control over financial reporting is a process designed to provide reasonable assurance regarding the reliability of financial reporting and the preparation of financial statements for external purposes in accordance with generally accepted accounting principles. A company’s internal control over financial reporting includes those policies and procedures that (1) pertain to the maintenance of records that, in reasonable detail, accurately and fairly reflect the transactions and dispositions of the assets of the company; (2) provide reasonable assurance that transactions are recorded as necessary to permit preparation of financial statements in accordance with generally accepted accounting principles, and that receipts and expenditures of the company are being made only in accordance with authorizations of management and directors of the company; and (3) provide reasonable assurance regarding prevention or timely detection of unauthorized acquisition, use, or disposition of the company’s assets that could have a material effect on the financial statements.
Because of its inherent limitations, internal control over financial reporting may not prevent or detect misstatements. Also, projections of any evaluation of effectiveness to future periods are subject to the risk that controls may become inadequate because of changes in conditions, or that the degree of compliance with the policies or procedures may deteriorate.
In our opinion, GigPeak, Inc. and its subsidiaries maintained, in all material respects, effective internal control over financial reporting as of December 31, 2016, based on criteria established in Internal Control—Integrated Framework (2013 Framework) issued by COSO.
We also have audited, in accordance with the standards of the Public Company Accounting Oversight Board (United States), the consolidated balance sheets of GigPeak, Inc. and its subsidiaries as of December 31, 2016 and 2015 and the related consolidated statements of operations, comprehensive income, stockholders’ equity, and cash flows for each of the two years in the period ended December 31, 2016 and our report dated March 15, 2017 expressed an unqualified opinion.
/s/ BPM LLP
San Jose, California
March 15. 2017
None.
PART III
Directors and Executive Officers
The table below sets forth information regarding the members of our Board of Directors and non-director executive officers as of March 1, 2017. Our certificate of incorporation divides the Board of Directors into three classes with overlapping three-year terms. One class is elected each year at the annual meeting of stockholders, and the classes are to be as nearly equal in number as possible. Each director shall hold office until his or her successor is duly qualified. Our Board of Directors and executive officers are as follows:
|
Name
|
Age
|
Position
|
Director
Since
|
|||
|
Dr. Avi Katz
|
58
|
Chairman of the Board of Directors, Chief Executive Officer and President
|
2008
|
|||
|
Darren Ma
|
37
|
Vice President and Chief Financial Officer
|
N/A
|
|||
|
Andrea Betti-Berutto
|
52
|
Senior Vice President and Chief Technical Officer
|
N/A
|
|||
|
Dr. Raluca Dinu
|
43
|
Executive Vice President and Chief Operating Officer
|
N/A
|
|||
|
Joseph J. Lazzara
|
65
|
Director
|
2011
|
|||
|
John J. Mikulsky
|
71
|
Director
|
2011
|
|||
|
Neil J. Miotto
|
70
|
Director
|
2008
|
|||
|
Frank Schneider
|
74
|
Director
|
2010
|
|||
|
Kimberly D.C. Trapp
|
58
|
Director
|
2008
|
Dr. Avi Katz is a serial entrepreneur. Since founding GigOptix LLC, followed by GigOptix, Inc. the predecessor company to GigPeak, Inc. in July 2007, he served as the Chairman of the Board of Directors, Chief Executive Officer and President of the company and all its subsidiaries, including its overseas operations GigOptix-Helix AG in Switzerland, GigOptix Israel LTD, and GigOptix-Terasquare-Korea (GTK) Co., Ltd. He led the company through the public listing on OTC Exchange in December 2008, the listing of GigOptix, Inc. on the NYSE-MKT in April 2012 and the listing of GigPeak, Inc. on the NYSE-MKT in April 2016. Prior to founding the GigOptix / GigPeak group of companies, Dr. Katz was the Managing Partner of APU-Global, which he founded in 2005, the Chief Executive Officer, President and a board member of Intransa, Inc., from 2003 to 2005, and of Equator Technologies, Inc., from 2000 to 2003. Earlier in his career he held various sales and marketing, business development, technology and operational corporate executive positions with private and public companies, following his tenure as a Member of the Technical Staff with AT&T Bell Labs, Murray Hill, NJ, between 1988 and 1995. He holds more than 70 U.S. and international patents, has published about 300 technical papers and is the editor of a number of technical books. Dr. Katz received his Ph.D. in materials engineering and a B.S. in engineering from Technion-IIT, Israel, and is a graduate of the Israeli Naval Academy.
Darren Ma, Vice President and Chief Financial Officer, joined GigPeak in 2014. He brings over 13 years of semiconductor experience and financial leadership to GigPeak. He began his career at Intel Corporation, where he worked in various finance positions, specializing in budgeting, cost and inventory, strategic financial planning, and P&L management. Prior to joining GigPeak, he worked in roles of increasing responsibility at Semtech Corporation, and served as the primary financial partner to several members of the executive staff. He played a lead role in increasing the profitability of the Power Management business unit, and, most recently, as the Business Unit Controller for the Power Management and High Reliability and Systems Innovation business units. Prior to Semtech, he held a senior financial position at Fisher Investments, supporting the M&A, Institutional, and United Kingdom investment groups. Darren holds a Managerial Economics Bachelor of Science degree from the University of California, Davis and received his MBA from W.P. Carey School of Business at Arizona State University.
Andrea Betti-Berutto has served as the Chief Technology Officer of the company since its inception in 2007 through the acquisition of the iTerra LLC assets, where he was a co-founder and served as the VP of Engineering since the inception in 2001. In iTerra LLC he led the development of analog and digital high speed ICs for the 10 Gb/s and 40Gb/s optical network, wireless application and instrumentation. Previously, Mr. Betti-Berutto worked at Fujitsu Compound Semiconductor as manager of product development for microwave and millimeter-wave IC for point-to-point and satellite communication applications, at Space Engineering S.p.A Rome, Italy, and European Space Agency R&D laboratory, Noordwijk, The Netherlands, as payload system engineer and MMIC designer. Mr. Betti-Berutto has more than 20 years of experience in the design of high speed ICs and multichip modules for microwave, millimeter-wave, and fiber optics application. He is the author of several papers in technical journals in the area of power amplifiers, high-speed ICs, and broadband design for optical network applications and received his M.Sc. degree in electrical engineering from the University of Rome “La Sapienza”.
Dr. Raluca Dinu is the Executive Vice President and Chief Operating Officer, having been promoted to that position in April, 2016, and has more than 15 years of experience in the telecommunication industry. A visionary executive with an established track record of driving increased revenue and profitability, building and leading cross functional teams, developing and commercializing advanced technologies, Dr. Dinu joined GigPeak as the Vice President of Product Development in 2008 through the acquisition of Lumera Inc., where she served as the Vice President of the Electro-Optic Business Unit since 2007. From 2001 to 2007, Dr. Dinu served Lumera in various capacities as technology and business leader. In her current role, she leads the global marketing and sales organizations for GigPeak. She has an exceptional ability to manage and lead in rapidly changing and competitive environments while demonstrating an innate ability to achieve corporate goals within defined resources. Dr. Dinu holds more than 15 patents, obtained her B.Sc. in Optics, and Ph.D. in Physics, at the University of Bucharest in 2000 in ferroelectric thin films for random access memories, and also graduated from the Executive MBA AeA/Stanford Institute in 2007.
Joseph J. Lazzara has over 30 years of public company Board of Directors experience. He joined the Board in July, 2011 with the acquisition of Endwave where he served as a director since February 2004. From 2006 to 2008, Mr. Lazzara served as the Vice Chairman and a director of Omron Scientific Technologies, Inc. (formerly Scientific Technologies, Inc. (NASDAQ: STIZ)), a manufacturer of factory automation products acquired by Omron Corporation in 2006. Mr. Lazzara served in various executive positions with Scientific Technologies, including as the Chief Executive Officer, President and director and other positions between 1984 and 2006. He also serves as the Vice Chairman and Director of Automation Products Group, Inc., a privately held manufacturer of automation sensors. Mr. Lazzara received a B.S. in Engineering from Purdue University and an M.B.A. from Santa Clara University.
John J. Mikulsky served as President and Chief Executive Officer of Endwave Corporation from December 2009 until June 2011, when Endwave was acquired by GigPeak. From May 1996 until November 2009, Mr. Mikulsky served Endwave in a multitude of capacities including Vice President of Product Development, Vice President of Marketing and Business Development and Chief Operating Officer. Prior to Endwave, Mr. Mikulsky worked as a Technology Manager for Balazs Analytical Laboratory, from 1993 until 1996, a provider of analytical services to the semiconductor and disk drive industries. Prior to 1993, Mr. Mikulsky worked at Raychem Corporation, most recently as a Division Manager for its Electronic Systems Division. Mr. Mikulsky holds a B.S. in electrical engineering from Marquette University, an M.S. in electrical engineering from Stanford University and an S.M. in Management from the Sloan School at the Massachusetts Institute of Technology.
Neil J. Miotto joined the Board of Directors in December, 2008. Mr. Miotto is a financial consultant and a retired assurance partner of KPMG LLP where he was a partner for twenty-seven years until his retirement in September 2006. Since his retirement from KPMG Mr. Miotto has provided high level financial consulting services to companies in need of timely accounting assistance and in serving on public company boards. He is deem to be a ‘financial expert’ under SEC and NYSE rules. While at KPMG Mr. Miotto focused on serving large public companies, primarily semiconductor companies. Among the clients he served were National Semiconductor Corporation, Fairchild Semiconductor Corp, and nVIDIA Corporation. Mr Miotto also served as an SEC reviewing partner while at KPMG. He is a member of the American Institute of Certified Public Accountants. He holds a Bachelor of Business Administration degree from Baruch College, of The City University of New York. He served on the board of directors of Micrel, Inc. prior to its acquisition in 2015.
Frank W. Schneider has over 40 years of experience in the electronics and semiconductor industries, serving on the boards and executive management teams of both privately held and publicly traded companies. He recently retired from MKS Instruments Inc., where he served as vice president and general manager and continues to provide consulting services. Previously, he served as president and CEO at both ION Systems Inc., a privately held manufacturer of electrostatic management systems, and GHz Technology Inc., a privately held manufacturer of RF power transistors that was merged into Advanced Power Technology Inc. (NASDAQ: APTI), where he served as COO of the RF products group. Additionally, he was a member of the technical advisory board of Neomagic Inc., a display controller chip company, and was a member of the board of directors of GMT Microelectronics, Inc. and Micrel, Inc. He began his career at Corning Electronics and subsequently moved to Philips Semiconductor, then known as Signetics Corporation, where he held many senior positions during his tenure. He also was a group vice president at Sharp Electronics.
Kimberly D.C. Trapp has more than 30 years of experience in the optoelectronics industry. She served as the Industry Liaison Officer for the Center of Optical Technologies at Lehigh University until her retirement in 2010. Before joining Lehigh University, she served as the Director of Marketing Operations of Agere Systems until 2002 and was responsible for business operations, customer marketing, technical product support, product engineering, and program management of Agere’s optoelectronic business and product portfolio. From 1980 until 1995, she served in the development and research organizations of AT&T Bell Laboratories and Lucent Technologies. Ms. Trapp has a BS in Chemistry from Purdue University and an MS in Inorganic Chemistry from Fairleigh Dickinson University. She also has MBA from an AT&T sponsored executive program.
Section 16(a) Beneficial Ownership Reporting Compliance
Based solely upon a review of Forms 3, 4 and 5 furnished to us and written representations that no other reports were required, we believe that each of our directors, executive officers and beneficial owners of greater than 10% of our common stock complied during fiscal year 2013 with the reporting requirements of Section 16(a) of the Exchange Act.
Code of Ethics
We have adopted a Code of Business Ethics and Conduct that applies to our directors, executive officers and employees. We will disclose any future amendments to, or waivers from, the Code of Business Ethics and Conduct on our website http://www.gigpeak.com within four business days following the date of the amendment or waiver. We will provide to any person, without charge, a copy of Code of Business Ethics and Conduct upon written request to:
GigPeak, Inc.
130 Baytech Drive
San Jose, California 95134
Attn: Investor Relations
Audit Committee
We have a separately designated standing Audit Committee, which has been established in accordance with Section 3(a)(58)(A) of the Securities Exchange Act of 1934, as amended (the “Exchange Act”). The Audit Committee is comprised of not less than three directors, each of whom is independent as determined by the Board of Directors and as defined by Rule 10A-3(b)(1) under the Exchange Act and Section 803(a)(2) of the NYSE MKT Company Guide. The Board of Directors has also determined that Mr. Miotto is an “audit committee financial expert” as defined in SEC rules and Section 803(b)(2)(iii) of the NYSE MKT Company Guide. This designation does not impose on Mr. Miotto any duties, obligations or liabilities that are greater than is generally imposed on him as a member of our Audit Committee or our Board of Directors. The current members of the Audit Committee are Mr. Miotto (who serves as chairman of the committee), Mr. Lazzara, Mr. Mikulsky, Mr. Schneider and Ms. Trapp.
The Audit Committee is responsible for monitoring and overseeing: (i) our accounting and financial reporting processes; (ii) the preparation and integrity of our financial statements; (iii) our compliance with financial statement and regulatory requirements; (iv) the performance of our internal finance and accounting personnel and our independent registered accounting firm and (v) the qualification and independence of our independent registered public accounting firm.
The Audit Committee has the authority to retain legal, accounting or other experts that it deems necessary to carry out its duties. It also has the authority to determine the compensation of such advisors, as well as that of our independent registered accounting firm, and to determine appropriate funding needs for ordinary administrative expenses that are necessary or appropriate for carrying out its duties.
COMPENSATION OF EXECUTIVE OFFICERS
Our primary objectives with respect to executive compensation are to attract and retain the best possible executive talent, to link annual compensation (cash and stock-based) and long-term stock-based compensation to achievement of measurable corporate goals and individual performance, and to align executives’ incentives with stockholder value creation. To achieve these objectives, we have implemented and maintain compensation plans that tie a portion of executives’ overall compensation to our financial performance and common stock price. Overall, the total compensation opportunity is intended to create an executive compensation program that is competitive with comparably-sized companies where we are based, as it is these companies with whom we compete most vigorously for executive and technical talent.
Compensation Committee
Our Compensation Committee approves, administers and interprets our named executive officer compensation and benefit policies and plans. Our Compensation Committee is appointed by our Board of Directors, and consists entirely of independent directors who are “outside directors” for purposes of Section 162(m) of the Internal Revenue Code and “non-employee directors” for purposes of Rule 16b-3 under the Exchange Act. The current members of the Compensation Committee are Mr. Mikulsky (who serves as chairperson of the committee), Ms. Trapp, Mr. Lazzara, Mr. Miotto and Mr. Schneider.
Our Compensation Committee has primary responsibility for ensuring that our executive compensation and benefit program is consistent with our compensation philosophy and is responsible for determining the executive compensation packages offered to our named executive officers. The responsibilities of the Compensation Committee, as stated in its charter, include the following:
| · |
Review and approve goals and objectives relevant to CEO and other named executive officer compensation, evaluate the CEO’s and other named executive officers’ performance in light of these corporate goals and objectives, and set CEO and other named executive officer compensation levels consistent with its evaluation and the company philosophy;
|
| · |
Approve the salaries, bonus and other compensation for all named executive officers;
|
| · |
Adopt, administer, amend or terminate compensation plans applicable to the employees of GigPeak and/or any of its subsidiaries, and review and make recommendations concerning long-term incentive compensation plans, including the use of stock options and other equity-based plans; and
|
| · |
Undertake all further actions and discharge all further responsibilities imposed upon the Compensation Committee from time to time by the Board, the federal securities laws or the rules and regulations of the SEC.
|
Our Compensation Committee plays an integral role in setting the named executive officer compensation each year. Generally, during the fourth quarter of each year and leading up to the adoption by the Board of the annual operating plan for the following year, the Compensation Committee meets to discuss recent data and current trends in executive compensation and equity ownership programs for comparable companies. As discussed in more detail below, during such meeting, an independent compensation consultant engaged by the Compensation Committee provides a report to the Compensation Committee regarding this information about companies against which we compete for executive and technical talent. Afterwards, in the first quarter or the early part of the following year, our Compensation Committee holds a regular meeting in which our Chief Executive Officer and Chief Financial Officer review with the Compensation Committee GigPeak’s financial and business performance for the prior year and management’s business outlook and operating plan for the current year as adopted by the Board at the end of the prior year. In reviewing the prior year’s performance, the Compensation Committee compares our performance to the financial and operational goals set for such year and any management by objectives targets regarding revenues, non-GAAP gross margins, adjusted EBITDA and non-GAAP earnings per share set for such year. We use these financial measures in setting performance targets because we believe that these non-GAAP financial measures are important indicators of the ongoing operations of our business and provide better comparability between reporting periods and provide a better baseline for analyzing trends in our operations. In this meeting, the Chief Executive Officer also reviews with the Compensation Committee his assessment of the individual performance of each named executive officer, including his own performance, according to a variety of qualitative and quantitative performance criteria (including individualized performance criteria related to operational achievements pertaining to the functional area in which the named executive officer performs) and salary and bonus trends. Taking into account the information conveyed and discussed at these meetings and the recommendations of our Chief Executive Officer and the independent compensation consultant engaged by the committee, the Compensation Committee then determines:
| · |
The amount and type of any bonus compensation to be awarded to each named executive officer in respect of their performance;
|
| · |
Whether to raise, lower or maintain the named executive officer’s base salary for the current year; and
|
| · |
Option grants and restricted stock units, if any, to be awarded to each named executive officer.
|
Each element of our named executive compensation system is described in more detail below.
Comparable Company Comparisons
Each year, the Compensation Committee reviews the named executive officer compensation programs and amounts at comparable companies. As GigPeak has grown during 2015 and 2016 to cross $100 million of market capitalization and the makeup of the competitive market has evolved, the set of comparable companies has also gone through changes over the years. GigPeak’s total cash compensation packages are designed to be in the range between the median up to the 75th percentile of total target cash compensation among comparable companies for performance by comparable executives. Our equity compensation program is designed to provide a percentage ownership of GigPeak that is relatively comparable to the median percentage ownership among these comparable companies. However, the individual elements of our executive program (base salary, annual incentive compensation, equity compensation and benefits) may vary from group medians as the Compensation Committee deems appropriate. In addition, we may reduce cash compensation and award RSUs vesting over the course of the following year to make up for such cash compensation reduction. On occasion, the Compensation Committee may award special bonuses to the named executive officers.
Each year, we engage an independent outside firm which specializes in executive compensation. During 2015 and 2016, we engaged Compensia. For this purpose, the Compensation Committee looked at companies with less than $120 million in annual revenues in 2015 and companies with less than $150 million in annual revenues in 2016 as described by the Proprietary 2015 and 2016 Executive Compensation Survey published by Compensia as well as selected peer company proxy filings. We believe those two data sources were appropriate for benchmarking executive compensation because: the companies surveyed were of similar size, both in terms of revenues and market capitalization, to GigPeak; the companies are primarily located in the same geographic market as GigPeak; GigPeak competes with many of the surveyed companies for executive and technical talent; and certain of the companies in the indices are selected independently by Compensia. We do not benchmark our executive compensation solely against companies in our industry because few of our competitors are close to our size. Most of our competitors are very large, diversified companies or very small, privately-held companies. Rather, we focus on the companies with whom we compete most vigorously for executive and technical talent. Furthermore, as our financial performance in 2015 and 2016 exceeded our revenue, gross margin, and earnings guidance and targets, and our market capitalization grew significantly, we worked with Compensia to revise the set of comparable companies which are used. We believe that the peer group now being used includes competitors for talent, and that it is a better reflection of the competitor market. In addition, although this peer group has a broader revenue spread than that used in the past, we believe that GigPeak compares favorably to this group on profitability and total shareholder return.
Elements of Named Executive Officer Compensation
Our named executive officer compensation consists of base salary, annual cash and equity incentives, equity plan participation and customary broad-based employee benefits. In addition, on occasion, the Compensation Committee may award special achievement bonuses to the named executive officers. Consistent with our pay for performance philosophy, we believe that we can better motivate the named executive officers to enhance stockholder return if a portion of their compensation is “at risk”— that is, contingent upon the achievement of performance objectives and overall strong company performance. The mix of base salary, annual bonus opportunity based on achievement of objectives and anticipated long-term stock-based compensation incentive (in the form of appreciation in shares underlying stock options and restricted stock units) varies depending on the officer’s position and level. Long-term stock-based compensation has always been a significant component of the named executive officer compensation, as we believe that best aligns our named executive officers’ interests with those of our stockholders. An annual bonus opportunity may also form a significant component of the named executive compensation; however, as explained in more detail below, it was not a component of the named executive officer compensation paid in 2016 for 2015 financial performance. However, the named executive officers did receive special one-time bonuses as discussed below for such 2015 financial performance.
Base Salary: Base salaries for our named executive officers are established based on the scope of their responsibilities, taking into account market compensation paid by comparable companies for equivalent positions. Base salaries are reviewed on an annual basis and any increases are similar in scope to our overall corporate salary increase, if any. For comparison purposes, we have utilized compensation survey data from Compensia and the peer company proxy filings. Our philosophy is to target the named executive officer base salaries to be in the range between the median up to the 75th percentile of salaries for executives in equivalent positions at comparable companies. We believe targeting the named executive officer salaries to be in the range between the median up to the 75th percentile of salaries relative to comparable companies reflects our best efforts to ensure we are neither overpaying nor underpaying our named executive officers.
Annual Cash Incentive: Our employment contracts with our named executive officers provide them with an opportunity to receive annual cash incentive compensation consisting of the possibility of receipt of a cash bonus award, payable once per year. Any such cash bonus would be dependent, in part, upon attaining or exceeding stated corporate objectives for the prior fiscal year, including management by objectives targets regarding revenues, non-GAAP gross margins, adjusted EBITDA non-GAAP earnings per share (“EPS”) and other significant financial measures set for such year. We use these financial measures in setting performance targets because we believe that these non-GAAP financial measures are important indicators of the ongoing operations of our business, provide better comparability between reporting periods and provide a better baseline for analyzing trends in our operations both through our organic growth and strategic extension. Our goal with bonuses to our named executive officers is to reward executives in a manner that is commensurate with the level of achievement of certain financial and strategic goals that we believe, if attained, result in greater long-term stockholder value. The Board of Directors approves these financial and strategic goals and management by objective targets on an annual basis. These financial and strategic goals and management by objective targets typically have a one-year time horizon. In connection with the 2016 financial performance, however, the Board of Directors determined that the objectives which we achieved far exceeded guidance and budgeted financial targets, as well as resulted in meaningful stockholder value creation as reflected in Item 5 above, and supported awards of cash incentive compensation. Similarly, in connection with 2016 financial performance, the Board of Directors determined that the objectives which we achieved exceeded guidance and budgeted financial targets, as well as resulted in meaningful stockholder value creation, and supported awards of cash incentive compensation. In recognition of our 2016 financial performance, the Board approved bonuses to be paid in 2016 in accordance with the Company’s normal payroll practices. The 2016 performance bonus was paid in January 2017.
Warrants, Stock Options and Restricted Stock Units: We believe that stock ownership is an important factor in aligning corporate and individual goals. Therefore, we utilize stock options (prior to 2013) and, beginning in 2012, RSUs, to encourage long-term performance, with excellent corporate performance (as manifested in our common stock price) and extended officer tenure producing potentially significant value. Upon joining GigPeak, the named executive officers have received an initial stock option or RSU grant. This grant has been based on relevant industry comparisons, including data from Compensia, and was intended to be commensurate with the experience level and scope of responsibilities of the incoming executive officer. In addition, on an annual basis, the Compensation Committee, reviews with the Board the percentage ownership of GigPeak held by employees, and compares that to the employee ownership of comparable companies. The Compensation Committee uses this metric because it is easy to measure and compare to comparable companies. Based on its review, the Compensation Committee approves an annual grant and all named executive officers receive RSU grants. Additionally, we may award RSUs as special bonuses to the named executive officers. No stock options were granted in 2015 and 2016. All RSU grants for named executive officers are approved by the Compensation Committee.
Special Bonuses: On occasion, the Compensation Committee may award special bonuses (cash or RSUs) to the named executive officers. As disclosed in our Current Report on Form 8-K filed with the SEC on January 7, 2016 , in recognition of our 2015 financial performance having achieved the goals and targets approved by the Board for such year, the Compensation Committee on January 5, 2016 approved special one-time cash bonuses and awards of RSUs vesting in four quarterly installments beginning on February 1, 2016 and ending on November 1, 2016 for the named executive officers as identified in that Current Report. As disclosed in our Current Report on Form 8-K filed with the SEC on July 20, 2016, on July 19, 2016 the Compensation Committee rescinded the award of certain long-term RSUs previously granted to Dr. Katz in March 2015 and additional RSUs previously granted to Dr. Katz in November 2015, having determined that the total number of shares issuable in connection with the awards granted to Dr. Katz in 2015 were in excess of the 1,000,000 share per calendar year per person award limit in the 2008 Plan. On the same date, the Compensation Committee approved for Dr. Katz, the issuance of new RSUs vesting in six quarterly installments beginning on August 1, 2016 and ending on November 1, 2017, and certain other new RSUs vesting in twelve quarterly installments thereafter, beginning on August 1, 2016 and ending on May 1, 2019. As disclosed in our Current Report on Form 8‑K filed with the SEC on July 29, 2016, for the successful acquisition of Magnum Semiconductor, Inc., on July 27, 2016 the Compensation Committee approved (i) special one-time cash bonuses and (ii) awards of RSUs vesting 25% on August 1, 2017, with the remaining 75% vesting in twelve quarterly installments thereafter, beginning on November 1, 2017 and ending on August 1, 2020, to our named executive officers as identified in that Current Report.
Change in Control Bonus Plan: On November 17, 2016 the Compensation Committee approved the creation of a Change in Control Bonus Plan (the “Bonus Plan”) to provide cash payments upon a Change in Control (as such term is defined in the Bonus Plan) to such executive officers and employees of the Company as may in the future be designated by the Compensation Committee. The Bonus Plan is designed to promote the interests of the Company and its stockholders by providing an additional incentive to management and employees to maximize the value of the Company’s business and its common stock. The Bonus Plan shall be administered by the Compensation Committee, which shall determine the executive officers and employees to whom awards are granted under the Bonus Plan and the terms of payment under an award in accordance with the terms of the Bonus Plan. Payments to Participants under the Bonus Plan shall be made only upon the consummation of a Change in Control provided that the Participant remains employed by the Company at the time of such consummation in accordance with the Bonus Plan.
Other Benefits: Named executive officers are eligible to participate in all of our employee benefit plans, such as medical, dental, group life, disability, and accidental death and dismemberment insurance and our 401(k) plan. During 2015 and 2016, we made group life insurance payments as reflected in the Summary Compensation Table below. We do not maintain any pension plan, retirement benefit or deferred compensation arrangements other than our 401(k) plan.
The table below sets forth the compensation earned by our Chief Executive Officer and our two other most highly compensated executive officers for the fiscal years ended December 31, 2016 and 2015 whose compensation exceeded $100,000. These individuals are collectively referred to as our named executive officers.
Summary Compensation Table
|
Name and Principal Position
|
Year
|
Salary
|
Bonus
|
Severance
|
RSU’s (1)
|
Option
Awards (1)
|
All Other
Compensation
|
Total
|
||||||||||||||||||||||
|
(a)
|
||||||||||||||||||||||||||||||
|
Dr. Avi Katz
|
2016
|
$
|
468,660
|
$
|
1,194,721
|
$
|
—
|
$
|
2,547,244
|
$
|
—
|
$
|
4,188
|
$
|
4,214,813
|
|||||||||||||||
|
Chairman of the Board of Directors, Chief Executive Officer and President
|
2015
|
$
|
438,000
|
$
|
688,612
|
$
|
—
|
$
|
2,367,045
|
$
|
—
|
$
|
3,965
|
$
|
3,497,622
|
|||||||||||||||
|
Andrea Betti-Berutto
|
2016
|
$
|
258,825
|
$
|
31,048
|
$
|
—
|
$
|
104,905
|
$
|
—
|
$
|
656
|
$
|
395,434
|
|||||||||||||||
|
Senior Vice President and Chief Technical Officer
|
2015
|
$
|
255,000
|
$
|
22,339
|
$
|
—
|
$
|
126,450
|
$
|
—
|
$
|
764
|
$
|
404,553
|
|||||||||||||||
|
Dr. Raluca Dinu
|
2016
|
$
|
325,000
|
$
|
95,000
|
$
|
—
|
$
|
829,394
|
$
|
—
|
$
|
419
|
$
|
1,249,813
|
|||||||||||||||
|
Executive Vice President and Chief Operating Officer
|
2015
|
$
|
280,000
|
$
|
231,471
|
$
|
—
|
$
|
539,558
|
$
|
—
|
$
|
278
|
$
|
1,051,307
|
|||||||||||||||
| (1) |
The amounts in column (a) represent the aggregate grant date fair value computed in accordance with FASB ASC Topic 718. Assumptions used in the calculation of these amounts are included in Note 6-Stockholders’ Equity, to our audited financial statements for the fiscal year ended December 31, 2016 and 2015 included in this Form 10-K.
|
Narrative Disclosure to Summary Compensation Table
The Summary Compensation Table sets forth the aggregate compensation earned by each of our named executive officers in 2016 and 2015.
The components of executive compensation consist of base salary, annual and special bonus incentives, equity plan participation and customary broad-based employee benefits, as set forth in more detail above. Annual cash and/or stock-based compensation bonuses are awarded in the discretion of the Compensation Committee of the Board of Directors after a review and evaluation of each executive officer’s performance during the year and, as discussed above, take into consideration the attainment of stated corporate and personal performance objectives. Beginning in 2013, equity grants generally consist of restricted stock units and are intended to serve respectively as long-term compensation and short-term awards in lieu of higher cash payouts. On occasion, the Compensation Committee may also authorize special compensation awards in the form of cash and/or equity grants to recognize extraordinary efforts or results.
Equity awards such as options and restricted stock units are generally granted pursuant to the GigPeak, Inc. 2008 Equity Incentive Plan. Option grants to our executive officers generally vest as to 25% of the underlying award on the one-year anniversary of the grant date and monthly thereafter for a period of three years. However, certain option grants to our executive officers vest in accordance with certain performance goals being achieved, as discussed in more detail below in the vesting schedules for such option grant. In the case of stock options, the exercise price is set at 100% of the fair market value of the underlying common stock on the date of grant. Restricted stock unit grants generally vest quarterly over the period between one and four years. Upon vesting, a restricted stock unit is converted to an actual share of stock.
We have entered into an employment agreement with each of our executive officers, which governs the terms of employment as well as provides for certain payments upon termination of employment. The employment agreements for the named executive officers are discussed in more detail below under the caption “Employment Arrangements with Named Executive Officers.”
Outstanding Equity Awards at December 31, 2016
|
|
|
Option Awards
|
Stock Awards
|
||||||||||||||||||||
|
Name and Principal Position
|
|
Grant Date
|
|
|
Number of
Securities
Underlying
Unexercised
Options (#)
Exercisable
|
|
|
Number of
Securities
Underlying
Unexercised
Options (#)
Unexercisable
|
|
|
Exercise
Price ($) |
|
|
Option
Expiration
Date |
|
Number of Shares or Units of Stock That Have Not Vested (#)
|
Market Value of Units That Have
Not Vested
|
||||||
|
Dr. Avi Katz
|
|
8/1/07
|
|
|
|
166,606
|
|
|
|
-
|
|
|
$
|
0.73
|
|
|
8/1/17
|
|
-
|
$
|
-
|
||
|
Chairman of the Board of Directors, Chief Executive Officer and President
|
|
12/17/08
|
|
|
|
581,338
|
|
|
|
-
|
|
|
$
|
1.10
|
|
|
12/17/18
|
|
-
|
$
|
-
|
||
|
|
|
3/19/09
|
|
|
|
77,764
|
|
|
|
-
|
|
|
$
|
0.95
|
|
|
3/19/19
|
|
-
|
$
|
-
|
||
|
|
|
11/9/09
|
|
|
|
130,000
|
|
|
|
-
|
|
|
$
|
3.50
|
|
|
11/9/19
|
|
-
|
$
|
-
|
||
|
|
|
3/17/10
|
|
|
|
324,100
|
|
|
|
-
|
|
|
$
|
1.95
|
|
|
3/17/20
|
|
-
|
$
|
-
|
||
|
|
|
10/27/10
|
|
|
|
348,345
|
|
|
|
-
|
|
|
$
|
2.40
|
|
|
10/27/20
|
|
-
|
$
|
-
|
||
|
|
|
2/3/11
|
|
|
|
405,364
|
|
|
|
-
|
|
|
$
|
2.50
|
|
|
2/3/21
|
|
-
|
$
|
-
|
||
|
|
|
6/17/11
|
|
|
|
424,212
|
|
|
|
-
|
|
|
$
|
2.65
|
|
|
6/17/21
|
|
-
|
$
|
-
|
||
|
|
|
3/27/12
|
|
|
|
537,500
|
|
|
|
-
|
|
$
|
2.70
|
|
|
3/27/22
|
|
-
|
$
|
-
|
|||
|
|
8/1/13
|
|
|
|
-
|
|
|
|
-
|
|
|
$
|
-
|
|
|
|
N/A
|
|
16,100
|
$
|
40,572
|
||
|
|
|
2/7/14
|
|
|
|
-
|
|
|
|
-
|
|
|
$
|
-
|
|
|
|
N/A
|
|
117,750
|
$
|
296,730
|
|
|
|
|
3/26/15
|
|
|
|
-
|
|
|
|
-
|
|
|
$
|
-
|
|
|
|
N/A
|
|
336,931
|
$
|
849,066
|
|
|
|
|
11/19/15
|
|
|
|
-
|
|
|
|
-
|
|
|
$
|
-
|
|
|
|
N/A
|
|
-
|
$
|
-
|
|
|
01/05/16
|
-
|
-
|
$
|
-
|
N/A
|
500,000
|
$
|
1,260,000
|
|||||||||||||||
|
07/19/16
|
-
|
-
|
$
|
-
|
N/A
|
32,601
|
$
|
82,155
|
|||||||||||||||
|
07/19/16
|
-
|
-
|
$
|
-
|
N/A
|
267,498
|
$
|
674,095
|
|||||||||||||||
|
Andrea Betti-Berutto
|
|
8/1/07
|
|
|
|
112,612
|
|
|
|
-
|
|
|
$
|
0.73
|
|
|
8/1/17
|
|
-
|
$
|
-
|
||
|
Senior Vice President and Chief Technology Officer
|
|
12/17/08
|
|
|
|
238,913
|
|
|
|
-
|
|
|
$
|
1.10
|
|
|
12/17/18
|
|
-
|
$
|
-
|
||
|
|
|
3/19/09
|
|
|
|
36,025
|
|
|
|
-
|
|
|
$
|
0.95
|
|
|
3/19/19
|
|
-
|
$
|
-
|
||
|
|
|
11/9/09
|
|
|
|
38,011
|
|
|
|
-
|
|
|
$
|
3.50
|
|
|
11/9/19
|
|
-
|
$
|
-
|
||
|
|
|
3/17/10
|
|
|
|
101,500
|
|
|
|
-
|
|
|
$
|
1.95
|
|
|
3/17/20
|
|
-
|
$
|
-
|
||
|
|
|
10/27/10
|
|
|
|
139,554
|
|
|
|
-
|
|
|
$
|
2.40
|
|
|
10/27/20
|
|
-
|
$
|
-
|
||
|
|
|
2/3/11
|
|
|
|
141,287
|
|
|
|
-
|
|
|
$
|
2.50
|
|
|
2/3/21
|
|
-
|
$
|
-
|
||
|
|
|
6/17/11
|
|
|
|
87,713
|
|
|
|
-
|
|
|
$
|
2.65
|
|
|
6/17/21
|
|
-
|
$
|
-
|
||
|
|
|
3/27/12
|
|
|
|
201,563
|
|
|
|
-
|
|
|
$
|
2.70
|
|
|
3/27/22
|
|
-
|
$
|
-
|
||
|
|
|
8/1/13
|
|
|
|
-
|
|
|
|
-
|
|
|
$
|
-
|
|
|
|
N/A
|
|
6,038
|
$
|
15,216
|
|
|
|
|
2/7/14
|
|
|
|
-
|
|
|
|
-
|
|
|
$
|
-
|
|
|
|
N/A
|
|
28,500
|
$
|
71,820
|
|
|
|
|
3/26/15
|
|
|
|
-
|
|
|
|
-
|
|
|
$
|
-
|
|
|
|
N/A
|
|
31,250
|
$
|
78,750
|
|
|
|
|
11/19/15
|
|
|
|
-
|
|
|
|
-
|
|
|
$
|
-
|
|
|
|
N/A
|
|
10,000
|
$
|
25,200
|
|
|
1/5/16
|
-
|
-
|
$
|
-
|
N/A
|
25,000
|
$
|
63,000
|
|||||||||||||||
|
7/27/16
|
-
|
-
|
$
|
-
|
N/A
|
10,000
|
$
|
25,200
|
|||||||||||||||
|
Dr. Raluca Dinu
|
|
4/13/06
|
|
|
|
5,000
|
|
|
|
-
|
|
|
$
|
30.56
|
|
|
4/13/16
|
|
-
|
$
|
-
|
||
|
Executive Vice President and Chief Operating Officer
|
|
3/1/07
|
|
|
|
7,499
|
|
|
|
-
|
|
|
$
|
34.24
|
|
|
3/1/17
|
|
-
|
$
|
-
|
||
|
|
|
3/4/08
|
|
|
|
9,375
|
|
|
|
-
|
|
|
$
|
18.16
|
|
|
3/4/18
|
|
-
|
$
|
-
|
||
|
|
|
12/17/08
|
|
|
|
39,733
|
|
|
|
-
|
|
|
$
|
1.10
|
|
|
12/17/18
|
|
-
|
$
|
-
|
||
|
|
|
3/19/09
|
|
|
|
6,598
|
|
|
|
-
|
|
|
$
|
0.95
|
|
|
3/19/19
|
|
-
|
$
|
-
|
||
|
|
|
11/9/09
|
|
|
|
6,962
|
|
|
|
-
|
|
|
$
|
3.50
|
|
|
11/9/19
|
|
-
|
$
|
-
|
||
|
|
|
3/17/10
|
|
|
|
69,000
|
|
|
|
-
|
|
|
$
|
1.95
|
|
|
3/17/20
|
|
-
|
$
|
-
|
||
|
|
|
10/27/10
|
|
|
|
42,020
|
|
|
|
-
|
|
|
$
|
2.40
|
|
|
10/27/20
|
|
-
|
$
|
-
|
||
|
|
|
2/3/11
|
|
|
|
51,435
|
|
|
|
-
|
|
|
$
|
2.50
|
|
|
2/3/21
|
|
-
|
$
|
-
|
||
|
|
|
6/17/11
|
|
|
|
27,300
|
|
|
|
-
|
|
|
$
|
2.65
|
|
|
6/17/21
|
|
-
|
$
|
-
|
||
|
|
|
3/27/12
|
|
|
|
105,081
|
|
|
|
-
|
|
|
$
|
2.70
|
|
|
3/27/22
|
|
-
|
$
|
-
|
||
|
|
|
5/1/13
|
|
|
|
35,207
|
|
|
|
4,063
|
|
|
$
|
0.86
|
|
|
|
5/1/23
|
|
-
|
$
|
-
|
|
|
|
|
2/10/14
|
|
|
|
-
|
|
|
|
-
|
|
|
$
|
-
|
|
|
|
N/A
|
|
15,000
|
$
|
37,800
|
|
|
|
|
3/26/15
|
|
|
|
-
|
|
|
|
-
|
|
|
$
|
-
|
|
|
|
N/A
|
|
135,215
|
$
|
340,742
|
|
|
|
|
11/19/15
|
|
|
|
-
|
|
|
|
-
|
|
|
$
|
-
|
|
|
|
N/A
|
|
50,000
|
$
|
126,000
|
|
|
1/05/16
|
-
|
-
|
$
|
-
|
N/A
|
150,000
|
$
|
378,000
|
|||||||||||||||
|
4/27/16
|
-
|
-
|
$
|
-
|
N/A
|
56,250
|
$
|
141,750
|
|||||||||||||||
|
7/27/16
|
-
|
-
|
$
|
-
|
N/A
|
95,000
|
$
|
239,400
|
|||||||||||||||
|
Grant Date
|
Vesting Schedule for Dr. Katz
|
|
|
7/19/16
|
The grant of 401,250 restricted stock units was issued for the rescinded grant and has the same vesting schedule as the rescinded grant. One twelfth of the remaining award vesting on August 1, November 1, February 1 and May 1 over the next nine quarters thereafter, with the last vesting date occurring on Nov 1, 2017.
|
|
|
7/19/16
|
Rescinded 60,106 shares of unvested restricted stock units and concurrently issued 39,121 shares of RSUs with the same vesting term as the rescinded grant but a reduced number of shares vesting in each tranche as compared to the rescinded grant of restricted stock units as follows: one twelfth of the remaining award vesting on August 1, November 1, February 1 and May 1 over the next twelve quarters thereafter, with the last vesting date occurring on May 1, 2019.
|
|
|
1/5/16
|
The grant of 500,000 restricted stock units will vest as to 25% of the underlying award on 2/1/17, and one twelfth of the remaining award vesting on May 1, August 1, November 1 and February 1 over the next twelve quarters thereafter, with the last vesting date occurring on Feb 1, 2020.
|
|
|
3/26/15
|
The grant of 619,231 restricted stock units will vest as to 25% of the underlying award on 5/1/16, and one twelfth of the remaining award vesting on August 1, November 1, February 1 and May 1 over the next twelve quarters thereafter, with the last vesting date occurring on May 1, 2019.
|
|
|
2/7/14
|
The grant of 314,000 restricted stock units will vest as to 25% of the underlying award on 2/1/15, and one twelfth of the remaining award vesting on May 1, August 1, November 1 and February 1 over the next twelve quarters thereafter, with the last vesting date occurring on Feb. 1, 2018.
|
|
|
8/1/13
|
The grant of 128,800 restricted stock units will vest as to 25% of the underlying award on 5/1/2014, and one twelfth of the remaining award vesting on August 1, November 1, February 1 and May 1 over the next twelve quarters thereafter, with the last vesting date occurring on May 1, 2017.
|
|
|
Grant Date
|
Vesting Schedule for Mr. Betti-Berutto
|
|
|
7/27/16
|
The grant of 10,000 restricted stock units will vest as to 25% of the underlying award on 8/1/17, and one twelfth of the remaining award vesting on November 1, February 1, May 1 and August 1 over the next twelve quarters thereafter, with the last vesting date occurring on August 1, 2020.
|
|
|
1/5/16
|
The grant of 25,000 restricted stock units will vest as to 25% of the underlying award on 2/1/17, and one twelfth of the remaining award vesting on May 1, August 1, November 1 and February 1 over the next twelve quarters thereafter, with the last vesting date occurring on Feb 1, 2020.
|
|
|
11/19/15
|
The grant of 20,000 restricted stock units with one eighth of the total award vesting on the following dates - 2/1/16, 5/1/2016, 8/1/2016, 11/1/2016, 2/1/17, 5/1/2017, 8/1/2017 and 11/1/2017.
|
|
|
3/26/15
|
The grant of 50,000 restricted stock units will vest as to 25% of the underlying award on 5/1/16, and one twelfth of the remaining award vesting on August 1, November 1, February 1 and May 1 over the next twelve quarters thereafter, with the last vesting date occurring on May 1, 2019.
|
|
|
2/7/14
|
The grant of 76,000 restricted stock units will vest as to 25% of the underlying award on 2/1/15, and one twelfth of the remaining award vesting on May 1, August 1, November 1 and February 1 over the next twelve quarters thereafter, with the last vesting date occurring on Feb. 1, 2018.
|
|
|
8/1/13
|
The grant of 48,300 restricted stock units will vest as to 25% of the underlying award on 5/1/2014, and one twelfth of the remaining award vesting on August 1, November 1, February 1 and May 1 over the next twelve quarters thereafter, with the last vesting date occurring on May 1, 2017.
|
|
Grant Date
|
Vesting Schedule for Dr. Dinu
|
|
|
7/27/16
|
The grant of 95,000 restricted stock units will vest as to 25% of the underlying award on 8/1/17, and one twelfth of the remaining award vesting on November 1, February 1, May 1 and August 1 over the next twelve quarters thereafter, with the last vesting date occurring on August 1, 2020.
|
|
|
4/27/16
|
The grant of 75,000 restricted stock units will vest as to 25% of the underlying award on 8/1/17, and one twelfth of the remaining award vesting on November 1, February 1, May 1 and August 1 over the next twelve quarters thereafter, with the last vesting date occurring on August 1, 2020.
|
|
|
1/5/16
|
The grant of 150,000 restricted stock units will vest as to 25% of the underlying award on 2/1/17, and one twelfth of the remaining award vesting on May 1, August 1, November 1 and February 1 over the next twelve quarters thereafter, with the last vesting date occurring on Feb 1, 2020.
|
|
|
11/19/15
|
The grant of 100,000 restricted stock units with one eighth of the total award vesting on the following dates - 2/1/16, 5/1/2016, 8/1/2016, 11/1/2016, 2/1/17, 5/1/2017, 8/1/2017 and 11/1/2017.
|
|
|
3/26/15
|
The grant of 216,346 restricted stock units will vest as to 25% of the underlying award on 5/1/16, and one twelfth of the remaining award vesting on August 1, November 1, February 1 and May 1 over the next twelve quarters thereafter, with the last vesting date occurring on May 1, 2019.
|
|
|
2/10/14
|
The grant of 39,270 restricted stock units will vest as to 25% of the underlying award on 2/1/15, and one twelfth of the remaining award vesting on May 1, August 1, November 1 and February 1 over the next twelve quarters thereafter, with the last vesting date occurring on Feb. 1, 2018.
|
|
|
5/1/13
|
The grant of 39,270 stock options vested as to 25% of the underlying award on the first anniversary of the grant date and as to 1/36 of the remaining underlying award every month thereafter for three years.
|
Employment Arrangements with Named Executive Officers
We do not have deferred compensation plans, pension plans or other similar arrangements or plans for our executive officers, except a tax-qualified 401(k) Plan, which is available generally to all of our employees.
On November 17, 2016, the Compensation Committee approved and entered into a Fourth Amended and Restated Employment Agreement with Dr. Katz, our Chief Executive Officer (the “Katz Employment Agreement”). The Katz Employment Agreement reflected the increase in Dr. Katz’s base salary from $438,000 under the prior iteration of his employment agreement, dated December 31, 2014 (the “Prior Employment Agreement”), to $468,660, which increase was previously disclosed in the Company’s Current Report on Form 8-K filed with the SEC on January 7, 2016. On January 17, 2017, as disclosed in the Company’s Current Report on Form 8-K filed with the SEC on January 19, 2017, the Compensation Committee approved an increase in Dr. Katz’s annual compensation in 2017 effective as of March 27, 2017, to $491,156. But for the forgoing changes to Dr. Katz’s compensation, the terms of the Katz Employment Agreement remain in effect. As in the Prior Employment Agreement, the Katz Employment Agreement establishes bonuses and eligibility for health benefits, among other provisions. However, certain changes were made to the Katz Employment Agreement to provide a clearer definition of what constitutes a Change in Control (as such term is defined in the Katz Employment Agreement), as well as to clarify the payments Dr. Katz would be entitled to receive upon a Change in Control. Pursuant to the Katz Employment Agreement, Dr. Katz would be entitled to receive a pro-rated annual bonus for the period of the year that he has worked prior to the Change in Control, plus a lump sum payment equal to three times the average of the sum of his annual base salary plus annual bonuses for the most recent two fiscal years completed by the Company. Consistent with the Prior Employment Agreement, under the Katz Employment Agreement the occurrence of a Change in Control will trigger the vesting of all outstanding, unvested awards held by Dr. Katz and a potential tax equalization payment or gross-up payment which would place Dr. Katz in the same after-tax position as if any excise tax penalty did not apply with respect to compensation received by Dr. Katz in connection with such Change in Control. In addition, consistent with the Prior Employment Agreement, the Katz Employment Agreement provides that Dr. Katz would be entitled to receive certain compensation if his employment with the Company is terminated without “cause” or he resigns for “good reason” (as those terms are defined in the Katz Employment Agreement) in the absence of a change of control transaction, including (i) six months’ of his annual base salary then being paid, payable in equal monthly installments, (ii) a final pro-rated bonus for the period of the year that he has worked prior to termination, (iii) additional compensation equal to 30 months of Dr. Katz’s base salary then in effect plus 3 times the amount of the Bonus (with “Bonus” being defined as the average of the entire Annual Bonuses and Special Achievement Bonuses (each, as defined in the Katz Employment Agreement) paid to Dr. Katz for the 2 fiscal years completed prior to his termination), payable in a lump sum subject to certain conditions more fully described in the Katz Employment Agreement.
On November 17, 2016, the Compensation Committee approved and entered into a Fourth Amended and Restated Employment Agreement (the “Dinu Employment Agreement”) with Dr. Raluca Dinu, our Chief Operating Officer, amending the Third Amended and Restated Employment Agreement with Dr. Dinu filed as Exhibit 10.1 to the Current Report on Form 8-K with the SEC on August 7, 2015 (the “Prior Dinu Employment Agreement”). The only material changes in the Dinu Employment Agreement were to provide a clearer definition of what constitutes a Change in Control (as such term is defined in the Dinu Employment Agreement) and to provide for a single trigger acceleration of all unvested equity upon a Change in Control, in order to bring it into alignment with Dr. Katz’s and Mr. Betti-Berutto’s current arrangements. On January 17, 2017, as disclosed in the Company’s Current Report on Form 8-K filed with the SEC on January 19, 2017, the Compensation Committee approved an increase in Dr. Dinu’s annual compensation in 2017, effective as of March 27, 2017, to $341,250. But for the forgoing changes to Dr. Dinu’s compensation, the terms of the Dinu Employment Agreement remain in effect. Consistent with the Prior Dinu Employment Agreement, the Dinu Employment Agreement established Dr. Dinu’s base salary of $280,000 (superseded now, as disclosed in the previous sentence), subject to annual review by the Compensation Committee, as well as her eligibility to receive an annual performance bonus under such executive incentive plan as is applicable to our executives generally, with target bonus and performance metrics to be determined by the Board or the Compensation Committee. Consistent with the Prior Dinu Employment Agreement, the Dinu Employment Agreement provides for the severance which Dr. Dinu is entitled to receive in the event that her employment with the Company is terminated without “cause” or she resigns for “good reason” (as those terms are defined the Dinu Employment Agreement), and the amount that will be paid to her estate in the event of her death. The Dinu Employment Agreement provides that in the event of Dr. Dinu’s death during the term of her employment, Dr. Dinu’s estate will receive one-twelfth of her base salary then in effect for twelve months. In addition, the Dinu Employment Agreement provides that Dr. Dinu would be entitled to receive a pro-rated annual bonus plus severance in installments over a six month period in an amount of up to six months of her annual base salary then in effect and a lump sum payment equal to six months of her annual base salary following the initial six month period, provided that the Company terminates her employment without “cause” or she resigned for “good reason” and there has been no Change in Control (as such term is defined in the Dinu Employment Agreement). In the event that such termination or resignation occurs within twelve months following a Change in Control, then Dr. Dinu will be entitled to a pro-rated annual bonus plus lump sum severance in an amount equal to twelve months of her annual base salary plus the average of her annual bonuses from the prior two years.
On November 17, 2016, the Compensation Committee approved and entered into a Third Amended and Restated Employment Agreement (the “Betti-Berutto Employment Agreement”) with Andrea Betti-Berutto, our Senior Vice President and Chief Technical Officer, amending the Second Amended and Restated Employment Agreement (the “Prior Betti-Berutto Employment Agreement”) filed as Exhibit 10.3 to the Current Report on Form 8-K filed by the Company with the SEC on August 15, 2012. The only material change in the Betti-Berutto Employment Agreement from the Prior Betti-Berutto Employment Agreement was to provide a clearer definition of what constitutes a Change in Control (as such term is defined in the Betti-Berutto Employment Agreement). Further, on January 17, 2017, as disclosed in the Company’s Current Report on Form 8-K filed with the SEC on January 19, 2017, the Compensation Committee subsequently approved an increase in Mr. Betti-Berutto’s annual compensation in 2017 effective as of March 27, 2017, to $269,954. But for the forgoing changes to Mr. Betti-Berutto’s compensation, the terms of the Betti-Berutto Employment Agreement remain in effect. Consistent with the Prior Betti-Berutto Employment Agreement, the Betti-Berutto Employment Agreement establishes his annual salary of $258,825 (superseded now, as disclosed in the previous sentence), bonuses, eligibility for health benefits, and the severance which he is entitled to receive in the event that his employment with the Company is terminated without “cause” or resigns for “good reason” (as those terms are defined in the Betti-Berutto Employment Agreement). Mr. Betti-Berutto would be entitled to receive a pro-rated annual bonus plus severance in installments over a six month period, in an amount of up to six months of his annual base salary then in effect and a lump sum payment equal to six months of his annual base salary following the initial six month period plus the vesting of all outstanding, unvested awards. In the event that such termination occurs within twelve months following a Change in Control (as such term is defined in his Employment Agreement), then Mr. Betti-Berutto will be entitled to a pro-rated annual bonus plus lump sum severance amount equal to one year’s worth of his annual base salary plus average annual bonuses, the vesting of all outstanding, unvested awards and a potential tax equalization payment or gross-up payment which would place him in the same after-tax position as if any excise tax penalty did not apply.
The GigPeak, Inc. 2008 Equity Incentive Plan contains certain provisions for change in control transactions. In the event of a Covered Transaction (as defined in the plan), the outstanding awards must either be assumed or substituted by the successor company or will be fully accelerated prior to the closing of the Covered Transaction.
Director Compensation
The following table sets forth the compensation earned for services performed for us as a director by each member of our Board of Directors, other than any directors who are also our named executive officers, during the fiscal year ended December 31, 2016.
|
2016 Director Compensation Table
|
||||||||||||
|
Name
|
Fees Earned
or Paid
in Cash
|
Restricted
Stock Units
|
Total
|
|||||||||
|
Frank Schneider
|
$
|
22,500
|
$
|
106,709
|
$
|
129,209
|
||||||
|
John J. Mikulsky
|
$
|
24,000
|
$
|
109,000
|
$
|
133,000
|
||||||
|
Joseph J. Lazzara
|
$
|
22,500
|
$
|
103,970
|
$
|
126,470
|
||||||
|
Kimberly D.C. Trapp
|
$
|
25,308
|
$
|
103,970
|
$
|
129,278
|
||||||
|
Neil J. Miotto
|
$
|
25,000
|
$
|
111,739
|
$
|
136,739
|
||||||
As of December 31, 2016, each current director, other than directors who are also our named executive officers, held the following outstanding options and restricted stock unit awards:
|
Name
|
Aggregate
Number of
Shares
Underlying
Stock
Options
|
Aggregate
Number of
Shares
Underlying
Restricted Stock
Units
|
||||||
|
Frank Schneider
|
167,500
|
29,108
|
||||||
|
John J. Mikulsky
|
65,000
|
28,564
|
||||||
|
Joseph J. Lazzara
|
65,000
|
28,564
|
||||||
|
Kimberly D.C. Trapp
|
192,526
|
28,564
|
||||||
|
Neil J. Miotto
|
216,100
|
29,108
|
||||||
| ITEM 12. |
SECURITY OWNERSHIP OF CERTAIN BENEFICIAL OWNERS AND MANAGEMENT AND RELATED STOCKHOLDER MATTERS.
|
SECURITY OWNERSHIP OF CERTAIN BENEFICIAL OWNERS AND MANAGEMENT
The following table sets forth information regarding the beneficial ownership of our common stock as of March 1, 2017 by:
| · |
each person known by us to be the beneficial owner of more than 5% of our outstanding shares of common stock;
|
| · |
each of our named or current executive officers and directors; and
|
| · |
all of our current executive officers and current directors, as a group.
|
Beneficial ownership is determined in accordance with the rules of the Securities and Exchange Commission. Applicable percentages are based on 67,641,585 shares of our common stock outstanding as of March 1, 2017, adjusted as required by such rules. As provided by such rules, shares of our common stock issuable pursuant to options to purchase or other rights to acquire shares of common stock that are exercisable within 60 days of March 1, 2017 are deemed to be both beneficially owned by the person holding such options and outstanding for the purpose of computing ownership of such person, but are not treated as outstanding for the purpose of computing the ownership of any other person. Except as indicated by footnote, to our knowledge, the persons named in the table have sole voting and investment power with respect to all shares of common stock shown as beneficially owned by them. The information contained in the following table is not necessarily indicative of beneficial ownership for any other purpose and the inclusion of any shares in the table does not constitute an admission of beneficial ownership of those shares.
|
Beneficial Ownership of Our
Common Stock as of
March 1, 2017
Common Stock (1)
|
||||||||
|
5% Stockholders
|
Shares
|
Percent
of Class
|
||||||
|
Gardner Lewis Asset Management Inc. (2)
|
5,847,733
|
8.6
|
%
|
|||||
|
Integrated Device Technology, Inc. (3)
|
4,853,588
|
7.2
|
%
|
|||||
|
Unterberg Capital, LLC (4)
|
3,890,418
|
5.8
|
%
|
|||||
|
Named Executive Officers and Directors
|
||||||||
|
Dr. Avi Katz (5) (6)
|
3,315,225
|
4.7
|
%
|
|||||
|
Andrea Betti-Berutto (5)
|
1,167,854
|
1.7
|
%
|
|||||
|
Darren Ma (5)
|
70,956
|
*
|
||||||
|
Dr. Raluca Dinu (5)
|
520,544
|
*
|
||||||
|
Neil J. Miotto (5)
|
403,939
|
*
|
||||||
|
Frank Schneider (5) (7)
|
363,119
|
*
|
||||||
|
Kimberly D.C. Trapp (5)
|
293,527
|
*
|
||||||
|
John J. Mikulsky (5)
|
240,456
|
*
|
||||||
|
Joseph J. Lazzara (5) (8)
|
237,322
|
*
|
||||||
|
All current directors and executive officers 9 persons
|
6,612,942
|
9.1
|
%
|
|||||
| * |
Represents less than 1% of our outstanding common stock.
|
| (1) |
Unless otherwise indicated, each person’s address is c/o GigPeak, Inc., 130 Baytech Drive, San Jose, California 95134.
|
| (2) |
The information as to Gardner Lewis Asset Management, Inc. is derived from a Schedule 13D filed with the SEC on February 27, 2017. The principal business address is 285 Wilmington West Chester Pike, Chadds Ford, PA 19317.
|
| (3) |
The information as to Integrated Device Technology, Inc. is derived from a Schedule 13D filed with the SEC on February 21, 2017. The principal business address is 6024 Silver Creek Valley Road, San Jose, CA 95138.
|
| (4) |
The information as to Unterberg Capital, LLC. is derived from a Schedule 13G filed with the SEC on January 13, 2017. The principal business address is 445 Park Avenue, Room 901, New York, NY 10022.
|
| (5) |
Includes options to purchase shares of common stock exercisable within 60 days of March 1, 2017 as follows: 2,995,229 for Dr. Katz, 1,097,178 for Mr. Betti-Berutto, 395,987 for Dr. Dinu, 216,100 for Mr. Miotto, 192,526 for Ms. Trapp, 167,500 for Mr. Schneider, 65,000 for Mr. Mikulsky, and 65,000 for Mr. Lazzara.
|
| (6) |
Dr. Katz exceeded 5% beneficial ownership of our common stock on August 18, 2011, as initially reported in his Schedule 13D filed on August 19, 2011, as most recently amended in his Schedule 13D/A Amendment No. 8 filed on August 28, 2015.
|
| (7) |
Includes 168,265 shares held in the Schneider Family Trust.
|
| (8) |
Includes 165,920 shares held in the Joseph and Nancy Lazzara Family Trust.
|
Director Independence
The Board of Directors has determined that Mr. Lazzara, Mr. Mikulsky, Mr. Miotto, Mr. Schneider, and Ms. Trapp are “independent” directors.
The Company uses the independence standards set forth by Section 803(a)(2) of the NYSE MKT Company Guide. In reviewing the independence of our directors against these standards, we consider relationships and transactions between each director and members of the director’s family with us and our affiliates. Each member of our two standing committees, the Audit Committee and the Compensation Committee, is independent as defined by Section 803(a)(2) of the NYSE MKT Company Guide, and each member of our Audit Committee is also independent as defined by Rule 10A-3(b)(1) under the Exchange Act.
The following table sets forth the aggregate fees billed or to be billed by BPM LLP for auditing and other services provided to GigPeak for the fiscal year 2016 and 2015.
|
BPM LLP
|
||||||||
|
2016
|
2015
|
|||||||
|
Audit Fees (1)
|
$
|
700,167
|
$
|
412,717
|
||||
|
Audit-Related Fees (2)
|
$
|
276,102
|
$
|
14,220
|
||||
|
Tax Fees (3)
|
$
|
18,085
|
$
|
—
|
||||
| (1) |
Audit fees include fees for professional services rendered by our principal accountant for the audit of our annual consolidated financial statements, review of condensed consolidated financial statements included in our Forms 10-Q and other services normally provided by accountants in connection with statutory and regulatory filings or engagements for those fiscal years.
|
| (2) |
Audit-related fees for 2016 include fees for professional services rendered by BPM LLP related to the audit of the GigOptix, Inc. 401(k) Retirement Plan, Magnum Semiconductor, Inc. 401(k) Plan and services related to our acquisition of Magnum. Audit related fees for 2015 include fees related to the audit of the GigOptix, Inc. 401(k) Retirement Plan.
|
| (3) |
Fees for tax services related to tax return preparation and other compliance services for Magnum.
|
In considering the nature of the services provided by BPM LLP as our independent registered public accounting firm, the Audit Committee determined that such services are compatible with the provision of independent audit services. The Audit Committee discussed these services with the independent registered public accounting firm and our management to determine that they are permitted under the rules and regulations concerning auditors’ independence promulgated by the Securities and Exchange Commission, as well as the Public Company Accounting Oversight Board (United States).
Audit Committee Pre-Approval of Audit and Permissible Non-Audit Services of Independent Registered Public Accounting Firm
The Audit Committee pre-approves all audit services and all permitted non-audit services by the independent registered public accounting firm. The Audit Committee evaluates whether our use of the independent registered public accounting firm for permitted non-audit services is compatible with maintaining the independence of the independent registered public accounting firm. The Audit Committee’s policies prohibit us from engaging the independent registered public accounting firm to provide any services relating to bookkeeping or other services related to accounting records or financial statements, financial information systems design and implementation, appraisal or valuation services, fairness opinions or contribution-in-kind reports, actuarial services, or internal audit outsourcing services unless it is reasonable to conclude that the results of these services will not be subject to audit procedures. The Audit Committee’s policies prohibit us from engaging the independent registered public accounting firm to provide any services relating to any management function, expert services not related to the audit, legal services, broker-dealer, investment adviser, or investment banking services or human resource consulting. The Audit Committee approved in advance all fees for services provided by our independent registered public accounting firm, BPM LLP, for the years ended December 31, 2016 and 2015 and has concluded that the provision of these services is compatible with the accountants’ independence.
a) Documents filed as part of the report
(1) Financial Statements
Consolidated Balance Sheets – December 31, 2016 and 2015
Consolidated Statement of Operations – Years Ended December 31, 2016 and 2015
Consolidated Statements of Comprehensive Income – Years Ended December 31, 2016 and 2015
Consolidated Statements of Stockholders’ Equity– Years Ended December 31, 2016 and 2015
Consolidated Statements of Cash Flows for the Years Ended December 31, 2016 and 2015
(2) Financial Statement schedules have been omitted since they are either not required, not applicable, or the information is otherwise included.
(3) Exhibits
Pursuant to the requirements of Section 13 or 15(d) of the Securities Exchange Act of 1934, the registrant has duly caused this report to be signed on its behalf by the undersigned, thereunto duly authorized.
|
GigPeak, Inc.
|
||
|
By:
|
/S/ DR. AVI S. KATZ
|
|
|
Dr. Avi S. Katz,
Chief Executive Officer
and Chairman of the
Board
|
||
Date: March 15, 2017
KNOW ALL PERSONS BY THESE PRESENTS, that each person whose signature appears below hereby constitutes and appoints Dr. Avishay S. Katz, as his true and lawful attorney-in-fact and agent, with power to act with full power of substitution and resubstitution, to do any and all acts and things and to execute any and all instruments which said attorney and agent may deem necessary or desirable to enable the registrant to comply with the U.S. Securities Exchange Act of 1934, as amended, and any rules, regulations and requirements of the U.S. Securities and Exchange Commission thereunder in connection with the registrant’s Annual Report on Form 10-K for the fiscal year ended December 31, 2016 (the “Annual Report”), including specifically, but without limiting the generality of the foregoing, power and authority to sign the name of the registrant and the name of the undersigned, individually and in his capacity as a director or officer of the registrant, to the Annual Report as filed with the U.S. Securities and Exchange Commission, to any and all amendments thereto, and to any and all instruments or documents filed as part thereof or in connection therewith; and each of the undersigned hereby ratifies and confirms all that said attorney and agent shall do or cause to be done by virtue hereof.
Pursuant to the requirements of the Securities Exchange Act of 1934, this report has been signed by the following persons on behalf of the registrant and in the capacities and on the dates indicated.
|
NAME
|
TITLE
|
DATE
|
||
|
/S/ DR. AVI S. KATZ
|
Chief Executive Officer and Chairman of the Board
|
March 15, 2017
|
||
|
Dr. Avi S. Katz
|
(Principal Executive Officer)
|
|||
|
/S/ DARREN MA
|
Vice President and Chief Financial Officer
|
March 15, 2017
|
||
|
Darren Ma
|
(Principal Financial Officer and Principal Accounting Officer)
|
|||
|
/S/ JOSEPH J. LAZZARA
|
Director
|
March 15, 2017
|
||
|
Joseph J. Lazzara
|
||||
|
/S/ JOHN J. MIKULSKY
|
Director
|
March 15, 2017
|
||
|
John J. Mikulsky
|
||||
|
/S/ NEIL J. MIOTTO
|
Director
|
March 15, 2017
|
||
|
Neil J. Miotto
|
||||
|
/S/ FRANK SCHNEIDER
|
Director
|
March 15, 2017
|
||
|
Frank Schneider
|
||||
|
/S/ KIMBERLY D.C. TRAPP
|
Director
|
March 15, 2017
|
||
|
Kimberly D.C. Trapp
|
EXHIBIT INDEX
|
Exhibit
Number
|
Description
|
|
|
2.1
|
Agreement and Plan of Merger, dated as of November 9, 2009, among GigOptix, Inc., Ahoy Acquisition Corporation and ChipX, Incorporated. Filed previously with the Registrant’s Current Report on Form 8-K filed on November 10, 2009.
|
|
|
2.2
|
Agreement and Plan of Merger, dated as of February 4, 2011, among GigOptix, Inc., Aerie Acquisition Corporation and Endwave Corporation. Filed previously with the Registrant’s Current Report on Form 8-K filed on February 7, 2011.
|
|
|
2.3
|
Agreement and Plan of Merger, dated as of April 1, 2016, by and between GigOptix, Inc., Champagne Merger Sub, Inc., Magnum Semiconductor, Inc. and Fortis Advisors LLC. Filed previously with the Registrant’s Current Report on Form 8-K filed on April 4, 2016.
|
|
|
2.4
|
Agreement and Plan of Merger by and among GigPeak, Inc., Integrated Device Technology, Inc. and Glider Merger Sub, Inc., dated as of February 13, 2017. Filed previously with the Registrant’s Current Report on Form 8-K filed on February 13, 2017.
|
|
|
3.1
|
Form of Amended and Restated Certificate of Incorporation of the Registrant. Filed previously with the Registrant’s Registration Statement on Form S-4 filed on September 8, 2008, SEC File No. 333-153362.
|
|
|
3.2
|
Second Amended and Restated Bylaws of the Registrant. Filed previously with the Registrant’s Current Report on Form 8-K filed on April 18, 2016.
|
|
|
3.3
|
Certificate of Designation of Series A Junior Preferred Stock. Filed previously with the Registrant’s Registration Statement on Form 8-A filed on December 2011, SEC File No. 000-54572.
|
|
|
3.4
|
Amended and Restated Certificate of Designation of Series A Junior Preferred Stock. Filed previously with the Registrant’s Registration Statement on Form 8-A/A Amendment No. 1 filed on December 19, 2014, SEC File No. 000-54572.
|
|
|
3.5
|
Form of Certificate of Amendment of the Amended and Restated Certificate of Incorporation of the Registrant. Filed as Appendix A to the Registrant’s Proxy Statement on Schedule 14-A filed on October 3, 2014 (File No. 001-35520).
|
|
|
3.6
|
Second Certificate of Amendment of the Amended and Restated Certificate of Incorporation of the Registrant dated April 5, 2016. Filed previously with the Registrant’s Current Report on Form 8-K filed on April 6, 2016.
|
|
|
4.1
|
Form of Certificate representing the Common Stock, par value $0.001 per share, of the Registrant. Filed previously with the Registrant’s Amendment No. 2 to Registration Statement on Form S-4 filed on October 24, 2008, SEC File No. 333-153362.
|
|
|
4.2
|
Warrant issued by GigOptix, Inc. to Bridge Bank, N.A. on April 7, 2010 in connection with the Loan and Security Agreement. Filed previously with the Registrant’s Annual Report on Form 10-K for the fiscal year ended December 31, 2010, filed on March 3, 2011.
|
|
|
4.3
|
Rights Agreement, dated as of December 16, 2011, between GigOptix, Inc. and American Stock Transfer & Trust Company, LLC, as Rights Agent, including the Summary of Rights as Exhibit A, the Form of Rights Certificate as Exhibit B and the Certificate of Designation of Series A Junior Preferred Stock as Exhibit C. Filed previously with the Registrant’s Registration Statement on Form 8-A filed on December 2011, SEC File No. 000-54572.
|
|
|
4.4
|
Amended and Restated Rights Agreement, dated as of December 16, 2014, between GigOptix, Inc. and American Stock Transfer & Trust Company, LLC, as Rights Agent, including the Summary of Rights as Exhibit A, the Form of Rights Certificate as Exhibit B and the Amended and Restated Certificate of Designation of Series A Junior Preferred Stock as Exhibit C. Filed previously with the Registrant’s Registration Statement on Form 8-A/A Amendment No. 1 filed on December 19, 2014, SEC File No. 000-54572.
|
|
10.1
|
2000 Stock Option Plan of Lumera Corporation. Filed previously with Amendment No. 1 to Lumera Corporation’s Registration Statement on Form S-1 filed on June 24, 2004.
|
|
|
10.2
|
GigPeak, Inc. Amended and Restated 2008 Equity Incentive Plan. Filed previously with the Registrant's Current Report on Form 8-K filed on April 18, 2016.
|
|
|
10.3
|
2004 Equity Incentive Plan of Lumera Corporation. Filed previously with Amendment No. 1 to Lumera Corporation’s Registration Statement on Form S-1 filed on June 24, 2004.
|
|
|
10.4
|
2007 GigOptix LLC Equity Incentive Plan. Filed previously with the Registrant’s Registration Statement on Form S-4 filed on September 8, 2008, SEC File No. 333-153362.
|
|
|
10.5
|
Amendment to 2000 Stock Option Plan of Lumera Corporation. Filed previously with Amendment No. 1 to Lumera Corporation’s Registration Statement on Form S-1 filed on June 24, 2004.
|
|
|
10.6
|
Form of Employment Agreement to be entered into between the Company and its executive officers. Filed previously with the Registrant’s 8-K filed on February 11, 2009.
|
|
10.7
|
Form of Incentive Stock Option Award Agreement. Filed previously with the Registrant’s Current Report on Form 8-K filed on April 18, 2016.
|
|
|
10.8
|
Form of Nonstatutory Stock Option Award Agreement. Filed previously with the Registrant’s Current Report on Form 8-K filed on April 18, 2016.
|
|
|
10.9
|
Lease Agreement, by and between Legacy Partners I San Jose, LLC and Endwave Corporation, dated May 24, 2006, as amended by: (i) that certain First Amendment to Lease Agreement, by and between Legacy Partners I San Jose, LLC and Endwave Corporation, dated as of September 11, 2006; (ii) that certain Second Amendment to Lease Agreement, by and between Legacy Partners I San Jose, LLC and Endwave Corporation, dated as of December 6, 2006; (iii) that certain Third Amendment to Lease Agreement dated as of April 12, 2007, by and between Legacy Partners I San Jose, LLC and Endwave Corporation; and (iv) that certain Fourth Amendment to Lease Agreement dated as of June 17, 2011, by and between Legacy Partners I San Jose, LLC and GigOptix, Inc. Filed previously with the Registrant’s Current Report on Form 8-K filed on June 21, 2011.
|
|
|
10.10
|
Form of Indemnification Agreement. Filed previously with the Registrant’s Current Report on Form 8-K filed on June 21, 2011.
|
|
|
10.11
|
Agreement between Mr. Judson and GigOptix, Inc., dated as of November 21, 2011. Filed previously with the Registrant’s Current Report on Form 8-K filed on November 28, 2011.
|
|
|
10.12
|
Form of Amendment of Award for Directors, dated as of March 27, 2012. Filed previously with the Registrant’s Current Report on Form 8-K filed March 28, 2012.
|
|
|
10.13
|
Form of Restricted Stock Units Notice of Grant and Agreement. Filed previously with the Registrant’s Current Report on Form 8-K filed April 18, 2016.
|
|
|
10.14
|
Third Amended and Restated Employment Agreement by and between GigPeak, Inc. and Andrea Betti-Berutto, dated as of November 17, 2016. Filed previously with the Registrant’s Current Report on Form 8-K filed November 23, 2016.
|
|
10.15
|
First Amendment to the Articles of Association of BrPhotonics Produtos Optoeletrônicos LTDA. Filed previously with the Registrant’s Quarterly Report on Form 10-Q for the fiscal quarter ended March 30, 2014, filed May 9, 2014.
|
|
|
10.16
|
Joint Venture and Quotaholders Agreement dated February 10, 2014, by and among GigPeak, Inc., Fundação CPqD – Centro De Pesquisa e Desenvolvimento em Telecomunicações (CPqD), and BrPhotonics Produtos Optoeletrônicos LTDA. Filed previously with the Registrant’s Quarterly Report on Form 10-Q for the fiscal quarter ended March 30, 2014, filed May 9, 2014.
|
|
|
10.17
|
First Amended and Restated Employment Agreement dated as of November 17, 2016, by and between GigPeak, Inc. and Darren Ma. Filed previously with the Registrant’s Current Report on Form 8-K filed November 23, 2016.
|
|
|
10.18
|
Fourth Amended and Restated Employment Agreement dated as of November 17, 206, by and between GigPeak, Inc. and Dr. Avi Katz. Filed previously with the Registrant’s Current Report on Form 8-K filed November 23, 2016.
|
|
|
10.19
|
Fourth Amended and Restated Employment Agreement dated as of November 17, 2016, by and between GigPeak, Inc., and Dr. Raluca Dinu. Filed previously with the Registrant’s Current Report on Form 8-K filed on November 23, 2016.
|
|
|
10.20
|
Lease Agreement, dated April 17, 2007 by and between Keith C. Estes & Traci A. Estes, The Estes Family Trust and Tahoe RF Semiconductor, Inc. for facilities located at 12834 Earhart Avenue, Auburn, Washington. Filed previously with the Registrant’s Annual Report on Form 10-K for the fiscal year ended December 31, 2014, filed on March 17, 2015.
|
|
|
10.21
|
Amendment to Lease Agreement dated November 14, 2012, by and between Keith C. Estes & Traci A. Estes, The Estes Family Trust and Tahoe RF Semiconductor, Inc. for facilities located at 12834 Earhart Avenue, Auburn, Washington. Filed previously with the Registrant’s Annual Report on Form 10-K for the fiscal year ended December 31, 2014, filed on March 17, 2015.
|
|
|
10.22
|
Transfer of Lease Agreement, dated April 17, 2007, and Amendment to Lease Agreement, November 14, 2012 by and between Keith C. Estes & Traci A. Estes, The Estes Family Trust and Tahoe RF Semiconductor to GigOptix, Inc. for facilities located at 12834 Earhart Avenue, Auburn, Washington. Filed previously with the Registrant’s Annual Report on Form 10-K for the fiscal year ended December 31, 2014, filed on March 17, 2015.
|
|
10.23
|
Century Park Standard Form Lease Agreement, by and between GigOptix, Inc. and Keith C. Traci A. Estes Trust, dated as of April 3, 2015. Filed previously with the Registrant’s Quarterly Report on Form 10-Q for the fiscal quarter ended March 29, 2015, filed on May 7, 2015.
|
|
|
10.24
|
Underwriting Agreement, by and between GigOptix, Inc. and, Avi Katz, Andrea Betti-Berutto and John Mikulsky, Cowen and Company, LLC and Roth Capital Partners, LLC, dated August 21, 2015. Filed previously with the Registrant’s Current Report on Form 8-K, filed on August 21, 2015.
|
|
|
10.25
|
Distributor Agreement, by and between GigOptix, Inc. and Avnet Asia Pte Ltd, dated March 11, 2016. Filed previously with the Registrant’s Current Report on Form 8-K filed on March 16, 2016.
|
|
|
10.26
|
Securities Purchase Agreement, by and between GigOptix, Inc. and Pudong Science and Technology Investment (Cayman) Co., Ltd., dated March 21, 2016. Filed previously with the Registrant’s Current Report on Form 8-K filed on March 22, 2016.
|
|
|
10.27
|
Third Amended and Restated Loan and Security Agreement, dated as April 5, 2016 between GigOptix, Inc. and its wholly owned subsidiaries, ChipX, Incorporated and Endwave Corporation, Magnum Semiconductor, Inc. and Silicon Valley Bank. Filed previously with the Registrant’s Current Report on Form 8-K filed on April 6, 2016.
|
|
|
10.28
|
Underwriting Agreement, by and between GigPeak, Inc., Avi Katz, Andrea Betti-Berutto, Raluca Dinu, Darren Ma, Joseph J. Lazzara John Mikulsky, Neil J. Miotto, Frank Schneider, Kimberly D.C. Trapp, Investcorp Technology Ventures II, L.P. (Delaware), Investcorp Technology Ventures II, L.P. (Cayman), ITV II (II), L.P., Cowen and Company, Raymond James & Associates, Inc. and Needham & Company, LLC, dated June 10, 2016. Filed previously with the Registrant’s Current Report on Form 8-K, filed on June 10, 2016.
|
|
10.29
|
Fifth Amendment to Lease Agreement dated as of July 15, 2016, by and between G&I VIII Baytech LP and GigPeak, Inc. Filed previously with the Registrant’s Quarterly Report on Form 10-Q for the quarter ended September 25, 2016 filed on November 2, 2016.
|
|
|
10.30
|
Change in Control Bonus Plan. Filed previously with the Registrant’s Current Report on Form 8-K filed on November 23, 2016.
|
|
|
10.31
|
Amendment No. 1 to Amended and Restated Rights Agreement, by and between the Company and American Stock Transfer & Trust Company, LLC, dated as of February 10, 2017. Filed previously with the Registrant’s Current Report on Form 8-K filed on February 13, 2017.
|
|
|
Subsidiaries of the registrant.
|
||
|
Consent of BPM LLP Independent Registered Public Accounting Firm.
|
||
|
24.1*
|
Powers of Attorney (included on the signature pages hereto)
|
|
|
Chief Executive Officer certification pursuant to Rule 13a-14(a)/15d-14a of the Securities Exchange Act of 1934, as adopted pursuant to Section 302 of the Sarbanes-Oxley Act of 2002.
|
||
|
Chief Financial Officer certification pursuant to Rule 13a-14(a)/15d-14a of the Securities Exchange Act of 1934, as adopted pursuant to Section 302 of the Sarbanes-Oxley Act of 2002.
|
||
|
Chief Executive Officer certification pursuant to Rule 13a-14(b) or Rule 13d-14(b) and Section 1350, Chapter 63 of Title 18 United States Code (18 U.S.C. 1350) as adopted pursuant to Section 906 of Sarbanes-Oxley Act of 2002.
|
||
|
Chief Financial Officer certification pursuant to Rule 13a-14(b) or Rule 15d-14(b) and Section 1350, Chapter 63 of Title 18 United States Code (18 U.S.C. 1350) as adopted pursuant to Section 906 of Sarbanes-Oxley Act of 2002.
|
||
|
101.INS
|
Instance Document
|
|
|
101.SCH
|
XBRL Taxonomy Extension Schema Document
|
|
|
101.CAL
|
XBRL Taxonomy Extension Calculation Linkbase Document
|
|
|
101.DEF
|
XBRL Taxonomy Extension Definition Linkbase Document
|
|
|
101.LAB
|
XBRL Taxonomy Extension Label Linkbase Document
|
|
|
101.PRE
|
XBRL Taxonomy Extension Presentation Linkbase Document
|
| * |
Filed herewith
|
| † |
Portions of this exhibit have been omitted and filed separately with the Securities and Exchange Commission pursuant to a confidential treatment request under Rule 24b-2 of the Securities Exchange Act of 1934, as amended.
|
135