Attached files
| file | filename |
|---|---|
| 8-K - 8-K - CLOUD PEAK ENERGY INC. | a15-17187_18k.htm |
Exhibit 99.1
|
|
INVESTOR Presentation August 2015 |
|
|
1 Cautionary Note Regarding Forward-Looking Statements This presentation contains “forward-looking statements” within the meaning of the safe harbor provisions of Section 27A of the Securities Act of 1933 and Section 21E of the Securities Exchange Act of 1934. Forward-looking statements are not statements of historical facts, and often contain words such as “may,” “will,” “expect,” “believe,” “anticipate,” “plan,” “estimate,” “seek,” “could,” “should,” “intend,” “potential,” or words of similar meaning. Forward-looking statements are based on management’s current expectations, beliefs, assumptions and estimates regarding our company, industry, economic conditions, government regulations, energy policies and other factors. These statements are subject to significant risks, uncertainties and assumptions that are difficult to predict and could cause actual results to differ materially and adversely from those expressed or implied in the forward-looking statements. For a description of some of the risks and uncertainties that may adversely affect our future results, refer to the risk factors described from time to time in the reports and registration statements we file with the Securities and Exchange Commission, including those in Item 1A "Risk Factors" of our most recent Form 10-K and any updates thereto in our Forms 10-Q and Forms 8-K. There may be other risks and uncertainties that are not currently known to us or that we currently believe are not material. We make forward-looking statements based on currently available information, and we assume no obligation to, and expressly disclaim any obligation to, update or revise publicly any forward-looking statements made in our presentation, whether as a result of new information, future events or otherwise, except as required by law. Non-GAAP Financial Measures This presentation includes the non-GAAP financial measures of (1) Adjusted EBITDA (on a consolidated basis and for our reporting segments) and (2) Adjusted Earnings Per Share (“Adjusted EPS”). Adjusted EBITDA and Adjusted EPS are intended to provide additional information only and do not have any standard meaning prescribed by generally accepted accounting principles in the U.S. (“GAAP”). A quantitative reconciliation of historical net income (loss) to Adjusted EBITDA and EPS (as defined below) to Adjusted EPS is found in the tables accompanying this presentation. EBITDA represents net income (loss) before: (1) interest income (expense) net, (2) income tax provision, (3) depreciation and depletion, and (4) amortization. Adjusted EBITDA represents EBITDA as further adjusted for accretion, which represents non-cash increases in asset retirement obligation liabilities resulting from the passage of time, and specifically identified items that management believes do not directly reflect our core operations. For the periods presented herein, the specifically identified items are: (1) adjustments to exclude the updates to the tax agreement liability, including tax impacts of the 2009 IPO and 2010 Secondary Offering and the termination of the Tax Receivable Agreement in August 2014, (2) adjustments for derivative financial instruments, excluding fair value mark-to-market gains or losses and including cash amounts received or paid, (3) adjustments to exclude non-cash goodwill impairment charges, and (4) adjustments to exclude the gain from the sale of our 50% non-operating interest in the Decker Mine. We enter into certain derivative financial instruments such as put options that require the payment of premiums at contract inception. The reduction in the premium value over time is reflected in the mark-to-market gains or losses. Our calculation of Adjusted EBITDA does not include premiums paid for derivative financial instruments; either at contract inception, as these payments pertain to future settlement periods, or in the period of contract settlement, as the payment occurred in a preceding period. Because of the inherent uncertainty related to the items identified above, management does not believe it is able to provide a meaningful forecast of the comparable GAAP measures or a reconciliation to any forecasted GAAP measures. Adjusted EPS represents diluted earnings (loss) per common share (“EPS”) adjusted to exclude (i) the estimated per share impact of the same specifically identified non-core items used to calculate Adjusted EBITDA as described above, and (ii) the cash and non-cash interest expense associated with the early retirement of debt and refinancing transactions. All items are adjusted at the statutory tax rate of approximately 37%. Adjusted EBITDA is an additional tool intended to assist our management in comparing our performance on a consistent basis for purposes of business decision making by removing the impact of certain items that management believes do not directly reflect our core operations. Adjusted EBITDA is a metric intended to assist management in evaluating operating performance, comparing performance across periods, planning and forecasting future business operations and helping determine levels of operating and capital investments. Period-to-period comparisons of Adjusted EBITDA are intended to help our management identify and assess additional trends potentially impacting our Company that may not be shown solely by period-to-period comparisons of net income (loss). Our chief operating decision maker uses Adjusted EBITDA as a measure of segment performance. Consolidated Adjusted EBITDA is also used as part of our incentive compensation program for our executive officers and others. We believe Adjusted EBITDA and Adjusted EPS are also useful to investors, analysts and other external users of our consolidated financial statements in evaluating our operating performance from period to period and comparing our performance to similar operating results of other relevant companies. Adjusted EBITDA allows investors to measure a company’s operating performance without regard to items such as interest expense, taxes, depreciation and depletion, amortization and accretion and other specifically identified items that are not considered to directly reflect our core operations. Similarly, we believe our use of Adjusted EPS provides an appropriate measure to use in assessing our performance across periods given that this measure provides an adjustment for certain specifically identified significant items that are not considered to directly reflect our core operations, the magnitude of which may vary significantly from period to period and, thereby, have a disproportionate effect on the earnings per share reported for a given period. Our management recognizes that using Adjusted EBITDA and Adjusted EPS as performance measures has inherent limitations as compared to net income (loss), EPS, or other GAAP financial measures, as these non-GAAP measures exclude certain items, including items that are recurring in nature, which may be meaningful to investors. Adjusted EBITDA and Adjusted EPS should not be considered in isolation and do not purport to be alternatives to net income (loss), EPS or other GAAP financial measures as a measure of our operating performance. Because not all companies use identical calculations, our presentations of Adjusted EBITDA and Adjusted EPS may not be comparable to other similarly titled measures of other companies. Moreover, our presentation of Adjusted EBITDA is different than EBITDA as defined in our debt financing agreements. |
|
|
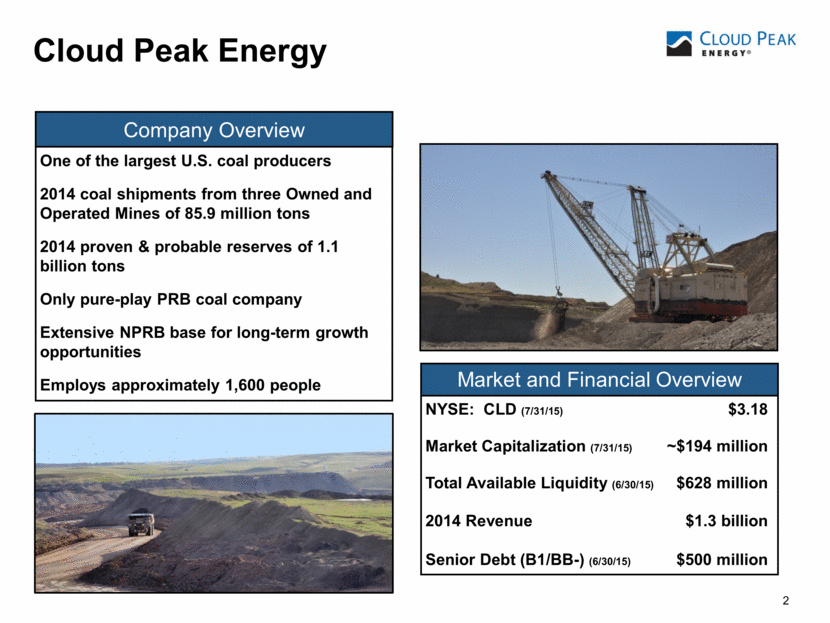
2 2 2 Cloud Peak Energy One of the largest U.S. coal producers 2014 coal shipments from three Owned and Operated Mines of 85.9 million tons 2014 proven & probable reserves of 1.1 billion tons Only pure-play PRB coal company Extensive NPRB base for long-term growth opportunities Employs approximately 1,600 people NYSE: CLD (7/31/15) $3.18 Market Capitalization (7/31/15) ~$194 million Total Available Liquidity (6/30/15) $628 million 2014 Revenue $1.3 billion Senior Debt (B1/BB-) (6/30/15) $500 million Market and Financial Overview Company Overview |
|
|
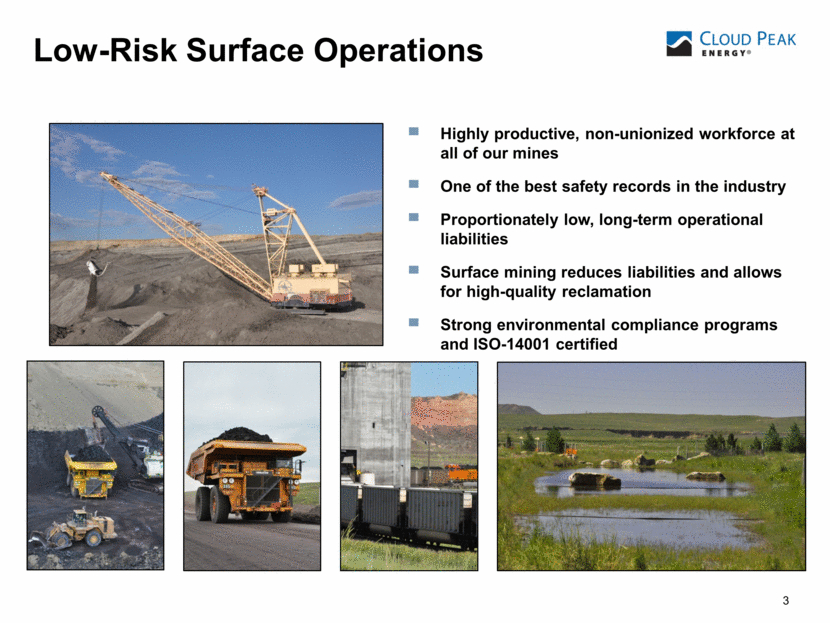
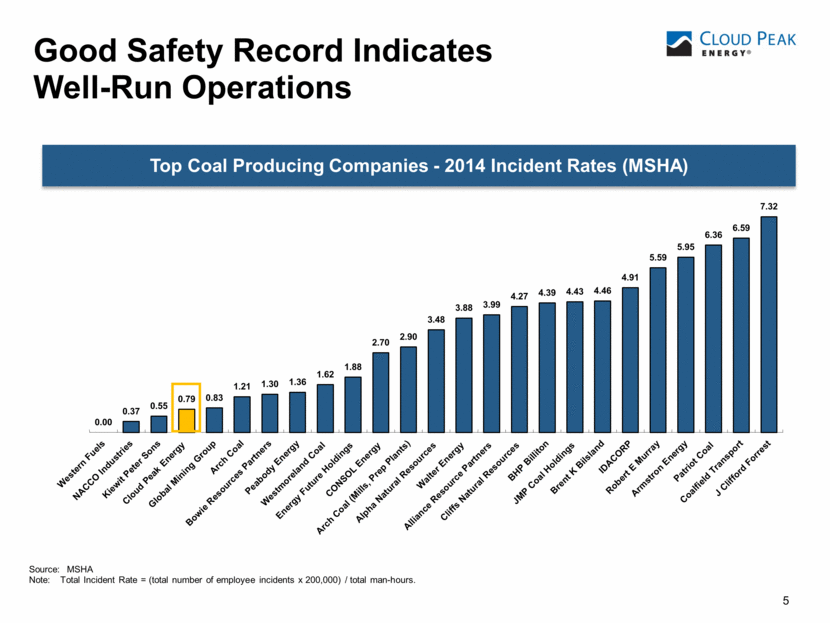
3 Low-Risk Surface Operations Highly productive, non-unionized workforce at all of our mines One of the best safety records in the industry Proportionately low, long-term operational liabilities Surface mining reduces liabilities and allows for high-quality reclamation Strong environmental compliance programs and ISO-14001 certified |
|
|
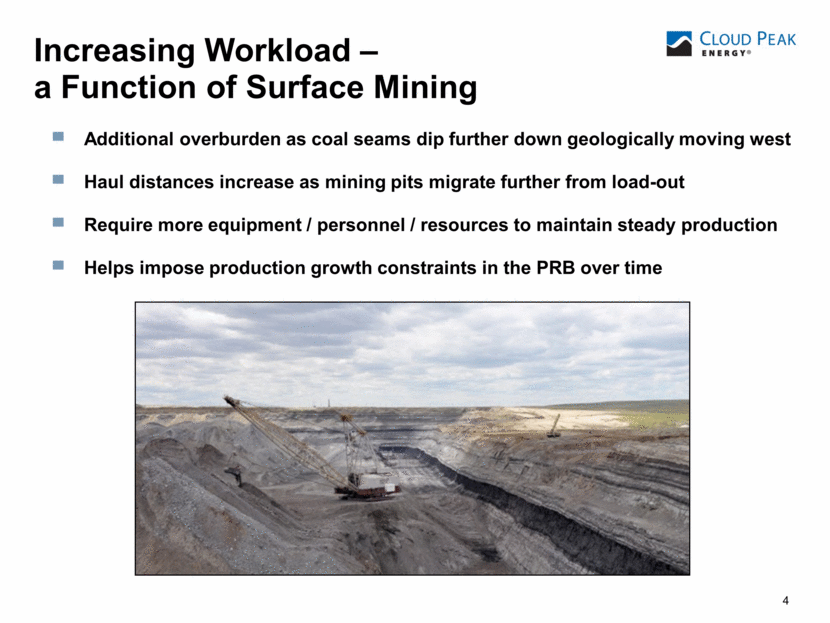
4 4 4 (1) Additional overburden as coal seams dip further down geologically moving west Haul distances increase as mining pits migrate further from load-out Require more equipment / personnel / resources to maintain steady production Helps impose production growth constraints in the PRB over time Increasing Workload – a Function of Surface Mining |
|
|
5 5 5 5 Top Coal Producing Companies - 2014 Incident Rates (MSHA) Source: MSHA Note: Total Incident Rate = (total number of employee incidents x 200,000) / total man-hours. Good Safety Record Indicates Well-Run Operations Cloud Peak Energy Cloud Peak Energy 0.00 0.37 0.55 0.79 0.83 1.21 1.30 1.36 1.62 1.88 2.70 2.90 3.48 3.88 3.99 4.27 4.39 4.43 4.46 4.91 5.59 5.95 6.36 6.59 7.32 |
|
|
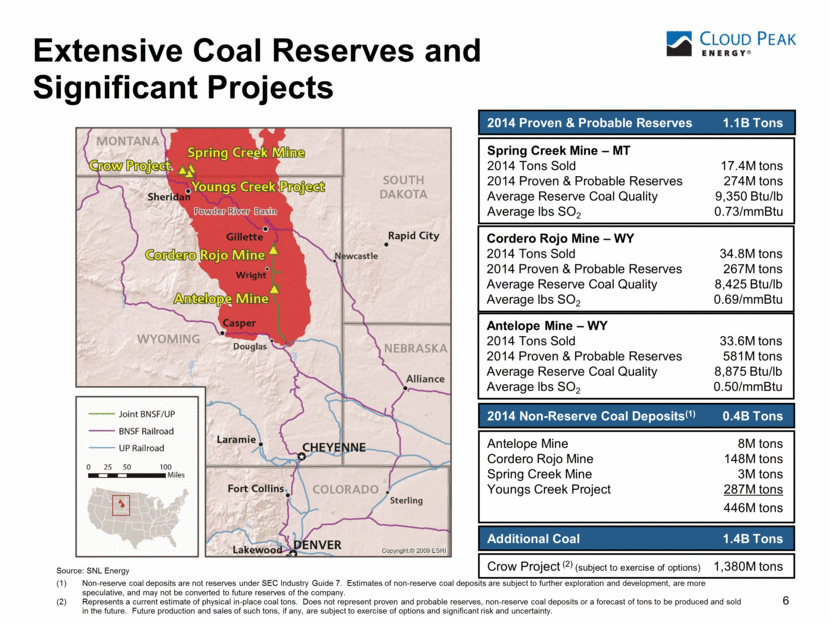
Extensive Coal Reserves and Significant Projects 6 Spring Creek Mine – MT 2014 Tons Sold 17.4M tons 2014 Proven & Probable Reserves 274M tons Average Reserve Coal Quality 9,350 Btu/lb Average lbs SO2 0.73/mmBtu Cordero Rojo Mine – WY 2014 Tons Sold 34.8M tons 2014 Proven & Probable Reserves 267M tons Average Reserve Coal Quality 8,425 Btu/lb Average lbs SO2 0.69/mmBtu Antelope Mine – WY 2014 Tons Sold 33.6M tons 2014 Proven & Probable Reserves 581M tons Average Reserve Coal Quality 8,875 Btu/lb Average lbs SO2 0.50/mmBtu 6 2014 Proven & Probable Reserves 1.1B Tons Antelope Mine 8M tons Cordero Rojo Mine 148M tons Spring Creek Mine 3M tons Youngs Creek Project 287M tons 446M tons 2014 Non-Reserve Coal Deposits(1) 0.4B Tons Source: SNL Energy (1) Non-reserve coal deposits are not reserves under SEC Industry Guide 7. Estimates of non-reserve coal deposits are subject to further exploration and development, are more speculative, and may not be converted to future reserves of the company. (2) Represents a current estimate of physical in-place coal tons. Does not represent proven and probable reserves, non-reserve coal deposits or a forecast of tons to be produced and sold in the future. Future production and sales of such tons, if any, are subject to exercise of options and significant risk and uncertainty. Crow Project (2) (subject to exercise of options) 1,380M tons Additional Coal 1.4B Tons |
|
|
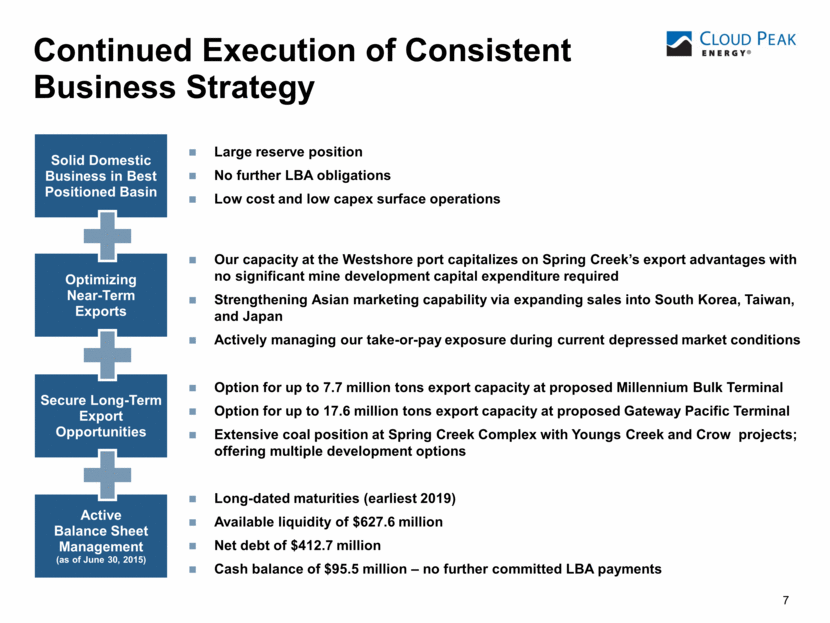
7 Continued Execution of Consistent Business Strategy Optimizing Near-Term Exports Our capacity at the Westshore port capitalizes on Spring Creek’s export advantages with no significant mine development capital expenditure required Strengthening Asian marketing capability via expanding sales into South Korea, Taiwan, and Japan Actively managing our take-or-pay exposure during current depressed market conditions Secure Long-Term Export Opportunities Option for up to 7.7 million tons export capacity at proposed Millennium Bulk Terminal Option for up to 17.6 million tons export capacity at proposed Gateway Pacific Terminal Extensive coal position at Spring Creek Complex with Youngs Creek and Crow projects; offering multiple development options Solid Domestic Business in Best Positioned Basin Large reserve position No further LBA obligations Low cost and low capex surface operations Active Balance Sheet Management (as of June 30, 2015) Long-dated maturities (earliest 2019) Available liquidity of $627.6 million Net debt of $412.7 million Cash balance of $95.5 million – no further committed LBA payments |
|
|
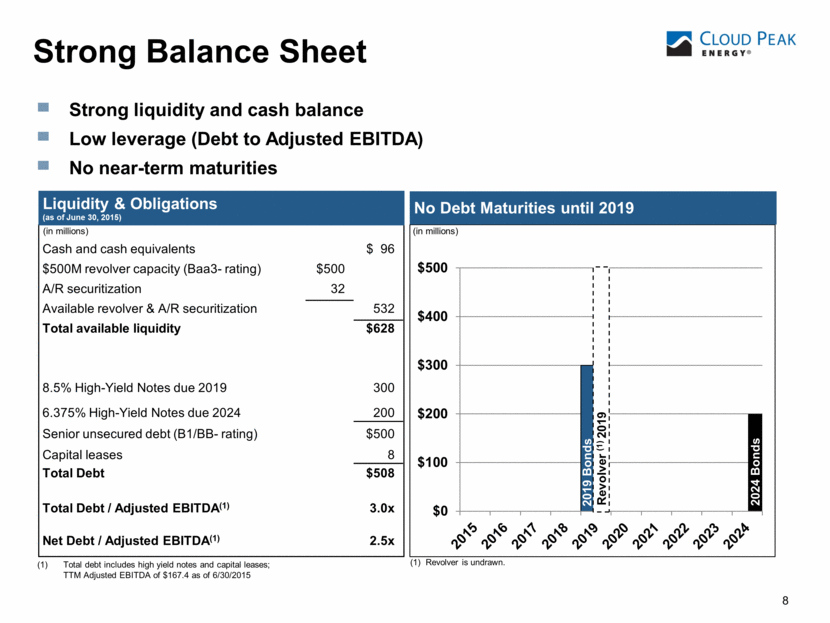
(1) Total debt includes high yield notes and capital leases; TTM Adjusted EBITDA of $167.4 as of 6/30/2015 Liquidity & Obligations (as of June 30, 2015) Strong Balance Sheet (in millions) 8 No Debt Maturities until 2019 (1) Revolver is undrawn. Cash and cash equivalents $ 96 $500M revolver capacity (Baa3- rating) $500 A/R securitization 32 Available revolver & A/R securitization 532 Total available liquidity $628 8.5% High-Yield Notes due 2019 300 6.375% High-Yield Notes due 2024 200 Senior unsecured debt (B1/BB- rating) $500 Capital leases 8 Total Debt $508 Total Debt / Adjusted EBITDA(1) 3.0x Net Debt / Adjusted EBITDA(1) 2.5x Strong liquidity and cash balance Low leverage (Debt to Adjusted EBITDA) No near-term maturities (in millions) 2019 Bonds 2024 Bonds $0 $100 $200 $300 $400 $500 Revolver (1) 2019 |
|
|
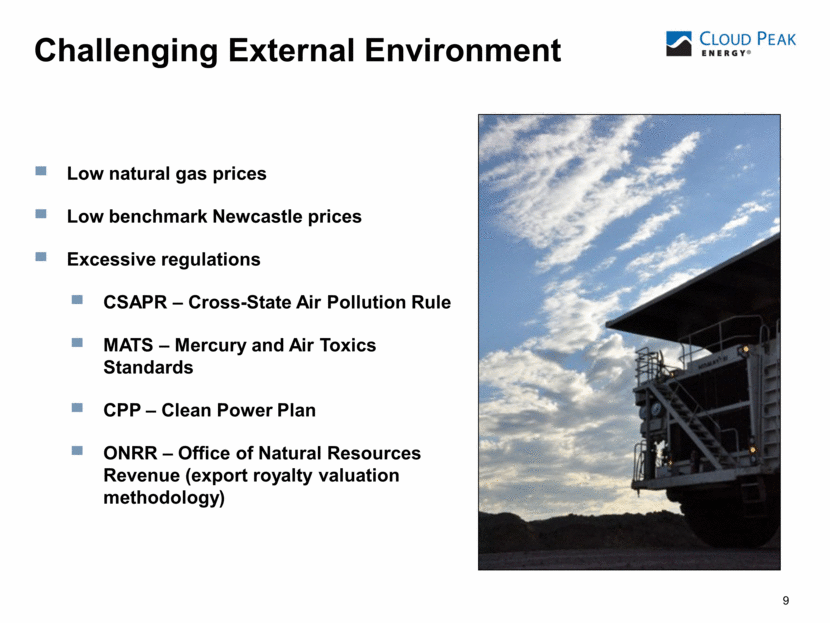
9 9 9 (1) Low natural gas prices Low benchmark Newcastle prices Excessive regulations CSAPR – Cross-State Air Pollution Rule MATS – Mercury and Air Toxics Standards CPP – Clean Power Plan ONRR – Office of Natural Resources Revenue (export royalty valuation methodology) Challenging External Environment |
|
|
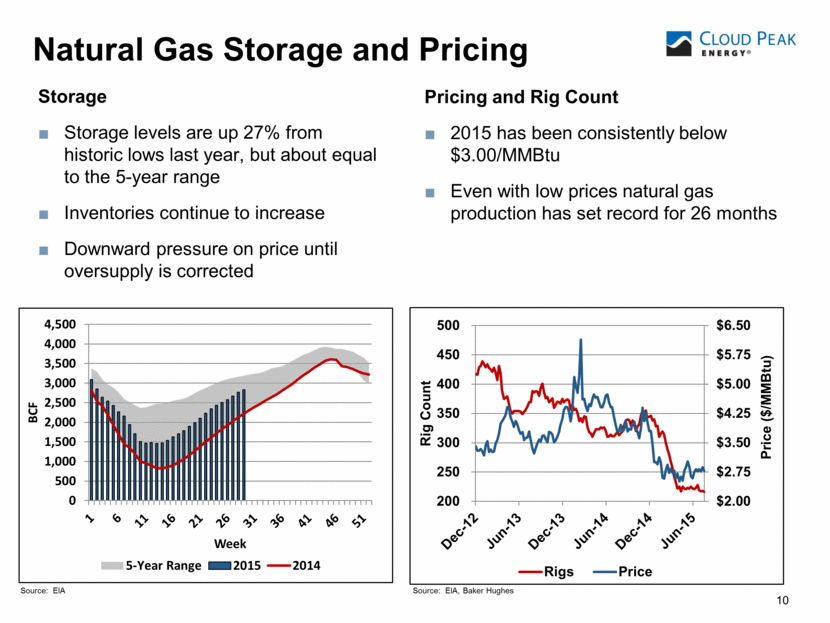
Natural Gas Storage and Pricing Storage Storage levels are up 27% from historic lows last year, but about equal to the 5-year range Inventories continue to increase Downward pressure on price until oversupply is corrected Pricing and Rig Count 2015 has been consistently below $3.00/MMBtu Even with low prices natural gas production has set record for 26 months 10 Source: EIA Source: EIA, Baker Hughes 0 500 1,000 1,500 2,000 2,500 3,000 3,500 4,000 4,500 BCF Week 5-Year Range 2015 2014 $2.00 $2.75 $3.50 $4.25 $5.00 $5.75 $6.50 200 250 300 350 400 450 500 Price ($/MMBtu) Rig Count Rigs Price |
|
|
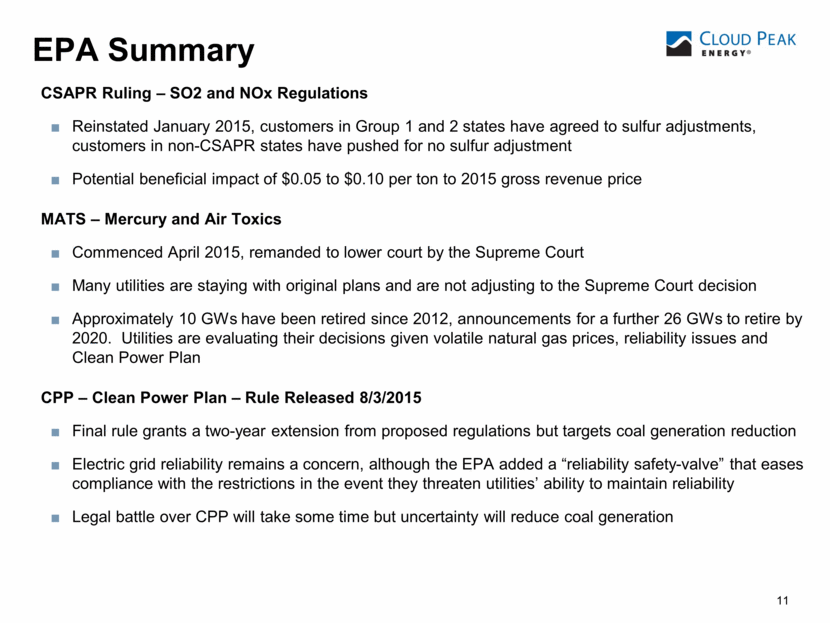
EPA Summary CSAPR Ruling – SO2 and NOx Regulations Reinstated January 2015, customers in Group 1 and 2 states have agreed to sulfur adjustments, customers in non-CSAPR states have pushed for no sulfur adjustment Potential beneficial impact of $0.05 to $0.10 per ton to 2015 gross revenue price MATS – Mercury and Air Toxics Commenced April 2015, remanded to lower court by the Supreme Court Many utilities are staying with original plans and are not adjusting to the Supreme Court decision Approximately 10 GWs have been retired since 2012, announcements for a further 26 GWs to retire by 2020. Utilities are evaluating their decisions given volatile natural gas prices, reliability issues and Clean Power Plan CPP – Clean Power Plan – Rule Released 8/3/2015 Final rule grants a two-year extension from proposed regulations but targets coal generation reduction Electric grid reliability remains a concern, although the EPA added a “reliability safety-valve” that eases compliance with the restrictions in the event they threaten utilities’ ability to maintain reliability Legal battle over CPP will take some time but uncertainty will reduce coal generation 11 |
|
|
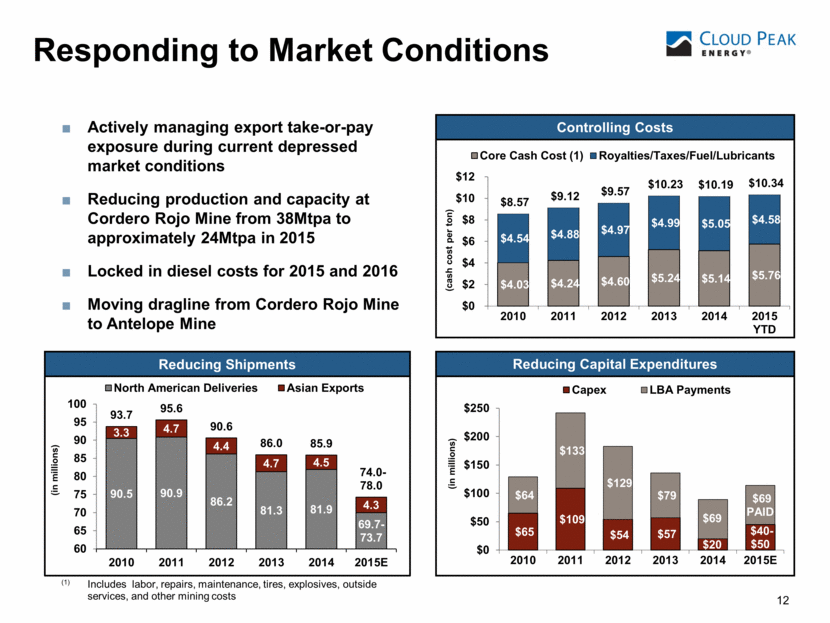
Responding to Market Conditions 12 Actively managing export take-or-pay exposure during current depressed market conditions Reducing production and capacity at Cordero Rojo Mine from 38Mtpa to approximately 24Mtpa in 2015 Locked in diesel costs for 2015 and 2016 Moving dragline from Cordero Rojo Mine to Antelope Mine Reducing Capital Expenditures (1) Includes labor, repairs, maintenance, tires, explosives, outside services, and other mining costs Controlling Costs Reducing Shipments $65 $109 $54 $57 $20 $40 - $50 $64 $133 $129 $79 $69 $ 69 PAID $0 $50 $100 $150 $200 $250 2010 2011 2012 2013 2014 2015E (in millions) Capex LBA Payments $4.03 $4.24 $4.60 $5.24 $5.14 $5.76 $4.54 $4.88 $4.97 $4.99 $5.05 $4.58 $8.57 $9.12 $9.57 $10.23 $10.19 $10.34 $0 $2 $4 $6 $8 $10 $12 2010 2011 2012 2013 2014 2015 YTD (cash cost per ton) Core Cash Cost (1) Royalties/Taxes/Fuel/Lubricants 90.5 90.9 86.2 81.3 81.9 69.7 - 73.7 3.3 4.7 4.4 4.7 4.5 4.3 93.7 95.6 90.6 86.0 85.9 74.0 - 78.0 60 65 70 75 80 85 90 95 100 2010 2011 2012 2013 2014 2015E (in millions) North American Deliveries Asian Exports |
|
|
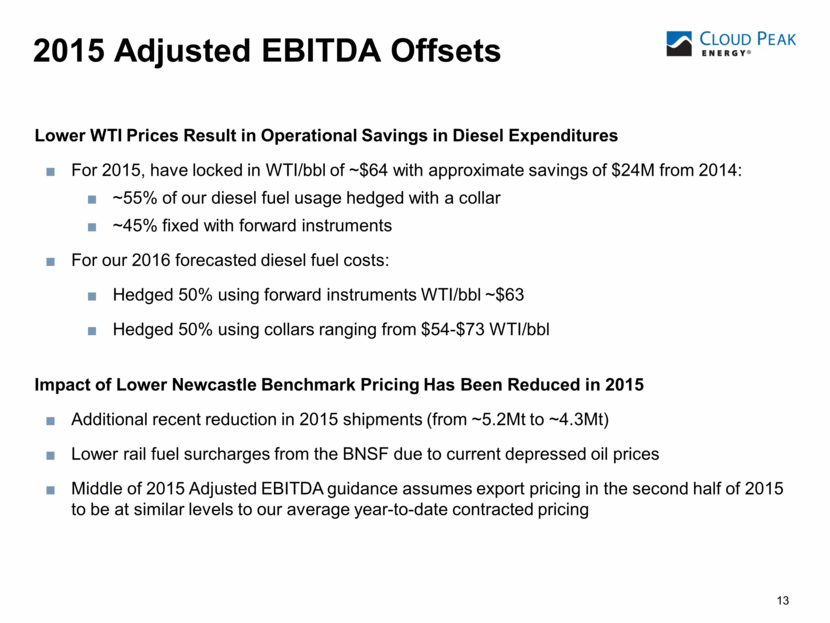
13 2015 Adjusted EBITDA Offsets 13 13 Lower WTI Prices Result in Operational Savings in Diesel Expenditures For 2015, have locked in WTI/bbl of ~$64 with approximate savings of $24M from 2014: ~55% of our diesel fuel usage hedged with a collar ~45% fixed with forward instruments For our 2016 forecasted diesel fuel costs: Hedged 50% using forward instruments WTI/bbl ~$63 Hedged 50% using collars ranging from $54-$73 WTI/bbl Impact of Lower Newcastle Benchmark Pricing Has Been Reduced in 2015 Additional recent reduction in 2015 shipments (from ~5.2Mt to ~4.3Mt) Lower rail fuel surcharges from the BNSF due to current depressed oil prices Middle of 2015 Adjusted EBITDA guidance assumes export pricing in the second half of 2015 to be at similar levels to our average year-to-date contracted pricing |
|
|
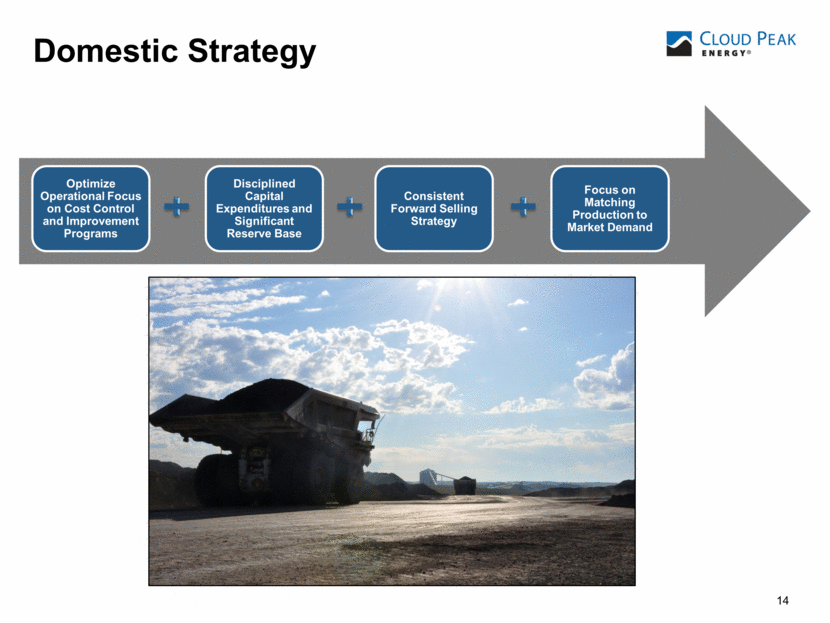
14 Domestic Strategy Consistent Forward Selling Strategy Focus on Matching Production to Market Demand Optimize Operational Focus on Cost Control and Improvement Programs Disciplined Capital Expenditures and Significant Reserve Base |
|
|
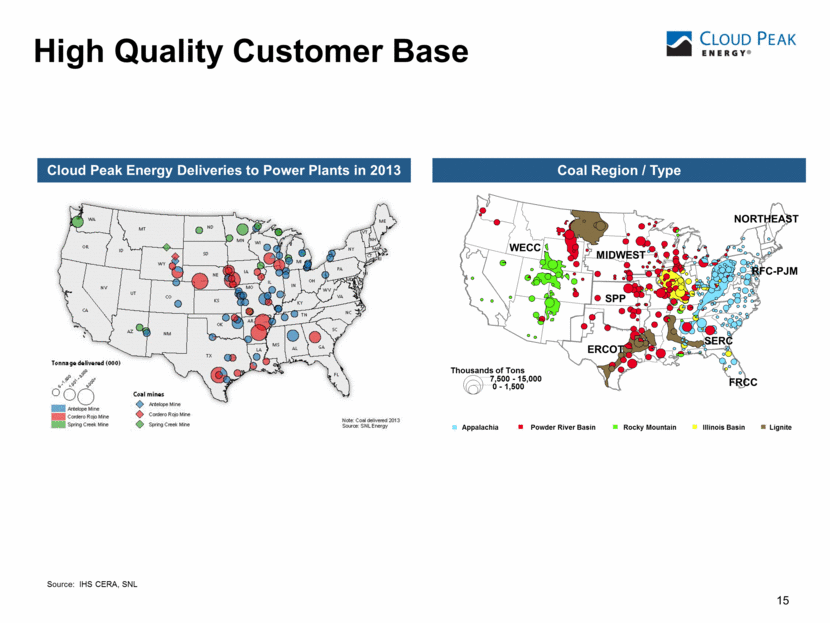
15 High Quality Customer Base Thousands of Tons 7,500 - 15,000 0 - 1,500 Appalachia Powder River Basin Illinois Basin Rocky Mountain Lignite WECC MIDWEST SPP ERCOT SERC NORTHEAST RFC-PJM FRCC Source: IHS CERA, SNL Coal Region / Type Cloud Peak Energy Deliveries to Power Plants in 2013 |
|
|
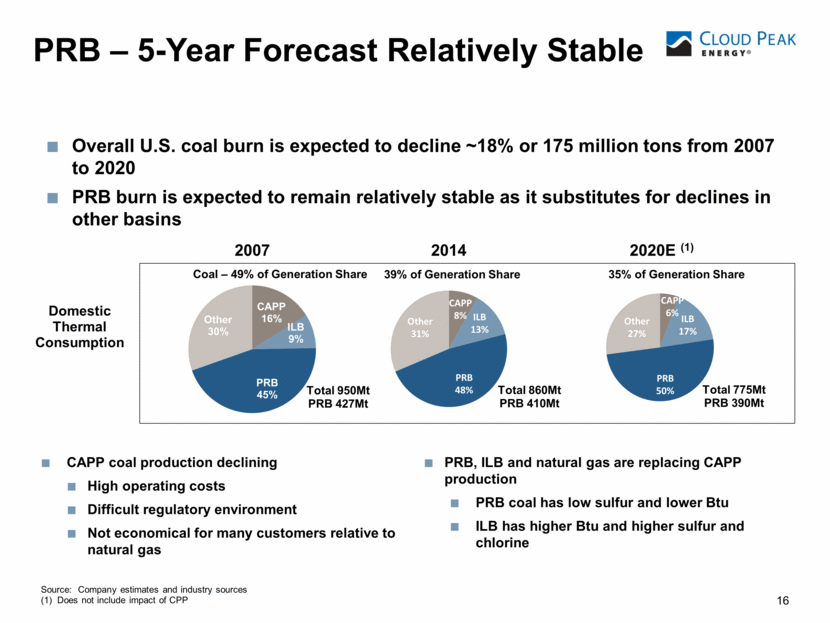
16 PRB – 5-Year Forecast Relatively Stable CAPP coal production declining High operating costs Difficult regulatory environment Not economical for many customers relative to natural gas Source: Company estimates and industry sources (1) Does not include impact of CPP PRB, ILB and natural gas are replacing CAPP production PRB coal has low sulfur and lower Btu ILB has higher Btu and higher sulfur and chlorine 2007 2014 2020E (1) Domestic Thermal Consumption Total 950Mt PRB 427Mt Total 860Mt PRB 410Mt Total 775Mt PRB 390Mt Overall U.S. coal burn is expected to decline ~18% or 175 million tons from 2007 to 2020 PRB burn is expected to remain relatively stable as it substitutes for declines in other basins |
|
|
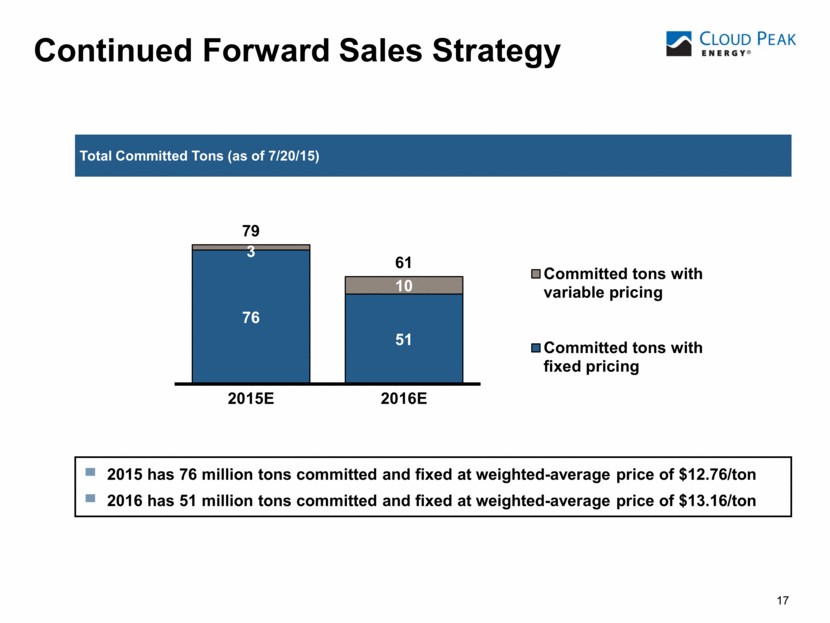
17 Continued Forward Sales Strategy 2015 has 76 million tons committed and fixed at weighted-average price of $12.76/ton 2016 has 51 million tons committed and fixed at weighted-average price of $13.16/ton Total Committed Tons (as of 7/20/15) (tons in millions) 76 51 3 10 79 61 2015E 2016E Committed tons with variable pricing Committed tons with fixed pricing |
|
|
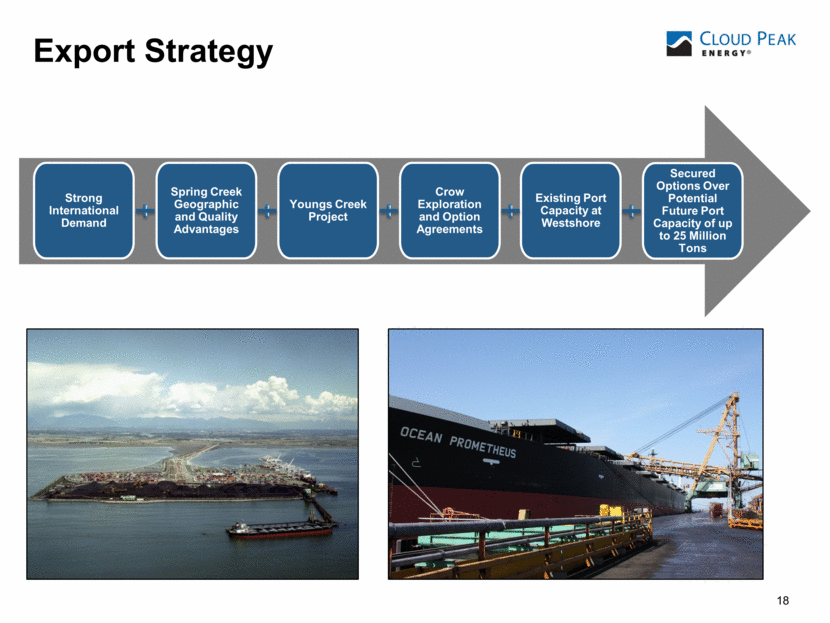
18 Export Strategy Strong International Demand Spring Creek Geographic and Quality Advantages Youngs Creek Project Crow Exploration and Option Agreements Existing Port Capacity at Westshore Secured Options Over Potential Future Port Capacity of up to 25 Million Tons |
|
|
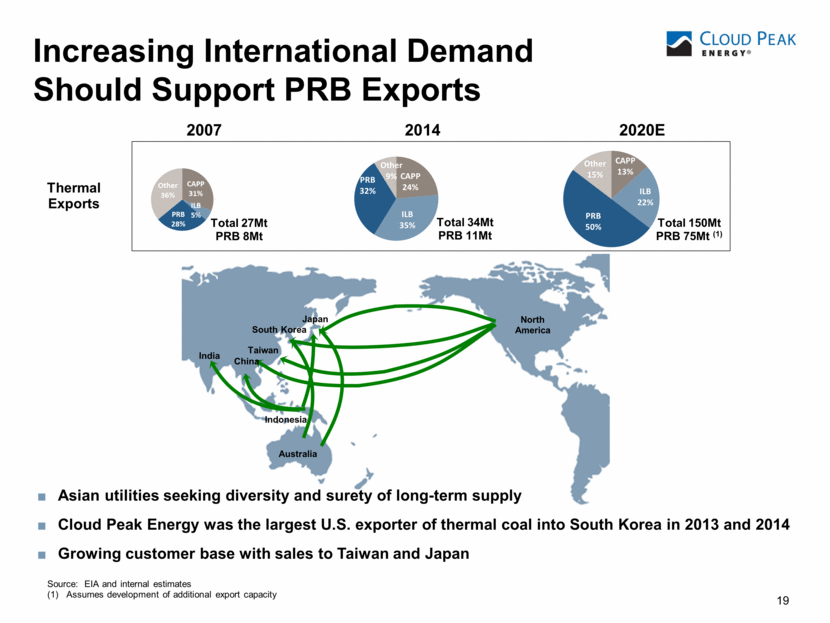
19 Increasing International Demand Should Support PRB Exports North America China Japan South Korea Taiwan India Australia Indonesia Asian utilities seeking diversity and surety of long-term supply Cloud Peak Energy was the largest U.S. exporter of thermal coal into South Korea in 2013 and 2014 Growing customer base with sales to Taiwan and Japan Thermal Exports Total 27Mt PRB 8Mt Total 34Mt PRB 11Mt Total 150Mt PRB 75Mt (1) 2007 2014 2020E Source: EIA and internal estimates (1) Assumes development of additional export capacity |
|
|
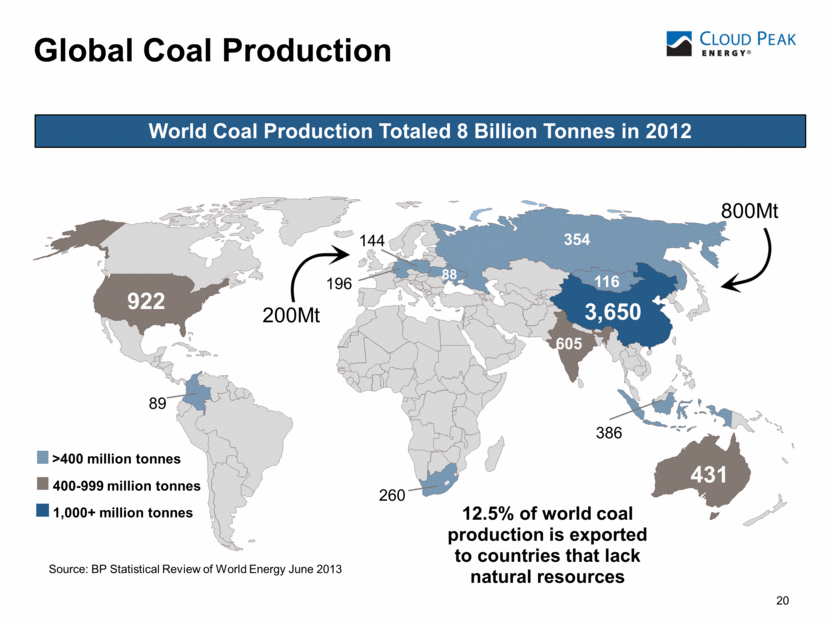
431 386 260 354 922 3,650 605 116 89 88 196 144 400-999 million tonnes 1,000+ million tonnes >400 million tonnes Global Coal Production Source: BP Statistical Review of World Energy June 2013 World Coal Production Totaled 8 Billion Tonnes in 2012 12.5% of world coal production is exported to countries that lack natural resources 200Mt 20 800Mt |
|
|
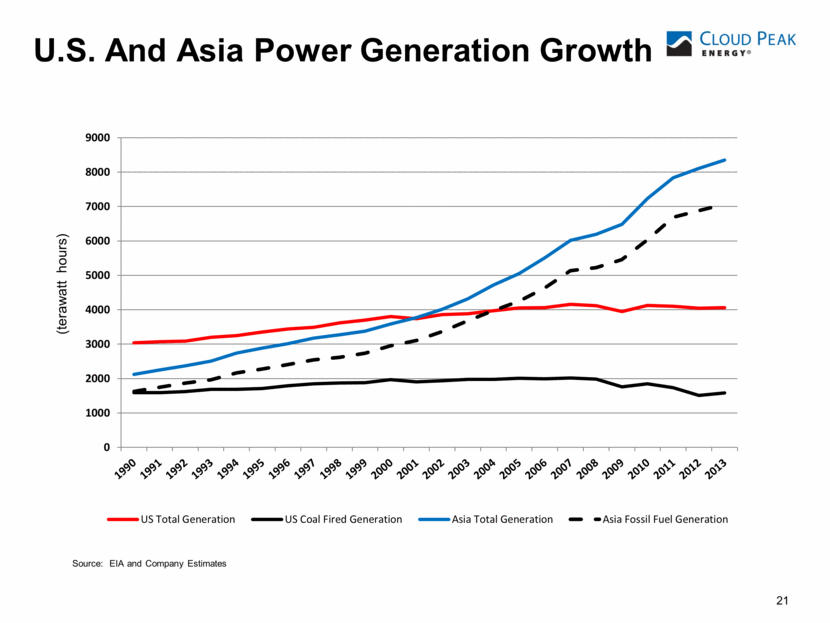
U.S. And Asia Power Generation Growth 21 Source: EIA and Company Estimates (terawatt hours) 0 1000 2000 3000 4000 5000 6000 7000 8000 9000 US Total Generation US Coal Fired Generation Asia Total Generation Asia Fossil Fuel Generation |
|
|
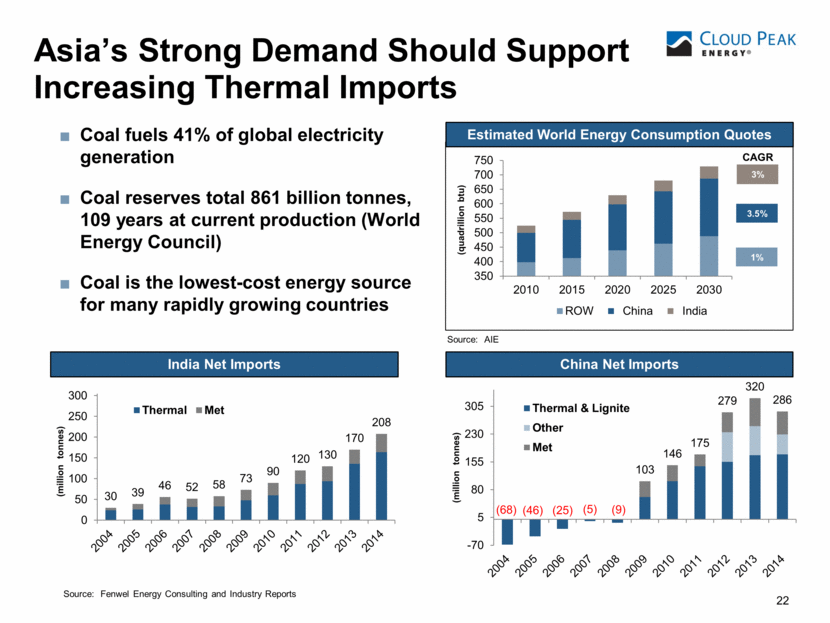
Asia’s Strong Demand Should Support Increasing Thermal Imports 22 China Net Imports Coal fuels 41% of global electricity generation Coal reserves total 861 billion tonnes, 109 years at current production (World Energy Council) Coal is the lowest-cost energy source for many rapidly growing countries Source: Fenwel Energy Consulting and Industry Reports Source: AIE India Net Imports Estimated World Energy Consumption Quotes 30 39 46 52 58 73 90 120 130 170 208 0 50 100 150 200 250 300 (million tonnes ) Thermal Met 350 400 450 500 550 600 650 700 750 2010 2015 2020 2025 2030 (quadrillion btu) ROW China India 3% 1% 3.5% CAGR (68) (46) (25) (5) (9) 103 146 175 279 320 286 -70 5 80 155 230 305 (million tonnes) Thermal & Lignite Other Met |
|
|
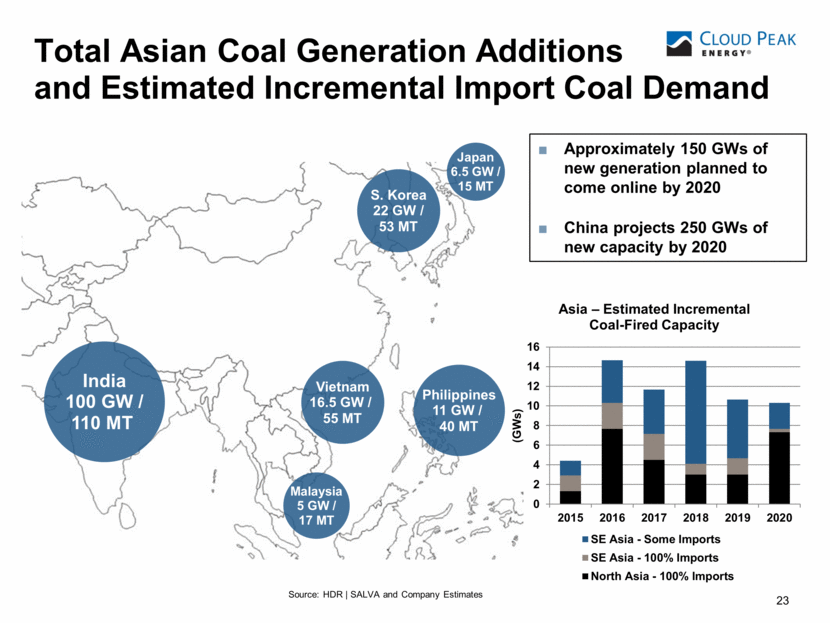
Total Asian Coal Generation Additions and Estimated Incremental Import Coal Demand 23 India 100 GW / 110 MT S. Korea 22 GW / 53 MT Japan 6.5 GW / 15 MT Vietnam 16.5 GW / 55 MT Philippines 11 GW / 40 MT Malaysia 5 GW / 17 MT Approximately 150 GWs of new generation planned to come online by 2020 China projects 250 GWs of new capacity by 2020 Source: HDR SALVA and Company Estimates 0 2 4 6 8 10 12 14 16 2015 2016 2017 2018 2019 2020 (GWs) Asia – Estimated Incremental Coal - Fired Capacity SE Asia - Some Imports SE Asia - 100% Imports North Asia - 100% Imports |
|
|
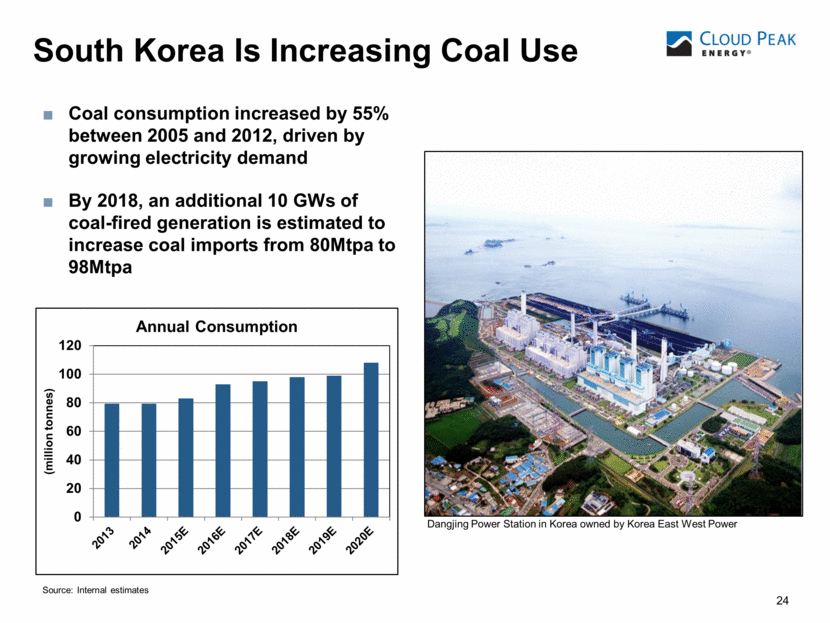
24 South Korea Is Increasing Coal Use Coal consumption increased by 55% between 2005 and 2012, driven by growing electricity demand By 2018, an additional 10 GWs of coal-fired generation is estimated to increase coal imports from 80Mtpa to 98Mtpa Dangjing Power Station in Korea owned by Korea East West Power Source: Internal estimates 0 20 40 60 80 100 120 (million tonnes) Annual Consumption |
|
|
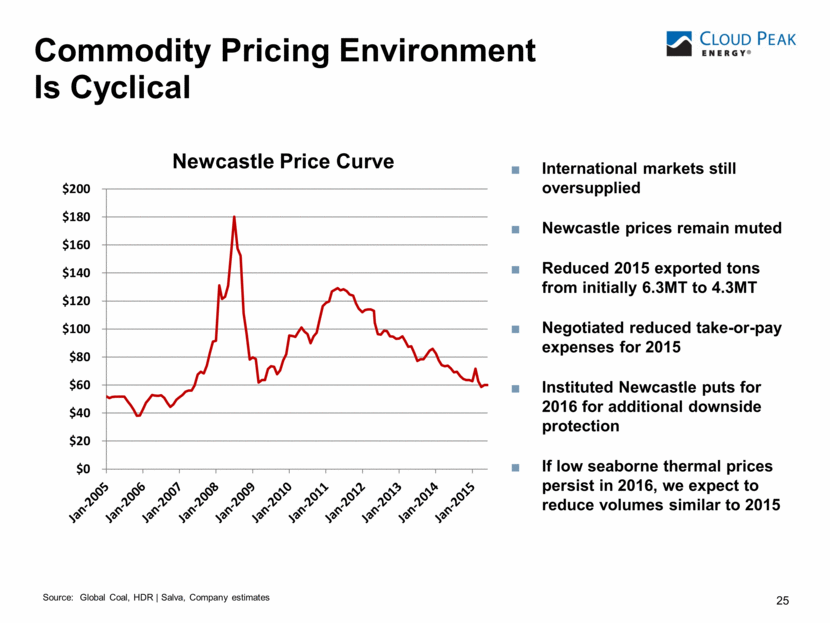
25 Source: Global Coal, HDR Salva, Company estimates International markets still oversupplied Newcastle prices remain muted Reduced 2015 exported tons from initially 6.3MT to 4.3MT Negotiated reduced take-or-pay expenses for 2015 Instituted Newcastle puts for 2016 for additional downside protection If low seaborne thermal prices persist in 2016, we expect to reduce volumes similar to 2015 Newcastle Price Curve Commodity Pricing Environment Is Cyclical $0 $20 $40 $60 $80 $100 $120 $140 $160 $180 $200 |
|
|
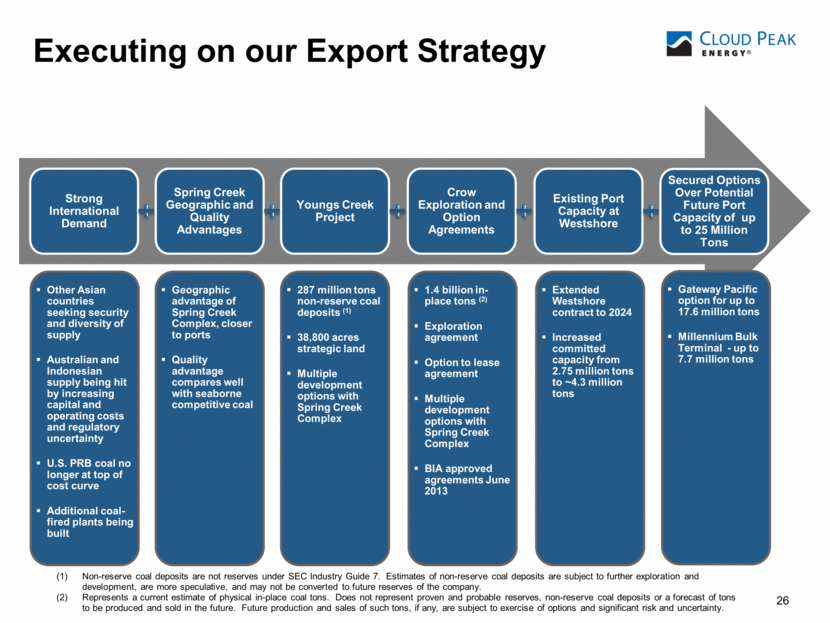
26 Executing on our Export Strategy Strong International Demand Spring Creek Geographic and Quality Advantages Youngs Creek Project Crow Exploration and Option Agreements Existing Port Capacity at Westshore Other Asian countries seeking security and diversity of supply Australian and Indonesian supply being hit by increasing capital and operating costs and regulatory uncertainty U.S. PRB coal no longer at top of cost curve Additional coal-fired plants being built Geographic advantage of Spring Creek Complex, closer to ports Quality advantage compares well with seaborne competitive coal 287 million tons non-reserve coal deposits (1) 38,800 acres strategic land Multiple development options with Spring Creek Complex 1.4 billion in-place tons (2) Exploration agreement Option to lease agreement Multiple development options with Spring Creek Complex BIA approved agreements June 2013 Extended Westshore contract to 2024 Increased committed capacity from 2.75 million tons to ~4.3 million tons (1) Non-reserve coal deposits are not reserves under SEC Industry Guide 7. Estimates of non-reserve coal deposits are subject to further exploration and development, are more speculative, and may not be converted to future reserves of the company. (2) Represents a current estimate of physical in-place coal tons. Does not represent proven and probable reserves, non-reserve coal deposits or a forecast of tons to be produced and sold in the future. Future production and sales of such tons, if any, are subject to exercise of options and significant risk and uncertainty. Secured Options Over Potential Future Port Capacity of up to 25 Million Tons Gateway Pacific option for up to 17.6 million tons Millennium Bulk Terminal - up to 7.7 million tons |
|
|
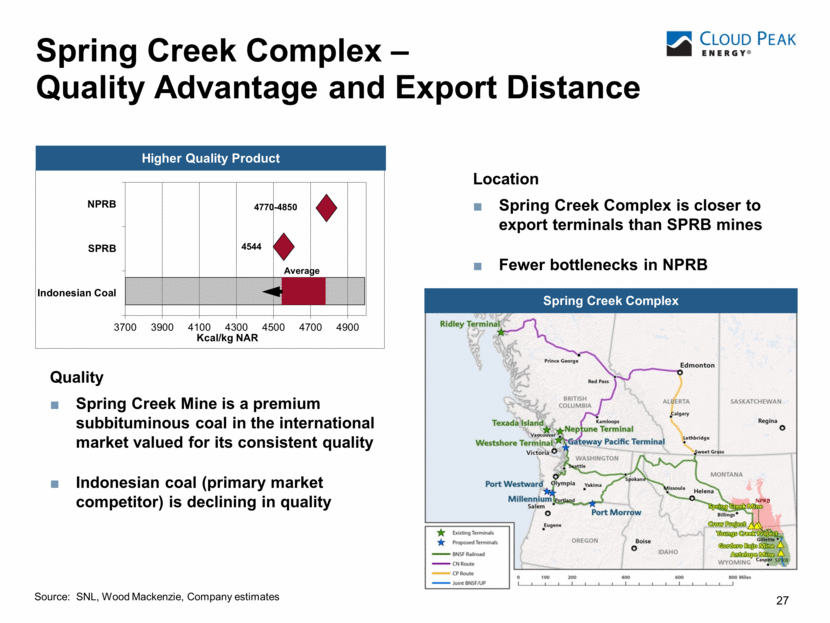
Spring Creek Complex – Quality Advantage and Export Distance 27 27 4770-4850 4544 Average Source: SNL, Wood Mackenzie, Company estimates Higher Quality Product Spring Creek Complex Location Spring Creek Complex is closer to export terminals than SPRB mines Fewer bottlenecks in NPRB Quality Spring Creek Mine is a premium subbituminous coal in the international market valued for its consistent quality Indonesian coal (primary market competitor) is declining in quality |
|
|
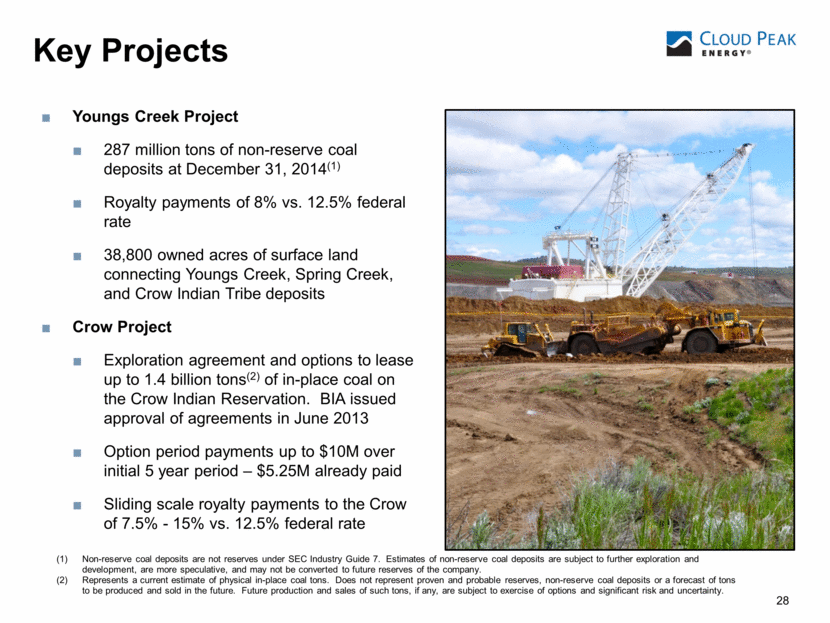
Key Projects 28 Youngs Creek Project 287 million tons of non-reserve coal deposits at December 31, 2014(1) Royalty payments of 8% vs. 12.5% federal rate 38,800 owned acres of surface land connecting Youngs Creek, Spring Creek, and Crow Indian Tribe deposits Crow Project Exploration agreement and options to lease up to 1.4 billion tons(2) of in-place coal on the Crow Indian Reservation. BIA issued approval of agreements in June 2013 Option period payments up to $10M over initial 5 year period – $5.25M already paid Sliding scale royalty payments to the Crow of 7.5% - 15% vs. 12.5% federal rate 28 (1) Non-reserve coal deposits are not reserves under SEC Industry Guide 7. Estimates of non-reserve coal deposits are subject to further exploration and development, are more speculative, and may not be converted to future reserves of the company. (2) Represents a current estimate of physical in-place coal tons. Does not represent proven and probable reserves, non-reserve coal deposits or a forecast of tons to be produced and sold in the future. Future production and sales of such tons, if any, are subject to exercise of options and significant risk and uncertainty. |
|
|
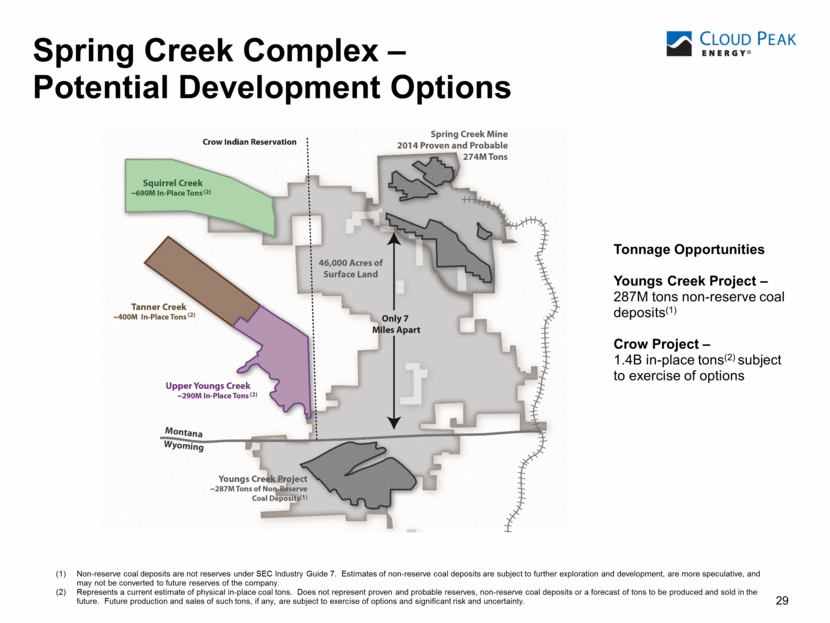
29 Spring Creek Complex – Potential Development Options (1) Non-reserve coal deposits are not reserves under SEC Industry Guide 7. Estimates of non-reserve coal deposits are subject to further exploration and development, are more speculative, and may not be converted to future reserves of the company. (2) Represents a current estimate of physical in-place coal tons. Does not represent proven and probable reserves, non-reserve coal deposits or a forecast of tons to be produced and sold in the future. Future production and sales of such tons, if any, are subject to exercise of options and significant risk and uncertainty. Tonnage Opportunities Youngs Creek Project – 287M tons non-reserve coal deposits(1) Crow Project – 1.4B in-place tons(2) subject to exercise of options |
|
|
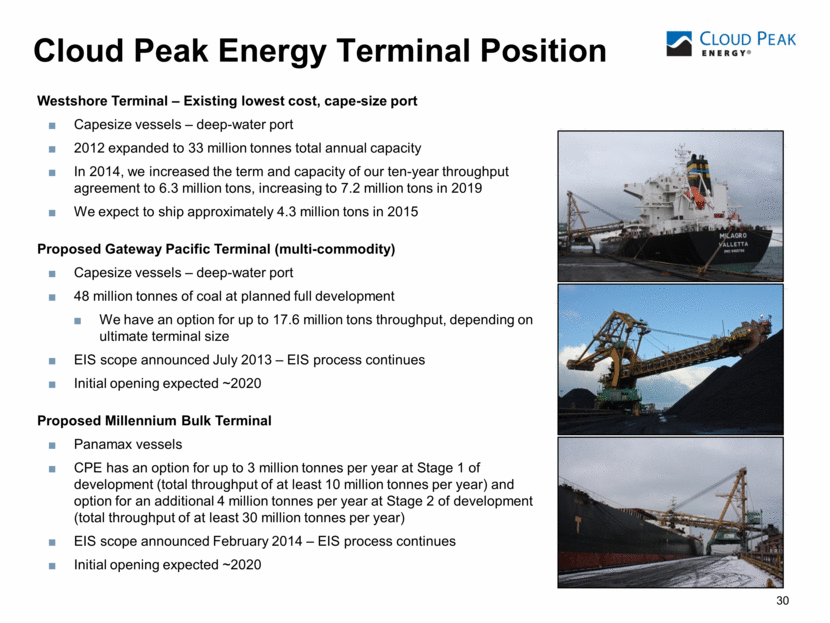
30 Cloud Peak Energy Terminal Position 30 30 Westshore Terminal – Existing lowest cost, cape-size port Capesize vessels – deep-water port 2012 expanded to 33 million tonnes total annual capacity In 2014, we increased the term and capacity of our ten-year throughput agreement to 6.3 million tons, increasing to 7.2 million tons in 2019 We expect to ship approximately 4.3 million tons in 2015 Proposed Gateway Pacific Terminal (multi-commodity) Capesize vessels – deep-water port 48 million tonnes of coal at planned full development We have an option for up to 17.6 million tons throughput, depending on ultimate terminal size EIS scope announced July 2013 – EIS process continues Initial opening expected ~2020 Proposed Millennium Bulk Terminal Panamax vessels CPE has an option for up to 3 million tonnes per year at Stage 1 of development (total throughput of at least 10 million tonnes per year) and option for an additional 4 million tonnes per year at Stage 2 of development (total throughput of at least 30 million tonnes per year) EIS scope announced February 2014 – EIS process continues Initial opening expected ~2020 |
|
|
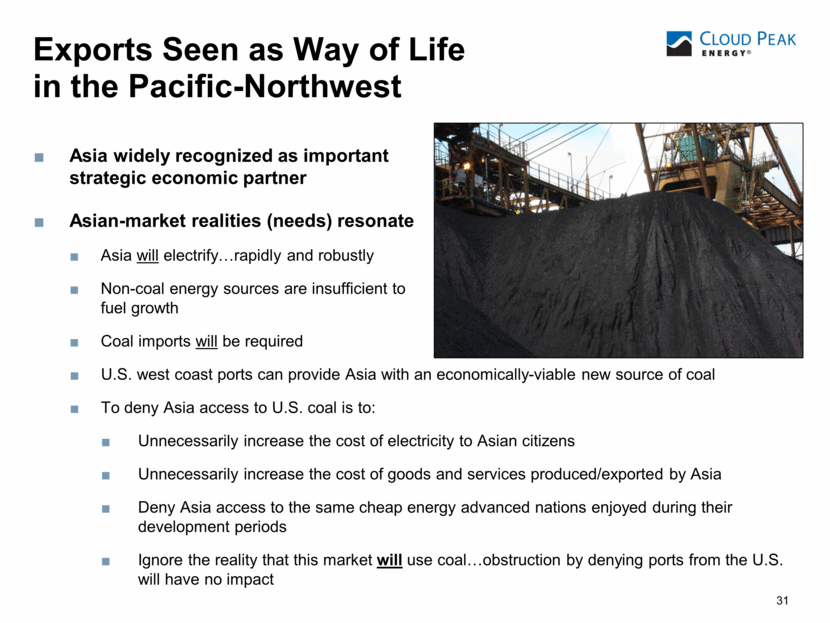
Exports Seen as Way of Life in the Pacific-Northwest Asia widely recognized as important strategic economic partner Asian-market realities (needs) resonate Asia will electrify rapidly and robustly Non-coal energy sources are insufficient to fuel growth Coal imports will be required 31 U.S. west coast ports can provide Asia with an economically-viable new source of coal To deny Asia access to U.S. coal is to: Unnecessarily increase the cost of electricity to Asian citizens Unnecessarily increase the cost of goods and services produced/exported by Asia Deny Asia access to the same cheap energy advanced nations enjoyed during their development periods Ignore the reality that this market will use coal obstruction by denying ports from the U.S. will have no impact |
|
|
32 32 Appendix 32 |
|
|
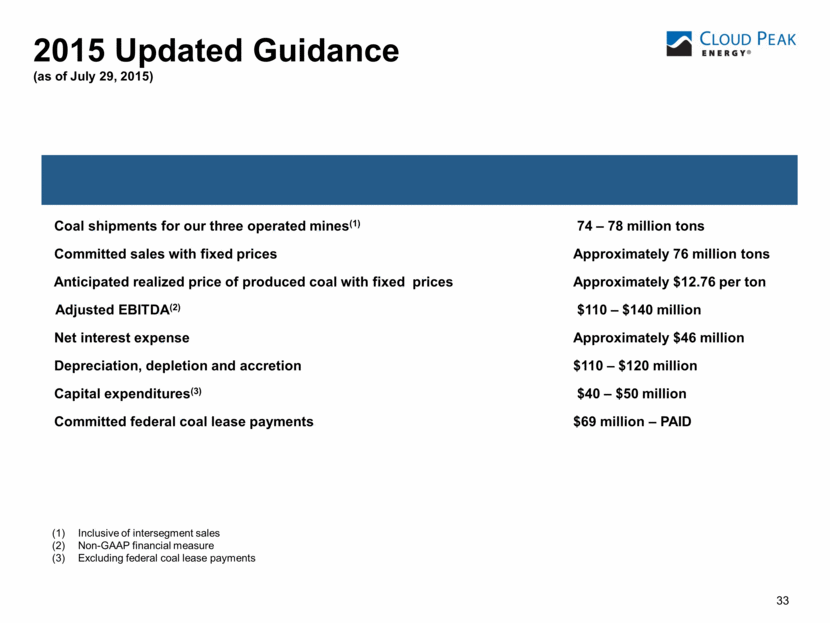
33 2015 Updated Guidance (as of July 29, 2015) Inclusive of intersegment sales Non-GAAP financial measure (3) Excluding federal coal lease payments Coal shipments for our three operated mines(1) 74 – 78 million tons Committed sales with fixed prices Approximately 76 million tons Anticipated realized price of produced coal with fixed prices Approximately $12.76 per ton Adjusted EBITDA(2) $110 – $140 million Net interest expense Approximately $46 million Depreciation, depletion and accretion $110 – $120 million Capital expenditures(3) $40 – $50 million Committed federal coal lease payments $69 million – PAID |
|
|
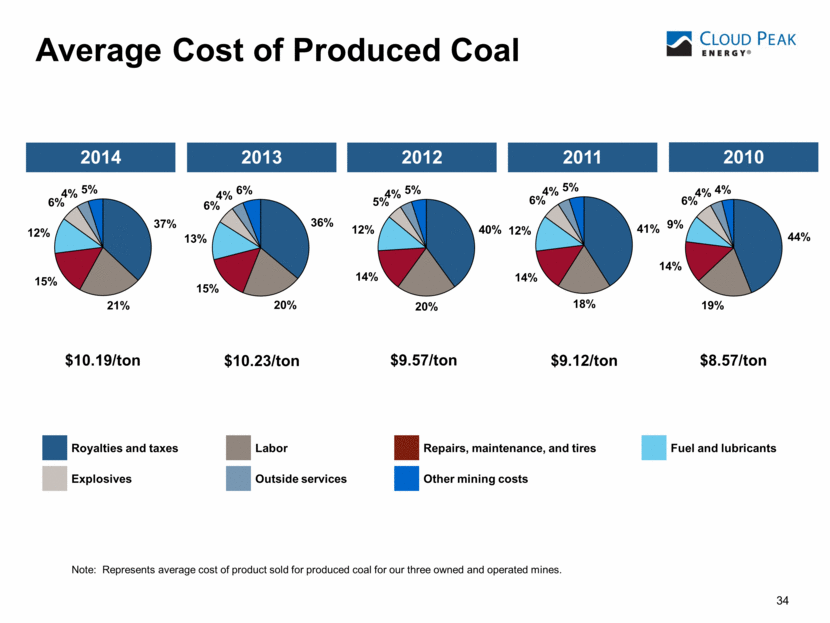
34 Average Cost of Produced Coal Note: Represents average cost of product sold for produced coal for our three owned and operated mines. $10.23/ton $9.57/ton 2012 2013 2011 $9.12/ton 2014 $10.19/ton Royalties and taxes Labor Repairs, maintenance, and tires Fuel and lubricants Explosives Outside services Other mining costs 2010 $8.57/ton 36% 20% 15% 13% 6% 4% 6% 40% 20% 14% 12% 5% 4% 5% 41% 18% 14% 12% 6% 4% 5% 37% 21% 15% 12% 6% 4% 5% 44% 19% 14% 9% 6% 4% 4% |
|
|
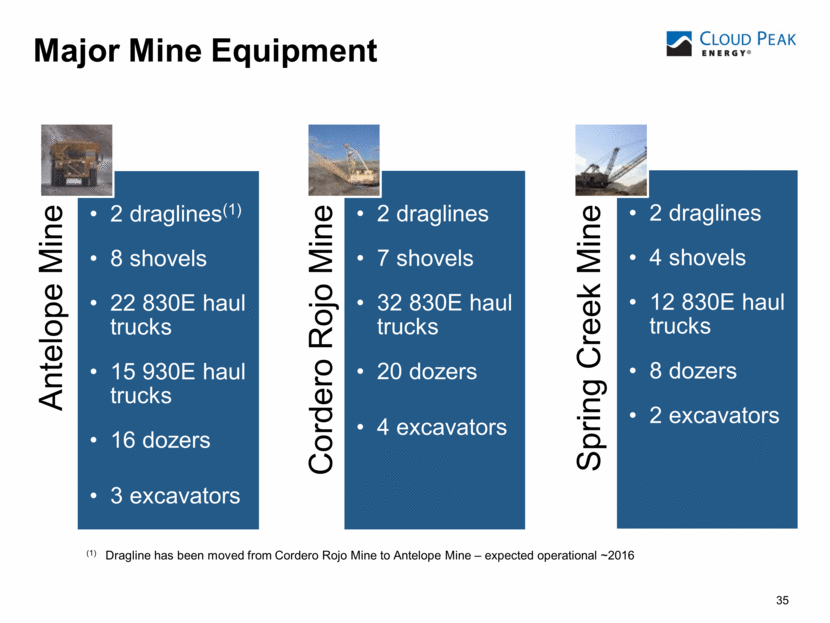
Major Mine Equipment 35 35 Confidential; Non-Public Information; Not for Disclosure 35 (1) Dragline has been moved from Cordero Rojo Mine to Antelope Mine – expected operational ~2016 Antelope Mine 2 draglines(1) 8 shovels 22 830E haul trucks 15 930E haul trucks 16 dozers 3 excavators Cordero Rojo Mine 2 draglines 7 shovels 32 830E haul trucks 20 dozers 4 excavators Spring Creek Mine 2 draglines 4 shovels 12 830E haul trucks 8 dozers 2 excavators |
|
|
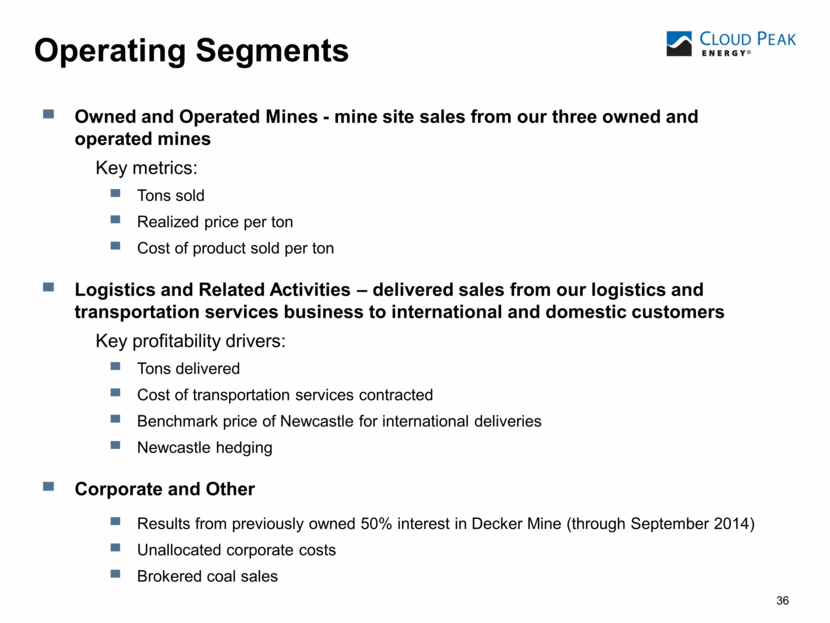
Operating Segments 36 Owned and Operated Mines - mine site sales from our three owned and operated mines Key metrics: Tons sold Realized price per ton Cost of product sold per ton Logistics and Related Activities – delivered sales from our logistics and transportation services business to international and domestic customers Key profitability drivers: Tons delivered Cost of transportation services contracted Benchmark price of Newcastle for international deliveries Newcastle hedging Corporate and Other Results from previously owned 50% interest in Decker Mine (through September 2014) Unallocated corporate costs Brokered coal sales |
|
|
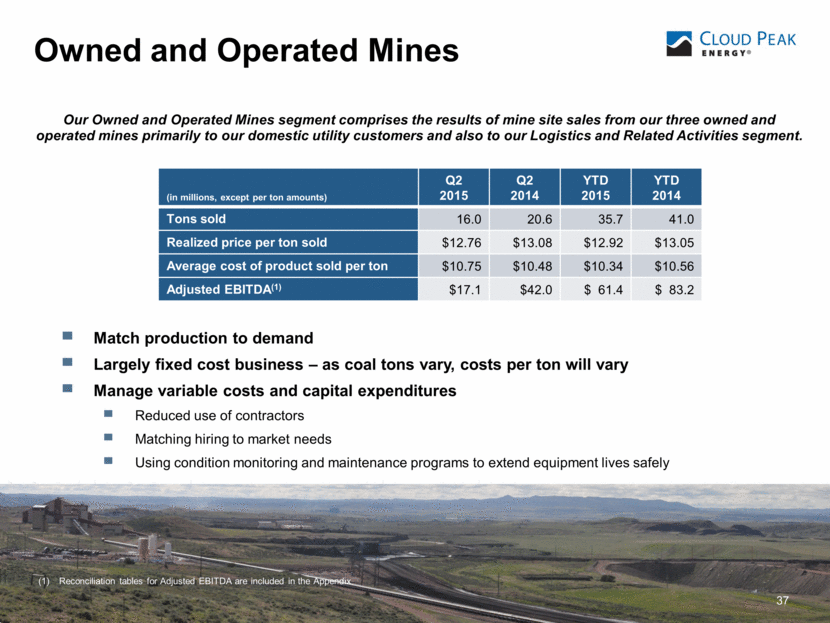
Owned and Operated Mines 37 Our Owned and Operated Mines segment comprises the results of mine site sales from our three owned and operated mines primarily to our domestic utility customers and also to our Logistics and Related Activities segment. Match production to demand Largely fixed cost business – as coal tons vary, costs per ton will vary Manage variable costs and capital expenditures Reduced use of contractors Matching hiring to market needs Using condition monitoring and maintenance programs to extend equipment lives safely (1) Reconciliation tables for Adjusted EBITDA are included in the Appendix (in millions, except per ton amounts) Q2 2015 Q2 2014 YTD 2015 YTD 2014 Tons sold 16.0 20.6 35.7 41.0 Realized price per ton sold $12.76 $13.08 $12.92 $13.05 Average cost of product sold per ton $10.75 $10.48 $10.34 $10.56 Adjusted EBITDA(1) $17.1 $42.0 $ 61.4 $ 83.2 |
|
|
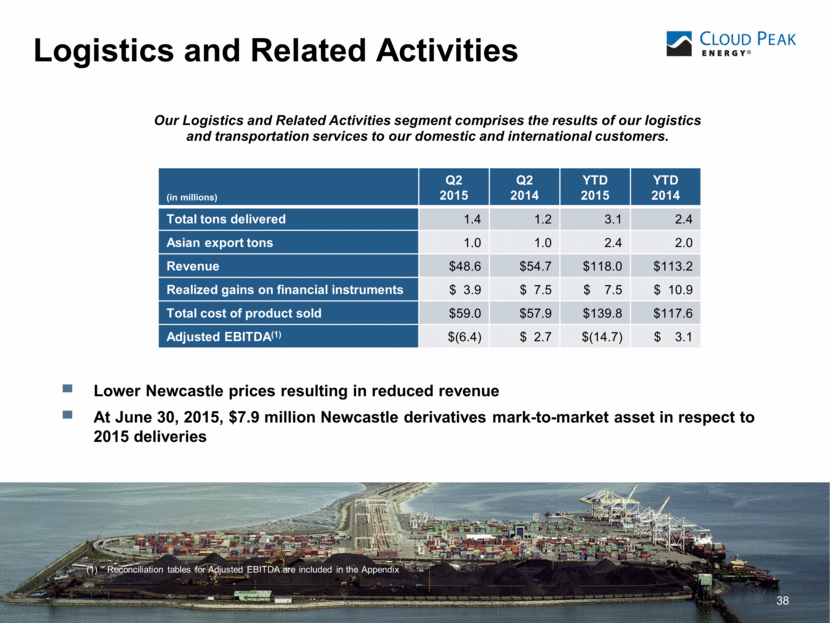
Logistics and Related Activities 38 Our Logistics and Related Activities segment comprises the results of our logistics and transportation services to our domestic and international customers. Lower Newcastle prices resulting in reduced revenue At June 30, 2015, $7.9 million Newcastle derivatives mark-to-market asset in respect to 2015 deliveries (1) Reconciliation tables for Adjusted EBITDA are included in the Appendix (in millions) Q2 2015 Q2 2014 YTD 2015 YTD 2014 Total tons delivered 1.4 1.2 3.1 2.4 Asian export tons 1.0 1.0 2.4 2.0 Revenue $48.6 $54.7 $118.0 $113.2 Realized gains on financial instruments $ 3.9 $ 7.5 $ 7.5 $ 10.9 Total cost of product sold $59.0 $57.9 $139.8 $117.6 Adjusted EBITDA(1) $(6.4) $ 2.7 $(14.7) $ 3.1 |
|
|
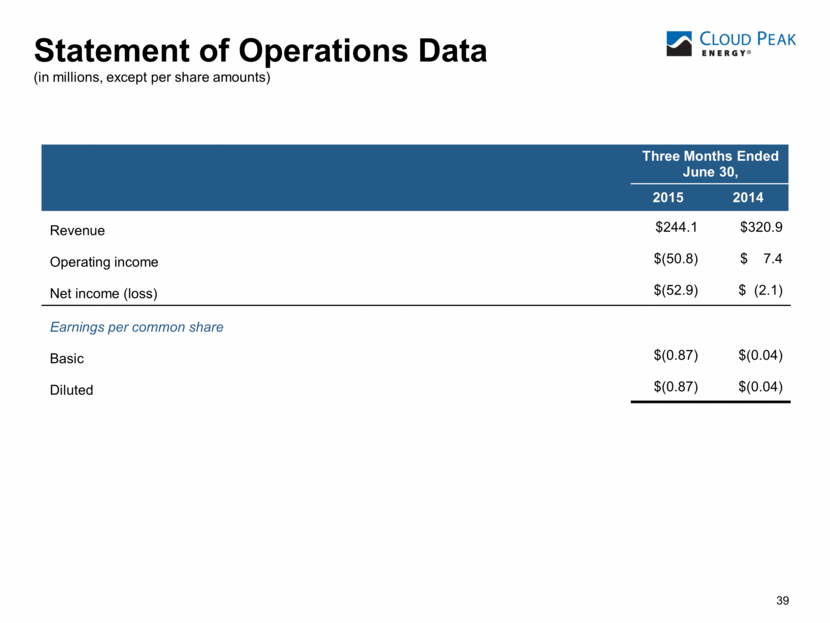
39 Statement of Operations Data (in millions, except per share amounts) Three Months Ended June 30, 2015 2014 Revenue $244.1 $320.9 Operating income $(50.8) $ 7.4 Net income (loss) $(52.9) $ (2.1) Earnings per common share Basic $(0.87) $(0.04) Diluted $(0.87) $(0.04) |
|
|
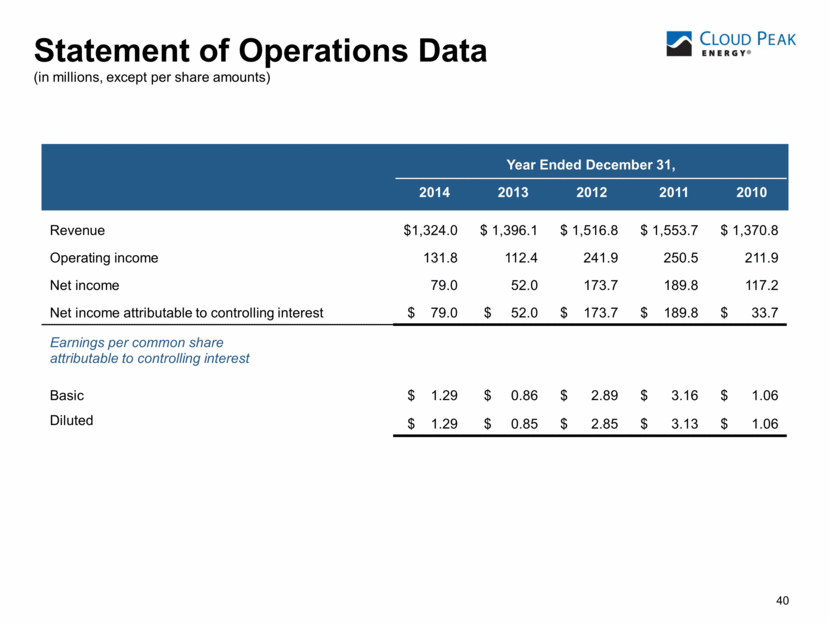
40 Statement of Operations Data (in millions, except per share amounts) Revenue $1,324.0 $ 1,396.1 $ 1,516.8 $ 1,553.7 $ 1,370.8 Operating income 131.8 112.4 241.9 250.5 211.9 Net income 79.0 52.0 173.7 189.8 117.2 Net income attributable to controlling interest $ 79.0 $ 52.0 $ 173.7 $ 189.8 $ 33.7 Earnings per common share attributable to controlling interest Basic $ 1.29 $ 0.86 $ 2.89 $ 3.16 $ 1.06 Diluted $ 1.29 $ 0.85 $ 2.85 $ 3.13 $ 1.06 Year Ended December 31, 2014 2013 2012 2011 2010 |
|
|
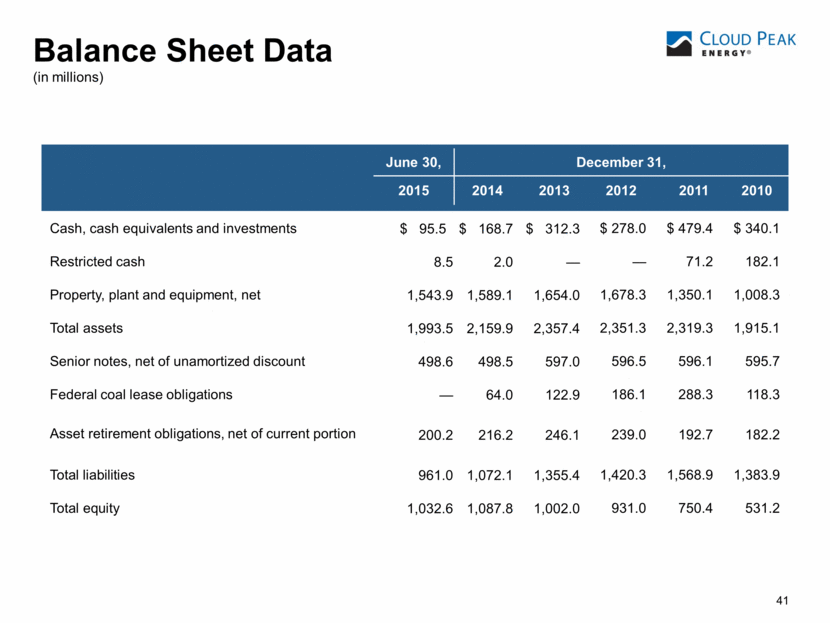
41 Balance Sheet Data (in millions) Cash, cash equivalents and investments $ 95.5 $ 168.7 $ 312.3 $ 278.0 $ 479.4 $ 340.1 Restricted cash 8.5 2.0 — — 71.2 182.1 Property, plant and equipment, net 1,543.9 1,589.1 1,654.0 1,678.3 1,350.1 1,008.3 Total assets 1,993.5 2,159.9 2,357.4 2,351.3 2,319.3 1,915.1 Senior notes, net of unamortized discount 498.6 498.5 597.0 596.5 596.1 595.7 Federal coal lease obligations — 64.0 122.9 186.1 288.3 118.3 Asset retirement obligations, net of current portion 200.2 216.2 246.1 239.0 192.7 182.2 Total liabilities 961.0 1,072.1 1,355.4 1,420.3 1,568.9 1,383.9 Total equity 1,032.6 1,087.8 1,002.0 931.0 750.4 531.2 June 30, December 31, 2015 2014 2013 2012 2011 2010 |
|
|
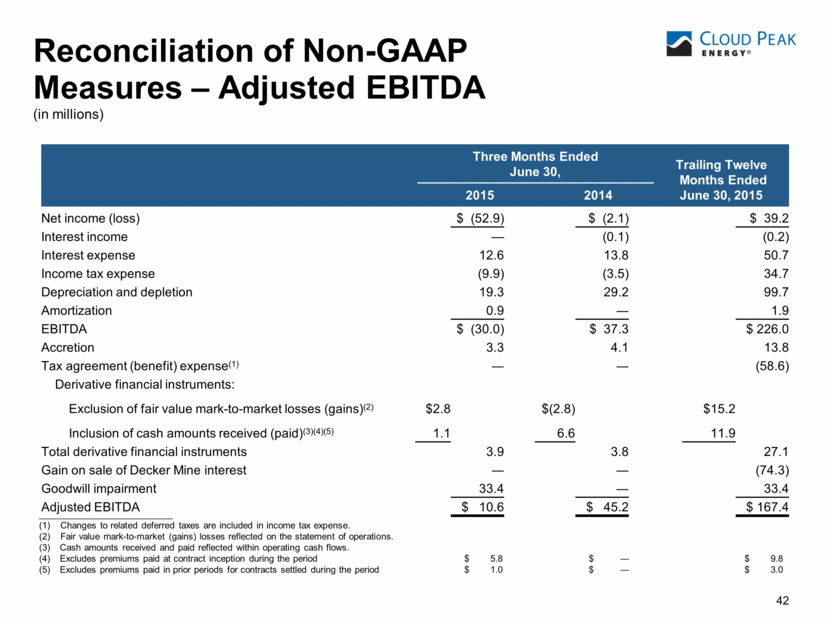
42 Reconciliation of Non-GAAP Measures – Adjusted EBITDA (in millions) __________________________ (1) Changes to related deferred taxes are included in income tax expense. (2) Fair value mark-to-market (gains) losses reflected on the statement of operations. Cash amounts received and paid reflected within operating cash flows. Excludes premiums paid at contract inception during the period $ 5.8 $ — $ 9.8 Excludes premiums paid in prior periods for contracts settled during the period $ 1.0 $ — $ 3.0 Net income (loss) $ (52.9) $ (2.1) $ 39.2 Interest income — (0.1) (0.2) Interest expense 12.6 13.8 50.7 Income tax expense (9.9) (3.5) 34.7 Depreciation and depletion 19.3 29.2 99.7 Amortization 0.9 — 1.9 EBITDA $ (30.0) $ 37.3 $ 226.0 Accretion 3.3 4.1 13.8 Tax agreement (benefit) expense(1) — — (58.6) Derivative financial instruments: Exclusion of fair value mark-to-market losses (gains)(2) $2.8 $(2.8) $15.2 Inclusion of cash amounts received (paid)(3)(4)(5) 1.1 6.6 11.9 Total derivative financial instruments 3.9 3.8 27.1 Gain on sale of Decker Mine interest — — (74.3) Goodwill impairment 33.4 — 33.4 Adjusted EBITDA $ 10.6 $ 45.2 $ 167.4 Three Months Ended June 30, Trailing Twelve Months Ended June 30, 2015 2015 2014 |
|
|
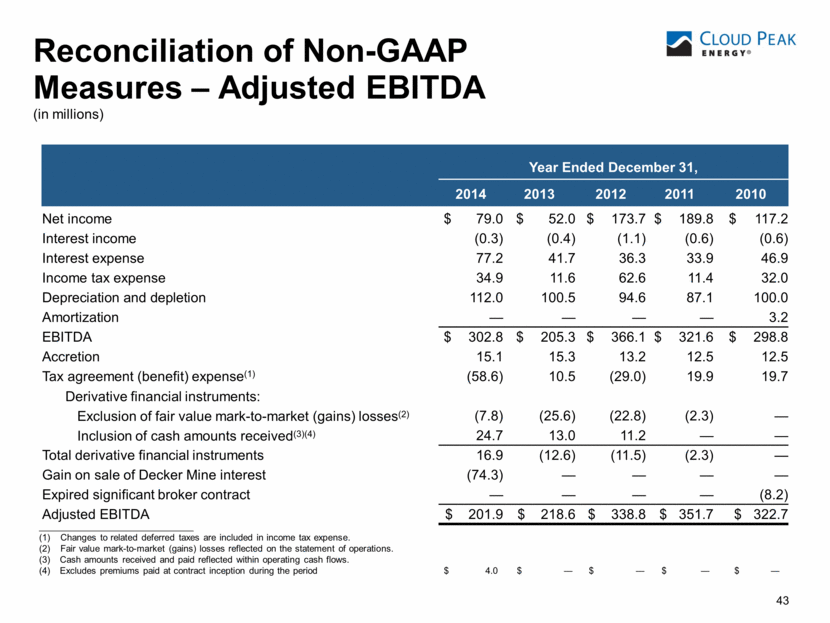
43 Reconciliation of Non-GAAP Measures – Adjusted EBITDA (in millions) Year Ended December 31, 2014 2013 2012 2011 2010 Net income $ 79.0 $ 52.0 $ 173.7 $ 189.8 $ 117.2 Interest income (0.3) (0.4) (1.1) (0.6) (0.6) Interest expense 77.2 41.7 36.3 33.9 46.9 Income tax expense 34.9 11.6 62.6 11.4 32.0 Depreciation and depletion 112.0 100.5 94.6 87.1 100.0 Amortization — — — — 3.2 EBITDA $ 302.8 $ 205.3 $ 366.1 $ 321.6 $ 298.8 Accretion 15.1 15.3 13.2 12.5 12.5 Tax agreement (benefit) expense(1) (58.6) 10.5 (29.0) 19.9 19.7 Derivative financial instruments: Exclusion of fair value mark-to-market (gains) losses(2) (7.8) (25.6) (22.8) (2.3) — Inclusion of cash amounts received(3)(4) 24.7 13.0 11.2 — — Total derivative financial instruments 16.9 (12.6) (11.5) (2.3) — Gain on sale of Decker Mine interest (74.3) — — — — Expired significant broker contract — — — — (8.2) Adjusted EBITDA $ 201.9 $ 218.6 $ 338.8 $ 351.7 $ 322.7 ______________________________ (1) Changes to related deferred taxes are included in income tax expense. (2) Fair value mark-to-market (gains) losses reflected on the statement of operations. Cash amounts received and paid reflected within operating cash flows. Excludes premiums paid at contract inception during the period $ 4.0 $ — $ — $ — $ — |
|
|
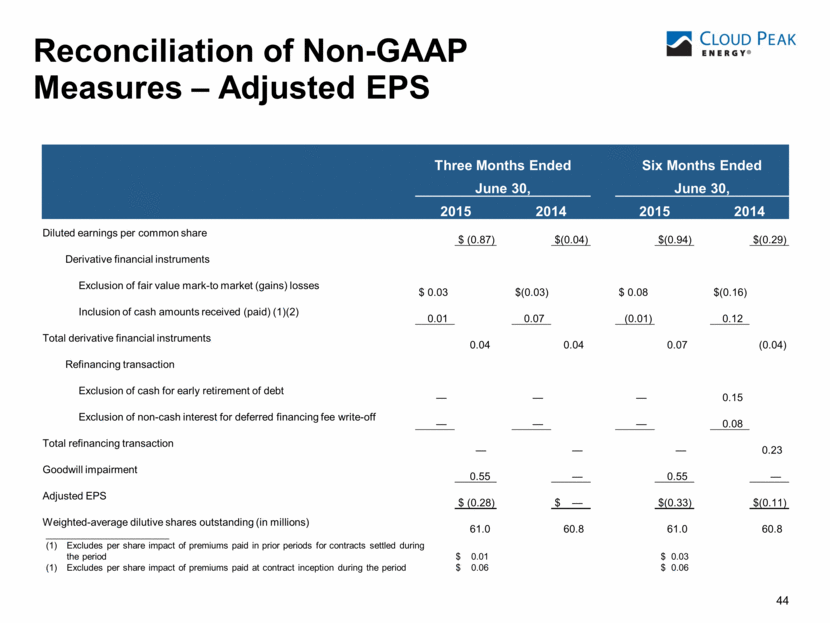
44 Reconciliation of Non-GAAP Measures – Adjusted EPS ________________________ Excludes per share impact of premiums paid in prior periods for contracts settled during the period $ 0.01 $ 0.03 Excludes per share impact of premiums paid at contract inception during the period $ 0.06 $ 0.06 Three Months Ended Six Months Ended June 30, June 30, 2015 2014 2015 2014 Diluted earnings per common share $ (0.87) $(0.04) $(0.94) $(0.29) Derivative financial instruments Exclusion of fair value mark-to market (gains) losses $ 0.03 $(0.03) $ 0.08 $(0.16) Inclusion of cash amounts received (paid) (1)(2) 0.01 0.07 (0.01) 0.12 Total derivative financial instruments 0.04 0.04 0.07 (0.04) Refinancing transaction Exclusion of cash for early retirement of debt — — — 0.15 Exclusion of non-cash interest for deferred financing fee write-off — — — 0.08 Total refinancing transaction — — — 0.23 Goodwill impairment 0.55 — 0.55 — Adjusted EPS $ (0.28) $ — $(0.33) $(0.11) Weighted-average dilutive shares outstanding (in millions) 61.0 60.8 61.0 60.8 |
|
|
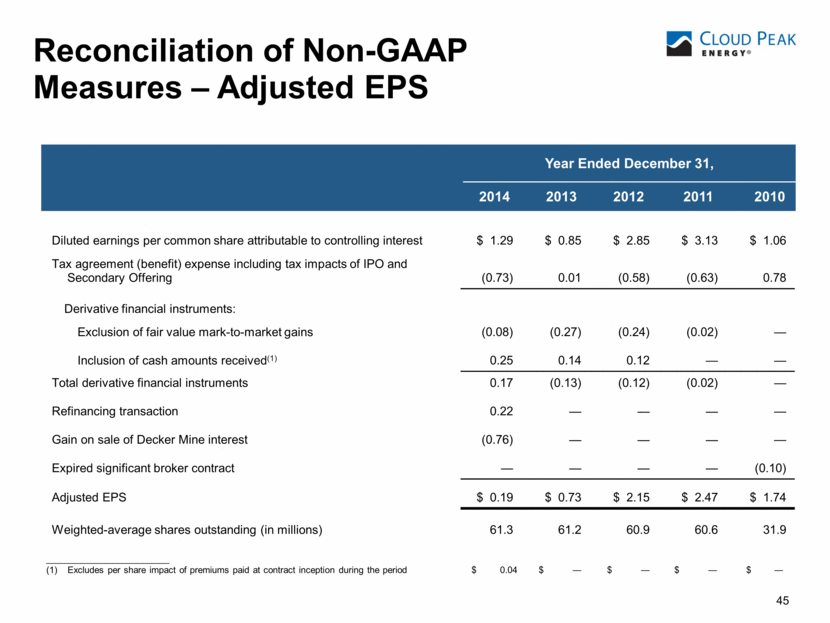
45 Diluted earnings per common share attributable to controlling interest $ 1.29 $ 0.85 $ 2.85 $ 3.13 $ 1.06 Tax agreement (benefit) expense including tax impacts of IPO and Secondary Offering (0.73) 0.01 (0.58) (0.63) 0.78 Derivative financial instruments: Exclusion of fair value mark-to-market gains (0.08) (0.27) (0.24) (0.02) — Inclusion of cash amounts received(1) 0.25 0.14 0.12 — — Total derivative financial instruments 0.17 (0.13) (0.12) (0.02) — Refinancing transaction 0.22 — — — — Gain on sale of Decker Mine interest (0.76) — — — — Expired significant broker contract — — — — (0.10) Adjusted EPS $ 0.19 $ 0.73 $ 2.15 $ 2.47 $ 1.74 Weighted-average shares outstanding (in millions) 61.3 61.2 60.9 60.6 31.9 Reconciliation of Non-GAAP Measures – Adjusted EPS Year Ended December 31, 2014 2013 2012 2011 2010 ________________________ (1) Excludes per share impact of premiums paid at contract inception during the period $ 0.04 $ — $ — $ — $ — |
|
|
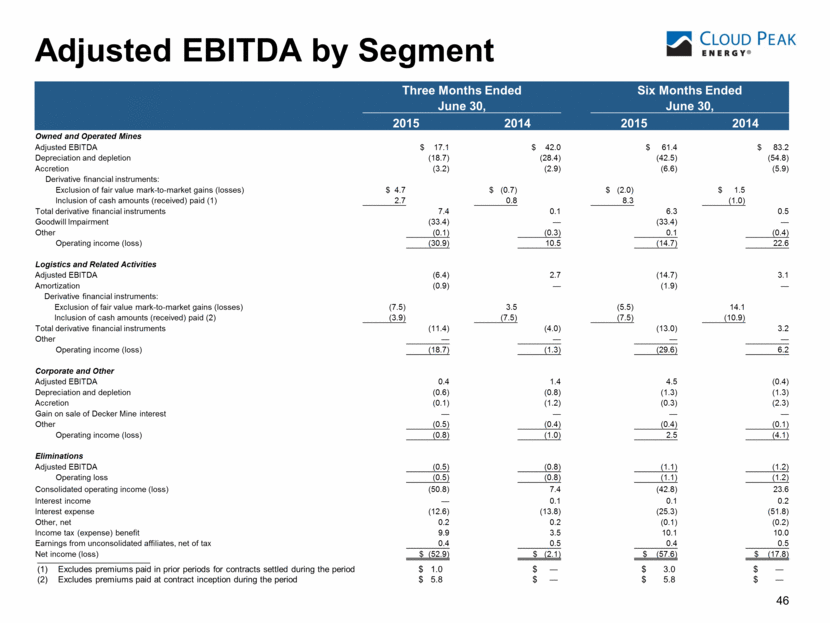
Adjusted EBITDA by Segment ________________________ Excludes premiums paid in prior periods for contracts settled during the period $ 1.0 $ — $ 3.0 $ — Excludes premiums paid at contract inception during the period $ 5.8 $ — $ 5.8 $ — 46 Three Months Ended Six Months Ended June 30, June 30, 2015 2014 2015 2014 Owned and Operated Mines Adjusted EBITDA $ 17.1 $ 42.0 $ 61.4 $ 83.2 Depreciation and depletion (18.7) (28.4) (42.5) (54.8) Accretion (3.2) (2.9) (6.6) (5.9) Derivative financial instruments: Exclusion of fair value mark-to-market gains (losses) $ 4.7 $ (0.7) $ (2.0) $ 1.5 Inclusion of cash amounts (received) paid (1) 2.7 0.8 8.3 (1.0) Total derivative financial instruments 7.4 0.1 6.3 0.5 Goodwill Impairment (33.4) — (33.4) — Other (0.1) (0.3) 0.1 (0.4) Operating income (loss) (30.9) 10.5 (14.7) 22.6 Logistics and Related Activities Adjusted EBITDA (6.4) 2.7 (14.7) 3.1 Amortization (0.9) — (1.9) — Derivative financial instruments: Exclusion of fair value mark-to-market gains (losses) (7.5) 3.5 (5.5) 14.1 Inclusion of cash amounts (received) paid (2) (3.9) (7.5) (7.5) (10.9) Total derivative financial instruments (11.4) (4.0) (13.0) 3.2 Other — — — — Operating income (loss) (18.7) (1.3) (29.6) 6.2 Corporate and Other Adjusted EBITDA 0.4 1.4 4.5 (0.4) Depreciation and depletion (0.6) (0.8) (1.3) (1.3) Accretion (0.1) (1.2) (0.3) (2.3) Gain on sale of Decker Mine interest — — — — Other (0.5) (0.4) (0.4) (0.1) Operating income (loss) (0.8) (1.0) 2.5 (4.1) Eliminations Adjusted EBITDA (0.5) (0.8) (1.1) (1.2) Operating loss (0.5) (0.8) (1.1) (1.2) Consolidated operating income (loss) (50.8) 7.4 (42.8) 23.6 Interest income — 0.1 0.1 0.2 Interest expense (12.6) (13.8) (25.3) (51.8) Other, net 0.2 0.2 (0.1) (0.2) Income tax (expense) benefit 9.9 3.5 10.1 10.0 Earnings from unconsolidated affiliates, net of tax 0.4 0.5 0.4 0.5 Net income (loss) $ (52.9) $ (2.1) $ (57.6) $ (17.8) |
|
|
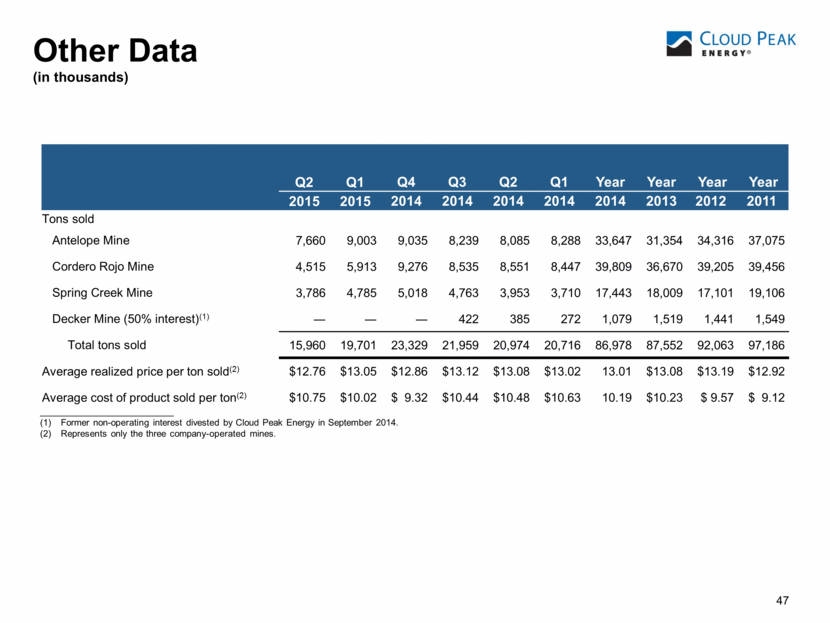
47 __________________________ Former non-operating interest divested by Cloud Peak Energy in September 2014. Represents only the three company-operated mines. Q2 Q1 Q4 Q3 Q2 Q1 Year Year Year Year 2015 2015 2014 2014 2014 2014 2014 2013 2012 2011 Tons sold Antelope Mine 7,660 9,003 9,035 8,239 8,085 8,288 33,647 31,354 34,316 37,075 Cordero Rojo Mine 4,515 5,913 9,276 8,535 8,551 8,447 39,809 36,670 39,205 39,456 Spring Creek Mine 3,786 4,785 5,018 4,763 3,953 3,710 17,443 18,009 17,101 19,106 Decker Mine (50% interest)(1) — — — 422 385 272 1,079 1,519 1,441 1,549 Total tons sold 15,960 19,701 23,329 21,959 20,974 20,716 86,978 87,552 92,063 97,186 Average realized price per ton sold(2) $12.76 $13.05 $12.86 $13.12 $13.08 $13.02 13.01 $13.08 $13.19 $12.92 Average cost of product sold per ton(2) $10.75 $10.02 $ 9.32 $10.44 $10.48 $10.63 10.19 $10.23 $ 9.57 $ 9.12 Other Data (in thousands) |
|
|
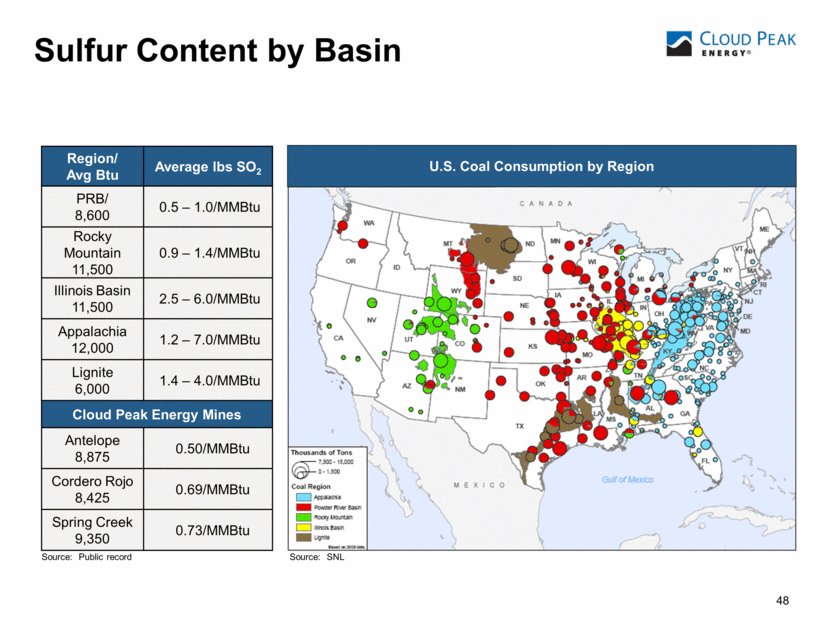
48 48 48 Sulfur Content by Basin 48 Source: SNL U.S. Coal Consumption by Region Region/ Avg Btu Average lbs SO2 PRB/ 8,600 0.5 – 1.0/MMBtu Rocky Mountain 11,500 0.9 – 1.4/MMBtu Illinois Basin 11,500 2.5 – 6.0/MMBtu Appalachia 12,000 1.2 – 7.0/MMBtu Lignite 6,000 1.4 – 4.0/MMBtu Cloud Peak Energy Mines Antelope 8,875 0.50/MMBtu Cordero Rojo 8,425 0.69/MMBtu Spring Creek 9,350 0.73/MMBtu Source: Public record |
|
|
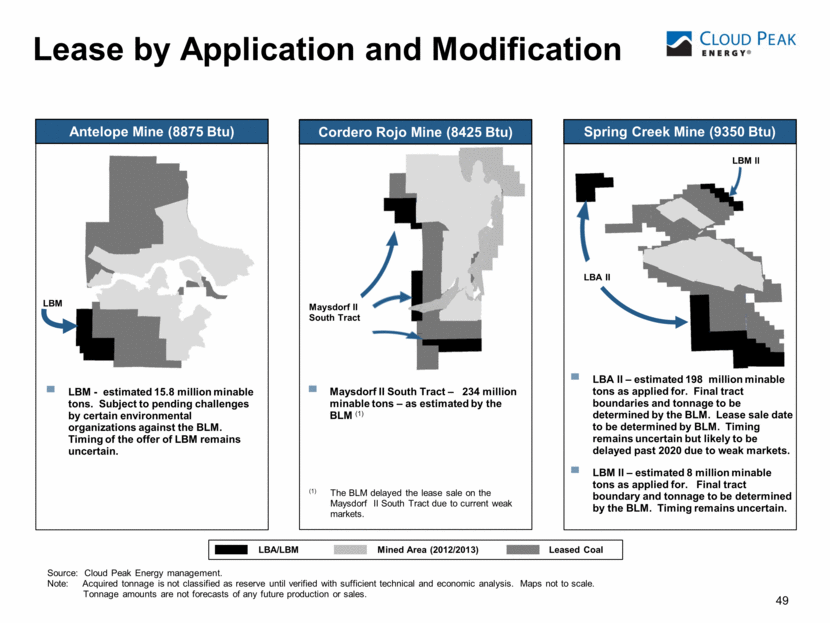
49 Lease by Application and Modification Source: Cloud Peak Energy management. Note: Acquired tonnage is not classified as reserve until verified with sufficient technical and economic analysis. Maps not to scale. Tonnage amounts are not forecasts of any future production or sales. LBA/LBM Mined Area (2012/2013) Leased Coal LBM - estimated 15.8 million minable tons. Subject to pending challenges by certain environmental organizations against the BLM. Timing of the offer of LBM remains uncertain. Antelope Mine (8875 Btu) LBM LBA II – estimated 198 million minable tons as applied for. Final tract boundaries and tonnage to be determined by the BLM. Lease sale date to be determined by BLM. Timing remains uncertain but likely to be delayed past 2020 due to weak markets. LBM II – estimated 8 million minable tons as applied for. Final tract boundary and tonnage to be determined by the BLM. Timing remains uncertain. LBA II Spring Creek Mine (9350 Btu) LBM ll Cordero Rojo Mine (8425 Btu) Maysdorf II South Tract – 234 million minable tons – as estimated by the BLM (1) (1) The BLM delayed the lease sale on the Maysdorf II South Tract due to current weak markets. Maysdorf II South Tract |

