Attached files
| file | filename |
|---|---|
| 8-K - GOLDMAN SACHS BDC, INC. - Goldman Sachs BDC, Inc. | d15062d8k.htm |
Exhibit 99.1
Goldman Sachs BDC, Inc. Investor Presentation Quarter Ended June 30, 2015 www.goldmansachsbdc.com
Disclaimer and Forward-Looking Statement The information contained in this presentation should be viewed in conjunction with the earnings conference call of Goldman Sachs BDC, Inc. (“GS BDC” or the “Company”) held on August 7, 2015. By acceptance hereof, you agree that the information contained herein may not be used, reproduced or distributed to others, in whole or in part, for any other purpose without the prior written consent of the Company. This investor presentation may contain forward-looking statements that involve substantial risks and uncertainties. You can identify these statements by the use of forward-looking terminology such as “may,” “will,” “should,” “expect,” “anticipate,” “project,” “estimate,” “intend,” “continue” or “believe” or the negatives thereof or other variations thereon or comparable terminology. You should read statements that contain these words carefully because they discuss our plans, strategies, prospects and expectations concerning our business, operating results, financial condition and other similar matters. We believe that it is important to communicate our future expectations to our investors. There may be events in the future, however, that we are not able to predict accurately or control. Any forward-looking statement made by us in this presentation speaks only as of the date on which we make it. Factors or events that could cause our actual results to differ may emerge from time to time, and it is not possible for us to predict all of them. We undertake no obligation to update or revise publicly any forward-looking statements, whether as a result of new information, future events or otherwise, except as required by law. This presentation does not constitute a prospectus and should under no circumstances be understood as an offer to sell or the solicitation of an offer to buy the common stock or any other securities nor will there be any sale of the common stock or any other securities referred to in this presentation in any state or jurisdiction in which such offer, solicitation or sale would be unlawful prior to the registration or qualification under the securities laws of such state or jurisdiction. Nothing in these materials should be construed as a recommendation to invest in any securities that may be issued by GS BDC or as legal, accounting or tax advice. An investment in securities of the type described herein presents certain risks. GS BDC is managed by Goldman Sachs Asset Management, L.P. (“GSAM”), a wholly owned subsidiary of the Goldman Sachs Group, Inc. (“Group Inc.”). None of GSAM, Group Inc., GS BDC, or any affiliate of GSAM, Group Inc., or GS BDC makes any representation or warranty, express or implied, as to the accuracy or completeness of the information contained herein and nothing contained herein shall be relied upon as a promise or representation whether as to the past or future performance. The information contained in this presentation is summary information that is intended to be considered in the context of other public announcements that we may make, by press release or otherwise, from time to time. We undertake no duty or obligation to publicly update or revise the information contained in this presentation. These materials contain information about GS BDC, certain of its personnel and affiliates and its historical performance. You should not view information related to the past performance of GS BDC as indicative of GS BDC’s future results, the achievement of which cannot be assured. Further, an investment in GS BDC is discrete from, and does not represent an interest in, any other Goldman Sachs entity. This investor presentation contains certain financial measures that have not been prepared in accordance with generally accepted accounting principles in the Unites States (“GAAP”). Non-GAAP financial measures are not meant to be considered in isolation or as a substitute for comparable GAAP financial measures, and should be read only in conjunction with the Company’s consolidated financial statements prepared in accordance with GAAP. A reconciliation of non-GAAP financial measures to the most directly comparable GAAP measures has been provided in this investor presentation, and investors are encouraged to review the reconciliation. 2
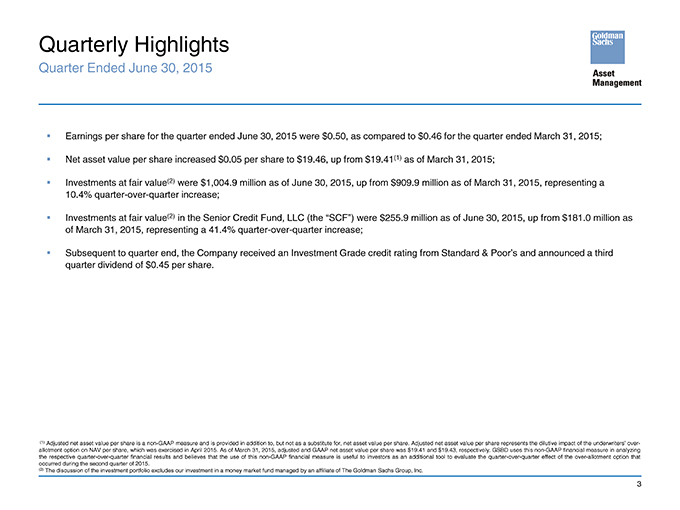
Quarterly Highlights Quarter Ended June 30, 2015 Earnings per share for the quarter ended June 30, 2015 were $0.50, as compared to $0.46 for the quarter ended March 31, 2015; Net asset value per share increased $0.05 per share to $19.46, up from $19.41(1) as of March 31, 2015; Investments at fair value(2) were $1,004.9 million as of June 30, 2015, up from $909.9 million as of March 31, 2015, representing a 10.4% quarter-over-quarter increase; Investments at fair value(2) in the Senior Credit Fund, LLC (the “SCF”) were $255.9 million as of June 30, 2015, up from $181.0 million as of March 31, 2015, representing a 41.4% quarter-over-quarter increase; Subsequent to quarter end, the Company received an Investment Grade credit rating from Standard & Poor’s and announced a third quarter dividend of $0.45 per share. (1) Adjusted net asset value per share is a non-GAAP measure and is provided in addition to, but not as a substitute for, net asset value per share. Adjusted net asset value per share represents the dilutive impact of the underwriters’ over-allotment option on NAV per share, which was exercised in April 2015. As of March 31, 2015, adjusted and GAAP net asset value per share was $19.41 and $19.43, respectively. GSBD uses this non-GAAP financial measure in analyzing the respective quarter-over-quarter financial results and believes that the use of this non-GAAP financial measure is useful to investors as an additional tool to evaluate the quarter-over-quarter effect of the over-allotment option that occurred during the second quarter of 2015. (2) The discussion of the investment portfolio excludes our investment in a money market fund managed by an affiliate of The Goldman Sachs Group, Inc. 3
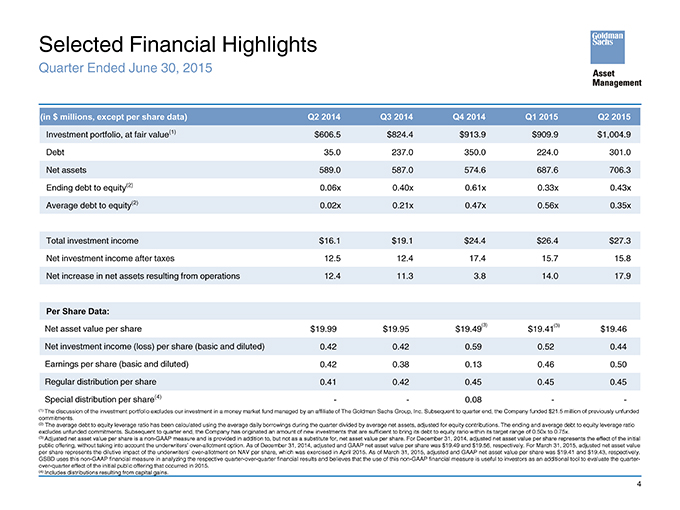
Selected Financial Highlights Quarter Ended June 30, 2015 (in $ millions, except per share data) Q2 2014 Q3 2014 Q4 2014 Q1 2015 Q2 2015 Investment portfolio, at fair value(1) $606.5 $824.4 $913.9 $909.9 $1,004.9 Debt 35.0 237.0 350.0 224.0 301.0 Net assets 589.0 587.0 574.6 687.6 706.3 Ending debt to equity(2) 0.06x 0.40x 0.61x 0.33x 0.43x Average debt to equity(2) 0.02x 0.21x 0.47x 0.56x 0.35x Total investment income $16.1 $19.1 $24.4 $26.4 $27.3 Net investment income after taxes 12.5 12.4 17.4 15.7 15.8 Net increase in net assets resulting from operations 12.4 11.3 3.8 14.0 17.9 Per Share Data: Net asset value per share $19.99 $19.95 $19.49(3) $19.41(3) $19.46 Net investment income (loss) per share (basic and diluted) 0.42 0.42 0.59 0.52 0.44 Earnings per share (basic and diluted) 0.42 0.38 0.13 0.46 0.50 Regular distribution per share 0.41 0.42 0.45 0.45 0.45 Special distribution per share(4) — 0.08 — (1) The discussion of the investment portfolio excludes our investment in a money market fund managed by an affiliate of The Goldman Sachs Group, Inc. Subsequent to quarter end, the Company funded $21.5 million of previously unfunded commitments. (2) The average debt to equity leverage ratio has been calculated using the average daily borrowings during the quarter divided by average net assets, adjusted for equity contributions. The ending and average debt to equity leverage ratio excludes unfunded commitments.Subsequent to quarter end, the Company has originated an amount of new investments that are sufficient to bring its debt to equity ratio within its target range of 0.50x to 0.75x. (3) Adjusted net asset value per share is a non-GAAP measure and is provided in addition to, but not as a substitute for, net asset value per share. For December 31, 2014, adjusted net asset value per share represents the effect of the initial public offering, without taking into account the underwriters’ over-allotment option. As of December 31, 2014, adjusted and GAAP net asset value per share was $19.49 and $19.56, respectively. For March 31, 2015, adjusted net asset value per share represents the dilutive impact of the underwriters’ over-allotment on NAV per share, which was exercised in April 2015. As of March 31, 2015, adjusted and GAAP net asset value per share was $19.41 and $19.43, respectively. GSBD uses this non-GAAP financial measure in analyzing the respective quarter-over-quarter financial results and believes that the use of this non-GAAP financial measure is useful to investors as an additional tool to evaluate the quarter-over-quarter effect of the initial public offering that occurred in 2015. (4) Includes distributions resulting from capital gains. 4
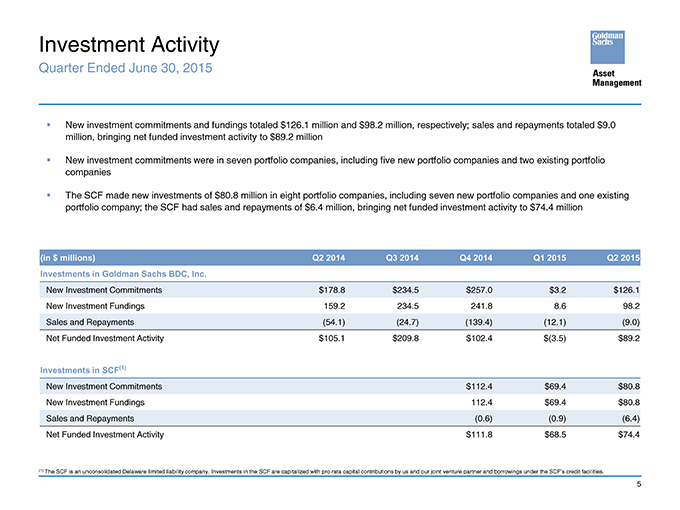
Investment Activity Quarter Ended June 30, 2015 New investment commitments and fundings totaled $126.1 million and $98.2 million, respectively; sales and repayments totaled $9.0 million, bringing net funded investment activity to $89.2 million New investment commitments were in seven portfolio companies, including five new portfolio companies and two existing portfolio companies The SCF made new investments of $80.8 million in eight portfolio companies, including seven new portfolio companies and one existing portfolio company; the SCF had sales and repayments of $6.4 million, bringing net funded investment activity to $74.4 million (in $ millions) Q2 2014 Q3 2014 Q4 2014 Q1 2015 Q2 2015 Investments in Goldman Sachs BDC, Inc. New Investment Commitments $ 178.8 $ 234.5 $257.0 $3.2 $126.1 New Investment Fundings 159.2 234.5 241.8 8.6 98.2 Sales and Repayments (54.1) (24.7) (139.4) (12.1) (9.0) Net Funded Investment Activity $ 105.1 $ 209.8 $102.4 $(3.5) $89.2 Investments in SCF(1) New Investment Commitments $112.4 $69.4 $80.8 New Investment Fundings 112.4 $69.4 $80.8 Sales and Repayments (0.6) (0.9) (6.4) Net Funded Investment Activity $111.8 $68.5 $74.4 (1) The SCF is an unconsolidated Delaware limited liability company. Investments in the SCF are capitalized with pro rata capital contributions by us and our joint venture partner and borrowings under the SCF’s credit facilities. 5
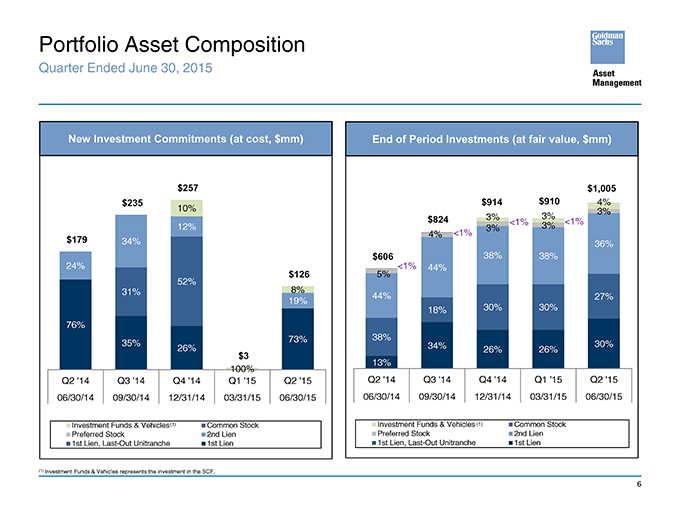
Portfolio Asset Composition Quarter Ended June 30, 2015 New Investment Commitments (at cost, $mm) $257 $235 10% 12% $179 34% 24% 52% $126 31% 8% 19% 76% 35% 73% 26% $3 100%- Q2 ‘14 Q3 ‘14 Q4 ‘14 Q1 ‘15 Q2 ‘15 06/30/14 09/30/14 12/31/14 03/31/15 06/30/15 Investment Funds & Vehicles(1) Common Stock Preferred Stock 2nd Lien 1st Lien, Last-Out Unitranche 1st Lien (1) Investment Funds & Vehicles represents the investment in the SCF. End of Period Investments (at fair value, $mm) $1,005 $914 $910 4% 3% 3% 3% $824 3% <1% 3% <1% 4% <1% 36% $606 38% 38% 5% <1% 44% 44% 27% 18% 30% 30% 38% 34% 26% 26% 30% 13% Q2 ‘14 Q3 ‘14 Q4 ‘14 Q1 ‘15 Q2 ‘15 06/30/14 09/30/14 12/31/14 03/31/15 06/30/15 Investment Funds & Vehicles (1) Common Stock Preferred Stock 2nd Lien 1st Lien, Last-Out Unitranche 1st Lien 6
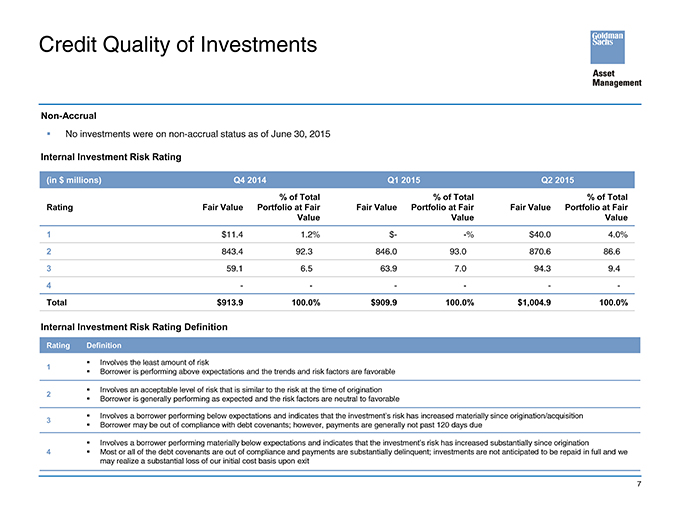
Credit Quality of Investments Non-Accrual No investments were on non-accrual status as of June 30, 2015 Internal Investment Risk Rating (in $ millions) Q4 2014 Q1 2015 Q2 2015 % of Total % of Total % of Total Rating Fair Value Portfolio at Fair Fair Value Portfolio at Fair Fair Value Portfolio at Fair Value Value Value 1 $11.4 1.2% $—% $40.0 4.0% 2 843.4 92.3% 846.0 93.0% 870.6 86.6% 3 59.1 6.5% 63.9 7.0% 94.3 9.4% 4 —% —% —% Total $913.9 100.0% $909.9 100.0% $1,004.9 100.0% Internal Investment Risk Rating Definition Rating Definition 1 Involves the least amount of risk Borrower is performing above expectations and the trends and risk factors are favorable 2 Involves an acceptable level of risk that is similar to the risk at the time of origination Borrower is generally performing as expected and the risk factors are neutral to favorable 3 Involves a borrower performing below expectations and indicates that the investment’s risk has increased materially since origination/acquisition Borrower may be out of compliance with debt covenants; however, payments are generally not past 120 days due Involves a borrower performing materially below expectations and indicates that the investment’s risk has increased substantially since origination 4 Most or all of the debt covenants are out of compliance and payments are substantially delinquent; investments are not anticipated to be repaid in full and we may realize a substantial loss of our initial cost basis upon exit 7
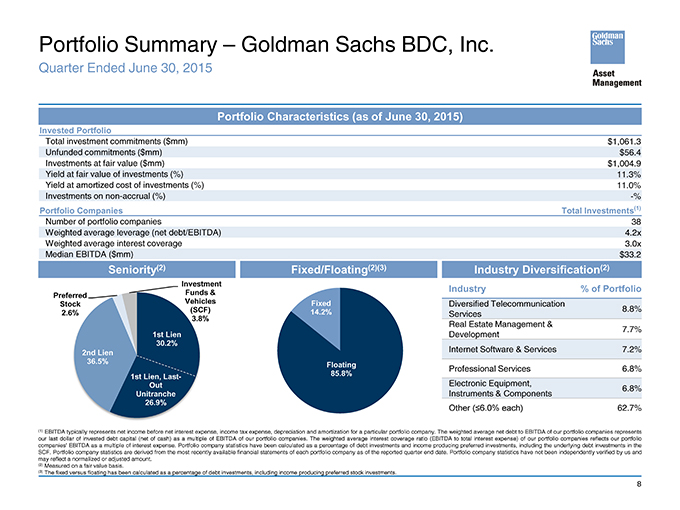
Portfolio Summary – Goldman Sachs BDC, Inc. Quarter Ended June 30, 2015 Portfolio Characteristics (as of June 30, 2015) Invested Portfolio Total investment commitments ($mm) $1,061.3 Unfunded commitments ($mm) $56.4 Investments at fair value ($mm) $1,004.9 Yield at fair value of investments (%) 11.3% Yield at amortized cost of investments (%) 11.0% Investments on non-accrual (%) -% Portfolio Companies Total Investments(1) Number of portfolio companies 38 Weighted average leverage (net debt/EBITDA) 4.2x Weighted average interest coverage 3.0x Median EBITDA ($mm) $33.2 Seniority(2) Investment Preferred Funds & Stock Vehicles 2.6% (SCF) 3.8% 1st Lien 30.2% 2nd Lien 36.5% 1st Lien, Last- Out Unitranche 26.9% Fixed/Floating(2)(3) Fixed 14.2% Floating 85.8% Industry Diversification(2) Industry % of Portfolio Diversified Telecommunication 8.8% Services Real Estate Management & Development 7.7% Internet Software & Services 7.2% Professional Services 6.8% Electronic Equipment, Instruments & Components 6.8% Other (?6.0% each) 62.7% (1) EBITDA typically represents net income before net interest expense, income tax expense, depreciation and amortization for a particular portfolio company. The weighted average net debt to EBITDA of our portfolio companies represents our last dollar of invested debt capital (net of cash) as a multiple of EBITDA of our portfolio companies. The weighted average interest coverage ratio (EBITDA to total interest expense) of our portfolio companies reflects our portfolio companies’ EBITDA as a multiple of interest expense. Portfolio company statistics have been calculated as a percentage of debt investments and income producing preferred investments, including the underlying debt investments in the SCF. Portfolio company statistics are derived from the most recently available financial statements of each portfolio company as of the reported quarter end date. Portfolio company statistics have not been independently verified by us and may reflect a normalized or adjusted amount. (2) Measured on a fair value basis. (3) The fixed versus floating has been calculated as a percentage of debt investments, including income producing preferred stock investments. 8
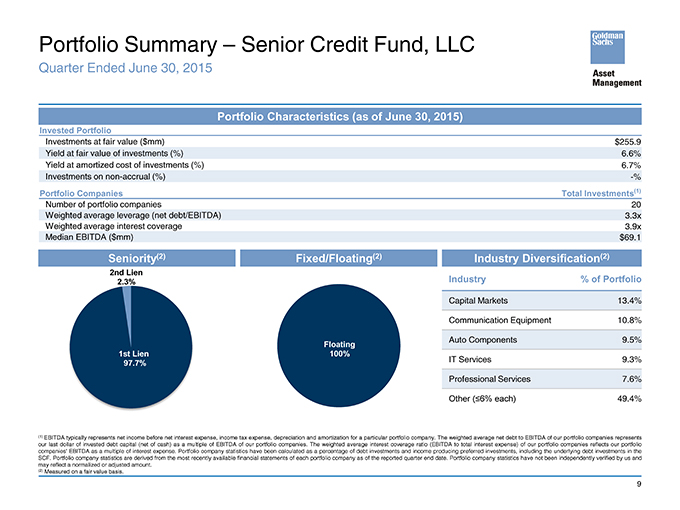
Portfolio Summary – Senior Credit Fund, LLC Quarter Ended June 30, 2015 Portfolio Characteristics (as of June 30, 2015) Invested Portfolio Investments at fair value ($mm) $255.9 Yield at fair value of investments (%) 6.6% Yield at amortized cost of investments (%) 6.7% Investments on non-accrual (%) -% Portfolio Companies Total Investments(1) Number of portfolio companies 20 Weighted average leverage (net debt/EBITDA) 3.3x Weighted average interest coverage 3.9x Median EBITDA ($mm) $69.1 Seniority(2) 2nd Lien 2.3% 1st Lien 97.7% Fixed/Floating(2) Floating 100% Industry Diversification(2) Industry % of Portfolio Capital Markets 13.4% Communication Equipment 10.8% Auto Components 9.5% IT Services 9.3% Professional Services 7.6% Other (?6% each) 49.4% (1) EBITDA typically represents net income before net interest expense, income tax expense, depreciation and amortization for a particular portfolio company. The weighted average net debt to EBITDA of our portfolio companies represents our last dollar of invested debt capital (net of cash) as a multiple of EBITDA of our portfolio companies. The weighted average interest coverage ratio (EBITDA to total interest expense) of our portfolio companies reflects our portfolio companies’ EBITDA as a multiple of interest expense. Portfolio company statistics have been calculated as a percentage of debt investments and income producing preferred investments, including the underlying debt investments in the SCF. Portfolio company statistics are derived from the most recently available financial statements of each portfolio company as of the reported quarter end date. Portfolio company statistics have not been independently verified by us and may reflect a normalized or adjusted amount. (2) Measured on a fair value basis. 9
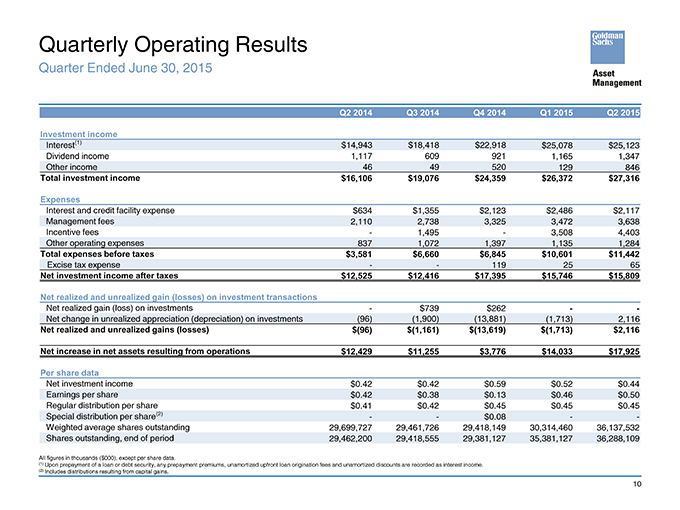
Quarterly Operating Results Quarter Ended June 30, 2015 Q2 2014 Q3 2014 Q4 2014 Q1 2015 Q2 2015 Investment income Interest(1) $14,943 $18,418 $22,918 $25,078 $25,123 Dividend income 1,117 609 921 1,165 1,347 Other income 46 49 520 129 846 Total investment income $16,106 $19,076 $24,359 $26,372 $27,316 Expenses Interest and credit facility expense $634 $1,355 $2,123 $2,486 $2,117 Management fees 2,110 2,738 3,325 3,472 3,638 Incentive fees—1,495—3,508 4,403 Other operating expenses 837 1,072 1,397 1,135 1,284 Total expenses before taxes $3,581 $6,660 $6,845 $10,601 $11,442 Excise tax expense — 119 25 65 Net investment income after taxes $12,525 $12,416 $17,395 $15,746 $15,809 Net realized and unrealized gain (losses) on investment transactions Net realized gain (loss) on investments—$739 $262 — Net change in unrealized appreciation (depreciation) on investments (96) (1,900) (13,881) (1,713) 2,116 Net realized and unrealized gains (losses) $(96) $(1,161) $(13,619) $(1,713) $2,116 Net increase in net assets resulting from operations $12,429 $11,255 $3,776 $14,033 $17,925 Per share data Net investment income $0.42 $0.42 $0.59 $0.52 $0.44 Earnings per share $0.42 $0.38 $0.13 $0.46 $0.50 Regular distribution per share $0.41 $0.42 $0.45 $0.45 $0.45 Special distribution per share(2) — $0.08 — Weighted average shares outstanding 29,699,727 29,461,726 29,418,149 30,314,460 36,137,532 Shares outstanding, end of period 29,462,200 29,418,555 29,381,127 35,381,127 36,288,109 All figures in thousands ($000), except per share data. (1) Upon prepayment of a loan or debt security, any prepayment premiums, unamortized upfront loan origination fees and unamortized discounts are recorded as interest income. (2) Includes distributions resulting from capital gains. 10
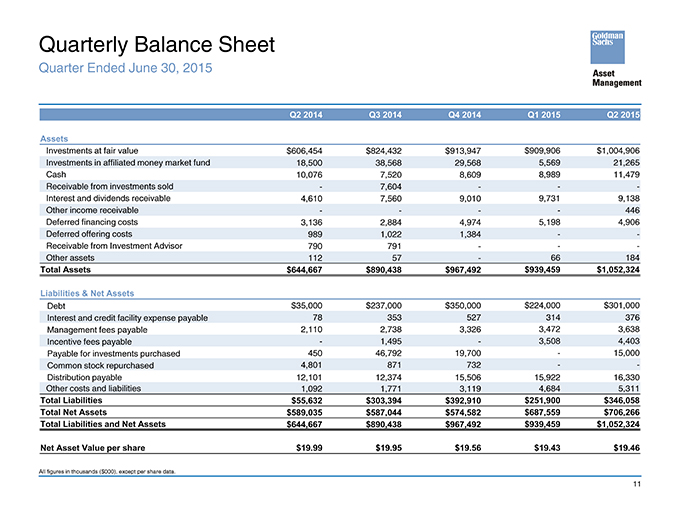
Quarterly Balance Sheet Quarter Ended June 30, 2015 Q2 2014 Q3 2014 Q4 2014 Q1 2015 Q2 2015 Assets Investments at fair value $606,454 $824,432 $913,947 $909,906 $1,004,906 Investments in affiliated money market fund 18,500 38,568 29,568 5,569 21,265 Cash 10,076 7,520 8,609 8,989 11,479 Receivable from investments sold—7,604 ——Interest and dividends receivable 4,610 7,560 9,010 9,731 9,138 Other income receivable — — 446 Deferred financing costs 3,136 2,884 4,974 5,198 4,906 Deferred offering costs 989 1,022 1,384 — Receivable from Investment Advisor 790 791 ——Other assets 112 57—66 184 Total Assets $644,667 $890,438 $967,492 $939,459 $1,052,324 Liabilities & Net Assets Debt $35,000 $237,000 $350,000 $224,000 $301,000 Interest and credit facility expense payable 78 353 527 314 376 Management fees payable 2,110 2,738 3,326 3,472 3,638 Incentive fees payable—1,495—3,508 4,403 Payable for investments purchased 450 46,792 19,700—15,000 Common stock repurchased 4,801 871 732 — Distribution payable 12,101 12,374 15,506 15,922 16,330 Other costs and liabilities 1,092 1,771 3,119 4,684 5,311 Total Liabilities $55,632 $303,394 $392,910 $251,900 $346,058 Total Net Assets $589,035 $587,044 $574,582 $687,559 $706,266 Total Liabilities and Net Assets $644,667 $890,438 $967,492 $939,459 $1,052,324 Net Asset Value per share $19.99 $19.95 $19.56 $19.43 $19.46 All figures in thousands ($000), except per share data. 11
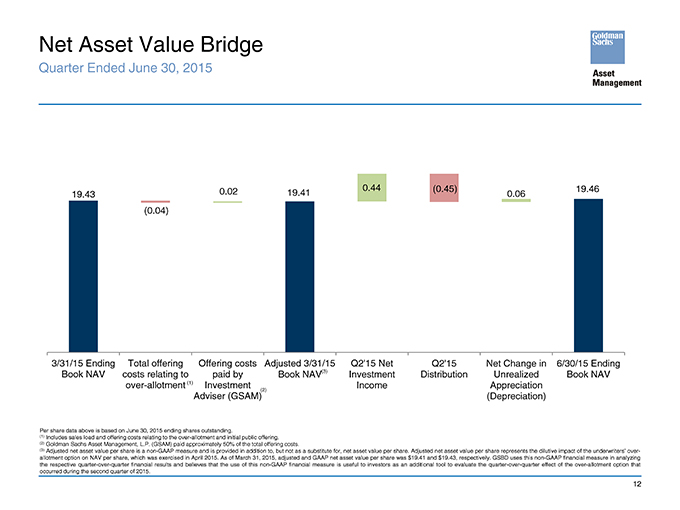
Net Asset Value Bridge Quarter Ended June 30, 2015 19.43 0.02 19.41 0.44 (0.45) 0.06 19.46 (0.04) 3/31/15 Ending Total offering Offering costs Adjusted 3/31/15 Q2’15 Net Q2’15 Net Change in 6/30/15 Ending Book NAV costs relating to paid by Book NAV(3) Investment Distribution Unrealized Book NAV over-allotment (1) Investment Income Appreciation Adviser (GSAM)(2) (Depreciation) Per share data above is based on June 30, 2015 ending shares outstanding. (1) Includes sales load and offering costs relating to the over-allotment and initial public offering. (2) Goldman Sachs Asset Management, L.P. (GSAM) paid approximately 50% of the total offering costs. (3) Adjusted net asset value per share is a non-GAAP measure and is provided in addition to, but not as a substitute for, net asset value per share. Adjusted net asset value per share represents the dilutive impact of the underwriters’ over-allotment option on NAV per share, which was exercised in April 2015. As of March 31, 2015, adjusted and GAAP net asset value per share was $19.41 and $19.43, respectively. GSBD uses this non-GAAP financial measure in analyzing the respective quarter-over-quarter financial results and believes that the use of this non-GAAP financial measure is useful to investors as an additional tool to evaluate the quarter-over-quarter effect of the over-allotment option that occurred during the second quarter of 2015. 12
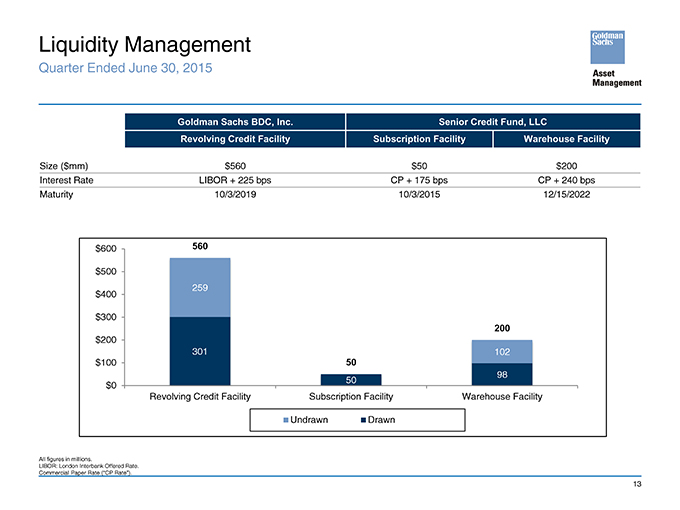
Liquidity Management Quarter Ended June 30, 2015 Goldman Sachs BDC, Inc. Senior Credit Fund, LLC Revolving Credit Facility Subscription Facility Warehouse Facility Size ($mm) $560 $50 $200 Interest Rate LIBOR + 225 bps CP + 175 bps CP + 240 bps Maturity 10/3/2019 10/3/2015 12/15/2022 $600 560 $500 $400 259 $300 200 $200 301 102 $100 50 98 $0 50 Revolving Credit Facility Subscription Facility Warehouse Facility Undrawn Drawn All figures in millions. LIBOR: London Interbank Offered Rate. Commercial Paper Rate (“CP Rate”). 13
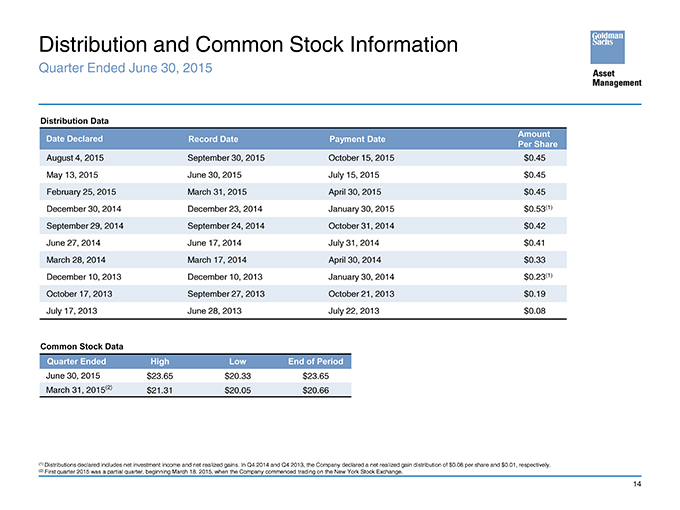
Distribution and Common Stock Information Quarter Ended June 30, 2015 Distribution Data Date Declared Record Date Payment Date Amount Per Share August 4, 2015 September 30, 2015 October 15, 2015 $ 0.45 May 13, 2015 June 30, 2015 July 15, 2015 $ 0.45 February 25, 2015 March 31, 2015 April 30, 2015 $ 0.45 December 30, 2014 December 23, 2014 January 30, 2015 $ 0.53(1) September 29, 2014 September 24, 2014 October 31, 2014 $ 0.42 June 27, 2014 June 17, 2014 July 31, 2014 $ 0.41 March 28, 2014 March 17, 2014 April 30, 2014 $ 0.33 December 10, 2013 December 10, 2013 January 30, 2014 $ 0.23(1) October 17, 2013 September 27, 2013 October 21, 2013 $ 0.19 July 17, 2013 June 28, 2013 July 22, 2013 $ 0.08 Common Stock Data Quarter Ended High Low End of Period June 30, 2015 $23.65 $20.33 $ 23.65 March 31, 2015(2) $21.31 $20.05 $ 20.66 (1) Distributions declared includes net investment income and net realized gains. In Q4 2014 and Q4 2013, the Company declared a net realized gain distribution of $0.08 per share and $0.01, respectively. (2) First quarter 2015 was a partial quarter, beginning March 18, 2015, when the Company commenced trading on the New York Stock Exchange. 14