Attached files
| file | filename |
|---|---|
| EX-99.(31)(1) - CERTIFICATION OF CHIEF EXECUTIVE OFFICER - Goldman Sachs BDC, Inc. | d307019dex99311.htm |
| EX-99.(32)(1) - CERTIFICATION OF CHIEF EXECUTIVE OFFICER AND CHIEF FINANCIAL OFFICER - Goldman Sachs BDC, Inc. | d307019dex99321.htm |
| EX-99.(31)(2) - CERTIFICATION OF CHIEF FINANCIAL OFFICER - Goldman Sachs BDC, Inc. | d307019dex99312.htm |
UNITED STATES
SECURITIES AND EXCHANGE COMMISSION
Washington, D.C. 20549
FORM 10-K
| ☒ | ANNUAL REPORT PURSUANT TO SECTION 13 OR 15(d) OF THE SECURITIES EXCHANGE ACT OF 1934 |
For the fiscal year ended December 31, 2016
or
| ☐ | TRANSITION REPORT PURSUANT TO SECTION 13 OR 15(d) OF THE SECURITIES EXCHANGE ACT OF 1934 |
Commission file number 814-00998
Goldman Sachs BDC, Inc.
(Exact Name of Registrant as Specified in Its Charter)
| Delaware (State or Other Jurisdiction |
46-2176593 (I.R.S. Employer | |
| 200 West Street, New York, New York | 10282 | |
| (Address of Principal Executive Offices) | (Zip Code) | |
Registrant’s Telephone Number, Including Area Code: (212) 902-0300
Securities registered pursuant to Section 12(b) of the Act:
| Title of each class | Name of each exchange on which registered | |
| Common Stock, par value $0.001 per share | The New York Stock Exchange |
Securities registered pursuant to Section 12(g) of the Act:
None
(Title of class)
Indicate by check mark if the registrant is a well-known seasoned issuer, as defined in Rule 405 of the Securities Act. YES ☐ NO ☒
Indicate by check mark if the registrant is not required to file reports pursuant to Section 13 or Section 15(d) of the Act. YES ☐ NO ☒
Indicate by check mark whether the registrant (1) has filed all reports required to be filed by Section 13 or 15(d) of the Securities Exchange Act of 1934 during the preceding 12 months (or for such shorter period that the registrant was required to file such reports), and (2) has been subject to such filing requirements for the past 90 days. YES ☒ NO ☐
Indicate by check mark whether the registrant has submitted electronically and posted on its corporate Web site, if any, every Interactive Data File required to be submitted and posted pursuant to Rule 405 of Regulation S-T (§232.405 of this chapter) during the preceding 12 months (or for such shorter period that the registrant was required to submit and post such files). YES ☐ NO ☐
Indicate by check mark if disclosure of delinquent filers pursuant to Item 405 of Regulation S-K is not contained herein, and will not be contained, to the best of the registrant’s knowledge, in definitive proxy or information statements incorporated by reference in Part III of this Form 10-K or any amendment to this Form 10-K. ☒
Indicate by check mark whether the registrant is a large accelerated filer, an accelerated filer, a non-accelerated filer or a smaller reporting company. See definitions of “large accelerated filer”, “accelerated filer” and “smaller reporting company” in Rule 12b-2 of the Exchange Act. (Check one):
| Large accelerated filer: |
☐ |
Accelerated filer: |
☒ | |||
| Non-accelerated filer: |
☐ (Do not check if a smaller reporting company) |
Smaller reporting company: |
☐ |
Indicate by check mark whether the registrant is a shell company (as defined in Rule 12b-2 of the Act). YES ☐ NO ☒
The aggregate market value of the registrant’s common stock at June 30, 2016 (based upon the closing sale price of the common stock on the New York Stock Exchange on June 30, 2016) held by those persons deemed by the registrant to be non-affiliates was approximately $593.75 million. Shares of the registrant’s common stock held by each executive officer and director and by each entity or person that, to the registrant’s knowledge, owned 10% or more of the registrant’s outstanding common stock as of June 30, 2016 have been excluded from this number in that these persons may be deemed affiliates of the registrant. This determination of possible affiliate status for purposes of this computation is not necessarily a conclusive determination for other purposes.
There were 36,342,786 shares of the registrant’s common stock outstanding as of February 28, 2017.
Portions of the registrant’s Proxy Statement for its 2017 Annual Meeting of Stockholders to be filed not later than 120 days after the end of the fiscal year covered by this Annual Report on Form 10-K are incorporated by reference into Part III of this Annual Report on Form 10-K.
Index to Annual Report on Form 10-K for
Year Ended December 31, 2016
| PAGE | |||||||
| PART I. | 4 | ||||||
| ITEM 1. | Business | 4 | |||||
| ITEM 1A. | Risk Factors | 33 | |||||
| ITEM 1B. | Unresolved Staff Comments | 62 | |||||
| ITEM 2. | Properties | 62 | |||||
| ITEM 3. | Legal Proceedings | 62 | |||||
| ITEM 4. | Mine Safety Disclosures | 62 | |||||
| PART II. | 63 | ||||||
| ITEM 5. | Market For Registrant’s Common Equity, Related Stockholder Matters and Issuer Purchases of Equity Securities |
63 | |||||
| ITEM 6. | Selected Financial Data | 66 | |||||
| ITEM 7. | Management’s Discussion and Analysis of Financial Condition and Results of Operations | 67 | |||||
| ITEM 7A. | Quantitative and Qualitative Disclosures About Market Risk | 92 | |||||
| ITEM 8. | Consolidated Financial Statements and Supplementary Data | 93 | |||||
| ITEM 9. | Changes in and Disagreements with Accountants on Accounting and Financial Disclosure | 137 | |||||
| ITEM 9A. | Controls and Procedures | 137 | |||||
| ITEM 9B. | Other Information | 137 | |||||
| PART III. | 138 | ||||||
| ITEM 10. | Directors, Executive Officers and Corporate Governance | 138 | |||||
| ITEM 11. | Executive Compensation | 138 | |||||
| ITEM 12. | Security Ownership of Certain Beneficial Owners and Management and Related Stockholder Matters | 138 | |||||
| ITEM 13. | Certain Relationships and Related Transactions, and Director Independence | 138 | |||||
| ITEM 14. | Principal Accounting Fees and Services | 138 | |||||
| PART IV. | 139 | ||||||
| ITEM 15. | Exhibits, Financial Statement Schedules | 139 | |||||
2
CAUTIONARY STATEMENT REGARDING FORWARD-LOOKING STATEMENTS
This report contains forward-looking statements that involve substantial risks and uncertainties. You can identify these statements by the use of forward-looking terminology such as “may,” “will,” “should,” “expect,” “anticipate,” “project,” “target,” “estimate,” “intend,” “continue” or “believe” or the negatives of, or other variations on, these terms or comparable terminology. You should read statements that contain these words carefully because they discuss our plans, strategies, prospects and expectations concerning our business, operating results, financial condition and other similar matters. We believe that it is important to communicate our future expectations to our investors. Our forward-looking statements include information in this report regarding general domestic and global economic conditions, our future financing plans, our ability to operate as a business development company (“BDC”) and the expected performance of, and the yield on, our portfolio companies. There may be events in the future, however, that we are not able to predict accurately or control. The factors listed under “Risk Factors” in this Annual Report on Form 10-K, as well as any cautionary language in this report, provide examples of risks, uncertainties and events that may cause our actual results to differ materially from the expectations we describe in our forward-looking statements. The occurrence of the events described in these risk factors and elsewhere in this report could have a material adverse effect on our business, results of operations and financial position. Any forward-looking statement made by us in this report speaks only as of the date of this report. Factors or events that could cause our actual results to differ from our forward-looking statements may emerge from time to time, and it is not possible for us to predict all of them. You are advised to consult any additional disclosures that we may make directly to you or through reports that we in the future may file with the U.S. Securities and Exchange Commission (the “SEC”), including annual reports on Form 10-K, registration statements on Form N-2, quarterly reports on Form 10-Q and current reports on Form 8-K. Under Section 21E(b)(2)(B) of the Securities Exchange Act of 1934, as amended (the “Exchange Act”), the “safe harbor” provisions of the Private Securities Litigation Reform Act of 1995 do not apply to statements made in periodic reports we file under the Exchange Act, such as this Annual Report on Form 10-K.
The following factors are among those that may cause actual results to differ materially from our forward-looking statements:
| • | our future operating results; |
| • | changes in political, economic or industry conditions, the interest rate environment or conditions affecting the financial and capital markets; |
| • | uncertainty surrounding the financial and political stability of the U.S., the European Union and China; |
| • | our business prospects and the prospects of our portfolio companies; |
| • | the impact of investments that we expect to make; |
| • | the impact of increased competition; |
| • | our contractual arrangements and relationships with third parties; |
| • | the dependence of our future success on the general economy and its impact on the industries in which we invest; |
| • | the ability of our prospective portfolio companies to achieve their objectives; |
| • | the relative and absolute performance of our investment adviser; |
| • | our expected financings and investments; |
| • | the use of borrowed money to finance a portion of our investments; |
| • | our ability to make distributions; |
| • | the adequacy of our cash resources and working capital; |
| • | the timing of cash flows, if any, from the operations of our portfolio companies; |
| • | the impact of future acquisitions and divestitures; |
| • | the effect of changes in tax laws and regulations and interpretations thereof; |
| • | our ability to maintain our status as a BDC and a regulated investment company (“RIC”) under Subchapter M of the Internal Revenue Code of 1986, as amended (the “Code”); |
| • | actual and potential conflicts of interest with Goldman Sachs Asset Management, L.P. and its affiliates; |
| • | general price and volume fluctuations in the stock market; |
| • | the ability of our investment adviser to attract and retain highly talented professionals; |
| • | the impact on our business from new or amended legislation or regulations; and |
| • | the availability of credit and/or our ability to access the equity markets. |
3
Unless indicated otherwise in this Annual Report on Form 10-K or the context so requires, the terms “GS BDC,” “Company,” “we,” “us” or “our” refer to Goldman Sachs BDC, Inc. or, for periods prior to our conversion from a Delaware limited liability company to a Delaware corporation (the “Conversion”), Goldman Sachs Liberty Harbor Capital, LLC. The terms “GSAM,” our “adviser” or our “Investment Adviser” refer to Goldman Sachs Asset Management, L.P., a Delaware limited partnership. The term “Group Inc.” refers to The Goldman Sachs Group, Inc. The term “Goldman Sachs” refers to Group Inc., together with Goldman, Sachs & Co., GSAM and its other subsidiaries and affiliates.
The Company
We are a specialty finance company focused on lending to middle-market companies. We are a closed-end management investment company that has elected to be regulated as a BDC under the Investment Company Act of 1940, as amended (the “Investment Company Act”). In addition, we have elected to be treated as a RIC under Subchapter M of the Code, commencing with our taxable year ended December 31, 2013. From our formation in 2012 through December 31, 2016, we originated more than $1.94 billion in aggregate principal amount of debt and equity investments prior to any subsequent exits and repayments. We seek to generate current income and, to a lesser extent, capital appreciation primarily through direct originations of secured debt, including first lien, unitranche, including last out portions of such loans, and second lien debt, and unsecured debt, including mezzanine debt, as well as through select equity investments.
“Unitranche” loans are first lien loans that may extend deeper in a company’s capital structure than traditional first lien debt and may provide for a waterfall of cash flow priority between different lenders in the unitranche loan. In a number of instances, we may find another lender to provide the “first out” portion of such loan and retain the “last out” portion of such loan, in which case, the “first out” portion of the loan would generally receive priority with respect to payment of principal, interest and any other amounts due thereunder over the “last out” portion that we would continue to hold. In exchange for the greater risk of loss, the “last out” portion earns a higher interest rate. We use the term “mezzanine” to refer to debt that ranks senior only to a borrower’s equity securities and ranks junior in right of payment to all of such borrower’s other indebtedness. We may make multiple investments in the same portfolio company.
We invest primarily in U.S. middle-market companies, which we believe are underserved by traditional providers of capital such as banks and the public debt markets. In describing our business, we generally use the term “middle market companies” to refer to companies with earnings before interest, taxes, depreciation and amortization (“EBITDA”) of between $5 million and $75 million annually. However, we may from time to time invest in larger or smaller companies. We generate revenues primarily through receipt of interest income from the investments we hold. In addition, we generate income from various loan origination and other fees, dividends on direct equity investments and capital gains on the sales of investments. Fees received from portfolio companies (directors’ fees, consulting fees, administrative fees, tax advisory fees and other similar compensation) are paid to us, unless otherwise required by any applicable law or exemptive relief, in which case, we would only receive our allocable portion of such fees. The companies in which we invest use our capital for a variety of purposes, including to support organic growth, fund acquisitions, make capital investments or refinance indebtedness.
Available Information
We file with or submit to the SEC periodic and current reports, proxy statements and other information meeting the informational requirements of the Exchange Act. You may inspect and copy these reports, proxy statements and other information, as well as registration statements and related exhibits and schedules, at the Public SEC’s Reference Room at 100 F Street, N.E., Washington, D.C. 20549-0102. You may obtain information on the operation of the Public Reference Room by calling the SEC at (202) 551-8090 or (800) SEC-0330. We maintain a website at www.GoldmanSachsBDC.com and make all of our annual, quarterly and current reports, proxy statements and other publicly filed information available, free of charge, on or through our website. You may also obtain such information by contacting us, in writing at: 200 West Street New York, New York 10282, or by telephone (collect) at (212) 902-0300. The SEC maintains an Internet site that contains reports, proxy and information statements and other information filed electronically by us with the SEC which are available on the SEC’s Internet site at http://www.sec.gov. Copies of these reports, proxy and information statements and other information may be obtained, after paying a duplicating fee, by electronic request at the following e-mail address: publicinfo@sec.gov, or by writing the SEC’s Public Reference Section, Washington, D.C. 20549-0102.
4
Investment Strategy
Our origination strategy focuses on leading the negotiation and structuring of the loans or securities in which we invest and holding the investments in our portfolio to maturity. In many cases we are the sole investor in the loan or security in our portfolio. Where there are multiple investors, we generally seek to control or obtain significant influence over the rights of investors in the loan or security. Our investments typically have maturities between three and ten years and generally range in size between $10 million and $75 million, although we may make larger or smaller investments on occasion. In addition, part of our strategy involves an investment in a joint venture, Senior Credit Fund, LLC (the “Senior Credit Fund”), with the Regents of the University of California (“Cal Regents”). The Senior Credit Fund’s principal purpose is to make investments, either directly or indirectly through its wholly owned subsidiary, Senior Credit Fund SPV I, LLC (“SPV I”), primarily in senior secured loans to middle-market companies.
Investment Portfolio
As of December 31, 2016 and December 31, 2015, our portfolio (excluding our investment in a money market fund managed by an affiliate of Group Inc. of $0.00 million and $10.12 million, respectively) consisted of the following:
| As of | ||||||||||||||||||||||||
| December 31, 2016 | December 31, 2015 | |||||||||||||||||||||||
| Investment Type |
Amortized Cost |
Fair Value | Percentage of Total Portfolio at Fair Value |
Amortized Cost |
Fair Value | Percentage of Total Portfolio at Fair Value |
||||||||||||||||||
| ($ in millions) | ($ in millions) | |||||||||||||||||||||||
| First Lien/Senior Secured Debt |
$ | 436.90 | $ | 421.03 | 36.1 | % | $ | 425.53 | $ | 420.10 | 38.9 | % | ||||||||||||
| First Lien/Last-Out Unitranche |
329.45 | 310.25 | 26.6 | 308.10 | 305.72 | 28.3 | ||||||||||||||||||
| Second Lien/Senior Secured Debt |
352.70 | 336.18 | 28.8 | 312.83 | 285.47 | 26.4 | ||||||||||||||||||
| Unsecured Debt |
3.12 | 3.12 | 0.3 | — | — | — | ||||||||||||||||||
| Preferred Stock |
11.12 | 11.83 | 1.0 | 25.62 | 24.87 | 2.3 | ||||||||||||||||||
| Common Stock |
11.63 | 6.49 | 0.5 | 4.45 | — | — | ||||||||||||||||||
| Investment Funds & Vehicles |
77.59 | 78.39 | 6.7 | 46.17 | 44.90 | 4.1 | ||||||||||||||||||
|
|
|
|
|
|
|
|
|
|
|
|
|
|||||||||||||
| Total Investments |
$ | 1,222.51 | $ | 1,167.29 | 100.0 | % | $ | 1,122.70 | $ | 1,081.06 | 100.0 | % | ||||||||||||
|
|
|
|
|
|
|
|
|
|
|
|
|
|||||||||||||
As of December 31, 2016, our portfolio consisted of 49 investments in 40 portfolio companies across 26 different industries. The largest industries in our portfolio, based on fair value as of December 31, 2016, were Software, Internet Software & Services, Diversified Telecommunication Services and Investment Funds & Vehicles, which represented 9.8%, 8.3%, 8.0% and 6.7%, respectively, of our portfolio at fair value.
The geographic composition of our portfolio at fair value at December 31, 2016 was United States 98.5%, Germany 1.3% and Canada 0.2%.
As of December 31, 2016, the weighted average yield on our portfolio (excluding our investment in a money market fund managed by an affiliate of Group Inc.), at cost and fair value, were as follows:
| December 31, 2016 | ||||||||
| Amortized Cost |
Fair Value |
|||||||
| Weighted Average Yield(1) |
||||||||
| First Lien/Senior Secured Debt(2) |
10.0 | % | 10.6 | % | ||||
| First Lien/Last-Out Unitranche(2) |
11.3 | % | 14.2 | % | ||||
| Second Lien/Senior Secured Debt(2) |
10.5 | % | 11.0 | % | ||||
| Unsecured Debt(2) |
12.0 | % | 12.0 | % | ||||
| Preferred Stock(2) |
0.5 | % | 0.5 | % | ||||
| Common Stock(2) |
0.0 | % | 0.0 | % | ||||
| Investment Funds & Vehicles(3) |
14.5 | % | 14.5 | % | ||||
| Total Portfolio(2) |
10.6 | % | 11.8 | % | ||||
| (1) | The weighted average yield of our portfolio does not represent the total return to our stockholders. |
| (2) | Computed based on the (a) annual stated interest rate or yield earned plus amortization of fees and discounts on the performing debt and other income producing investments, divided by (b) the total investments (including investments on non-accrual and non-income producing investments) at amortized cost or fair value, respectively. |
5
| (3) | Computed based on the net investment income earned from the Senior Credit Fund for the respective trailing twelve months ended on the measurement date, which may include dividend income and loan origination and structuring fees, divided by our average member’s equity at cost and fair value, adjusted for equity contributions. |
The following table presents certain selected information regarding our investment portfolio (excluding our investment in a money market fund managed by an affiliate of Group Inc.) as of December 31, 2016:
| December 31, 2016 | ||||
| Number of portfolio companies(1) |
40 | |||
| Percentage of performing debt bearing a floating rate (2) |
92.8 | % | ||
| Percentage of performing debt bearing a fixed rate (2) (3) |
7.2 | % | ||
| Weighted average leverage (net debt/EBITDA)(4) |
4.8x | |||
| Weighted average interest coverage(4) |
2.7x | |||
| Median EBITDA(4) |
$ | 25.02 million | ||
| (1) | Includes the Senior Credit Fund as a single portfolio company. For details on the portfolio companies held within the Senior Credit Fund, refer to the Senior Credit Fund, LLC Selected Financial Data. |
| (2) | Measured on a fair value basis. Excludes investments, if any, placed on non-accrual. |
| (3) | Includes income producing preferred stock investments. |
| (4) | For a particular portfolio company, EBITDA typically represents net income before net interest expense, income tax expense, depreciation and amortization. The weighted average net debt to EBITDA represents the weighted average ratio of our portfolio companies’ debt (net of cash), including all of our investment and the amount of debt senior to us, to our portfolio companies’ EBITDA. Weighted average net debt to EBITDA and median EBITDA have been calculated as a percentage of debt investments and income producing preferred stock investments, including the Company’s exposure to underlying debt investments in the Senior Credit Fund and excluding collateral loans and preferred stock investments where net debt to EBITDA may not be the appropriate measure of credit risk. The weighted average interest coverage ratio (EBITDA to total interest expense) of our portfolio companies reflects our performing portfolio companies’ EBITDA as a multiple of interest expense and has been calculated as a percentage of performing debt investments and income producing preferred stock investments, including the Company’s exposure to underlying debt investments in the Senior Credit Fund and excluding collateral loans and preferred stock investments where EBITDA may not be the appropriate measure of credit risk. Portfolio company statistics are derived from the most recently available financial statements of each portfolio company as of the respective reported end date. Portfolio company statistics have not been independently verified by us and may reflect a normalized or adjusted amount. |
Floating rates are primarily London Interbank Offered Rates (“LIBOR”) plus a spread.
As of December 31, 2016, we and Cal Regents had subscribed to fund and contributed the following in the Senior Credit Fund:
| December 31, 2016 | ||||||||
| Subscribed to fund |
Contributed | |||||||
| ($ in millions) | ||||||||
| Company |
$ | 100.00 | $ | 77.59 | ||||
| Cal Regents |
100.00 | 77.59 | ||||||
|
|
|
|
|
|||||
| Total |
$ | 200.00 | $ | 155.18 | ||||
|
|
|
|
|
|||||
As of December 31, 2016, the Senior Credit Fund had total investments in senior secured debt at fair value of $479.53 million. In addition, as of December 31, 2016, the Senior Credit Fund had an investment in a money market fund managed by an affiliate of Group Inc. with a total fair value of $1.94 million. Additionally, as of December 31, 2016, the Senior Credit Fund had three unfunded commitments totaling $6.30 million.
Below is a summary of the Senior Credit Fund’s portfolio (excluding an investment in a money market fund managed by an affiliate of Group Inc.) as of December 31, 2016:
| December 31, 2016 | ||||
| Number of portfolio companies |
37 | |||
| Total senior secured debt(1) |
$ | 489.66 million | ||
| Largest loan to a single borrower(1) |
$ | 24.62 million | ||
| Weighted average current interest rate on senior secured debt(2) |
6.6% | |||
| Percentage of performing debt bearing a floating rate(3) |
100.0% | |||
| Percentage of performing debt bearing a fixed rate(3) |
–% | |||
| Weighted average leverage (net debt/EBITDA)(4) |
3.8x | |||
| Weighted average interest coverage(4) |
3.2x | |||
| Median EBITDA(4) |
$ | 68.70 million | ||
| (1) | At par amount. |
6
| (2) | Computed as the (a) annual stated interest rate on accruing senior secured debt divided by (b) total senior secured debt at par amount. |
| (3) | Measured on a fair value basis. |
| (4) | For a particular portfolio company of the Senior Credit Fund, EBITDA typically represents net income before net interest expense, income tax expense, depreciation and amortization. The weighted average net debt to EBITDA represents the weighted average ratio of the Senior Credit Fund’s portfolio companies’ debt (net of cash), including all of its investment and the amount of debt senior to it, to its portfolio companies as a multiple of EBITDA. Weighted average net debt to EBITDA and median EBITDA have been calculated as a percentage of the Senior Credit Fund’s debt investments and income producing preferred stock investments, excluding collateral loans and preferred stock investments where net debt to EBITDA may not be the appropriate measure of credit risk. The weighted average interest coverage ratio (EBITDA to total interest expense) of the Senior Credit Fund’s portfolio companies reflects its performing portfolio companies’ EBITDA as a multiple of interest expense and has been calculated as a percentage of performing debt investments and income producing preferred stock investments, excluding collateral loans and preferred stock investments where EBITDA may not be the appropriate measure of credit risk. Portfolio company statistics are derived from the most recently available financial statements of each portfolio company of the Senior Credit Fund as of the respective reported end date. Statistics of the Senior Credit Fund’s portfolio companies have not been independently verified by us and may reflect a normalized or adjusted amount. |
As of December 31, 2016, the Senior Credit Fund was invested across 22 different industries. The largest industries in the Senior Credit Fund’s portfolio, based on fair value as of December 31, 2016, were Software, IT Services, Health Care Providers & Services and Health Care Technology, which represented 8.9%, 8.2%, 7.6%, and 7.6%, respectively, of the Senior Credit Fund’s portfolio at fair value.
Corporate Structure
We were formed as a private fund in September 2012 and commenced operations in November 2012, using seed capital contributions we received from Group Inc. In March 2013, we elected to be treated as a BDC. In April 2013, we converted from a Delaware limited liability company to a Delaware corporation. We have elected to be treated, and expect to qualify annually, as a RIC under Subchapter M of the Code, commencing with our taxable year ended December 31, 2013. On March 18, 2015, our common stock began trading on the New York Stock Exchange (“NYSE”) under the symbol “GSBD”. On March 23, 2015, we closed our initial public offering (“IPO”), issuing 6,000,000 shares of common stock at a public offering price of $20.00 per share. On April 21, 2015, we issued an additional 900,000 shares of our common stock pursuant to the exercise of the underwriters’ over-allotment option in connection with the IPO. As a result of the Conversion, subsequent share repurchases and the IPO, as of December 31, 2016, Group Inc. owned approximately 17.85% of our common stock.
Our Investment Adviser
GSAM serves as our Investment Adviser and has been registered as an investment adviser with the SEC since 1990. Subject to the supervision of our Board of Directors (the “Board of Directors”), a majority of whom are independent directors (including an independent Chairman), GSAM manages our day-to-day operations and provides us with investment advisory and management services and certain administrative services. GSAM is an indirect subsidiary of Group Inc., a public company that is a bank holding company (a “BHC”), financial holding company (a “FHC”) and a world-wide, full-service financial services organization. Group Inc. is the indirect parent of GSAM. GSAM has been providing financial solutions for investors since 1988 and had over $1.17 trillion of assets under supervision as of December 31, 2016.
The GSAM Private Credit Group
The Private Credit Group of GSAM (the “GSAM Private Credit Group”) is responsible for identifying investment opportunities, conducting research and due diligence on prospective investments, negotiating and structuring our investments and monitoring and servicing our investments. The GSAM Private Credit Group was comprised of 17 investment professionals, as of December 31, 2016, all of whom are dedicated to the Company’s investment strategy and other funds that share a similar investment strategy with the Company. These professionals are supported by an additional 16 investment professionals, as of December 31, 2016, who are primarily focused on investment strategies in syndicated, liquid credit (together with the GSAM Private Credit Group, “GSAM Credit Alternatives”). These individuals may have additional responsibilities other than those relating to us, but generally allocate a portion of their time in support of our business and our investment objective as a whole. In addition, GSAM has risk management, legal, accounting, tax, information technology and compliance personnel, among others, who provide services to us. We benefit from the expertise provided by these personnel in our operations.
The GSAM Private Credit Group is dedicated primarily to private corporate credit investment opportunities in North America and utilizes a bottom-up, fundamental research approach to lending. The senior members of the GSAM Private Credit Group have been working together since 2006 and have an average of over 17 years of experience in leveraged finance and private transactions.
7
All investment decisions are made by the investment committee of GSAM’s Private Credit Group (the “Investment Committee”), which currently consists of five voting members: Brendan McGovern, Salvatore Lentini, Jon Yoder, David Yu and Scott Turco, as well as three non-voting members with operational and/or legal expertise. The Investment Committee is responsible for approving all of our investments. The Investment Committee also monitors investments in our portfolio and approves all asset dispositions. We expect to benefit from the extensive and varied relevant experience of the investment professionals serving on the Investment Committee, which includes expertise in privately originated and publicly traded leveraged credit, stressed and distressed debt, bankruptcy, mergers and acquisitions and private equity. The voting members of the Investment Committee collectively have over 50 years of experience in middle-market investment and activities related to middle-market investing. The membership of the Investment Committee may change from time to time.
Allocation of Opportunities
Our investment objectives and investment strategies are similar to those of other client accounts managed by our Investment Adviser (including Goldman Sachs Private Middle Market Credit LLC (“GS PMMC”) and Goldman Sachs Middle Market Lending Corp. (“GS MMLC”), privately offered BDCs, collectively, the “Accounts”), and an investment appropriate for us may also be appropriate for those Accounts. This creates potential conflicts in allocating investment opportunities among us and such other Accounts, particularly in circumstances where the availability of such investment opportunities is limited, where the liquidity of such investment opportunities is limited or where co-investments by us and other Accounts are not permitted under applicable law.
We are prohibited under the Investment Company Act from participating in certain transactions with our affiliates without the prior approval of our independent directors (“Independent Directors”) and, in some cases, of the SEC. Any person that owns, directly or indirectly, five percent or more of our outstanding voting securities will be our affiliate for purposes of the Investment Company Act, and we are generally prohibited from buying or selling any assets from or to, or entering into certain “joint” transactions (which could include investments in the same portfolio company) with such affiliates, absent the prior approval of the Independent Directors. Our Investment Adviser and its affiliates, including persons that control, or are under common control with, us or our Investment Adviser, are also considered our affiliates under the Investment Company Act, and we are generally prohibited from buying or selling any assets from or to, or entering into “joint” transactions with, such affiliates without exemptive relief from the SEC or applicable SEC staff guidance.
Subject to applicable law, Goldman Sachs or other Accounts may invest alongside us. In certain circumstances, negotiated co-investments by us and other funds managed by our Investment Adviser may be made only pursuant to an order from the SEC permitting us to do so. In January 2017, we received an exemptive order from the SEC that permits us to participate in negotiated co-investment transactions with certain affiliates (including GS PMMC and GS MMLC), each of whose investment adviser is GSAM, in a manner consistent with our investment objectives, positions, policies, strategies and restrictions, as well as regulatory requirements and pursuant to the conditions required by the exemptive relief.
We may also invest alongside other Accounts advised by our Investment Adviser and its affiliates in certain circumstances where doing so is consistent with applicable law and SEC staff guidance and interpretations. For example, we may invest alongside such Accounts consistent with guidance promulgated by the staff of the SEC permitting us and such other Accounts to purchase interests in a single class of privately placed securities so long as certain conditions are met, including that our Investment Adviser, acting on our behalf and on behalf of its other clients, negotiates no term other than price. We may also invest alongside other Accounts as otherwise permissible under SEC staff guidance and interpretations, applicable regulations and the allocation policy of our Investment Adviser.
8
If we are unable to rely on our exemptive relief for a particular opportunity, our Investment Adviser will be required to determine which Accounts should make the investment at the potential exclusion of other Accounts. To address potential conflicts in such allocations, our Investment Adviser has developed allocation policies and procedures that provide that personnel of our Investment Adviser making portfolio decisions for Accounts will make purchase and sale decisions and allocate investment opportunities among Accounts consistent with its fiduciary obligations. The policy provides that our Investment Adviser allocate opportunities through a rotation system or in such other manner as our Investment Adviser determines to be equitable. To the extent permitted by applicable law, these policies and procedures may result in the pro rata allocation of limited opportunities across eligible Accounts managed by a particular portfolio management team, but in many other cases the allocations reflect numerous other factors as described below. Accounts managed outside of the GSAM Private Credit Group are generally viewed separately for allocation purposes. There will be cases where certain Accounts receive an allocation of an investment opportunity when we do not and vice versa.
In some cases, due to information barriers that are in place, other Accounts may compete with us for specific investment opportunities without being aware that they are competing against each other. Goldman Sachs has a conflicts system in place above these information barriers to identify potential conflicts early in the process and determine if an allocation decision needs to be made. If the conflicts system detects a potential conflict, the legal and compliance departments of Goldman Sachs assess investment opportunities to determine whether a particular investment opportunity is required to be allocated to a particular Account (including us) or is prohibited from being allocated to a particular Account. Subject to a determination by the legal and compliance departments (if applicable), portfolio management teams are then charged with ensuring that investment opportunities are allocated to the appropriate Account.
Personnel of our Investment Adviser involved in decision-making for Accounts may make allocation related decisions for us and other Accounts by reference to one or more factors, including, but not limited to: the Account’s portfolio and its investment horizons, objectives, guidelines and restrictions (including legal and regulatory restrictions); strategic fit and other portfolio management considerations, including different desired levels of investment for different strategies; the expected future capacity of the applicable Accounts; cash and liquidity considerations; and the availability of other appropriate investment opportunities. Suitability considerations, reputational matters and other considerations may also be considered. The application of these considerations may cause differences in the performance of different Accounts that have similar strategies. In addition, in some cases our Investment Adviser may make investment recommendations to Accounts where the Accounts make the investment independently of our Investment Adviser, which may result in a reduction in the availability of the investment opportunity for other Accounts (including us) irrespective of our Investment Adviser’s policies regarding allocation of investments. With respect to us, the Investment Adviser may also make allocation-related decisions by reference to Senior Credit Fund, consistent with the nature of the relationship between us and Senior Credit Fund, even though there is no formal investment advisory relationship between the Investment Adviser and Senior Credit Fund. Additional information about our Investment Adviser’s allocation policies is set forth in Item 6 (“Performance-based Fees and Side-by-Side Management—Side-by-Side Management of Advisory Accounts; Allocation of Opportunities”) of our Investment Adviser’s Form ADV.
Our Investment Adviser, including the GSAM Credit Alternatives Team, may, from time to time, develop and implement new trading strategies or seek to participate in new investment opportunities and trading strategies. These opportunities and strategies may not be employed in all Accounts or pro rata among Accounts where they are employed, even if the opportunity or strategy is consistent with the objectives of such Accounts.
During periods of unusual market conditions, our Investment Adviser may deviate from its normal trade allocation practices. For example, this may occur with respect to the management of unlevered and/or long-only Accounts that are typically managed on a side-by-side basis with levered and/or long-short Accounts.
We may receive opportunities sourced by Goldman Sachs businesses and affiliates, but in no event do we have any rights with respect to such opportunities. Subject to applicable law, including the Investment Company Act, such opportunities or any portion thereof may be offered to other Accounts, Goldman Sachs, all or certain investors in us, or such other persons or entities as determined by Goldman Sachs in its sole discretion. We will have no rights and will not receive any compensation related to such opportunities. For a further explanation of the allocation of opportunities and other conflicts and the risks related thereto, please see “Item 1A. Risk Factors—Risks Relating to Our Business and Structure—Potential conflicts of interest with other businesses of Goldman Sachs could impact our investment returns.”
9
Market Opportunity
According to the National Center for the Middle Market and the CIA World Fact Book, the U.S. middle market is comprised of approximately 200,000 companies that collectively generate revenues of more than $10.00 trillion annually(1). The U.S. middle market represents nearly 33% of private sector gross domestic product, or equivalent to the world’s third largest global economy on a stand-alone basis. The GSAM Private Credit Group believes that existing market conditions and regulatory changes have combined to create an attractive investment environment for non-bank lenders such as us to provide loans to U.S. middle market companies. Specifically:
| • | Recent changes in the regulatory capital charges imposed on the banking sector for unrated, illiquid assets have caused banks to reduce their lending activities to middle-market companies. Stakeholders in banks, including their shareholders, lenders and regulators, continue to exert pressure to contain the amount of illiquid, unrated assets held on bank balance sheets. Examples of this include moves to codify the BASEL III accords in the United States, which would increase the regulatory capital charge for lower rated and unrated assets in most instances, and continued investor focus on the amount of illiquid assets whose fair value cannot be determined by using observable measures, or “Level 3 assets,” held on bank balance sheets. As a result, the GSAM Private Credit Group believes that many banks have been forced to reduce their lending to middle-market companies, creating an opportunity for alternative lenders such as us to fill the void. |
| • | Changes in business strategy by banks have further reduced the supply of capital to middle-market companies. The trend of consolidation of regional banks into money center banks has reduced the focus of these businesses on middle-market lending. Money center banks traditionally focus on lending and providing other services to large corporate clients to whom they can deploy larger amounts of capital more efficiently. The GSAM Private Credit Group believes that this has resulted in fewer bank lenders to U.S. middle-market companies and reduced the availability of debt capital to the companies we target. |
| • | The capital markets have been unable to fill the void in middle-market finance left by banks. While underwritten bond and syndicated loan markets have been robust in recent years, middle-market companies are rarely able to access these markets, as participants are generally highly focused on the liquidity characteristics of the bond or loan being issued. For example, mutual funds and exchange traded funds (“ETFs”) are significant buyers of underwritten bonds. However, mutual funds (and certain ETFs) generally require the ability to liquidate their investments quickly in order to fund investor redemptions. Accordingly, the existence of an active secondary market for bonds is an important consideration in the initial investment decision. Because there is typically no active secondary market for the debt of U.S. middle-market companies, mutual funds and ETFs generally do not provide capital to U.S. middle-market companies. The GSAM Private Credit Group believes that this is likely to be a persistent problem for the capital markets and creates an advantage for investors like us who have a stable capital base and can therefore invest in illiquid assets. |
| • | It is difficult for new lending platforms to enter the middle market and fill the capital void because it is very fragmented. While the middle market is a very large component of the U.S. economy, it is a highly fragmented space with thousands of companies operating in many different geographies and industries. Typically, companies that need capital find lenders and investors based on preexisting relationships, referrals and word of mouth. Developing the many relationships required and wide-spread recognition as a source of capital to the middle market is a time consuming, highly resource-intensive endeavor. As a result, the GSAM Private Credit Group believes that it is difficult for new lending platforms to successfully enter the middle market, thereby providing insulation from rapid shifts in the supply of capital to the middle market that might otherwise disrupt pricing of capital. |
| (1) | Estimate by the National Center for the Middle Market, which defined middle market as companies with annual revenue of $10 million—$1 billion. See http://www.middlemarketcenter.org (relying on data from the 2015 CIA World Factbook, available at https://www.cia.gov/library/publications/the-world-factbook/). |
10
Competitive Advantages
The Goldman Sachs Platform: Goldman Sachs is a leading global financial institution that provides a wide range of financial services to a substantial and diversified client base, including companies and high net worth individuals, among others. The firm is headquartered in New York and maintains offices across the United States and in all major financial centers around the world. Group Inc.’s asset management subsidiary, GSAM, is one of the world’s leading investment managers with over 750 investment professionals and over $1.17 trillion of assets under supervision, in each case as of December 31, 2016. GSAM’s investment teams, including the GSAM Private Credit Group, capitalize on the relationships, market insights, risk management expertise, technology and infrastructure of Goldman Sachs. We believe the Goldman Sachs platform delivers a meaningful competitive advantage to us in the following ways:
| • | Origination of Investment Opportunities: Goldman Sachs has a preeminent network of relationships and the ability to provide valued intellectual, as well as financial, capital to middle market borrowers which we believe significantly enhances our origination capability. We believe that many borrowers prefer to do business with Goldman Sachs and its advised funds because of its ability to offer further services to middle market companies as they grow in their life cycle, including financial advice, acquisition opportunities and capital markets expertise. The GSAM Private Credit Group is also able to leverage the Goldman Sachs platform to provide middle market companies with access to Goldman Sachs’ broad client network, which can be utilized to find new customers and partners as the GSAM Private Credit Group seeks to grow and execute its strategic plans. |
| • | Evaluation of Investment Opportunities: The GSAM Private Credit Group is comprised of seasoned professionals with significant private credit investing experience. The team draws on a diverse array of skill sets, spanning fundamental credit and portfolio management, as well as legal and transactional structuring expertise. The GSAM Private Credit Group is trained in, and utilizes, proprietary investment practices and procedures developed over many decades by Goldman Sachs, including those related to performing due diligence on prospective portfolio investments and reviewing the backgrounds of potential partners. Further, Goldman Sachs is an active participant in a wide array of industries, both in service to clients operating in many different industries and acting as a principal or customer in such industries. Accordingly, Goldman Sachs houses a tremendous amount of industry knowledge and experience. The GSAM Private Credit Group is able to draw upon these industry insights and expertise as it evaluates investment opportunities. |
| • | Risk Monitoring of Investments: The GSAM Private Credit Group has significant processes and procedures in place, including proprietary information technology systems, to monitor and evaluate the performance of its investments at the asset level. In addition, we benefit from Goldman Sachs’ extensive risk management capabilities, which have been developed and honed over many investment cycles. Our portfolio is regularly reviewed and stressed under various scenarios by senior risk management personnel within Goldman Sachs. These scenarios are drawn from the expertise developed by Goldman Sachs for its own balance sheet. This risk monitoring is designed to assist the GSAM Private Credit Group in seeking to minimize the risk of capital loss and maintain an investment portfolio that is expected to perform in a broad range of economic conditions. |
| • | Financing of Portfolio: As one of the world’s largest asset management firms, GSAM is a significant counterparty to many providers of capital. In addition, GSAM has a world-class asset management infrastructure, including significant resources in operations, legal, compliance and other support functions. This scale, combined with the institutional infrastructure to support it, gives capital providers an incentive to do business with GSAM and confidence that their capital will be well guarded. Accordingly, we believe that we are able to obtain favorable terms from financing providers, including attractive interest rates, advance rates, durations and covenants. We believe that we will continue to benefit from GSAM’s scale and infrastructure through attractive financing terms as we seek additional sources of capital in the future. |
| • | Existing Portfolio of Performing, Predominantly Senior Loans: Since our inception, we have originated a sizable investment portfolio. As of December 31, 2016, we had 49 investments in 40 portfolio companies operating across 26 different industries with an aggregate fair value of $1,167.29 million (excluding our investment in a money market fund managed by an affiliate of Group Inc.). We believe that this portfolio will generate attractive risk adjusted levels of income that will support dividend payments to our stockholders. |
11
| • | Strategic Joint Venture: We co-invest with Cal Regents through the Senior Credit Fund, an unconsolidated Delaware limited liability company. The objective of the Senior Credit Fund is to generate attractive rates of return by investing primarily in first lien loans to middle-market companies through a vehicle capitalized in part with debt that is non-recourse to the Company. While the loans in the Senior Credit Fund typically bear interest rates lower than the loans held directly on our balance sheet, the return on our investment in the Senior Credit Fund is targeted to be higher than our direct investments, reflecting the impact of the Senior Credit Fund’s financing strategy. The Senior Credit Fund is expected to maintain a debt-to-equity ratio of approximately 2 to 1. The Senior Credit Fund is managed by a six member board of managers, on which we and Cal Regents each have equal representation. Investment decisions generally must be unanimously approved by a quorum of the board of managers. Establishing a quorum for the Senior Credit Fund’s board of managers requires at least four members to be present at a meeting, including at least two of our representatives and two of Cal Regents’ representatives. If there are five members present at a meeting, all three representatives of Cal Regents must be present to constitute a quorum. We and Cal Regents each has a 50% economic ownership of the Senior Credit Fund and each has subscribed to fund $100.00 million. As of December 31, 2016, we and Cal Regents each had contributed $77.59 million to the Senior Credit Fund. See “Management’s Discussion and Analysis of Financial Condition and Results of Operations—Senior Credit Fund, LLC.” |
| • | Broad Existing Shareholder Base: We believe that the breadth of our shareholder base and our proven ability to attract investors will continue to support our future growth plans. |
Operating and Regulatory Structure
We have elected to be treated as a BDC under the Investment Company Act. As a BDC, we are generally prohibited from acquiring assets other than qualifying assets unless, after giving effect to any acquisition, at least 70% of our total assets are qualifying assets. Qualifying assets generally include securities of eligible portfolio companies, cash, cash equivalents, U.S. government securities and high-quality debt instruments maturing in one year or less from the time of investment. Under the rules of the Investment Company Act, “eligible portfolio companies” include (i) private U.S. operating companies, (ii) public U.S. operating companies whose securities are not listed on a national securities exchange (e.g., the NYSE) or registered under the Exchange Act, and (iii) public U.S. operating companies having a market capitalization of less than $250 million. Public U.S. operating companies whose securities are quoted on the over-the-counter bulletin board and through OTC Markets Group Inc. are not listed on a national securities exchange and therefore are eligible portfolio companies. In addition, we currently are an “emerging growth company,” as defined in the JOBS Act. See “Item 1. Business—Qualifying Assets.”
We have elected to be treated, and expect to qualify annually, as a RIC under Subchapter M of the Code, commencing with our taxable year ended December 31, 2013. As a RIC, we generally will not be required to pay corporate-level U.S. federal income taxes on any net ordinary income or capital gains that we timely distribute to our stockholders as dividends if we meet certain source of income, distribution and asset diversification requirements. We intend to timely distribute to our stockholders substantially all of our annual taxable income for each year, except that we may retain certain net capital gains for reinvestment and, depending upon the level of taxable income earned in a year, we may choose to carry forward taxable income for distribution in the following year and pay any applicable U.S. federal excise tax. In addition, the distributions we pay to our stockholders in a year may exceed our net ordinary income and capital gains for that year and, accordingly, a portion of such distributions may constitute a return of capital for U.S. federal income tax purposes. See “Item 5. Market for Registrant’s Common Equity, Related Stockholder Matters and Issuer Purchases of Equity Securities—Price Range of Common Stock.”
Investments
We seek to create a portfolio that includes primarily direct originations of secured debt, including first lien, unitranche, including last out portions of such loans, and second lien debt, and unsecured debt, including mezzanine debt, as well as through select equity investments. We expect to make investments through both primary originations and open-market secondary purchases. We currently do not limit our focus to any specific industry. If we are successful in achieving our investment objective, we believe that we will be able to provide our stockholders with consistent dividend distributions and attractive risk adjusted total returns.
12
As of December 31, 2016, our portfolio (which term does not include our investment in a money market fund managed by an affiliate of Group Inc.) on a fair value basis, was comprised of approximately 91.5% secured debt investments (62.7% in first lien debt (including 26.6% in first lien/last-out unitranche loans) and 28.8% in second lien debt), 0.3% in unsecured debt investments, 1.0% in preferred stock, 0.5% in common stock and 6.7% in investment funds & vehicles. We expect that our portfolio will continue to include secured debt, including first lien, unitranche, including last out portions of such loans, and second lien debt, unsecured debt (including mezzanine debt) and, to a lesser extent, equities. In addition to investments in U.S. middle-market companies, we may invest a portion of our capital in opportunistic investments, such as in large U.S. companies, foreign companies, stressed or distressed debt, structured products or private equity. Such investments are intended to enhance our risk adjusted returns to stockholders, and the proportion of these types of investments will change over time given our views on, among other things, the economic and credit environment in which we are operating, although these types of investments generally will constitute less than 30% of our total assets.
In the future, we may also securitize a portion of our investments in any or all of our assets. We expect that our primary use of funds will be to make investments in portfolio companies, distribute cash to holders of our common stock and pay our operating expenses, including debt service to the extent we borrow or issue senior securities to fund our investments.
Investment Criteria
We are committed to a value-oriented philosophy implemented by our Investment Adviser, which manages our portfolio and seeks to minimize the risk of capital loss without foregoing the potential for capital appreciation. We have identified several criteria, discussed below, that GSAM believes are important in identifying and investing in prospective portfolio companies.
These criteria provide general guidelines for our investment decisions. However, we caution that not all of these criteria will be met by each prospective portfolio company in which we choose to invest. Generally, we seek to use our experience and access to market information to identify investment candidates and to structure investments quickly and effectively.
| • | Value orientation and positive cash flow. Our investment philosophy places a premium on fundamental analysis and has a distinct value orientation. We focus on companies in which we can invest at relatively low multiples of operating cash flow and that are profitable at the time of investment on an operating cash flow basis. Typically, we do not expect to invest in start-up companies or companies having speculative business plans. |
| • | Experienced management and established financial sponsor relationships. We generally require that our portfolio companies have an experienced management team. We also require the portfolio companies to have proper incentives in place to induce management to succeed and to act in concert with our interests as investors. In addition, we focus our investments in companies backed by strong financial sponsors that have a history of creating value and with whom members of our Investment Adviser have an established relationship. |
| • | Strong and defensible competitive market position. We seek to invest in target companies that have developed leading market positions within their respective markets and are well-positioned to capitalize on growth opportunities. We also seek companies that demonstrate significant competitive advantages versus their competitors, which should help to protect their market position and profitability while enabling us to protect our principal and avoid capital losses. |
| • | Viable exit strategy. We seek to invest in companies that GSAM believes will provide a steady stream of cash flow to repay our loans and reinvest in their respective businesses. We expect that such internally generated cash flow, leading to the payment of interest on, and the repayment of the principal of, our investments in portfolio companies to be a key means by which we exit from our investments over time. In addition, we also seek to invest in companies whose business models and expected future cash flows offer attractive exit possibilities. These companies include candidates for strategic acquisition by other industry participants and companies that may repay our investments through an initial public offering of common stock or other capital markets transactions. |
13
| • | Due diligence. Our Investment Adviser takes a bottom-up, fundamental research approach to our potential investments. It believes it is critical to conduct extensive due diligence on investment targets and in evaluating new investments. Our Investment Adviser conducts a rigorous due diligence process that is applied to prospective portfolio companies and draws from its experience, industry expertise and network of contacts. In conducting due diligence, our Investment Adviser uses information provided by companies, financial sponsors and publicly available information as well as information from relationships with former and current management teams, consultants, competitors and investment bankers. |
Our due diligence typically includes:
| • | review of historical and prospective financial information; |
| • | review of the capital structure; |
| • | analysis of the business and industry in which the prospective portfolio company operates; |
| • | on-site visits; |
| • | interviews with management, employees, customers and vendors of the potential portfolio company; |
| • | review of loan documents; |
| • | background checks; and |
| • | research relating to the portfolio company’s management, industry, markets, products and services and competitors. |
Upon the completion of due diligence and a decision to proceed with an investment in a company, the team leading the investment presents the investment opportunity to our Investment Committee. This committee determines whether to pursue the potential investment. All new investments are required to be reviewed by the Investment Committee. The members of the Investment Committee are employees of our Investment Adviser and they do not receive separate compensation from us or our Investment Adviser for serving on the Investment Committee.
Additional due diligence with respect to any investment may be conducted on our behalf (and at our expense) by attorneys and independent auditors prior to the closing of the investment, as well as other outside advisers, as appropriate.
Investment Committee
All investment decisions are made by the Investment Committee of GSAM Private Credit Group which consists of five voting members, Brendan McGovern, Salvatore Lentini, Jon Yoder, David Yu and Scott Turco, as well as three non-voting members with operational and/or legal expertise. Our Investment Committee is responsible for approving all of our investments. Our Investment Committee also monitors investments in our portfolio and approves all asset dispositions. We expect to benefit from the extensive and varied relevant experience of the investment professionals serving on our Investment Committee, which includes expertise in privately originated and publicly traded leveraged credit, stressed and distressed debt, bankruptcy, mergers and acquisitions and private equity.
The purpose of our Investment Committee is to evaluate and approve all investments by our Investment Adviser. Our Investment Committee process is intended to bring the diverse experience and perspectives of our Investment Committee’s members to the analysis and consideration of every investment. Our Investment Committee also serves to provide investment consistency and adherence to our Investment Adviser’s investment philosophies and policies. Our Investment Committee also determines appropriate investment sizing and suggests ongoing monitoring requirements.
In addition to reviewing investments, our Investment Committee meetings serve as a forum for discussing credit views and outlooks, as well as reviewing investments. Potential transactions and investment opportunities are also reviewed on a regular basis. Members of our Investment Adviser’s investment team are encouraged to share information and views on credits with our Investment Committee early in their analysis. This process improves the quality of the analysis and assists the deal team members to work more efficiently.
14
Investment Structure
Once we determine that a prospective portfolio company is suitable for investment, we work with the management of that company and its other capital providers, including senior, junior and equity capital providers, to structure an investment. We negotiate among these parties and use creative and flexible approaches to structure our investment relative to the other capital in the portfolio company’s capital structure.
We expect our secured debt to have terms of three to ten years. We generally obtain security interests in the assets of our portfolio companies that will serve as collateral in support of the repayment of this debt. This collateral may take the form of first or second priority liens on the assets of a portfolio company.
We use the term “mezzanine” to refer to debt that ranks senior only to a borrower’s equity securities and ranks junior in right of payment to all of such borrower’s other indebtedness. Mezzanine debt typically has interest-only payments in the early years, payable in cash or in-kind, with amortization of principal deferred to the later years of the mezzanine debt. In some cases, we may enter into mezzanine debt that, by its terms, converts into equity (or is issued along with warrants for equity) or additional debt securities or defers payments of interest for the first few years after our investment. Typically, our mezzanine debt investments have maturities of three to ten years.
We also invest in unitranche loans, which are loans that combine features of first-lien, second-lien and mezzanine debt, generally in a first-lien position. In a number of instances, we may find another lender to provide the “first out” portion of such loan and retain the “last out” portion of such loan, in which case, the “first out” portion of the loan would generally receive priority with respect to payment of principal, interest and other amounts due thereunder over the “last out” portion that we would continue to hold.
In the case of our secured debt and unsecured debt, including mezzanine debt investments, we seek to tailor the terms of the investments to the facts and circumstances of the transactions and the prospective portfolio companies, negotiating a structure that protects our rights and manages our risk while creating incentives for the portfolio companies to achieve their business plan and improve their profitability. For example, in addition to seeking a senior position in the capital structure of our portfolio companies, we seek to limit the downside potential of our investments by:
| • | requiring a total return on our investments (including both interest and potential equity appreciation) that compensates us for credit risk; |
| • | incorporating “put” rights and call protection into the investment structure; and |
| • | negotiating contractual provisions in connection with our investments that afford our portfolio companies as much flexibility in managing their businesses as possible, consistent with preservation of our capital. Such provisions may include affirmative and negative covenants, default penalties, lien protection, change of control provisions and board rights, including either observation or participation rights. Our investments may include equity features, such as direct investments in the equity or convertible securities of portfolio companies or warrants or options to buy a minority interest in a portfolio company. Any warrants we may receive with our debt securities generally require only a nominal cost to exercise, so as a portfolio company appreciates in value, we may achieve additional investment return from these equity investments. We may structure the warrants to provide provisions protecting our rights as a minority-interest holder, as well as puts, or rights to sell such securities back to the company, upon the occurrence of specified events. In many cases, we may also obtain registration rights in connection with these equity investments, which may include demand and “piggyback” registration rights. |
We expect to hold most of our investments to maturity or repayment, but may sell certain investments earlier if a liquidity event takes place, such as the sale or refinancing of a portfolio company. We also may turn over our investments to better position the portfolio as market conditions change.
15
Ongoing relationships with portfolio companies
Monitoring
Our Investment Adviser monitors our portfolio companies on an ongoing basis. It monitors the financial trends of each portfolio company to determine if they are meeting their respective business plans and to assess the appropriate course of action for each company. Our Investment Adviser has several methods of evaluating and monitoring the performance and fair value of our investments, which may include the following:
| • | assessment of success in adhering to the portfolio company’s business plan and compliance with covenants; |
| • | periodic or regular contact with portfolio company management and, if appropriate, the financial or strategic sponsor to discuss financial position, requirements and accomplishments; |
| • | comparisons to our other portfolio companies in the industry, if any; |
| • | attendance at and participation in board meetings or presentations by portfolio companies; and |
| • | review of monthly and quarterly financial statements and financial projections of portfolio companies. |
Our Investment Adviser also employs an investment rating system to categorize our investments. In addition to various risk management and monitoring tools, our Investment Adviser grades the credit risk of all investments on a scale of 1 to 4 no less frequently than quarterly. This system is intended primarily to reflect the underlying risk of a portfolio investment relative to our initial cost basis in respect of such portfolio investment (i.e., at the time of origination or acquisition), although it may also take into account under certain circumstances the performance of the portfolio company’s business, the collateral coverage of the investment and other relevant factors. Under this system, investments graded 1 involve the least amount of risk to our initial cost basis. The trends and risk factors for this investment since origination or acquisition are generally favorable, which may include the performance of the portfolio company or a potential exit. Investments graded 2 involve a level of risk to our initial cost basis that is similar to the risk to our initial cost basis at the time of origination or acquisition. This portfolio company is generally performing as expected and the risk factors to our ability to ultimately recoup the cost of our investment are neutral to favorable. All investments or acquired investments in new portfolio companies are initially assessed a grade of 2. Investments graded 3 indicate that the risk to our ability to recoup the initial cost basis of such investment has increased materially since origination or acquisition, including as a result of factors such as declining performance and non-compliance with debt covenants; however, payments are generally not more than 120 days past due. Investments graded 4 indicate that the risk to our ability to recoup the initial cost basis of such investment has substantially increased since origination or acquisition, and the portfolio company likely has materially declining performance. For debt investments with an investment grade of 4, most or all of the debt covenants are out of compliance and payments are substantially delinquent. For investments graded 4, it is anticipated that we will not recoup our initial cost basis and may realize a substantial loss of our initial cost basis upon exit. For investments graded 3 or 4, the Investment Adviser enhances its level of scrutiny over the monitoring of such portfolio company. The Investment Adviser grades the investments in our portfolio at least each quarter and it is possible that the grade of a portfolio investment may be reduced or increased over time.
Managerial Assistance
As a BDC, we must offer, and must provide upon request, significant managerial assistance to certain of our eligible portfolio companies within the meaning of Section 55 of the Investment Company Act. This assistance could involve, among other things, monitoring the operations of our portfolio companies, participating in board and management meetings, consulting with and advising officers of portfolio companies and providing other organizational and financial guidance. Our Investment Adviser or an affiliate thereof may provide such managerial assistance on our behalf to portfolio companies that request such assistance. We may receive fees for these services. See “Item 1. Business—Managerial Assistance to Portfolio Companies.”
Competition
Our primary competitors provide financing to middle-market companies and include other BDCs, commercial and investment banks, commercial financing companies, collateralized loan obligations (“CLOs”), private funds, including hedge funds, and, to the extent they provide an alternative form of financing, private equity funds. Some of our existing and potential competitors are substantially larger and have considerably greater financial, technical and marketing resources than we do. For example, some competitors may have a lower cost of funds and access to funding sources that are not available to us.
16
In addition, some of our competitors may have higher risk tolerances or different risk assessments, which could allow them to consider a wider variety of investments and establish more relationships than us. Furthermore, many of our competitors are not subject to the regulatory restrictions that the Investment Company Act imposes on us as a BDC.
While we expect to use the industry information of GSAM’s investment professionals to which we have access to assess investment risks and determine appropriate pricing for our investments in portfolio companies, we do not seek to compete primarily based on the interest rates we offer and GSAM believes that some of our competitors may make loans with interest rates that are comparable to or lower than the rates we offer. Rather, we compete with our competitors based on our reputation in the market, our existing investment platform, the seasoned investment professionals of our Investment Adviser, our experience and focus on middle-market companies, our disciplined investment philosophy, our extensive industry focus and relationships and our flexible transaction structuring.
Staffing
We do not currently have any employees. Our day-to-day operations are managed by our Investment Adviser. Our Investment Adviser has hired and expects to continue to hire professionals with skills applicable to our business plan, including experience in middle-market investing, leveraged finance and capital markets.
Properties
We do not own any real estate or other properties materially important to our operations. Our principal executive offices are located at 200 West Street, New York, New York 10282. We believe that our office facilities are suitable and adequate for our business as it is contemplated to be conducted.
Legal Proceedings
We and our Investment Adviser are not currently subject to any material legal proceedings, although we may, from time to time, be involved in litigation arising out of operations in the normal course of business or otherwise.
Our Administrator
Pursuant to our Administration Agreement, our administrator is responsible for providing various accounting and administrative services to us. Our administrator is entitled to fees as described in “Item 1. Business—Administration Agreement.” To the extent that our administrator outsources any of its functions, the administrator will pay any compensation associated with such functions. See “Item 1. Business—Administration Agreement.”
Dividend Reinvestment Plan
We have adopted a dividend reinvestment plan, pursuant to which we will reinvest all cash distributions declared by our Board of Directors on behalf of investors who do not elect to receive their cash distributions in cash as provided below. As a result, if our Board of Directors declares a cash distribution, then our stockholders who have not elected (or have not previously been deemed to have elected) to “opt out” of our dividend reinvestment plan will have their cash distributions automatically reinvested in additional shares of our common stock as described below. We intend to continue to pay quarterly distributions to our stockholders out of assets legally available for distribution. Future quarterly distributions, if any, will be determined by our Board of Directors. All future distributions will be subject to lawfully available funds therefor, and no assurance can be given that we will be able to declare such distributions in future periods.
Each registered stockholder may elect to have distributions distributed in cash rather than participate in the plan. For any registered stockholder that does not so elect, distributions on such stockholder’s shares will be reinvested by State Street Bank and Trust Company, as the plan agent, in additional shares. The number of shares to be issued to the stockholder will be determined based on the total dollar amount of the cash distribution payable, net of applicable withholding taxes. The plan agent will maintain all participants’ accounts in the plan and furnish written confirmation of all transactions in the accounts. Shares in the account of each participant will be held by the plan agent on behalf of the participant in book entry form in the plan agent’s name or the plan agent’s nominee. Those stockholders whose shares are held through a broker or other nominee may receive cash distributions in cash by notifying their broker or nominee of their election.
17
The shares are acquired by the plan agent for the participants’ accounts either through (i) newly issued shares or (ii) by purchase of outstanding shares on the open market. If, on the payment date for any distribution, the most recently computed net asset value (“NAV”) per share as of the dividend payment date is equal to or less than the closing market price plus estimated per share fees (which include any applicable brokerage commissions the plan agent is required to pay) (such condition often referred to as a “premium”), the plan agent will invest the distribution amount in newly issued shares on behalf of the participants. The number of newly issued shares to be credited to a participant’s account will be determined by dividing the dollar amount of the distribution by the most recently computed NAV per share as of the dividend payment date; provided that, if the most recently computed NAV as of the dividend payment date is less than or equal to 95% of the closing market price on the dividend payment date, the dollar amount of the distribution will be divided by 95% of the closing market price per share on the dividend payment date. If on the dividend payment date, the most recently computed NAV per share as of that date is greater than the closing market price per share plus per share fees (such condition referred to as a “market discount”), the plan agent will invest the dividend amount in shares acquired on behalf of the participants by purchasing shares on the open market. Such open market purchases will continue on each successive business day until the entire dividend amount has been invested pursuant to open market purchases; provided, however, that if (a) the market discount shifts to a market premium, or (b) the open market purchases have not been completed by the last business day before the next date on which the common stock trades on an “ex-dividend” basis or 30 days after the dividend payment date, whichever is sooner, the plan agent will cease making open market purchases and will invest the entire uninvested portion of the dividend amount in newly issued common stock in the manner contemplated above.
Open-market purchases may be made on any securities exchange where shares are traded, in the over-the-counter market or in negotiated transactions, and may be on such terms as to price, delivery and otherwise as the plan agent will determine. Shares purchased in open market transactions by the plan agent will be allocated to a participant based on the average purchase price, excluding any brokerage charges or other charges, of all shares purchased in the open market with respect to any such distribution. The number of shares of our common stock to be outstanding after giving effect to payment of the distribution cannot be established until the value per share at which additional shares will be issued has been determined and elections of our stockholders have been tabulated.
If a participant elects by telephone, Internet, or written notice to the plan agent to have the plan agent sell all or a part of his or her shares and remit the proceeds to the participant, the plan agent will process all sale instructions received no later than five business days after the date on which the order is received. Such sale will be made through the plan agent’s broker on the relevant market and the sale price will not be determined until such time as the broker completes the sale. In each case, the price to each participant will be the weighted average sale price obtained by the plan agent’s broker net of fees for each aggregate order placed by the plan agent and executed by the broker.
The plan agent’s fees for the handling of the reinvestment of distributions will be paid by us. However, each participant will pay a per share fee incurred in connection with open market purchases. If a participant elects by telephone, Internet, or written notice to the plan agent to have the plan agent sell all or a part of his or her shares and remit the proceeds to the participant, the plan agent is authorized to deduct a per share fee from such proceeds. All per share fees include any applicable brokerage commissions the plan agent is required to pay.
Participation in the plan is completely voluntary and may be terminated or resumed at any time without penalty. Participants may terminate their accounts under the plan by notifying the plan agent by telephone, Internet, or written notice prior to the distribution record date. Such termination will be effective immediately if received by the plan administrator prior to any distribution record date; otherwise such termination or resumption will be effective with respect to any subsequently declared dividend or other distribution. The plan agent will seek to process termination notices received after the dividend record date but before the dividend payment date prior to such dividend payment date to the extent practicable, but may in its sole discretion reinvest the participant’s dividends in common stock, as described above. If such dividends are reinvested, the plan agent will process the late termination notice as soon as practicable, but in no event later than five business days after the reinvestment is completed.
18
A stockholder who does not opt out of the dividend reinvestment plan will generally be subject to the same U.S. federal, state and local tax consequences as a stockholder who elects to receive its distributions in cash; however, because a stockholder that participates in the dividend reinvestment plan will not actually receive any cash, such a stockholder will not have such cash available to pay any applicable taxes on the deemed distribution. A stockholder that participates in the dividend reinvestment plan and thus is treated as having invested in additional shares of our stock will have a basis in such additional shares of stock equal to the total dollar amount treated as a distribution for U.S. federal income tax purposes. The stockholder’s holding period for such stock will commence on the day following the day on which the shares are credited to the stockholder’s account. Stockholders that participate in the dividend reinvestment plan will receive tax information annually for their personal records and to help them prepare their federal income tax return. For further information as to tax consequences of participation in the plan, participants should consult with their own tax advisors.
We reserve the right to amend or terminate the plan upon notice in writing to each participant at least 30 days prior to any record date for the payment of any dividend or distribution by us. There is no direct transaction fee to participants with regard to purchases in the plan; however, we reserve the right to amend the plan to include a transaction fee payable by the participants. Notice will be sent to participants of any amendments as soon as practicable after such action by us.
All correspondence concerning the plan should be directed to the plan agent at Computershare Trust Company, N.A, P.O. Box 30170, College Station, TX 77842-3170, with overnight correspondence being directed to the plan agent at Computershare Trust Company, N.A, 211 Quality Circle, Suite 210, College Station, TX 77845; by calling 855-807-2742; or through the plan agent’s website at www.computershare.com/investor. Participants who hold their shares through a broker or other nominee should direct correspondence or questions concerning the dividend reinvestment plan to their broker or nominee.
Management Agreements
Investment Management Agreement
Our initial investment management agreement with our Investment Adviser was entered into as of November 15, 2012 and subsequently amended and restated as of April 1, 2013 (as amended and restated as of April 1, 2013, the “Initial Investment Management Agreement”). Our Board of Directors determined at an in person meeting held in November 2014 to approve certain changes to the Initial Investment Management Agreement and to submit the Investment Management Agreement, which included such changes, for stockholder approval as required by the provisions of the Investment Company Act. At a special meeting of stockholders held in January 2015, our stockholders approved the Investment Management Agreement. The Investment Management Agreement became effective as of January 1, 2015.
Management Services
Pursuant to the terms of our Investment Management Agreement, GSAM, subject to the overall supervision of our Board of Directors, manages our day-to-day investment-related operations and provides investment management services to us.
Subject to compliance with applicable law and published SEC guidance, nothing contained in the Investment Management Agreement in any way precludes, restricts or limits the activities of our Investment Adviser or any of its respective subsidiaries or affiliated parties. See “Item 1A. Risk Factors—Risks Relating to Our Business and Structure—Our Investment Adviser, its principals, investment professionals and employees and the members of its Investment Committee have certain conflicts of interest.”
Management Fee
The Management Fee is calculated at an annual rate of 1.50% (0.375% per quarter) of the average value of our gross assets (excluding cash or cash equivalents (such as investments in money market funds) but including assets purchased with borrowed amounts) at the end of each of the two most recently completed calendar quarters (and, in the case of our first quarter, our gross assets as of such quarter-end). The Management Fee is payable quarterly in arrears. The Management Fee for any partial quarter will be appropriately prorated.
19
Incentive Fee
The Incentive Fee consists of two components that are determined independent of each other, with the result that one component may be payable even if the other is not. The calculation of our incentive fee pursuant to our Investment Management Agreement has been modified from the method used to calculate the Incentive Fee payable for the periods ending after January 1, 2015.
A portion of the Incentive Fee is based on our income and a portion is based on our capital gains, each as described below. Our Investment Adviser is entitled to receive the Incentive Fee based on income from us if our Ordinary Income (as defined below) exceeds a quarterly “hurdle rate” of 1.75%. For this purpose, the hurdle is computed by reference to our NAV and does not take into account changes in the market price of our common stock.
Beginning with the calendar quarter that commenced on January 1, 2015, the Incentive Fee based on income is determined and paid quarterly in arrears at the end of each calendar quarter by reference to our aggregate net investment income, as adjusted as described below, from the calendar quarter then ending and the eleven preceding calendar quarters (or if shorter, the number of quarters that have occurred since January 1, 2015). The Incentive Fee based on capital gains is determined and paid annually in arrears at the end of each calendar year by reference to an Annual Period.
The hurdle amount for the Incentive Fee based on income is determined on a quarterly basis and is equal to 1.75% multiplied by our NAV at the beginning of each applicable calendar quarter comprising the relevant Trailing Twelve Quarters. The hurdle amount is calculated after making appropriate adjustments for subscriptions (which includes all issuances by us of shares of our common stock, including issuances pursuant to our dividend reinvestment plan) and distributions that occurred during the relevant Trailing Twelve Quarters. The Incentive Fee for any partial period will be appropriately prorated.
Quarterly Incentive Fee Based on Income. For the portion of the Incentive Fee based on income, we pay our Investment Adviser a quarterly Incentive Fee based on the amount by which (A) Ordinary Income in respect of the relevant Trailing Twelve Quarters exceeds (B) the hurdle amount for such Trailing Twelve Quarters. For the avoidance of doubt, Ordinary Income is net of all fees and expenses, including the Management Fee but excluding any Incentive Fee.
The Incentive Fee based on income for each quarter is determined as follows:
| • | No Incentive Fee based on income is payable to our Investment Adviser for any calendar quarter for which there is no Excess Income Amount; |
| • | 100% of the Ordinary Income, if any, that exceeds the hurdle amount, but is less than or equal to an amount, which we refer to as the “Catch-up Amount,” determined as the sum of 2.1875% multiplied by our NAV at the beginning of each applicable calendar quarter comprising the relevant Trailing Twelve Quarters is included in the calculation of the Incentive Fee based on income; and |
| • | 20% of the Ordinary Income that exceeds the Catch-up Amount is included in the calculation of the Incentive Fee based on income. |
The amount of the Incentive Fee based on income that is paid to our Investment Adviser for a particular quarter is equal to the excess of the Incentive Fee so calculated minus the aggregate Incentive Fees based on income that were paid in respect of the first eleven calendar quarters (or the portion thereof) included in the relevant Trailing Twelve Quarters but not in excess of the Incentive Fee Cap (as described below).
The Incentive Fee Cap for any quarter is an amount equal to (a) 20% of the Cumulative Net Return (as defined below) during the relevant Trailing Twelve Quarters minus (b) the aggregate Incentive Fees based on income that were paid in respect of the first eleven calendar quarters (or the portion thereof) included in the relevant Trailing Twelve Quarters.
20
“Cumulative Net Return” means (x) the Ordinary Income in respect of the relevant Trailing Twelve Quarters minus (y) any Net Capital Loss, if any, in respect of the relevant Trailing Twelve Quarters. If, in any quarter, the Incentive Fee Cap is zero or a negative value, we will pay no Incentive Fee based on income to our Investment Adviser for such quarter. If, in any quarter, the Incentive Fee Cap for such quarter is a positive value but is less than the Incentive Fee based on income that is payable to our Investment Adviser for such quarter (before giving effect to the Incentive Fee Cap) calculated as described above, we will pay an Incentive Fee based on income to our Investment Adviser equal to the Incentive Fee Cap for such quarter. If, in any quarter, the Incentive Fee Cap for such quarter is equal to or greater than the Incentive Fee based on income that is payable to our Investment Adviser for such quarter (before giving effect to the Incentive Fee Cap) calculated as described above, we will pay an Incentive Fee based on income to our Investment Adviser equal to the Incentive Fee calculated as described above for such quarter without regard to the Incentive Fee Cap.
“Net Capital Loss” in respect of a particular period means the difference, if positive, between (i) aggregate capital losses, whether realized or unrealized, in such period and (ii) aggregate capital gains, whether realized or unrealized, in such period.
The following is a graphical representation of the calculation of the Incentive Fee based on income:
Incentive Fee based on Income
Percentage of Ordinary Income comprising the Incentive Fee based on Income
(expressed as an annualized rate(1) of return on the value of net assets as of the beginning
of each of the quarters included in the Trailing Twelve Quarters)
| (1) | The Incentive Fee is determined on a quarterly basis but has been annualized for purposes of the above diagram. The diagram also does not reflect the Incentive Fee Cap. |
Annual Incentive Fee Based on Capital Gains. The portion of the Incentive Fee based on capital gains is calculated on an annual basis. For each Annual Period, we pay our Investment Adviser an Incentive Fee equal to (A) 20% of the difference, if positive, of the sum of our aggregate realized capital gains, if any, computed net of our aggregate realized capital losses, if any, and our aggregate unrealized capital depreciation, in each case from April 1, 2013 until the end of such Annual Period minus (B) the cumulative amount of Incentive Fees based on capital gains previously paid to our Investment Adviser from April 1, 2013. For the avoidance of doubt, unrealized capital appreciation is excluded from the calculation in clause (A), above.
We accrue, but not pay, a portion of the Incentive Fee based on capital gains with respect to net unrealized appreciation. Under GAAP, we are required to accrue an Incentive Fee based on capital gains that includes net realized capital gains and losses and net unrealized capital appreciation and depreciation on investments held at the end of each period. In calculating the accrual for the Incentive Fee based on capital gains, we consider the cumulative aggregate unrealized capital appreciation in the calculation, since an Incentive Fee based on capital gains would be payable if such unrealized capital appreciation were realized, even though such unrealized capital appreciation is not permitted to be considered in calculating the fee actually payable under the Investment Management Agreement. This accrual is calculated using the aggregate cumulative realized capital gains and losses and aggregate cumulative unrealized capital appreciation or depreciation. If such amount is positive at the end of a period, then we record a capital gains incentive fee equal to 20% of such amount, minus the aggregate amount of actual Incentive Fees based on capital gains paid in all prior periods. If such amount is negative, then there is no accrual for such period. There can be no assurance that such unrealized capital appreciation will be realized in the future.
Example of Calculation of the Incentive Fee based on Income Assumptions
Assumptions(1)
| • | Quarter 1 |
| • | Net Asset Value at the start of Quarter 1 = $100.0 million |
| • | Quarter 1 Ordinary Income = $6.0 million |
21
| • | Quarter 1 Net Capital Gain = $1.0 million |
| • | Quarter 1 Hurdle Amount = $1.75 million (calculated based on an annualized 7.00% hurdle rate) |
| • | Quarter 1 Catch-up Amount = $2.1875 million (calculated based on an annualized 8.75% rate) |
| • | Quarter 2 |
| • | Net Asset Value at the start of Quarter 2 = $100.0 million |
| • | Quarter 2 Ordinary Income = $1.5 million |
| • | Quarter 2 Net Capital Gain = $1.0 million |
| • | Quarter 2 Hurdle Amount = $1.75 million (calculated based on an annualized 7.00% hurdle rate) |
| • | Quarter 2 Catch-up Amount = $2.1875 million (calculated based on an annualized 8.75% rate) |
| • | Quarter 3 |
| • | Net Asset Value at the start of Quarter 3 = $100.0 million |
| • | Quarter 3 Ordinary Income = $2.0 million |
| • | Quarter 3 Net Capital Loss = ($6.0) million |
| • | Quarter 3 Hurdle Amount = $1.75 million (calculated based on an annualized 7.00% hurdle rate) |
| • | Quarter 3 Catch-up Amount = $2.1875 million (calculated based on an annualized 8.75% rate) |
| • | Quarter 4 |
| • | Net Asset Value at the start of Quarter 4 = $100.0 million |
| • | Quarter 4 Ordinary Income = $3.5 million |
| • | Quarter 4 Net Capital Gain = $3.0 million |
| • | Quarter 4 Hurdle Amount = $1.75 million (calculated based on an annualized 7.00% hurdle rate) |
| • | Quarter 4 Catch-up Amount = $2.1875 million (calculated based on an annualized 8.75% rate) |
| (1) | For illustrative purposes, Net Asset Value is assumed to be $100.0 million as of the beginning of all four quarters and does not give effect to gains or losses in the preceding quarters. |
Determination of Incentive Fee based on income
In Quarter 1, the Ordinary Income of $6.0 million exceeds the Hurdle Amount of $1.75 million and the Catch-up Amount of $2.1875 million. There are no Net Capital Losses. As a result, an Incentive Fee based on income of $1.2 million ((100% of $437,500) + (20% of $3,812,500)) is payable to our Investment Adviser for Quarter 1.
In Quarter 2, the Quarter 2 Ordinary Income of $1.5 million does not exceed the Quarter 2 Hurdle Amount of $1.75 million, but the aggregate Ordinary Income for the Trailing Twelve Quarters of $7.5 million exceeds the aggregate Hurdle Amount for the Trailing Twelve Quarters of $3.5 million and the aggregate Catch-up Amount for the Trailing Twelve Quarters of $4.375 million. There are no Net Capital Losses. As a result, an Incentive Fee based on income of $300,000 ($1.5 million ((100% of $875,000) + (20% of 3,125,000)) minus $1.2 million paid in Quarter 1) is payable to our Investment Adviser for Quarter 2.
In Quarter 3, the aggregate Ordinary Income of the Trailing Twelve Quarters of $9.5 million exceeds the aggregate Hurdle Amount for the Trailing Twelve Quarters of $5.25 million and the aggregate Catch-up Amount for the Trailing Twelve Quarters of $6.5625 million. However, there is an aggregate Net Capital Loss of ($4.0) million for the Trailing Twelve Quarters. As a result, the Incentive Fee Cap would apply. The Incentive Fee Cap equals $(400,000), calculated as follows:
(20% x ($9.5 million minus $4.0 million)) minus $1.5 million paid in Quarters 1 and 2. Because the Incentive Fee Cap is a negative value, there is no Incentive Fee based on income payable to our Investment Adviser for Quarter 3.
22
In Quarter 4, the aggregate Ordinary Income of the Trailing Twelve Quarters of $13.0 million exceeds the aggregate Hurdle Amount for the Trailing Twelve Quarters of $7.0 million and the aggregate Catch-up Amount for the Trailing Twelve Quarters of $8.75 million. The calculation of the Incentive Fee based on income would be $1.1 million ($2.6 million (100% of $1.75 million) + (20% of $4.25 million) minus $1.5 million paid in Quarters 1 and 2). However, there is an aggregate Net Capital Loss of ($1.0) million for the Trailing Twelve Quarters. As a result, the Incentive Fee Cap would apply. The Incentive Fee Cap equals $900,000 calculated as follows:
(20% x ($13.0 million minus $1.0 million)) minus $1.5 million. Because the Incentive Fee Cap is positive but less than the Incentive Fee based on income of $1.1 million calculated prior to applying the Incentive Fee Cap, an Incentive Fee based on income of $900,000 is payable to our Investment Adviser for Quarter 4.
Examples of Calculation of Incentive Fee based on Capital Gains
Assumptions
| • | Year 1: $20 million investment made in Company A (“Investment A”), $30 million investment made in Company B (“Investment B”) and $25 million investment made in Company C (“Investment C”) |
| • | Year 2: Investment A sold for $30 million, fair value of Investment B determined to be $25 million and fair value of Investment C determined to be $27 million |
| • | Year 3: fair value of Investment B determined to be $29 million and Investment C sold for $30 million |
| • | Year 4: fair value of Investment B determined to be $40 million |
Determination of Incentive Fee based on capital gains
The Incentive Fee based on capital gains, if any, would be:
| • | Year 1: None |
| • | Year 2: $1.0 million |
The portion of the Incentive Fee based on capital gains equals (A) 20% of the difference, if positive, of the sum of our aggregate realized capital gains, if any, computed net of our aggregate realized capital losses, if any, and our aggregate unrealized capital depreciation, if any, in each case from April 1, 2013 until the end of the applicable Annual Period minus (B) the cumulative amount of Incentive Fees based on capital gains previously paid to our Investment Adviser from April 1, 2013.
Therefore, using the assumptions above, the Incentive Fee based on capital gains equals (A) 20% x ($10.0 million—$5.0 million) minus (B) $0.
Therefore, the Incentive Fee based on capital gains equals $1.0 million.
| • | Year 3: $1.8 million, which is calculated as follows: |
The Incentive Fee based on capital gains equals (A) 20% x ($15.0 million—$1.0 million) minus (B) $1.0 million.
Therefore, the Incentive Fee based on capital gains equals $1.8 million.
| • | Year 4: $200,000, which is calculated as follows: |
The Incentive Fee based on capital gains equals (x) (A) 20% x ($15.0 million—$0 million) minus (B) $2.8 million.
Therefore, the Incentive Fee based on capital gains equals $200,000.
23
Expenses
Our Investment Adviser pays all costs incurred by it in connection with the performance of its duties under the Investment Management Agreement. Our Investment Adviser pays the compensation and expenses of all its personnel and makes available, without expense to us, the services of such of its partners, officers and employees as may duly be elected as our officers or directors, subject to their individual consent to serve and to any limitations imposed by law. Our Investment Adviser is not required to pay any of our expenses other than those specifically allocated to it, including as set forth below. In particular, our Investment Adviser is not required to pay: (i) our operational and organizational expenses; (ii) fees and expenses, including travel expenses, incurred by our Investment Adviser or payable to third parties related to our investments, including, among others, professional fees (including the fees and expenses of consultants and experts) and fees and expenses from evaluating, monitoring, researching and performing due diligence on investments and prospective investments; (iii) interest payable on debt, if any, incurred to finance our investments; (iv) fees and expenses incurred by us in connection with membership in investment company organizations; (v) brokers’ commissions; (vi) fees and expenses associated with calculating our NAV (including the costs and expenses of any independent valuation firm); (vii) legal, auditing or accounting expenses; (viii) taxes or governmental fees; (ix) the fees and expenses of our administrator, transfer agent or sub-transfer agent; (x) the cost of preparing stock certificates or any other expenses, including clerical expenses of issue, redemption or repurchase of our shares; (xi) the expenses of and fees for registering or qualifying our shares for sale and of maintaining our registration and registering us as a broker or a dealer; (xii) the fees and expenses of our directors who are not affiliated with our Investment Adviser; (xiii) the cost of preparing and distributing reports, proxy statements and notices to our stockholders, the SEC and other regulatory authorities; (xiv) costs of holding stockholder meetings; (xv) listing fees; (xvi) the fees or disbursements of custodians of our assets, including expenses incurred in the performance of any obligations enumerated by our certificate of incorporation or bylaws insofar as they govern agreements with any such custodian; (xvii) insurance premiums; or (xviii) costs incurred in connection with any claim, litigation, arbitration, mediation, government investigation or dispute in connection with our business and the amount of any judgment or settlement paid in connection therewith, or the enforcement of our rights against any person and indemnification or contribution expenses payable by us to any person and other extraordinary expenses not incurred in the ordinary course of our business. Our Investment Adviser is not required to pay expenses of activities which are primarily intended to result in sales of our shares, including, all costs and expenses associated with the preparation and distribution of an offering memorandum, a subscription agreement, if applicable, a registration statement, a prospectus or a stockholder application form.
Our Investment Adviser may impose a voluntary cap on the amount of expenses that will be borne by us on a monthly or annual basis. Any such expense cap may be increased, decreased, waived or eliminated at any time at our Investment Adviser’s sole discretion.
To the extent that expenses to be borne by us pursuant to the Investment Management Agreement are paid by our Investment Adviser, we will reimburse our Investment Adviser for such expenses, provided, however, that our Investment Adviser may elect, from time to time and in its sole discretion, to bear certain of our expenses set forth above, including organizational and other expenses.
Board Approval of the Investment Advisory and Management Agreement
Our Board of Directors determined at an in person meeting held on August 2, 2016 to approve the continuation of the Investment Management Agreement. In its consideration of the renewal of the Investment Management Agreement, the Board of Directors focused on information it had received relating to, among other things:
| • | the nature, quality and extent of the advisory and other services provided to us by the Investment Adviser; |
| • | the contractual terms of the Investment Management Agreement, including the structure of the Management Fee imposed on gross assets (excluding cash) and the Incentive Fee imposed on net investment income and capital gains; |
| • | comparative data with respect to the advisory fees and other expenses paid by other externally managed BDCs with similar investment objectives and strategies; |
| • | information about the services performed and the personnel performing such services under the Investment Management Agreement; |
| • | comparative data with respect to our investment performance and the performance of other BDCs with comparable investment objectives and strategies; |
| • | the Investment Adviser’s revenues and pre-tax profit margins with respect to its management of us; |
24
| • | any existing and potential benefits to the Investment Adviser or its affiliates from its relationship with us; |
| • | other potential benefits to us as a result of our relationship with the Investment Adviser; and |
| • | such other matters as the Board of Directors determined were relevant to their consideration of the Investment Management Agreement. |
In connection with their consideration of the renewal of the Investment Management Agreement, our Board of Directors gave weight to each of the factors described above, but did not identify any one particular factor as controlling their decision. After deliberation and consideration of all of the information provided, including the factors described above, the Board of Directors concluded, in the exercise of their business judgment, that the management fees paid by us were reasonable in light of the services provided to us by the Investment Adviser, the Investment Adviser’s costs, and our current and reasonably foreseeable asset levels. The Board of Directors unanimously concluded that the Investment Adviser’s continued management likely would benefit us and our stockholders and that the Investment Management Agreement should be approved and continued with respect to us until August 31, 2017.
For the year ended December 31, 2014, we paid our Investment Adviser a total of $10.90 million in fees (excluding fees that are accrued but not paid) pursuant to the Investment Management Agreement, which consisted of $9.40 million in Management Fees and $1.50 million in Incentive Fees. For the year ended December 31, 2015, we paid our Investment Adviser a total of $25.95 million in fees (excluding fees that are accrued but not paid) pursuant to the Investment Management Agreement, which consisted of $14.52 million in Management Fees and $11.43 million in Incentive Fees. For year ended December 31, 2016, we paid our Investment Adviser a total of $26.15 million in fees (excluding fees that are accrued but not paid) pursuant to the Investment Management Agreement), which consisted of $16.84 million in Management Fees and $9.31 million in Incentive Fees.
Duration and Termination
The Investment Management Agreement will remain in full force and effect for successive annual periods, but only so long as such continuance is specifically approved at least annually by (a) the vote of a majority of our Independent Directors and (b) by a vote of a majority of our Board of Directors or of a majority of our outstanding voting securities, as defined in the Investment Company Act. The Investment Management Agreement may, on 60 days’ written notice to the other party, be terminated in its entirety at any time without the payment of any penalty, by our Board of Directors, by vote of a majority of our outstanding voting stock or by our Investment Adviser. The Investment Management Agreement shall automatically terminate in the event of its assignment.
Limitation of Liability of Our Investment Adviser and the Company
The Investment Management Agreement provides that our Investment Adviser shall not be liable for any error of judgment or mistake of law or for any loss suffered by us in connection with the matters to which the Investment Management Agreement relates, except a loss resulting from our Investment Adviser’s willful misfeasance, bad faith or gross negligence in the performance of its duties or from reckless disregard by our Investment Adviser of its obligations and duties under the Investment Management Agreement. Any person, even though also employed by our Investment Adviser, who may be or become an employee of and paid by us will be deemed, when acting within the scope of such employment, to be acting in such employment solely for us and not as our Investment Adviser’s employee or agent.
Organization of our Investment Adviser
Our Investment Adviser is registered as an Investment Adviser under the Investment Advisers Act of 1940, as amended (the “Advisers Act”). The principal executive offices of our Investment Adviser are located at 200 West Street, New York, New York 10282.
Administration Agreement
Pursuant to the Administration Agreement with State Street Bank and Trust Company, our administrator, our administrator is responsible for providing various accounting and administrative services to us.
The Administration Agreement provides that the administrator is not liable to us for any damages or other losses arising out of the performance of its services thereunder except under certain circumstances, and contains provisions for the indemnification of the administrator by us against liabilities to other parties arising in connection with the performance of its services to us.
25
We pay the administrator fees for its services as we determine are commercially reasonable in our sole discretion. We also reimburse the administrator for all reasonable expenses. To the extent that our administrator outsources any of its functions, the administrator pays any compensation associated with such functions.
We are not obligated to retain our administrator. The Administration Agreement may be terminated by either party without penalty upon 30 days’ written notice to the other party.
The terms of any administration agreement that we may enter with any subsequent administrator may differ materially from the terms of the Administration Agreement with State Street Bank and Trust Company in effect prior to such retention, including providing for a fee structure that results in us, directly or indirectly, bearing higher fees for similar services and other terms that are potentially less advantageous to us. Our stockholders will not be entitled to receive prior notice of the engagement of an alternate administrator or of the terms of any agreement that is entered into with such administrator.
Transfer Agent
Computershare Trust Company, N.A. serves as our transfer agent (the “Transfer Agent”), dividend agent and registrar.
License Agreement
We are party to a license agreement with an affiliate of Goldman Sachs pursuant to which we have been granted a non-exclusive, royalty-free license to use the “Goldman Sachs” name. Under this agreement, we do not have a right to use the Goldman Sachs name if GSAM or another affiliate of Goldman Sachs is not our Investment Adviser or if our continued use of such license results in a violation of applicable law, results in a regulatory burden or has adverse regulatory consequences. Other than with respect to this limited license, we have no legal right to the “Goldman Sachs” name.
Regulation
We have elected to be treated as a BDC under the Investment Company Act. As with other companies regulated by the Investment Company Act, a BDC must adhere to certain substantive regulatory requirements. The Investment Company Act contains prohibitions and restrictions relating to transactions between BDCs and their affiliates (including any investment advisers or sub-advisers), principal underwriters and affiliates of those affiliates or underwriters and requires that a majority of the directors be persons other than “interested persons,” as that term is defined in the Investment Company Act. In addition, the Investment Company Act provides that we may not change the nature of our business so as to cease to be, or to withdraw our election as a BDC unless approved by a majority of our outstanding voting securities. A majority of the outstanding voting securities of a company is defined under the Investment Company Act as the vote: (i) of 67% or more of the voting securities present at such meeting, if the holders of more than 50% of the outstanding voting securities of such company are present or represented by proxy, or (ii) of more than 50% of the outstanding voting securities of such company, whichever is less.
Any issuance of preferred stock must comply with the requirements of the Investment Company Act. Additionally, the Investment Company Act requires, among other things, that (1) immediately after issuance and before any dividend or other distribution is made with respect to our common stock and before any purchase of common stock is made, such preferred stock together with all other senior securities must not exceed an amount equal to 50% of our total assets after deducting the amount of such dividend, distribution or purchase price, as the case may be, and (2) the holders of shares of preferred stock, if any are issued, must be entitled as a class to elect two directors at all times and to elect a majority of the directors if dividends on such preferred stock are in arrears by two full years or more. Certain other matters under the Investment Company Act require a separate class vote of the holders of any issued and outstanding preferred stock. For example, holders of preferred stock would be entitled to vote separately as a class from the holders of common stock on a proposal involving a plan of reorganization adversely affecting such securities.
26
We may invest up to 100% of our assets in securities acquired directly from issuers in privately negotiated transactions. With respect to such securities, we may, for the purpose of public resale, be deemed a “principal underwriter” as that term is defined under the Securities Act of 1933, as amended (the “Securities Act”). We may purchase or otherwise receive warrants, which offer an opportunity (not a requirement) to purchase common stock of a portfolio company in connection with an acquisition financing or other investments. Similarly, we may acquire rights that obligate an issuer of acquired securities or their affiliates to repurchase the securities at certain times, under certain circumstances. We do not intend to acquire securities issued by any investment company whereby our investment would exceed the limits imposed by the Investment Company Act. Under these limits, we generally cannot (1) acquire more than 3% of the total outstanding voting stock of any investment company, (2) invest more than 5% of the value of our total assets in the securities of one investment company or (3) invest more than 10% of the value of our total assets in the securities of investment companies in general. These limitations do not apply where we acquire interests in a money market fund as long as we do not pay a sales charge or service fee in connection with the purchase. With respect to the portion of our portfolio invested in securities issued by investment companies, it should be noted that such investments might subject our stockholders to additional expenses. None of our policies described above is fundamental and each such policy may be changed without stockholder approval, subject to any limitations imposed by the Investment Company Act.
Private funds that are excluded from the definition of “investment company” pursuant to either Section 3(c)(1) or 3(c)(7) of the Investment Company Act are also subject to certain of the limits under the Investment Company Act noted above. Specifically, such private funds may not acquire directly or through a controlled entity more than 3% of our total outstanding voting stock (measured at the time of the acquisition). Investment companies registered under the Investment Company Act are also subject to the restriction as well as other limitations under the Investment Company Act that would restrict the amount that they are able to invest in our securities. As a result, certain investors would be required to hold a smaller position in our shares than if they were not subject to such restrictions.
Qualifying Assets
Under the Investment Company Act, a BDC may not acquire any asset other than assets of the type listed in Section 55(a) of the Investment Company Act, which are referred to as “qualifying assets,” unless, at the time the acquisition is made, qualifying assets (not including certain assets specified in the Investment Company Act) represent at least 70% of the BDC’s total assets. The principal categories of qualifying assets relevant to our proposed business are the following:
| (1) | Securities purchased in transactions not involving any public offering from the issuer of such securities, which issuer (subject to certain exceptions) is an eligible portfolio company, or from any person who is, or has been during the preceding thirteen months, an affiliated person of an eligible portfolio company, or from any other person, subject to such rules and regulations as may be prescribed by the SEC. An eligible portfolio company is defined in the Investment Company Act as any issuer that: |
| (a) | is organized under the laws of, and has its principal place of business in, the United States; |
| (b) | is not an investment company (other than a SBIC wholly owned by the BDC) or a company that would be an investment company but for certain exclusions under the Investment Company Act; and |
| (c) | satisfies any of the following: |
| • | does not have any class of securities listed on a national securities exchange or has a class of securities listed on a national securities exchange but has an aggregate market value of outstanding common equity of less than $250 million; |
| • | is controlled by a BDC or a group of companies including a BDC, and the BDC has an affiliated person who is a director of the eligible portfolio company; or |
| • | is a small and solvent company having total assets of not more than $4 million and capital and surplus of not less than $2 million. |
| (2) | Securities of any eligible portfolio company that we control. |
| (3) | Securities purchased in a private transaction from a U.S. issuer that is not an investment company or from an affiliated person of the issuer, or in transactions incident thereto, if the issuer is in bankruptcy and subject to reorganization or if the issuer, immediately prior to the purchase of its securities, was unable to meet its obligations as they came due without material assistance other than conventional lending or financing arrangements. |
27
| (4) | Securities of an eligible portfolio company purchased from any person in a private transaction if there is no ready market for such securities and we already own at least 60% of the outstanding equity of the eligible portfolio company. |
| (5) | Securities received in exchange for or distributed on or with respect to securities described in (1) through (4) above, or pursuant to the exercise of options, warrants or rights relating to such securities. |
| (6) | Cash, cash equivalents, U.S. government securities or high-quality debt securities maturing in one year or less from the time of investment. |
Managerial Assistance to Portfolio Companies
A BDC must be organized and have its principal place of business in the United States and must be operated for the purpose of making investments in the types of securities described in (1), (2) or (3) above under “Item 1. Business—Qualifying Assets.” However, in order to count portfolio securities as qualifying assets for the purpose of the 70% test, the BDC must also either control the issuer of the securities or offer to make available to the issuer of the securities (other than small and solvent companies described above) significant managerial assistance; except that, where the BDC purchases such securities in conjunction with one or more other persons acting together, one of the other persons in the group may make available such managerial assistance (as long as the BDC does not make available significant managerial assistance solely in this fashion). Making available significant managerial assistance means, among other things, any arrangement whereby the BDC, through its directors, officers or employees, offers to provide, and, if accepted, does so provide, significant guidance and counsel concerning the management, operations or business objectives and policies of a portfolio company.
Temporary Investments
As a BDC, pending investment in other types of “qualifying assets,” as described above, our investments may consist of cash, cash items (such as money market funds), U.S. government securities or high-quality debt securities maturing in one year or less from the time of investment, which we refer to, collectively, as temporary investments, so that 70% of our assets are qualifying assets. We may invest in U.S. Treasury bills or in repurchase agreements, provided that such agreements are fully collateralized by cash or securities issued by the U.S. government or its agencies. A repurchase agreement involves the purchase by an investor, such as us, of a specified security and the simultaneous agreement by the seller to repurchase it at an agreed-upon future date and at a price which is greater than the purchase price by an amount that reflects an agreed-upon interest rate. There is no percentage restriction on the proportion of our assets that may be invested in such repurchase agreements. However, if more than 25% of our total assets constitute repurchase agreements from a single counterparty, we would generally not meet the asset diversification requirements in order to qualify as a RIC for U.S. federal income tax purposes. Thus, we do not intend to enter into repurchase agreements with a single counterparty in excess of this limit. Our Investment Adviser will monitor the creditworthiness of the counterparties with which we enter into repurchase agreement transactions.
Indebtedness and Senior Securities
As a BDC, we are permitted, under specified conditions, to issue multiple classes of indebtedness and one class of shares of stock senior to our common stock if our asset coverage ratio, as defined under the Investment Company Act, is at least equal to 2 to 1 immediately after each such issuance. Decreasing the asset coverage ratio to allow us to incur more debt has been under recent congressional consideration. In addition, except in limited circumstances, while any indebtedness and senior securities remain outstanding, we must make provisions to prohibit any distribution to our stockholders or the repurchase of such securities or stock unless we meet the applicable asset coverage ratios at the time of the distribution or repurchase. We may also borrow amounts up to 5% of the value of our total assets for temporary or emergency purposes without regard to asset coverage. For a discussion of the risks associated with leverage, see “Item 1A. Risk Factors—Risks Relating to Our Business and Structure—Regulations governing our operation as a BDC affect our ability to, and the way in which we, raise additional capital.”
28
Code of Ethics
We have adopted a Code of Ethics pursuant to Rule 17j-1 under the Investment Company Act and we have also approved our Investment Adviser’s Code of Ethics that it adopted in accordance with Rule 17j-1 and Rule 204A-1 under the Advisers Act. These Codes of Ethics establish, among other things, procedures for personal investments and restrict certain personal securities transactions, including transactions in securities that are held by us. Personnel subject to each code may invest in securities for their personal investment accounts, so long as such investments are made in accordance with the code’s requirements. The Codes of Ethics can be reviewed and copied at the SEC’s Public Reference Room in Washington, D.C. Information on the operation of the Public Reference Room may be obtained by calling the SEC at (202) 551-8090 or (800) SEC-0330. The Codes of Ethics are also available on the EDGAR Database on the SEC’s Internet site at http://www.sec.gov. Copies may also be obtained after paying a duplicating fee by writing the SEC’s Public Reference Section, Washington, DC 20549-0102, or by electronic request to publicinfo@sec.gov.
Proxy Voting Policies and Procedures
We have delegated the voting of portfolio securities to our Investment Adviser. For client accounts for which our Investment Adviser has voting discretion, our Investment Adviser has adopted policies and procedures (the “Proxy Voting Policy”) for the voting of proxies. Under the Proxy Voting Policy, our Investment Adviser’s guiding principles in performing proxy voting are to make decisions that favor proposals that tend to maximize a company’s shareholder value and are not influenced by conflicts of interest. To implement these guiding principles for investments in publicly traded equities, our Investment Adviser has developed customized proxy voting guidelines (the “Guidelines”) that it generally applies when voting on behalf of client accounts. These Guidelines address a wide variety of individual topics, including, among other matters, shareholder voting rights, anti-takeover defenses, board structures, the election of directors, executive and director compensation, reorganizations, mergers, issues of corporate social responsibility and various shareholder proposals.
The Proxy Voting Policy, including the Guidelines, is reviewed periodically to assure that it continues to be consistent with our Investment Adviser’s guiding principles. The Guidelines embody the positions and factors our Investment Adviser generally considers important in casting proxy votes.
Our Investment Adviser has retained a third-party proxy voting service (the “Proxy Service”), currently Institutional Shareholder Services, to assist in the implementation and administration of certain proxy voting-related functions including operational, recordkeeping, and reporting services. The Proxy Service also prepares a written analysis and recommendation (a “Recommendation”) of each proxy vote that reflects the Proxy Service’s application of the Guidelines to particular proxy issues. While it is our Investment Adviser’s policy generally to follow the Guidelines and Recommendations from the Proxy Service, our Investment Adviser’s portfolio management teams (the “Portfolio Management Teams”) may on certain proxy votes seek approval to diverge from the Guidelines or a Recommendation by following an “override” process. Such decisions are subject to a review and approval process, including a determination that the decision is not influenced by any conflict of interest. A Portfolio Management Team that receives approval through the override process to cast a proxy vote that diverges from the Guidelines and/or a Recommendation may vote differently than other Portfolio Management Teams that did not seek to override the vote. In forming their views on particular matters, the Portfolio Management Teams are also permitted to consider applicable regional rules and practices, including codes of conduct and other guides, regarding proxy voting, in addition to the Guidelines and Recommendations. Our Investment Adviser may hire other service providers to replace or supplement the Proxy Service with respect to any of the services our Investment Adviser currently receives from the Proxy Service.
From time to time, our Investment Adviser may face regulatory, compliance, legal or logistical limits with respect to voting securities that it may purchase or hold for client accounts, which can affect our Investment Adviser’s ability to vote such proxies, as well as the desirability of voting such proxies. Among other limits, federal, state and foreign regulatory restrictions or company specific ownership limits, as well as legal matters related to consolidated groups, may restrict the total percentage of an issuer’s voting securities that our Investment Adviser can hold for clients and the nature of our Investment Adviser’s voting in such securities. Our Investment Adviser’s ability to vote proxies may also be affected by, among other things: (i) late receipt of meeting notices; (ii) requirements to vote proxies in person; (iii) restrictions on a foreigner’s ability to exercise votes; (iv) potential difficulties in translating the proxy; (v) requirements to provide local agents with unrestricted powers of attorney to facilitate voting instructions; and (vi) requirements that investors who exercise their voting rights surrender the right to dispose of their holdings for some specified period in proximity to the shareholder meeting.
29
Our Investment Adviser conducts periodic due diligence meetings with the Proxy Service which include a review of the Proxy Service’s general organizational structure, new developments with respect to research and technology, work flow improvements and internal due diligence with respect to conflicts of interest.
Our Investment Adviser has adopted policies and procedures designed to prevent conflicts of interest from influencing its proxy voting decisions that our Investment Adviser makes on behalf of a client account and to help assure that such decisions are made in accordance with our Investment Adviser’s fiduciary obligations to its clients. These policies and procedures include our Investment Adviser’s use of the Guidelines and Recommendations from the Proxy Service, the override approval process previously discussed, and the establishment of information barriers between our Investment Adviser and other Goldman Sachs’ businesses. Notwithstanding such proxy voting policies and procedures, actual proxy voting decision of our Investment Adviser may have the effect of benefitting the interest of other clients or businesses of other divisions or units of Goldman Sachs and/or its affiliates, provided that our Investment Adviser believes such voting decisions to be in accordance with its fiduciary obligations. See “Item 1. Business—Proxy Voting Policies and Procedures.”
Voting decisions with respect to fixed income securities and the securities of privately held issuers generally will be made by our Investment Adviser based on its assessment of the particular transactions or other matters at issue.
Information regarding how we vote proxies relating to portfolio securities during the twelve-month period ended December 31, 2016 will be available on or through our website at https://www.GoldmanSachsBDC.com.
Privacy Principles
The following information is provided to help investors understand what personal information we collect, how we protect that information and why, in certain cases, we may share information with select other parties.
We generally will not receive any nonpublic personal information relating to stockholders who purchase our common stock. We may collect nonpublic personal information regarding our existing investors from sources such as subscription agreements, investor questionnaires and other forms; individual investors’ account histories; and correspondence between us and individual investors. We may share information that we collect regarding an investor with our affiliates and the employees of such affiliates for everyday business purposes, for example, to service the investor’s accounts and, unless an investor opts out, provide the investor with information about other products and services offered by us or our affiliates that may be of interest to the investor. In addition, we may disclose information that we collect regarding investors to third parties who are not affiliated with us (i) as authorized by our investors in investor subscription agreements or our organizational documents; (ii) as required by applicable law or in connection with a properly authorized legal or regulatory investigation, subpoena or summons, or to respond to judicial process or government regulatory authorities having property jurisdiction; (iii) as required to fulfill investor instructions; or (iv) as otherwise permitted by applicable law to perform support services for investor accounts or process investor transactions with us or our affiliates.
Any party not affiliated with us that receives nonpublic personal information relating to investors from us is required to adhere to confidentiality agreements and to maintain appropriate safeguards to protect your information. Additionally, for officers, employees and agents of ours and our affiliates, access to such information is restricted to those who need such access to provide services to us and investors. We maintain physical, electronic and procedural safeguards to seek to guard investor nonpublic personal information.
Other
We may also be prohibited under the Investment Company Act from knowingly participating in certain transactions with our affiliates without the prior approval of the members of our Board of Directors who are not interested persons and, in some cases, prior approval by the SEC. The SEC has interpreted the prohibition on transactions by BDCs with affiliates to prohibit “joint” transactions among entities that share a common investment adviser. The staff of the SEC has granted no-action relief permitting purchases of a single class of privately placed securities provided that the adviser negotiates no term other than price and certain other conditions are met. In January 2017, we received an exemptive order from the SEC that permits us to participate in negotiated co-investment transactions with certain affiliates (including GS PMMC and GS MMLC), each of whose investment adviser is GSAM, in a manner consistent with our investment objectives, positions, policies, strategies and restrictions, as well as regulatory requirements and pursuant to the conditions required by the exemptive relief. As a result of such order, there could be significant overlap in our portfolio and the investment portfolios of GS PMMC, GS MMLC and/or other funds managed by the GSAM Credit Alternatives Team.
30
As a BDC, the SEC will periodically examine us for compliance with the Investment Company Act.
We are required to provide and maintain a bond issued by a reputable fidelity insurance company, to protect against larceny and embezzlement, covering each of our officers and employees, who may singly, or jointly with others, have access to our securities or funds. Furthermore, as a BDC, we are prohibited from protecting any director, officer, Investment Adviser or underwriter against any liability to us or our stockholders arising from willful misfeasance, bad faith, gross negligence or reckless disregard of the duties involved in the conduct of such person’s office.
We and our Investment Adviser are each required to adopt and implement written policies and procedures reasonably designed to prevent violation of the federal securities laws, review these policies and procedures annually for their adequacy and the effectiveness of their implementation and designate a chief compliance officer to be responsible for administering the policies and procedures.
Compliance with the Sarbanes-Oxley Act
The Sarbanes-Oxley Act imposes a wide variety of regulatory requirements on publicly held companies and their insiders. The Sarbanes-Oxley Act requires us to review our policies and procedures to determine whether we comply with the Sarbanes-Oxley Act and the regulations promulgated thereunder. We will continue to monitor our compliance with all future regulations that are adopted under the Sarbanes-Oxley Act and will take actions necessary to ensure that we are in compliance therewith.
Compliance with Listing Requirements
Our common stock is listed on the NYSE under the symbol “GSBD.” As a listed company on the NYSE, we are subject to various listing standards including corporate governance listing standards. We believe we are in compliance with these rules.
Compliance with the JOBS Act
We currently are, and expect to remain, an “emerging growth company,” as defined in the JOBS Act signed into law in April 2012 until the earliest of:
| • | the last day of our fiscal year ending December 31, 2020; |
| • | the last day of the fiscal year in which our total annual gross revenues first exceed $1.0 billion; |
| • | the date on which we have, during the prior three-year period, issued more than $1.0 billion in non-convertible debt; or |
| • | the last day of a fiscal year in which we (1) have an aggregate worldwide market value of our common stock held by non-affiliates of $700 million or more (measured at the end of each fiscal year) as of the last business day of our most recently completed second fiscal quarter and (2) have been an Exchange Act reporting company for at least one year (and filed at least one annual report under the Exchange Act). |
Under the JOBS Act, we are exempt from the provisions of Section 404(b) of the Sarbanes-Oxley Act, which would require that our independent registered public accounting firm provide an attestation report on the effectiveness of our internal control over financial reporting. This may increase the risk that material weaknesses or other deficiencies in our internal control over financial reporting go undetected. See “Item 1A. Risk Factors—Risks Relating to Our Business and Structure—Efforts to comply with Section 404 of the Sarbanes-Oxley Act will involve significant expenditures, and non-compliance with Section 404 of the Sarbanes-Oxley Act may adversely affect us and the market price of our securities.”
In addition, Section 7(a)(2)(B) of the Securities Act and Section 13(a) of the Exchange Act, as amended by Section 102(b) of the JOBS Act, provide that an emerging growth company can take advantage of the extended transition period for complying with new or revised accounting standards. However, pursuant to Section 107 of the JOBS Act, we have chosen to “opt out” of such extended transition period, and as a result, we comply with new or revised accounting standards on the relevant dates on which adoption of such standards is required for non-emerging growth companies. Our decision to opt out of the extended transition period for complying with new or revised accounting standards is irrevocable.
31
Compliance with the Bank Holding Company Act
As a BHC and FHC, the activities of Group Inc. and its affiliates are subject to certain restrictions imposed by the Bank Holding Company Act of 1956, as amended (the “BHCA”), and related regulations. BHCs and FHCs are subject to supervision and regulation by the Federal Reserve. Because Group Inc. may be deemed to “control” us within the meaning of the BHCA, restrictions under the BHCA could apply to us. Accordingly, the BHCA and other applicable banking laws, rules, regulations and guidelines, and their interpretation and administration by the appropriate regulatory agencies, including the Federal Reserve, may restrict our investments, transactions and operations and may restrict the transactions and relationships between our Investment Adviser, Group Inc. and their affiliates, on the one hand, and us on the other hand. For example, the BHCA regulations applicable to Group Inc. and us may, among other things, restrict our ability to make certain investments or the size of certain investments, impose a maximum holding period on some or all of our investments and restrict our and our Investment Adviser’s ability to participate in the management and operations of the companies in which we invest. In addition, certain BHCA regulations may require aggregation of the positions owned, held or controlled by related entities. Thus, in certain circumstances, positions held by Group Inc. and its affiliates (including our Investment Adviser) for client and proprietary accounts may need to be aggregated with positions held by us. In this case, where BHCA regulations impose a cap on the amount of a position that may be held, Goldman Sachs may utilize available capacity to make investments for its proprietary accounts or for the accounts of other clients, which may require us to limit and/or liquidate certain investments. Additionally, Goldman Sachs may in the future, in its sole discretion and without notice to investors, engage in activities impacting us and/or our Investment Adviser in order to comply with the BHCA or other legal requirements applicable to, or reduce or eliminate the impact or applicability of any bank regulatory or other restrictions on, Goldman Sachs, us or other funds and accounts managed by our Investment Adviser and its affiliates. In addition, Goldman Sachs may cease in the future to qualify as a FHC, which may subject us to additional restrictions. Moreover, there can be no assurance that the bank regulatory requirements applicable to Goldman Sachs and us, or the interpretation thereof, will not change, or that any such change will not have a material adverse effect on us. See “Item 1A. Risk Factors—Risks Relating to Our Business and Structure—Our activities may be limited as a result of potentially being deemed to be controlled by a bank holding company.”
32
Investing in our securities involves certain risks relating to our structure and investment objective. You should carefully consider these risk factors, together with all of the other information included in this report, before you decide whether to make an investment in our securities. The risks set forth below are not the only risks we face, and we may face other risks that we have not yet identified, which we do not currently deem material or which are not yet predictable. If any of the following risks occur, our business, financial condition and results of operations could be materially adversely affected. In such case, our NAV and the trading price of our securities could decline, and you may lose all or part of your investment.
Risks Relating to Our Business and Structure
The capital markets may experience periods of disruption and instability. Such market conditions may materially and adversely affect debt and equity capital markets in the United States, which may have a negative impact on our business and operations.
From time to time, capital markets may experience periods of disruption and instability. For example, from 2008 to 2009, the global capital markets were unstable as evidenced by the lack of liquidity in the debt capital markets, significant write-offs in the financial services sector, the re-pricing of credit risk in the broadly syndicated credit market and the failure of major financial institutions. Despite actions of the U.S. federal government and various foreign governments, these events contributed to worsening general economic conditions that materially and adversely impacted the broader financial and credit markets and reduced the availability of debt and equity capital for the market as a whole and financial services firms in particular. While market conditions have improved from the beginning of the disruption, there have been recent periods of volatility and there can be no assurance that adverse market conditions will not repeat themselves in the future. If similar adverse and volatile market conditions repeat in the future, we and other companies in the financial services sector may have to access, if available, alternative markets for debt and equity capital in order to grow. Equity capital may be particularly difficult to raise during periods of adverse or volatile market conditions because, subject to some limited exceptions, as a BDC, we are generally not able to issue additional shares of our common stock at a price less than NAV per share without first obtaining approval for such issuance from our stockholders and our Independent Directors. Volatile economic conditions may lead to strategic initiatives such as the recent increase in merger activity in the BDC space.
Moreover, the re-appearance of market conditions similar to those experienced from 2008 through 2009 for any substantial length of time could make it difficult for us to borrow money or to extend the maturity of or refinance any indebtedness we may have under similar terms and any failure to do so could have a material adverse effect on our business. The debt capital that will be available to us in the future, if any, may be at a higher cost and on less favorable terms and conditions than what we currently experience. If we are unable to raise or refinance debt, then investors in our common stock may not benefit from the potential for increased returns on equity resulting from leverage and we may be limited in our ability to make new commitments or to fund existing commitments to our portfolio companies.
Given the periods of extreme volatility and dislocation in the capital markets from time to time, many BDCs have faced, and may in the future face, a challenging environment in which to raise or access capital. In addition, significant changes in the capital markets, including the extreme volatility and disruption over the past several years, has had, and may in the future have, a negative effect on the valuations of our investments and on the potential for liquidity events involving these investments. While most of our investments are not publicly traded, applicable accounting standards require us to assume as part of our valuation process that our investments are sold in a principal market to market participants (even if we plan on holding an investment through its maturity). As a result, volatility in the capital markets can adversely affect our investment valuations. Further, the illiquidity of our investments may make it difficult for us to sell such investments to access capital if required. As a result, we could realize significantly less than the value at which we have recorded our investments if we were required to sell them for liquidity purposes. In addition, a prolonged period of market illiquidity may cause us to reduce the volume of loans and debt securities we originate and/or fund and adversely affect the value of our portfolio investments, which could have a material and adverse effect on our business, financial condition, results of operations and cash flows. An inability to raise or access capital could have a material adverse impact on our business, financial condition or results of operations.
Our operation as a BDC imposes numerous constraints on us and significantly reduces our operating flexibility. In addition, if we fail to maintain our status as a BDC, we might be regulated as a closed-end investment company, which would subject us to additional regulatory restrictions.
33
The Investment Company Act imposes numerous constraints on the operations of BDCs. For example, BDCs generally are required to invest at least 70% of their total assets primarily in securities of qualifying U.S. private companies or thinly traded public companies, cash, cash equivalents, U.S. government securities and other high-quality debt investments that mature in one year or less from the time of investment. These constraints may hinder our Investment Adviser’s ability to take advantage of attractive investment opportunities and to achieve our investment objective. Furthermore, any failure to comply with the requirements imposed on BDCs by the Investment Company Act could cause the SEC to bring an enforcement action against us and/or expose us to claims of private litigants.
We may be precluded from investing in what GSAM believes are attractive investments if such investments are not qualifying assets for purposes of the Investment Company Act. If we do not invest a sufficient portion of our assets in qualifying assets, we will be prohibited from making any additional investment that is not a qualifying asset and could be forced to forgo attractive investment opportunities. Similarly, these rules could prevent us from making follow-on investments in existing portfolio companies (which could result in the dilution of our position).
If we fail to maintain our status as a BDC, we might be regulated as a closed-end investment company that is required to register under the Investment Company Act, which would subject us to additional regulatory restrictions and significantly decrease our operating flexibility. In addition, any such failure could cause an event of default under any outstanding indebtedness we might have, which could have a material adverse effect on our business, financial condition or results of operations.
We will be subject to corporate-level U.S. federal income tax on all of our income if we are unable to maintain our status as a RIC under Subchapter M of the Code, which would have a material adverse effect on our financial performance.
Although we have elected to be treated, and expect to qualify annually, as a RIC under Subchapter M of the Code, we cannot assure you that we will be able to maintain RIC status. To maintain RIC status and be relieved of U.S. federal income taxes on income and gains distributed to our stockholders, we must meet the annual distribution, source-of-income and asset diversification requirements described below.
| • | The annual distribution requirement for a RIC will be satisfied if we distribute to our stockholders on an annual basis at least 90% of our investment company taxable income (generally, our net ordinary income plus the excess of our realized net short-term capital gains over realized net long-term capital losses, determined without regard to the dividends paid deduction) for each taxable year. Because we expect to use debt financing, we expect to be subject to an asset coverage ratio requirement under the Investment Company Act, and we expect to be subject to certain covenants contained in our credit agreements and other debt financing agreements. This asset coverage ratio requirement and these covenants could, under certain circumstances, restrict us from making distributions to our stockholders that are necessary for us to satisfy the distribution requirement. If we are unable to obtain cash from other sources, and thus are unable to make sufficient distributions to our stockholders, we could fail to maintain our RIC status and thus become subject to corporate-level U.S. federal income tax (and any applicable U.S. state and local taxes). |
| • | The source-of-income requirement will be satisfied if at least 90% of our gross income for each year is derived from dividends, interest, gains from the sale of stock or securities, payments with respect to loans of certain securities, or net income derived from an interest in a “qualified publicly traded partnership, or other income derived with respect to our business of investing in such stock or securities.” |
| • | The asset diversification requirement will be satisfied if, at the end of each quarter of our taxable year, at least 50% of the value of our assets consists of cash, cash equivalents, U.S. government securities, securities of other RICs and other acceptable securities, and no more than 25% of the value of our assets is invested in the securities (other than U.S. government securities or securities of other RICs) of one issuer, of two or more issuers that are controlled, as determined under applicable Code rules, by us and that are engaged in the same or similar or related trades or businesses or of certain “qualified publicly traded partnerships.” Failure to meet these requirements may result in our having to dispose of certain investments quickly in order to prevent the loss of our RIC status. Because most of our investments will be in private companies, and therefore will be relatively illiquid, any such dispositions could be made at disadvantageous prices and could result in substantial losses. |
If we fail to maintain our RIC status for any reason, and we do not qualify for certain relief provisions under the Code, we would be subject to corporate-level U.S. federal income tax (and any applicable U.S. state and local taxes). In this event, the resulting taxes and any resulting penalties could substantially reduce our net assets, the amount of our income available for distribution and the amount of our distributions to our stockholders, which would have a material adverse effect on our financial performance.
34
We are dependent upon management personnel of our Investment Adviser for our future success.
We do not have any employees. We depend on the experience, diligence, skill and network of business contacts of the GSAM Credit Alternatives investment team. The GSAM Credit Alternatives investment team, together with other investment professionals that our Investment Adviser currently retains or may subsequently retain, identifies, evaluates, negotiates, structures, closes, monitors and manages our investments. Our future success will depend to a significant extent on the continued service and coordination of our Investment Adviser’s senior investment professionals. The departure of any of our Investment Adviser’s key personnel, including members of the GSAM Private Credit Group Investment Committee, or of a significant number of the investment professionals of our Investment Adviser, could have a material adverse effect on our business, financial condition or results of operations. In addition, we cannot assure you that our Investment Adviser will remain our investment adviser or that we will continue to have access to our Investment Adviser or its investment professionals. See “—Our Investment Adviser can resign on 60 days’ notice. We may not be able to find a suitable replacement within that time, resulting in a disruption in our operations that could adversely affect our financial condition, business and results of operations.”
Our Investment Adviser, its principals, investment professionals and employees and the members of its Investment Committee have certain conflicts of interest.
Our Investment Adviser, its principals, affiliates, investment professionals and employees, the members of its Investment Committee and our officers and directors serve or may serve now or in the future as investment advisers, officers, directors, principals of, or in other capacities with respect to, public or private entities (including other BDCs and other investment funds) that operate in the same or a related line of business as us. For example, we have the same management and investment committee team as GS PMMC and GS MMLC. Therefore, we expect these individuals may have obligations to investors in GS PMMC, GS MMLC and such other BDCs, the fulfillment of which might not be in our best interests or the best interests of our stockholders and we expect that investment opportunities will satisfy the investment criteria for both us, GS PMMC, GS MMLC and such other BDCs. In addition, GSAM and its affiliates also manage other Accounts, and expect to manage other vehicles in the future, that have investment mandates that are similar, in whole or in part, to ours and, accordingly, may invest in asset classes similar to those targeted by us. As a result, the Investment Adviser and/or its affiliates may face conflicts in allocating investment opportunities between us and such other entities. The fact that our investment advisory fees may be lower than those of certain other funds advised by GSAM could result in this conflict of interest affecting us adversely relative to such other funds.
Subject to applicable law, we may invest alongside Goldman Sachs and its Accounts. In certain circumstances, negotiated co-investments by us and other funds managed by our Investment Adviser may be made only pursuant to an order from the SEC permitting us to do so. In January 2017, we received an exemptive order from the SEC that permits us to participate in negotiated co-investment transactions with certain affiliates (including GS PMMC and GS MMLC), each of whose investment adviser is GSAM, in a manner consistent with our investment objectives, positions, policies, strategies and restrictions, as well as regulatory requirements and pursuant to the conditions required by the exemptive relief. As a result of such order, there could be significant overlap in our investment portfolio and the investment portfolios of GS PMMC, GS MMLC and/or other funds managed by our Investment Adviser. If we are unable to rely on our exemptive relief for a particular opportunity, our Investment Adviser will be required to determine which Accounts should make the investment at the potential exclusion of other Accounts. In such circumstances, the Investment Adviser will adhere to its investment allocation policy in order to determine the Account to which to allocate the opportunity. The policy provides that our Investment Adviser allocate opportunities through a rotation system or in such other manner as our Investment Adviser determines to be equitable. Accordingly, it is possible that we may not be given the opportunity to participate in certain investments made by other Accounts. See “—Our ability to enter into transactions with our affiliates is restricted.”
Goldman Sachs’ financial and other interests may incentivize Goldman Sachs to promote the sale of our common stock or favor other Accounts.
Goldman Sachs and its personnel have interests in promoting sales of our common stock, and the compensation from such sales may be greater than the compensation relating to sales of interests in other Accounts (including business development companies (including GS PMMC and GS MMLC) and other investment funds managed by our Investment Adviser). Therefore, Goldman Sachs and its personnel may have a financial interest in promoting our common stock over interests in other Accounts. The term “Goldman Sachs” refers to Group Inc., together with Goldman, Sachs & Co., GSAM and its other subsidiaries.
35
Our Investment Adviser may simultaneously manage other Accounts (including other BDCs (including GS PMMC and GS MMLC)) for which our Investment Adviser may be entitled to receive greater fees or other compensation (as a percentage of performance or otherwise) than it receives in respect of us. In addition, subject to applicable law, Goldman Sachs may invest in other Accounts (including other business development companies (including GS PMMC and GS MMLC)), and such investments may constitute substantial percentages of such other Accounts’ outstanding equity interests. Therefore, our Investment Adviser may have an incentive to favor such other Accounts over us. To address these types of conflicts, our Investment Adviser has adopted policies and procedures under which investment opportunities will be allocated in a manner that it believes is consistent with its obligations as an Investment Adviser. However, the amount, timing, structuring or terms of an investment by us may differ from, and performance may be different than, the investments and performance of other Accounts.
The downgrade of the U.S. credit rating and the economic crisis in Europe could negatively impact our business, financial condition and results of operations.
Beginning in August 2011, S&P lowered its long-term sovereign credit rating for the United States and certain European countries, which negatively impacted global markets and economic conditions. The financial markets continue to reflect concern and a loss of investor confidence globally about the ability of certain countries to finance their deficits and service growing debt burdens amid difficult economic conditions. The potential for insolvency has led to financial rescue measures for Greece, Portugal and Ireland by Euro-zone countries, the European Central Bank and the International Monetary Fund. The actions required to be taken by those countries as a condition to rescue packages, and by other countries to mitigate similar developments in their economies, have resulted in increased political and economic discord within and among Euro-zone countries. The interdependencies among European economies and financial institutions (in particular the European Central Bank, which has played a growing role during the crisis) have also exacerbated concern regarding the stability of European financial markets generally and certain institutions in particular.
Recent U.S. “fiscal cliff” and budget deficit concerns and difficulties in approving annual budgets and increases in the federal debt ceiling, together with signs of deteriorating sovereign debt conditions in Europe, have increased the possibility of additional credit-rating downgrades and economic slowdowns. In addition, the economic downturn and the significant government interventions into the financial markets and fiscal stimulus spending over the last several years have contributed to significantly increased U.S. budget deficits. There can be no assurance that future fiscal or monetary measures to aid economic recovery will be effective. In December 2016, the Federal Reserve raised its federal funds target rate. If key economic indicators, such as the unemployment rate or inflation, do not progress at a rate consistent with the Federal Reserve’s objectives, the Federal Reserve could revise the target federal funds rate. Any change in the federal funds target rate could have an adverse impact on our ability to borrow money on terms we determine to be commercially acceptable or at all, or impact returns on our investments. These and any future developments and reactions of the credit markets toward these developments could cause interest rates and borrowing costs to rise, which may negatively impact our ability to obtain debt financing on favorable terms. The impact of the downgrades of the sovereign credit ratings of the United States and certain European countries, any further downgrades of such sovereign credit ratings or the economic crisis in Europe on the U.S. and global financial markets and economic conditions is unpredictable and could have a material adverse effect on our business, financial condition and results of operations.
Our financial condition and results of operations depend on our Investment Adviser’s ability to manage our future growth effectively.
Our ability to achieve our investment objective depends on our Investment Adviser’s ability to identify, invest in and monitor companies that meet our investment criteria. Accomplishing this result on a cost-effective basis is largely a function of the structuring of our investment process and the ability of our Investment Adviser to provide competent, attentive and efficient services to us. Our executive officers and the members of our Investment Adviser’s Investment Committee have substantial responsibilities in connection with their roles at our Investment Adviser, with respect to GS PMMC, GS MMLC and other clients of our Investment Adviser, as well as responsibilities under the Investment Management Agreement. We may also be called upon to provide significant managerial assistance to certain of our portfolio companies. These demands on their time, which will increase as the number of investments grow, may distract them or slow the rate of investment. In order to grow, our Investment Adviser may need to hire, train, supervise, manage and retain new employees. However, we cannot assure you that they will be able to do so effectively. Any failure to manage our future growth effectively could have a material adverse effect on our business, financial condition and results of operations.
36
Our ability to grow depends on our ability to raise additional capital.
We will need to periodically access the capital markets to raise cash to fund new investments. If we do not have adequate capital available for investment, our performance could be adversely affected. In addition, we have elected to be treated, and expect to qualify annually, as a RIC under Subchapter M of the Code beginning with our taxable year ended December 31, 2013. To maintain our status as a RIC, among other requirements, we are required to distribute to our stockholders on a timely basis an amount equal to at least 90% of our investment company taxable income (determined without regard to the dividends paid deduction), which is generally our net ordinary income plus the excess of realized net short-term capital gains over realized net long-term capital losses, if any, for each taxable year. Consequently, such distributions will not be available to fund new investments. We expect to use debt financing and issue additional securities to fund our growth, if any. Unfavorable economic or capital market conditions may increase our funding costs, limit our access to the capital markets or result in a decision by lenders not to extend credit to us. An inability to successfully access the capital markets could limit our ability to grow our business and fully execute our business strategy and could decrease our earnings, if any. We may pursue growth through acquisitions or strategic investments in new businesses. Completion and timing of any such acquisitions or strategic investments may be subject to a number of contingencies and risks. There can be no assurance that the integration of an acquired business will be successful or that an acquired business will prove to be profitable or sustainable.
Regulations governing our operation as a BDC affect our ability to, and the way in which we, raise additional capital.
Regulations governing our operation as a BDC affect our ability to raise additional capital, and the ways in which we can do so. Raising additional capital may expose us to risks, including the typical risks associated with leverage, and may result in dilution to our current stockholders. The Investment Company Act limits our ability to borrow amounts or issue debt securities or preferred stock, which we refer to collectively as “senior securities,” to amounts such that our asset coverage ratio, as defined under the Investment Company Act, equals at least 2 to 1 immediately after such borrowing or issuance (except in connection with certain trading practices or investments). Consequently, if the value of our assets declines, we may be required to sell a portion of our investments and, depending on the nature of our leverage, repay a portion of our indebtedness at a time when this may be disadvantageous to us and, as a result, our stockholders. A recent legislative proposal, if passed, would modify the relevant section of the Investment Company Act and, subject to stockholder approval, increase the amount of debt that we may incur. As a result, we may be able to incur additional leverage in the future, and the risks associated with an investment in us may increase.
We are generally not able to issue and sell our common stock at a price per share below NAV per share. We may, however, sell our common stock, or warrants, options or rights to acquire our common stock, at a price below the then-current NAV per share of our common stock (i) with the consent of a majority of our common stockholders (and a majority of our common stockholders who are not affiliates of ours) and (ii) if, among other things, a majority of our Independent Directors and a majority of our directors who have no financial interest in the transaction determine that a sale is in the best interests of us and our stockholders. If our common stock trades at a discount to NAV, this restriction could adversely affect our ability to raise capital.
We borrow money, which may magnify the potential for gain or loss and may increase the risk of investing in us.
As part of our business strategy, we may borrow from and issue senior debt securities to banks, insurance companies and other lenders or investors. Holders of these senior securities will have fixed-dollar claims on our assets that are superior to the claims of our common stockholders. If the value of our assets decreases, leveraging would cause NAV to decline more sharply than it otherwise would have if we did not employ leverage. Similarly, any decrease in our income would cause net income to decline more sharply than it would have had we not borrowed. Such a decline could negatively affect our ability to make distributions to our common stockholders. Our ability to service any debt that we incur will depend largely on our financial performance and will be subject to prevailing economic conditions and competitive pressures. Moreover, leverage will increase the Management Fee payable to our Investment Adviser, which is based on our gross assets, including those assets acquired through the use of leverage but excluding cash and cash equivalents. Additionally, we will be able to incur additional leverage if we are able to obtain exemptive relief from the SEC to exclude the debt of any small business investment company (“SBIC”) subsidiary we may form in the future from the leverage requirements otherwise applicable to BDCs. We have not yet applied to the Small Business Administration (the “SBA”) for approval to form a SBIC and have not yet applied for exemptive relief from the SEC and we can offer no assurances as to whether or when we will be able to form a SBIC subsidiary or obtain such exemptive relief.
37
In addition to having fixed-dollar claims on our assets that are superior to the claims of our common stockholders, any obligations to the lenders will be secured by a first priority security interest in our portfolio of investments and cash. In the case of a liquidation event, those lenders would receive proceeds to the extent of their security interest before any distributions are made to our stockholders. Furthermore, our senior secured revolving credit agreement (as amended, the “Revolving Credit Facility”) with SunTrust Bank as the administrative agent and Bank of America, N.A. as the syndication agent, imposes, and any credit agreement or other debt financing agreement into which we may enter may impose, financial and operating covenants that restrict our investment activities (including restrictions on industry concentrations), remedies on default and similar matters. In connection with borrowings, our lenders may also require us to pledge assets.
Lastly, we may be unable to obtain our desired leverage, which would, in turn, affect your return on investment.
The following table illustrates the effect of leverage on returns from an investment in our common stock assuming various annual returns on our portfolio, net of expenses. The calculations in the table below are hypothetical, and actual returns may be higher or lower than those appearing in the table below.
| Assumed Return on Our Portfolio (Net of Expenses) |
(10.00 | )% | (5.00 | )% | 0.00 | % | 5.00 | % | 10.00 | % | ||||||||||
| Corresponding return to common stockholder (1) |
(19.97 | )% | (10.99 | )% | (2.00 | )% | 6.98 | % | 15.97 | % |
| (1) | Assumes (i) $1,195.13 million in total assets including debt issuance costs as of December 31, 2016, (ii) $502.75 million in outstanding indebtedness as of December 31, 2016, (iii) $665.14 million in net assets as of December 31, 2016 and (iv) an annualized average interest rate on our indebtedness, as of December 31, 2016, excluding fees (such as fees on undrawn amounts and amortization of financing costs), of 2.65%. |
Based on our outstanding indebtedness of $502.75 million as of December 31, 2016 and an annualized average interest rate on our indebtedness as of December 31, 2016, excluding fees (such as fees on undrawn amounts and amortization of financing costs), of 2.65%, our investment portfolio at fair value would have had to produce an annual return of approximately 1.14% to cover annual interest payments on the outstanding debt.
We operate in a highly competitive market for investment opportunities.
A number of entities, including GS PMMC and GS MMLC, compete with us to make the types of investments that we make in middle-market companies. We compete with other BDCs, commercial and investment banks, commercial financing companies, CLOs, private funds, including hedge funds, and, to the extent they provide an alternative form of financing, private equity funds. Many of our competitors are more experienced, substantially larger and have considerably greater financial, technical and marketing resources than we do. Some competitors may have a lower cost of funds and access to funding sources that are not available to us. In addition, some of our competitors may have higher risk tolerances or different risk assessments, which could allow them to consider a wider variety of investments and establish more relationships than us. Furthermore, certain of our competitors are not subject to the regulatory restrictions that the Investment Company Act imposes on us as a BDC and that the Code imposes on us as a RIC. We cannot assure you that the competitive pressures we face will not have a material adverse effect on our business, financial condition and results of operations. Also, as a result of this competition, we may not be able to secure attractive investment opportunities from time to time.
We do not seek to compete primarily based on the interest rates we offer and GSAM believes that some of our competitors may make loans with interest rates that are comparable to or lower than the rates we offer. Rather, we compete with our competitors based on our reputation in the market, our existing investment platform, the seasoned investment professionals of our Investment Adviser, our experience and focus on middle-market companies, our disciplined investment philosophy, our extensive industry focus and relationships and our flexible transaction structuring. For a more detailed discussion of these competitive advantages, see “Item 1. Business—Competitive Advantages.”
We may lose investment opportunities if we do not match our competitors’ pricing, terms and structure. If we match our competitors’ pricing, terms and structure, we may experience decreased net interest income and increased risk of credit loss. As a result of operating in such a competitive environment, we may make investments that are on less favorable terms than what we may have originally anticipated, which may impact our return on these investments.
38
Our Investment Adviser will be paid the Management Fee even if the value of your investment declines and our Investment Adviser’s Incentive Fee may create incentives for it to make certain kinds of investments.
The Management Fee is payable even in the event the value of your investment declines. The Management Fee is calculated as a percentage of the average value of our gross assets including borrowed funds (excluding cash or cash equivalents) at the end of the prior two completed calendar quarters. Accordingly, the Management Fee is payable regardless of whether the value of our gross assets and/or your investment has decreased during the then-current quarter and creates an incentive for the Investment Adviser to incur leverage.
In addition, the Incentive Fee payable by us to our Investment Adviser may create an incentive for our Investment Adviser to make investments on our behalf that are risky or more speculative than would be the case in the absence of such a compensation arrangement and also to incur leverage, which will tend to enhance returns where our portfolio has positive returns. Our Investment Adviser receives the Incentive Fee based, in part, upon capital gains realized on our investments. As a result, our Investment Adviser may have an incentive to invest more in companies whose securities are likely to yield capital gains, as compared to income-producing securities. Such a practice could result in our investing in more speculative securities than would otherwise be the case, which could result in higher investment losses, particularly during cyclical economic downturns.
The Incentive Fee payable by us to our Investment Adviser also may create an incentive for our Investment Adviser to invest on our behalf in instruments that have a deferred interest feature. Under these investments, we accrue the interest over the life of the investment but do not receive the cash income from the investment until the end of the term. Our net investment income used to calculate the income portion of our Incentive Fee, however, includes accrued interest. Thus, a portion of this Incentive Fee is based on income that we have not yet received in cash. This risk could be increased because our Investment Adviser is not obligated to reimburse us for any Incentive Fees received even if we subsequently incur losses or never receive in cash the accrued income (including accrued income with respect to original issue discount (“OID”), payment-in-kind (“PIK”) interest and zero coupon securities).
We incur significant costs as a result of being a public company.
We incur legal, accounting and other expenses, including costs associated with the periodic reporting requirements applicable to a company whose securities are registered under the Exchange Act, as well as additional corporate governance requirements, including requirements under the Sarbanes-Oxley Act. These requirements may place a strain on our systems and resources. The Exchange Act requires that we file annual, quarterly and current reports with respect to our business and financial condition. The Sarbanes-Oxley Act requires that we maintain effective disclosure controls and procedures and internal control over financial reporting, which requires significant resources and management oversight. See “Item 1. Business—Compliance with the Sarbanes-Oxley Act.” We are implementing additional procedures, processes, policies and practices for the purpose of addressing the standards and requirements applicable to public companies. These activities may divert management’s attention from other business concerns, which could have a material adverse effect on our business, financial condition, results of operations and cash flows. We have incurred, and expect to incur in the future, significant additional annual expenses related to these steps and directors’ and officers’ liability insurance, director fees, reporting requirements of the SEC, transfer agent fees, additional administrative expenses payable to our administrator to compensate it for hiring additional accounting, legal and administrative personnel, increased auditing and legal fees and similar expenses associated with being a public company.
The systems and resources necessary to comply with public company reporting requirements will increase further once we cease to be an “emerging growth company” under the JOBS Act. As long as we remain an emerging growth company, we intend to take advantage of certain exemptions from various reporting requirements that are applicable to other public companies, including not being required to comply with the auditor attestation requirements of Section 404 of the Sarbanes-Oxley Act. We will remain an emerging growth company until as late as December 31, 2020, although if, before that time, among other things, the market value of our common stock that is held by non-affiliates exceeds $700 million (measured at the end of each fiscal year) as of the last business day of our most recently completed second fiscal quarter and we have been an Exchange Act reporting company for at least one year (and filed at least one annual report under the Exchange Act), we would cease to be an emerging growth company as of the following December 31.
Efforts to comply with Section 404 of the Sarbanes-Oxley Act will involve significant expenditures, and noncompliance with Section 404 of the Sarbanes-Oxley Act may adversely affect us and the market price of our securities.
39
Under current SEC rules, we are required to report on our internal control over financial reporting pursuant to Section 404 of the Sarbanes Oxley Act and, under the JOBS Act, beginning with the first fiscal year in which we no longer qualify as an emerging growth company, our independent registered public accounting firm must audit this report. We are required to review on an annual basis our internal control over financial reporting, and on a quarterly and annual basis to evaluate and disclose changes in our internal control over financial reporting.
As a result, we expect to incur additional expenses in the near term that may negatively impact our financial performance and our ability to make distributions. This process also will result in a diversion of management’s time and attention. We cannot be certain as to the timing of completion of our evaluation, testing and remediation actions or the impact of the same on our operations, and we may not be able to ensure that the process is effective or that our internal control over financial reporting is or will be effective in a timely manner. In the event that we are unable to maintain or achieve compliance with Section 404 of the Sarbanes-Oxley Act and related rules, we and the market price of our common stock may be adversely affected
Potential conflicts of interest with other businesses of Goldman Sachs could impact our investment returns.
There are significant potential conflicts of interest that could negatively impact our investment returns. A number of these potential conflicts of interest with affiliates of our Investment Adviser and Group Inc. are discussed in more detail elsewhere in this report.
Group Inc., including its affiliates and personnel, is a BHC and a worldwide, full-service investment banking, broker-dealer, asset management and financial services organization, and a major participant in global financial markets that provides a wide range of financial services to a substantial and diversified client base that includes corporations, financial institutions, governments and high-net-worth individuals. As such, it acts as an investor, investment banker, research provider, investment manager, financer, advisor, market maker, proprietary trader, prime broker, lender, agent and principal. In those and other capacities, Goldman Sachs purchases, sells and holds a broad array of investments, actively trades securities, derivatives, loans, commodities, currencies, credit default swaps, indices, baskets and other financial instruments and products for its own accounts or for the accounts of its customers, and has other direct and indirect interests, in the global fixed income, currency, commodity, equity, bank loan and other markets in which we invest or may invest. Such additional businesses and interests will likely give rise to potential conflicts of interest and may restrict the way we operate our business. For example, (1) we may not be able to conduct transactions relating to investments in portfolio companies because our Investment Adviser is not permitted to obtain or use material nonpublic information in effecting purchases and sales in public securities transactions for us or (2) Goldman Sachs, the clients it advises, and its personnel may engage (or consider engaging) in commercial arrangements or transactions with us (subject to any limitations under the law), and/or may compete for commercial arrangements or transactions in the same types of companies, assets, securities or other assets or instruments as us. Transactions by, advice to and activities of such accounts (including potentially Goldman Sachs acting on a proprietary basis), may involve the same or related companies, securities or other assets or instruments as those in which we invest and may negatively affect us (including our ability to engage in a transaction or other activities) or the prices or terms at which our transactions or other activities may be effected. For example, Goldman Sachs may be engaged to provide advice to an account that is considering entering into a transaction with us, and Goldman Sachs may advise the account not to pursue the transaction with us, or otherwise in connection with a potential transaction provide advice to the account that would be adverse to us. See “Our Investment Adviser, its principals, investment professionals and employees and the members of its Investment Committee have certain conflicts of interest” and “—Our ability to enter into transactions with our affiliates is restricted.”
Furthermore, Goldman Sachs is currently, and in the future expects to be, raising capital for new public and private investment vehicles that have, or when formed will have, the primary purpose of middle-market direct lending. These investment vehicles, as well as existing investment vehicles (including GS PMMC and GS MMLC), will compete with us for investments. Although our Investment Adviser and its affiliates will endeavor to allocate investment opportunities among their clients, including us, in a fair and equitable manner and consistent with applicable allocation procedures, it is expected that, in the future, we may not be given the opportunity to participate in investments made by other Accounts or that we may participate in such investments to a lesser extent due to participation by such other Accounts.
40
In addition, Goldman Sachs or another investment account or vehicle managed or controlled by Goldman Sachs may hold securities, loans or other instruments of a portfolio company in a different class or a different part of the capital structure than securities, loans or other instruments of such portfolio company held by us. As a result, Goldman Sachs or such other investment account or vehicle may pursue or enforce rights or activities, or refrain from pursuing or enforcing rights or activities, on behalf of its own account, that could have an adverse effect on us. In addition, to the extent Goldman Sachs has invested in a portfolio company for its own account, Goldman Sachs may limit the transactions engaged in by us with respect to such portfolio company or issuer for reputational, legal, regulatory or other reasons.
Goldman Sachs has influence, and may continue to exert influence, over our management and affairs and over most votes requiring stockholder approval.
Group Inc. has owned a significant portion of our common stock since the inception of our operations. As of December 31, 2016, Group Inc. owned approximately 17.85% of our outstanding common stock. Goldman, Sachs & Co., a wholly owned subsidiary of Group Inc., has acquired shares of our common stock pursuant to a 10b5-1 plan, and may in the future acquire additional shares of our common stock in the open market, but Goldman, Sachs & Co. will limit its collective ownership with Group Inc. to 19.9% of our outstanding common stock. Therefore, Group Inc. is able to exert, and may be able to continue to exert, influence over our management and policies and have significant voting influence on most votes requiring stockholder approval. This concentration of ownership may also have the effect of delaying, preventing or deterring a change of control of us, could deprive our stockholders of an opportunity to receive a premium for their common stock as part of a sale of us and might ultimately affect the market price of our common stock. Our Investment Adviser has the authority to vote securities held by Group Inc., including on matters that may present a conflict of interest between our Investment Adviser and other stockholders.
Our Board of Directors may change our investment objective, operating policies and strategies without prior notice or stockholder approval.
Our Board of Directors has the authority to modify or waive certain of our operating policies and strategies without prior notice (except as required by the Investment Company Act or other applicable laws) and without stockholder approval. However, absent stockholder approval, we may not change the nature of our business so as to cease to be, or withdraw our election as, a BDC. We cannot predict the effect any changes to our current operating policies and strategies would have on our business, operating results and market price of our securities. Nevertheless, the effects may adversely affect our business and impact our ability to make distributions.
Changes in laws or regulations governing our operations or the operations of our portfolio companies, changes in the interpretation thereof or newly enacted laws or regulations, or any failure by us or our portfolio companies to comply with these laws or regulations, could require changes to certain of our or our portfolio companies’ business practices, negatively impact our or our portfolio companies’ operations, cash flows or financial condition, impose additional costs on us or our portfolio companies or otherwise adversely affect our business or the business of our portfolio companies.
We and our portfolio companies are subject to regulation at the local, state, federal and, in some cases, foreign levels. These laws and regulations, as well as their interpretation, are likely to change from time to time, and new laws and regulations may be enacted. Accordingly, any change in these laws or regulations, changes in their interpretation, or newly enacted laws or regulations, or any failure by us or our portfolio companies to comply with these laws or regulations, could require changes to certain of our or our portfolio companies’ business practices, negatively impact our or our portfolio companies’ operations, cash flows or financial condition, impose additional costs on us or our portfolio companies or otherwise adversely affect our business or the business of our portfolio companies. In addition to the legal, tax and regulatory changes that are expected to occur, there may be unanticipated changes and uncertainty regarding any such changes. The legal, tax and regulatory environment for BDCs, investment advisers and the instruments that they utilize (including derivative instruments) is continuously evolving. In addition, there is significant uncertainty regarding recently enacted legislation (including the Dodd-Frank Wall Street Reform and Consumer Protection Act (the “Dodd-Frank Act”) and the regulations that have recently been adopted and future regulations that will need to be adopted pursuant to such legislation) and, consequently, the full impact that such legislation will ultimately have on us and the markets in which we trade and invest is not fully known. Such uncertainty and any resulting confusion may itself be detrimental to the efficient functioning of the markets and the success of certain investment strategies.
41
On July 21, 2010, President Obama signed into law the Dodd-Frank Act, which impacts many aspects of the financial services industry. Some of the provisions of the Dodd-Frank Act have been implemented, while others have extended implementation periods and delayed effective dates and will require extensive rulemaking by regulatory authorities. While the full impact of the Dodd-Frank Act on us and our portfolio companies may not be known for an extended period of time, the Dodd-Frank Act, including current rules and regulations and proposed rules implementing its provisions and the interpretation of those rules, along with other legislative and regulatory proposals directed at the financial services industry or affecting taxation that are proposed or pending in the U.S. Congress, may negatively impact the operations, cash flows or financial condition of us and our portfolio companies, impose additional costs on us and our portfolio companies, intensify the regulatory supervision of us and our portfolio companies or otherwise adversely affect our business or the business of our portfolio companies.
Over the last several years, there also has been an increase in regulatory attention to the extension of credit outside of the traditional banking sector, raising the possibility that some portion of the non-bank financial sector will be subject to new regulation. While it cannot be known at this time whether any regulation will be implemented or what form it will take, increased regulation of non-bank credit extension could negatively impact our operations, cash flows or financial condition, impose additional costs on us, intensify the regulatory supervision of us or otherwise adversely affect our business.
Our Investment Adviser can resign on 60 days’ notice. We may not be able to find a suitable replacement within that time, resulting in a disruption in our operations that could adversely affect our financial condition, business and results of operations.
Our Investment Adviser has the right, under the Investment Management Agreement, to resign at any time upon 60 days’ written notice, regardless of whether we have found a replacement. If our Investment Adviser resigns, we may not be able to find a new external investment adviser or hire internal management with similar expertise and ability to provide the same or equivalent services on acceptable terms within 60 days, or at all. If we are unable to do so quickly, our operations are likely to experience a disruption, our financial condition, business and results of operations as well as our ability to pay distributions are likely to be adversely affected, and the market price of our securities may decline.
Our Investment Adviser’s responsibilities and its liability to us are limited under the Investment Management Agreement, which may lead our Investment Adviser to act in a riskier manner on our behalf than it would when acting for its own account.
Our Investment Adviser has not assumed any responsibility to us other than to render the services described in the Investment Management Agreement, and it will not be responsible for any action of our Board of Directors in declining to follow our Investment Adviser’s advice or recommendations. Pursuant to the Investment Management Agreement, our Investment Adviser and its directors, members, stockholders, partners, officers, employees or controlling persons will not be liable to us for its acts under the Investment Management Agreement, absent willful misfeasance, bad faith or gross negligence in the performance of its duties, or by reason of its reckless disregard of its obligations and duties under the Investment Management Agreement. These protections may lead our Investment Adviser to act in a riskier manner when acting on our behalf than it would when acting for its own account. See “—Our Investment Adviser will be paid the Management Fee even if the value of your investment declines and our Investment Adviser’s Incentive Fee may create incentives for it to make certain kinds of investments.”
Our ability to enter into transactions with our affiliates is restricted.
As a BDC, we are prohibited under the Investment Company Act from knowingly participating in certain transactions with our affiliates without the prior approval of a majority of our Independent Directors who have no financial interest in the transaction, or in some cases, the prior approval of the SEC. For example, any person that owns, directly or indirectly, 5% or more of our outstanding voting securities is deemed our affiliate for purposes of the Investment Company Act and, if this is the only reason such person is our affiliate, we are generally prohibited from buying any asset from or selling any asset (other than our capital stock) to such affiliate, absent the prior approval of such directors. The Investment Company Act also prohibits “joint” transactions with an affiliate, which could include joint investments in the same portfolio company, without approval of our Independent Directors or in some cases the prior approval of the SEC. Moreover, except in certain limited circumstances, we are prohibited from buying any asset from or selling any asset to a holder of more than 25% of our voting securities, absent prior approval of the SEC. The analysis of whether a particular transaction constitutes a joint transaction requires a review of the relevant facts and circumstances then existing.
42
In certain circumstances, negotiated co-investments may be made only pursuant to an order from the SEC permitting us to do so. In January 2017, we received an exemptive order from the SEC that permits us to participate in negotiated co-investment transactions with certain affiliates (including GS PMMC and GS MMLC), each of whose investment adviser is GSAM, in a manner consistent with our investment objectives, positions, policies, strategies and restrictions, as well as regulatory requirements and pursuant to the conditions required by the exemptive relief.
Additionally, except in certain circumstances, we will be unable to invest in any issuer in which another client sponsored or managed by our Investment Adviser has previously invested, including GS PMMC and GS MMLC.
We may experience fluctuations in our quarterly results.
We could experience fluctuations in our quarterly operating results due to a number of factors, including interest rates payable on debt investments we make, default rates on such investments, the level of our expenses, variations in and the timing of the recognition of realized and unrealized gains or losses, the degree to which we encounter competition in certain markets and general economic conditions. As a result of these factors, results for any period should not be relied upon as being indicative of performance in future periods or the full fiscal year.
We are exposed to risks associated with changes in interest rates.
Our debt investments may be based on floating rates, such as LIBOR, the Euro Interbank Offered Rate, the Federal Funds Rate or the Prime Rate. General interest rate fluctuations may have a substantial negative impact on our investments, the value of our securities and our rate of return on invested capital. Currently, most of our floating rate investments are linked to LIBOR and it is unclear how increased regulatory oversight and changes in the method for determining LIBOR may affect the value of the financial obligations to be held by or issued to us that are linked to LIBOR, or how such changes could affect our results of operations or financial condition. In addition, any further changes or reforms to the determination or supervision of LIBOR may result in a sudden or prolonged increase or decrease in reported LIBOR, which could have an adverse impact on the market for or value of any LIBOR-linked securities, loans, and other financial obligations or extensions of credit held by or due to us or on our overall financial condition or results of operations.
Because we have borrowed money, and may issue preferred stock to finance investments, our net investment income depends, in part, upon the difference between the rate at which we borrow funds or pay distributions on preferred stock and the rate that our investments yield. As a result, we can offer no assurance that a significant change in market interest rates will not have a material adverse effect on our net investment income.
A reduction in the interest rates on new investments relative to interest rates on current investments could also have an adverse impact on our net interest income. However, an increase in interest rates could decrease the value of any investments we hold which earn fixed interest rates, including subordinated loans, senior and junior secured and unsecured debt securities and loans and high yield bonds, and also could increase our interest expense, thereby decreasing our net income. Also, an increase in interest rates available to investors could make investment in our common stock less attractive if we are not able to increase our dividend rate, which could reduce the value of our common stock. Further, rising interest rates could also adversely affect our performance if such increases cause our borrowing costs to rise at a rate in excess of the rate that our investments yield.
In periods of rising interest rates, to the extent we borrow money subject to a floating interest rate, our cost of funds would increase, which could reduce our net investment income. Further, rising interest rates could also adversely affect our performance if we hold Investments with floating interest rates, subject to specified minimum interest rates (such as a LIBOR floor), while at the same time engaging in borrowings subject to floating interest rates not subject to such minimums. In such a scenario, rising interest rates may increase our interest expense, even though our interest income from Investments is not increasing in a corresponding manner as a result of such minimum interest rates.
If general interest rates rise, there is a risk that the portfolio companies in which we hold floating rate securities will be unable to pay escalating interest amounts, which could result in a default under their loan documents with us. Rising interest rates could also cause portfolio companies to shift cash from other productive uses to the payment of interest, which may have a material adverse effect on their business and operations and could, over time, lead to increased defaults. In addition, rising interest rates may increase pressure on us to provide fixed rate loans to our portfolio companies, which could adversely affect our net investment income, as increases in our cost of borrowed funds would not be accompanied by increased interest income from such fixed-rate investments.
43
A change in the general level of interest rates can be expected to lead to a change in the interest rate we receive on many of our debt investments. Accordingly, a change in the interest rate could make it easier for us to meet or exceed the performance threshold in the Investment Management Agreement and may result in a substantial increase in the amount of incentive fees payable to our Investment Adviser with respect to the portion of the Incentive Fee based on income.
Our activities may be limited as a result of potentially being deemed to be controlled by a bank holding company.
Goldman Sachs is a BHC under the BHCA and therefore subject to supervision and regulation by the Federal Reserve. In addition, Goldman Sachs is a FHC under the BHCA, which is a status available to BHCs that meet certain criteria. FHCs may engage in a broader range of activities than BHCs that are not FHCs. However, the activities of FHCs and their affiliates remain subject to certain restrictions imposed by the BHCA and related regulations. Because Goldman Sachs may be deemed to “control” us within the meaning of the BHCA, these restrictions could apply to us as well. Accordingly, the BHCA and other applicable banking laws, rules, regulations and guidelines, and their interpretation and administration by the appropriate regulatory agencies, including the Federal Reserve, may restrict our investments, transactions and operations and may restrict the transactions and relationships between our Investment Adviser, Goldman Sachs and their affiliates, on the one hand, and us on the other hand. For example, the BHCA regulations applicable to Goldman Sachs and us may, among other things, restrict our ability to make certain investments or the size of certain investments, impose a maximum holding period on some or all of our investments and restrict our and our Investment Adviser’s ability to participate in the management and operations of the companies in which we invest. In addition, certain BHCA regulations may require aggregation of the positions owned, held or controlled by related entities. Thus, in certain circumstances, positions held by Goldman Sachs and its affiliates (including our Investment Adviser) for client and proprietary accounts may need to be aggregated with positions held by us. In this case, where BHCA regulations impose a cap on the amount of a position that may be held, Goldman Sachs may utilize available capacity to make investments for its proprietary accounts or for the accounts of other clients, which may require us to limit and/or liquidate certain investments.
These restrictions may materially adversely affect us by, among other things, affecting our Investment Adviser’s ability to pursue certain strategies within our investment program or trade in certain securities. In addition, Goldman Sachs may cease in the future to qualify as an FHC, which may subject us to additional restrictions. Moreover, there can be no assurance that the bank regulatory requirements applicable to Goldman Sachs and us, or the interpretation thereof, will not change, or that any such change will not have a material adverse effect on us.
Goldman Sachs may in the future, in its sole discretion and without notice to investors, engage in activities impacting us and/or our Investment Adviser in order to comply with the BHCA or other legal requirements applicable to, or reduce or eliminate the impact or applicability of any bank regulatory or other restrictions on, Goldman Sachs, us or other funds and accounts managed by our Investment Adviser and its affiliates. Goldman Sachs may seek to accomplish this result by causing GSAM to resign as our Investment Adviser, voting for changes to our Board of Directors, causing Goldman Sachs personnel to resign from our Board of Directors, reducing the amount of Goldman Sachs’ investment in us (if any), revoking our right to use the Goldman Sachs name or any combination of the foregoing, or by such other means as it determines in its sole discretion. Any replacement investment adviser appointed by us may be unaffiliated with Goldman Sachs.
Recent Commodity Futures Trading Commission rulemaking may have a negative impact on us and our Investment Adviser.
The Commodity Futures Trading Commission (the “CFTC”) and the SEC have issued final rules establishing that certain swap transactions are subject to CFTC regulation. Engaging in such swap or other commodity interest transactions such as futures contracts or options on futures contracts may cause us to fall within the definition of “commodity pool” under the Commodity Exchange Act and related CFTC regulations. Our Investment Adviser has claimed no-action relief from CFTC registration and regulation as a commodity pool operator pursuant to a CFTC staff no-action letter with respect to our operations, with the result that we will be limited in our ability to use futures contracts or options on futures contracts or engage in swap transactions. Specifically, the CFTC staff no action letter (the “BDC CFTC No-Action Letter”) imposes strict limitations on engaging in such transactions other than for hedging purposes, whereby the use of transactions not used solely for hedging purposes is generally limited to situations where (i) the aggregate initial margin and premiums required to establish such positions does not exceed five percent of the liquidation value of our portfolio, after taking into account unrealized profits and unrealized losses on any such contracts it has entered into; or (ii) the aggregate net notional value of such transactions does not exceed 100% of the liquidation value of our portfolio. Moreover, we anticipate entering into such transactions to a very limited extent solely for hedging purposes or otherwise within the limitations of the BDC CFTC No-Action Letter.
44
We are dependent on information systems, and systems failures, as well as operating failures, could significantly disrupt our business, which may, in turn, negatively affect our liquidity, financial condition or results of operations.
Our business is dependent on our and third parties’ communications and information systems. Any failure or interruption of those systems, including as a result of the termination of an agreement with any third-party service providers, could cause delays or other problems in our activities. Our financial, accounting, data processing, backup or other operating systems and facilities may fail to operate properly or become disabled or damaged as a result of a number of factors including events that are wholly or partially beyond our control and adversely affect our business. There could be:
| • | sudden electrical or telecommunications outages; |
| • | natural disasters such as earthquakes, tornadoes and hurricanes; |
| • | disease pandemics; |
| • | events arising from local or larger scale political or social matters, including terrorist acts; and |
| • | cyber-attacks. |
In addition to our dependence on information systems, poor operating performance by our service providers could adversely impact us.
These events, in turn, could have a material adverse effect on our operating results and negatively affect the market price of our securities and our ability to pay distributions to our stockholders.
Cybersecurity risks and cyber incidents may adversely affect our business by causing a disruption to our operations, a compromise or corruption of our confidential information and/or damage to our business relationships, all of which could negatively impact our business, financial condition and operating results.
A cyber incident is considered to be any adverse event that threatens the confidentiality, integrity or availability of our information resources. These incidents may be an intentional attack or an unintentional event and could involve gaining unauthorized access to our information systems for purposes of misappropriating assets, stealing confidential information, corrupting data or causing operational disruption. The result of these incidents may include disrupted operations, misstated or unreliable financial data, liability for stolen assets or information, increased cybersecurity protection and insurance costs, litigation and damage to our business relationships. As our reliance on technology has increased, so have the risks posed to our information systems, both internal and those provided by Goldman Sachs and third-party service providers. Goldman Sachs and these third-party service providers have implemented processes, procedures and internal controls to help mitigate cybersecurity risks and cyber intrusions, but these measures, as well as our increased awareness of the nature and extent of a risk of a cyber incident, do not guarantee that a cyber incident will not occur and/or that our financial results, operations or confidential information will not be negatively impacted by such an incident.
There are risks associated with any potential merger with or purchase of assets of another BDC.
Our Investment Adviser may in the future recommend to the Board of Directors that we merge with or acquire all or substantially all of the assets of one or more funds including a fund that could be managed by our Investment Adviser (including another BDC). We do not expect that our Investment Adviser would recommend any such merger or asset purchase unless it determines that it would be in our best interests, with such determination dependent on factors it deems relevant, which may include historical and projected financial performance of us and any proposed merger partner, portfolio composition, potential synergies from the merger or asset sale, available alternative options and market conditions. In addition, no such merger or asset purchase would be consummated absent the meeting of various conditions required by applicable law or contract, at such time, which may include approval of the board of directors and common equity holders of both funds. If our Investment Adviser is the investment adviser of both funds, various conflicts of interest would exist with respect to any such transaction. Such conflicts of interest may potentially arise from, among other things, differences between the compensation payable to the Investment Adviser by us and by the entity resulting from such a merger or asset purchase or efficiencies or other benefits to our Investment Adviser as a result of managing a single, larger fund instead of two separate funds.
45
Our ability to enter into transactions involving derivatives and financial commitment transactions may be limited.
The SEC has proposed a new rule under the Investment Company Act that would govern the use of derivatives (defined to include any swap, security-based swap, futures contract, forward contract, option or any similar instrument) as well as financial commitment transactions (defined to include reverse repurchase agreements, short sale borrowings and any firm or standby commitment agreement or similar agreement) by BDCs. Under the proposed rule, a BDC would be required to comply with one of two alternative portfolio limitations and manage the risks associated with derivatives transactions and financial commitment transactions by segregating certain assets. Furthermore, a BDC that engages in more than a limited amount of derivatives transactions or that uses complex derivatives would be required to establish a formalized derivatives risk management program. If the SEC adopts this rule in the form proposed, our ability to enter into transactions involving such instruments may be hindered, which could have an adverse effect on our business, financial condition and results of operations.
The United Kingdom referendum decision to leave the European Union may create significant risks and uncertainty for global markets and our investments.
The recent decision made in the United Kingdom referendum to leave the European Union has led to volatility in global financial markets, and in particular in the markets of the United Kingdom and across Europe, and may also lead to weakening in consumer, corporate and financial confidence in the United Kingdom and Europe. The extent and process by which the United Kingdom will exit the European Union, and the longer term economic, legal, political and social framework to be put in place between the United Kingdom and the European Union are unclear at this stage and are likely to lead to ongoing political and economic uncertainty and periods of exacerbated volatility in both the United Kingdom and in wider European markets for some time. In particular, the decision made in the United Kingdom referendum may lead to a call for similar referenda in other European jurisdictions which may cause increased economic volatility and uncertainty in the European and global markets. This volatility and uncertainty may have an adverse effect on the economy generally and on the ability of us and our portfolio companies to execute our respective strategies and to receive attractive returns.
In particular, currency volatility may mean that the returns of us and our portfolio companies are adversely affected by market movements and may make it more difficult, or more expensive, for us to implement appropriate currency hedging. Potential decline in the value of the British Pound and/or the euro against other currencies, along with the potential downgrading of the United Kingdom’s sovereign credit rating, may also have an impact on the performance of our portfolio companies located in the United Kingdom or Europe.
Certain investors are limited in their ability to make significant investments in us.
Private funds that are excluded from the definition of “investment company” either pursuant to Section 3(c)(1) or 3(c)(7) of the Investment Company Act are restricted from acquiring directly or through a controlled entity more than 3% of our total outstanding voting stock (measured at the time of the acquisition, including through conversion of convertible securities). Investment companies registered under the Investment Company Act and BDCs are also subject to this restriction as well as other limitations under the Investment Company Act that would restrict the amount that they are able to invest in our securities. As a result, certain investors may be precluded from acquiring additional shares, at a time that they might desire to do so.
Risks Relating to Our Portfolio Company Investments
Our investments are very risky and highly speculative.
We invest primarily through direct originations of secured debt, including first lien, unitranche, including last out portions of such loans, and second lien debt, and unsecured debt, including mezzanine debt, as well as select equity investments. The securities in which we invest typically are not rated by any rating agency, and if they were rated, they would be below investment grade (rated lower than “Baa3” by Moody’s Investors Service and lower than “BBB-” by Fitch Ratings or S&P), which is an indication of having predominantly speculative characteristics with respect to the issuer’s capacity to pay interest and repay principal. Investments that are rated below investment grade are sometimes referred to as “junk bonds,” “high yield bonds” or “leveraged loans.” Therefore, our investments may result in an above average amount of risk and volatility or loss of principal. We also may invest in other assets, including U.S. government securities and structured securities. These investments entail additional risks that could adversely affect our investment returns.
46
Secured Debt. When we make a secured debt investment, we generally take a security interest in the available assets of the portfolio company, including the equity interests of any subsidiaries, which we expect to help mitigate the risk that we will not be repaid. However, there is a risk that the collateral securing our debt investment may decrease in value over time, may be difficult to sell in a timely manner, may be difficult to appraise and may fluctuate in value based upon the success of the business and market conditions, including as a result of the inability of the portfolio company to raise additional capital. In some circumstances, our lien could be subordinated to claims of other creditors, such as trade creditors. In addition, deterioration in a portfolio company’s financial condition and prospects, including its inability to raise additional capital, may be accompanied by deterioration in the value of the collateral for the debt investment. Consequently, the fact that our debt is secured does not guarantee that we will receive principal and interest payments according to the debt investment’s terms, or at all, or that we will be able to collect on the loan, in full or at all, should we enforce our remedies.
Unsecured Debt, including Mezzanine Debt. Our unsecured debt investments, including mezzanine debt investments, generally will be subordinated to senior debt in the event of an insolvency. This may result in an above average amount of risk and loss of principal.
Equity Investments. When we invest in secured debt or unsecured debt, including mezzanine debt, we may acquire equity securities from the company in which we make the investment. In addition, we may invest in the equity securities of portfolio companies independent of any debt investment. Our goal is ultimately to dispose of such equity interests and realize gains upon our disposition of such interests. However, the equity interests we hold may not appreciate in value and, in fact, may decline in value. Accordingly, we may not be able to realize gains from our equity interests, and any gains that we do realize on the disposition of any equity interests may not be sufficient to offset any other losses we experience.
Investing in middle-market companies involves a number of significant risks.
Investing in middle-market companies involves a number of significant risks, including:
| • | such companies may have limited financial resources and may be unable to meet their obligations under their debt securities that we hold, which may be accompanied by a deterioration in the value of any collateral and a reduction in the likelihood of us realizing any guarantees we may have obtained in connection with our investment; |
| • | such companies typically have shorter operating histories, narrower product lines and smaller market shares than larger businesses, which tend to render them more vulnerable to competitors’ actions and market conditions, as well as general economic downturns; |
| • | such companies are more likely to depend on the management talents and efforts of a small group of persons; therefore, the death, disability, resignation or termination of one or more of these persons could have a material adverse impact on our portfolio company and, in turn, on us; |
| • | such companies generally have less predictable operating results, may from time to time be parties to litigation, may be engaged in rapidly changing businesses with products subject to a substantial risk of obsolescence and may require substantial additional capital to support their operations, finance expansion or maintain their competitive position; |
| • | there is generally little public information about these companies, they and their financial information are not subject to the reporting requirements of the Exchange Act and other regulations that govern public companies and we may be unable to uncover all material information about these companies, which may prevent us from making a fully informed investment decision and cause us to lose money on our investments; |
| • | our executive officers, directors and Investment Adviser may, in the ordinary course of business, be named as defendants in litigation arising from our investments in the portfolio companies; and |
| • | such companies may have difficulty accessing the capital markets to meet future capital needs, which may limit their ability to grow or to repay their outstanding indebtedness, including any debt securities held by us, upon maturity. |
Many of our portfolio securities do not have a readily available market price and we value these securities at fair value as determined in good faith under procedures adopted by our Board of Directors. Valuation is inherently subjective and may not reflect what we may actually realize for the sale of the investment.
47
The majority of our investments are, and are expected to continue to be, in debt instruments that do not have readily ascertainable market prices. The fair value of assets that are not publicly traded or whose market prices are not readily available are determined in good faith under procedures adopted by our Board of Directors. Our Board of Directors utilizes the services of independent third-party valuation firms in determining the fair value of a portion of the securities in our portfolio as of each quarter end. Investment professionals from our Investment Adviser also prepare portfolio company valuations using sources and/or proprietary models depending on the availability of information on our assets and the type of asset being valued, all in accordance with our valuation policy. The participation of our Investment Adviser in our valuation process could result in a conflict of interest, since the Management Fee is based in part on our gross assets and also because our Investment Adviser is receiving a performance-based Incentive Fee.
Because fair valuations, and particularly fair valuations of private securities and private companies, are inherently uncertain, may fluctuate over short periods of time and are often based to a large extent on estimates, comparisons and qualitative evaluations of private information, it may be more difficult for investors to value accurately our investments and could lead to undervaluation or overvaluation of our common stock. In addition, the valuation of these types of securities may result in substantial write-downs and earnings volatility.
Our NAV as of a particular date may be materially greater than or less than the value that would be realized if our assets were to be liquidated as of such date. For example, if we were required to sell a certain asset or all or a substantial portion of our assets on a particular date, the actual price that we would realize upon the disposition of such asset or assets could be materially less than the value of such asset or assets as reflected in our NAV. Volatile market conditions could also cause reduced liquidity in the market for certain assets, which could result in liquidation values that are materially less than the values of such assets as reflected in our NAV.
The lack of liquidity in our investments may adversely affect our business.
Various restrictions render our investments relatively illiquid, which may adversely affect our business. As we generally make investments in private companies, substantially all of these investments are subject to legal and other restrictions on resale or are otherwise less liquid than publicly traded securities. Our Investment Adviser is not permitted to obtain or use material non-public information in effecting purchases and sales in public securities transactions for us, which could create an additional limitation on the liquidity of our investments. The illiquidity of our investments may make it difficult for us to sell such investments if the need arises. Therefore, if we are required to or desire to liquidate all or a portion of our portfolio quickly, we could realize significantly less than the value at which we have recorded our investments or could be unable to dispose of our investments in a timely manner or at such times as we deem advisable.
Our portfolio may be focused in a limited number of portfolio companies, which will subject us to a risk of significant loss if any of these companies default on their obligations under any of their debt instruments or if there is a downturn in a particular industry.
We are classified as a non-diversified investment company within the meaning of the Investment Company Act, which means that we are not limited by the Investment Company Act with respect to the proportion of our assets that we may invest in securities of a single issuer, excluding limitations on investments in other investment companies. To the extent that we assume large positions in the securities of a small number of issuers or industries, our NAV may fluctuate to a greater extent than that of a diversified investment company as a result of changes in the financial condition or the market’s assessment of the issuer. We may also be more susceptible to any single economic or regulatory occurrence than a diversified investment company. In addition, the aggregate returns we realize may be significantly adversely affected if a small number of investments perform poorly or if we need to write down the value of any one investment. Additionally, a downturn in any particular industry in which we are invested could significantly affect our aggregate returns. Further, any industry in which we are meaningfully concentrated at any given time could be subject to significant risks that could adversely impact our aggregate returns. For example, as of December 31, 2016, Software and Internet Software & Services represented 9.8% and 8.3%, respectively, of our portfolio at fair value. Our investments in Software and Internet Software & Services are subject to substantial risks, including, but not limited to, intense competition, changing technology, shifting user needs, frequent introductions of new products and services, competitors in different industries and ranging from large established companies to emerging startups, decreasing average selling prices of products and services resulting from rapid technological changes, and various legal and regulatory risks.
We may not be in a position to exercise control over our portfolio companies or to prevent decisions by management of our portfolio companies that could decrease the value of our investments.
48
We do not generally hold controlling equity positions in our portfolio companies. To the extent that we do not hold a controlling equity interest in a portfolio company, we are subject to the risk that such portfolio company may make business decisions with which we disagree, and the stockholders and management of such portfolio company may take risks or otherwise act in ways that are adverse to our interests. Due to the lack of liquidity for the debt and equity investments that we typically hold in our portfolio companies, we may not be able to dispose of our investments in the event we disagree with the actions of a portfolio company and may therefore suffer a decrease in the value of our investments.
In addition, we may not be in a position to control any portfolio company by investing in its debt securities. As a result, we are subject to the risk that a portfolio company in which we invest may make business decisions with which we disagree and the management of such company, as representatives of the holders of their common equity, may take risks or otherwise act in ways that do not serve our interests as debt investors.
We may be subject to risks associated with investments in real estate loans.
Our Investment Adviser, on our behalf, may periodically invest in loans related to real estate and real estate-related assets, and such investments will be subject to the risks inherent to investment in real estate-related assets generally. These risks include regional, national and international economic conditions, the supply and demand for properties, the financial resources of tenants, buyers and sellers of properties, changes in building, environmental, zoning and other laws and regulations, changes in real property tax rates, changes in interest rates and the availability of financing, which may render the sale or refinancing of properties difficult or impracticable, environmental liabilities, uninsured losses, acts of God, natural disasters, terrorist attacks, acts of war (declared and undeclared), strikes and other factors which are beyond the control of our Investment Adviser and us.
We may be subject to risks associated with investments in energy companies.
The energy industry has been in a period of disruption and volatility that has been characterized by decreases in oil and gas prices and production levels. This disruption and volatility has led to, and future disruptions and volatility may lead to, decreases in the credit quality and performance of our potential debt and equity investments in energy companies, which could, in turn, negatively impact the fair value of our investments in energy companies. Any prolonged decline in oil and gas prices or production levels could adversely impact the ability of our potential portfolio companies in the energy industry to satisfy financial or operating covenants that may be imposed by us and other lenders or to make payments to us as and when due, which could have a material adverse effect on our business, financial condition and results of operations. In addition, energy companies are subject to supply and demand fluctuations in the markets in which they operate, which are impacted by a numerous factors, including weather, use of renewable fuel sources, natural disasters, governmental regulation and general economic conditions, in addition to the effects of increasing regulation and general operational risks, any of which could have a material adverse effect on the performance and value of our energy-related investments as well as our cash flows from such investments.
Our failure to make follow-on investments in our portfolio companies could impair the value of our portfolio.
Following an initial investment in a portfolio company, we may make additional investments in that portfolio company as “follow-on” investments, in order to:
| • | increase or maintain in whole or in part our equity ownership percentage; |
| • | exercise warrants, options or convertible securities that were acquired in the original or subsequent financing; or |
| • | attempt to preserve or enhance the value of our investment. |
We may elect not to make follow-on investments or may lack sufficient funds to make those investments.
We will have the discretion to make any follow-on investments, subject to the availability of capital resources. The failure to make follow-on investments may, in some circumstances, jeopardize the continued viability of a portfolio company and our initial investment, or may result in a missed opportunity for us to increase our participation in a successful operation. Even if we have sufficient capital to make a desired follow-on investment, we may elect not to make a follow-on investment because we may not want to increase our concentration of risk, because we prefer other opportunities or because we are inhibited by compliance with BDC requirements, compliance with covenants contained in our Revolving Credit Facility or compliance with the requirements for maintenance of our RIC status.
49
Our portfolio companies may prepay loans, which may reduce stated yields in the future if the capital returned cannot be invested in transactions with equal or greater expected yields.
Certain of the loans we make are prepayable at any time, with some prepayable at no premium to par. We cannot predict when such loans may be prepaid. Whether a loan is prepaid will depend both on the continued positive performance of the portfolio company and the existence of favorable financing market conditions that permit such company to replace existing financing with less expensive capital. In periods of rising interest rates, the risk of prepayment of floating rate loans may increase if other financing sources are available. As market conditions change frequently, it is unknown when, and if, this may be possible for each portfolio company. In the case of some of these loans, having the loan prepaid early may reduce the achievable yield for us in the future below the current yield disclosed for our portfolio if the capital returned cannot be invested in transactions with equal or greater expected yields.
Investments in common and preferred equity securities, many of which are illiquid with no readily available market, involve a substantial degree of risk.
Although common stock has historically generated higher average total returns than fixed income securities over the long term, common stock also has experienced significantly more volatility in those returns. Our equity investments may fail to appreciate and may decline in value or become worthless, and our ability to recover our investment will depend on our portfolio company’s success. Investments in equity securities involve a number of significant risks, including:
| • | any equity investment we make in a portfolio company could be subject to further dilution as a result of the issuance of additional equity interests and to serious risks as a junior security that will be subordinate to all indebtedness (including trade creditors) or senior securities in the event that the issuer is unable to meet its obligations or becomes subject to a bankruptcy process; |
| • | to the extent that the portfolio company requires additional capital and is unable to obtain it, we may not recover our investment; and |
| • | in some cases, equity securities in which we invest will not pay current dividends, and our ability to realize a return on our investment, as well as to recover our investment, will be dependent on the success of the portfolio company. |
Even if the portfolio company is successful, our ability to realize the value of our investment may be dependent on the occurrence of a liquidity event, such as a public offering or the sale of the portfolio company. It is likely to take a significant amount of time before a liquidity event occurs or we can otherwise sell our investment. In addition, the equity securities we receive or invest in may be subject to restrictions on resale during periods in which it could be advantageous to sell them.
There are special risks associated with investing in preferred securities, including:
| • | preferred securities may include provisions that permit the issuer, at its discretion, to defer distributions for a stated period without any adverse consequences to the issuer. If we own a preferred security that is deferring its distributions, we may be required to report income for tax purposes before we receive such distributions; |
| • | preferred securities are subordinated to debt in terms of priority to income and liquidation payments, and therefore will be subject to greater credit risk than debt; |
| • | preferred securities may be substantially less liquid than many other securities, such as common stock or U.S. government securities; and |
| • | generally, preferred security holders have no voting rights with respect to the issuing company, subject to limited exceptions. |
Additionally, when we invest in debt securities, we may acquire warrants or other equity securities as well. Our goal is ultimately to dispose of such equity interests and realize gains upon our disposition of such interests. However, the equity interests we receive may not appreciate in value and, in fact, may decline in value. Accordingly, we may not be able to realize gains from our equity interests and any gains that we do realize on the disposition of any equity interests may not be sufficient to offset any other losses we experience.
50
We may invest, to the extent permitted by law, in the equity securities of investment funds that are operating pursuant to certain exceptions to the Investment Company Act and, to the extent we so invest, will bear our ratable share of any such company’s expenses, including management and performance fees. We will also remain obligated to pay the Management Fee and Incentive Fee to our Investment Adviser with respect to the assets invested in the securities and instruments of such companies. With respect to each of these investments, each of our common stockholders will bear his or her share of the Management Fee and Incentive Fee due to our Investment Adviser as well as indirectly bearing the management and performance fees and other expenses of any such investment funds or advisers.
By originating loans to companies that are experiencing significant financial or business difficulties, we may be exposed to distressed lending risks.
As part of our lending activities, we may originate loans to companies that are experiencing significant financial or business difficulties, including companies involved in bankruptcy or other reorganization and liquidation proceedings. Although the terms of such financing may result in significant financial returns to us, they involve a substantial degree of risk. The level of analytical sophistication, both financial and legal, necessary for successful financing to companies experiencing significant business and financial difficulties is unusually high. There is no assurance that we will correctly evaluate the value of the assets collateralizing our loans or the prospects for a successful reorganization or similar action. In any reorganization or liquidation proceeding relating to a company that we fund, we may lose all or part of the amounts advanced to the borrower or may be required to accept collateral with a value less than the amount of the loan advanced by us to the borrower.
We may be exposed to special risks associated with bankruptcy cases.
Many of the events within a bankruptcy case are adversarial and often beyond the control of the creditors. While creditors generally are afforded an opportunity to object to significant actions, there can be no assurance that a bankruptcy court would not approve actions that may be contrary to our interests. Furthermore, there are instances where creditors can lose their ranking and priority if they are considered to have taken over management of a borrower.
The reorganization of a company can involve substantial legal, professional and administrative costs to a lender and the borrower; it is subject to unpredictable and lengthy delays; and during the process a company’s competitive position may erode, key management may depart and a company may not be able to invest its capital adequately. In some cases, the debtor company may not be able to reorganize and may be required to liquidate assets. The debt of companies in financial reorganization will, in most cases, not pay current interest, may not accrue interest during reorganization and may be adversely affected by an erosion of the issuer’s fundamental value.
In addition, lenders can be subject to lender liability claims for actions taken by them where they become too involved in the borrower’s business or exercise control over the borrower. For example, we could become subject to a lender’s liability claim, if, among other things, the borrower requests significant managerial assistance from us and we provide such assistance as contemplated by the Investment Company Act.
51
Declines in market prices and liquidity in the corporate debt markets can result in significant net unrealized depreciation of our portfolio, which in turn would reduce our NAV.
As a BDC, we are required to carry our investments at market value or, if no market value is ascertainable, at fair value as determined in good faith under procedures adopted by our Board of Directors. We may take into account the following types of factors, if relevant, in determining the fair value of our investments: the enterprise value of a portfolio company (the entire value of the portfolio company to a market participant, including the sum of the values of debt and equity securities used to capitalize the enterprise at a point in time), the nature and realizable value of any collateral, the portfolio company’s ability to make payments and its earnings and discounted cash flow (taking into consideration current market interest rates and credit spreads), the markets in which the portfolio company does business, a comparison of the portfolio company’s securities to similar publicly traded securities and other relevant factors. When an external event such as a purchase transaction, public offering or subsequent equity sale occurs, we use the pricing indicated by the external event to corroborate our valuation. While most of our investments are not publicly traded, applicable accounting standards require us to assume as part of our valuation process that our investments are sold in a principal market to market participants (even if we plan on holding an investment through its maturity). As a result, volatility in the capital markets can also adversely affect our investment valuations. Decreases in the market values or fair values of our investments are recorded as unrealized depreciation. The effect of all of these factors on our portfolio can reduce our NAV by increasing net unrealized depreciation in our portfolio. Depending on market conditions, we could incur substantial realized losses and may suffer unrealized losses, which could have a material adverse impact on our business, financial condition and results of operations.
Economic recessions or downturns could impair our portfolio companies and harm our operating results.
Our portfolio companies may be susceptible to economic downturns or recessions and may be unable to repay our loans during these periods. Therefore, during these periods our non-performing assets may increase and the value of our portfolio may decrease if we are required to write down the values of our investments. Adverse economic conditions may also decrease the value of collateral securing some of our loans and the value of our equity investments. Economic slowdowns or recessions could lead to financial losses in our portfolio and a decrease in revenues, net income and assets. Unfavorable economic conditions also could increase our funding costs, limit our access to the capital markets or result in a decision by lenders not to extend credit to us. These events could prevent us from increasing investments and harm our operating results.
A portfolio company’s failure to satisfy financial or operating covenants imposed by us or other lenders could lead to defaults and, potentially, acceleration of the time when the loans are due and foreclosure on the portfolio company’s assets representing collateral for its obligations. This could trigger cross defaults under other agreements and jeopardize our portfolio company’s ability to meet its obligations under the debt that we hold and the value of any equity securities we own. We may incur expenses to the extent necessary to seek recovery upon default or to negotiate new terms with a defaulting portfolio company.
Our portfolio companies may have incurred or issued, or may in the future incur or issue, debt or equity securities that rank equally with, or senior to, our investments in such companies, which could have an adverse effect on us in any liquidation of the portfolio company.
Our portfolio companies may have, or may be permitted to incur, other debt, or issue other equity securities that rank equally with, or senior to, our investments. By their terms, such instruments may provide that the holders are entitled to receive payment of dividends, interest or principal on or before the dates on which we are entitled to receive payments in respect of our investments. These debt instruments would usually prohibit the portfolio companies from paying interest on or repaying our investments in the event and during the continuance of a default under such debt. Also, in the event of insolvency, liquidation, dissolution, reorganization or bankruptcy of a portfolio company, holders of securities ranking senior to our investment in that portfolio company typically are entitled to receive payment in full before we receive any distribution in respect of our investment. After repaying such holders, the portfolio company may not have any remaining assets to use for repaying its obligation to us. In the case of securities ranking equally with our investments, we would have to share on an equal basis any distributions with other security holders in the event of an insolvency, liquidation, dissolution, reorganization or bankruptcy of the relevant portfolio company.
52
Additionally, certain loans that we make to portfolio companies may be secured on a second priority basis by the same collateral securing senior secured debt, which will be secured on a first priority basis. The first priority liens on the collateral will secure the portfolio company’s obligations under any outstanding senior debt and may secure certain other future debt that may be permitted to be incurred by the portfolio company under the agreements governing the loans. The holders of obligations secured by the first priority liens on the collateral will generally control the liquidation of and be entitled to receive proceeds from any realization of the collateral to repay their obligations in full before us. In addition, the value of the collateral in the event of liquidation will depend on market and economic conditions, the availability of buyers and other factors. There can be no assurance that the proceeds, if any, from the sale or sales of all of the collateral would be sufficient to satisfy the loan obligations secured by the second priority liens after payment in full of all obligations secured by the first priority liens. If such proceeds are not sufficient to repay amounts outstanding under the loan obligations secured by the second priority liens, then we, to the extent not repaid from the proceeds of the sale of the collateral, will only have an unsecured claim against the portfolio company’s remaining assets, if any.
The rights we may have with respect to the collateral securing any junior priority loans we make to our portfolio companies may also be limited pursuant to the terms of one or more intercreditor agreements that we enter into with the holders of senior debt. Under such an intercreditor agreement, at any time that senior obligations are outstanding, we may forfeit certain rights with respect to the collateral to the holders of the senior obligations. These rights may include the right to commence enforcement proceedings against the collateral, the right to control the conduct of such enforcement proceedings, the right to approve amendments to collateral documents, the right to release liens on the collateral and the right to waive past defaults under collateral documents. We may not have the ability to control or direct such actions, even if our rights as junior lenders are adversely affected. In addition, a bankruptcy court may choose not to enforce an intercreditor agreement or other arrangement with creditors. Similar risks to the foregoing may apply where we hold the last out piece of a unitranche loan.
We may also make unsecured loans to portfolio companies, meaning that such loans will not benefit from any interest in collateral of such companies. Liens on such portfolio companies’ collateral, if any, will secure the portfolio company’s obligations under its outstanding secured debt and may secure certain future debt that is permitted to be incurred by the portfolio company under its secured loan agreements. The holders of obligations secured by such liens will generally control the liquidation of, and be entitled to receive proceeds from, any realization of such collateral to repay their obligations in full before us. In addition, the value of such collateral in the event of liquidation will depend on market and economic conditions, the availability of buyers and other factors. There can be no assurance that the proceeds, if any, from sales of such collateral would be sufficient to satisfy our unsecured loan obligations after payment in full of all secured loan obligations. If such proceeds were not sufficient to repay the outstanding secured loan obligations, then our unsecured claims would rank equally with the unpaid portion of such secured creditors’ claims against the portfolio company’s remaining assets, if any.
Our portfolio companies may be highly leveraged.
Some of our portfolio companies may be highly leveraged, which may have adverse consequences to these companies and to us as an investor. These companies may be subject to restrictive financial and operating covenants and the leverage may impair these companies’ ability to finance their future operations and capital needs. As a result, these companies’ flexibility to respond to changing business and economic conditions and to take advantage of business opportunities may be limited. Further, a leveraged company’s income and net assets will tend to increase or decrease at a greater rate than if borrowed money were not used.
Our investments in non-U.S. companies may involve significant risks in addition to the risks inherent in U.S. investments.
Our investment strategy contemplates potential investments in securities of non-U.S. companies to the extent permissible under the Investment Company Act. Investing in non-U.S. companies may expose us to additional risks not typically associated with investing in U.S. companies. These risks include changes in exchange control regulations, political and social instability, expropriation, imposition of non-U.S. taxes (potentially at confiscatory levels), less liquid markets, less available information than is generally the case in the United States, higher transaction costs, less government supervision of exchanges, brokers and issuers, less developed bankruptcy laws, difficulty in enforcing contractual obligations, lack of uniform accounting and auditing standards and greater price volatility. These risks are likely to be more pronounced for investments in companies located in emerging markets and particularly for middle-market companies in these economies.
53
Although most of our investments are denominated in U.S. dollars, our investments that are denominated in a non-U.S. currency will be subject to the risk that the value of a particular currency will change in relation to the U.S. dollar. Among the factors that may affect currency values are trade balances, the level of short-term interest rates, differences in relative values of similar assets in different currencies, long-term opportunities for investment and capital appreciation and political developments. We may employ hedging techniques to minimize these risks, but we cannot assure you that such strategies will be effective or without risk to us.
We may expose ourselves to risks if we engage in hedging transactions.
Subject to applicable provisions of the Investment Company Act and applicable CFTC regulations, we may enter into hedging transactions in a manner consistent with SEC guidance, which may expose us to risks associated with such transactions. Such hedging may utilize instruments such as forward contracts, currency options and interest rate swaps, caps, collars and floors to seek to hedge against fluctuations in the relative values of our portfolio positions from changes in currency exchange rates and market interest rates. Use of these hedging instruments may include counter-party credit risk.
Hedging against a decline in the values of our portfolio positions does not eliminate the possibility of fluctuations in the values of such positions or prevent losses if the values of such positions decline. However, such hedging can establish other positions designed to gain from those same developments, thereby offsetting the decline in the value of such portfolio positions. Such hedging transactions may also limit the opportunity for gain if the values of the underlying portfolio positions should increase. Moreover, it may not be possible to hedge against an exchange rate or interest rate fluctuation that is so generally anticipated that we are not able to enter into a hedging transaction at an acceptable price.
The success of any hedging transactions we may enter into will depend on our ability to correctly predict movements in currencies and interest rates. Therefore, while we may enter into such transactions to seek to reduce currency exchange rate and interest rate risks, unanticipated changes in currency exchange rates or interest rates may result in poorer overall investment performance than if we had not engaged in any such hedging transactions. In addition, the degree of correlation between price movements of the instruments used in a hedging strategy and price movements in the portfolio positions being hedged may vary. Moreover, for a variety of reasons, we may not seek to (or be able to) establish a perfect correlation between such hedging instruments and the portfolio holdings being hedged. Any such imperfect correlation may prevent us from achieving the intended hedge and expose us to risk of loss. In addition, it may not be possible to hedge fully or perfectly against currency fluctuations affecting the value of securities denominated in non-U.S. currencies because the value of those securities is likely to fluctuate as a result of factors not related to currency fluctuations. See also “—Risks Relating to Our Business—We are exposed to risks associated with changes in interest rates.”
We may form one or more CLOs, which may subject us to certain structured financing risks.
To finance investments, we may securitize certain of our investments, including through the formation of one or more CLOs, while retaining all or most of the exposure to the performance of these investments. This would involve contributing a pool of assets to a special purpose entity, and selling debt interests in such entity on a non-recourse or limited-recourse basis to purchasers. Any interest in any such CLO held by us may be considered a “non-qualifying asset” for purposes of Section 55 of the Investment Company Act.
If we create a CLO, we will depend on distributions from the CLO’s assets out of its earnings and cash flows to enable us to make distributions to our stockholders. The ability of a CLO to make distributions will be subject to various limitations, including the terms and covenants of the debt it issues. For example, tests (based on interest coverage or other financial ratios or other criteria) may restrict our ability, as holder of a CLO’s equity interests, to receive cash flow from these investments. There is no assurance any such performance tests will be satisfied. Also, a CLO may take actions that delay distributions in order to preserve ratings and to keep the cost of present and future financings lower or the CLO may be obligated to retain cash or other assets to satisfy over-collateralization requirements commonly provided for holders of the CLO’s debt. As a result, there may be a lag, which could be significant, between the repayment or other realization on a loan or other assets in, and the distribution of cash out of, a CLO, or cash flow may be completely restricted for the life of the CLO. If we do not receive cash flow from any such CLO that is necessary to satisfy the annual distribution requirement for maintaining our RIC status, and we are unable to obtain cash from other sources necessary to satisfy this requirement, we could fail to maintain our status as a RIC, which would have a material adverse effect on our financial performance.
54
In addition, a decline in the credit quality of loans in a CLO due to poor operating results of the relevant borrower, declines in the value of loan collateral or increases in defaults, among other things, may force a CLO to sell certain assets at a loss, reducing their earnings and, in turn, cash potentially available for distribution to us for distribution to our stockholders.
To the extent that any losses are incurred by the CLO in respect of any collateral, such losses will be borne first by us as owner of equity interests. Finally, any equity interests that we retain in a CLO will not be secured by the assets of the CLO and we will rank behind all creditors of the CLO.
Risks Relating to Our Securities
Investing in our securities involves an above average degree of risk.
The investments we make in accordance with our investment objective may result in a higher amount of risk than alternative investment options and volatility or loss of principal. Our investments in portfolio companies may be highly speculative and aggressive, and therefore an investment in our securities may not be suitable for someone with lower risk tolerance.
The market price of our securities may fluctuate significantly.
The market price and liquidity of the market for our securities may be significantly affected by numerous factors, some of which are beyond our control and may not be directly related to our operating performance. These factors include:
| • | significant volatility in the market price and trading volume of securities of BDCs or other companies in our sector, which are not necessarily related to the operating performance of these companies; |
| • | price and volume fluctuations in the overall stock market from time to time; |
| • | the inclusion or exclusion of our securities from certain indices; |
| • | changes in regulatory policies or tax guidelines, particularly with respect to RICs or BDCs; |
| • | any loss of RIC or BDC status; |
| • | changes in earnings or perceived changes or variations in operating results; |
| • | changes or perceived changes in the value of our portfolio of investments; |
| • | changes in accounting guidelines governing valuation of our investments; |
| • | any shortfall in revenue or net income or any increase in losses from levels expected by investors or securities analysts; |
| • | the inability of our Investment Adviser to employ additional experienced investment professionals or the departure of any of our Investment Adviser’s key personnel; |
| • | short-selling pressure with respect to shares of our common stock or BDCs generally; |
| • | future sales of our securities convertible into or exchangeable or exercisable for our common stock or the conversion of such securities; |
| • | uncertainty surrounding the strength of the U.S. economic recovery; |
| • | concerns regarding European sovereign debt; |
| • | operating performance of companies comparable to us; |
| • | general economic trends and other external factors; and |
| • | loss of a major funding source. |
In the past, following periods of volatility in the market price of a company’s securities, securities class action litigation has often been brought against that company. If our stock price fluctuates significantly, we may be the target of securities litigation in the future. Securities litigation could result in substantial costs and divert management’s attention and resources from our business.
55
Shares of closed-end investment companies, including BDCs, frequently trade at a discount to their NAV per share.
We cannot predict the prices at which our common stock will trade. Shares of closed-end investment companies, including BDCs, frequently trade at a discount from their NAV and our common stock may also be discounted in the market. This characteristic of closed-end investment companies is separate and distinct from the risk that our NAV per share of common stock may decline. We cannot predict whether our common stock will trade at, above or below NAV. In addition, if our common stock trades below its NAV, we will generally not be able to sell additional shares of our common stock to the public at its market price without first obtaining the approval of a majority of our stockholders (including a majority of our unaffiliated stockholders) and our Independent Directors for such issuance.
Sales of substantial amounts of our common stock in the public market may have a material adverse effect on the market price of our common stock.
Sales of substantial amounts of our common stock, the availability of such common stock for sale (including as a result of the conversion of our 4.50% Convertible Notes due 2022 (the “Convertible Notes”) into common stock) or the perception that such sales could occur could materially adversely affect the prevailing market price for our common stock. Both the sale of a substantial amount of our securities and the perception that such sales could occur could impair our ability to raise additional capital through the sale of equity securities should we desire to do so. Additionally, as an owner of approximately 17.85% of our common stock as of December 31, 2016, Group Inc. is a significant stockholder that may decide to sell a substantial amount of its common stock, subject to applicable securities laws, and such a sale would exacerbate the effects described above.
Our stockholders may experience dilution upon the conversion of our Convertible Notes.
Our Convertible Notes are convertible into shares of our common stock beginning on October 1, 2021 or, under certain circumstances, earlier. Upon conversion of the Convertible Notes, we have the choice to pay or deliver, as the case may be, at our election, cash, shares of our common stock or a combination of cash and shares of our common stock. The initial conversion price of the Convertible Notes is $24.49, subject to adjustment in certain circumstances. If we elect to deliver shares of common stock upon a conversion at the time our NAV per share exceeds the conversion price in effect at such time, our stockholders may incur dilution. In addition, our stockholders will experience dilution in their ownership percentage of common stock upon our issuance of common stock in connection with the conversion of the Convertible Notes and any dividends paid on our common stock will also be paid on shares issued in connection with such conversion after such issuance.
Our stockholders will experience dilution in their ownership percentage if they opt out of our dividend reinvestment plan.
We have adopted a dividend reinvestment plan pursuant to which we reinvest all cash distributions declared by the Board of Directors on behalf of investors who do not elect to receive their distributions in cash. As a result, if the Board of Directors declares a cash distribution, then our stockholders who have not opted out of our dividend reinvestment plan will have their cash distributions automatically reinvested in additional shares of our common stock, rather than receiving the cash distribution. See “Item 5. Market For Registrant’s Common Equity, Related Stockholder Matters and Issuer Purchases of Equity Securities—Distributions” and “Item 1. Business—Dividend Reinvestment Plan” for a description of our distribution policy and obligations.
If, on the payment date for any distribution, the most recently computed NAV per share is equal to or less than the closing market price plus estimated per share fees (which include any applicable brokerage commissions the plan agent is required to pay), the plan agent will invest the distribution amount in newly issued shares on behalf of the participants. The number of newly issued shares to be credited to a participant’s account will be determined by dividing the dollar amount of the distribution by the most recently computed NAV per share provided that, if the NAV is less than or equal to 95% of the then current market price per share, the dollar amount of the distribution will be divided by 95% of the market price on the payment date. Accordingly, participants in the dividend reinvestment plan may receive a greater number shares of our common stock than the number of shares associated with the market price of our common stock, resulting in dilution for other stockholders. Stockholders that opt out of our dividend reinvestment plan will experience dilution in their ownership percentage of our common stock over time. See “Item 1. Business—Dividend Reinvestment Plan.”
56
Our stockholders that do not opt out of our dividend reinvestment plan should generally expect to have current tax liabilities without receiving cash to pay such liabilities.
Under our dividend reinvestment plan, if we declare a cash distribution, our stockholders who have not elected to “opt out” will have their cash distributions automatically reinvested in additional shares of our common stock, rather than receiving the cash distributions. Stockholders who receive distributions in the form of shares of our common stock generally are subject to the same U.S. federal, state and local tax consequences as stockholders who elect to receive their distributions in cash; however, since their distributions will be reinvested, those stockholders will not receive cash with which to pay any applicable taxes on such reinvested distributions. As a result, stockholders that have not opted out of our dividend reinvestment plan may have to use funds from other sources to pay any tax liabilities imposed upon them based on the value of the common stock received.
We may in the future determine to issue preferred stock, which could adversely affect the market value of our common stock.
The issuance of shares of preferred stock with dividend or conversion rights, liquidation preferences or other economic terms favorable to the holders of preferred stock could adversely affect the market price for our common stock by making an investment in the common stock less attractive. In addition, the dividends on any preferred stock we issue must be cumulative. Payment of dividends and repayment of the liquidation preference of preferred stock must take preference over any distributions or other payments to our common stockholders, and holders of preferred stock are not subject to any of our expenses or losses and are not entitled to participate in any income or appreciation in excess of their stated preference (other than convertible preferred stock that converts into common stock). In addition, under the Investment Company Act, participating preferred stock and preferred stock constitutes a “senior security” for purposes of the 2 to 1 asset coverage test.
Certain provisions of our certificate of incorporation and bylaws and the Delaware General Corporation Law (“DGCL”), as well as other aspects of our structure, including the substantial ownership interest of Group Inc., could deter takeover attempts and have an adverse impact on the price of our common stock
Our certificate of incorporation and bylaws, as well as the DGCL, contain provisions that may have the effect of discouraging a third party from making an acquisition proposal for us. Among other things, our certificate of incorporation and bylaws:
| • | provide that our Board of Directors is classified, which may delay the ability of our stockholders to change the membership of a majority of our Board of Directors; |
| • | do not provide for cumulative voting; |
| • | provide that vacancies on our Board of Directors, including newly created directorships, may be filled only by a majority vote of directors then in office; |
| • | provide that our directors may be removed only for cause, and only by a supermajority vote of the stockholders entitled to elect such directors; |
| • | provide that stockholders may only take action at an annual or special meeting of stockholders, and may not act by written consent; |
| • | restrict stockholders’ ability to call special meetings; |
| • | require a supermajority vote of stockholders to effect certain amendments to our certificate of incorporation and bylaws; and |
| • | require stockholders to provide advance notice of new business proposals and director nominations under specific procedures. |
57
We have provisions comparable to those of Section 203 of the DGCL (other than with respect to Group Inc. and its affiliates and certain of its or their direct or indirect transferees and any group as to which such persons are a party). These provisions generally prohibit us from engaging in mergers, business combinations and certain other types of transactions with “interested stockholders” (generally defined as persons or entities that beneficially own 15% or more of our voting stock), other than the exempt parties as described above, for a period of three years following the date the person became an interested stockholder unless, prior to such stockholder becoming an interested stockholder, our Board of Directors has approved the “business combination” that would otherwise be restricted or the transaction that resulted in the interested stockholder becoming an interested stockholder or the subsequent transaction with the interested stockholder has been approved by our Board of Directors and 662/3% of our outstanding voting stock (other than voting stock owned by the interested stockholder). Such provisions may discourage third parties from trying to acquire control of us and increase the difficulty of consummating such an offer.
These anti-takeover provisions may inhibit a change of control in circumstances that could give the holders of our common stock the opportunity to realize a premium over the market price for the common stock. In addition, certain aspects of our structure, including the substantial ownership interest of Group Inc., may have the effect of discouraging a third party from making an acquisition proposal for us.
We may not be able to pay you distributions on our common stock or preferred stock, our distributions to you may not grow over time and a portion of our distributions to you may be a return of capital for U.S. federal income tax purposes.
We intend to pay quarterly distributions to our stockholders out of assets legally available for distribution. We cannot assure you that we will achieve investment results that will allow us to make a specified level of cash distributions or year-to-year increases in cash distributions. If we are unable to satisfy the asset coverage test applicable to us as a BDC, or if we violate certain covenants under our Revolving Credit Facility and other debt financing agreements, our ability to pay distributions to our stockholders could be limited. All distributions will be paid at the discretion of our Board of Directors and will depend on our earnings, financial condition, maintenance of our RIC status, compliance with applicable BDC regulations, compliance with covenants under our Revolving Credit Facility and other debt financing agreements and such other factors as our Board of Directors may deem relevant from time to time.
The distributions we pay to our stockholders in a year may exceed our net ordinary income and capital gains for that year and, accordingly, a portion of such distributions may constitute a return of capital for U.S. federal income tax purposes that would reduce a stockholder’s adjusted tax basis in its shares of our common stock or preferred stock and correspondingly increase such stockholder’s gain, or reduce such stockholder’s loss, on disposition of such shares. Distributions in excess of a stockholder’s adjusted tax basis in its shares of our common stock or preferred stock will constitute capital gains to such stockholder.
Stockholders who periodically receive the payment of a distribution from a RIC consisting of a return of capital for U.S. federal income tax purposes may be under the impression that they are receiving a distribution of RIC’s net ordinary income or capital gains when they are not. Accordingly, stockholders should read carefully any written disclosure accompanying a distribution from us and the information about the specific tax characteristics of our distributions provided to stockholders after the end of each calendar year, and should not assume that the source of any distribution is our net ordinary income or capital gains.
We may have difficulty paying our required distributions if we recognize taxable income before or without receiving cash representing such income.
For U.S. federal income tax purposes, we will include in our taxable income certain amounts that we have not yet received in cash, such as OID or accruals on a contingent payment debt instrument, which may occur if we receive warrants in connection with the origination of a loan, or possibly in other circumstances, or contracted PIK interest, which generally represents contractual interest added to the loan balance and due at the end of the loan term. Such OID and PIK interest will be included in our taxable income before we receive any corresponding cash payments. We also may be required to include in our taxable income certain other amounts that we will not receive in cash. The credit risk associated with the collectability of deferred payments may be increased as and when a portfolio company increases the amount of interest on which it is deferring cash payment through deferred interest features. Our investments with a deferred interest feature may represent a higher credit risk than loans for which interest must be paid in full in cash on a regular basis. For example, even if the accounting conditions for income accrual are met, the borrower could still default when our actual collection is scheduled to occur upon maturity of the obligation.
58
Because in certain cases we may recognize taxable income before or without receiving cash representing such income, we may have difficulty making distributions to our stockholders that will be sufficient to enable us to meet the annual distribution requirement necessary for us to maintain our status as a RIC. Accordingly, we may need to sell some of our assets at times and/or at prices that we would not consider advantageous, we may need to raise additional equity or debt capital or we may need to forego new investment opportunities or otherwise take actions that are disadvantageous to our business (or be unable to take actions that are advantageous to our business) to enable us to make distributions to our stockholders that will be sufficient to enable us to meet the annual distribution requirement. If we are unable to obtain cash from other sources to meet the annual distribution requirement, we may fail to qualify for the U.S. federal income tax benefits allowable to RICs and, thus, become subject to a corporate-level U.S. federal income tax (and any applicable U.S. state and local taxes).
Our stockholders may receive shares of our common stock or preferred stock as dividends, which could result in adverse tax consequences to them.
In order to satisfy the annual distribution requirement applicable to RICs, we will have the ability to declare a large portion of a dividend in shares of our common stock or preferred stock instead of in cash. We are not subject to restrictions on the circumstances in which we may declare a portion of a dividend in shares of our stock but would generally anticipate doing so only in unusual situations, such as, for example, if we do not have sufficient cash to meet our RIC distribution requirements under the Code. Generally, were we to declare such a dividend, it would allow stockholders to elect payment in cash and/or shares of our stock of equivalent value, with a percentage cap on the portion of the total dividend to be issued in cash (such that, if the aggregate stockholder elections exceeded such percentage cap, each stockholder’s cash portion would be reduced pro rata). The number of shares of our stock declared would thus depend on the applicable percentage cap, the stockholders’ individual elections to receive cash or stock, and the value of the shares of our stock. As long as a portion of such dividend is paid in cash and certain requirements are met, the entire distribution will generally be treated as a dividend for U.S. federal income tax purposes. As a result, a stockholder generally would be taxed on 100% of the fair market value of the dividend on the date the dividend is received by the stockholder in the same manner as a cash dividend, even though most of the dividend was paid in shares of our common stock or preferred stock. We currently do not intend to pay dividends in shares of our common stock or preferred stock, but there can be no assurance we will not do so in the future.
If we are not treated as a “publicly offered regulated investment company,” as defined in the Code, U.S. stockholders that are individuals, trusts or estates will be taxed as though they received a distribution of some of our expenses.
We expect to be treated as a “publicly offered regulated investment company” as a result of either (i) shares of our common stock being held by at least 500 persons at all times during a taxable year or (ii) shares of our common stock being treated as regularly traded on an established securities market. However, we cannot assure you that we will be treated as a publicly offered regulated investment company for all years. If we are not treated as a publicly offered regulated investment company for any calendar year, each U.S. stockholder that is an individual, trust or estate will be treated as having received a dividend from us in the amount of such U.S. stockholder’s allocable share of the management and incentive fees paid to our Investment Adviser and certain of our other expenses for the calendar year, and these fees and expenses will be treated as miscellaneous itemized deductions of such U.S. stockholder. Miscellaneous itemized deductions generally are deductible by a U.S. stockholder that is an individual, trust or estate only to the extent that the aggregate of such U.S. stockholder’s miscellaneous itemized deductions exceeds 2% of such U.S. stockholder’s adjusted gross income for U.S. federal income tax purposes, are not deductible for purposes of the alternative minimum tax and are subject to the overall limitation on itemized deductions under the Code.
Non-U.S. stockholders may be subject to withholding of U.S. federal income tax on dividends we pay.
Distributions of our “investment company taxable income” to a non-U.S. stockholder that are not effectively connected with the non-U.S. stockholder’s conduct of a trade or business within the United States will generally be subject to withholding of U.S. federal income tax at a 30% rate (or lower rate provided by an applicable income tax treaty) to the extent of our current or accumulated earnings and profits.
Certain properly reported dividends are generally exempt from withholding of U.S. federal income tax where they are paid in respect of our (i) “qualified net interest income” (generally, our U.S.-source interest income, other than certain contingent interest and interest from obligations of a corporation or partnership in which we or the non-U.S. stockholder are at least a 10% shareholder, reduced by expenses that are allocable to such income) or (ii) “qualified short-term capital gains” (generally, the excess of our net short-term capital gain over our net long-term capital loss for such taxable year), and certain other requirements are satisfied.
59
NO ASSURANCE CAN BE GIVEN AS TO WHETHER ANY OF OUR DISTRIBUTIONS WILL BE ELIGIBLE FOR THIS EXEMPTION FROM WITHHOLDING OF U.S. FEDERAL INCOME TAX OR, IF ELIGIBLE, WILL BE REPORTED AS SUCH BY US. IN PARTICULAR, THIS EXEMPTION WILL NOT APPLY TO OUR DISTRIBUTIONS PAID IN RESPECT OF OUR NON-U.S. SOURCE INTEREST INCOME OR OUR DIVIDEND INCOME (OR ANY OTHER TYPE OF INCOME OTHER THAN GENERALLY OUR NON-CONTINGENT U.S. SOURCE INTEREST INCOME RECEIVED FROM UNRELATED OBLIGORS AND OUR QUALIFIED SHORT-TERM CAPITAL GAINS). IN THE CASE OF OUR COMMON STOCK HELD THROUGH AN INTERMEDIARY, THE INTERMEDIARY MAY WITHHOLD U.S. FEDERAL INCOME TAX EVEN IF WE REPORT THE PAYMENT AS QUALIFIED NET INTEREST INCOME OR QUALIFIED SHORT-TERM CAPITAL GAIN.
Purchases of our common stock pursuant to the Company’s 10b5-1 Plan (the “Company 10b5-1 Plan”) or otherwise may result in the price of our common stock being higher than the price that otherwise might exist in the open market.
We are authorized to purchase up to $25.00 million of shares of our common stock if the stock trades below the most recently announced NAV per share (including any updates, corrections or adjustments publicly announced by us to any previously announced NAV per share), subject to certain limitations, until March 18, 2017. Any such purchases will be conducted in accordance with applicable securities laws. Whether purchases will be made under the Company 10b5-1 Plan or otherwise and how much will be purchased at any time is uncertain, dependent on prevailing market prices and trading volumes, all of which we cannot predict. These activities may have the effect of maintaining the market price of our common stock or retarding a decline in the market price of the common stock, and, as a result, the price of our common stock may be higher than the price that otherwise might exist in the open market.
Purchases of our common stock by us under the Company 10b5-1 Plan or otherwise may result in dilution to our NAV per share.
We are authorized to repurchase shares of common stock when the market price per share is below the most recently reported NAV per share (including any updates, corrections or adjustments publicly announced by us to any previously announced NAV per share), including under the Company 10b5-1 Plan. Because purchases may be made beginning at any price below our most recently reported NAV per share, if our NAV per share decreases after the date as of which NAV per share was last reported, such purchases may result in dilution to our NAV per share. This dilution would occur because we would repurchase shares at a price above the then-current NAV per share, which would cause a proportionately smaller increase in our stockholders’ interest in our earnings and assets and their voting interest in us than the decrease in our assets resulting from such repurchase. As a result of any such dilution, our market price per share may decline. The actual dilutive effect will depend on the number of shares of common stock that could be so repurchased, the price and the timing of any repurchases.
The continued uncertainty related to the sustainability and pace of economic recovery in the U.S. and globally could have a negative impact on our business.
Our business is directly influenced by the economic cycle, and could be negatively impacted by a downturn in economic activity in the US as well as globally. Fiscal and monetary actions taken by U.S. and non-U.S. government and regulatory authorities could have a material adverse impact on our business. To the extent uncertainty regarding the U.S. or global economy negatively impacts consumer confidence and consumer credit factors, our business, financial condition and results of operations could be adversely affected. Moreover, Federal Reserve policy, along with the general policies of the incoming Presidential administration, including with respect to certain interest rates and the decision to end its quantitative easing policy, may also adversely affect the value, volatility and liquidity of dividend- and interest-paying securities. Market volatility, rising interest rates and/or a return to unfavorable economic conditions could adversely affect our business.
60
To the extent OID and PIK interest constitute a portion of our income, we will be exposed to typical risks associated with such income being required to be included in taxable and accounting income prior to receipt of cash representing such income.
Our investments may include OID instruments and PIK, interest arrangements, which represents contractual interest added to a loan balance and due at the end of such loan’s term. To the extent OID or PIK interest constitute a portion of our income, we are exposed to typical risks associated with such income being required to be included in taxable and accounting income prior to receipt of cash, including the following:
| • | The higher interest rates of OID and PIK instruments reflect the payment deferral and increased credit risk associated with these instruments, and OID and PIK instruments generally represent a significantly higher credit risk than coupon loans. |
| • | Even if the accounting conditions for income accrual are met, the borrower could still default when our actual collection is supposed to occur at the maturity of the obligation. |
| • | OID and PIK instruments may have unreliable valuations because their continuing accruals require continuing judgments about the collectability of the deferred payments and the value of any associated collateral. OID and PIK income may also create uncertainty about the source of our cash distributions. |
| • | For accounting purposes, any cash distributions to shareholders representing OID and PIK income are not treated as coming from paid-in capital, even if the cash to pay them comes from offering proceeds. As a result, despite the fact that a distribution representing OID and PIK income could be paid out of amounts invested by our stockholders, the Investment Company Act does not require that stockholders be given notice of this fact by reporting it as a return of capital. |
Terms relating to redemption may materially adversely affect your return on any debt securities that we may issue.
If our noteholders’ debt securities are redeemable at our option, we may choose to redeem your debt securities at times when prevailing interest rates are lower than the interest rate paid on your debt securities. In addition, if our noteholders’ debt securities are subject to mandatory redemption, we may be required to redeem such debt securities also at times when prevailing interest rates are lower than the interest rate paid on such debt securities. In this circumstance, a noteholder may not be able to reinvest the redemption proceeds in a comparable security at an effective interest rate as high as the debt securities being redeemed.
Our credit ratings may not reflect all risks of an investment in our debt securities.
Our credit ratings are an assessment by third parties of our ability to pay our obligations. Consequently, real or anticipated changes in our credit ratings will generally affect the market value of our debt securities. Our credit ratings, however, may not reflect the potential impact of risks related to market conditions generally or other factors discussed above on the market value of or trading market for the publicly issued debt securities.
Holders of any preferred stock we might issue would have the right to elect members of the board of directors and class voting rights on certain matters.
Holders of any preferred stock we might issue, voting separately as a single class, would have the right to elect two members of the board of directors at all times and in the event dividends become two full years in arrears would have the right to elect a majority of the directors until such arrearage is completely eliminated. In addition, preferred stockholders have class voting rights on certain matters, including changes in fundamental investment restrictions and conversion to open-end status, and accordingly can veto any such changes. Restrictions imposed on the declarations and payment of dividends or other distributions to the holders of our common stock and preferred stock, both by the Investment Company Act and by requirements imposed by rating agencies or the terms of our credit facilities, might impair our ability to maintain our qualification as a RIC for federal income tax purposes. While we would intend to redeem our preferred stock to the extent necessary to enable us to distribute our income as required to maintain our qualification as a RIC, there can be no assurance that such actions could be effected in time to meet the tax requirements.
61
There is a risk that investors in our equity securities may not receive distributions or that our distributions may not grow over time and that investors in our debt securities may not receive all of the interest income to which they are entitled.
We intend to make distributions on a quarterly basis to our stockholders out of assets legally available for distribution. We cannot assure you that we will achieve investment results that will allow us to make a specified level of cash distributions or year-to-year increases in cash distributions. In addition, due to the asset coverage test applicable to us as a BDC, we may in the future be limited in our ability to make distributions. Also, the Revolving Credit Facility may limit our ability to declare dividends if we default under certain provisions or fail to satisfy certain other conditions. If we do not distribute a certain percentage of our income annually, we will suffer adverse tax consequences, including possible loss of the tax benefits available to us as a RIC. In addition, in accordance with U.S. generally accepted accounting principles and tax regulations, we include in income certain amounts that we have not yet received in cash, such as contractual PIK interest, which represents contractual interest added to the loan balance that becomes due at the end of the loan term, or the accrual of original issue or market discount. Since we may recognize income before or without receiving cash representing such income, we may have difficulty meeting the requirement to distribute at least 90% of our investment company taxable income to obtain tax benefits as a RIC.
We will be subject to a 4% nondeductible federal excise tax on certain undistributed income of RICs unless we distribute in a timely manner an amount at least equal to the sum of (1) 98% of our ordinary income (taking into account certain deferrals and elections) for each calendar year, (2) 98.2% of our capital gain net income for the one-year period ending October 31 in that calendar year and (3) any income recognized, but not distributed, in preceding years. We will not be subject to excise taxes on amounts on which we are required to pay corporate income taxes (such as retained net capital gains).
Finally, if more stockholders opt to receive cash distributions rather than participate in our dividend reinvestment plan, we may be forced to liquidate some of our investments and raise cash in order to make cash distribution payments.
If you do not fully exercise your subscription rights in any rights offering of our common stock, your interest in us may be diluted and, if the subscription price is less than our NAV per share, you may experience an immediate dilution of the aggregate NAV of your shares.
In the event we issue subscription rights to acquire shares of our common stock, stockholders who do not fully exercise their subscription rights should expect that they will, at the completion of the rights offering, own a smaller proportional interest in us than would be the case if they fully exercised their rights.
In addition, if the subscription price is less than the NAV per share of our common stock, a stockholder who does not fully exercise its subscription rights may experience an immediate dilution of the aggregate NAV of its shares as a result of the offering.
We would not be able to state the amount of any such dilution prior to knowing the results of the offering. Such dilution could be substantial.
ITEM 1B. UNRESOLVED STAFF COMMENTS
None.
We maintain our principal executive office at 200 West Street, New York, New York 10282. We do not own any real estate.
From time to time, we may be a party to certain legal proceedings, including proceedings relating to the enforcement of our rights under loans to or other contracts with our portfolio companies. We are not currently subject to any material legal proceedings, nor, to our knowledge, is any material legal proceeding threatened against us.
ITEM 4. MINE SAFETY DISCLOSURES
Not applicable.
62
ITEM 5. MARKET FOR REGISTRANT’S COMMON EQUITY, RELATED STOCKHOLDER MATTERS AND ISSUER PURCHASES OF EQUITY SECURITIES
Price Range of Common Stock
Our common stock is traded on the NYSE under the symbol “GSBD”. Our common stock has historically traded at prices both above and below our NAV per share. It is not possible to predict whether our common stock will trade at, above or below NAV in the future. See “Item 1A. Risk Factors—Risks Relating to Our Securities.”
The following table sets forth, for each fiscal quarter since our IPO, the NAV per share of our common stock, the range of high and low closing sales prices of our common stock reported on the NYSE, the closing sales price as a premium (discount) to NAV and distributions declared by us. On February 27, 2017, the last reported closing sales price of our common stock on the NYSE was $24.57 per share, which represented a premium of approximately 34.2% to the NAV per share reported by us as of December 31, 2016.
| NAV(1) | Closing Sales Price |
Premium or Discount of High Sales Price to NAV (2) |
Premium or Discount of Low Sales Price to NAV (2) |
Declared Distribution(3) |
||||||||||||||||||||
| High | Low | |||||||||||||||||||||||
| Fiscal Year Ending December 31, 2016 |
||||||||||||||||||||||||
| Fourth Fiscal Quarter |
$ | 18.31 | $ | 23.65 | $ | 20.77 | 29.2% | 13.4% | $ | 0.45 | ||||||||||||||
| Third Fiscal Quarter |
$ | 18.58 | $ | 22.26 | $ | 19.98 | 19.8% | 7.5% | $ | 0.45 | ||||||||||||||
| Second Fiscal Quarter |
$ | 18.41 | $ | 20.02 | $ | 19.34 | 8.7% | 5.1% | $ | 0.45 | ||||||||||||||
| First Fiscal Quarter |
$ | 18.67 | $ | 20.00 | $ | 17.41 | 7.1% | (6.7)% | $ | 0.45 | ||||||||||||||
| Fiscal Year Ended December 31, 2015 |
||||||||||||||||||||||||
| Fourth Fiscal Quarter |
$ | 18.97 | $ | 20.37 | $ | 18.40 | 7.4% | (3.0)% | $ | 0.45 | ||||||||||||||
| Third Fiscal Quarter |
$ | 19.38 | $ | 25.19 | $ | 17.91 | 30.0% | (7.6)% | $ | 0.45 | ||||||||||||||
| Second Fiscal Quarter |
$ | 19.46 | $ | 23.65 | $ | 20.33 | 21.5% | 4.5% | $ | 0.45 | ||||||||||||||
| First Fiscal Quarter (from March 18, 2015 through March 31, 2015) |
$ | 19.43 | $ | 21.31 | $ | 20.05 | 9.7% | 3.2% | $ | 0.45 | ||||||||||||||
| (1) | NAV per share is determined as of the last day in the relevant quarter and therefore may not reflect the NAV per share on the date of the high and low closing sales prices. The NAVs shown are based on outstanding shares at the end of the relevant quarter. |
| (2) | Calculated as the respective high or low closing sales price less NAV divided by NAV as of the last day in the relevant quarter. |
| (3) | Represents the dividend or distribution declared in the relevant quarter. |
Holders
As of February 27, 2017, there were approximately 2 holders of record of our common stock (including Cede & Co.).
Sales of Unregistered Securities
On October 3, 2016, we closed an offering of $115.00 million aggregate principal amount of unsecured Convertible Notes. The sale of the Convertible Notes generated net proceeds of approximately $110.90 million. Aggregate estimated offering expenses in connection with the transaction, including the initial purchasers’ discount of approximately $3.45 million, were approximately $4.10 million.
We offered and sold the Convertible Notes to the initial purchasers in reliance on the exemption from registration provided by Section 4(a)(2) of the Securities Act, for resale by the initial purchasers to qualified institutional buyers (as defined in the Securities Act) pursuant to the exemption from registration provided by Rule 144A under the Securities Act. We relied on these exemptions from registration based in part on representations made by the initial purchasers in connection with the sale of the Convertible Notes.
Distributions
We intend to continue to pay quarterly distributions to our stockholders out of assets legally available for distribution. Future quarterly distributions, if any, will be determined by our Board of Directors. All future distributions will be subject to lawfully available funds therefor, and no assurance can be given that we will be able to declare such distributions in future periods.
63
We have elected to be treated, and expect to qualify annually, as a RIC under Subchapter M of the Code, commencing with our taxable year ended December 31, 2013. To maintain our RIC status, we must, among other things, timely distribute to our stockholders at least 90% of our investment company taxable income for each taxable year. We intend to timely distribute to our stockholders substantially all of our annual taxable income for each year, except that we may retain certain net capital gains (i.e., realized net long-term capital gains in excess of realized net short-term capital losses) for reinvestment and, depending upon the level of taxable income earned in a year, we may choose to carry forward taxable income for distribution in the following year and pay any applicable U.S. federal excise tax. We generally will be required to pay such U.S. federal excise tax if our distributions during a calendar year do not exceed the sum of (1) 98.0% of our net ordinary income (taking into account certain deferrals and elections) for the calendar year, (2) 98.2% of our capital gains in excess of capital losses for the one-year period ending on October 31 of the calendar year and (3) any net ordinary income and capital gains in excess of capital losses for preceding years that were not distributed during such years. If we retain net capital gains, we may treat such amounts as deemed distributions to our stockholders. In that case, you will be treated as if you had received an actual distribution of the capital gains we retained and then you reinvested the net after-tax proceeds in our common stock. In general, you also will be eligible to claim a tax credit (or, in certain circumstances, obtain a tax refund) equal to your allocable share of the tax we paid on the capital gains deemed distributed to you. Stockholders should read carefully any written disclosure accompanying a distribution from us and should not assume that the source of any distribution is our net ordinary income or capital gains. The distributions we pay to our stockholders in a year may exceed our net ordinary income and capital gains for that year and, accordingly, a portion of such distributions may constitute a return of capital for U.S. federal income tax purposes. The specific tax characteristics of our distributions will be reported to stockholders after the end of the calendar year. Please refer to “Item 7. Management’s Discussion and Analysis of Financial Condition and Results of Operations—Critical Accounting Policies—Distribution Policy” for further information regarding the tax treatment of our distributions and the tax consequences of our retention of net capital gains. See also “Item 1A. Risk Factors—Risks Relating to Our Portfolio Company Investments—Risks Relating to Our Securities—We may not be able to pay you distributions on our common stock or preferred stock, our distributions to you may not grow over time and a portion of our distributions to you may be a return of capital for U.S. federal income tax purposes.”
Unless our stockholders elect to receive their distributions in cash, we intend to make such distributions in additional shares of our common stock under our dividend reinvestment plan. Distributions paid in the form of additional shares of our common stock will generally be subject to U.S. federal, state and local taxes in the same manner as cash distributions; however, investors participating in our dividend reinvestment plan will not receive any corresponding cash with which to pay any such applicable taxes. If you hold shares of our common stock through a broker or financial intermediary, you may elect to receive distributions in cash by notifying your broker or financial intermediary of your election to receive distributions in cash in lieu of shares of our common stock. Any distributions reinvested through the issuance of shares through our dividend reinvestment plan will increase our assets on which the Management Fee and the Incentive Fee are determined and paid to the Investment Adviser. See “Item 1. Business—Dividend Reinvestment Plan.”
The following tables summarize distributions declared during the years ended December 31, 2016 and 2015:
| Year Ended December 31, 2016 |
||||||||
| Date Declared |
Record Date |
Payment Date |
Distributions per Share |
|||||
| February 25, 2016 |
March 31, 2016 | April 15, 2016 | $ | 0.45 | ||||
| May 3, 2016 |
June 30, 2016 | July 15, 2016 | 0.45 | |||||
| August 2, 2016 |
September 30, 2016 | October 17, 2016 | 0.45 | |||||
| November 1, 2016 |
December 31, 2016 | January 17, 2017 | 0.45 | |||||
|
|
|
|||||||
| Total Distributions Declared |
$ | 1.80 | ||||||
|
|
|
|||||||
| Year Ended December 31, 2015 |
||||||||
| Date Declared |
Record Date |
Payment Date |
Distributions per Share |
|||||
| February 25, 2015 |
March 31, 2015 | April 30, 2015 | $ | 0.45 | ||||
| May 13, 2015 |
June 30, 2015 | July 15, 2015 | 0.45 | |||||
| August 4, 2015 |
September 30, 2015 | October 15, 2015 | 0.45 | |||||
| November 3, 2015 |
December 31, 2015 | January 28, 2016 | 0.45 | |||||
|
|
|
|||||||
| Total Distributions Declared |
$ | 1.80 | ||||||
|
|
|
|||||||
64
The distributions declared during the years ended December 31, 2016 and 2015 were derived from net investment income and capital gains, determined on a tax basis. See “Item 1. Business—Dividend Reinvestment Plan” for a description of our distribution policy and obligations.
Issuer and Affiliate Purchases of Equity Securities
None.
Stock Performance Graph
This graph compares the stockholder return on our common stock from March 18, 2015 (the date our common stock commenced trading on the NYSE) to December 31, 2016 with that of the Standard & Poor’s BDC Index and the Standard & Poor’s 500 Stock Index. This graph assumes that on March 18, 2015, $100 was invested in our common stock, the Standard & Poor’s BDC Index, and the Standard & Poor’s 500 Stock Index. The graph also assumes the reinvestment of all cash dividends prior to any tax effect. The graph and other information furnished under this Part II Item 5 of this annual report on Form 10-K shall not be deemed to be “soliciting material” or to be “filed” with the SEC or subject to Regulation 14A or 14C under, or to the liabilities of Section 18 of, the Exchange Act. The stock price performance included in the below graph is not necessarily indicative of future stock performance.
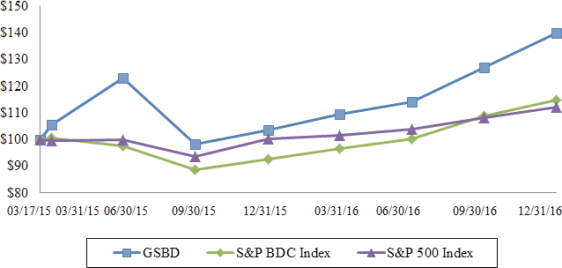
65
ITEM 6. SELECTED FINANCIAL DATA
The table below sets forth our selected consolidated historical financial data for the periods indicated. The selected consolidated financial data as of and for the years ended December 31, 2016, 2015, 2014 and 2013 and as of and for the period from November 15, 2012 (commencement of operations) through December 31, 2012 have been derived from our audited consolidated financial statements, which are included elsewhere in this annual report on Form 10-K.
The selected consolidated financial information and other data presented below should be read in conjunction with the information contained in “Item 7. Management’s Discussion and Analysis of Financial Condition and Results of Operations,” the audited consolidated financial statements and the notes thereto included elsewhere in this annual report on Form 10-K.
| For the Year Ended December 31, 2016 |
For the Year Ended December 31, 2015 |
For the Year Ended December 31, 2014 |
For the Year Ended December 31, 2013 |
For the period from November 15, 2012 (commencement of operations) through December 31, 2012 |
||||||||||||||||
| Consolidated statements of operations data (in thousands): |
| |||||||||||||||||||
| Total investment income |
$ | 125,108 | $ | 118,436 | $ | 73,279 | $ | 22,835 | $ | 162 | ||||||||||
| Net expenses |
47,844 | 43,338 | 20,422 | 6,899 | 346 | |||||||||||||||
|
|
|
|
|
|
|
|
|
|
|
|||||||||||
| Net investment income (loss) before excise tax expense |
77,264 | 75,098 | 52,857 | 15,936 | (184 | ) | ||||||||||||||
| Excise tax expense |
1,037 | 518 | 119 | – | – | |||||||||||||||
|
|
|
|
|
|
|
|
|
|
|
|||||||||||
| Net investment income (loss) after excise tax expense |
76,227 | 74,580 | 52,738 | 15,936 | (184 | ) | ||||||||||||||
| Net realized and unrealized gain (loss) on investments |
(35,575 | ) | (27,952 | ) | (15,816 | ) | 3,118 | 1,046 | ||||||||||||
|
|
|
|
|
|
|
|
|
|
|
|||||||||||
| Net increase in net assets resulting from operations before income tax expense |
$ | 40,652 | $ | 46,628 | $ | 36,922 | $ | 19,054 | $ | 862 | ||||||||||
| Income tax expense |
– | – | – | (1,070 | ) | (351 | ) | |||||||||||||
|
|
|
|
|
|
|
|
|
|
|
|||||||||||
| Net increase in net assets resulting from operations after income tax expense |
$ | 40,652 | $ | 46,628 | $ | 36,922 | $ | 17,984 | $ | 511 | ||||||||||
|
|
|
|
|
|
|
|
|
|
|
|||||||||||
| Per share data |
||||||||||||||||||||
| Net Asset Value |
$ | 18.31 | $ | 18.97 | $ | 19.56 | $ | 20.00 | $ | 19.37 | ||||||||||
| Net investment income (loss) (basic and diluted) |
$ | 2.10 | $ | 2.14 | $ | 1.77 | $ | 0.67 | $ | (0.09 | ) | |||||||||
| Earnings (basic and diluted) |
$ | 1.12 | $ | 1.34 | $ | 1.24 | $ | 0.76 | $ | 0.26 | ||||||||||
| Distributions declared |
$ | 1.80 | $ | 1.80 | $ | 1.69 | $ | 0.50 | $ | – | ||||||||||
| As of December 31, 2016 |
As of December 31, 2015 |
As of December 31, 2014 |
As of December 31, 2013 |
As of December 31, 2012 |
||||||||||||||||
| Consolidated statements of asset and liabilities data (at period end) (in thousands): |
| |||||||||||||||||||
| Total assets |
$ | 1,190,533 | $ | 1,132,759 | $ | 967,492 | $ | 630,222 | $ | 51,769 | ||||||||||
| Total investments, at fair value |
1,167,291 | 1,091,181 | 943,515 | 613,935 | 49,965 | |||||||||||||||
| Total liabilities |
525,396 | 444,109 | 392,910 | 22,437 | 346 | |||||||||||||||
| Total debt, net |
498,152 | 419,000 | 350,000 | – | – | |||||||||||||||
| Total net assets |
665,137 | 688,650 | 574,582 | 607,785 | 51,423 | |||||||||||||||
66
ITEM 7. MANAGEMENT’S DISCUSSION AND ANALYSIS OF FINANCIAL CONDITION AND RESULTS OF OPERATIONS
The discussion and analysis contained in this section refers to our financial condition, results of operations and cash flows. The information contained in this section should be read in conjunction with the consolidated financial statements and notes thereto appearing elsewhere in this report. Please see “Cautionary Statement Regarding Forward-Looking Statements” for a discussion of the uncertainties, risks and assumptions associated with this discussion and analysis. Our actual results could differ materially from those anticipated by such forward-looking information due to factors discussed under “Cautionary Statement Regarding Forward-Looking Statements” appearing elsewhere in this report.
OVERVIEW
We are a specialty finance company focused on lending to middle-market companies. We are a closed-end management investment company that has elected to be regulated as a BDC under the Investment Company Act. In addition, we have elected to be treated as a RIC under Subchapter M of the Code, commencing with our taxable year ended December 31, 2013. From our formation in 2012 through December 31, 2016, we originated more than $1.94 billion in aggregate principal amount of debt and equity investments prior to any subsequent exits and repayments. We seek to generate current income and, to a lesser extent, capital appreciation primarily through direct originations of secured debt, including first lien, unitranche, including last out portions of such loans, and second lien debt, and unsecured debt, including mezzanine debt, as well as through select equity investments.
“Unitranche” loans are first lien loans that may extend deeper in a company’s capital structure than traditional first lien debt and may provide for a waterfall of cash flow priority between different lenders in the unitranche loan. In a number of instances, we may find another lender to provide the “first out” portion of such loan and retain the “last out” portion of such loan, in which case, the “first out” portion of the loan would generally receive priority with respect to payment of principal, interest and any other amounts due thereunder over the “last out” portion that we would continue to hold. In exchange for the greater risk of loss, the “last out” portion earns a higher interest rate. We use the term “mezzanine” to refer to debt that ranks senior only to a borrower’s equity securities and ranks junior in right of payment to all of such borrower’s other indebtedness. We may make multiple investments in the same portfolio company.
We invest primarily in U.S. middle-market companies, which we believe are underserved by traditional providers of capital such as banks and the public debt markets. In this report, we generally use the term “middle market companies” to refer to companies with EBITDA of between $5 million and $75 million annually. However, we may from time to time invest in larger or smaller companies. We generate revenues primarily through receipt of interest income from the investments we hold. In addition, we may generate income from various loan origination and other fees, dividends on direct equity investments and capital gains on the sales of investments. Fees received from portfolio companies (directors’ fees, consulting fees, administrative fees, tax advisory fees and other similar compensation) are paid to us, unless, to the extent required by applicable law or exemptive relief therefrom, we only receive our allocable portion of such fees when invested in the same portfolio company as another account managed by Goldman Sachs. The companies in which we invest use our capital for a variety of purposes, including to support organic growth, fund acquisitions, make capital investments or refinance indebtedness.
Our origination strategy focuses on leading the negotiation and structuring of the loans or securities in which we invest and holding the investments in our portfolio to maturity. In many cases, we are the sole investor in the loan or security in our portfolio. Where there are multiple investors, we generally seek to control or obtain significant influence over the rights of investors in the loan or security. We generally seek to make investments that have maturities between three and ten years and range in size between $10 million and $75 million, although we may make larger or smaller investments on occasion. In addition, part of our strategy involves a joint venture with the Cal Regents through the Senior Credit Fund. The Senior Credit Fund’s principal purpose is to make investments, either directly or indirectly through its wholly owned subsidiary, SPV I, primarily in senior secured loans to middle-market companies.
For a discussion of the competitive landscape we face, please see “Risk Factors—We operate in a highly competitive market for investment opportunities” and “Business—Competitive Advantages.”
67
KEY COMPONENTS OF OPERATIONS
Investments
Our level of investment activity can and does vary substantially from period to period depending on many factors, including the amount of debt and equity capital available to middle-market companies, the level of merger and acquisition activity for such companies, the general economic environment, the amount of capital we have available to us and the competitive environment for the type of investments we make.
As a BDC, we may not acquire any assets other than “qualifying assets” specified in the Investment Company Act, unless, at the time the acquisition is made, at least 70% of our total assets are qualifying assets (with certain limited exceptions). Qualifying assets include investments in “eligible portfolio companies.” Pursuant to rules adopted by the SEC, “eligible portfolio companies” include certain companies that do not have any securities listed on a national securities exchange and public companies whose securities are listed on a national securities exchange but whose market capitalization is less than $250 million.
Revenues
We generate revenue in the form of interest income on debt investments and, to a lesser extent, capital gains and distributions, if any, on equity securities that we may acquire in portfolio companies. Some of our investments may provide for deferred interest payments or PIK interest. The principal amount of the debt investments and any accrued but unpaid interest generally becomes due at the maturity date.
We generate revenues primarily through receipt of interest income from the investments we hold. In addition, we may generate revenue in the form of commitment, origination, structuring or diligence fees, fees for providing managerial assistance and consulting fees. Portfolio company fees (directors’ fees, consulting fees, administrative fees, tax advisory fees and other similar compensation) will be paid to us, unless, to the extent required by applicable law or exemptive relief, if any, therefrom, we receive our allocable portion of such fees when invested in the same portfolio company as other Accounts, which other Accounts could receive their allocable portion of such fee. We do not expect to receive material fees as it is not our principal investment strategy. We record contractual prepayment premiums on loans and debt securities as interest income.
Dividend income on preferred equity investments is recorded on an accrual basis to the extent that such amounts are payable by the portfolio company and are expected to be collected. Dividend income on common equity investments is recorded on the record date for private portfolio companies and on the ex-dividend date for publicly traded portfolio companies. Interest and dividend income are presented net of withholding tax, if any.
Expenses
Our primary operating expenses include the payment of the Management Fee and the Incentive Fee to the Investment Adviser, legal and professional fees, interest and other debt expenses and other operating and overhead related expenses. The Management Fee and Incentive Fee compensate our Investment Adviser for its work in identifying, evaluating, negotiating, closing and monitoring our investments. We bear all other costs and expenses of our operations and transactions in accordance with our Investment Management Agreement and Administration Agreement, including those relating to:
| • | our operational and organizational expenses; |
| • | fees and expenses, including travel expenses, incurred by our Investment Adviser or payable to third parties related to our investments, including, among others, professional fees (including the fees and expenses of consultants and experts) and fees and expenses from evaluating, monitoring, researching and performing due diligence on investments and prospective investments; |
| • | interest payable on debt, if any, incurred to finance our investments; |
| • | fees and expenses incurred by us in connection with membership in investment company organizations; |
| • | brokers’ commissions; |
| • | the expenses of and fees for registering or qualifying our shares for sale and of maintaining our registration and registering us as a broker or a dealer |
| • | fees and expenses associated with calculating our NAV (including the costs and expenses of any independent valuation firm); |
68
| • | legal, auditing or accounting expenses; |
| • | taxes or governmental fees; |
| • | the fees and expenses of our administrator, transfer agent or sub-transfer agent; |
| • | the cost of preparing stock certificates or any other expenses, including clerical expenses of issue, redemption or repurchase of our shares; |
| • | the fees and expenses of our directors who are not affiliated with our Investment Adviser; |
| • | the cost of preparing and distributing reports, proxy statements and notices to our stockholders, the SEC and other regulatory authorities; |
| • | costs of holding stockholder meetings; |
| • | listing fees; |
| • | the fees or disbursements of custodians of our assets, including expenses incurred in the performance of any obligations enumerated by our certificate of incorporation or bylaws insofar as they govern agreements with any such custodian; |
| • | insurance premiums; and |
| • | costs incurred in connection with any claim, litigation, arbitration, mediation, government investigation or dispute in connection with our business and the amount of any judgment or settlement paid in connection therewith, or the enforcement of our rights against any person and indemnification or contribution expenses payable by us to any person and other extraordinary expenses not incurred in the ordinary course of our business. |
We expect our general and administrative expenses to be relatively stable or decline as a percentage of total assets during periods of asset growth and to increase during periods of asset declines. Costs relating to future offerings of securities would be incremental.
Leverage
The Revolving Credit Facility and the Convertible Notes allow us to borrow money and lever our investment portfolio, subject to the limitations of the Investment Company Act, with the objective of increasing our yield. This is known as “leverage” and could increase or decrease returns to our stockholders. The use of leverage involves significant risks. As a BDC, with certain limited exceptions, we are only permitted to borrow amounts such that our asset coverage ratio, as defined in the Investment Company Act, equals at least 2 to 1 after such borrowing. Certain trading practices and investments, such as reverse repurchase agreements, may be considered borrowings or involve leverage and thus may be subject to Investment Company Act restrictions. In accordance with applicable SEC staff guidance and interpretations, when we engage in such transactions, instead of maintaining an asset coverage ratio of at least 2 to 1, we may segregate or earmark liquid assets, or enter into an offsetting position, in an amount at least equal to our exposure, on a mark-to-market basis, to such transactions (as calculated pursuant to requirements of the SEC). Short-term credits necessary for the settlement of securities transactions and arrangements with respect to securities lending will not be considered borrowings for these purposes. Practices and investments that may involve leverage but are not considered borrowings are not subject to the Investment Company Act’s asset coverage requirement and we will not otherwise segregate or earmark liquid assets or enter into offsetting positions for such transactions. The amount of leverage that we employ will depend on our Investment Adviser’s and our Board of Directors’ assessment of market conditions and other factors at the time of any proposed borrowing.
69
PORTFOLIO AND INVESTMENT ACTIVITY
As of December 31, 2016 and December 31, 2015, our portfolio (excluding our investment in a money market fund managed by an affiliate of Group Inc.) of $0.00 million and $10.12 million, respectively) consisted of the following:
| As of | ||||||||||||||||||||||||
| December 31, 2016 | December 31, 2015 | |||||||||||||||||||||||
| Amortized Cost |
Fair Value |
Percentage of Total Portfolio at Fair Value |
Amortized Cost |
Fair Value |
Percentage of Total Portfolio at Fair Value |
|||||||||||||||||||
| ($ in millions) | ($ in millions) | |||||||||||||||||||||||
| First Lien/Senior Secured Debt |
$ | 436.90 | $ | 421.03 | 36.1 | % | $ | 425.53 | $ | 420.10 | 38.9 | % | ||||||||||||
| First Lien/Last-Out Unitranche |
329.45 | 310.25 | 26.6 | 308.10 | 305.72 | 28.3 | ||||||||||||||||||
| Second Lien/Senior Secured Debt |
352.70 | 336.18 | 28.8 | 312.83 | 285.47 | 26.4 | ||||||||||||||||||
| Unsecured Debt |
3.12 | 3.12 | 0.3 | – | – | – | ||||||||||||||||||
| Preferred Stock |
11.12 | 11.83 | 1.0 | 25.62 | 24.87 | 2.3 | ||||||||||||||||||
| Common Stock |
11.63 | 6.49 | 0.5 | 4.45 | – | – | ||||||||||||||||||
| Investment Funds & Vehicles |
77.59 | 78.39 | 6.7 | 46.17 | 44.90 | 4.1 | ||||||||||||||||||
|
|
|
|
|
|
|
|
|
|
|
|
|
|||||||||||||
| Total Investments |
$ | 1,222.51 | $ | 1,167.29 | 100.0 | % | $ | 1,122.70 | $ | 1,081.06 | 100.0 | % | ||||||||||||
|
|
|
|
|
|
|
|
|
|
|
|
|
|||||||||||||
As of December 31, 2016 and December 31, 2015, the weighted average yield on our portfolio (excluding our investment in a money market fund managed by an affiliate of Group Inc.), at cost and fair value, were as follows:
| As of | ||||||||||||||||
| December 31, 2016 | December 31, 2015 | |||||||||||||||
| Amortized Cost |
Fair Value |
Amortized Cost |
Fair Value |
|||||||||||||
| Weighted Average Yield(1) |
||||||||||||||||
| First Lien/Senior Secured Debt(2) |
10.0 | % | 10.6 | % | 10.6 | % | 11.2 | % | ||||||||
| First Lien/Last-Out Unitranche(2) |
11.3 | % | 14.2 | % | 10.9 | % | 11.2 | % | ||||||||
| Second Lien/Senior Secured Debt(2) |
10.5 | % | 11.0 | % | 11.1 | % | 13.0 | % | ||||||||
| Unsecured Debt(2) |
12.0 | % | 12.0 | % | – | % | – | % | ||||||||
| Preferred Stock(2) |
0.5 | % | 0.5 | % | 9.8 | % | 10.0 | % | ||||||||
| Common Stock(2) |
0.0 | % | 0.0 | % | – | % | – | % | ||||||||
| Investment Funds & Vehicles(3) |
14.5 | % | 14.5 | % | 13.0 | % | 13.0 | % | ||||||||
| Total Portfolio(2) |
10.6 | % | 11.8 | % | 10.9 | % | 11.7 | % | ||||||||
| (1) | The weighted average yield of our portfolio does not represent the total return to our stockholders. |
| (2) | Computed based on the (a) annual stated interest rate or yield earned plus amortization of fees and discounts on the performing debt and other income producing investments, divided by (b) the total investments (including investments on non-accrual and non-income producing investments) at amortized cost or fair value, respectively. |
| (3) | Computed based on the net investment income earned from the Senior Credit Fund for the respective trailing twelve months ended on the measurement date, which may include dividend income and loan origination and structuring fees, divided by our average member’s equity at cost and fair value, adjusted for equity contributions. |
The following table presents certain selected information regarding our investment portfolio (excluding our investment in a money market fund managed by an affiliate of Group Inc.) as of December 31, 2016 and December 31, 2015:
| As of | ||||||||
| December 31, 2016 | December 31, 2015 | |||||||
| Number of portfolio companies(1) |
40 | 39 | ||||||
| Percentage of performing debt bearing a floating rate(2) |
92.8% | 87.0% | ||||||
| Percentage of performing debt bearing a fixed rate(2)(3) |
7.2% | 13.0% | ||||||
| Weighted average leverage (net debt/EBITDA)(4) |
4.8x | 4.3x | ||||||
| Weighted average interest coverage(4) |
2.7x | 3.1x | ||||||
| Median EBITDA(4) |
$ | 25.02 million | $ | 28.02 million | ||||
| (1) | Includes the Senior Credit Fund as a single portfolio company. For details on the portfolio companies held within the Senior Credit Fund, refer to the Senior Credit Fund, LLC Selected Financial Data. |
| (2) | Measured on a fair value basis. Excludes investments, if any, placed on non-accrual. |
| (3) | Includes income producing preferred stock investments. |
70
| (4) | For a particular portfolio company, EBITDA typically represents net income before net interest expense, income tax expense, depreciation and amortization. The weighted average net debt to EBITDA represents the weighted average ratio of our portfolio companies’ debt (net of cash), including all of our investment and the amount of debt senior to us, to our portfolio companies’ EBITDA. Weighted average net debt to EBITDA and median EBITDA have been calculated as a percentage of debt investments and income producing preferred stock investments, including the Company’s exposure to underlying debt investments in the Senior Credit Fund and excluding collateral loans and preferred stock investments where net debt to EBITDA may not be the appropriate measure of credit risk. The weighted average interest coverage ratio (EBITDA to total interest expense) of our portfolio companies reflects our performing portfolio companies’ EBITDA as a multiple of interest expense and has been calculated as a percentage of performing debt investments and income producing preferred stock investments, including the Company’s exposure to underlying debt investments in the Senior Credit Fund and excluding collateral loans and preferred stock investments where EBITDA may not be the appropriate measure of credit risk. Portfolio company statistics are derived from the most recently available financial statements of each portfolio company as of the respective reported end date. Portfolio company statistics have not been independently verified by us and may reflect a normalized or adjusted amount. |
Our Investment Adviser monitors our portfolio companies on an ongoing basis. It monitors the financial trends of each portfolio company to determine if they are meeting their respective business plans and to assess the appropriate course of action for each company. Our Investment Adviser has several methods of evaluating and monitoring the performance and fair value of our investments, which may include the following:
| • | assessment of success in adhering to the portfolio company’s business plan and compliance with covenants; |
| • | periodic or regular contact with portfolio company management and, if appropriate, the financial or strategic sponsor to discuss financial position, requirements and accomplishments; |
| • | comparisons to our other portfolio companies in the industry, if any; |
| • | attendance at and participation in board meetings or presentations by portfolio companies; and |
| • | review of monthly and quarterly financial statements and financial projections of portfolio companies. |
As part of the monitoring process, our Investment Adviser also employs an investment rating system to categorize our investments. In addition to various risk management and monitoring tools, our Investment Adviser grades the credit risk of all investments on a scale of 1 to 4. This system is intended primarily to reflect the underlying risk of a portfolio investment relative to our initial cost basis in respect of such portfolio investment (e.g., at the time of origination or acquisition), although it may also take into account the performance of the portfolio company’s business, the collateral coverage of the investment and other relevant factors. The grading system is as follows:
| • | investments with a grade of 1 involve the least amount of risk to our initial cost basis. The trends and risk factors for this investment since origination or acquisition are generally favorable, which may include the performance of the portfolio company or a potential exit; |
| • | investments graded 2 involve a level of risk to our initial cost basis that is similar to the risk to our initial cost basis at the time of origination or acquisition. This portfolio company is generally performing as expected and the risk factors to our ability to ultimately recoup the cost of our investment are neutral to favorable. All investments or acquired investments in new portfolio companies are initially assessed a grade of 2; |
| • | investments graded 3 indicate that the risk to our ability to recoup the initial cost basis of such investment has increased materially since origination or acquisition, including as a result of factors such as declining performance and non-compliance with debt covenants; however, payments are generally not more than 120 days past due; and |
| • | an investment grade of 4 indicates that the risk to our ability to recoup the initial cost basis of such investment has substantially increased since origination or acquisition, and the portfolio company likely has materially declining performance. For debt investments with an investment grade of 4, most or all of the debt covenants are out of compliance and payments are substantially delinquent. For investments graded 4, it is anticipated that we will not recoup our initial cost basis and may realize a substantial loss of our initial cost basis upon exit. |
71
Our Investment Adviser grades the investments in our portfolio at least quarterly and it is possible that the grade of a portfolio investment may be reduced or increased over time. For investments graded 3 or 4, our Investment Adviser enhances its level of scrutiny over the monitoring of such portfolio company. The following table shows the composition of our portfolio (excluding our investment in a money market fund managed by an affiliate of Group Inc.) on the 1 to 4 grading scale as of December 31, 2016 and December 31, 2015:
| As of | ||||||||||||||||
| December 31, 2016 | December 31, 2015 | |||||||||||||||
| Investment Performance Rating |
Fair Value | Percentage of Total Portfolio at Fair Value |
Fair Value | Percentage of Total Portfolio at Fair Value |
||||||||||||
| (in millions) |
(in millions) |
|||||||||||||||
| Grade 1 |
$ | 164.98 | 14.1 | % | $ | 108.80 | 10.1 | % | ||||||||
| Grade 2 |
817.88 | 70.1 | 797.09 | 73.7 | ||||||||||||
| Grade 3 |
167.60 | 14.4 | 175.17 | 16.2 | ||||||||||||
| Grade 4 |
16.83 | 1.4 | – | – | ||||||||||||
|
|
|
|
|
|
|
|
|
|||||||||
| Total Investments |
$ | 1,167.29 | 100.0 | % | $ | 1,081.06 | 100.0 | % | ||||||||
|
|
|
|
|
|
|
|
|
|||||||||
The following table shows the amortized cost of our performing and non-accrual investments as of December 31, 2016 and December 31, 2015:
| As of | ||||||||||||||||
| December 31, 2016 | December 31, 2015 | |||||||||||||||
| Amortized Cost |
Percentage of Total Portfolio at Amortized Cost |
Amortized Cost |
Percentage of Total Portfolio at Amortized Cost |
|||||||||||||
| (in millions) |
(in millions) |
|||||||||||||||
| Performing |
$ | 1,176.24 | 96.2 | % | $ | 1,122.70 | 100.0 | % | ||||||||
| Non-accrual |
46.27 | 3.8 | – | – | ||||||||||||
|
|
|
|
|
|
|
|
|
|||||||||
| Total Investments |
$ | 1,222.51 | 100.0 | % | $ | 1,122.70 | 100.0 | % | ||||||||
|
|
|
|
|
|
|
|
|
|||||||||
Loans or debt securities are placed on non-accrual status when it is probable that principal or interest will not be collected according to the contractual terms. Accrued interest generally is reversed when a loan or debt security is placed on non-accrual status. Interest payments received on non-accrual loans or debt securities may be recognized as income or applied to principal depending upon management’s judgment. Non-accrual loans and debt securities are restored to accrual status when past due principal and interest is paid and, in management’s judgment, are likely to remain current. We may make exceptions to this treatment if the loan has sufficient collateral value and is in the process of collection.
72
The following table shows our investment activity for the years ended December 31, 2016, 2015 and 2014 by investment type:
| For the Years Ended December 31, |
||||||||||||
| 2016 | 2015 | 2014 | ||||||||||
| ($ in millions) | ||||||||||||
| New investment commitments at cost: |
||||||||||||
| Gross originations |
$ | 337.05 | $ | 335.25 | $ | 723.66 | ||||||
| Less: Syndications(1) |
20.00 | – | – | |||||||||
|
|
|
|
|
|
|
|||||||
| Net amount of new investments committed at cost: |
$ | 317.05 | $ | 335.25 | $ | 723.66 | ||||||
| Amount of investments committed at cost(2): |
||||||||||||
| First Lien/Senior Secured Debt |
$ | 107.25 | $ | 206.87 | $ | 284.17 | ||||||
| First Lien/Last-Out Unitranche |
8.65 | 29.69 | 254.07 | |||||||||
| Second Lien/Senior Secured Debt |
157.83 | 67.52 | 155.63 | |||||||||
| Unsecured Debt |
3.10 | – | – | |||||||||
| Preferred Stock |
8.79 | – | 4.79 | |||||||||
| Common Stock |
– | 10.00 | – | |||||||||
| Investment Funds & Vehicles |
31.43 | 21.17 | 25.00 | |||||||||
|
|
|
|
|
|
|
|||||||
| Total |
$ | 317.05 | $ | 335.25 | $ | 723.66 | ||||||
|
|
|
|
|
|
|
|||||||
| Proceeds from investments sold or repaid: |
||||||||||||
| First Lien/Senior Secured Debt |
$ | 49.76 | $ | 22.60 | $ | 192.97 | ||||||
| First Lien/Last-Out Unitranche |
35.12 | 8.60 | 1.66 | |||||||||
| Second Lien/Senior Secured Debt |
92.79 | 89.07 | 66.47 | |||||||||
| Unsecured Debt |
– | – | 2.63 | |||||||||
| Preferred Stock |
21.25 | – | – | |||||||||
| Common Stock |
– | 10.00 | – | |||||||||
| Investment Funds & Vehicles |
– | – | – | |||||||||
|
|
|
|
|
|
|
|||||||
| Total |
$ | 198.92 | $ | 130.27 | $ | 263.73 | ||||||
|
|
|
|
|
|
|
|||||||
| Net increase (decrease) in portfolio |
$ | 118.13 | $ | 204.98 | $ | 459.93 | ||||||
|
|
|
|
|
|
|
|||||||
| Number of new investment commitments in new portfolio companies(3) |
5 | 9 | 22 | |||||||||
| Total new investment commitment amount in new portfolio companies(3) |
$ | 223.89 | $ | 276.50 | $ | 625.61 | ||||||
| Average new investment commitment amount in new portfolio companies(3) |
$ | 44.78 | $ | 30.72 | $ | 28.44 | ||||||
| Weighted average remaining term for new investment commitments in new portfolio companies (in years)(3)(4) |
5.2 | 4.4 | 4.8 | |||||||||
| Number of new investment commitments in existing portfolio companies(3) |
7 | 4 | 10 | |||||||||
| Total new investment commitment amount in existing portfolio companies(3) |
$ | 93.16 | $ | 58.75 | $ | 98.05 | ||||||
| Percentage of new debt investment commitments in new portfolio companies at floating interest rates(3) |
100.0% | 100.0% | 88.9% | |||||||||
| Percentage of new debt investment commitments in new portfolio companies at fixed interest rates(3)(5) |
–% | –% | 11.1% | |||||||||
| Weighted average stated interest rate of new investment commitments in new portfolio companies(3) |
10.8% | 9.2% | 9.2% | |||||||||
| Weighted average spread over base rate of new floating rate investment commitments in new portfolio companies(3) |
9.2% | 8.3% | 8.0% | |||||||||
| Weighted average stated interest rate on investments sold or paid down |
10.0% | 10.4% | 8.7% | |||||||||
| (1) | Only includes syndications that occurred at the initial close of the investment. |
| (2) | Net of capitalized fees, expenses and OIDs. |
| (3) | May include positions originated during the period but not held at the reporting date. |
| (4) | Calculated as of the end of the relevant period and the maturity date of the individual investments. |
| (5) | May include preferred stock investments. |
73
RESULTS OF OPERATIONS
Our operating results for the years ended December 31, 2016, 2015 and 2014 were as follows:
| For the Years Ended December 31, | ||||||||||||
| 2016 | 2015 | 2014 | ||||||||||
| (in millions) | ||||||||||||
| Total investment income |
$ | 125.11 | $ | 118.44 | $ | 73.28 | ||||||
| Net expenses |
(47.85 | ) | (43.34 | ) | (20.42 | ) | ||||||
|
|
|
|
|
|
|
|||||||
| Net investment income (loss) before taxes |
77.26 | 75.10 | 52.86 | |||||||||
| Excise tax expense |
(1.04 | ) | (0.52 | ) | (0.12 | ) | ||||||
|
|
|
|
|
|
|
|||||||
| Net investment income (loss) after taxes |
76.22 | 74.58 | 52.74 | |||||||||
| Net realized gain (loss) on investments |
(21.99 | ) | (0.07 | ) | (1.19 | ) | ||||||
| Net unrealized appreciation (depreciation) on investments |
(13.58 | ) | (27.88 | ) | (14.63 | ) | ||||||
|
|
|
|
|
|
|
|||||||
| Net increase in net assets resulting from operations |
$ | 40.65 | $ | 46.63 | $ | 36.92 | ||||||
|
|
|
|
|
|
|
|||||||
Net increase in net assets resulting from operations after tax can vary from period to period as a result of various factors, including acquisitions, the level of new investment commitments, the recognition of realized gains and losses and changes in unrealized appreciation and depreciation on the investment portfolio. As a result, comparisons may not be meaningful.
Investment Income
| For the Years Ended December 31, | ||||||||||||
| 2016 | 2015 | 2014 | ||||||||||
| (in millions) | ||||||||||||
| Interest |
$ | 112.10 | $ | 109.70 | $ | 69.46 | ||||||
| Dividend income |
8.73 | 6.47 | 3.19 | |||||||||
| Other income |
4.28 | 2.27 | 0.63 | |||||||||
|
|
|
|
|
|
|
|||||||
| Total investment income |
$ | 125.11 | $ | 118.44 | $ | 73.28 | ||||||
|
|
|
|
|
|
|
|||||||
Interest
Interest from investments, which includes prepayment premiums and accelerated accretion of upfront loan origination fees and unamortized discounts, increased from $109.70 million for the year ended December 31, 2015 to $112.10 million for the year ended December 31, 2016, primarily due to an increase in recurring interest income, which resulted primarily from an increase in the size of our portfolio, partially offset by a decrease in non-recurring prepayment premiums. The amortized cost of the portfolio increased from $1,122.70 million as of December 31, 2015 to $1,222.51 million as of December 31, 2016. Included in interest for the years ended December 31, 2016 and 2015 is $0.70 million and $1.38 million, respectively, in prepayment premiums and $1.25 million and $1.23 million, respectively, in accelerated accretion of upfront loan origination fees and unamortized discounts.
Interest from investments, which includes prepayment premiums and accelerated accretion of upfront loan origination fees and unamortized discounts, increased from $69.46 million for the year ended December 31, 2014 to $109.70 million for the year ended December 31, 2015, primarily due to an increase in the size of our portfolio. The amortized cost of the portfolio increased from $927.70 million as of December 31, 2014 to $1,122.70 million as of December 31, 2015. Included in interest for the years ended December 31, 2015 and 2014 is $1.38 million and $0.84 million, respectively, in prepayment premiums and $1.23 million and $1.25 million, respectively, in accelerated accretion of upfront loan origination fees and unamortized discounts.
Dividend income
Dividend income increased from $6.47 million for the year ended December 31, 2015 to $8.73 million for the year ended December 31, 2016 primarily as a result of increased distributions from the Senior Credit Fund during the year ended December 31, 2016. The dividend income from Senior Credit Fund increased from $3.99 million for the year ended December 31, 2015 to $6.58 million for the year ended December 31, 2016.
74
Dividend income increased from $3.19 million for the year ended December 31, 2014 to $6.47 million for the year ended December 31, 2015 primarily as a result of increased distributions from the Senior Credit Fund during the year ended December 31, 2015. The dividend income from Senior Credit Fund increased from $0.31 million for the year ended December 31, 2014 to $3.99 million for the year ended December 31, 2015. See “Senior Credit Fund, LLC” below for further detail.
Other income
Other income increased from $2.27 million for the year ended December 31, 2015 to $4.28 million for the year ended December 31, 2016 primarily as a result of excess loan origination fee income accrued from the Senior Credit Fund.
Other income increased from $0.63 million for the year ended December 31, 2014 to $2.27 million for the year ended December 31, 2015 primarily as a result of excess loan origination fee income accrued from the Senior Credit Fund during the year ended December 31, 2015. In addition, we earned higher commitment and administrative agent fees during the year ended December 31, 2015 as compared to the year ended December 31, 2014.
Expenses
| For the Years Ended December 31, | ||||||||||||
| 2016 | 2015 | 2014 | ||||||||||
| (in millions) | ||||||||||||
| Interest and other debt expense |
$ | 14.30 | $ | 10.71 | $ | 4.68 | ||||||
| Management fees |
17.01 | 15.44 | 10.07 | |||||||||
| Incentive fees |
10.42 | 11.79 | 1.50 | |||||||||
| Professional fees |
2.56 | 2.75 | 2.01 | |||||||||
| Administration, custodian and transfer agent fees |
0.87 | 0.97 | 0.85 | |||||||||
| Directors’ fees |
1.01 | 0.62 | 0.40 | |||||||||
| Other expenses |
1.68 | 1.06 | 0.91 | |||||||||
|
|
|
|
|
|
|
|||||||
| Total Expenses |
$ | 47.85 | $ | 43.34 | $ | 20.42 | ||||||
|
|
|
|
|
|
|
|||||||
Interest and other debt expense
Interest and other debt expense increased from $10.71 million for the year ended December 31, 2015 to $14.30 million for the year ended December 31, 2016 primarily due to an increase in the average aggregate daily borrowings from $358.44 million to $464.44 million. Included in interest and other debt expense for the year ended December 31, 2016 is $1.48 million in interest expense, accretion of original issue discount and amortization of debt issuance costs related to the Convertible Notes that were issued on October 3, 2016.
Interest and other debt expense increased from $4.68 million for the year ended December 31, 2014 to $10.71 million for the year ended December 31, 2015 primarily due to an increase in the average daily borrowings from $102.29 million to $358.44 million.
Management Fees and Incentive Fees
Management Fees increased from $15.44 million for the year ended December 31, 2015 to $17.01 million for the year ended December 31, 2016 as a result of an increase in gross assets, excluding cash and investments in a money market fund managed by an affiliate of Group Inc. Incentive Fees decreased from $11.79 million for the year ended December 31, 2015 to $10.42 million for the year ended December 31, 2016 as a result of a decrease in the cap on Incentive Fees for the period which is primarily due to an increase in net capital loss on portfolio companies.
Management Fees increased from $10.07 million for the year ended December 31, 2014 to $15.44 million for the year ended December 31, 2015 as a result of an increase in gross assets, excluding cash and investments in a money market fund managed by an affiliate of Group Inc. Incentive Fees increased from $1.50 million for the year ended December 31, 2014 to $11.79 million for the year ended December 31, 2015.
Professional fees and other general and administrative expenses
Professional fees for the year ended December 31, 2015 remained relatively consistent as compared to the year ended December 31, 2016; and other general and administrative expenses increased from $2.65 million for the year ended December 31, 2015 to $3.56 million for the year ended December 31, 2016 due to an increase in costs associated with servicing a larger investment portfolio.
75
Professional fees increased from $2.01 million for the year ended December 31, 2014 to $2.75 million for the year ended December 31, 2015; and other general and administrative expenses increased from $2.16 million for the year ended December 31, 2014 to $2.65 million for the year ended December 31, 2015. Both increases are due to the increase in costs associated with servicing a larger investment portfolio.
Net Realized Gains (Losses)
The realized gains and losses on fully exited and partially exited portfolio companies during the years ended December 31, 2016, 2015 and 2014 consisted of the following:
| For the Years Ended December 31, | ||||||||||||
| 2016 | 2015 | 2014 | ||||||||||
| (in millions) |
||||||||||||
| Hunter Defense Technologies, Inc. (1) |
$ | (22.12 | ) | $ | — | $ | — | |||||
| Prairie Provident Resources, Inc. |
— | — | (2.48 | ) | ||||||||
| Other, net |
0.13 | (0.07 | ) | 1.29 | ||||||||
|
|
|
|
|
|
|
|||||||
| Net realized gain (loss) |
$ | (21.99) | $ | (0.07) | $ | (1.19) | ||||||
|
|
|
|
|
|
|
|||||||
| (1) | Effective July 1, 2016, Hunter Defense Technologies, Inc. completed a restructuring whereby the second lien debt held by us was converted into non-interest bearing preferred and common equity. As a result, we realized a loss during the period. |
Net Change in Unrealized Appreciation (Depreciation) on Investments
Any changes in fair value are recorded as a change in unrealized appreciation (depreciation) on investments. For further details on the valuation process, refer to “Critical Accounting Policies—Valuation of Portfolio Investments.” Net change in unrealized appreciation (depreciation) on investments for the years ended December 31, 2016, 2015 and 2014 were as follows:
| For the Years Ended December 31, | ||||||||||||
| 2016 | 2015 | 2014 | ||||||||||
| (in millions) | ||||||||||||
| Change in unrealized appreciation |
$ | 37.71 | $ | 9.63 | $ | 5.06 | ||||||
| Change in unrealized depreciation |
(51.29 | ) | (37.51 | ) | (19.69 | ) | ||||||
|
|
|
|
|
|
|
|||||||
| Net change in unrealized appreciation (depreciation) on investments |
$ | (13.58) | $ | (27.88) | $ | (14.63) | ||||||
|
|
|
|
|
|
|
|||||||
76
The change in unrealized appreciation (depreciation) on investments for the years ended December 31, 2016, 2015 and 2014 consisted of the following:
| For the Years Ended December 31, | ||||||||||||
| 2016 | 2015 | 2014 | ||||||||||
| Portfolio Company: | (in millions) | |||||||||||
| Artesyn Embedded Technologies, Inc. |
(0.38 | ) | (0.30 | ) | (2.10 | ) | ||||||
| ASC Acquisition Holdings, LLC |
0.82 | — | — | |||||||||
| Avenue Stores, LLC |
(0.44 | ) | 0.93 | (0.03 | ) | |||||||
| Bolttech Mannings, Inc. |
(14.43 | ) | (0.95 | ) | (0.50 | ) | ||||||
| CB-HDT Holdings, Inc. |
2.82 | — | — | |||||||||
| Data Driven Delivery Systems, LLC |
(0.29 | ) | 2.30 | — | ||||||||
| Dispensing Dynamics International |
0.54 | (1.28 | ) | (0.82 | ) | |||||||
| Fairpoint Communications, Inc. |
— | — | (1.01 | ) | ||||||||
| Global Tel*Link Corporation |
10.26 | (10.58 | ) | 0.95 | ||||||||
| Heligear Acquisition Co. |
(0.72 | ) | 1.35 | (0.03 | ) | |||||||
| Highwinds Capital, Inc. |
0.43 | (0.14 | ) | 0.81 | ||||||||
| Hunter Defense Technologies, Inc. |
0.55 | (1.17 | ) | 0.63 | ||||||||
| Hutchinson Technology, Inc. |
(1.28 | ) | 0.51 | 0.49 | ||||||||
| Infinity Sales Group |
(1.14 | ) | 1.73 | (2.36 | ) | |||||||
| Iracore International Holdings, Inc. |
(9.30 | ) | 0.41 | (6.02 | ) | |||||||
| Legacy Buyer Corp. |
(0.79 | ) | 0.15 | (0.02 | ) | |||||||
| NTS Communications, Inc. |
0.03 | (1.40 | ) | (0.05 | ) | |||||||
| Orchard Brands Corporation |
— | (0.86 | ) | 0.86 | ||||||||
| P2 Upstream Acquisition Co. |
0.86 | (1.26 | ) | (0.71 | ) | |||||||
| Perfect Commerce, LLC |
0.68 | 0.18 | — | |||||||||
| Prairie Provident Resources, Inc. |
(1.87 | ) | (2.53 | ) | (0.20 | ) | ||||||
| Pro-Pet, LLC |
(0.69 | ) | (1.02 | ) | (0.01 | ) | ||||||
| Reddy Ice Corporation |
2.72 | (1.53 | ) | (2.59 | ) | |||||||
| Securus Technologies Holdings, Inc. |
8.57 | (8.96 | ) | (0.13 | ) | |||||||
| Senior Credit Fund, LLC |
2.07 | (0.90 | ) | (0.37 | ) | |||||||
| Vexos, Inc. |
(1.18 | ) | (0.02 | ) | (0.06 | ) | ||||||
| Washington Inventory Service |
(11.14 | ) | (3.16 | ) | (0.72 | ) | ||||||
| Other, net(1) |
(0.28 | ) | 0.62 | (0.64 | ) | |||||||
|
|
|
|
|
|
|
|||||||
| Total |
$ | (13.58) | $ | (27.88) | $ | (14.63) | ||||||
|
|
|
|
|
|
|
|||||||
| (1) | For the years ended December 31, 2016, 2015 and 2014 other, net includes gross unrealized appreciation of $7.36 million, $2.07 million and $1.32 million, respectively, and gross unrealized depreciation of $(7.64) million, $(1.45) million and $(1.96) million, respectively. |
SENIOR CREDIT FUND, LLC
Overview
The Senior Credit Fund, an unconsolidated Delaware limited liability company, was formed on May 7, 2014 and commenced operations on October 1, 2014. We co-invest with Cal Regents through the Senior Credit Fund. The Senior Credit Fund’s principal purpose is to make investments, either directly or indirectly through its wholly owned subsidiary, SPV I, primarily in senior secured loans to middle-market companies. Each of us and Cal Regents has a 50% economic ownership in the Senior Credit Fund and each has subscribed to fund $100.00 million. Except under certain circumstances, contributions to the Senior Credit Fund cannot be redeemed. The Senior Credit Fund is managed by a six member board of managers, on which we and Cal Regents have equal representation. Investment decisions generally must be unanimously approved by a quorum of the board of managers. Establishing a quorum for the Senior Credit Fund’s board of managers requires at least four members to be present at a meeting, including at least two of our representatives and two of Cal Regents’ representatives. If there are five members present at a meeting, all three representatives of Cal Regents must be present to constitute a quorum.
77
Selected Financial Data
As of December 31, 2016 and December 31, 2015, we and Cal Regents had subscribed to fund and contributed the following in the Senior Credit Fund:
| December 31, 2016 | December 31, 2015 | |||||||||||||||
| Subscribed to fund |
Contributed | Subscribed to fund |
Contributed | |||||||||||||
| ($ in millions) | ($ in millions) | |||||||||||||||
| Company |
$ | 100.00 | $ | 77.59 | $ | 100.00 | $ | 46.17 | ||||||||
| Cal Regents |
100.00 | 77.59 | 100.00 | 46.17 | ||||||||||||
|
|
|
|
|
|
|
|
|
|||||||||
| Total |
$ | 200.00 | $ | 155.18 | $ | 200.00 | $ | 92.34 | ||||||||
|
|
|
|
|
|
|
|
|
|||||||||
As of December 31, 2016 and December 31, 2015, the Senior Credit Fund had total investments in senior secured debt at fair value of $479.53 million and $285.59 million, respectively. As of December 31, 2016 and 2015, the Senior Credit Fund had no investments on non-accrual status. As of December 31, 2016 and December 31, 2015, the Senior Credit Fund had an investment in a money market fund managed by an affiliate of Group Inc. with a total fair value of $1.94 million and $21.83 million, respectively. In addition, as of December 31, 2016, the Senior Credit Fund had three unfunded commitments totaling $6.30 million and no unfunded commitments as of December 31, 2015.
Below is a summary of the Senior Credit Fund’s portfolio (excluding an investment in a money market fund managed by an affiliate of Group Inc.) followed by a listing of the individual loans in the Senior Credit Fund’s portfolio as of December 31, 2016 and December 31, 2015:
| As of | ||||||||
| December 31, 2016 |
December 31, 2015 |
|||||||
| Number of portfolio companies |
37 | 22 | ||||||
| Total senior secured debt(1) |
$ | 489.66 million | $ | 291.51 million | ||||
| Largest loan to a single borrower(1) |
$ | 24.62 million | $ | 23.82 million | ||||
| Weighted average current interest rate on senior secured debt(2) |
6.6% | 6.3% | ||||||
| Percentage of performing debt bearing a floating rate(3) |
100.0% | 100.0% | ||||||
| Percentage of performing debt bearing a fixed rate(3) |
–% | –% | ||||||
| Weighted average leverage (net debt/EBITDA)(4) |
3.8x | 3.5x | ||||||
| Weighted average interest coverage(4) |
3.2x | 3.7x | ||||||
| Median EBITDA(4) |
$ | 68.70 million | $ | 71.89 million | ||||
| (1) | At par amount. |
| (2) | Computed as the (a) annual stated interest rate on accruing senior secured debt divided by (b) total senior secured debt at par amount. |
| (3) | Measured on a fair value basis. |
| (4) | For a particular portfolio company of the Senior Credit Fund, EBITDA typically represents net income before net interest expense, income tax expense, depreciation and amortization. The weighted average net debt to EBITDA represents the weighted average ratio of the Senior Credit Fund’s portfolio companies’ debt (net of cash), including all of its investment and the amount of debt senior to it, to its portfolio companies as a multiple of EBITDA. Weighted average net debt to EBITDA and median EBITDA have been calculated as a percentage of the Senior Credit Fund’s debt investments and income producing preferred stock investments, excluding collateral loans and preferred stock investments where net debt to EBITDA may not be the appropriate measure of credit risk. The weighted average interest coverage ratio (EBITDA to total interest expense) of the Senior Credit Fund’s portfolio companies reflects its performing portfolio companies’ EBITDA as a multiple of interest expense and has been calculated as a percentage of performing debt investments and income producing preferred stock investments, excluding collateral loans and preferred stock investments where EBITDA may not be the appropriate measure of credit risk. Portfolio company statistics are derived from the most recently available financial statements of each portfolio company of the Senior Credit Fund as of the respective reported end date. Statistics of the Senior Credit Fund’s portfolio companies have not been independently verified by us and may reflect a normalized or adjusted amount. |
78
Senior Credit Fund Portfolio as of December 31, 2016
| Portfolio Company | Industry | Interest | Maturity | Par |
Cost |
Fair Value |
||||||||||||
| 1st Lien/Senior Secured Debt | (in millions) | |||||||||||||||||
| Affordable Care Holding Corp.(+++) | Health Care Providers & Services | L + 4.75% (1.00% Floor) | 10/22/2022 | $ | 4.95 | $ | 4.86 | $ | 4.95 | |||||||||
| Ansira Partners, Inc.(1) | Media | L + 6.50% (1.00% Floor) | 12/20/2022 | 8.73 | 8.64 | 8.64 | ||||||||||||
| Ansira Partners, Inc.(1)(2) | Media | L + 6.50% (1.00% Floor) | 12/20/2022 | 1.27 | – | – | ||||||||||||
| ASC Acquisition Holdings, LLC(+++)(3) | Distributors |
L + 7.50% (1.00% Floor) | 12/15/2021 | 11.25 | 11.14 | 11.14 | ||||||||||||
| ASC Acquisition Holdings, LLC(+++)(2)(3) | Distributors |
L + 7.50% (1.00% Floor) | 12/15/2021 | 3.75 | – | – | ||||||||||||
| ATX Networks Corp.(+++) | Communications Equipment | L + 6.00% (1.00% Floor) | 06/11/2021 | 16.77 | 16.60 | 16.35 | ||||||||||||
| Badger Sportswear, Inc.(+++) | Textiles, Apparel & Luxury Goods | L + 4.50% (1.00% Floor) | 09/11/2023 | 14.96 | 14.86 | 14.85 | ||||||||||||
| ConvergeOne Holdings Corporation(+++)(4) | Communications Equipment | L + 5.38% (1.00% Floor) | 06/17/2020 | 17.40 | 17.26 | 17.31 | ||||||||||||
| Crowne Group, LLC(+++) | Auto Components | L + 9.25% (1.00% Floor) | 05/26/2021 | 16.87 | 16.72 | 17.04 | ||||||||||||
| DBRS Limited(+++) | Capital Markets | L + 5.25% (1.00% Floor) | 03/04/2022 | 11.79 | 11.70 | 10.73 | ||||||||||||
| DiscoverOrg, LLC(+)(3) | Software | L + 4.25% (1.00% Floor) | 06/02/2020 | 7.15 | 7.12 | 7.08 | ||||||||||||
| Edgewood Partners Insurance Center(+) | Insurance | L + 6.00% (1.00% Floor) | 03/16/2023 | 15.88 | 15.59 | 15.92 | ||||||||||||
| Explorer Holdings, Inc.(+++) | Health Care Technology | L + 5.00% (1.00% Floor) | 05/02/2023 | 9.95 | 9.85 | 10.02 | ||||||||||||
| GK Holdings, Inc.(+++) | IT Services | L + 5.50% (1.00% Floor) | 01/20/2021 | 17.64 | 17.56 | 17.46 | ||||||||||||
| HC Group Holdings III, Inc.(+++) | Health Care Providers & Services | L + 5.00% (1.00% Floor) | 04/07/2022 | 8.89 | 8.85 | 8.51 | ||||||||||||
| Help/Systems, LLC(+++) | Software | L + 5.25% (1.00% Floor) | 10/08/2021 | 17.95 | 17.41 | 17.91 | ||||||||||||
| Imagine! Print Solutions, Inc.(+++) | Commercial Services & Supplies | L + 6.00% (1.00% Floor) | 03/30/2022 | 4.96 | 4.91 | 5.04 | ||||||||||||
| Jill Acquisition LLC(+++) | Textiles, Apparel & Luxury Goods | L + 5.00% (1.00% Floor) | 05/08/2022 | 15.81 | 15.70 | 15.75 | ||||||||||||
| Lattice Semiconductor Corporation(+++) | Semiconductors & Semiconductor Equipment | L + 4.25% (1.00% Floor) | 03/10/2021 | 11.99 | 11.80 | 11.96 | ||||||||||||
| Liquidnet Holdings, Inc.(+)(4) | Capital Markets | L + 6.75% (1.00% Floor) | 05/22/2019 | 24.62 | 24.34 | 24.43 | ||||||||||||
| Loar Group, Inc.(++) | Aerospace & Defense | L + 4.75% (1.00% Floor) | 01/12/2022 | 9.93 | 9.68 | 9.88 | ||||||||||||
| MB Aerospace Holdings Inc.(+++) | Aerospace & Defense | L + 5.50% (1.00% Floor) | 12/15/2022 | 15.85 | 15.71 | 15.77 | ||||||||||||
| Mister Car Wash, Inc.(1) | Automobiles | L + 4.25% (1.00% Floor) | 08/20/2021 | 6.65 | 6.60 | 6.66 | ||||||||||||
| Mister Car Wash, Inc.(1)(2) | Automobiles | L + 4.25% (1.00% Floor) | 08/20/2021 | 1.33 | – | 0.01 | ||||||||||||
| Netsmart Technologies, Inc.(+++) | Health Care Technology | L + 4.50% (1.00% Floor) | 04/19/2023 | 18.94 | 18.88 | 19.00 | ||||||||||||
| Oasis Outsourcing Holdings, Inc.(+) | Diversified Financial Services | L + 4.75% (1.00% Floor) | 12/27/2021 | 3.98 | 3.97 | 3.99 | ||||||||||||
| PGX Holdings, Inc.(+++)(4) | Professional Services | L + 5.25% (1.00% Floor) | 09/29/2020 | 13.58 | 13.51 | 13.55 | ||||||||||||
| Playcore Wisconsin, Inc.(+++) | Leisure Equipment & Products | L + 4.25% (1.00% Floor) | 05/29/2020 | 18.00 | 17.82 | 17.82 | ||||||||||||
| Pomeroy Group LLC(++++) | IT Services | L + 6.00% (1.00% Floor) | 11/30/2021 | 15.92 | 15.47 | 15.76 | ||||||||||||
| Precyse Acquisition Corp.(+) | Health Care Technology | L + 5.50% (1.00% Floor) | 10/20/2022 | 7.47 | 7.37 | 7.55 | ||||||||||||
| Professional Physical Therapy(+++) | Health Care Providers & Services | L + 6.00% (1.00% Floor) | 12/16/2022 | 10.50 | 10.40 | 10.40 | ||||||||||||
| RealD, Inc.(++) | Media | L + 7.50% (1.00% Floor) | 03/22/2021 | 16.87 | 16.72 | 16.70 | ||||||||||||
| Research Now Group, Inc.(+++) | Professional Services | L + 4.50% (1.00% Floor) | 03/18/2021 | 9.59 | 9.48 | 9.45 | ||||||||||||
| SciQuest, Inc.(++++) | Internet Software & Services | L + 4.75% (1.00% Floor) | 07/28/2023 | 13.93 | 13.86 | 13.86 | ||||||||||||
| Smarte Carte, Inc.(+++) | Air Freight & Logistics | L + 5.50% (1.00% Floor) | 08/30/2021 | 11.21 | 11.11 | 11.10 | ||||||||||||
| Tronair Parent Inc.(+++) | Air Freight & Logistics | L + 4.75% (1.00% Floor) | 09/08/2023 | 13.86 | 13.76 | 13.72 | ||||||||||||
| U.S. Acute Care Solutions, LLC(1) | Health Care Providers & Services | L + 5.00% (1.00% Floor) | 05/14/2021 | 13.00 | 12.87 | 12.87 | ||||||||||||
| Veresen Midstream Limited Partnership(+++) | Energy Equipment & Services | L + 4.25% (1.00% Floor) | 03/31/2022 | 10.81 | 10.61 | 10.87 | ||||||||||||
| Zep Inc.(+++) | Chemicals | L + 4.00% (1.00% Floor) | 06/27/2022 | 11.90 | 11.88 | 11.96 | ||||||||||||
|
|
|
|
|
|||||||||||||||
| Total 1st Lien/Senior Secured Debt |
|
454.61 | 456.01 | |||||||||||||||
| 1st Lien/First-Out Unitranche |
| |||||||||||||||||
| Infogix, Inc.(+++) | Software | L + 4.75% (1.00% Floor) | 12/31/2021 | 9.76 | 9.68 | 9.66 | ||||||||||||
|
|
|
|
|
|||||||||||||||
| Total 1st Lien/First-Out Unitranche |
|
9.68 | 9.66 | |||||||||||||||
| 2nd Lien/Senior Secured Debt |
| |||||||||||||||||
| DiscoverOrg, LLC(+++)(3) | Software | L + 9.00% (1.00% Floor) | 02/10/2022 | 8.00 | 7.86 | 7.86 | ||||||||||||
| GK Holdings, Inc.(+++) | IT Services | L + 9.50% (1.00% Floor) | 01/20/2022 | 6.00 | 5.90 | 6.00 | ||||||||||||
|
|
|
|
|
|||||||||||||||
| Total 2nd Lien/Senior Secured Debt |
|
13.76 | 13.86 | |||||||||||||||
|
|
|
|
|
|||||||||||||||
| Total Corporate Debt |
|
$ | 478.05 | $ | 479.53 | |||||||||||||
|
|
|
|
|
|||||||||||||||
79
| (+) | The interest rate on these loans is subject to the greater of a LIBOR floor or 1 month LIBOR plus a base rate. The 1 month LIBOR as of December 31, 2016 was 0.77%. |
| (++) | The interest rate on these loans is subject to the greater of a LIBOR floor or 2 month LIBOR plus a base rate. The 2 month LIBOR as of December 31, 2016 was 0.82%. |
| (+++) | The interest rate on these loans is subject to the greater of a LIBOR floor or 3 month LIBOR plus a base rate. The 3 month LIBOR as of December 31, 2016 was 1.00%. |
| (++++) | The interest rate on these loans is subject to the greater of a LIBOR floor or 12 month LIBOR plus a base rate. The 12 month LIBOR as of December 31, 2016 was 1.69%. |
| (1) | Position or portion thereof unsettled as of December 31, 2016. |
| (2) | Position or portion thereof is an unfunded loan commitment, and no interest is being earned on the unfunded portion. The unfunded loan commitment may be subject to a commitment termination date, that may expire prior to the maturity date stated. |
| (3) | We also hold a portion of the 2nd lien/senior secured debt in this portfolio company. |
| (4) | Initial investment was purchased at fair value from us in October 2014. |
L – LIBOR
Senior Credit Fund Portfolio as of December 31, 2015
| Portfolio Company | Industry | Interest | Maturity | Par Amount |
Cost | Fair Value |
||||||||||||
| (in millions) | ||||||||||||||||||
| 1st Lien/Senior Secured Debt |
||||||||||||||||||
| Affordable Care Holding Corp.(++) | Health Care Providers & Services | L + 4.75% (1.00% Floor) | 10/22/2022 | $ | 5.00 | $ | 4.90 | $ | 4.90 | |||||||||
| Aperture Group, LLC(++)(1) | Diversified Financial Services | L + 6.25% (1.00% Floor) | 08/29/2019 | 17.86 | 17.66 | 17.62 | ||||||||||||
| ATX Networks Corp.(++) | Communications Equipment | L + 6.00% (1.00% Floor) | 06/12/2021 | 14.93 | 14.78 | 14.63 | ||||||||||||
| Cengage Learning Acquisitions, Inc.(+)(1) | Diversified Consumer Services | L + 6.00% (1.00% Floor) | 03/31/2020 | 15.00 | 14.74 | 14.59 | ||||||||||||
| ConvergeOne Holdings Corporation(++)(2) | Communications Equipment | L + 5.00% (1.00% Floor) | 06/17/2020 | 14.82 | 14.75 | 14.63 | ||||||||||||
| Crowne Group, LLC(++)(2) | Auto Components | L + 5.00% (1.00% Floor) | 09/30/2020 | 14.81 | 14.69 | 14.29 | ||||||||||||
| DBRS Limited(++) | Capital Markets | L + 5.25% (1.00% Floor) | 03/04/2022 | 11.91 | 11.80 | 11.82 | ||||||||||||
| DiscoverOrg, LLC(+) | Software | L + 4.50% (1.00% Floor) | 06/02/2020 | 7.56 | 7.53 | 7.52 | ||||||||||||
| Epicor RSG US Inc.(++) | Internet Software & Services | L + 5.25% (0.75% Floor) | 06/23/2022 | 14.93 | 14.78 | 14.78 | ||||||||||||
| eResearchTechnology, Inc.(++) | Health Care Technology | L + 4.50% (1.00% Floor) | 05/08/2022 | 14.93 | 14.86 | 14.60 | ||||||||||||
| GK Holdings, Inc.(++) | IT Services | L + 5.50% (1.00% Floor) | 01/20/2021 | 17.82 | 17.72 | 17.46 | ||||||||||||
| HC Group Holdings III, Inc.(++) | Healthcare Providers & Services | L + 5.00% (1.00% Floor) | 04/07/2022 | 8.98 | 8.94 | 8.91 | ||||||||||||
| Help/Systems, LLC(++) | Software | L + 5.25% (1.00% Floor) | 10/08/2021 | 15.00 | 14.41 | 14.68 | ||||||||||||
| Jill Acquisition LLC(++) | Textiles, Apparel & Luxury Goods | L + 5.00% (1.00% Floor) | 05/08/2022 | 14.96 | 14.89 | 14.59 | ||||||||||||
| Lattice Semiconductor Corporation(+++) | Semiconductors & Semiconductor Equipment | L + 4.25% (1.00% Floor) | 03/10/2021 | 12.16 | 11.94 | 11.32 | ||||||||||||
| Liquidnet Holdings, Inc.(++)(2) | Capital Markets | L + 6.75% (1.00% Floor) | 05/22/2019 | 22.48 | 22.13 | 21.69 | ||||||||||||
| MB Aerospace Holdings Inc.(1) | Aerospace & Defense | L + 5.50% (1.00% Floor) | 12/15/2022 | 12.50 | 12.38 | 12.38 | ||||||||||||
| PGX Holdings, Inc.(+++)(2) | Professional Services | L + 4.75% (1.00% Floor) | 09/29/2020 | 14.26 | 14.16 | 14.11 | ||||||||||||
| Research Now Group, Inc.(++) | Professional Services | L + 4.50% (1.00% Floor) | 03/18/2021 | 4.96 | 4.94 | 4.89 | ||||||||||||
| SkinnyPop Popcorn LLC(++)(2) | Food Products | L + 4.50% (1.00% Floor) | 07/17/2019 | 14.25 | 14.15 | 14.22 | ||||||||||||
| Veresen Midstream Limited Partnership(++) | Energy Equipment & Services | L + 4.25% (1.00% Floor) | 03/31/2022 | 10.92 | 10.70 | 10.70 | ||||||||||||
| Zep Inc.(++) | Chemicals | L + 4.75% (1.00% Floor) | 06/27/2022 | 5.47 | 5.45 | 5.44 | ||||||||||||
|
|
|
|
|
|||||||||||||||
| Total 1st Lien/Senior Secured Debt |
282.30 | 279.77 | ||||||||||||||||
| 2nd Lien/Senior Secured Debt |
||||||||||||||||||
| GK Holdings, Inc.(++) | IT Services | L + 9.50% (1.00% Floor) | 01/20/2022 | 6.00 | 5.89 | 5.82 | ||||||||||||
|
|
|
|
|
|||||||||||||||
| Total 2nd Lien/Senior Secured Debt |
5.89 | 5.82 | ||||||||||||||||
|
|
|
|
|
|||||||||||||||
| Total Corporate Debt |
$ | 288.19 | $ | 285.59 | ||||||||||||||
|
|
|
|
|
|||||||||||||||
| (+) | The interest rate on these loans is subject to a base rate plus 1 month LIBOR, which as of December 31, 2015 was 0.43%. As the interest rate is subject to a minimum LIBOR floor which was greater than the 1 month LIBOR rate at December 31, 2015, the prevailing rate in effect as of December 31, 2015 was the base rate plus the LIBOR floor. |
| (++) | The interest rate on these loans is subject to a base rate plus 3 month LIBOR, which as of December 31, 2015 was 0.61%. As the interest rate is subject to a minimum LIBOR floor which was greater than the 3 month LIBOR rate at December 31, 2015, the prevailing rate in effect as of December 31, 2015 was the base rate plus the LIBOR floor. |
| (+++) | The interest rate on these loans is subject to a base rate plus 6 month LIBOR, which as of December 31, 2015 was 0.85%. As the interest rate is subject to a minimum LIBOR floor which was greater than the 6 month LIBOR rate at December 31, 2015, the prevailing rate in effect as of December 31, 2015 was the base rate plus the LIBOR floor. |
| (1) | Position or portion thereof unsettled as of December 31, 2015. |
| (2) | Initial investment was purchased at fair value from us in October 2014. |
L – LIBOR
80
Below is certain summarized balance sheet information for the Senior Credit Fund as of December 31, 2016 and December 31, 2015:
| As of | ||||||||
| December 31, 2016 |
December 31, 2015 |
|||||||
| (in millions) | ||||||||
| Selected Balance Sheet Information |
||||||||
| Total investments, at fair value |
$ | 481.47 | $ | 307.42 | ||||
| Cash and other assets |
10.93 | 7.58 | ||||||
|
|
|
|
|
|||||
| Total assets |
$ | 492.40 | $ | 315.00 | ||||
|
|
|
|
|
|||||
| Debt(1) |
$ | 300.57 | $ | 184.98 | ||||
| Other liabilities |
35.04 | 40.22 | ||||||
|
|
|
|
|
|||||
| Total liabilities |
$ | 335.61 | $ | 225.20 | ||||
|
|
|
|
|
|||||
| Members’ equity |
$ | 156.79 | $ | 89.80 | ||||
|
|
|
|
|
|||||
| Total liabilities and members’ equity |
$ | 492.40 | $ | 315.00 | ||||
|
|
|
|
|
|||||
| (1) | Net of deferred financing costs for the SPV I Term Loan Facility (as defined below) as of December 31, 2016 and December 31, 2015, which were in the amount of $2.68 million and $0.57 million, respectively. |
Below is certain summarized Statement of Operations information for the Senior Credit Fund for the years ended December 31, 2016, 2015 and the period ended December 31, 2014:
| Year Ended December 31, 2016 |
Year Ended December 31, 2015 |
For the period October 1, 2014 (commencement of operations) through Year End December 31, 2014 |
||||||||||
| (in millions) | ||||||||||||
| Selected Statement of Operations Information: |
||||||||||||
| Total investment income |
$ | 25.53 | $ | 14.68 | $ | 1.70 | ||||||
| Expenses |
||||||||||||
| Interest and other debt expense |
9.10 | 5.28 | 0.57 | |||||||||
| Excess loan origination and structuring fees |
2.31 | 0.75 | – | |||||||||
| Organization expense |
– | – | 0.23 | |||||||||
| Professional fees |
0.43 | 0.32 | 0.20 | |||||||||
| Administration and custodian fees |
0.35 | 0.30 | 0.07 | |||||||||
| Other expenses |
0.10 | 0.04 | 0.03 | |||||||||
|
|
|
|
|
|
|
|||||||
| Total expenses |
12.29 | 6.69 | 1.10 | |||||||||
|
|
|
|
|
|
|
|||||||
| Net investment income (loss) |
13.24 | 7.99 | 0.60 | |||||||||
| Net realized gain (loss) on investments |
(0.02 | ) | 0.05 | – | ||||||||
| Net change in unrealized appreciation (depreciation) on investments |
4.07 | (1.87 | ) | (0.73 | ) | |||||||
|
|
|
|
|
|
|
|||||||
| Net increase (decrease) in members’ equity |
$ | 17.29 | $ | 6.17 | $ | (0.13 | ) | |||||
|
|
|
|
|
|
|
|||||||
81
Debt
The Senior Credit Fund had entered into a revolving credit facility (the “Subscription Facility”) with Versailles Assets LLC as lender, and with Natixis, New York Branch (“Natixis”) as the facility agent. The Subscription Facility provided for borrowings in an aggregate amount up to $50.00 million on a committed basis. The Senior Credit Fund’s obligations to Natixis and the lenders were secured by the unfunded subscriptions of us and Cal Regents, proceeds of such subscriptions and certain other assets. On September 30, 2016, the Senior Credit Fund paid in full all loans outstanding and the Subscription Facility was terminated. In connection thereof, the related documents governing the Subscription Facility were also terminated. As of December 31, 2016, 2015 and the period ended December 31, 2014, the Senior Credit Fund’s outstanding borrowings under the Subscription Facility were $0, $45.70 million and $50.00 million, respectively. The summary information of the Subscription Facility for the years ended December 31, 2016, 2015 and the period ended December 31, 2014 is as follows:
| Year Ended December 31, 2016 |
Year Ended December 31, 2015 |
Period from October 3, 2014 (commencement of Subscription Facility) through December 31, 2014 |
||||||||||
| (in millions) | ||||||||||||
| Borrowing interest expense |
$ | 0.50 | $ | 1.05 | $ | 0.24 | ||||||
| Facility fees |
0.04 | – | – | |||||||||
| Amortization of financing costs |
0.09 | 0.31 | 0.09 | |||||||||
|
|
|
|
|
|
|
|||||||
| Total |
$ | 0.63 | $ | 1.36 | $ | 0.33 | ||||||
|
|
|
|
|
|
|
|||||||
| Weighted average interest rate |
2.47% | 2.12% | 2.04% | |||||||||
| Average outstanding balance |
$ | 20.12 | $ | 49.73 | $ | 47.78 | ||||||
|
|
|
|
|
|
|
|||||||
SPV I has entered into an amended and restated credit facility (as amended, the “Asset Based Facility”), which, as of December 19, 2016, consisted of a revolving credit facility (the “SPV I Revolving Credit Facility”), a term loan facility (the “SPV I Term Loan Facility”) and a Class B loan facility (the “SPV I Class B Facility”), with various lenders. For the Asset Based Facility, Natixis serves as the facility agent, and State Street Bank and Trust Company serves as the collateral agent. The Asset Based Facility includes a maximum borrowing capacity of $400.00 million. The SPV I Revolving Credit Facility provides for borrowings in an aggregate amount up to $97.50 million on a committed basis as of December 31, 2016, and was subsequently increased to $120.00 million in January 2017. As of December 31, 2016, the SPV I Term Loan Facility consisted of a $240.00 million fully drawn term loan and the SPV I Class B Facility consisted of a $40.00 million fully drawn Class B loan.
As of December 31, 2016, 2015 and 2014, the SPV I’s outstanding borrowings under the Asset Based Facility were $303.25 million, $139.85 million and $17.00 million, respectively. The summary information of the Asset Based Facility for the years ended December 31, 2016, 2015 and the period ended December 31, 2014 is as follows:
| Year Ended December 31, 2016 |
Year Ended December 31, 2015 |
Period from November 19, 2014 (commencement of Asset Based Facility) through December 31, 2014 |
||||||||||
| (in millions) | ||||||||||||
| Borrowing interest expense |
$ | 7.04 | $ | 2.59 | $ | 0.03 | ||||||
| Facility fees |
0.73 | 0.92 | 0.17 | |||||||||
| Amortization of financing costs |
0.69 | 0.41 | 0.04 | |||||||||
|
|
|
|
|
|
|
|||||||
| Total |
$ | 8.46 | $ | 3.92 | $ | 0.24 | ||||||
|
|
|
|
|
|
|
|||||||
| Weighted average interest rate |
3.24% | 2.76% | 2.18% | |||||||||
| Average outstanding balance |
$ | 217.19 | $ | 93.71 | $ | 11.86 | ||||||
|
|
|
|
|
|
|
|||||||
FINANCIAL CONDITION, LIQUIDITY AND CAPITAL RESOURCES
The primary use of existing funds and any funds raised in the future is expected to be for our investments in portfolio companies, cash distributions to our stockholders or for other general corporate purposes, including paying for operating expenses or debt service to the extent we borrow or issue senior securities.
82
We expect to generate cash primarily from the net proceeds of any future offerings of securities, future borrowings and cash flows from operations. To the extent we determine that additional capital would allow us to take advantage of additional investment opportunities, if the market for debt financing presents attractively priced debt financing opportunities, or if our Board of Directors otherwise determines that leveraging our portfolio would be in our best interest and the best interests of our stockholders, we may enter into credit facilities in addition to our Revolving Credit Facility as discussed below, or issue other senior securities. We would expect any such credit facilities may be secured by certain of our assets and may contain advance rates based upon pledged collateral. The pricing and other terms of any such facilities would depend upon market conditions when we enter into any such facilities as well as the performance of our business, among other factors. In accordance with applicable SEC staff guidance and interpretations, as a BDC, with certain limited exceptions, we are only permitted to borrow amounts such that our asset coverage ratio, as defined in the Investment Company Act, is at least 2 to 1 after such borrowing. As of December 31, 2016 and December 31, 2015, our asset coverage ratio was 2.32 to 1 and 2.64 to 1, respectively. We may also refinance or repay any of our indebtedness at any time based on our financial condition and market conditions.
As of December 31, 2016, we had cash of approximately $4.57 million, a decrease of $18.14 million from December 31, 2015. Cash used by operating activities for the year ended December 31, 2016 was approximately $31.35 million, primarily driven by purchases of investments of $310.17 million, partially offset by an increase in net assets resulting from operations of $40.65 million, proceeds from sales and principal repayments of $195.36 million, net purchase of investments in the affiliated money market fund of $10.12 million and proceeds from other operating activities of $32.69 million. Cash provided by financing activities for the year ended December 31, 2016 was approximately $13.21 million, primarily driven by proceeds from the borrowings on debt of $387.00 million, partially offset by repayments on debt of $303.25 million, distributions paid of $64.87 million, and other financing activities of $5.67 million.
As of December 31, 2015, we had cash of approximately $22.71 million, an increase of $14.10 million from December 31, 2014. In addition, as of December 31, 2015, we had an investment in a money market fund managed by an affiliate of Group Inc. of $10.12 million, a decrease of $19.45 million from December 31, 2014. Cash used by operating activities for the year ended December 31, 2015 was approximately $121.41 million, primarily driven by purchases of investments of $320.74 million, partially offset by an increase in net assets resulting from operations of $46.63 million, proceeds from sales and principal repayments of $131.09 million, proceeds from the net sale of investments in the affiliated money market fund of $19.45 million and other operating activities of $2.16 million. Cash provided by financing activities was approximately $135.51 million, which was the result of proceeds from the issuance of common stock (net of underwriting costs) of $135.11 million and borrowings on debt of $288.00 million, partially offset by repayments on debt of $219.00 million, distributions paid of $63.57 million, and other financing activities of $5.03 million.
We may raise capital by securitizing certain of our investments, including through the formation of one or more CLOs or asset based facilities, while retaining all or most of the exposure to the performance of these investments. This would involve contributing a pool of assets to a special purpose entity, and selling debt interests in such entity on a non-recourse or limited-recourse basis to purchasers. We may also pursue other forms of debt financing, including potentially from the Small Business Administration through a future small business investment company subsidiary.
Equity Issuances
On March 23, 2015, we completed our IPO, issuing 6,000,000 shares of common stock at a public offering price of $20.00 per share. Net of offering and underwriting costs, we received cash proceeds of $114.57 million. In connection with the IPO, our Investment Adviser paid 70%, or approximately $5.04 million, of the sales load.
In April 2015, we issued a total of 900,000 shares of our common stock pursuant to the exercise of the underwriters’ over-allotment option in connection with the IPO. Net of underwriting costs, we received additional total cash proceeds of $17.27 million. In addition, our Investment Adviser paid 70%, or approximately $0.76 million, of the sales load.
There were no sales of our common stock during the year ended December 31, 2016 and December 31, 2014.
83
10b5-1 Plan
Goldman, Sachs & Co. adopted a 10b5-1 plan (the “GS 10b5-1 Plan”) in accordance with Rules 10b5-1 and 10b-18 under the Exchange Act, which provided for the purchase by Goldman, Sachs & Co. in the open market of up to the lesser of (i) $25.00 million in the aggregate of our common stock and (ii) such amount that would not bring its collective ownership (with Group Inc.) of our common stock over 19.9%. The GS 10b5-1 Plan expired on March 18, 2016. The GS 10b5-1 Plan required Goldman, Sachs & Co. to purchase shares of our common stock when the market price per share was below our most recently reported NAV per share (including any updates, corrections or adjustments publicly announced by us to any previously announced NAV per share). The purchase of shares by Goldman, Sachs & Co. pursuant to the GS 10b5-1 Plan was intended to satisfy the conditions of Rules 10b5-1 and 10b-18 under the Exchange Act, and was otherwise subject to applicable law. Under the GS 10b5-1 Plan, Goldman, Sachs & Co. increased the volume of purchases made anytime the market price per share of our common stock declined below the most recently reported NAV per share, subject to volume restrictions. Purchases of our common stock by Goldman, Sachs & Co. under the GS 10b5-1 Plan may have resulted in the price of our common stock being higher than the price that otherwise might have existed in the open market. For the period January 1, 2016 through March 18, 2016, Goldman, Sachs & Co. purchased 432,638 shares of our common stock pursuant to the GS 10b5-1 Plan.
Common Stock Repurchase Plans
In February 2015, our Board of Directors approved a common stock repurchase plan (the “Company Repurchase Plan”), which authorized our purchase of up to $35.00 million of our common stock in the open market during open trading periods. No repurchases were made pursuant to the Company Repurchase Plan which expired on March 18, 2016.
In February 2016, our Board of Directors authorized us to repurchase up to $25.00 million of our common stock if the stock trades below the most recently announced NAV per share (including any updates, corrections or adjustments publicly announced by us to any previously announced NAV per share), from March 18, 2016 to March 18, 2017, subject to certain limitations. In connection with this authorization, we entered into a 10b5-1 plan (the “Company 10b5-1 Plan”). The Company 10b5-1 Plan provides that purchases will be conducted on the open market on a programmatic basis in accordance with Rules 10b5-1 and 10b-18 under the Exchange Act and will otherwise be subject to applicable law, including Regulation M, which may prohibit purchases under certain circumstances. No purchases will be effected pursuant to the Company 10b5-1 Plan if such purchase would (i) cause the aggregate ownership of our outstanding stock by Group Inc. and Goldman, Sachs & Co. to equal or exceed 25.0% (due to the reduction in outstanding shares of stock as a result of purchase) or (ii) cause our debt/equity ratio to exceed 0.75. The Company 10b5-1 Plan took effect on March 18, 2016 (with any purchases to commence after the opening of NYSE trading on March 21, 2016) and expires on March 18, 2017.
Repurchases of our common stock under the Company 10b5-1 Plan or otherwise may result in the price of our common stock being higher than the price that otherwise might exist in the open market. For the year ended December 31, 2016, we did not repurchase any of our common stock pursuant to the Company 10b5-1 Plan or otherwise.
Dividend Reinvestment Plan
Concurrent with the IPO, we adopted a dividend reinvestment plan that provides for reinvestment of all cash distributions declared by the Board of Directors unless a stockholder elects to “opt out” of the plan. As a result, if the Board of Directors declares a cash distribution, then the stockholders who have not “opted out” of the dividend reinvestment plan will have their cash distributions automatically reinvested in additional shares of common stock, rather than receiving the cash distribution. Due to regulatory considerations, Group Inc. has opted out of the dividend reinvestment plan, and Goldman, Sachs & Co. has opted out of the dividend reinvestment plan in respect of any shares of our common stock acquired through the GS 10b5-1 Plan.
84
The following table summarizes shares distributed pursuant to the dividend reinvestment plan during the year ended December 31, 2016 to stockholders who had not opted out of the dividend reinvestment plan.
| Date Declared |
Record Date |
Payment Date |
Shares | |||||
| November 3, 2015 |
December 31, 2015 | January 28, 2016 | 8,206 | |||||
| February 25, 2016 |
March 31, 2016 | April 15, 2016 | 5,555 | |||||
| May 3, 2016 |
June 30, 2016 | July 15, 2016 | 8,937 | |||||
| August 2, 2016 |
September 30, 2016 | October 17, 2016 | 10,288 | |||||
The following table summarizes shares distributed pursuant to the dividend reinvestment plan during the year ended December 31, 2015 to stockholders who had not opted out of the dividend reinvestment plan.
| Date Declared |
Record Date |
Payment Date |
Shares | |||||
| February 25, 2015 |
March 31, 2015 | April 30, 2015 | 6,982 | |||||
| May 13, 2015 |
June 30, 2015 | July 15, 2015 | 5,336 | |||||
| August 4, 2015 |
September 30, 2015 | October 15, 2015 | 13,437 | |||||
Contractual Obligations
We have entered into certain contracts under which we have future commitments. Payments under the Investment Management Agreement, pursuant to which GSAM has agreed to serve as our Investment Adviser, are equal to (1) a percentage of value of our average gross assets and (2) a two-part Incentive Fee. Under the Administration Agreement, pursuant to which State Street Bank and Trust Company has agreed to furnish us with the administrative services necessary to conduct our day-to-day operations, we pay our administrator such fees as may be agreed between us and our administrator that we determine are commercially reasonable in our sole discretion. Either party or the stockholders, by a vote of a majority of our outstanding voting securities, may terminate the Investment Management Agreement without penalty on least 60 days’ written notice to the other party. Either party may terminate the Administration Agreement without penalty upon at least 30 days’ written notice to the other party.
The following table shows our contractual obligations as of December 31, 2016:
| Payments Due by Period (Millions) | ||||||||||||||||||||
| Total | Less Than 1 Year |
1 – 3 Years | 3 – 5 Years | More Than 5 Years |
||||||||||||||||
| Revolving Credit Facility |
$ | 387.75 | $ | – | $ | – | $ | 387.75 | $ | – | ||||||||||
| Convertible Notes |
$ | 115.00 | $ | – | $ | – | $ | – | $ | 115.00 | ||||||||||
Revolving Credit Facility
On September 19, 2013, we entered into the Revolving Credit Facility with various lenders. SunTrust Bank serves as administrative agent and Bank of America N.A. serves as syndication agent under the Revolving Credit Facility.
On October 3, 2014, we amended and restated the Revolving Credit Facility to, among other things:
| • | increase the aggregate borrowing amount of $340.00 million to $485.00 million on a committed basis; |
| • | increase the total borrowing capacity from a maximum of $500.00 million to $900.00 million; |
| • | extend the maturity date from September 19, 2017 to October 3, 2019; and |
| • | reduce the applicable margin of borrowings with respect to (i) any loan bearing interest at a rate determined by reference to the alternate base rate from 1.50% to 1.25% and (ii) any loan bearing interest at a rate determined by reference to the adjusted LIBOR rate from 2.50% to 2.25%. |
On January 16, 2015, we exercised the right under the accordion feature and increased the size of the Revolving Credit Facility to $535.00 million, on a committed basis.
On March 27, 2015, we exercised the right under the accordion feature and increased the size of the Revolving Credit Facility to $560.00 million, on a committed basis.
On November 3, 2015, we amended the Revolving Credit Facility to, among other things:
| • | increase the aggregate borrowing amount to $570.00 million on a committed basis; |
| • | increase the total borrowing capacity to a maximum of $1,000.00 million; |
| • | extend the final maturity date to November 4, 2020; and |
85
| • | reduce the applicable margin of borrowings with respect to (i) any loan bearing interest at a rate determined by reference to the alternate base rate from 1.25% to 0.75% or 1.00%, subject to borrowing base conditions and (ii) any loan bearing interest at a rate determined by reference to the adjusted LIBOR rate from 2.25% to 1.75% or 2.00%, subject to borrowing base conditions. |
On December 16, 2016, we further amended the Revolving Credit Facility to, among other things:
| • | increase aggregate borrowing amount to $605.00 million on a committed basis; and |
| • | extend the final maturity date to December 16, 2021. |
Borrowings under the Revolving Credit Facility, including amounts drawn in respect of letters of credit, bear interest (at the Company’s election) of either LIBOR plus an applicable margin or applicable margin plus the higher of the Prime Rate, Federal Funds Rate plus 0.5% or overnight LIBOR plus 1.0%. Interest is payable quarterly in arrears. We pay a fee of 0.375% per annum on committed but undrawn amounts under the Revolving Credit Facility, payable quarterly in arrears. Any amounts borrowed under the Revolving Credit Facility will mature, and all accrued and unpaid interest will be due and payable, on December 16, 2021.
The Revolving Credit Facility may be guaranteed by certain of our domestic subsidiaries that are formed or acquired by us in the future (collectively, the “Guarantors”). The Senior Credit Fund is not a Guarantor of the Revolving Credit Facility. Proceeds from borrowings may be used for general corporate purposes, including the funding of portfolio investments.
Our obligations to the lenders under the Revolving Credit Facility are secured by a first priority security interest in substantially the entire portfolio of investments and cash held by us and each Guarantor, if any. The Revolving Credit Facility contains certain customary covenants, including: (i) maintaining a minimum shareholder’s equity of $458.21 million, subject to increase from certain equity sales, (ii) maintaining an asset coverage ratio of at least 2 to 1, (iii) maintaining a minimum liquidity test of at least 10% of the “covered debt amount” during any period when the “adjusted covered debt balance” is greater than 90% of the “adjusted borrowing base,” as such quoted terms are defined in the Revolving Credit Facility and (iv) restrictions on industry concentrations in our investment portfolio. As of December 31, 2016, we were in compliance with these covenants.
The Revolving Credit Facility also includes customary representations and warranties, conditions precedent to funding of draws and events of default.
Convertible Notes
On October 3, 2016, we closed an offering of $115.00 million aggregate principal amount of unsecured Convertible Notes, which includes $15.00 million aggregate principal amount issued pursuant to the initial purchasers’ exercise in full of an over-allotment option. The Convertible Notes bear interest at a rate of 4.50% per year, payable semi-annually in arrears on April 1 and October 1 of each year, commencing on April 1, 2017. The Convertible Notes will mature on April 1, 2022, unless repurchased or converted in accordance with their terms prior to such date. In certain circumstances, the Convertible Notes will be convertible into cash, shares of our common stock or a combination of cash and shares of our common stock, based on an initial conversion rate of 40.8397 shares of our common stock per $1,000 principal amount of Convertible Notes, which is equivalent to an initial conversion price of approximately $24.49 per share of common stock, subject to customary anti-dilution adjustments and the other terms of the indenture governing the Convertible Notes. The conversion price is approximately 10.0% above the $22.26 per share closing price of our common stock on September 27, 2016. We will not have the right to redeem the Convertible Notes prior to maturity. The sale of the Convertible Notes generated net proceeds of approximately $110.90 million. We used the net proceeds of the offering to pay down debt under the Revolving Credit Facility.
86
Holders may convert their notes at their option at any time prior to the close of business on the business day immediately preceding October 1, 2021 only under the following circumstances: (1) during any calendar quarter commencing after December 31, 2016, if the last reported sale price of our common stock for at least 20 trading days (whether or not consecutive) during a period of 30 consecutive trading days ending on the last trading day of the immediately preceding calendar quarter is greater than or equal to 130% of the conversion price on each applicable trading day; (2) during the five business day period after any five consecutive trading day period (the “measurement period”) in which the trading price (as defined below) per $1,000 principal amount of notes for each trading day of the measurement period was less than 98% of the product of the last reported sale price of our common stock and the conversion rate on each such trading day; or (3) upon the occurrence of specified corporate events. On or after October 1, 2021, until the close of business on the scheduled trading day immediately preceding the maturity date, holders may convert their notes at any time, regardless of the occurrence or nonoccurrence of any of the foregoing circumstances.
The Convertible Notes are accounted for in accordance with Accounting Standards Codification (“ASC”) Topic 470-20, “Debt with Conversion and Other Options.” Upon conversion of any of the Convertible Notes, we intend to pay the outstanding principal amount in cash and, to the extent that the conversion value exceeds the principal amount, we have the option to pay the excess amount in cash or shares of our common stock (or a combination of cash and shares), subject to the requirements of the respective indenture. We have determined that the embedded conversion options in the Convertible Notes are not required to be separately accounted for as derivatives under ASC 815, “Derivatives and Hedging.” At the time of issuance the values of the debt and equity components of the Convertible Notes were approximately 99.4% and 0.6%, respectively.
The OID equals to the equity component of the Convertible Notes was recorded in “paid-in capital in excess of par” in the accompanying Consolidated Statements of Assets and Liabilities. We record interest expense comprised of both stated interest and amortization of the OID. At the time of issuance, the equity component of the Convertible Notes was $0.74 million. Additionally, the issuance costs associated with the Convertible Notes were allocated to the debt and equity components in proportion to the allocation of the values at the time of issuance and accounted for as debt issuance costs and equity issuance costs, respectively.
HEDGING
Subject to applicable provisions of the Investment Company Act and applicable CFTC regulations, we may enter into hedging transactions in a manner consistent with SEC guidance. To the extent that any of our loans is denominated in a currency other than U.S. dollars, we may enter into currency hedging contracts to reduce our exposure to fluctuations in currency exchange rates. We may also enter into interest rate hedging agreements. Such hedging activities, which will be subject to compliance with applicable legal requirements, may include the use of futures, options, swaps and forward contracts. Costs incurred in entering into such contracts or in settling them, if any, will be borne by us. The Investment Adviser has claimed no-action relief from CFTC registration and regulation as a commodity pool operator pursuant to a CFTC staff no-action letter (the “BDC CFTC No-Action Letter”) with respect to our operations, with the result that we will be limited in our ability to use futures contracts or options on futures contracts or engage in swap transactions. Specifically, the BDC CFTC No-Action Letter imposes strict limitations on using such derivatives other than for hedging purposes, whereby the use of derivatives not used solely for hedging purposes is generally limited to situations where (i) the aggregate initial margin and premiums required to establish such positions does not exceed five percent of the liquidation value of our portfolio, after taking into account unrealized profits and unrealized losses on any such contracts it has entered into; or (ii) the aggregate net notional value of such derivatives does not exceed 100% of the liquidation value of our portfolio. Moreover, we anticipate entering into transactions involving such derivatives to a very limited extent solely for hedging purposes or otherwise within the limitations of the BDC CFTC No-Action Letter. As of December 31, 2016, no hedging arrangements were used.
87
OFF-BALANCE SHEET ARRANGEMENTS
We may become a party to financial instruments with off-balance sheet risk in the normal course of our business to fund investments and to meet the financial needs of our portfolio companies. These instruments may include commitments to extend credit and involve, to varying degrees, elements of liquidity and credit risk in excess of the amount recognized in the balance sheet. As of December 31, 2016, we reasonably believed that our liquid assets would provide adequate financial resources to satisfy all of our unfunded commitments. As of December 31, 2016 and 2015, our unfunded commitments to provide funds to portfolio companies are as follows:
| As of | ||||||||
| December 31, 2016 |
December 31, 2015 |
|||||||
| (in millions) | ||||||||
| Unfunded Commitments |
||||||||
| First Lien/Senior Secured Debt |
$ | 6.80 | $ | 2.50 | ||||
| First Lien/Last-Out Unitranche |
– | 3.51 | ||||||
|
|
|
|
|
|||||
| Total |
$ | 6.80 | $ | 6.01 | ||||
|
|
|
|
|
|||||
RECENT DEVELOPMENTS
In January 2017, we and Cal Regents each contributed $3.90 million to the Senior Credit Fund, a controlled affiliated investment.
On February 22, 2017, our Board of Directors declared a quarterly distribution of $0.45 per share payable on or about April 17, 2017 to holders of record as of March 31, 2017.
In February 2017, our Board of Directors renewed our stock repurchase plan to extend the expiration from March 18, 2017 to March 18, 2018. Under the stock repurchase plan, we may repurchase up to $25.00 million of our common stock if the market price for the common stock is below our most recently announced net asset value per share, subject to certain limitations. The stock repurchase plan authorized us to enter into a plan that provides that purchases will be conducted on the open market on a programmatic basis or to repurchase in privately negotiated transactions in accordance with Rule 10b-18 under the Exchange Act and will otherwise be subject to applicable law, including Regulation M, which may prohibit purchases under certain circumstances.
NEW ACCOUNTING PRONOUNCEMENTS
In April 2015, the Financial Accounting Standards Board (“FASB”) issued Accounting Standards Update (“ASU”) 2015-03, “Simplifying the Presentation of Debt Issuance Costs.” ASU 2015-03 requires that debt issuance costs be presented as a direct deduction from the carrying amount of the related debt liability, consistent with the presentation of debt discounts. Upon adoption, the standard requires prior period financial statements to be retrospectively adjusted. Prior to the issuance of ASU 2015-03, debt issuance costs were required to be presented as deferred assets, separate from the related debt liability. ASU 2015-03 does not change the recognition and measurement requirements for debt issuance costs. ASU 2015-03 is effective for financial statements issued for fiscal years beginning after December 15, 2015, and interim periods within those fiscal years, with early adoption permitted. We have adopted this standard effective January 1, 2016.
CRITICAL ACCOUNTING POLICIES
Our discussion and analysis of our financial condition and results of operations are based upon our consolidated financial statements, which have been prepared in accordance with GAAP. The preparation of these consolidated financial statements requires management to make estimates and assumptions that affect the reported amounts of assets, liabilities, revenues and expenses. Changes in the economic environment, financial markets and any other parameters used in determining such estimates could cause actual results to differ materially. In addition to the discussion below, our critical accounting policies are further described in the notes to the consolidated financial statements.
Valuation of Portfolio Investments
As a BDC, we conduct the valuation of our assets, pursuant to which our NAV is determined, at all times consistent with GAAP and the Investment Company Act. Our Board of Directors, with the assistance of our Audit Committee, determines the fair value of our assets on at least a quarterly basis, in accordance with the terms of ASC 820. Our valuation procedures are described in more detail below.
88
ASC 820 defines fair value as the price that would be received to sell an asset or paid to transfer a liability in an orderly transaction between market participants at the measurement date. Fair value is a market-based measurement, not an entity-specific measurement. For some assets and liabilities, observable market transactions or market information might be available. For other assets and liabilities, observable market transactions and market information might not be available. However, the objective of a fair value measurement in both cases is the same—to estimate the price when an orderly transaction to sell the asset or transfer the liability would take place between market participants at the measurement date under current market conditions (that is, an exit price at the measurement date from the perspective of a market participant that holds the asset or owes the liability).
ASC 820 establishes a hierarchal disclosure framework which ranks the observability of inputs used in measuring financial instruments at fair value. The observability of inputs is impacted by a number of factors, including the type of financial instruments and their specific characteristics. Financial instruments with readily available quoted prices, or for which fair value can be measured from quoted prices in active markets, generally will have a higher degree of market price observability and a lesser degree of judgment applied in determining fair value. The levels used for classifying investments are not necessarily an indication of the risk associated with investing in these securities.
The three-level hierarchy for fair value measurement is defined as follows:
Level 1—inputs to the valuation methodology are quoted prices available in active markets for identical instruments as of the reporting date. The types of financial instruments included in Level 1 include unrestricted securities, including equities and derivatives, listed in active markets.
Level 2—inputs to the valuation methodology are other than quoted prices in active markets, which are either directly or indirectly observable as of the reporting date. The type of financial instruments in this category includes less liquid and restricted securities listed in active markets, securities traded in other than active markets, government and agency securities, and certain over-the-counter derivatives where the fair value is based on observable inputs.
Level 3—inputs to the valuation methodology are unobservable and significant to overall fair value measurement. The inputs into the determination of fair value require significant management judgment or estimation. Financial instruments that are included in this category include investments in privately held entities and certain over-the-counter derivatives where the fair value is based on unobservable inputs.
In certain cases, the inputs used to measure fair value may fall into different levels of the fair value hierarchy. In such cases, the determination of which category within the fair value hierarchy is appropriate for any given financial instrument is based on the lowest level of input that is significant to the fair value measurement. Our assessment of the significance of a particular input to the fair value measurement requires judgment and considers factors specific to the financial instrument.
Currently, the majority of our investments fall within Level 3 of the fair value hierarchy. We do not expect that there will be readily available market values for most of the investments which are in our portfolio, and we value such investments at fair value as determined in good faith by or under the direction of our Board of Directors using a documented valuation policy, described below, and a consistently applied valuation process. The factors that may be taken into account in pricing our investments at fair value include, as relevant, the nature and realizable value of any collateral, the portfolio company’s ability to make payments and its earnings and discounted cash flow, and the markets in which the portfolio company does business, comparison to publicly traded securities and other relevant factors. Available current market data are considered such as applicable market yields and multiples of publicly traded securities, comparison of financial ratios of peer companies, and changes in the interest rate environment and the credit markets that may affect the price at which similar investments would trade in their principal market, and other relevant factors. When an external event such as a purchase transaction, public offering or subsequent equity sale occurs, we consider the pricing indicated by the external event to corroborate or revise our valuation.
With respect to investments for which market quotations are not readily available, or for which market quotations are deemed not reflective of the fair value, the valuation procedures adopted by our Board of Directors contemplates a multi-step valuation process each quarter, as described below:
| (1) | Our quarterly valuation process begins with each portfolio company or investment being initially valued by the investment professionals of our Investment Adviser responsible for the portfolio investment; |
89
| (2) | Our Board of Directors also engages independent valuation firms (the “Independent Valuation Advisors”) to provide independent valuations of the investments for which market quotations are not readily available, or are readily available but deemed not reflective of the fair value of an investment. The Independent Valuation Advisors independently value such investments using quantitative and qualitative information provided by the investment professionals of the Investment Adviser as well as any market quotations obtained from independent pricing services, brokers, dealers or market dealers. The Independent Valuation Advisors also provide analyses to support their valuation methodology and calculations. The Independent Valuation Advisors provide an opinion on a final range of values on such investments to our Board of Directors or the Audit Committee. The Independent Valuation Advisors define fair value in accordance with ASC 820 and utilize valuation techniques including the market approach, the income approach or both. A portion of the portfolio is reviewed on a quarterly basis, and all investments in the portfolio for which market quotations are not readily available, or are readily available, but deemed not reflective of the fair value of an investment, are reviewed at least annually by an Independent Valuation Advisor; |
| (3) | The Independent Valuation Advisors’ preliminary valuations are reviewed by our Investment Adviser and the Valuation Oversight Group (“VOG”), a team that is part of the Controllers Department within the Finance Division of Goldman Sachs. The Independent Valuation Advisors’ ranges are compared to our Investment Adviser’s valuations to ensure our Investment Adviser’s valuations are reasonable. VOG presents the valuations to the Private Investment Sub-Committee of the Investment Management Division Valuation Committee, which is comprised of representatives from GSAM who are independent of the investment making decision process; |
| (4) | The Investment Management Division Valuation Committee ratifies fair valuations and makes recommendations to the Audit Committee of the Board of Directors; |
| (5) | The Audit Committee of our Board of Directors reviews valuation information provided by the Investment Management Division Valuation Committee, our Investment Adviser and the Independent Valuation Advisors. The Audit Committee then assesses such valuation recommendations; and |
| (6) | Our Board of Directors discusses the valuations and, within the meaning of the Investment Company Act, determines the fair value of our investments in good faith, based on the input of our Investment Adviser, the Independent Valuation Advisors and the Audit Committee. |
Investment Transactions and Related Investment Income
We record our investment transactions on a trade date basis. Realized gains and losses are based on the specific identification method. Dividend income on common equity investments are recorded on the record date for private portfolio companies or on the ex-dividend date for publicly traded portfolio companies. Interest income and dividend income are presented net of withholding tax, if any. Accretion of discounts and amortization of premiums, which are included in interest income and expense, are recorded over the life of the underlying instrument using the effective interest method.
Fair value generally is based on quoted market prices, broker or dealer quotations, or alternative price sources. In the absence of quoted market prices, broker or dealer quotations, or alternative price sources, investments in securities are measured at fair value as determined by our Investment Adviser and/or by one or more independent third parties.
Due to the inherent uncertainties of valuation, certain estimated fair values may differ significantly from the values that would have been realized had a ready market for these investments existed, and these differences could be material. For additional information, see Note 2 “Significant Accounting Policies” to our consolidated financial statements included in this report.
90
Non-Accrual Status
Loans or debt securities are placed on non-accrual status when it is probable that principal or interest will not be collected according to the contractual terms. Accrued interest generally is reversed when a loan or debt security is placed on non-accrual status. Interest payments received on non-accrual loans or debt securities may be recognized as income or applied to principal depending upon management’s judgment. Non-accrual loans and debt securities are restored to accrual status when past due principal and interest is paid and, in management’s judgment, are likely to remain current. We may make exceptions to this treatment if the loan has sufficient collateral value and is in the process of collection. As of December 31, 2016, we had two investments on non-accrual status, which represented 3.8% and 1.4% of the total investments (excluding an investment in a money market fund managed by an affiliate of Group Inc. of $0.00 million) at amortized cost and at fair value, respectively. As of December 31, 2015, we had no investments on non-accrual status.
Distribution Policy
We intend to pay quarterly distributions to our stockholders out of assets legally available for distribution. Future quarterly distributions, if any, will be determined by our Board of Directors. All distributions will be subject to lawfully available funds therefor, and no assurance can be given that we will be able to declare distributions in future periods.
We have elected to be treated, and expect to qualify annually, as a RIC under Subchapter M of the Code, commencing with our taxable year ended December 31, 2013. To obtain and maintain RIC status, we must, among other things, timely distribute to our stockholders at least 90% of our investment company taxable income for each taxable year. We intend to timely distribute to our stockholders substantially all of our annual taxable income for each year, except that we may retain certain net capital gains for reinvestment and, depending upon the level of taxable income earned in a year, we may choose to carry forward taxable income for distribution in the following year and pay any applicable U.S. federal excise tax. The distributions we pay to our stockholders in a year may exceed our net ordinary income and capital gains for that year and, accordingly, a portion of such distributions may constitute a return of capital for U.S. federal income tax purposes. The specific tax characteristics of our distributions will be reported to stockholders after the end of the calendar year. Stockholders should read carefully any written disclosure regarding a distribution from us and should not assume that the source of any distribution is our net ordinary income or capital gains.
We have adopted an “opt out” dividend reinvestment plan for our common stockholders. As a result, if our Board of Directors declares a cash distribution, each stockholder that has not “opted out” of our dividend reinvestment plan will have its distribution automatically reinvested in additional shares of our common stock rather than receiving the cash distribution. Stockholders who receive distributions in the form of shares of common stock will generally be subject to the same U.S. federal, state and local tax consequences as if they received cash distributions; however, since their cash distributions will be reinvested, those stockholders will not receive cash with which to pay any applicable taxes. Due to regulatory considerations, Group Inc. has opted out of the dividend reinvestment plan, and Goldman, Sachs & Co. has opted out of the dividend reinvestment plan in respect of any shares of our common stock acquired through the GS 10b5-1 Plan.
Federal Income Taxes
As a RIC, we generally will not pay corporate-level U.S. federal income taxes on any net ordinary income or capital gains that we timely distribute to our stockholders as dividends. To maintain our RIC status, we must meet specified source-of-income and asset diversification requirements and timely distribute to our stockholders at least 90% of our investment company taxable income for each year. Depending upon the level of taxable income earned in a year, we may choose to carry forward taxable income for distribution in the following year and pay any applicable U.S. federal excise tax. We generally will be required to pay such U.S. federal excise tax if our distributions during a calendar year do not exceed the sum of (1) 98% of our net ordinary income (taking into account certain deferrals and elections) for the calendar year, (2) 98.2% of our capital gains in excess of capital losses for the one-year period ending on October 31 of the calendar year and (3) any net ordinary income and capital gains in excess of capital losses for preceding years that were not distributed during such years.
91
Because federal income tax regulations differ from GAAP, distributions in accordance with tax regulations may differ from net investment income and realized gains recognized for financial reporting purposes. Differences may be permanent or temporary. Permanent differences are reclassified among capital accounts in the consolidated financial statements to reflect their tax character. Temporary differences arise when certain items of income, expense, gain or loss are recognized at some time in the future. Differences in classification may also result from the treatment of short-term gains as ordinary income for tax purposes.
ITEM 7A. QUANTITATIVE AND QUALITATIVE DISCLOSURES ABOUT MARKET RISK
We are subject to financial market risks, most significantly changes in interest rates. Interest rate sensitivity refers to the change in our earnings that may result from changes in the level of interest rates. Because we expect to fund a portion of our investments with borrowings, our net investment income is expected to be affected by the difference between the rate at which we invest and the rate at which we borrow. As a result, we can offer no assurance that a significant change in market interest rates will not have a material adverse effect on our net investment income.
As of December 31, 2016 and 2015, on a fair value basis, approximately 7.2% and 13.0% , respectively, of our performing debt investments bore interest at a fixed rate (including income producing preferred stock investments), and approximately 92.8% and 87.0%, respectively, of our performing debt investments bore interest at a floating rate. Our borrowings under the Revolving Credit Facility bear interest at a floating rate and the Convertible Notes (which were issued in October 2016) bear interest at a fixed rate.
We regularly measure our exposure to interest rate risk. We assess interest rate risk and manage our interest rate exposure on an ongoing basis by comparing our interest rate sensitive assets to our interest rate sensitive liabilities.
Based on our December 31, 2016 balance sheet, the following table shows the annual impact on net income of base rate changes in interest rates (considering interest rate floors for variable rate instruments) assuming no changes in our investment and borrowing structure:
| As of December 31, 2016 Basis Point Change |
Interest Income |
Interest Expense |
Net Income |
|||||||||
| ($ in millions) | ||||||||||||
| Up 300 basis points |
$ | 25.39 | $ | (10.86 | ) | $ | 14.53 | |||||
| Up 200 basis points |
16.54 | (7.24 | ) | 9.30 | ||||||||
| Up 100 basis points |
7.69 | (3.62 | ) | 4.07 | ||||||||
| Up 75 basis points |
5.47 | (2.71 | ) | 2.76 | ||||||||
| Up 50 basis points |
3.26 | (1.81 | ) | 1.45 | ||||||||
| Up 25 basis points |
1.18 | (0.90 | ) | 0.28 | ||||||||
| Down 25 basis points |
(0.13 | ) | 0.90 | 0.77 | ||||||||
| Down 50 basis points |
(0.20 | ) | 1.81 | 1.61 | ||||||||
| Down 75 basis points |
(0.24 | ) | 2.71 | 2.47 | ||||||||
| Down 100 basis points |
(0.29 | ) | 2.79 | 2.50 | ||||||||
| Down 200 basis points |
(0.43 | ) | 2.79 | 2.36 | ||||||||
| Down 300 basis points |
(0.43 | ) | 2.79 | 2.36 | ||||||||
We may, in the future, hedge against interest rate fluctuations by using standard hedging instruments such as futures, options and forward contracts subject to the requirements of the Investment Company Act, applicable CFTC regulations and in a manner consistent with SEC guidance. While hedging activities may insulate us against adverse changes in interest rates, they may also limit our ability to participate in benefits of lower interest rates with respect to our portfolio of investments with fixed interest rates.
92
ITEM 8. CONSOLIDATED FINANCIAL STATEMENTS AND SUPPLEMENTARY DATA
GOLDMAN SACHS BDC, INC.
INDEX TO CONSOLIDATED FINANCIAL STATEMENTS
93
Report of Independent Registered Public Accounting Firm
To the Board of Directors and Shareholders of Goldman Sachs BDC, Inc.:
In our opinion, the accompanying consolidated statements of assets and liabilities, including the consolidated schedules of investments, and the related consolidated statements of operations, of changes in net assets and of cash flows present fairly, in all material respects, the financial position of Goldman Sachs BDC, Inc. and its subsidiary (the “Company”) as of December 31, 2016 and 2015, and the results of their operations, the changes in their net assets and their cash flows for each of the three years in the period ended December 31, 2016 in conformity with accounting principles generally accepted in the United States of America. These consolidated financial statements are the responsibility of the Company’s management. Our responsibility is to express an opinion on these consolidated financial statements based on our audits. We conducted our audits of these consolidated financial statements in accordance with the standards of the Public Company Accounting Oversight Board (United States). Those standards require that we plan and perform the audit to obtain reasonable assurance about whether the consolidated financial statements are free of material misstatement. An audit includes examining, on a test basis, evidence supporting the amounts and disclosures in the consolidated financial statements, assessing the accounting principles used and significant estimates made by management, and evaluating the overall consolidated financial statement presentation. We believe that our audits, which included confirmation of investments as of December 31, 2016 by correspondence with the custodian, transfer agent and brokers, and the application of alternative auditing procedures where investments purchased had not been received, provide a reasonable basis for our opinion.
/s/ PricewaterhouseCoopers LLP
Boston, Massachusetts
February 28, 2017
94
Goldman Sachs BDC, Inc.
Consolidated Statements of Assets and Liabilities
(in thousands, except share and per share amounts)
| December 31, 2016 | December 31, 2015 | |||||||
| Assets |
| |||||||
| Investments, at fair value |
| |||||||
|
Non-controlled/non-affiliated investments (cost of $1,055,203 and $1,067,299, respectively) |
$ | 1,004,793 | $ | 1,032,119 | ||||
| Non-controlled affiliated investments (cost of $89,715 and $9,237, respectively) |
84,103 | 4,048 | ||||||
| Controlled affiliated investments (cost of $77,592 and $46,167, respectively) |
78,394 | 44,897 | ||||||
| Investments in affiliated money market fund (cost of $1 and $10,117, respectively) |
1 | 10,117 | ||||||
|
|
|
|
|
|||||
| Total investments, at fair value (cost of $1,222,511 and $1,132,820, respectively) |
1,167,291 | 1,091,181 | ||||||
| Cash |
4,565 | 22,710 | ||||||
| Receivable for investments sold |
– | 313 | ||||||
| Interest and dividends receivable from non-controlled/affiliated investments and non-controlled/non-affiliated investments |
7,841 | 10,399 | ||||||
| Dividend receivable from controlled affiliated investments |
1,925 | 1,350 | ||||||
| Other income receivable from controlled affiliated investments |
2,212 | 681 | ||||||
| Deferred financing costs |
6,018 | 5,775 | ||||||
| Deferred offering costs |
605 | – | ||||||
| Other assets |
76 | 350 | ||||||
|
|
|
|
|
|||||
| Total assets |
$ | 1,190,533 | $ | 1,132,759 | ||||
|
|
|
|
|
|||||
| Liabilities |
| |||||||
| Debt (net of debt issuance costs of $4,598 and $0, respectively) |
$ | 498,152 | $ | 419,000 | ||||
| Interest and other debt expenses payable |
1,569 | 432 | ||||||
| Management fees payable |
4,406 | 4,238 | ||||||
| Incentive fees payable |
1,474 | 360 | ||||||
| Distribution payable |
16,349 | 16,338 | ||||||
| Accrued offering costs |
518 | 40 | ||||||
| Directors’ fees payable |
8 | – | ||||||
| Accrued expenses and other liabilities |
2,920 | 3,701 | ||||||
|
|
|
|
|
|||||
| Total liabilities |
$ | 525,396 | $ | 444,109 | ||||
|
|
|
|
|
|||||
| Commitments and Contingencies (Note 7) |
| |||||||
| Net Assets |
| |||||||
| Preferred stock, par value $0.001 per share (1,000,000 shares authorized, no shares issued and outstanding) |
$ | – | $ | – | ||||
| Common stock, par value $0.001 per share (200,000,000 shares authorized, 36,331,662 and 36,306,882 shares issued and outstanding at December 31, 2016 and December 31, 2015, respectively) |
36 | 36 | ||||||
| Paid-in capital in excess of par |
719,847 | 719,690 | ||||||
| Accumulated net realized gain (loss) |
(23,729 | ) | (2,367 | ) | ||||
| Accumulated undistributed net investment income |
25,624 | 14,351 | ||||||
| Net unrealized appreciation (depreciation) on investments |
(55,220 | ) | (41,639 | ) | ||||
| Allocated income tax expense |
(1,421 | ) | (1,421 | ) | ||||
|
|
|
|
|
|||||
| TOTAL NET ASSETS |
$ | 665,137 | $ | 688,650 | ||||
|
|
|
|
|
|||||
| TOTAL LIABILITIES AND NET ASSETS |
$ | 1,190,533 | $ | 1,132,759 | ||||
|
|
|
|
|
|||||
| Net asset value per share |
$ | 18.31 | $ | 18.97 | ||||
The accompanying notes are part of these consolidated financial statements.
95
Consolidated Statements of Operations
(in thousands, except share and per share amounts)
| For the year ended December 31, 2016 |
For the year ended December 31, 2015 |
For the year ended December 31, 2014 |
||||||||||
| Investment Income: |
| |||||||||||
| From non-controlled/non-affiliated investments: |
| |||||||||||
| Interest income |
$ | 109,568 | $ | 109,700 | $ | 69,454 | ||||||
| Dividend income |
2,107 | 2,476 | 2,881 | |||||||||
| Other income |
2,058 | 1,584 | 632 | |||||||||
|
|
|
|
|
|
|
|||||||
| Total investment income from non-controlled/non-affiliated investments |
113,733 | 113,760 | 72,967 | |||||||||
| From non-controlled affiliated investments: |
| |||||||||||
| Interest income |
2,529 | – | – | |||||||||
| Dividend income |
46 | 3 | 3 | |||||||||
| Other income |
13 | – | – | |||||||||
|
|
|
|
|
|
|
|||||||
| Total investment income from non-controlled affiliated investments |
2,588 | 3 | 3 | |||||||||
| From controlled affiliated investments: |
| |||||||||||
| Dividend income |
6,575 | 3,992 | 309 | |||||||||
| Other income |
2,212 | 681 | – | |||||||||
|
|
|
|
|
|
|
|||||||
| Total investment income from controlled affiliated investments |
8,787 | 4,673 | 309 | |||||||||
|
|
|
|
|
|
|
|||||||
| Total investment income |
$ | 125,108 | $ | 118,436 | $ | 73,279 | ||||||
|
|
|
|
|
|
|
|||||||
| Expenses: |
| |||||||||||
| Interest and other debt expenses |
$ | 14,299 | $ | 10,705 | $ | 4,683 | ||||||
| Management fees |
17,012 | 15,436 | 10,069 | |||||||||
| Incentive fees |
10,422 | 11,786 | 1,495 | |||||||||
| Professional fees |
2,563 | 2,752 | 2,007 | |||||||||
| Administration, custodian and transfer agent fees |
865 | 974 | 856 | |||||||||
| Directors’ fees |
1,012 | 623 | 399 | |||||||||
| Other expenses |
1,671 | 1,062 | 913 | |||||||||
|
|
|
|
|
|
|
|||||||
| Total expenses |
$ | 47,844 | $ | 43,338 | $ | 20,422 | ||||||
|
|
|
|
|
|
|
|||||||
| NET INVESTMENT INCOME (LOSS) BEFORE TAXES |
$ | 77,264 | $ | 75,098 | $ | 52,857 | ||||||
|
|
|
|
|
|
|
|||||||
| Excise tax expense |
$ | 1,037 | $ | 518 | $ | 119 | ||||||
|
|
|
|
|
|
|
|||||||
| NET INVESTMENT INCOME (LOSS) AFTER TAXES |
$ | 76,227 | $ | 74,580 | $ | 52,738 | ||||||
|
|
|
|
|
|
|
|||||||
| Net realized and unrealized gains (losses) on investment transactions: |
| |||||||||||
| Net realized gain (loss) from: |
| |||||||||||
|
Non-controlled/non-affiliated investments |
$ | (21,994 | ) | $ | (67 | ) | $ | (1,191 | ) | |||
| Net change in unrealized appreciation (depreciation) from: |
| |||||||||||
|
Non-controlled/non-affiliated investments |
(21,154 | ) | (24,458 | ) | (11,593 | ) | ||||||
| Non-controlled affiliated investments |
5,501 | (2,530 | ) | (2,659 | ) | |||||||
| Controlled affiliated investments |
2,072 | (897 | ) | (373 | ) | |||||||
|
|
|
|
|
|
|
|||||||
| Net realized and unrealized gains (losses) |
$ | (35,575 | ) | $ | (27,952 | ) | $ | (15,816 | ) | |||
|
|
|
|
|
|
|
|||||||
| NET INCREASE IN NET ASSETS RESULTING FROM OPERATIONS |
$ | 40,652 | $ | 46,628 | $ | 36,922 | ||||||
|
|
|
|
|
|
|
|||||||
| Net investment income (loss) per share (basic and diluted) |
$ | 2.10 | $ | 2.14 | $ | 1.77 | ||||||
| Earnings per share (basic and diluted) |
$ | 1.12 | $ | 1.34 | $ | 1.24 | ||||||
| Weighted average shares outstanding |
36,317,131 | 34,782,967 | 29,737,113 | |||||||||
The accompanying notes are part of these consolidated financial statements.
96
Consolidated Statements of Changes in Net Assets
(in thousands, except share and per share amounts)
| For the year ended December 31, 2016 |
For the year ended December 31, 2015 |
For the year ended December 31, 2014 |
||||||||||
| Increase (decrease) in net assets resulting from operations: |
| |||||||||||
| Net investment income |
$ | 76,227 | $ | 74,580 | $ | 52,738 | ||||||
| Net realized gain (loss) on investments |
(21,994 | ) | (67 | ) | (1,191 | ) | ||||||
| Net change in unrealized appreciation (depreciation) on investments |
(13,581 | ) | (27,885 | ) | (14,625 | ) | ||||||
|
|
|
|
|
|
|
|||||||
| Net increase (decrease) in net assets resulting from operations |
$ | 40,652 | $ | 46,628 | $ | 36,922 | ||||||
|
|
|
|
|
|
|
|||||||
| Distributions to stockholders from: |
| |||||||||||
| Net investment income |
$ | (65,373 | ) | $ | (63,624 | ) | $ | (47,712 | ) | |||
| Net realized gain |
– | (1,297 | ) | (2,268 | ) | |||||||
|
|
|
|
|
|
|
|||||||
| Total distributions to stockholders |
$ | (65,373 | ) | $ | (64,921 | ) | $ | (49,980 | ) | |||
|
|
|
|
|
|
|
|||||||
| Capital transactions: |
| |||||||||||
| Issuance of common stock, net of offering and underwriting costs (0, 6,900,000 and 0 shares, respectively) |
$ | – | $ | 131,839 | $ | – | ||||||
| Equity component of convertible notes |
717 | – | – | |||||||||
| Reinvestment of stockholder distributions (24,780 and 25,755 and 0 shares, respectively) |
491 | 522 | – | |||||||||
| Repurchase of common stock (0, 0 and 1,008,987 shares, respectively) |
– | – | (20,145 | ) | ||||||||
|
|
|
|
|
|
|
|||||||
| Net increase (decrease) in net assets resulting from capital transactions |
$ | 1,208 | $ | 132,361 | $ | (20,145 | ) | |||||
|
|
|
|
|
|
|
|||||||
| TOTAL INCREASE (DECREASE) IN NET ASSETS |
$ | (23,513 | ) | $ | 114,068 | $ | (33,203 | ) | ||||
|
|
|
|
|
|
|
|||||||
| Net assets at beginning of period |
$ | 688,650 | $ | 574,582 | $ | 607,785 | ||||||
|
|
|
|
|
|
|
|||||||
| Net assets at end of period |
$ | 665,137 | $ | 688,650 | $ | 574,582 | ||||||
|
|
|
|
|
|
|
|||||||
| Accumulated undistributed net investment income (loss) |
$ | 25,624 | $ | 14,351 | $ | 4,058 | ||||||
|
|
|
|
|
|
|
|||||||
| Distribution declared per share |
$ | 1.80 | $ | 1.80 | $ | 1.69 | ||||||
The accompanying notes are part of these consolidated financial statements.
97
Consolidated Statements of Cash Flows
(in thousands, except share and per share amounts)
| For the year ended December 31, 2016 |
For the year ended December 31, 2015 |
For the year ended December 31, 2014 |
||||||||||
| Cash flows from operating activities: |
| |||||||||||
| Net increase (decrease) in net assets resulting from operations: |
$ | 40,652 | $ | 46,628 | $ | 36,922 | ||||||
| Adjustments to reconcile net increase (decrease) in net assets resulting from operations to net cash provided by (used for) operating activities: |
||||||||||||
| Purchases of investments |
(310,173 | ) | (320,740 | ) | (697,039 | ) | ||||||
| Payment-in-kind interest |
(2,045 | ) | (411 | ) | (412 | ) | ||||||
| Investments in affiliated money market fund, net |
10,116 | 19,451 | 90,950 | |||||||||
| Proceeds from sales of investments and principal repayments |
195,363 | 131,090 | 263,738 | |||||||||
| Net realized (gain) loss on investments |
21,994 | 67 | 1,191 | |||||||||
| Net change in unrealized (appreciation) depreciation on investments |
13,581 | 27,885 | 14,625 | |||||||||
| Amortization of premium and accretion of discount, net |
(4,946 | ) | (5,008 | ) | (2,633 | ) | ||||||
| Amortization of deferred financing and debt issuance costs |
1,399 | 1,170 | 1,013 | |||||||||
| Amortization of original issue discount on convertible notes |
30 | – | – | |||||||||
| Increase (decrease) in operating assets and liabilities: |
| |||||||||||
| (Increase) decrease in interest and dividends receivable |
1,983 | (2,739 | ) | (5,368 | ) | |||||||
| (Increase) decrease in deferred financing and debt issuance costs |
– | – | 24 | |||||||||
| (Increase) decrease in receivable for investments sold |
313 | (313 | ) | – | ||||||||
| (Increase) decrease in other income receivable |
(1,531 | ) | (681 | ) | – | |||||||
| (Increase) decrease in receivable from Investment Adviser |
– | – | 780 | |||||||||
| (Increase) decrease in other assets |
274 | (350 | ) | – | ||||||||
| Increase (decrease) in interest and other debt expenses payable |
1,130 | (86 | ) | 110 | ||||||||
| Increase (decrease) in management fees payable |
168 | 912 | 666 | |||||||||
| Increase (decrease) in incentive fees payable |
1,114 | 360 | – | |||||||||
| Increase (decrease) in payable for investments purchased |
– | (19,700 | ) | 14,774 | ||||||||
| Increase (decrease) in accrued organization costs |
– | – | (497 | ) | ||||||||
| Increase (decrease) in directors’ fees payable |
8 | (115 | ) | 1 | ||||||||
| Increase (decrease) in accrued expenses and other liabilities |
(781 | ) | 1,171 | 1,633 | ||||||||
|
|
|
|
|
|
|
|||||||
| Net cash provided by (used for) operating activities |
$ | (31,351 | ) | $ | (121,409 | ) | $ | (279,522 | ) | |||
|
|
|
|
|
|
|
|||||||
| Cash flows from financing activities: |
| |||||||||||
| Proceeds from issuance of common stock (net of underwriting costs) |
$ | – | $ | 135,111 | $ | – | ||||||
| Offering costs paid |
(127 | ) | (2,322 | ) | (1,040 | ) | ||||||
| Repurchase of common stock |
– | (732 | ) | (24,407 | ) | |||||||
| Distributions paid |
(64,871 | ) | (63,567 | ) | (41,543 | ) | ||||||
| Deferred financing and debt issuance costs paid |
(5,546 | ) | (1,980 | ) | (2,290 | ) | ||||||
| Borrowings on debt |
387,000 | 288,000 | 450,000 | |||||||||
| Repayments of debt |
(303,250 | ) | (219,000 | ) | (100,000 | ) | ||||||
|
|
|
|
|
|
|
|||||||
| Net cash provided by (used for) financing activities |
$ | 13,206 | $ | 135,510 | $ | 280,720 | ||||||
|
|
|
|
|
|
|
|||||||
| Net increase (decrease) in cash |
(18,145 | ) | 14,101 | 1,198 | ||||||||
| Cash, beginning of period |
22,710 | 8,609 | 7,411 | |||||||||
|
|
|
|
|
|
|
|||||||
| Cash, end of period |
$ | 4,565 | $ | 22,710 | $ | 8,609 | ||||||
|
|
|
|
|
|
|
|||||||
| Supplemental and non-cash financing activities |
| |||||||||||
| Interest expense paid |
$ | 11,174 | $ | 8,829 | $ | 2,118 | ||||||
| Accrued but unpaid excise tax expense |
$ | 1,031 | $ | 512 | $ | 119 | ||||||
| Accrued but unpaid deferred financing and debt issuance costs |
$ | 60 | $ | 54 | $ | 63 | ||||||
| Accrued but unpaid offering costs |
$ | 518 | $ | 40 | $ | 474 | ||||||
| Accrued but unpaid distributions |
$ | 16,349 | $ | 16,338 | $ | 15,506 | ||||||
| Accrued but unpaid common stock repurchase |
$ | – | $ | – | $ | 732 | ||||||
| Reinvestment of stockholder distributions |
$ | 491 | $ | 522 | $ | – | ||||||
The accompanying notes are part of these consolidated financial statements.
98
Consolidated Schedule of Investments as of December 31, 2016
(in thousands, except share and per share amounts)
| Portfolio Company | Industry | Interest | Maturity | Par Amount | Cost | Fair Value | ||||||||||||||
| Investments at Fair Value – 175.50%# | ||||||||||||||||||||
| Corporate Debt (1) – 160.95% | ||||||||||||||||||||
| 1st Lien/Senior Secured Debt – 63.30% | ||||||||||||||||||||
| Artesyn Embedded Technologies, Inc.(2) |
Electronic Equipment, Instruments & Components | 9.75% | 10/15/2020 | $20,000 | $ | 20,000 | $ | 18,325 | ||||||||||||
| Data Driven Delivery Systems, LLC(++) |
Health Care Technology | L + 7.00% (1.00% Floor) | 05/30/2019 | 69,619 | 67,609 | 69,619 | ||||||||||||||
| Dispensing Dynamics International(2) |
Building Products | 12.50% | 01/01/2018 | 24,000 | 24,359 | 23,520 | ||||||||||||||
| Elemica, Inc.(+) |
Software | L + 8.00% (1.00% Floor) | 07/07/2021 | 42,288 | 41,308 | 41,336 | ||||||||||||||
| Elemica, Inc.(3) (4) |
Software | L + 8.00% (1.00% Floor) | 07/07/2021 | 6,000 | (139 | ) | (135 | ) | ||||||||||||
| Heligear Acquisition Co.(2) |
Aerospace & Defense | 10.25% | 10/15/2019 | 17,500 | 17,289 | 17,894 | ||||||||||||||
| Infinity Sales Group(+) |
Media | L + 10.50% (1.00% Floor) | 11/21/2018 | 30,803 | 30,518 | 28,724 | ||||||||||||||
| Iracore International Holdings, Inc.(2) (5) (6) |
Energy Equipment & Services | 9.50% | 06/01/2018 | 24,250 | 21,321 | 6,911 | ||||||||||||||
| Kawa Solar Holdings Limited^ (7) |
Construction & Engineering | F + 8.20% and 3.50% PIK | 07/02/2018 | 12,767 | 12,727 | 12,767 | ||||||||||||||
| Kawa Solar Holdings Limited^ (++) (7) |
Construction & Engineering | L + 8.20% | 07/02/2018 | 2,400 | 2,392 | 2,400 | ||||||||||||||
| Legacy Buyer Corp.(++) |
Health Care Providers & Services | L + 8.00% (1.00% Floor) | 10/24/2019 | 27,470 | 27,120 | 26,508 | ||||||||||||||
| Legacy Buyer Corp.(++) (3) |
Health Care Providers & Services | L + 8.00% (1.00% Floor) | 10/24/2019 | 2,500 | 1,668 | 1,612 | ||||||||||||||
| Madison-Kipp Corporation(+) |
Machinery | L + 9.00% (1.00% Floor) | 05/26/2020 | 36,696 | 36,153 | 36,420 | ||||||||||||||
| Perfect Commerce, LLC(++) |
Internet Software & Services | L + 8.50% (1.00% Floor) | 06/30/2020 | 37,418 | 36,740 | 37,605 | ||||||||||||||
| The Merit Distribution Group, LLC(++) |
Distributors | L + 11.25% (0.50% Floor) | 04/08/2021 | 30,000 | 29,329 | 29,775 | ||||||||||||||
| US Med Acquisition, Inc.(+) |
Health Care Equipment & Supplies | L + 9.00% (1.00% Floor) | 08/13/2021 | 30,574 | 30,069 | 30,574 | ||||||||||||||
| Vexos, Inc.(++) |
Electronic Equipment, Instruments & Components | L + 9.50% (1.00% Floor) | 10/09/2019 | 38,922 | 38,433 | 37,171 | ||||||||||||||
|
|
|
|
|
|||||||||||||||||
| Total 1st Lien/Senior Secured Debt |
436,896 | 421,026 | ||||||||||||||||||
| 1st Lien/Last-Out Unitranche (8) – 46.64% | ||||||||||||||||||||
| Associations, Inc.(++) |
Real Estate Management & Development | L + 7.00% (1.00% Floor) | 12/23/2019 | 58,136 | 57,324 | 57,700 | ||||||||||||||
| Avenue Stores, LLC(+) |
Specialty Retail | L + 8.00% (1.00% Floor) | 09/19/2019 | 30,000 | 29,546 | 30,000 | ||||||||||||||
| Bolttech Mannings, Inc.(++) |
Commercial Services & Supplies | L + 7.75% (1.00% Floor) | 12/21/2018 | 36,346 | 35,967 | 20,081 | ||||||||||||||
| Integrated Practice Solutions, Inc.(++) |
Software | L + 9.10% (1.00% Floor) | 08/03/2020 | 25,781 | 25,240 | 25,781 | ||||||||||||||
| Mervin Manufacturing, Inc.(++) |
Leisure Equipment & Products | L + 7.50% (1.00% Floor) | 10/10/2019 | 11,165 | 11,024 | 9,936 | ||||||||||||||
| NTS Communications, Inc.^ (++) |
Diversified Telecommunication Services | L + 9.00% (1.25% Floor) PIK | 06/06/2019 | 52,776 | 48,725 | 47,498 | ||||||||||||||
| Pro-Pet, LLC(+) |
Household Products | L + 7.25% (0.75% Floor) | 11/21/2019 | 31,600 | 31,104 | 29,388 | ||||||||||||||
| The Service Companies Inc.(+) |
Professional Services | L + 10.25% (1.00% Floor) | 03/26/2019 | 46,580 | 46,087 | 45,881 | ||||||||||||||
| United Road Services, Inc.(+) |
Air Freight & Logistics | L + 7.50% (1.00% Floor) | 12/14/2017 | 44,658 | 44,438 | 43,989 | ||||||||||||||
|
|
|
|
|
|||||||||||||||||
| Total 1st Lien/Last-Out Unitranche |
329,455 | 310,254 | ||||||||||||||||||
| 2nd Lien/Senior Secured Debt – 50.54% | ||||||||||||||||||||
| ASC Acquisition Holdings, LLC(++) |
Distributors | L + 13.00% (1.00% Floor) | 12/15/2022 | 30,000 | 29,181 | 30,000 | ||||||||||||||
| DiscoverOrg, LLC(++) |
Software | L + 9.00% (1.00% Floor) | 02/10/2022 | 39,500 | 38,798 | 38,809 | ||||||||||||||
| DiversiTech Corporation(++) |
Building Products | L + 8.00% (1.00% Floor) | 11/18/2022 | 51,350 | 50,331 | 50,708 | ||||||||||||||
| Global Tel*Link Corporation(++) |
Diversified Telecommunication Services | L + 7.75% (1.25% Floor) | 11/23/2020 | 28,000 | 27,656 | 27,125 | ||||||||||||||
| Highwinds Capital, Inc.(+) |
Internet Software & Services | L + 12.25% (1.25% Floor) | 01/29/2019 | 59,050 | 58,591 | 59,641 | ||||||||||||||
| Hutchinson Technology, Inc. |
Computers & Peripherals | 10.88% | 01/15/2017 | 12,200 | 12,189 | 12,200 | ||||||||||||||
| IHS Intermediate Inc.(++) |
Health Care Providers & Services | L + 8.25% (1.00% Floor) | 07/20/2022 | 10,000 | 9,830 | 9,500 | ||||||||||||||
| MedPlast Holdings, Inc. |
Health Care Equipment & Supplies | P + 7.75% (2.00% Floor) | 06/06/2023 | 25,000 | 24,380 | 24,375 | ||||||||||||||
| MPI Products LLC(++) |
Auto Components | L + 9.00% (1.00% Floor) | 01/30/2020 | 20,000 | 19,808 | 19,850 | ||||||||||||||
| P2 Upstream Acquisition Co.(+++) |
Software | L + 8.00% (1.00% Floor) | 04/30/2021 | 10,000 | 9,933 | 9,075 | ||||||||||||||
The accompanying notes are part of these consolidated financial statements.
99
Goldman Sachs BDC, Inc.
Consolidated Schedule of Investments as of December 31, 2016 (continued)
(in thousands, except share and per share amounts)
| Portfolio Company | Industry | Interest | Maturity | Par Amount | Cost | Fair Value | ||||||||||||||
| Reddy Ice Corporation(++) |
Food Products | L + 9.50% (1.25% Floor) | 11/01/2019 | $13,500 | $ | 13,168 | $ | 11,610 | ||||||||||||
| Securus Technologies Holdings, Inc.(++) |
Diversified Telecommunication Services | L + 7.75% (1.25% Floor) | 04/30/2021 | 20,000 | 19,853 | 19,350 | ||||||||||||||
| SW Holdings, LLC(++) |
Media | L + 8.75% (1.00% Floor) | 12/30/2021 | 14,265 | 14,029 | 14,015 | ||||||||||||||
| Washington Inventory Service(5) (6) | Professional Services | P + 8.00% | 06/20/2019 | 24,800 | 24,949 | 9,920 | ||||||||||||||
|
|
|
|
|
|||||||||||||||||
| Total 2nd Lien/Senior Secured Debt |
|
352,696 | 336,178 | |||||||||||||||||
| Unsecured Debt – 0.47% | ||||||||||||||||||||
| CB-HDT Holdings, Inc.^ | Aerospace & Defense | 12.00% PIK | 12/15/2019 | 3,115 | 3,115 | 3,115 | ||||||||||||||
|
|
|
|
|
|||||||||||||||||
| Total Unsecured Debt |
|
3,115 | 3,115 | |||||||||||||||||
|
|
|
|
|
|||||||||||||||||
| Total Corporate Debt |
|
1,122,162 | 1,070,573 | |||||||||||||||||
|
|
|
|
|
|||||||||||||||||
| Portfolio Company | Industry | Coupon | Shares | Cost | Fair Value | |||||||||||||
| Preferred Stock(1) – 1.78% | ||||||||||||||||||
| CB-HDT Holdings, Inc.^ (5) | Aerospace & Defense | 1,108,333 | $ | 10,186 | $ | 11,083 | ||||||||||||
| Kawa Solar Holdings Limited^ (7) | Construction & Engineering | 8.00% PIK | 50,000 | 750 | 750 | |||||||||||||
| NTS Communications, Inc.^ (5) | Diversified Telecommunication Services | 263 | 187 | — | ||||||||||||||
|
|
|
|
|
|||||||||||||||
| Total Preferred Stock |
11,123 | 11,833 | ||||||||||||||||
|
|
|
|
|
|||||||||||||||
| Common Stock(1) – 0.98% | ||||||||||||||||||
| CB-HDT Holdings, Inc.^ (5) | Aerospace & Defense | 453,383 | 2,393 | 4,312 | ||||||||||||||
| Kawa Solar Holdings Limited^ (5) (7) | Construction & Engineering | 1,399,556 | — | — | ||||||||||||||
| NTS Communications, Inc.^ (5) | Diversified Telecommunication Services | 595,215 | 3 | — | ||||||||||||||
| Prairie Provident Resources, Inc.^ (5) (7) | Oil, Gas & Consumable Fuels | 3,579,989 | 9,237 | 2,178 | ||||||||||||||
|
|
|
|
|
|||||||||||||||
| Total Common Stock |
11,633 | 6,490 | ||||||||||||||||
|
|
|
|
|
|||||||||||||||
| Portfolio Company | LLC Interest | Cost | Fair Value | |||||||||||||||
| Investment Funds & Vehicles(1) – 11.79% | ||||||||||||||||||
| Senior Credit Fund, LLC^^ (7) | $ | 77,592 | $ | 77,592 | $ | 78,394 | ||||||||||||
|
|
|
|
|
|||||||||||||||
| Total Investment Funds & Vehicles |
77,592 | 78,394 | ||||||||||||||||
|
|
|
|
|
|||||||||||||||
| Yield | Shares | Cost | Fair Value | |||||||||||||||
| Investments in Affiliated Money Market Fund(1) – 0.00%# | ||||||||||||||||||
| Goldman Sachs Financial Square Government Fund | 0.45%(9) | 1,179 | $ | 1 | $ | 1 | ||||||||||||
|
|
|
|
|
|||||||||||||||
| Total Investments in Affiliated Money Market Fund |
1 | 1 | ||||||||||||||||
|
|
|
|
|
|||||||||||||||
| TOTAL INVESTMENTS – 175.50% | $ | 1,222,511 | $ | 1,167,291 | ||||||||||||||
|
|
|
|
|
|||||||||||||||
| LIABILITIES IN EXCESS OF OTHER ASSETS – (75.50%) | $ | (502,154 | ) | |||||||||||||||
|
|
|
|||||||||||||||||
| NET ASSETS – 100.00% | $ | 665,137 | ||||||||||||||||
|
|
|
|||||||||||||||||
| # | Percentages are based on net assets. |
| ^ | As defined in the Investment Company Act of 1940, the investment is deemed to be an “affiliated person” of the Company because the Company owns, either directly or indirectly, 5% or more of the portfolio company’s outstanding voting securities. See Note 3 “Significant Agreements and Related Parties”. |
| ^^ | As defined in the Investment Company Act of 1940, the investment is deemed to be a “controlled affiliated person” of the Company because the Company owns, either directly or indirectly, 25% or more of the portfolio company’s outstanding voting securities or has the power to exercise control over management or policies of such portfolio company. See Note 3 “Significant Agreements and Related Parties”. |
| (+) | The interest rate on these loans is subject to the greater of a LIBOR floor or 1 month LIBOR plus a base rate. The 1 month LIBOR as of December 31, 2016 was 0.77%. |
| (++) | The interest rate on these loans is subject to the greater of a LIBOR floor or 3 month LIBOR plus a base rate. The 3 month LIBOR as of December 31, 2016 was 1.00%. |
| (+++) | The interest rate on these loans is subject to the greater of a LIBOR floor or 6 month LIBOR plus a base rate. The 6 month LIBOR as of December 31, 2016 was 1.32%. |
| (1) | Assets are pledged as collateral for the Revolving Credit Facility. See Note 6 “Debt”. |
The accompanying notes are part of these consolidated financial statements.
100
Goldman Sachs BDC, Inc.
Consolidated Schedule of Investments as of December 31, 2016 (continued)
(in thousands, except share and per share amounts)
| (2) | Security exempt from registration pursuant to Rule 144A under the Securities Act of 1933. These securities may be sold in certain transactions (normally to qualified institutional buyers) and remain exempt from registration. As of December 31, 2016, the aggregate fair value of these securities is $66,650 or 10.02% of the Company’s net assets. |
| (3) | Position or portion thereof is an unfunded loan commitment, and no interest is being earned on the unfunded portion. The unfunded loan commitment may be subject to a commitment termination date, that may expire prior to the maturity date stated. See Note 7 “Commitments and Contingencies”. |
| (4) | The negative cost is the result of the capitalized discount being greater than the principal amount outstanding on the loan. The negative fair value is the result of the capitalized discount on the loan. |
| (5) | Non-income producing security. |
| (6) | The investment is on non-accrual status as of December 31, 2016. See Note 2 “Significant Accounting Policies”. |
| (7) | The investment is not a qualifying asset under Section 55(a) of the Investment Company Act of 1940. The Company may not acquire any non-qualifying asset unless, at the time of acquisition, qualifying assets represent at least 70% of the Company’s total assets. |
| (8) | In addition to the interest earned based on the stated rate of this loan, the Company may be entitled to receive additional interest as a result of its arrangement with other lenders in a syndication. |
| (9) | The rate shown is the annualized seven-day yield as of December 31, 2016. |
F – Federal Funds Rate (which as of December 31, 2016 was 0.55%)
L – LIBOR
P – U.S. Prime Rate (which as of December 31, 2016 was 3.75%)
PIK – Payment-In-Kind
The accompanying notes are part of these consolidated financial statements.
101
Goldman Sachs BDC, Inc.
Consolidated Schedule of Investments as of December 31, 2015
(in thousands, except share and per share amounts)
| Portfolio Company | Industry | Interest | Maturity | Par Amount | Cost | Fair Value | ||||||||||||||
| Investments at Fair Value – 156.98%# | ||||||||||||||||||||
| Corporate Debt(1) – 146.85% | ||||||||||||||||||||
| 1st Lien/Senior Secured Debt – 61.00% | ||||||||||||||||||||
| Artesyn Embedded Technologies, Inc.(2) | Electronic Equipment, Instruments & Components | 9.75% | 10/15/2020 | $ | 20,000 | $ | 20,000 | $ | 18,700 | |||||||||||
| Data Driven Delivery Systems, LLC(++) | Health Care Technology | L + 7.00% (1.00% Floor) | 05/31/2019 | 70,500 | 68,202 | 70,500 | ||||||||||||||
| Dispensing Dynamics International(2) | Building Products | 12.50% | 01/01/2018 | 24,000 | 24,685 | 23,304 | ||||||||||||||
| Heligear Acquisition Co.(2) | Aerospace & Defense | 10.25% | 10/15/2019 | 17,500 | 17,229 | 18,550 | ||||||||||||||
| Infinity Sales Group(+) | Media | L + 10.50% (1.00% Floor) | 11/21/2018 | 33,727 | 33,284 | 32,630 | ||||||||||||||
| Iracore International Holdings, Inc.(2) | Energy Equipment & Services | 9.50% | 06/01/2018 | 24,250 | 20,877 | 15,763 | ||||||||||||||
| Kawa Solar Holdings Limited(3) | Construction & Engineering | F + 8.20% | 07/02/2017 | 15,000 | 15,000 | 15,000 | ||||||||||||||
| Legacy Buyer Corp.(++) | Health Care Providers & Services | L + 8.00% (1.00% Floor) | 10/24/2019 | 30,225 | 29,735 | 29,847 | ||||||||||||||
| Legacy Buyer Corp.(4) (5) | Health Care Providers & Services | L + 8.00% (1.00% Floor) | 10/24/2019 | 2,500 | (40 | ) | (31 | ) | ||||||||||||
| Madison-Kipp Corporation(+) | Machinery | L + 9.00% (1.00% Floor) | 05/26/2020 | 37,000 | 36,330 | 36,352 | ||||||||||||||
| NTS Communications, Inc.(++) | Diversified Telecommunication Services | L + 9.00% (1.25% Floor) | 06/06/2019 | 44,300 | 43,641 | 42,196 | ||||||||||||||
| Perfect Commerce, LLC(++) | Internet Software & Services | L + 8.50% (1.00% Floor) | 06/30/2020 | 39,668 | 38,789 | 38,973 | ||||||||||||||
| US Med Acquisition, Inc.(+) | Health Care Equipment & Supplies | L + 9.00% (1.00% Floor) | 08/13/2021 | 30,884 | 30,292 | 30,884 | ||||||||||||||
| Vexos, Inc.(++) | Electronic Equipment, Instruments & Components | L + 9.50% (1.00% Floor) | 10/09/2019 | 48,275 | 47,512 | 47,430 | ||||||||||||||
|
|
|
|
|
|||||||||||||||||
| Total 1st Lien/Senior Secured Debt |
|
425,536 | 420,098 | |||||||||||||||||
| 1st Lien/Last-Out Unitranche (6) – 44.40% | ||||||||||||||||||||
| Associations, Inc.(++) | Real Estate Management & Development | L + 7.00% (1.00% Floor) | 12/23/2019 | 75,926 | 74,669 | 74,598 | ||||||||||||||
| Associations, Inc.(++) (4) | Real Estate Management & Development | L + 7.00% (1.00% Floor) | 12/23/2019 | 12,955 | 9,194 | 9,217 | ||||||||||||||
| Avenue Stores, LLC(+) | Specialty Retail | L + 8.00% (1.00% Floor) | 09/19/2019 | 30,000 | 29,409 | 30,300 | ||||||||||||||
| Bolttech Mannings, Inc.(+) | Commercial Services & Supplies | L + 7.75% (1.00% Floor) | 12/21/2018 | 33,000 | 32,504 | 31,185 | ||||||||||||||
| Bolttech Mannings, Inc.(+) | Commercial Services & Supplies | L + 7.75% (1.00% Floor) | 12/21/2018 | 3,346 | 3,297 | 3,162 | ||||||||||||||
| Integrated Practice Solutions, Inc.(++) | Software | L + 9.10% (1.00% Floor) | 08/03/2020 | 27,156 | 26,464 | 26,417 | ||||||||||||||
| Mervin Manufacturing, Inc.(++) | Leisure Equipment & Products | L + 7.50% (1.00% Floor) | 10/10/2019 | 13,584 | 13,365 | 12,837 | ||||||||||||||
| Pro-Pet, LLC(+) | Household Products | L + 7.25% (0.75% Floor) | 11/21/2019 | 28,600 | 28,196 | 27,170 | ||||||||||||||
| The Service Companies Inc.(++) | Professional Services | L + 10.25% (1.00% Floor) | 03/26/2019 | 47,460 | 46,773 | 46,629 | ||||||||||||||
| United Road Services, Inc.(+) | Air Freight & Logistics | L + 7.50% (1.00% Floor) | 12/14/2017 | 44,658 | 44,237 | 44,212 | ||||||||||||||
|
|
|
|
|
|||||||||||||||||
| Total 1st Lien/Last-Out Unitranche |
|
308,108 | 305,727 | |||||||||||||||||
| 2nd Lien/Senior Secured Debt – 41.45% | ||||||||||||||||||||
| DiversiTech Corporation(++) | Building Products | L + 8.00% (1.00% Floor) | 11/18/2022 | 10,000 | 9,859 | 9,850 | ||||||||||||||
| Extraction Oil & Gas Holdings, LLC | Oil, Gas & Consumable Fuels | 11.00% | 05/29/2019 | 15,000 | 14,833 | 15,187 | ||||||||||||||
| Extraction Oil & Gas Holdings, LLC | Oil, Gas & Consumable Fuels | 10.00% | 05/29/2019 | 8,412 | 8,314 | 8,286 | ||||||||||||||
| Global Tel*Link Corporation(++) | Diversified Telecommunication Services | L + 7.75% (1.25% Floor) | 11/23/2020 | 28,000 | 27,588 | 16,800 | ||||||||||||||
| Highwinds Capital, Inc.(+) | Internet Software & Services | L + 12.25% (1.25% Floor) | 01/29/2019 | 59,050 | 58,429 | 59,050 | ||||||||||||||
| Hunter Defense Technologies, Inc.(++) | Aerospace & Defense | L + 10.00% (1.00% Floor) | 02/05/2020 | 28,000 | 26,866 | 26,320 | ||||||||||||||
| Hutchinson Technology, Inc. | Computers & Peripherals | 10.88% | 01/15/2017 | 12,200 | 12,004 | 13,298 | ||||||||||||||
| iFly Holdings LLC(++) | Leisure Equipment & Products | L + 9.00% (1.00% Floor) | 07/08/2019 | 25,000 | 24,595 | 25,000 | ||||||||||||||
The accompanying notes are part of these consolidated financial statements.
102
Goldman Sachs BDC, Inc.
Consolidated Schedule of Investments as of December 31, 2015 (continued)
(in thousands, except share and per share amounts)
| Portfolio Company | Industry | Interest | Maturity | Par Amount | Cost | Fair Value | ||||||||||||||
| IHS Intermediate, Inc.(++) | Health Care Providers & Services | L + 8.25% (1.00% Floor) | 07/20/2022 | $ | 10,000 | $ | 9,809 | $ | 9,800 | |||||||||||
| MPI Products LLC(++) | Auto Components | L + 9.00% (1.00% Floor) | 01/30/2020 | 20,000 | 19,761 | 19,800 | ||||||||||||||
| Oasis Outsourcing Holdings, Inc.(+) | Diversified Financial Services | L + 8.75% (1.00% Floor) | 12/26/2022 | 20,000 | 19,726 | 20,000 | ||||||||||||||
| P2 Upstream Acquisition Co.(+++) | Software | L + 8.00% (1.00% Floor) | 04/30/2021 | 10,000 | 9,922 | 8,200 | ||||||||||||||
| Reddy Ice Corporation(++) | Food Products | L + 9.50% (1.25% Floor) | 11/01/2019 | 13,500 | 13,082 | 8,809 | ||||||||||||||
| Securus Technologies Holdings, Inc.(++) | Diversified Telecommunication Services | L + 7.75% (1.25% Floor) | 04/30/2021 | 20,000 | 19,828 | 10,760 | ||||||||||||||
| SW Holdings, LLC(+++) | Media | L + 8.75% (1.00% Floor) | 12/30/2021 | 13,500 | 13,245 | 13,230 | ||||||||||||||
| Washington Inventory Service(++) | Professional Services | L + 9.00% (1.25% Floor) | 06/20/2019 | 24,800 | 24,970 | 21,080 | ||||||||||||||
|
|
|
|
|
|||||||||||||||||
| Total 2nd Lien/Senior Secured Debt |
|
312,831 | 285,470 | |||||||||||||||||
|
|
|
|
|
|||||||||||||||||
| Total Corporate Debt |
|
1,046,475 | 1,011,295 | |||||||||||||||||
|
|
|
|
|
|||||||||||||||||
| Portfolio Company | Industry | Coupon | Shares | Cost | Fair Value | |||||||||||||
| Preferred Stock(1) – 3.61% | ||||||||||||||||||
| Crowley Holdings Preferred LLC(2) | Marine | 12.00% (Includes 2% PIK) | 20,823 | $ | 20,824 | $ | 20,824 | |||||||||||
| Lone Pine Resources CDA, Ltd.^ (3) (7) (8) | Oil, Gas & Consumable Fuels | 10.00% | 3,745,909 | 4,791 | 4,048 | |||||||||||||
|
|
|
|
|
|||||||||||||||
| Total Preferred Stock |
25,615 | 24,872 | ||||||||||||||||
|
|
|
|
|
|||||||||||||||
| Common Stock(1) – 0.00% | ||||||||||||||||||
| Lone Pine Resources CDA, Ltd.^ (3) (8) (9) | Oil, Gas & Consumable Fuels | 972,919 | 4,446 | — | ||||||||||||||
|
|
|
|
|
|||||||||||||||
| Total Common Stock |
4,446 | — | ||||||||||||||||
|
|
|
|
|
|||||||||||||||
| Portfolio Company | LLC Interest | Cost | Fair Value | |||||||||||||||
| Investment Funds & Vehicles(1) – 6.52% | ||||||||||||||||||
| Senior Credit Fund, LLC^^ (3) | $ | 46,167 | $ | 46,167 | $ | 44,897 | ||||||||||||
|
|
|
|
|
|||||||||||||||
| Total Investment Funds & Vehicles |
46,167 | 44,897 | ||||||||||||||||
|
|
|
|
|
|||||||||||||||
| Yield | Shares | Cost | Fair Value | |||||||||||||||
| Investments in Affiliated Money Market Fund(1) – 1.47%# | ||||||||||||||||||
| Goldman Sachs Financial Square Government Fund | 0.19%(10) | 10,116,857 | $ | 10,117 | $ | 10,117 | ||||||||||||
|
|
|
|
|
|||||||||||||||
| Total Investments in Affiliated Money Market Fund |
10,117 | 10,117 | ||||||||||||||||
|
|
|
|
|
|||||||||||||||
| TOTAL INVESTMENTS – 158.45% | $ | 1,132,820 | $ | 1,091,181 | ||||||||||||||
|
|
|
|
|
|||||||||||||||
| LIABILITIES IN EXCESS OF OTHER ASSETS – (58.45%) | $ | (402,531 | ) | |||||||||||||||
|
|
|
|||||||||||||||||
| NET ASSETS – 100.00% | $ | 688,650 | ||||||||||||||||
|
|
|
|||||||||||||||||
| # | Percentages are based on net assets |
| (+) | The interest rate on these loans is subject to a base rate plus 1 month LIBOR, which as of December 31, 2015 was 0.43%. As the interest rate is subject to a minimum LIBOR floor which was greater than the 1 month LIBOR rate at December 31, 2015, the prevailing rate in effect as of December 31, 2015 was the base rate plus the LIBOR floor. |
| (++) | The interest rate on these loans is subject to a base rate plus 3 month LIBOR, which as of December 31, 2015 was 0.61%. As the interest rate is subject to a minimum LIBOR floor which was greater than the 3 month LIBOR rate at December 31, 2015, the prevailing rate in effect as of December 31, 2015 was the base rate plus the LIBOR floor. |
| (+++) | The interest rate on these loans is subject to a base rate plus 6 month LIBOR, which as of December 31, 2015 was 0.85%. As the interest rate is subject to a minimum LIBOR floor which was greater than the 6 month LIBOR rate at December 31, 2015, the prevailing rate in effect as of December 31, 2015 was the base rate plus the LIBOR floor. |
| ^ | As defined in the Investment Company Act of 1940, the investment is deemed to be an “affiliated person” of the Company because the Company owns, either directly or indirectly, 5% or more of the portfolio company’s outstanding voting securities. See Note 3 “Significant Agreements and Related Parties”. |
| ^^ | As defined in the Investment Company Act of 1940, the investment is deemed to be a “controlled affiliated person” of the Company because the Company owns, either directly or indirectly, 25% or more of the portfolio company’s outstanding voting securities or has the power to exercise control over management or policies of such portfolio company. See Note 3 “Significant Agreements and Related Parties”. |
The accompanying notes are part of these consolidated financial statements.
103
Goldman Sachs BDC, Inc.
Consolidated Schedule of Investments as of December 31, 2015 (continued)
(in thousands, except share and per share amounts)
| (1) | Assets are pledged as collateral for the Revolving Credit Facility. See Note 6 “Debt”. |
| (2) | Security exempt from registration pursuant to Rule 144A under the Securities Act of 1933. These securities may be sold in certain transactions (normally to qualified institutional buyers) and remain exempt from registration. As of December 31, 2015, the aggregate fair value of these securities is $97,141 or 14.11% of the Company’s net assets. |
| (3) | The investment is not a qualifying asset under Section 55(a) of the Investment Company Act of 1940. The Company may not acquire any non-qualifying asset unless, at the time of acquisition is made, qualifying assets represent at least 70% of the Company’s total assets. |
| (4) | Position or portion thereof is an unfunded loan commitment, and no interest is being earned on the unfunded portion. The unfunded loan commitment may be subject to a commitment termination date that may expire prior to the maturity date stated. See Note 7 “Commitments and Contingencies”. |
| (5) | The negative cost is the result of the capitalized discount being greater than the principal amount outstanding on the loan. The negative fair value is the result of the capitalized discount on the loan. |
| (6) | In addition to the interest earned based on the stated rate of this loan, the Company may be entitled to receive additional interest as a result of its arrangement with other lenders in a syndication. |
| (7) | In addition, the Company holds 3,745,909 shares of voting securities in an affiliated entity with zero cost and zero value. |
| (8) | Non-income producing security. |
| (9) | In addition, the Company holds 972,919 shares of voting securities in an affiliated entity with zero cost and zero value. |
| (10) | The rate shown is the annualized seven-day yield as of December 31, 2015. |
F – Federal Funds Rate (which as of December 31, 2015 was 0.25%)
L – LIBOR
PIK – Payment-In-Kind
The accompanying notes are part of these consolidated financial statements.
104
Notes to the Consolidated Financial Statements
(in thousands, except share and per share amounts)
| 1. ORGANIZATION |
Goldman Sachs BDC, Inc. (the “Company,” which term refers to either Goldman Sachs BDC, Inc. or Goldman Sachs BDC, Inc. together with its consolidated subsidiary, as the context may require) was initially established as Goldman Sachs Liberty Harbor Capital, LLC, a single member Delaware limited liability company (“SMLLC”), on September 26, 2012 and commenced operations on November 15, 2012 with the Goldman Sachs Group, Inc. (“Group Inc.”) as its sole member. On March 29, 2013, the Company elected to be regulated as a business development company (“BDC”) under the Investment Company Act of 1940, as amended (the “Investment Company Act”). Effective April 1, 2013, the Company converted from a SMLLC to a Delaware corporation (the “Conversion”). In addition, the Company has elected to be treated as a regulated investment company (“RIC”) under Subchapter M of the Internal Revenue Code of 1986, as amended (the “Code”), commencing with its taxable year ended December 31, 2013.
The Company’s investment objective is to generate current income and, to a lesser extent, capital appreciation primarily through direct originations of secured debt, including first lien, unitranche, including last out portions of such loans, and second lien debt, and unsecured debt, including mezzanine debt, as well as through select equity investments.
Goldman Sachs Asset Management, L.P. (“GSAM”), a Delaware limited partnership and an affiliate of Goldman, Sachs & Co., is the investment adviser (the “Investment Adviser”) of the Company. The term “Goldman Sachs” refers to Group Inc., together with Goldman, Sachs & Co., GSAM and its other subsidiaries.
On March 23, 2015, the Company closed its initial public offering (“IPO”), issuing 6,000,000 shares of its common stock at a public offering price of $20.00 per share. Net of offering and underwriting costs, the Company received cash proceeds of $114,568. On March 18, 2015, the Company’s common stock began trading on the New York Stock Exchange (“NYSE”) under the symbol “GSBD”.
In April 2015, the Company issued a total of 900,000 shares of its common stock pursuant to the exercise of the underwriters’ over-allotment option in connection with the IPO. Net of underwriting costs, the Company received additional cash proceeds of $17,271.
The Company has formed a wholly owned subsidiary, which is structured as a Delaware limited liability company, to hold certain equity or equity-like investments in portfolio companies.
| 2. SIGNIFICANT | ACCOUNTING POLICIES |
Basis of Presentation
The Company’s functional currency is U.S. dollars and these consolidated financial statements have been prepared in that currency. The accompanying consolidated financial statements have been prepared in accordance with accounting principles generally accepted in the United States of America (“GAAP”) and pursuant to Regulation S-X. This requires the Company to make certain estimates and assumptions that may affect the amounts reported in the consolidated financial statements and accompanying notes. These consolidated financial statements reflect adjustments that in the opinion of the Company are necessary for the fair statement of the results for the periods presented. Actual results may differ from the estimates and assumptions included in the consolidated financial statements.
Certain prior period information has been reclassified to conform to the current period presentation. The reclassification has no effect on the Company’s consolidated financial position or the consolidated results of operations as previously reported.
As an investment company, the Company applies the accounting and reporting guidance in Accounting Standards Codification (“ASC”) Topic 946, “Financial Services – Investment Companies” (“ASC 946”).
105
Basis of Consolidation
As provided under ASC 946, the Company will not consolidate its investment in a company other than an investment company subsidiary or a controlled operating company whose business consists of providing services to the Company. Accordingly, the Company consolidated the financial position and results of operations of its wholly owned subsidiary. All significant intercompany transactions and balances have been eliminated in consolidation.
The Company does not consolidate its equity interest in Senior Credit Fund, LLC (the “Senior Credit Fund”). For further description of the Company’s investment in the Senior Credit Fund, see Note 4 “Investments”.
Revenue Recognition
The Company records its investment transactions on a trade date basis. Realized gains and losses are based on the specific identification method.
Interest income, adjusted for amortization of premium and accretion of discount, is recorded on an accrual basis. Discounts and premiums to par value on investments purchased are accreted and amortized, respectively, into interest income over the life of the respective investment using the effective interest method. Loan origination fees, original issue discount (“OID”) and market discounts or premiums are capitalized and amortized into interest income using the effective interest method or straight-line method, as applicable. Upon prepayment of a loan or debt security, any prepayment premiums, unamortized upfront loan origination fees and unamortized discounts are recorded as interest income. For the years ended December 31, 2016, 2015 and 2014, the Company earned $704, $1,375 and $840 in prepayment premiums, respectively, and $1,252, $1,229 and $1,247 in accelerated accretion of upfront loan origination fees and unamortized discounts, respectively.
Fees received from portfolio companies (directors’ fees, consulting fees, administrative fees, tax advisory fees and other similar compensation) are paid to the Company, unless, to the extent required by applicable law or exemptive relief, if any, therefrom, the Company only receives its allocable portion of such fees when invested in the same portfolio company as another account managed by Goldman Sachs.
Dividend income on preferred equity investments is recorded on an accrual basis to the extent that such amounts are payable by the portfolio company and are expected to be collected. Dividend income on common equity investments is recorded on the record date for private portfolio companies and on the ex-dividend date for publicly traded portfolio companies. Interest and dividend income are presented net of withholding tax, if any.
Certain investments may have contractual payment-in-kind (“PIK”) interest or dividends. PIK represents accrued interest or accumulated dividends that are added to the principal amount of the investment on the respective interest or dividend payment dates rather than being paid in cash and generally becomes due at maturity or upon being called by the issuer. PIK is recorded as interest or dividend income, as applicable. If at any point the Company believes PIK is not expected to be realized, the investment generating PIK will be placed on non-accrual status. Accrued PIK interest or dividends are generally reversed through interest or dividend income, respectively, when an investment is placed on non-accrual status.
Certain structuring fees and amendment fees are recorded as other income when earned. Administrative agent fees received by the Company are recorded as other income when the services are rendered.
Non-Accrual Investments
Loans or debt securities are placed on non-accrual status when it is probable that principal or interest will not be collected according to the contractual terms. Accrued interest generally is reversed when a loan or debt security is placed on non-accrual status. Interest payments received on non-accrual loans or debt securities may be recognized as income or applied to principal depending upon management’s judgment. Non-accrual loans and debt securities are restored to accrual status when past due principal and interest are paid and, in management’s judgment, principal and interest payments are likely to remain current. The Company may make exceptions to this treatment if a loan or debt security has sufficient collateral value and is in the process of collection. As of December 31, 2016, the Company had two investments on non-accrual status, which represented 3.8% and 1.4% of the total investments (excluding an investment in a money market fund managed by an affiliate of Group Inc. of $1) at amortized cost and at fair value, respectively. As of December 31, 2015, the Company had no investments on non-accrual status.
106
Investments
The Company carries its investments in accordance with ASC Topic 820, “Fair Value Measurements and Disclosures” (“ASC 820”), issued by the Financial Accounting Standards Board (“FASB”), which defines fair value, establishes a framework for measuring fair value and requires disclosures about fair value measurements. Fair value is generally based on quoted market prices provided by independent pricing services, broker or dealer quotations or alternative price sources. In the absence of quoted market prices, broker or dealer quotations or alternative price sources, investments are measured at fair value as determined by the board of directors (the “Board of Directors”).
Due to the inherent uncertainties of valuation, certain estimated fair values may differ significantly from the values that would have been realized had a ready market for these investments existed, and these differences could be material. See Note 5 “Fair Value Measurement”.
The Company generally invests in illiquid securities, including debt and equity investments, of middle-market companies. The Board of Directors has delegated to the Investment Adviser day-to-day responsibility for implementing and maintaining internal controls and procedures related to the valuation of the Company’s portfolio investments. Under valuation procedures adopted by the Board of Directors, market quotations are generally used to assess the value of the investments for which market quotations are readily available. The Investment Adviser obtains these market quotations from independent pricing services or at the bid prices obtained from at least two brokers or dealers, if available; otherwise from a principal market maker or a primary market dealer. To assess the continuing appropriateness of pricing sources and methodologies, the Investment Adviser regularly performs price verification procedures and issues challenges as necessary to independent pricing services or brokers, and any differences are reviewed in accordance with the valuation procedures. If the Board of Directors or Investment Adviser has a bona fide reason to believe any such market quotation does not reflect the fair value of an investment, it may independently value such investment in accordance with valuation procedures for investments for which market quotations are not readily available.
With respect to investments for which market quotations are not readily available, or for which market quotations are deemed not reflective of the fair value, the valuation procedures adopted by the Board of Directors contemplate a multi-step valuation process each quarter, as described below:
| (1) | The quarterly valuation process begins with each portfolio company or investment being initially valued by the investment professionals of the Investment Adviser responsible for the portfolio investment; |
| (2) | The Board of Directors also engages independent valuation firms (the “Independent Valuation Advisors”) to provide independent valuations of the investments for which market quotations are not readily available, or are readily available but deemed not reflective of the fair value of an investment. The Independent Valuation Advisors independently value such investments using quantitative and qualitative information provided by the investment professionals of the Investment Adviser as well as any market quotations obtained from independent pricing services, brokers, dealers or market dealers. The Independent Valuation Advisors also provide analyses to support their valuation methodology and calculations. The Independent Valuation Advisors provide an opinion on a final range of values on such investments to the Board of Directors or the Audit Committee. The Independent Valuation Advisors define fair value in accordance with ASC 820 and utilize valuation techniques including the market approach, the income approach or both. A portion of the portfolio is reviewed on a quarterly basis, and all investments in the portfolio for which market quotations are not readily available, or are readily available, but deemed not reflective of the fair value of an investment, are reviewed at least annually by an Independent Valuation Advisor; |
| (3) | The Independent Valuation Advisors’ preliminary valuations are reviewed by the Investment Adviser and the Valuation Oversight Group (“VOG”), a team that is part of the Controllers Department within the Finance Division of Goldman Sachs. The Independent Valuation Advisors’ valuation ranges are compared to the Investment Adviser’s valuations to ensure the Investment Adviser’s valuations are reasonable. VOG presents the valuations to the Private Investment Sub-Committee of the Investment Management Division Valuation Committee, which is comprised of representatives from GSAM who are independent of the investment decision making process; |
| (4) | The Investment Management Division Valuation Committee ratifies fair valuations and makes recommendations to the Audit Committee of the Board of Directors; |
107
| (5) | The Audit Committee of the Board of Directors reviews valuation information provided by the Investment Management Division Valuation Committee, the Investment Adviser and the Independent Valuation Advisors. The Audit Committee then assesses such valuation recommendations; and |
| (6) | The Board of Directors discusses the valuations and, within the meaning of the Investment Company Act, determines the fair value of the investments in good faith, based on the inputs of the Investment Adviser, the Independent Valuation Advisors and the Audit Committee. |
Money Market Funds
Investments in money market funds are valued at amortized cost, which approximates fair value. See Note 3 “Significant Agreements and Related Parties”.
Cash
Cash consists of deposits held at a custodian bank. As of December 31, 2016 and 2015, the Company held $4,565 and $22,710, respectively, in cash.
Foreign Currency Translation
Amounts denominated in foreign currencies are translated into U.S. dollars on the following basis: (i) investments and other assets and liabilities denominated in foreign currencies are translated into U.S. dollars based upon currency exchange rates effective on the date of valuation; and (ii) purchases and sales of investments and income and expense items denominated in foreign currencies are translated into U.S. dollars based upon currency exchange rates prevailing on the transaction dates.
The Company does not isolate that portion of the results of operations resulting from changes in foreign exchange rates on investments from fluctuations arising from changes in market prices of securities held. Such fluctuations are included within the net realized and unrealized gains or losses on investment transactions.
Income Taxes
The Company recognizes tax positions in its consolidated financial statements only when it is more likely than not that the position will be sustained upon examination by the relevant taxing authority based on the technical merits of the position. A position that meets this standard is measured at the largest amount of benefit that will more likely than not be realized upon settlement. The Company reports any interest expense related to income tax matters in income tax expense, and any income tax penalties under expenses in the Consolidated Statements of Operations.
The Company’s tax positions have been reviewed based on applicable statutes of limitation for tax assessments, which may vary by jurisdiction, and based on such review, the Company has concluded that no additional provision for income tax is required in the Company’s consolidated financial statements. The Company is subject to potential examination by certain taxing authorities in various jurisdictions. The Company’s tax positions are subject to ongoing interpretation of laws and regulations by taxing authorities.
Effective April 1, 2013, the Company converted from an SMLLC into a corporation for U.S. tax purposes and elected to be treated as a RIC commencing with its taxable year ended December 31, 2013. So long as the Company maintains its status as a RIC, it will generally not be subject to corporate-level U.S. federal income tax on any ordinary income or capital gains that it distributes at least annually to its stockholders as dividends. As a result, any U.S. federal income tax liability related to income earned and distributed by the Company represents obligations of the Company’s stockholders and will not be reflected in the consolidated financial statements of the Company. The Company’s conversion from an SMLLC to a RIC was considered a taxable event.
108
To maintain its status as a RIC, the Company must meet specified source-of-income and asset diversification requirements and timely distribute to its stockholders for each taxable year at least 90% of its investment company taxable income (generally, its net ordinary income plus the excess of its realized net short-term capital gains over realized net long-term capital losses, determined without regard to the dividends paid deduction). In order for the Company not to be subject to U.S. federal excise taxes, it must distribute annually an amount at least equal to the sum of (i) 98% of its net ordinary income (taking into account certain deferrals and elections) for the calendar year, (ii) 98.2% of its capital gains in excess of capital losses for the one-year period ending on October 31 of the calendar year and (iii) any net ordinary income and capital gains in excess of capital losses for preceding years that were not distributed during such years. The Company, at its discretion, may carry forward taxable income in excess of calendar year dividends and pay a 4% nondeductible U.S. federal excise tax on this income. If the Company chooses to do so, this generally would increase expenses and reduce the amount available to be distributed to stockholders. The Company will accrue excise tax on estimated undistributed taxable income as required. For the years ended December 31, 2016, 2015 and 2014, the Company accrued excise tax of $1,037, $518 and $119, respectively. As of December 31, 2016, $ 1,031 of accrued excise taxes remained payable.
Distributions
Distributions from net investment income and net realized capital gains are determined in accordance with U.S. federal income tax regulations, which may differ from those amounts determined in accordance with GAAP. The Company may pay distributions in excess of its taxable net investment income. This excess would be a tax-free return of capital in the period and reduce the stockholder’s tax basis in its shares. These book/tax differences are either temporary or permanent in nature. To the extent these differences are permanent they are charged or credited to paid-in capital in excess of par, accumulated undistributed net investment income or accumulated net realized gain (loss), as appropriate, in the period that the differences arise. Temporary and permanent differences are primarily attributable to differences in the tax treatment of certain loans and the tax characterization of income and non-deductible expenses. These differences are generally determined in conjunction with the preparation of the Company’s annual RIC tax return. Distributions to common stockholders are recorded on the ex-dividend date. The amount to be paid out as a distribution is determined by the Board of Directors each quarter and is generally based upon the earnings estimated by the Investment Adviser. The Company may pay distributions to its stockholders in a year in excess of its net ordinary income and capital gains for that year and, accordingly, a portion of such distributions may constitute a return of capital for U.S. federal income tax purposes. The Company intends to timely distribute to its stockholders substantially all of its annual taxable income for each year, except that the Company may retain certain net capital gains for reinvestment and, depending upon the level of the Company’s taxable income earned in a year, the Company may choose to carry forward taxable income for distribution in the following year and pay any applicable U.S. federal excise tax. The specific tax characteristics of the Company’s distributions will be reported to stockholders after the end of the calendar year. All distributions will be subject to available funds, and no assurance can be given that the Company will be able to declare such distributions in future periods.
The Company has adopted a dividend reinvestment plan that provides for reinvestment of all cash distributions declared by the Board of Directors unless a stockholder elects to “opt out” of the plan. As a result, if the Board of Directors declares a cash distribution, then the stockholders who have not “opted out” of the dividend reinvestment plan will have their cash distributions automatically reinvested in additional shares of common stock, rather than receiving the cash distribution. Stockholders who receive distributions in the form of shares of common stock will generally be subject to the same U.S. federal, state and local tax consequences as if they received cash distributions and, for this purpose, stockholders receiving distributions in the form of stock will generally be treated as receiving distributions equal to the fair market value of the stock received through the plan; however, since their cash distributions will be reinvested, those stockholders will not receive cash with which to pay any applicable taxes. Due to regulatory considerations, Group Inc. has opted out of the dividend reinvestment plan, and Goldman, Sachs & Co. has opted out of the dividend reinvestment plan in respect of shares of the Company’s common stock acquired through its 10b5-1 plan. See Note 3 “Significant Agreements and Related Parties”.
Deferred Financing and Debt Issuance Costs
Deferred financing and debt issuance costs consist of fees and expenses paid in connection with the closing of the Revolving Credit Facility and debt offering of convertible notes (“Convertible Notes”). These costs are amortized using the straight-line method over the respective term of the Revolving Credit Facility and Convertible Notes. Deferred financing costs related to the Revolving Credit Facility are presented separately as an asset on the Company’s Consolidated Statements of Assets and Liabilities. Deferred debt issuance costs related to the Convertible Notes are presented net against the outstanding debt balance on the Consolidated Statements of Assets and Liabilities.
109
Deferred Offering Costs
The Company records expenses related to registration statement filings and applicable offering costs as deferred offering costs. To the extent such expenses relate to equity offerings, these expenses are charged as a reduction of capital upon each such offering.
New Accounting Pronouncements
In April 2015, the FASB issued Accounting Standards Update (“ASU”) 2015-03, “Simplifying the Presentation of Debt Issuance Costs.” ASU 2015-03 requires that debt issuance costs be presented as a direct deduction from the carrying amount of the related debt liability, consistent with the presentation of debt discounts. Upon adoption, the standard requires prior period financial statements to be retrospectively adjusted. Prior to the issuance of ASU 2015-03, debt issuance costs were required to be presented as deferred assets, separate from the related debt liability. ASU 2015-03 does not change the recognition and measurement requirements for debt issuance costs. ASU 2015-03 is effective for financial statements issued for fiscal years beginning after December 15, 2015, and interim periods within those fiscal years, with early adoption permitted. The Company has adopted this standard effective January 1, 2016.
| 3. SIGNIFICANT | AGREEMENTS AND RELATED PARTIES |
Investment Management Agreement
The Company has entered into an investment management agreement (as amended and restated as of January 1, 2015, the “Investment Management Agreement”) with the Investment Adviser, pursuant to which the Investment Adviser manages the Company’s investment program and related activities.
Management Fee
The Company pays the Investment Adviser a management fee (the “Management Fee”), accrued and payable quarterly in arrears. The Management Fee is calculated at an annual rate of 1.50% (0.375% per quarter) of the average value of the Company’s gross assets (excluding cash or cash equivalents (such as investments in money market funds), but including assets purchased with borrowed amounts) at the end of each of the two most recently completed calendar quarters (and, in the case of our first quarter, our gross assets as of such quarter-end). The Management Fee for any partial quarter will be appropriately prorated.
For the years ended December 31, 2016, 2015 and 2014, Management Fees charged amounted to $17,012, $15,436 and $10,069, respectively. As of December 31, 2016, $4,406 remained payable.
Incentive Fee
The incentive fee (the “Incentive Fee”) consists of two components that are determined independent of each other, with the result that one component may be payable even if the other is not. Effective as of January 1, 2015, the Incentive Fee is calculated as follows:
A portion of the Incentive Fee is based on income and a portion is based on capital gains, each as described below. The Investment Adviser is entitled to receive the Incentive Fee based on income if Ordinary Income (as defined below) exceeds a quarterly “hurdle rate” of 1.75%. For this purpose, the hurdle is computed by reference to the Company’s net asset value (“NAV”) and does not take into account changes in the market price of the Company’s common stock.
Beginning with the calendar quarter that commenced on January 1, 2015, the Incentive Fee based on income is determined and paid quarterly in arrears at the end of each calendar quarter by reference to the Company’s aggregate net investment income, as adjusted as described below, from the calendar quarter then ending and the eleven preceding calendar quarters (or if shorter, the number of quarters that have occurred since January 1, 2015) (such period the “Trailing Twelve Quarters”). The Incentive Fee based on capital gains is determined and paid annually in arrears at the end of each calendar year by reference to an “Annual Period,” which means the period beginning on January 1 of each calendar year and ending on December 31 of such calendar year or, in the case of the first and last year, the appropriate portion thereof.
110
The hurdle amount for the Incentive Fee based on income is determined on a quarterly basis and is equal to 1.75% multiplied by the Company’s NAV at the beginning of each applicable calendar quarter comprising the relevant Trailing Twelve Quarters. The hurdle amount is calculated after making appropriate adjustments for subscriptions (which includes all of the Company’s issuances of shares of its common stock, including issuances pursuant to its dividend reinvestment plan) and distributions that occurred during the relevant Trailing Twelve Quarters. The Incentive Fee for any partial period will be appropriately prorated.
i. Quarterly Incentive Fee Based on Income
For the portion of the Incentive Fee based on income, the Company pays the Investment Adviser a quarterly Incentive Fee based on the amount by which (A) aggregate net investment income (“Ordinary Income”) in respect of the relevant Trailing Twelve Quarters exceeds (B) the hurdle amount for such Trailing Twelve Quarters. The amount of the excess of (A) over (B) described in this paragraph for such Trailing Twelve Quarters is referred to as the “Excess Income Amount”. Ordinary Income is net of all fees and expenses, including the Management Fee but excluding any Incentive Fee.
The Incentive Fee based on income for each quarter is determined as follows:
| • | No Incentive Fee based on income is payable to the Investment Adviser for any calendar quarter for which there is no Excess Income Amount; |
| • | 100% of the Ordinary Income, if any, that exceeds the hurdle amount, but is less than or equal to an amount, referred to as the “Catch-up Amount,” determined as the sum of 2.1875% multiplied by the Company’s NAV at the beginning of each applicable calendar quarter comprising the relevant Trailing Twelve Quarters is included in the calculation of the Incentive Fee based on income; and |
| • | 20% of the Ordinary Income that exceeds the Catch-up Amount is included in the calculation of the Incentive Fee based on income. |
The amount of the Incentive Fee based on income that is paid to the Investment Adviser for a particular quarter equals the excess of the Incentive Fee so calculated minus the aggregate Incentive Fees based on income that were paid in respect of the first eleven calendar quarters (or the portion thereof) included in the relevant Trailing Twelve Quarters but not in excess of the Incentive Fee Cap (as described below).
The Incentive Fee based on income that is paid to the Investment Adviser for a particular quarter is subject to a cap (the “Incentive Fee Cap”). The Incentive Fee Cap for any quarter is an amount equal to (a) 20% of the Cumulative Net Return (as defined below) during the relevant Trailing Twelve Quarters minus (b) the aggregate Incentive Fees based on income that were paid in respect of the first eleven calendar quarters (or the portion thereof) included in the relevant Trailing Twelve Quarters.
“Cumulative Net Return” means (x) the Ordinary Income in respect of the relevant Trailing Twelve Quarters minus (y) any Net Capital Loss, if any, in respect of the relevant Trailing Twelve Quarters. If, in any quarter, the Incentive Fee Cap is zero or a negative value, the Company pays no Incentive Fee based on income to the Investment Adviser for such quarter. If, in any quarter, the Incentive Fee Cap for such quarter is a positive value but is less than the Incentive Fee based on income that is payable to the Investment Adviser for such quarter (before giving effect to the Incentive Fee Cap) calculated as described above, the Company pays an Incentive Fee based on income to the Investment Adviser equal to the Incentive Fee Cap for such quarter. If, in any quarter, the Incentive Fee Cap for such quarter is equal to or greater than the Incentive Fee based on income that is payable to the Investment Adviser for such quarter (before giving effect to the Incentive Fee Cap) calculated as described above, the Company pays an Incentive Fee based on income to the Investment Adviser equal to the Incentive Fee calculated as described above for such quarter without regard to the Incentive Fee Cap.
“Net Capital Loss” in respect of a particular period means the difference, if positive, between (i) aggregate capital losses, whether realized or unrealized, in such period and (ii) aggregate capital gains, whether realized or unrealized, in such period.
111
ii. Annual Incentive Fee Based on Capital Gains.
The portion of the Incentive Fee based on capital gains is calculated on an annual basis. For each Annual Period, the Company pays the Investment Adviser an amount equal to (A) 20% of the difference, if positive, of the sum of the Company’s aggregate realized capital gains, if any, computed net of the Company’s aggregate realized capital losses, if any, and the Company’s aggregate unrealized capital depreciation, in each case from April 1, 2013 until the end of such Annual Period minus (B) the cumulative amount of Incentive Fees based on capital gains previously paid to the Investment Adviser from April 1, 2013. For the avoidance of doubt, unrealized capital appreciation is excluded from the calculation in clause (A) above.
The Company accrues, but does not pay, a portion of the Incentive Fee based on capital gains with respect to net unrealized appreciation. Under GAAP, the Company is required to accrue an Incentive Fee based on capital gains that includes net realized capital gains and losses and net unrealized capital appreciation and depreciation on investments held at the end of each period. In calculating the accrual for the Incentive Fee based on capital gains, the Company considers the cumulative aggregate unrealized capital appreciation in the calculation, since an Incentive Fee based on capital gains would be payable if such unrealized capital appreciation were realized, even though such unrealized capital appreciation is not permitted to be considered in calculating the fee payable under the Investment Management Agreement. This accrual is calculated using the aggregate cumulative realized capital gains and losses and aggregate cumulative unrealized capital appreciation or depreciation. If such amount is positive at the end of a period, then the Company records a capital gains incentive fee equal to 20% of such amount, minus the aggregate amount of actual Incentive Fees based on capital gains paid in all prior periods. If such amount is negative, then there is no accrual for such period. There can be no assurance that such unrealized capital appreciation will be realized in the future.
For the years ended December 31, 2016 and 2015, the Company incurred Incentive Fees based on income of $10,422 and $11,786, respectively. As of December 31, 2016, $1,474 remained payable. For the years ended December 31, 2016 and 2015, the Company did not accrue any Incentive Fees based on capital gains.
Between April 1, 2013 and January 1, 2015, the Incentive Fee was calculated in two parts as follows:
Quarterly Incentive Fees Based on Income. The Company accrued monthly and paid the Investment Adviser a quarterly Incentive Fee based on the amount by which (A) aggregate net investment income in respect of the relevant trailing four quarters (“Ordinary Income”) less the amount of any net realized and unrealized capital loss (“Adjusted Ordinary Income”) exceeded (B) the quarterly hurdle of 1.75% (7% annualized) of the Company’s NAV at the beginning of the trailing four quarters after making appropriate adjustments for subscriptions and distributions (“Adjusted NAV”). The trailing four quarter period was the Company’s current quarter and the three preceding quarters or the appropriate portion in the Company’s first and last year. The amount of the excess of (A) over (B) was referred to as the “Excess Income Amount”. Net investment income was net of all fees and expenses, including the Management Fee, but excluding any Incentive Fee expense.
The Incentive Fee for a quarter equaled 100% of the trailing four quarters’ Excess Income Amount until the Company’s Adjusted Ordinary Income exceeded an annualized hurdle rate of 8.75% of the Company’s Adjusted NAV. Thereafter, the Incentive Fee for the quarter equaled 20% of the trailing four quarters’ remaining Excess Income Amount. The Incentive Fee paid to the Investment Adviser for a quarter equaled the excess of the calculated Incentive Fee less the cumulative amount of such Incentive Fees paid in the preceding three quarters.
Annual Incentive Fees Based on Capital Gains. Annually, the Company paid the Investment Adviser an Incentive Fee equal to (A) 20% of net realized capital gains and unrealized capital depreciation, from April 1, 2013 until the end of the year less (B) the cumulative amount of such Incentive Fees paid to the Investment Adviser from April 1, 2013.
The Incentive Fee for each annual period was limited to the amount by which the Ordinary Income (reduced by the Incentive Fee based on income for the period) plus/minus net capital gain/loss for the period exceeded the annual hurdle of 7%.
Unrealized capital appreciation was excluded from the calculation in (A) above; however, the Company, in accordance with GAAP, accrued, but did not pay, that part of the Incentive Fee relating to unrealized capital appreciation. There can be no assurance that such unrealized capital appreciation will be realized in the future.
For the year ended December 31, 2014, the Company incurred Incentive Fees based on income of $1,495. For the year ended December 31, 2014, the Company did not accrue any Incentive Fees based on capital gains.
112
Administration and Custodian Fees
The Company has entered into an administration agreement with State Street Bank and Trust Company (the “Administrator”) under which the Administrator provides various accounting and administrative services to the Company. The Company pays the Administrator fees for its services as it determines to be commercially reasonable in its sole discretion. The Company also reimburses the Administrator for all reasonable expenses. To the extent that the Administrator outsources any of its functions, the Administrator pays any compensation associated with such functions. The Administrator also serves as the Company’s custodian (the “Custodian”).
For the years ended December 31, 2016, 2015 and 2014, the Company incurred expenses for services provided by the Administrator and the Custodian of $842, $882 and $734, respectively. As of December 31, 2016, $144 remained payable.
Transfer Agent Fees
Effective May 2, 2016, the Company entered into a transfer agency and services agreement pursuant to which Computershare Trust Company, N.A. serves as the Company’s transfer agent (the “Transfer Agent”), dividend agent and registrar. From the IPO to May 1, 2016, State Street Bank and Trust Company served as the Transfer Agent and dividend agent. Prior to the IPO, Goldman, Sachs & Co. was the Transfer Agent. For the years ended December 31, 2016, 2015 and 2014, the Company incurred expenses for services provided by the Transfer Agent of $23, $92 and $122. As of December 31, 2016, $1 remained payable.
Reimbursement from Investment Adviser
The Investment Adviser has reimbursed the Company for organization and private placement offering costs in excess of $1,250. For the year ended December 31, 2016 and 2015, the Company did not incur any organization or private placement offering costs. For the year ended December 31, 2014, the Company incurred and was reimbursed for $10 of private placement offering costs.
In connection with the IPO, the Investment Adviser paid 70%, or approximately $5,040, of the sales load. In addition, in April 2015, the Investment Adviser paid 70%, or approximately $756, of the sales load related to the exercise of the underwriters’ over-allotment option.
10b5-1 Plan
Goldman, Sachs & Co. adopted a 10b5-1 plan (the “GS 10b5-1 Plan”) in accordance with Rules 10b5-1 and 10b-18 under the Securities Exchange Act of 1934, as amended (the “Exchange Act”), which provided for the purchase by Goldman, Sachs & Co. in the open market up to the lesser of (i) $25,000 in the aggregate of the Company’s common stock and (ii) such amount that would not bring its collective ownership (with Group Inc.) of the Company’s common stock over 19.9%. The GS 10b5-1 Plan expired on March 18, 2016. The GS 10b5-1 Plan required Goldman, Sachs & Co. to purchase shares of the Company’s common stock when the market price per share was below the Company’s most recently reported NAV per share (including any updates, corrections or adjustments publicly announced by the Company to any previously announced NAV per share). The purchase of shares by Goldman, Sachs & Co. pursuant to the GS 10b5-1 Plan was intended to satisfy the conditions of Rules 10b5-1 and 10b-18 under the Exchange Act, and was otherwise subject to applicable law, including Regulation M. Under the GS 10b5-1 Plan, Goldman, Sachs & Co. increased the volume of purchases made anytime the market price per share of the Company’s common stock declined below the most recently reported NAV per share, subject to volume restrictions. Purchases of the Company’s common stock by Goldman, Sachs & Co. under the GS 10b5-1 Plan may have resulted in the price of the Company’s common stock being higher than the price that otherwise might have existed in the open market. For the period January 1, 2016 through March 18, 2016, Goldman, Sachs & Co. purchased 432,638 shares of the Company’s common stock pursuant to the GS 10b5-1 Plan. For the year ended December 31, 2015, Goldman, Sachs & Co. purchased 219,716 shares of Company’s common stock pursuant to the 10b5-1 Plan.
Common Stock Repurchase Plans
In February 2015, the Company’s Board of Directors approved a common stock repurchase plan (the “Company Repurchase Plan”), which authorized the Company’s purchase of up to $35,000 of its common stock in the open market during open trading periods. No repurchases were made pursuant to the Company Repurchase Plan which expired on March 18, 2016.
113
In February 2016, the Company’s Board of Directors authorized the Company to repurchase up to $25,000 of the Company’s common stock if the stock trades below the most recently announced NAV per share (including any updates, corrections or adjustments publicly announced by the Company to any previously announced NAV per share), from March 18, 2016 to March 18, 2017, subject to certain limitations. In connection with this authorization, the Company entered into a 10b5-1 plan (the “Company 10b5-1 Plan”). The Company 10b5-1 Plan provides that purchases will be conducted on the open market on a programmatic basis in accordance with Rules 10b5-1 and 10b-18 under the Exchange Act and will otherwise be subject to applicable law, including Regulation M, which may prohibit purchases under certain circumstances. No purchases will be effected pursuant to the Company 10b5-1 Plan if such purchase would (i) cause the aggregate ownership of the Company’s outstanding common stock by Group Inc. and Goldman, Sachs & Co. to equal or exceed 25.0% (due to the reduction in outstanding shares of stock as a result of such purchase) or (ii) cause the Company’s debt/equity ratio to exceed 0.75. The Company 10b5-1 Plan took effect on March 18, 2016 (with any purchases to commence after the opening of NYSE trading on March 21, 2016) and expires on March 18, 2017.
The Company’s repurchase of its common stock under the Company 10b5-1 Plan or otherwise may result in the price of the Company’s common stock being higher than the price that otherwise might exist in the open market. For the year ended December 31, 2016, the Company did not repurchase any of its common stock pursuant to the Company 10b5-1 Plan or otherwise.
Affiliates
At December 31, 2016 and 2015, Group Inc. owned 17.85% and 16.67%, respectively, of the outstanding shares of the Company’s common stock.
The Company’s investments in affiliates for the year ended December 31, 2016, were as follows:
| Fair Value as of December 31, 2015 |
Gross Additions(4) |
Gross Reductions(5) |
Change in Unrealized Gains (Losses) |
Fair Value as of December 31, 2016 |
Dividend and Interest Income |
Other Income | ||||||||||||||||||||||
| Controlled Affiliates |
||||||||||||||||||||||||||||
| Senior Credit Fund, LLC(1) |
$ | 44,897 | $ | 31,425 | $ | – | $ | 2,072 | $ | 78,394 | $ | 6,575 | $ | 2,212 | ||||||||||||||
|
|
||||||||||||||||||||||||||||
| Total Controlled Affiliates |
$ | 44,897 | $ | 31,425 | $ | – | $ | 2,072 | $ | 78,394 | $ | 6,575 | $ | 2,212 | ||||||||||||||
|
|
||||||||||||||||||||||||||||
| Non-Controlled Affiliates |
||||||||||||||||||||||||||||
| Goldman Sachs Financial Square Government Fund(2) |
$ | 10,117 | $ | 381,895 | $ | (392,011 | ) | $ | – | $ | 1 | $ | 37 | $ | – | |||||||||||||
| CB-HDT Holdings, Inc. |
– | 15,694 | – | 2,816 | 18,510 | 18 | – | |||||||||||||||||||||
| Kawa Solar Holdings Limited |
– | 15,931 | – | (14 | ) | 15,917 | 851 | – | ||||||||||||||||||||
| Prairie Provident Resources, Inc.(3) |
4,048 | – | – | (1,870 | ) | 2,178 | – | – | ||||||||||||||||||||
| NTS Communications, Inc. |
– | 42,929 | – | 4,569 | 47,498 | 1,669 | 13 | |||||||||||||||||||||
|
|
||||||||||||||||||||||||||||
| Total Non-Controlled Affiliates |
$ | 14,165 | $ | 456,449 | $ | (392,011 | ) | $ | 5,501 | $ | 84,104 | $ | 2,575 | $ | 13 | |||||||||||||
|
|
||||||||||||||||||||||||||||
| Total Affiliates |
$ | 59,062 | $ | 487,874 | $ | (392,011 | ) | $ | 7,573 | $ | 162,498 | $ | 9,150 | $ | 2,225 | |||||||||||||
|
|
||||||||||||||||||||||||||||
| (1) | Together with The Regents of the University of California (“Cal Regents”, and collectively with the Company, the “Members”), the Company co-invests through the Senior Credit Fund. Although the Company owns more than 25% of the voting securities of the Senior Credit Fund, the Company does not believe that it has control over the Senior Credit Fund (other than for purposes of the Investment Company Act). See Note 4 “Investments”. |
| (2) | Fund advised by an affiliate of Goldman Sachs. |
| (3) | Formerly known as Lone Pine Resources CDA, Ltd. |
| (4) | Gross additions may include increases in the cost basis of investments resulting from new portfolio investments, PIK interest or dividends, the accretion of discounts, the exchange of one or more existing securities for one or more new securities and the movement of an existing portfolio company into this category from a different category. |
| (5) | Gross reductions may include decreases in the cost basis of investments resulting from principal collections related to investment repayments or sales, the exchange of one or more existing securities for one or more new securities and the movement of an existing portfolio company out of this category into a different category. |
114
The Company’s investments in affiliates for the year ended December 31, 2015 were as follows:
| Fair Value as of December 31, 2014 |
Gross Additions(3) |
Gross Reductions(4) |
Change in Unrealized Gains (Losses) |
Fair Value as of December 31, 2015 |
Dividend Income |
Other Income | ||||||||||||||||||||||
| Controlled Affiliates |
||||||||||||||||||||||||||||
| Senior Credit Fund LLC(1) |
$ | 24,627 | $ | 21,167 | $ | – | $ | (897 | ) | $ | 44,897 | $ | 3,992 | $ | 681 | |||||||||||||
|
|
||||||||||||||||||||||||||||
| Total Controlled Affiliates |
$ | 24,627 | $ | 21,167 | $ | – | $ | (897 | ) | $ | 44,897 | $ | 3,992 | $ | 681 | |||||||||||||
|
|
||||||||||||||||||||||||||||
| Non-Controlled Affiliates |
||||||||||||||||||||||||||||
| Goldman Sachs Financial Square Government Fund(2) |
$ | 29,568 | $ | 397,861 | $ | (417,312 | ) | $ | – | $ | 10,117 | $ | 3 | $ | – | |||||||||||||
| Lone Pine Resources CDA, Ltd. (Preferred Stock) |
5,946 | – | – | (1,898 | ) | 4,048 | – | – | ||||||||||||||||||||
| Lone Pine Resources CDA, Ltd. (Common Stock) |
632 | – | – | (632 | ) | – | – | – | ||||||||||||||||||||
|
|
||||||||||||||||||||||||||||
| Total Non-Controlled Affiliates |
$ | 36,146 | $ | 397,861 | $ | (417,312 | ) | $ | (2,530 | ) | $ | 14,165 | $ | 3 | $ | – | ||||||||||||
|
|
||||||||||||||||||||||||||||
| Total Affiliates |
$ | 60,773 | $ | 419,028 | $ | (417,312 | ) | $ | (3,427 | ) | $ | 59,062 | $ | 3,995 | $ | 681 | ||||||||||||
|
|
||||||||||||||||||||||||||||
| (1) | Together with Cal Regents, the Company co-invests through the Senior Credit Fund. Although the Company owns more than 25% of the voting securities of the Senior Credit Fund, the Company does not believe that it has control over the Senior Credit Fund (other than for purposes of the Investment Company Act). See Note 4 “Investments”. |
| (2) | Fund advised by an affiliate of Goldman Sachs. |
| (3) | Gross additions may include increases in the cost basis of investments resulting from new portfolio investments, PIK interest or dividends, the accretion of discounts, the exchange of one or more existing securities for one or more new securities and the movement of an existing portfolio company into this category from a different category. |
| (4) | Gross reductions may include decreases in the cost basis of investments resulting from principal collections related to investment repayments or sales, the exchange of one or more existing securities for one or more new securities and the movement of an existing portfolio company out of this category into a different category. |
| 4. | INVESTMENTS |
As of the dates indicated, the Company’s investments (excluding an investment in a money market fund managed by an affiliate of Group Inc. of $1 and $10,117, respectively) consisted of the following:
| December 31, 2016 | December 31, 2015 | |||||||||||||||
| Investment Type | Cost | Fair Value | Cost | Fair Value | ||||||||||||
| 1st Lien/Senior Secured Debt |
$ | 436,896 | $ | 421,026 | $ | 425,536 | $ | 420,098 | ||||||||
| 1st Lien/Last-Out Unitranche |
329,455 | 310,254 | 308,108 | 305,727 | ||||||||||||
| 2nd Lien/Senior Secured Debt |
352,696 | 336,178 | 312,831 | 285,470 | ||||||||||||
| Unsecured Debt |
3,115 | 3,115 | – | – | ||||||||||||
| Preferred Stock |
11,123 | 11,833 | 25,615 | 24,872 | ||||||||||||
| Common Stock |
11,633 | 6,490 | 4,446 | – | ||||||||||||
| Investment Funds & Vehicles(1) |
77,592 | 78,394 | 46,167 | 44,897 | ||||||||||||
|
|
||||||||||||||||
| Total Investments |
$ | 1,222,510 | $ | 1,167,290 | $ | 1,122,703 | $ | 1,081,064 | ||||||||
|
|
||||||||||||||||
| (1) | Includes equity investments in the Senior Credit Fund. |
115
As of the dates indicated, the industry composition of the Company’s portfolio at fair value was as follows:
| Industry |
December 31, 2016 | December 31, 2015 | ||||||
| Software |
9.8 | % | 3.2 | % | ||||
| Internet Software & Services |
8.3 | 9.1 | ||||||
| Diversified Telecommunication Services |
8.0 | 6.4 | ||||||
| Investment Funds & Vehicles |
6.7 | 4.2 | ||||||
| Building Products |
6.4 | 3.1 | ||||||
| Health Care Technology |
6.0 | 6.5 | ||||||
| Distributors |
5.1 | – | ||||||
| Real Estate Management & Development |
4.9 | 7.8 | ||||||
| Professional Services |
4.8 | 6.3 | ||||||
| Electronic Equipment, Instruments & Components |
4.8 | 6.1 | ||||||
| Health Care Equipment & Supplies |
4.7 | 2.9 | ||||||
| Air Freight & Logistics |
3.8 | 4.1 | ||||||
| Media |
3.7 | 4.2 | ||||||
| Health Care Providers & Services |
3.2 | 3.7 | ||||||
| Machinery |
3.1 | 3.4 | ||||||
| Aerospace & Defense |
3.1 | 4.1 | ||||||
| Specialty Retail |
2.6 | 2.8 | ||||||
| Household Products |
2.5 | 2.5 | ||||||
| Commercial Services & Supplies |
1.7 | 3.2 | ||||||
| Auto Components |
1.7 | 1.8 | ||||||
| Construction & Engineering |
1.4 | 1.4 | ||||||
| Computers & Peripherals |
1.0 | 1.2 | ||||||
| Food Products |
1.0 | 0.8 | ||||||
| Leisure Equipment & Products |
0.9 | 3.5 | ||||||
| Energy Equipment & Services |
0.6 | 1.5 | ||||||
| Oil, Gas & Consumable Fuels |
0.2 | 2.5 | ||||||
| Diversified Financial Services |
– | 1.8 | ||||||
| Marine |
– | 1.9 | ||||||
|
|
||||||||
| Total |
100.0 | % | 100.0 | % | ||||
|
|
||||||||
As of the dates indicated, the geographic composition of the Company’s portfolio at fair value was as follows:
| Geographic | December 31, 2016 | December 31, 2015 | ||||||
| United States |
98.5 | % | 98.2 | % | ||||
| Germany |
1.3 | 1.4 | ||||||
| Canada |
0.2 | 0.4 | ||||||
|
|
||||||||
| Total |
100.0 | % | 100.0 | % | ||||
|
|
||||||||
Senior Credit Fund, LLC
The Senior Credit Fund, an unconsolidated Delaware limited liability company, was formed on May 7, 2014 and commenced operations on October 1, 2014. The Company co-invests with Cal Regents through the Senior Credit Fund. The Senior Credit Fund’s principal purpose is to make investments, either directly or indirectly through its wholly owned subsidiary, Senior Credit Fund SPV I, LLC (“SPV I”), primarily in senior secured loans to middle-market companies. Each of the Company and Cal Regents has a 50% economic ownership in the Senior Credit Fund and each has subscribed to fund $100,000. Except under certain circumstances, contributions to the Senior Credit Fund cannot be redeemed. The Senior Credit Fund is managed by a six member board of managers, on which the Company and Cal Regents have equal representation. Investment decisions generally must be unanimously approved by a quorum of the board of managers.
The Senior Credit Fund had entered into a revolving credit facility (the “Subscription Facility”) with Versailles Assets LLC, as lender, and Natixis, New York Branch (“Natixis”), as the facility agent. The Subscription Facility provided for borrowings in an aggregate amount up to $50,000 on a committed basis. The Senior Credit Fund’s obligations to Natixis and the lenders were secured by the unfunded subscriptions of the Company and Cal Regents, proceeds of such subscriptions and certain other assets. On September 30, 2016, the Senior Credit Fund paid in full all loans outstanding and the Subscription Facility was terminated. In connection thereof, the related documents governing the Subscription Facility were also terminated. As of December 31, 2016 and 2015, the Senior Credit Fund’s outstanding borrowings under the Subscription Facility were $0 and $45,700, respectively.
116
SPV I has entered into an amended and restated credit facility (as amended, the “Asset Based Facility”), which, as of December 19, 2016, consisted of a revolving credit facility (the “SPV I Revolving Credit Facility”), a term loan facility (the “SPV I Term Loan Facility”) and a Class B loan facility (the “SPV I Class B Facility”), with various lenders. For the Asset Based Facility, Natixis serves as the facility agent, and State Street Bank and Trust Company serves as the collateral agent. The Asset Based Facility includes a maximum borrowing capacity of $400,000. The SPV I Revolving Credit Facility provides for borrowings in an aggregate amount up to $97,500 on a committed basis as of December 31, 2016, and was subsequently increased to $120,000 in January 2017. As of December 31, 2016, the SPV I Term Loan Facility consisted of a $240,000 fully drawn term loan and the SPV I Class B Facility consisted of a $40,000 fully drawn Class B loan. As of December 31, 2016 and 2015, the SPV I’s outstanding borrowings under the Asset Based Facility were $303,250 and $139,850, respectively.
As of December 31, 2016 and 2015, the Company and Cal Regents had subscribed to fund and contributed the following to the Senior Credit Fund:.
| December 31, 2016 | December 31, 2015 | |||||||||||||||
| Member |
Subscribed to fund | Contributed | Subscribed to fund | Contributed | ||||||||||||
| Company |
$ | 100,000 | $ | 77,592 | $ | 100,000 | $ | 46,167 | ||||||||
| Cal Regents |
100,000 | 77,592 | 100,000 | 46,167 | ||||||||||||
|
|
||||||||||||||||
| Total |
$ | 200,000 | $ | 155,184 | $ | 200,000 | $ | 92,334 | ||||||||
|
|
||||||||||||||||
As of December 31, 2016 and 2015, the Senior Credit Fund had total investments in senior secured debt at fair value of $479,526 and $285,586, respectively. As of December 31, 2016 and 2015, the Senior Credit Fund had no investments on non-accrual status. As of December 31, 2016 and 2015, the Senior Credit Fund had an investment in a money market fund managed by an affiliate of Group Inc. with a total fair value of $1,942 and $21,830, respectively. In addition, as of December 31, 2016, the Senior Credit Fund had three unfunded commitments totaling $6,296 and no unfunded commitments as of December 31, 2015.
In October 2014, the Senior Credit Fund purchased seven investments at fair value, as prescribed under the valuation procedures in Note 2 “Significant Accounting Policies”, from the Company for an aggregate purchase price of approximately $97,640. In connection with the transaction, the Company recorded a realized gain of $2.
Below is a summary of the Senior Credit Fund’s portfolio, excluding an investment in a money market fund managed by an affiliate of Group Inc., followed by a listing of the individual loans in the Senior Credit Fund’s portfolio as of December 31, 2016 and 2015:
| As of | ||||||||
| December 31, 2016 | December 31, 2015 | |||||||
| Total senior secured debt(1) |
$ | 489,657 | $ | 291,512 | ||||
| Weighted average current interest rate on senior secured debt(2) |
6.6 | % | 6.3 | % | ||||
| Number of borrowers in the Senior Credit Fund |
37 | 22 | ||||||
| Largest loan to a single borrower(1) |
$ | 24,618 | $ | 23,820 | ||||
| (1) | At par amount. |
| (2) | Computed as the (a) annual stated interest rate on accruing senior secured debt, divided by (b) total senior secured debt at par amount. |
117
Senior Credit Fund Portfolio as of December 31, 2016
| Portfolio Company | Industry | Interest | Maturity | Par Amount |
Cost | Fair Value |
||||||||||||
| 1st Lien/Senior Secured Debt |
| |||||||||||||||||
| Affordable Care Holding Corp.(+++) | Health Care Providers & Services | L + 4.75% (1.00% Floor) | 10/22/2022 | $ | 4,950 | $ | 4,864 | $ | 4,950 | |||||||||
| Ansira Partners, Inc.(1) | Media | L + 6.50% (1.00% Floor) | 12/20/2022 | 8,727 | 8,640 | 8,640 | ||||||||||||
| Ansira Partners, Inc.(1)(2) | Media | L + 6.50% (1.00% Floor) | 12/20/2022 | 1,273 | – | – | ||||||||||||
| ASC Acquisition Holdings, LLC(+++)(3) | Distributors |
L + 7.50% (1.00% Floor) | 12/15/2021 | 11,250 | 11,138 | 11,137 | ||||||||||||
| ASC Acquisition Holdings, LLC(+++)(2)(3) | Distributors |
L + 7.50% (1.00% Floor) | 12/15/2021 | 3,750 | – | – | ||||||||||||
| ATX Networks Corp.(+++) | Communications Equipment | L + 6.00% (1.00% Floor) | 06/11/2021 | 16,767 | 16,607 | 16,348 | ||||||||||||
| Badger Sportswear, Inc.(+++) | Textiles, Apparel & Luxury Goods | L + 4.50% (1.00% Floor) | 09/11/2023 | 14,963 | 14,861 | 14,850 | ||||||||||||
| ConvergeOne Holdings Corporation(+++)(4) | Communications Equipment | L + 5.38% (1.00% Floor) | 06/17/2020 | 17,401 | 17,261 | 17,314 | ||||||||||||
| Crowne Group, LLC(+++) | Auto Components | L + 9.25% (1.00% Floor) | 05/26/2021 | 16,873 | 16,717 | 17,041 | ||||||||||||
| DBRS Limited(+++) | Capital Markets | L + 5.25% (1.00% Floor) | 03/04/2022 | 11,790 | 11,697 | 10,729 | ||||||||||||
| DiscoverOrg, LLC(+)(3) | Software | L + 4.25% (1.00% Floor) | 06/02/2020 | 7,147 | 7,121 | 7,075 | ||||||||||||
| Edgewood Partners Insurance Center(+) | Insurance | L + 6.00% (1.00% Floor) | 03/16/2023 | 15,880 | 15,589 | 15,920 | ||||||||||||
| Explorer Holdings, Inc.(+++) | Health Care Technology | L + 5.00% (1.00% Floor) | 05/02/2023 | 9,950 | 9,855 | 10,025 | ||||||||||||
| GK Holdings, Inc.(+++) | IT Services | L + 5.50% (1.00% Floor) | 01/20/2021 | 17,640 | 17,555 | 17,464 | ||||||||||||
| HC Group Holdings III, Inc.(+++) | Health Care Providers & Services | L + 5.00% (1.00% Floor) | 04/07/2022 | 8,888 | 8,852 | 8,510 | ||||||||||||
| Help/Systems, LLC(+++) | Software | L + 5.25% (1.00% Floor) | 10/08/2021 | 17,955 | 17,407 | 17,910 | ||||||||||||
| Imagine! Print Solutions, Inc.(+++) | Commercial Services & Supplies | L + 6.00% (1.00% Floor) | 03/30/2022 | 4,965 | 4,909 | 5,039 | ||||||||||||
| Jill Acquisition LLC(+++) | Textiles, Apparel & Luxury Goods | L + 5.00% (1.00% Floor) | 05/08/2022 | 15,805 | 15,700 | 15,746 | ||||||||||||
| Lattice Semiconductor Corporation(+++) | Semiconductors & Semiconductor Equipment | L + 4.25% (1.00% Floor) | 03/10/2021 | 11,986 | 11,803 | 11,956 | ||||||||||||
| Liquidnet Holdings, Inc.(+)(4) | Capital Markets | L + 6.75% (1.00% Floor) | 05/22/2019 | 24,618 | 24,340 | 24,433 | ||||||||||||
| Loar Group, Inc.(++) | Aerospace & Defense | L + 4.75% (1.00% Floor) | 01/12/2022 | 9,925 | 9,684 | 9,875 | ||||||||||||
| MB Aerospace Holdings Inc.(+++) | Aerospace & Defense | L + 5.50% (1.00% Floor) | 12/15/2022 | 15,849 | 15,708 | 15,769 | ||||||||||||
| Mister Car Wash, Inc.(1) | Automobiles | L + 4.25% (1.00% Floor) | 08/20/2021 | 6,650 | 6,600 | 6,658 | ||||||||||||
| Mister Car Wash, Inc.(1)(2) | Automobiles | L + 4.25% (1.00% Floor) | 08/20/2021 | 1,333 | – | 12 | ||||||||||||
| Netsmart Technologies, Inc.(+++) | Health Care Technology | L + 4.50% (1.00% Floor) | 04/19/2023 | 18,937 | 18,878 | 18,997 | ||||||||||||
| Oasis Outsourcing Holdings, Inc.(+) | Diversified Financial Services | L + 4.75% (1.00% Floor) | 12/27/2021 | 3,979 | 3,970 | 3,989 | ||||||||||||
| PGX Holdings, Inc.(+++)(4) | Professional Services | L + 5.25% (1.00% Floor) | 09/29/2020 | 13,578 | 13,510 | 13,552 | ||||||||||||
| Playcore Wisconsin, Inc.(+++) | Leisure Equipment & Products | L + 4.25% (1.00% Floor) | 05/29/2020 | 18,000 | 17,820 | 17,820 | ||||||||||||
| Pomeroy Group LLC(++++) | IT Services | L + 6.00% (1.00% Floor) | 11/30/2021 | 15,920 | 15,472 | 15,760 | ||||||||||||
| Precyse Acquisition Corp.(+) | Health Care Technology | L + 5.50% (1.00% Floor) | 10/20/2022 | 7,469 | 7,369 | 7,553 | ||||||||||||
| Professional Physical Therapy(+++) | Health Care Providers & Services | L + 6.00% (1.00% Floor) | 12/16/2022 | 10,500 | 10,395 | 10,395 | ||||||||||||
| RealD, Inc.(++) | Media | L + 7.50% (1.00% Floor) | 03/22/2021 | 16,873 | 16,719 | 16,704 | ||||||||||||
| Research Now Group, Inc.(+++) | Professional Services | L + 4.50% (1.00% Floor) | 03/18/2021 | 9,592 | 9,476 | 9,448 | ||||||||||||
| SciQuest, Inc.(++++) | Internet Software & Services | L + 4.75% (1.00% Floor) | 07/28/2023 | 13,930 | 13,863 | 13,860 | ||||||||||||
| Smarte Carte, Inc.(+++) | Air Freight & Logistics | L + 5.50% (1.00% Floor) | 08/30/2021 | 11,213 | 11,107 | 11,100 | ||||||||||||
| Tronair Parent Inc.(+++) | Air Freight & Logistics | L + 4.75% (1.00% Floor) | 09/08/2023 | 13,860 | 13,762 | 13,721 | ||||||||||||
| U.S. Acute Care Solutions, LLC(1) | Health Care Providers & Services | L + 5.00% (1.00% Floor) | 05/14/2021 | 13,000 | 12,870 | 12,870 | ||||||||||||
| Veresen Midstream Limited Partnership(+++) | Energy Equipment & Services | L + 4.25% (1.00% Floor) | 03/31/2022 | 10,808 | 10,614 | 10,871 | ||||||||||||
| Zep Inc.(+++) | Chemicals | L + 4.00% (1.00% Floor) | 06/27/2022 | 11,901 | 11,879 | 11,961 | ||||||||||||
|
|
|
|
|
|||||||||||||||
| Total 1st Lien/Senior Secured Debt |
|
454,612 | 456,002 | |||||||||||||||
| 1st Lien/First-Out Unitranche |
| |||||||||||||||||
| Infogix, Inc.(+++) | Software | L + 4.75% (1.00% Floor) | 12/31/2021 | 9,762 | 9,676 | 9,664 | ||||||||||||
|
|
|
|
|
|||||||||||||||
| Total 1st Lien/First-Out Unitranche |
|
9,676 | 9,664 | |||||||||||||||
118
| Portfolio Company | Industry | Interest | Maturity | Par Amount |
Cost | Fair Value | ||||||||||||
| 2nd Lien/Senior Secured Debt | ||||||||||||||||||
| DiscoverOrg, LLC(+++)(3) | Software | L + 9.00% (1.00% Floor) | 02/10/2022 | $ | 8,000 | $ | 7,858 | $ | 7,860 | |||||||||
| GK Holdings, Inc.(+++) | IT Services | L + 9.50% (1.00% Floor) | 01/20/2022 | 6,000 | 5,904 | 6,000 | ||||||||||||
|
|
|
|
|
|||||||||||||||
| Total 2nd Lien/Senior Secured Debt |
|
13,762 | 13,860 | |||||||||||||||
|
|
|
|
|
|||||||||||||||
| Total Corporate Debt |
|
478,050 | 479,526 | |||||||||||||||
|
|
|
|
|
|||||||||||||||
|
Yield |
Shares | Cost | Fair Value |
|||||||||||||||
| Investments in Affiliated Money Market Fund |
||||||||||||||||||
| Goldman Sachs Financial Square Government Fund |
0.45%(5) | 1,941,599 | $ | 1,942 | $ | 1,942 | ||||||||||||
|
|
|
|
|
|||||||||||||||
| Total Investments in Affiliated Money Market Fund |
|
1,942 | 1,942 | |||||||||||||||
|
|
|
|
|
|||||||||||||||
| TOTAL INVESTMENTS |
|
$ | 479,992 | $ | 481,468 | |||||||||||||
|
|
|
|
|
|||||||||||||||
| (+) | The interest rate on these loans is subject to the greater of a LIBOR floor or 1 month LIBOR plus a base rate. The 1 month LIBOR as of December 31, 2016 was 0.77%. |
| (++) | The interest rate on these loans is subject to the greater of a LIBOR floor or 2 month LIBOR plus a base rate. The 2 month LIBOR as of December 31, 2016 was 0.82%. |
| (+++) | The interest rate on these loans is subject to the greater of a LIBOR floor or 3 month LIBOR plus a base rate. The 3 month LIBOR as of December 31, 2016 was 1.00%. |
| (++++) | The interest rate on these loans is subject to the greater of a LIBOR floor or 12 month LIBOR plus a base rate. The 12 month LIBOR as of December 31, 2016 was 1.69%. |
| (1) | Position or portion thereof unsettled as of December 31, 2016. |
| (2) | Position or portion thereof is an unfunded loan commitment, and no interest is being earned on the unfunded portion. The unfunded loan commitment may be subject to a commitment termination date, that may expire prior to the maturity date stated. |
| (3) | The Company also holds a portion of the 2nd lien/senior secured debt in this portfolio company. |
| (4) | Initial investment was purchased at fair value from the Company in October 2014. |
| (5) | The rate shown is the annualized seven-day yield as of December 31, 2016. |
L – LIBOR
Senior Credit Fund Portfolio as of December 31, 2015
| Portfolio Company | Industry | Interest | Maturity | Par Amount |
Cost | Fair Value |
||||||||||||
| 1st Lien/Senior Secured Debt |
|
|||||||||||||||||
| Affordable Care Holding Corp.(++) | Health Care Providers & Services | L + 4.75% (1.00% Floor) | 10/22/2022 | $ | 5,000 | $ | 4,901 | $ | 4,900 | |||||||||
| Aperture Group, LLC(++)(1) | Diversified Financial Services | L + 6.25% (1.00% Floor) | 08/29/2019 | 17,855 | 17,657 | 17,623 | ||||||||||||
| ATX Networks Corp.(++) | Communications Equipment | L + 6.00% (1.00% Floor) | 06/12/2021 | 14,925 | 14,785 | 14,626 | ||||||||||||
| Cengage Learning Acquisitions, Inc.(+)(1) | Diversified Consumer Services | L + 6.00% (1.00% Floor) | 03/31/2020 | 15,000 | 14,741 | 14,588 | ||||||||||||
| ConvergeOne Holdings Corporation(++)(2) | Communications Equipment | L + 5.00% (1.00% Floor) | 06/17/2020 | 14,817 | 14,745 | 14,632 | ||||||||||||
| Crowne Group, LLC(++)(2) | Auto Components | L + 5.00% (1.00% Floor) | 09/30/2020 | 14,813 | 14,695 | 14,294 | ||||||||||||
| DBRS Limited(++) | Capital Markets | L + 5.25% (1.00% Floor) | 03/04/2022 | 11,910 | 11,802 | 11,821 | ||||||||||||
| DiscoverOrg, LLC(+) | Software | L + 4.50% (1.00% Floor) | 06/02/2020 | 7,560 | 7,526 | 7,522 | ||||||||||||
| Epicor RSG US Inc.(++) | Internet Software & Services | L + 5.25% (0.75% Floor) | 06/23/2022 | 14,925 | 14,784 | 14,776 | ||||||||||||
| eResearchTechnology, Inc.(++) | Health Care Technology | L + 4.50% (1.00% Floor) | 05/08/2022 | 14,925 | 14,856 | 14,602 | ||||||||||||
| GK Holdings, Inc.(++) | IT Services | L + 5.50% (1.00% Floor) | 01/20/2021 | 17,820 | 17,719 | 17,464 | ||||||||||||
| HC Group Holdings III, Inc.(++) | Health Care Providers & Services | L + 5.00% (1.00% Floor) | 04/07/2022 | 8,978 | 8,936 | 8,910 | ||||||||||||
| Help/Systems, LLC(++) | Software | L + 5.25% (1.00% Floor) | 10/08/2021 | 15,000 | 14,410 | 14,681 | ||||||||||||
| Jill Acquisition LLC(++) | Textiles, Apparel & Luxury Goods | L + 5.00% (1.00% Floor) | 05/08/2022 | 14,963 | 14,893 | 14,588 | ||||||||||||
| Lattice Semiconductor Corporation(+++) | Semiconductors & Semiconductor Equipment | L + 4.25% (1.00% Floor) | 03/10/2021 | 12,166 | 11,944 | 11,315 | ||||||||||||
| Liquidnet Holdings, Inc.(++)(2) | Capital Markets | L + 6.75% (1.00% Floor) | 05/22/2019 | 22,481 | 22,134 | 21,694 | ||||||||||||
| MB Aerospace Holdings Inc.(1) | Aerospace & Defense | L + 5.50% (1.00% Floor) | 12/15/2022 | 12,500 | 12,375 | 12,375 | ||||||||||||
| PGX Holdings, Inc.(+++)(2) | Professional Services | L + 4.75% (1.00% Floor) | 09/29/2020 | 14,263 | 14,158 | 14,109 | ||||||||||||
| Research Now Group, Inc.(++) | Professional Services | L + 4.50% (1.00% Floor) | 03/18/2021 | 4,963 | 4,940 | 4,888 | ||||||||||||
| SkinnyPop Popcorn LLC(++)(2) | Food Products | L + 4.50% (1.00% Floor) | 07/17/2019 | 14,257 | 14,147 | 14,221 | ||||||||||||
119
| Portfolio Company | Industry | Interest | Maturity | Par Amount |
Cost | Fair Value |
||||||||||||
| Veresen Midstream Limited Partnership(++) | Energy Equipment & Services | L + 4.25% (1.00% Floor) | 03/31/2022 | $ | 10,918 | $ | 10,698 | $ | 10,699 | |||||||||
| Zep Inc.(++) | Chemicals | L + 4.75% (1.00% Floor) | 06/27/2022 | 5,473 | 5,447 | 5,438 | ||||||||||||
|
|
|
|
|
|||||||||||||||
| Total 1st Lien/Senior Secured Debt |
282,293 | 279,766 | ||||||||||||||||
| 2nd Lien/Senior Secured Debt |
|
|||||||||||||||||
| GK Holdings, Inc.(++) | IT Services | L + 9.50% (1.00% Floor) | 01/20/2022 | 6,000 | 5,891 | 5,820 | ||||||||||||
|
|
|
|
|
|||||||||||||||
| Total 2nd Lien/Senior Secured Debt |
5,891 | 5,820 | ||||||||||||||||
|
|
|
|
|
|||||||||||||||
| Total Corporate Debt |
288,184 | 285,586 | ||||||||||||||||
|
|
|
|
|
|||||||||||||||
| Yield |
Shares | Cost | Fair Value |
|||||||||||||||
| Investments in Affiliated Money Market Fund |
||||||||||||||||||
| Goldman Sachs Financial Square Government Fund |
0.19%(3) | 21,829,831 | $ | 21,830 | $ | 21,830 | ||||||||||||
|
|
|
|
|
|||||||||||||||
| Total Investments in Affiliated Money Market Fund |
21,830 | 21,830 | ||||||||||||||||
|
|
|
|
|
|||||||||||||||
| TOTAL INVESTMENTS |
$ | 310,014 | $ | 307,416 | ||||||||||||||
|
|
|
|
|
|||||||||||||||
| (+) | The interest rate on these loans is subject to a base rate plus 1 month LIBOR, which as of December 31, 2015 was 0.43%. As the interest rate is subject to a minimum LIBOR floor which was greater than the 1 month LIBOR rate at December 31, 2015, the prevailing rate in effect as of December 31, 2015 was the base rate plus the LIBOR floor. |
| (++) | The interest rate on these loans is subject to a base rate plus 3 month LIBOR, which as of December 31, 2015 was 0.61%. As the interest rate is subject to a minimum LIBOR floor which was greater than the 3 month LIBOR rate at December 31, 2015, the prevailing rate in effect as of December 31, 2015 was the base rate plus the LIBOR floor. |
| (+++) | The interest rate on these loans is subject to a base rate plus 6 month LIBOR, which as of December 31, 2015 was 0.85%. As the interest rate is subject to a minimum LIBOR floor which was greater than the 6 month LIBOR rate at December 31, 2015, the prevailing rate in effect as of December 31, 2015 was the base rate plus the LIBOR floor. |
| (1) | Position or portion thereof unsettled as of December 31, 2015. |
| (2) | Initial investment was purchased at fair value from the Company in October 2014. |
| (3) | The rate shown is the annualized seven-day yield as of December 31, 2015. |
L – LIBOR
Below is selected balance sheet information for the Senior Credit Fund as of December 31, 2016 and December 31, 2015:
| As of December 31, 2016 |
As of December 31, 2015 |
|||||||
| Selected Balance Sheet Information |
||||||||
| Total investments, at fair value |
$ | 481,468 | $ | 307,416 | ||||
| Cash and other assets |
10,930 | 7,579 | ||||||
|
|
||||||||
| Total assets |
$ | 492,398 | $ | 314,995 | ||||
|
|
||||||||
| Debt (1) |
$ | 300,574 | $ | 184,983 | ||||
| Other liabilities |
35,036 | 40,218 | ||||||
|
|
||||||||
| Total liabilities |
$ | 335,610 | $ | 225,201 | ||||
|
|
||||||||
| Members’ equity |
156,788 | 89,794 | ||||||
|
|
||||||||
| Total liabilities and members’ equity |
$ | 492,398 | $ | 314,995 | ||||
|
|
||||||||
| (1) | Net of deferred financing costs for the SPV I Term Loan Facility which were in the amount of $2,676 and $567 as of December 31, 2016 and December 31, 2015, respectively. |
120
Below is selected statements of operations information for the Senior Credit Fund for the years ended December 31, 2016, 2015 and for the period October 1, 2014 (commencement of operations) through December 31, 2014:
| For the Year Ended December 31, 2016 |
For the Year Ended December 31, 2015 |
For the period October 1, 2014 (commencement of operations) through Year Ended December 31, 2014 |
||||||||||
| Selected Statements of Operations Information: |
|
|||||||||||
| Total investment income |
$ | 25,534 | $ | 14,684 | $ | 1,698 | ||||||
| Expenses |
||||||||||||
| Interest and other debt expense |
9,101 | 5,283 | 571 | |||||||||
| Excess loan origination and structuring fees |
2,312 | 746 | — | |||||||||
| Organization expense |
— | — | 230 | |||||||||
| Professional fees |
430 | 319 | 200 | |||||||||
| Administration and custodian fees |
347 | 299 | 67 | |||||||||
| Other expenses |
103 | 44 | 28 | |||||||||
|
|
||||||||||||
| Total expenses |
12,293 | 6,691 | 1,096 | |||||||||
|
|
||||||||||||
| Total net income |
13,241 | 7,993 | 602 | |||||||||
| Net realized gain(loss) on investments |
(21 | ) | 50 | — | ||||||||
| Net change in unrealized appreciation (depreciation) on investments |
4,074 | (1,869 | ) | (729 | ) | |||||||
|
|
||||||||||||
| Net increase (decrease) in members’ equity |
$ | 17,294 | $ | 6,174 | $ | (127 | ) | |||||
|
|
||||||||||||
Loan Origination and Structuring Fees
If the loan origination and structuring fees earned by the Senior Credit Fund (including directly or indirectly through SPV I or another vehicle) during a period exceed the Senior Credit Fund’s expenses (excluding interest and other debt expenses), such excess is paid as a fee to the Member(s) responsible for the origination of the loans pro rata in accordance with the total loan origination and structuring fees earned by the Senior Credit Fund with respect to the loans originated by such Member. The loan origination and structuring fee is accrued quarterly and included in other income from controlled affiliated investments on the Consolidated Statements of Operations and paid annually. For the years ended December 31, 2016 and 2015, the Company accrued income based on loan origination and structuring fees of $2,212 and $681, respectively. There was no such income for the year ended December 31, 2014.
| 5. | FAIR VALUE MEASUREMENT |
The fair value of a financial instrument is the amount that would be received to sell an asset or would be paid to transfer a liability in an orderly transaction between market participants at the measurement date (i.e., the exit price).
The fair value hierarchy under ASC 820 prioritizes the inputs to valuation techniques used to measure fair value. The hierarchy gives the highest priority to unadjusted quoted prices in active markets for identical assets or liabilities (Level 1 measurements) and the lowest priority to unobservable inputs (Level 3 measurements). The levels used for classifying investments are not necessarily an indication of the risk associated with investing in these securities. The three levels of the fair value hierarchy are as follows:
Basis of Fair Value Measurement
Level 1 – Inputs to the valuation methodology are quoted prices available in active markets for identical instruments as of the reporting date. The types of financial instruments included in Level 1 include unrestricted securities, including equities and derivatives, listed in active markets.
Level 2 – Inputs to the valuation methodology are other than quoted prices in active markets, which are either directly or indirectly observable as of the reporting date. The types of financial instruments in this category include less liquid and restricted securities listed in active markets, securities traded in other than active markets, government and agency securities and certain over-the-counter derivatives where the fair value is based on observable inputs.
Level 3 – Inputs to the valuation methodology are unobservable and significant to overall fair value measurement. The inputs into the determination of fair value require significant management judgment or estimation. Financial instruments that are included in this category include investments in privately held entities and certain over-the-counter derivatives where the fair value is based on unobservable inputs.
121
A financial instrument’s level within the fair value hierarchy is based on the lowest level of any input that is significant to the fair value measurement. Note 2 “Significant Accounting Policies” should be read in conjunction with the information outlined below.
The table below presents the valuation techniques and the nature of significant inputs generally used in determining the fair value of Level 2 Instruments.
| Level 2 Instruments | Valuation Techniques and Significant Inputs | |
| Equity and Fixed Income | The types of instruments that trade in markets that are not considered to be active but are valued based on quoted market prices, broker or dealer quotations or alternative pricing sources with reasonable levels of price transparency include commercial paper, most government agency obligations, most corporate debt securities, certain mortgage-backed securities, certain bank loans, less liquid publicly listed equities, certain state and municipal obligations, certain money market instruments and certain loan commitments.
Valuations of Level 2 Equity and Fixed Income instruments can be verified to quoted prices, broker or dealer quotations or alternative pricing sources with reasonable levels of price transparency. Consideration is given to the nature of the quotations (e.g. indicative or firm) and the relationship of recent market activity to the prices provided from alternative pricing sources. |
The table below presents the valuation techniques and the nature of significant inputs generally used in determining the fair value of Level 3 Instruments.
| Level 3 Instruments | Valuation Techniques and Significant Inputs | |
| Bank Loans, Corporate Debt, and Other Debt Obligations | Valuations are generally based on discounted cash flow techniques, for which the significant inputs are the amount and timing of expected future cash flows, market yields and recovery assumptions. The significant inputs are generally determined based on relative value analyses, which incorporate comparisons both to credit default swaps that reference the same underlying credit risk and to other debt instruments for the same issuer for which observable prices or broker quotes are available. Other valuation methodologies are used as appropriate including market comparables, transactions in similar instruments and recovery/liquidation analysis. | |
| Equity | Recent third-party investments or pending transactions are considered to be the best evidence for any change in fair value. When these are not available, the following valuation methodologies are used, as appropriate and available: • Transactions in similar instruments; • Discounted cash flow techniques; • Third party appraisals; and • Industry multiples and public comparables. Evidence includes recent or pending reorganizations (for example, merger proposals, tender offers and debt restructurings) and significant changes in financial metrics, including: • Current financial performance as compared to projected performance; • Capitalization rates and multiples; and • Market yields implied by transactions of similar or related assets. |
122
The tables below present the ranges of significant unobservable inputs used to value the Company’s Level 3 assets and liabilities as of December 31, 2016 and 2015. These ranges represent the significant unobservable inputs that were used in the valuation of each type of instrument, but they do not represent a range of values for any one instrument. For example, the lowest yield in 1st Lien/Senior Secured is appropriate for valuing that specific debt investment, but may not be appropriate for valuing any other debt investments in this asset class. Accordingly, the ranges of inputs presented below do not represent uncertainty in, or possible ranges of, fair value measurements of the Company’s Level 3 assets and liabilities.
| Level 3 Instruments | Level 3 Assets as of December 31, 2016(1) |
Significant Unobservable Inputs by Valuation Techniques(2) |
Range(3) of Significant Unobservable Inputs
(Weighted December 31, 2016 | |||
| Bank Loans, Corporate Debt, and Other Debt Obligations | 1st Lien/Senior Secured Debt |
Discounted cash flows: |
9.1% – 20% (11.6%) | |||
| $379,181 |
• Discount Rate |
|||||
| Comparable multiples: |
2.9x – 19.5x (5.0x) | |||||
| • EV/EBITDA(5) |
||||||
| 1st Lien/Last-Out Unitranche |
Discounted cash flows: |
10.8% –15.6% (12.9%) | ||||
| $310,254 |
• Discount Rate |
|||||
| Comparable multiples: |
||||||
| • EV/EBITDA(5) |
7.7x – 13.2x (7.9x) | |||||
| 2nd Lien/Senior Secured Debt |
Discounted cash flows: |
10.7% – 48.1% (12.6%) | ||||
| $214,643 |
• Discount Rate |
|||||
| Comparable multiples: |
6.5x – 9.1x (6.8x) | |||||
| • EV/EBITDA(5) |
||||||
| Equity | Preferred Stock |
Comparable multiples: |
5.6x – 12.3x (6.3x) | |||
| $11,083 |
• EV/EBITDA(5) |
|||||
| Common Stock |
Comparable multiples: |
5.6x – 12.3x (6.3x) | ||||
| $4,312 |
• EV/EBITDA(5) |
|||||
| (1) | Included within Level 3 Assets of $977,713 is an amount of $58,240 in which the Investment Adviser did not develop the unobservable inputs (examples include single source broker quotations, third party pricing, and prior transactions). |
| (2) | The fair value of any one instrument may be determined using multiple valuation techniques. For example, market comparable and discounted cash flows may be used together to determine fair value. Therefore, the level 3 balance encompasses both of these techniques. |
| (3) | The range for an asset category consisting of a single investment represents the relevant market data considered in determining the fair value of the investment. |
| (4) | Weighted average for an asset category consisting of multiple investments is calculated by weighting the significant unobservable input by the relative fair value of the investment. Weighted average for an asset category consisting of a single investment represents the significant unobservable input used in the fair value of the investment. |
| (5) | Enterprise value of portfolio company as a multiple of earnings before interest, taxes, depreciation and amortization (“EBITDA”). |
123
| Level 3 Instruments |
Level 3 Assets as of December 31, 2015(1) |
Significant Unobservable Inputs by Valuation Techniques(2) |
Range(3) of Significant Unobservable Inputs (Weighted December 31, 2015 | |||
| Bank Loans, Corporate Debt, and Other Debt Obligations | 1st Lien/Senior Secured Debt |
Discounted cash flows: |
8.4% – 13.5% (10.9%) | |||
| $362,331 |
• Discount Rate |
|||||
|
| ||||||
| 1st Lien/Last-Out Unitranche |
Discounted cash flows: |
10.5% – 12.7% (11.8%) | ||||
| $305,727 |
• Discount Rate |
|||||
|
| ||||||
| 2nd Lien/Senior Secured Debt |
Discounted cash flows: |
2.1% – 14% (11.6%) | ||||
| $199,821 |
• Discount Rate |
|||||
| Equity | Preferred Stock |
Discounted cash flows: |
10% – 12% (11.8%) | |||
| $24,872 |
• Discount Rate |
|||||
| Comparable multiples: |
||||||
| • EV/EBITDA(5) • EV/Production(6) |
3.8x – 7.1x (4.9x) $13 – $40 ($27) | |||||
| (1) | Included within Level 3 Assets of $950,631 is an amount of $57,880 for which the Investment Adviser did not develop the unobservable inputs (examples include single source broker quotations, third party pricing, and prior transactions). |
| (2) | The fair value of any one instrument may be determined using multiple valuation techniques. For example, market comparable and discounted cash flows may be used together to determine fair value. Therefore, the Level 3 balance encompasses both of these techniques. |
| (3) | The range for an asset category consisting of a single investment represents the relevant market data considered in determining the fair value of the investment. |
| (4) | Weighted average for an asset category consisting of multiple investments is calculated by weighting the significant unobservable input by the relative fair value of the investments. Weighted average for an asset category consisting of a single investment represents the significant unobservable input used in the fair value of the investment. |
| (5) | Enterprise value of portfolio company as a multiple of EBITDA. |
| (6) | Enterprise value of portfolio company as a multiple of oil and gas production (barrels of oil equivalent per day). |
As noted above, the income and market approaches were used in the determination of fair value of certain Level 3 assets as of December 31, 2016 and 2015. The significant unobservable inputs used in the income approach are the discount rate or market yield used to discount the estimated future cash flows expected to be received from the underlying investment, which include both future principal and interest payments. An increase in the discount rate or market yield would result in a decrease in the fair value. Included in the consideration and selection of discount rates is risk of default, rating of the investment, call provisions and comparable company investments. The significant unobservable inputs used in the market approach are based on market comparable transactions and market multiples of publicly traded comparable companies. Increases or decreases in market multiples would result in an increase or decrease, respectively, in the fair value.
The following is a summary of the Company’s assets categorized within the fair value hierarchy as of December 31, 2016:
| Assets | Level 1 | Level 2 | Level 3 | Total | ||||||||||||
| 1st Lien/Senior Secured Debt |
$ | – | $ | 41,845 | $ | 379,181 | $ | 421,026 | ||||||||
| 1st Lien/Last-Out Unitranche |
– | – | 310,254 | 310,254 | ||||||||||||
| 2nd Lien/Senior Secured Debt |
– | 67,160 | 269,018 | 336,178 | ||||||||||||
| Unsecured Debt |
– | – | 3,115 | 3,115 | ||||||||||||
| Preferred Stock |
– | – | 11,833 | 11,833 | ||||||||||||
| Common Stock |
– | 2,178 | 4,312 | 6,490 | ||||||||||||
| Affiliated Money Market Fund |
1 | – | – | 1 | ||||||||||||
|
|
||||||||||||||||
| Subtotal |
$ | 1 | $ | 111,183 | $ | 977,713 | $ | 1,088,897 | ||||||||
|
|
||||||||||||||||
| Investments measured at NAV(1) |
78,394 | |||||||||||||||
|
|
||||||||||||||||
| Total assets |
$ | 1,167,291 | ||||||||||||||
|
|
||||||||||||||||
| (1) | Includes equity investments in the Senior Credit Fund. |
124
The following is a summary of the Company’s assets categorized within the fair value hierarchy as of December 31, 2015:
| Assets | Level 1 | Level 2 | Level 3 | Total | ||||||||||||
| 1st Lien/Senior Secured Debt |
$ | – | $ | 57,767 | $ | 362,331 | $ | 420,098 | ||||||||
| 1st Lien/Last-Out Unitranche |
– | – | 305,727 | 305,727 | ||||||||||||
| 2nd Lien/Senior Secured Debt |
– | 27,769 | 257,701 | 285,470 | ||||||||||||
| Preferred Stock |
– | – | 24,872 | 24,872 | ||||||||||||
| Common Stock |
– | – | – | – | ||||||||||||
| Affiliated Money Market Fund |
10,117 | – | – | 10,117 | ||||||||||||
|
|
||||||||||||||||
| Subtotal |
$ | 10,117 | $ | 85,536 | $ | 950,631 | $ | 1,046,284 | ||||||||
|
|
||||||||||||||||
| Investments measured at NAV(1) |
44,897 | |||||||||||||||
|
|
||||||||||||||||
| Total assets |
$ | 1,091,181 | ||||||||||||||
|
|
||||||||||||||||
| (1) | Includes equity investments in the Senior Credit Fund. |
The following is a reconciliation of Level 3 assets for the year ended December 31, 2016:
| Level 3 |
Beginning |
Purchases(1) |
Net |
Net Change
in |
Sales and |
Net Discount |
Transfers |
Transfers |
Ending |
|||||||||||||||||||||||||||
| 1st Lien/Senior Secured Debt |
$ | 362,331 | $ | 99,543 | $ | – | $ | (10,600 | ) | $ | (89,834 | ) | $ | 1,978 | $ | 15,763 | $ | – | $ | 379,181 | ||||||||||||||||
| 1st Lien/Last-Out Unitranche |
305,727 | 54,814 | 123 | (16,820 | ) | (35,119 | ) | 1,529 | – | – | 310,254 | |||||||||||||||||||||||||
| 2nd Lien/Senior Secured Debt |
257,701 | 157,733 | (22,117 | ) | (11,560 | ) | (97,513 | ) | 1,574 | – | (16,800 | ) | 269,018 | |||||||||||||||||||||||
| Unsecured Debt |
– | 3,115 | – | – | – | – | – | – | 3,115 | |||||||||||||||||||||||||||
| Preferred Stock |
24,872 | 11,548 | – | 1,453 | (21,249 | ) | – | – | (4,791 | ) | 11,833 | |||||||||||||||||||||||||
| Common Stock |
– | 2,395 | – | 6,363 | – | – | – | (4,446 | ) | 4,312 | ||||||||||||||||||||||||||
|
|
||||||||||||||||||||||||||||||||||||
| Total assets |
$ | 950,631 | $ | 329,148 | $ | (21,994 | ) | $ | (31,164 | ) | $ | (243,715 | ) | $ | 5,081 | $ | 15,763 | $ | (26,037 | ) | $ | 977,713 | ||||||||||||||
|
|
||||||||||||||||||||||||||||||||||||
| (1) | Purchases may include securities received in corporate actions and PIK. Sales and Settlements may include securities delivered in corporate actions. |
| (2) | Change in unrealized appreciation (depreciation) relating to assets still held at December 31, 2016 totaled $(30,159) consisting of the following: 1st Lien/Senior Secured Debt $(10,600), 1st Lien/Last-Out Unitranche $(16,820), 2nd Lien/Senior Secured Debt $(10,555), Unsecured Debt $0, Preferred Stock $1,453, and Common Stock $6,363. |
The following is a reconciliation of Level 3 assets for the year ended December 31, 2015:
| Level 3 | Beginning Balance as of January 1, 2015 |
Purchases(1) | Net Realized Gain (Loss) |
Net Change in Unrealized Appreciation (Depreciation)(2) |
Sales and Settlements(1) |
Net Discount |
Transfers In |
Transfers Out |
Ending Balance as of December 31, 2015 |
|||||||||||||||||||||||||||
| 1st Lien/Senior Secured Debt |
$ | 176,931 | $ | 202,467 | $ | (98 | ) | $ | 5,133 | $ | (23,418 | ) | $ | 1,316 | $ | – | $ | – | $ | 362,331 | ||||||||||||||||
| 1st Lien/Last-Out Unitranche |
275,567 | 39,183 | – | (1,630 | ) | (8,602 | ) | 1,209 | – | – | 305,727 | |||||||||||||||||||||||||
| 2nd Lien/Senior Secured Debt |
304,541 | 47,923 | 31 | (15,035 | ) | (89,070 | ) | 1,698 | 27,323 | (19,710 | ) | 257,701 | ||||||||||||||||||||||||
| Preferred Stock |
26,358 | 411 | – | (1,897 | ) | – | – | – | – | 24,872 | ||||||||||||||||||||||||||
| Common Stock |
632 | – | – | (632 | ) | – | – | – | – | – | ||||||||||||||||||||||||||
|
|
||||||||||||||||||||||||||||||||||||
| Total assets |
$ | 784,029 | $ | 289,984 | $ | (67 | ) | $ | (14,061 | ) | $ | (121,090 | ) | $ | 4,223 | $ | 27,323 | $ | (19,710 | ) | $ | 950,631 | ||||||||||||||
|
|
||||||||||||||||||||||||||||||||||||
| (1) | Purchases may include securities received in corporate actions and PIK. Sales and Settlements may include securities delivered in corporate actions. |
| (2) | Change in unrealized appreciation (depreciation) relating to assets still held at December 31, 2015 totaled $(13,286) consisting of the following: 1st Lien/Senior Secured Debt $4,883, 1st Lien/Last-Out Unitranche $(1,630), 2nd Lien/Senior Secured Debt $(14,010), Preferred Stock $(1,897), and Common Stock $(632). |
Transfers between levels of the fair value hierarchy are reported at the beginning of the reporting period in which they occur. For the years ended December 31, 2016 and 2015 transfers from Level 2 to Level 3 were primarily due to decreased price transparency, while transfers from Level 3 to Level 2 were primarily due to increased price transparency.
125
Debt Not Carried at Fair Value
The fair value of the Company’s revolving credit facility (as amended, the “Revolving Credit Facility”), which would be categorized as Level 3 within the fair value hierarchy as of December 31, 2016 and 2015, approximates its carrying value. The fair value of the Company’s Convertible Notes, which would be categorized as Level 2 within the fair value hierarchy, as of December 31, 2016, was $116,006, based on broker quotes received by the Company.
| 6. | DEBT |
In accordance with the Investment Company Act, with certain exceptions, the Company is only allowed to borrow amounts such that its asset coverage ratio, as defined in the Investment Company Act, is at least 2 to 1 after such borrowing. As of December 31, 2016 and 2015, the Company’s asset coverage ratio based on aggregated borrowings outstanding was 2.32 to 1 and 2.64 to 1, respectively.
The Company’s outstanding debt as of December 31, 2016 and 2015 was as follows:
| As of | ||||||||||||||||||||||||||||||||
| December 31, 2016 | December 31, 2015 | |||||||||||||||||||||||||||||||
| Aggregate Borrowing Amount Committed |
Outstanding Borrowing |
Amount Available |
Carrying Value |
Aggregate Borrowing Amount Committed |
Outstanding Borrowing |
Amount Available |
Carrying Value |
|||||||||||||||||||||||||
| Revolving Credit Facility |
$ | 605,000 | (1) | $ | 387,750 | $ | 217,250 | $ | 387,750 | $ | 570,000 | $ | 419,000 | $ | 151,000 | $ | 419,000 | |||||||||||||||
| Convertible Notes(2) |
115,000 | 115,000 | – | 110,402 | – | – | – | – | ||||||||||||||||||||||||
|
|
||||||||||||||||||||||||||||||||
| Total Debt |
$ | 720,000 | $ | 502,750 | $ | 217,250 | $ | 498,152 | $ | 570,000 | $ | 419,000 | $ | 151,000 | $ | 419,000 | ||||||||||||||||
|
|
||||||||||||||||||||||||||||||||
| (1) | Provides, under certain circumstances, a total borrowing capacity of $1,000,000. |
| (2) | The carrying value of the Company’s Convertible Notes is presented net of unamortized debt issuance costs of $3,884 and OID net of accretion of $714. |
The combined weighted average interest rates of the aggregate borrowings outstanding for the years ended December 31, 2016 and 2015 are 2.65% and 2.44%, respectively.
Revolving Credit Facility
On September 19, 2013, the Company entered into a Revolving Credit Facility with various lenders. SunTrust Bank serves as administrative agent and Bank of America N.A. serves as syndication agent under the Revolving Credit Facility.
On October 3, 2014, the Company amended and restated the Revolving Credit Facility to, among other things:
| • | increase the aggregate borrowing amount of $340,000 to $485,000 on a committed basis; |
| • | increase the total borrowing capacity from a maximum of $500,000 to $900,000; |
| • | extend the maturity date from September 19, 2017 to October 3, 2019; and |
| • | reduce the applicable margin of borrowings with respect to (i) any loan bearing interest at a rate determined by reference to the alternate base rate from 1.50% to 1.25% and (ii) any loan bearing interest at a rate determined by reference to the adjusted LIBOR rate from 2.50% to 2.25%. |
On January 16, 2015, the Company exercised the right under the accordion feature and increased the size of the Revolving Credit Facility to $535,000, on a committed basis.
On March 27, 2015, the Company exercised the right under the accordion feature and increased the size of the Revolving Credit Facility to $560,000, on a committed basis.
On November 3, 2015, the Company amended the Revolving Credit Facility to, among other things:
| • | increase the aggregate borrowing amount to $570,000 on a committed basis; |
| • | increase the total borrowing capacity to a maximum of $1,000,000; |
| • | extend the final maturity date to November 4, 2020; and |
| • | reduce the applicable margin of borrowings with respect to (i) any loan bearing interest at a rate determined by reference to the alternate base rate from 1.25% to 0.75% or 1.00%, subject to borrowing base conditions and (ii) any loan bearing interest at a rate determined by reference to the adjusted LIBOR rate from 2.25% to 1.75% or 2.00%, subject to borrowing base conditions. |
126
On December 16, 2016, the Company further amended the Revolving Credit Facility to, among other things:
| • | increase aggregate borrowing amount to $605,000 on a committed basis; and |
| • | extend the final maturity date to December 16, 2021. |
Borrowings under the Revolving Credit Facility, including amounts drawn in respect of letters of credit, bear interest (at the Company’s election) of either LIBOR plus an applicable margin or an applicable margin plus the higher of the Prime Rate, Federal Funds Rate plus 0.5% or overnight LIBOR plus 1.0%. Interest is payable quarterly in arrears. The Company pays a fee of 0.375% per annum on committed but undrawn amounts under the Revolving Credit Facility, payable quarterly in arrears. Any amounts borrowed under the Revolving Credit Facility will mature, and all accrued and unpaid interest will be due and payable, on December 16, 2021.
The Company’s obligations to the lenders under the Revolving Credit Facility are secured by a first priority security interest in substantially the Company’s entire portfolio of investments and cash. The Revolving Credit Facility contains certain covenants, including: (i) maintaining a minimum stockholder’s equity of $458,212, subject to increase pending certain equity sales, (ii) maintaining an asset coverage ratio of at least 2 to 1, (iii) maintaining a minimum liquidity test of at least 10% of the covered debt amount during any period when the adjusted covered debt balance is greater than 90% of the adjusted borrowing base, as defined in the Revolving Credit Facility, and (iv) complying with restrictions on industry concentrations in the Company’s investment portfolio. As of December 31, 2016, the Company was in compliance with these covenants.
Costs of $9,704 were incurred in connection with obtaining and amending the Revolving Credit Facility, which have been recorded as deferred financing costs on the Consolidated Statements of Assets and Liabilities and are being amortized over the life of the Revolving Credit Facility using the straight-line method.
The summary information of the Revolving Credit Facility for the years ended December 31, 2016, 2015 and 2014 is as follows:
| Year Ended December 31, 2016 |
Year Ended December 31, 2015 |
Year Ended December 31, 2014 |
||||||||||
| Borrowing interest expense |
$ | 11,033 | $ | 8,743 | $ | 2,587 | ||||||
| Facility fees |
572 | 792 | 1,083 | |||||||||
| Amortization of financing costs |
1,214 | 1,170 | 1,013 | |||||||||
|
|
||||||||||||
| Total |
$ | 12,819 | $ | 10,705 | $ | 4,683 | ||||||
|
|
||||||||||||
| Weighted average interest rate |
2.53% | 2.44% | 2.53% | |||||||||
| Average outstanding balance |
$ | 436,161 | $ | 358,444 | $ | 102,285 | ||||||
|
|
||||||||||||
Convertible Notes
On October 3, 2016, the Company closed an offering of $115,000 aggregate principal amount of unsecured Convertible Notes, which includes $15,000 aggregate principal amount issued pursuant to the initial purchasers’ exercise in full of an over-allotment option. The Convertible Notes bear interest at a rate of 4.50% per year, payable semi-annually in arrears on April 1 and October 1 of each year, commencing on April 1, 2017. The Convertible Notes will mature on April 1, 2022, unless repurchased or converted in accordance with their terms prior to such date. In certain circumstances, the Convertible Notes will be convertible into cash, shares of the Company’s common stock or a combination of cash and shares of the Company’s common stock, based on an initial conversion rate of 40.8397 shares of the Company’s common stock per $1,000 principal amount of Convertible Notes, which is equivalent to an initial conversion price of approximately $24.49 per share of common stock, subject to customary anti-dilution adjustments and the other terms of the indenture governing the Convertible Notes. The conversion price is approximately 10.0% above the $22.26 per share closing price of the Company’s common stock on September 27, 2016. The Company will not have the right to redeem the Convertible Notes prior to maturity. The sale of the Convertible Notes generated net proceeds of approximately $110,900. The Company used the net proceeds of the offering to pay down debt under the Revolving Credit Facility.
127
Holders may convert their notes at their option at any time prior to the close of business on the business day immediately preceding October 1, 2021 only under the following circumstances: (1) during any calendar quarter commencing after December 31, 2016, if the last reported sale price of the Company’s common stock for at least 20 trading days (whether or not consecutive) during a period of 30 consecutive trading days ending on the last trading day of the immediately preceding calendar quarter is greater than or equal to 130% of the conversion price on each applicable trading day; (2) during the five business day period after any five consecutive trading day period (the “measurement period”) in which the trading price (as defined below) per $1,000 principal amount of notes for each trading day of the measurement period was less than 98% of the product of the last reported sale price of the Company’s common stock and the conversion rate on each such trading day; or (3) upon the occurrence of specified corporate events. On or after October 1, 2021, until the close of business on the scheduled trading day immediately preceding the maturity date, holders may convert their notes at any time, regardless of the occurrence or nonoccurrence of any of the foregoing circumstances.
The Convertible Notes are accounted for in accordance with ASC Topic 470-20, “Debt with Conversion and Other Options.” Upon conversion of any of the Convertible Notes, the Company intends to pay the outstanding principal amount in cash and, to the extent that the conversion value exceeds the principal amount, has the option to pay the excess amount in cash or shares of the Company’s common stock (or a combination of cash and shares), subject to the requirements of the respective indenture. The Company has determined that the embedded conversion options in the Convertible Notes are not required to be separately accounted for as derivatives under ASC 815, “Derivatives and Hedging.” At the time of issuance the values of the debt and equity components of the Convertible Notes were approximately 99.4% and 0.6%, respectively.
The OID equal to the equity component of the Convertible Notes was recorded in “paid-in capital in excess of par” in the accompanying Consolidated Statements of Assets and Liabilities. The Company records interest expense comprised of both stated interest and amortization of the OID. At the time of issuance, the equity component of the Convertible Notes was $743. Additionally, the issuance costs associated with the Convertible Notes were allocated to the debt and equity components in proportion to the allocation of the values at the time of issuance and accounted for as debt issuance costs and equity issuance costs, respectively.
As of December 31, 2016, the components of the carrying value of the Convertible Notes were as follows:
| December 31, 2016 |
||||
| Principal amount of debt |
$ | 115,000 | ||
| OID, net of accretion |
714 | |||
| Unamortized debt issuance costs |
3,884 | |||
|
|
||||
| Carrying value |
$ | 110,402 | ||
|
|
||||
| Stated interest rate |
4.50% | |||
| Effective interest rate (stated interest rate plus accretion of OID) |
4.60% | |||
For the year ended December 31, 2016, the components of interest and other debt expenses related to the Convertible Notes were as follows:
| Year Ended December 31, 2016 |
||||
| Borrowing interest expense |
$ | 1,265 | ||
| Accretion of original issuance discount |
30 | |||
| Amortization of debt issuance costs |
185 | |||
|
|
||||
| Total |
$ | 1,480 | ||
|
|
||||
128
| 7. | COMMITMENTS AND CONTINGENCIES |
Commitments
The Company may enter into commitments to fund investments. As of December 31, 2016, the Company reasonably believed that its liquid assets would provide adequate financial resources to satisfy all of its unfunded commitments. The Company had the following unfunded commitments by investment types as of the dates indicated:
| December 31, 2016 | December 31, 2015 | |||||||||||||||||||||||
| Commitment Expiration Date(1) |
Unfunded Commitment(2) |
Fair Value(3) |
Commitment Expiration Date(1) |
Unfunded Commitment(2) |
Fair Value(3) |
|||||||||||||||||||
| 1st Lien/Senior Secured Debt |
||||||||||||||||||||||||
| Legacy Buyer Corp. |
10/24/2019 | $ | 800 | $ | (28 | ) | 10/24/2019 | $ | 2,500 | $ | (31 | ) | ||||||||||||
| Elemica, Inc. |
07/07/2021 | 6,000 | (135 | ) | – | – | – | |||||||||||||||||
|
|
||||||||||||||||||||||||
| Total 1st Lien/Senior Secured Debt |
6,800 | (163 | ) | 2,500 | (31 | ) | ||||||||||||||||||
|
|
||||||||||||||||||||||||
| 1st Lien/Last-Out Unitranche |
||||||||||||||||||||||||
| Associations, Inc. |
– | – | – | 12/22/2018 | 3,511 | (61 | ) | |||||||||||||||||
|
|
||||||||||||||||||||||||
| Total 1st Lien/Last-Out Unitranche |
– | – | 3,511 | (61 | ) | |||||||||||||||||||
|
|
||||||||||||||||||||||||
| Total |
$ | 6,800 | $ | (163 | ) | $ | 6,011 | $ | (92 | ) | ||||||||||||||
|
|
||||||||||||||||||||||||
| (1) | Commitments are generally subject to borrowers meeting certain criteria such as compliance with covenants and certain operational metrics. These amounts may remain outstanding until the commitment period of an applicable loan expires, which may be shorter than its maturity. |
| (2) | Net of capitalized fees, expenses, and OIDs. |
| (3) | A negative fair value was reflected as investments, at fair value in the Consolidated Statements of Assets and Liabilities. The negative fair value is the result of the capitalized discount on the loan. |
Contingencies
In the normal course of business, the Company enters into contracts that provide a variety of general indemnifications. Any exposure to the Company under these arrangements could involve future claims that may be made against the Company. Currently, no such claims exist or are expected to arise and, accordingly, the Company has not accrued any liability in connection with such indemnifications.
| 8. | NET ASSETS |
Equity Issuances
On March 23, 2015, the Company completed its IPO, issuing 6,000,000 shares at $20.00 per share. Net of offering and underwriting costs, the Company received cash proceeds of $114,568.
In April 2015, the Company issued a total of 900,000 shares of its common stock pursuant to the exercise of the underwriters’ over-allotment option in connection with the IPO. Net of underwriting costs, the Company received additional cash proceeds of $17,271.
There were no sales of the Company’s common stock during the years ended December 31, 2016 and 2014.
Distributions
The following table reflects the distributions declared on shares of the Company’s common stock during the year ended December 31, 2016:
| Date Declared | Record Date | Payment Date | Amount Per Share | |||
| February 25, 2016 | March 31, 2016 | April 15, 2016 | $0.45 | |||
| May 3, 2016 | June 30, 2016 | July 15, 2016 | $0.45 | |||
| August 2, 2016 | September 30, 2016 | October 17, 2016 | $0.45 | |||
| November 1, 2016 | December 31, 2016 | January 17, 2017 | $0.45 |
129
The following table reflects the distributions declared on shares of the Company’s common stock during the year ended December 31, 2015:
| Date Declared | Record Date | Payment Date | Amount Per Share | |||
| February 25, 2015 | March 31, 2015 | April 30, 2015 | $0.45 | |||
| May 13, 2015 | June 30, 2015 | July 15, 2015 | $0.45 | |||
| August 4, 2015 | September 30, 2015 | October 15, 2015 | $0.45 | |||
| November 3, 2015 | December 31, 2015 | January 28, 2016 | $0.45 |
The following table reflects the distributions declared on shares of the Company’s common stock during the year ended December 31, 2014:
| Date Declared | Record Date | Payment Date | Amount Per Share | |||
| March 28, 2014 | March 17, 2014 | April 30, 2014 | $0.33 | |||
| June 27, 2014 | June 17, 2014 | July 31, 2014 | $0.41 | |||
| September 29, 2014 | September 24, 2014 | October 31, 2014 | $0.42 | |||
| December 30, 2014 | December 23, 2014 | January 30, 2015 | $0.53 |
Dividend Reinvestment Plan
Concurrent with the IPO, the Company adopted a dividend reinvestment plan that provides for reinvestment of all cash distributions declared by the Board of Directors, unless a stockholder elects to “opt out” of the plan. As a result, if the Board of Directors declares a cash distribution, then the stockholders who have not “opted out” of the dividend reinvestment plan will have their cash distributions automatically reinvested in additional shares of common stock, rather than receiving the cash distribution.
The following table summarizes shares distributed pursuant to the dividend reinvestment plan during the year ended December 31, 2016 to stockholders who had not opted out of the dividend reinvestment plan:
| Date Declared | Record Date | Payment Date | Shares | |||
| November 3, 2015 | December 31, 2015 | January 28, 2016 | 8,206 | |||
| February 25, 2016 | March 31, 2016 | April 15, 2016 | 5,555 | |||
| May 3, 2016 | June 30, 2016 | July 15, 2016 | 8,937 | |||
| August 2, 2016 | September 30, 2016 | October 17, 2016 | 10,288 |
The following table summarizes shares distributed pursuant to the dividend reinvestment plan during the year ended December 31, 2015 to stockholders who had not opted out of the dividend reinvestment plan:
| Date Declared | Record Date | Payment Date | Shares | |||
| February 25, 2015 | March 31, 2015 | April 30, 2015 | 6,982 | |||
| May 13, 2015 | June 30, 2015 | July 15, 2015 | 5,336 | |||
| August 4, 2015 | September 30, 2015 | October 15, 2015 | 13,437 |
Tender Offers
Prior to the IPO, each quarter, beginning with the calendar quarter ended December 31, 2013, the Board of Directors, in its sole discretion, determined the number of shares, if any that the Company would offer to repurchase (the “Tender Offer Amount”). The quarterly Tender Offer Amount could be up to 5% of the total number of shares outstanding on the date by which a stockholder could tender its shares in response to the Company’s offer to repurchase shares (“Tender Offer”). The Company repurchased shares at NAV per share of the Company at the end of the quarter.
The Company did not conduct a Tender Offer for the years ended December 31, 2016 and 2015.
130
For the year ended December 31, 2014, the Company extended the following Tender Offers:
| Repurchase Request Deadline |
Percentage of Outstanding Shares the Company Offered to be Repurchased |
Amount of Shares the Company Offered to Repurchase |
Number of Shares Tendered by Group Inc. |
Number of Shares Tendered by Other Stockholders |
Total Number of Shares Tendered |
|||||||||||||||
| March 18, 2014 |
5 | % | 1,519,506 | 136,498 | 551,250 | 687,748 | ||||||||||||||
|
|
||||||||||||||||||||
| June 18, 2014 |
5 | % | 1,485,118 | 47,666 | 192,500 | 240,166 | ||||||||||||||
|
|
||||||||||||||||||||
| September 25, 2014 |
2 | % | 589,244 | 8,662 | 34,983 | 43,645 | ||||||||||||||
|
|
||||||||||||||||||||
| December 24, 2014 |
1 | % | 294,186 | 7,428 | 30,000 | 37,428 | ||||||||||||||
|
|
||||||||||||||||||||
9. EARNINGS PER SHARE
The following information sets forth the computation of basic and diluted earnings per share for the years ended December 31, 2016, 2015 and 2014:
| Year Ended December 31, 2016 |
Year Ended December 31, 2015 |
Year Ended December 31, 2014 |
||||||||||
| Numerator for basic and diluted earnings per share—increase in net assets resulting from operations |
$ | 40,652 | $ | 46,628 | $ | 36,922 | ||||||
| Denominator for basic and diluted earnings per share—weighted average shares outstanding |
36,317,131 | 34,782,967 | 29,737,113 | |||||||||
| Basic and diluted earnings per share |
$ | 1.12 | $ | 1.34 | $ | 1.24 | ||||||
|
|
||||||||||||
For the purpose of calculating diluted earnings per common share, the average closing price of the Company’s common stock for the year ended December 31, 2016 was less than the conversion price for the Convertible Notes outstanding as of December 31, 2016. Therefore, for the year ended December 31, 2016, diluted earnings per share equals basic earnings per share because the underlying shares for the intrinsic value of the embedded options in the Convertible Notes were not dilutive. For the year ended December 31, 2015 and 2014, diluted earnings per share equals basic earnings per share because there were no common stock equivalents outstanding.
10. TAX INFORMATION
The tax character of distributions during the years ended December 31, 2016, 2015 and 2014 were as follows:
| Year Ended | Year Ended | Year Ended | ||||||||||
| December 31, 2016 | December 31, 2015 | December 31, 2014 | ||||||||||
| Distributions paid from: |
||||||||||||
| Ordinary Income |
$ | 65,373 | $ | 63,973 | $ | 48,813 | ||||||
| Net Long-Term Capital Gains |
$ | – | $ | 948 | $ | 1,167 | ||||||
|
|
||||||||||||
| Total Taxable Distributions |
$ | 65,373 | $ | 64,921 | $ | 49,980 | ||||||
|
|
||||||||||||
As of December 31, 2016, 2015 and 2014 the components of Accumulated Earnings (Losses) on a tax basis were as follows:
| December 31, 2016 | December 31, 2015 | December 31, 2014 | ||||||||||
| Undistributed Ordinary Income—net |
$ | 28,801 | $ | 15,093 | $ | 4,079 | ||||||
| Undistributed Long-Term Capital Gains |
$ | – | $ | – | $ | 248 | ||||||
|
|
||||||||||||
| Total Undistributed Earnings |
$ | 28,801 | $ | 15,093 | $ | 4,327 | ||||||
|
|
||||||||||||
| Capital Loss Carryforward: |
||||||||||||
| Perpetual Long-Term |
$ | (20,433 | ) | $ | – | $ | – | |||||
|
|
||||||||||||
| Total capital loss carryforwards |
$ | (20,433 | ) | $ | – | $ | – | |||||
| Timing Differences |
$ | (9 | ) | $ | (364 | ) | $ | – | ||||
| Unrealized Earnings (Losses)—net |
$ | (61,683 | ) | $ | (44,384 | ) | $ | (16,235 | ) | |||
|
|
||||||||||||
| Total Accumulated Earnings (Losses)—net |
$ | (53,324 | ) | $ | (29,655 | ) | $ | (11,908 | ) | |||
|
|
||||||||||||
131
As of December 31, 2016, 2015 and 2014 the Company’s aggregate unrealized appreciation and depreciation on investments based on cost for U.S. federal income tax purposes were as follows:
| December 31, 2016 | December 31, 2015 | December 31, 2014 | ||||||||||
| Tax cost |
$ | 1,228,974 | $ | 1,135,565 | $ | 959,750 | ||||||
| Gross unrealized appreciation |
$ | 11,946 | $ | 8,439 | $ | 5,372 | ||||||
| Gross unrealized depreciation |
$ | (73,629 | ) | $ | (52,823 | ) | $ | (21,607 | ) | |||
|
|
||||||||||||
| Net unrealized investment appreciation on investments |
$ | (61,683 | ) | $ | (44,384 | ) | $ | (16,235 | ) | |||
|
|
||||||||||||
The difference between GAAP-basis and tax basis unrealized gains (losses) is attributable primarily to differences in the tax treatment of underlying fund investments.
In order to present certain components of the Company’s capital accounts on a tax-basis, certain reclassifications have been recorded to the Company’s accounts. These reclassifications have no impact on the net asset value of the Company’s and result primarily from dividend redesignations, certain non-deductible expenses, and differences in the tax treatment of paydown gains and losses and underlying fund investments.
| December 31, 2016 | December 31, 2015 | December 31, 2014 | ||||||||||
| Paid-in capital in excess of par |
$ | (1,051 | ) | $ | (546 | ) | $ | (126 | ) | |||
| Accumulated undistributed net investment income |
$ | 419 | $ | (663 | ) | $ | (978 | ) | ||||
| Accumulated net realized gain (loss) |
$ | 632 | $ | 1,209 | $ | 1,104 | ||||||
|
|
||||||||||||
ASC 740, “Accounting for Uncertainty in Income Taxes” (“ASC 740”) provides guidance on the accounting for and disclosure of uncertainty in tax position. ASC 740 requires the evaluation of tax positions taken or expected to be taken in the course of preparing the Company’s tax returns to determine whether the tax positions are “more-likely-than-not” of being sustained by the applicable tax authority. Tax positions deemed to meet the more-likely-than-not threshold are recorded as a tax benefit or expense in the current year. Based on its analysis of its tax position for all open tax years (the current and prior years, as applicable), the Company has concluded that it does not have any uncertain tax positions that met the recognition or measurement criteria of ASC 740. Such open tax years remain subject to examination and adjustment by tax authorities.
132
| 11. | FINANCIAL HIGHLIGHTS |
Below is the schedule of financial highlights of the Company for the years ended December 31, 2016, 2015, 2014 and 2013 and the period ended December 31, 2012:
| Year ended December 31, 2016 |
Year ended December 31, 2015 |
Year ended December 31, 2014 |
Year ended December 31, 2013 |
Period from November 15, 2012 (commencement of operations) through December 31, 2012 |
||||||||||||||||
| Per Share Data:(1) |
||||||||||||||||||||
| NAV, beginning of year/period |
$ | 18.97 | $ | 19.56 | $ | 20.00 | $ | 19.37 | $ | 18.59 | ||||||||||
| Net investment income (loss) |
2.10 | 2.14 | 1.77 | 0.67 | (0.10 | ) | ||||||||||||||
| Net realized and unrealized gains (losses) |
(0.98 | ) | (0.84 | ) | (0.52 | ) | 0.51 | 0.88 | ||||||||||||
|
|
||||||||||||||||||||
| Net increase (decrease) in net assets resulting from operations |
1.12 | 1.30 | 1.25 | 1.18 | 0.78 | |||||||||||||||
|
|
||||||||||||||||||||
| Cost of issuance of common stock, net of underwriting and offering costs |
– | (0.09 | ) | – | – | – | ||||||||||||||
| Equity component of convertible notes |
0.02 | – | – | – | – | |||||||||||||||
| Private placement offering costs |
– | – | – | (0.05 | ) | – | ||||||||||||||
| Distributions declared from net investment income(2) |
(1.80 | ) | (1.76 | ) | (1.61 | ) | (0.49 | ) | – | |||||||||||
| Distributions declared from net realized gains(2) |
– | (0.04 | ) | (0.08 | ) | (0.01 | ) | – | ||||||||||||
|
|
||||||||||||||||||||
| Total increase (decrease) in net assets |
(0.66 | ) | (0.59 | ) | (0.44 | ) | 0.63 | 0.78 | ||||||||||||
|
|
||||||||||||||||||||
| NAV, end of year/period |
$ | 18.31 | $ | 18.97 | $ | 19.56 | $ | 20.00 | $ | 19.37 | ||||||||||
|
|
||||||||||||||||||||
| Market price, end of year/period |
$ | 23.52 | $ | 19.00 | $ | N.A. | $ | N.A. | $ | N.A. | ||||||||||
| Shares outstanding, end of year/period |
36,331,662 | 36,306,882 | 29,381,127 | 30,390,114 | 2,655,017 | |||||||||||||||
| Weighted average shares outstanding |
36,317,131 | 34,782,967 | 29,737,113 | 23,819,077 | 1,968,388 | |||||||||||||||
| Total return based on NAV(3) |
5.42% | 6.07% | 6.36% | 5.86% | 4.20% | |||||||||||||||
| Total return based on market value(4) |
35.20% | 3.90% | N.A.% | N.A.% | N.A.% | |||||||||||||||
| Ratio/Supplemental Data (all amounts in thousands except ratios): |
||||||||||||||||||||
| Net assets, end of year/period |
$ | 665,137 | $ | 688,650 | $ | 574,582 | $ | 607,785 | $ | 51,423 | ||||||||||
| Ratio of net expenses to average net assets |
7.25% | 6.51% | 3.45% | 1.45% | 3.01% | (5) | ||||||||||||||
| Ratio of expenses (without incentive fees and interest and other debt expenses) to average net assets |
3.58% | 3.17% | 2.41% | 1.36% | 2.35% | (5) | ||||||||||||||
| Ratio of interest and other debt expenses to average net assets |
2.12% | 1.59% | 0.79% | 0.14% | –% | (5) | ||||||||||||||
| Ratio of incentive fees to average net assets |
1.55% | 1.75% | 0.25% | 0.07% | 0.66% | (6) | ||||||||||||||
| Ratio of total expenses to average net assets |
7.25% | 6.51% | 3.45% | 1.57% | 3.01% | (5) | ||||||||||||||
| Ratio of net investment income to average net assets |
11.30% | 11.06% | 8.85% | 3.34% | 0.95% | (5) | ||||||||||||||
| Average debt outstanding |
464,440 | 358,444 | 102,285 | – | – | |||||||||||||||
| Average debt per share(7) |
12.79 | 10.31 | 3.44 | – | – | |||||||||||||||
| Portfolio turnover |
17% | 13% | 41% | 15% | 0% | |||||||||||||||
| (1) | The per share data was derived by using the weighted average shares outstanding during the applicable period. |
| (2) | The per share data for distributions declared reflects the actual amount of distributions declared per share for the applicable period. |
| (3) | Total return based on NAV is calculated as the change in NAV per share during the respective periods, assuming dividends and distributions, if any, are reinvested in accordance with the Company’s dividend reinvestment plan. |
| (4) | Total return based on market value is calculated as the change in market value per share during the respective periods, assuming dividends and distributions, if any, are reinvested in accordance with the Company’s dividend reinvestment plan. For the year ended December 31, 2015, the beginning market value per share is based on the IPO price of $20.00 per share. |
| (5) | Annualized except for Incentive Fees and certain operating expenses. |
| (6) | Not annualized. |
| (7) | Average debt per share is calculated as average debt outstanding divided by the weighted average shares outstanding during the applicable period. |
133
| 12. | SELECTED QUARTERLY FINANCIAL DATA (Unaudited) |
The following are the quarterly results of operations for the years ended December 31, 2016, 2015 and 2014. The following information reflects all normal recurring adjustments necessary for a fair presentation of the information for the periods presented. The operating results for any quarter are not necessarily indicative of results for any future period.
| Quarter Ended | ||||||||||||||||
| December 31, 2016 | September 30, 2016 | June 30, 2016 | March 31, 2016 | |||||||||||||
| Investment income |
$ | 30,493 | $ | 33,950 | $ | 29,321 | $ | 31,344 | ||||||||
| Expenses: |
||||||||||||||||
| Total expenses |
12,044 | 14,979 | 10,902 | 9,919 | ||||||||||||
|
|
|
|||||||||||||||
| Net investment income (loss) before taxes |
18,449 | 18,971 | 18,419 | 21,425 | ||||||||||||
| Excise tax expense |
309 | 294 | 221 | 213 | ||||||||||||
|
|
|
|||||||||||||||
| Net investment income (loss) after taxes |
18,140 | 18,677 | 18,198 | 21,212 | ||||||||||||
|
|
|
|||||||||||||||
| Net realized and unrealized gains (losses) |
(12,552 | ) | 3,986 | (11,198 | ) | (15,811 | ) | |||||||||
| Income tax expense |
– | – | – | – | ||||||||||||
|
|
|
|||||||||||||||
| Net increase in net assets resulting from operations after tax |
$ | 5,588 | $ | 22,663 | $ | 7,000 | $ | 5,401 | ||||||||
|
|
|
|||||||||||||||
| Net investment income per share (basic and diluted) |
$ | 0.50 | $ | 0.51 | $ | 0.50 | $ | 0.58 | ||||||||
|
|
|
|||||||||||||||
| Earnings per share (basic and diluted) |
$ | 0.15 | $ | 0.62 | $ | 0.19 | $ | 0.15 | ||||||||
|
|
|
|||||||||||||||
| Weighted average shares outstanding |
36,329,873 | 36,320,014 | 36,311,582 | 36,306,881 | ||||||||||||
|
|
|
|||||||||||||||
| Quarter Ended | ||||||||||||||||
| December 31, 2015 | September 30, 2015 | June 30, 2015 | March 31, 2015 | |||||||||||||
| Investment income |
$ | 31,852 | $ | 32,896 | $ | 27,316 | $ | 26,372 | ||||||||
| Expenses: |
||||||||||||||||
| Total expenses |
9,175 | 12,120 | 11,442 | 10,601 | ||||||||||||
|
|
|
|||||||||||||||
| Net investment income (loss) before taxes |
22,677 | 20,776 | 15,874 | 15,771 | ||||||||||||
| Excise tax expense |
254 | 174 | 65 | 25 | ||||||||||||
|
|
|
|||||||||||||||
| Net investment income (loss) after taxes |
22,423 | 20,602 | 15,809 | 15,746 | ||||||||||||
|
|
|
|||||||||||||||
| Net realized and unrealized gains (losses) |
(21,236 | ) | (7,119 | ) | 2,116 | (1,713 | ) | |||||||||
| Income tax expense |
– | – | – | – | ||||||||||||
|
|
|
|||||||||||||||
| Net increase in net assets resulting from operations after tax |
$ | 1,187 | $ | 13,483 | $ | 17,925 | $ | 14,033 | ||||||||
|
|
|
|||||||||||||||
| Net investment income per share (basic and diluted) |
$ | 0.62 | $ | 0.57 | $ | 0.44 | $ | 0.52 | ||||||||
|
|
|
|||||||||||||||
| Earnings per share (basic and diluted) |
$ | 0.03 | $ | 0.37 | $ | 0.50 | $ | 0.46 | ||||||||
|
|
|
|||||||||||||||
| Weighted average shares outstanding |
36,304,838 | 36,292,619 | 36,137,532 | 30,314,460 | ||||||||||||
|
|
|
|||||||||||||||
| Quarter Ended | ||||||||||||||||
| December 31, 2014 | September 30, 2014 | June 30, 2014 | March 31, 2014 | |||||||||||||
| Investment income |
$ | 24,359 | $ | 19,076 | $ | 16,106 | $ | 13,738 | ||||||||
| Expenses: |
||||||||||||||||
| Total expenses |
6,964 | 6,660 | 3,581 | 3,336 | ||||||||||||
|
|
|
|||||||||||||||
| Net investment income (loss) |
17,395 | 12,416 | 12,525 | 10,402 | ||||||||||||
| Net realized and unrealized gains (losses) |
(13,619 | ) | (1,161 | ) | (96 | ) | (940 | ) | ||||||||
| Income tax expense |
– | – | – | – | ||||||||||||
|
|
|
|||||||||||||||
| Net increase in net assets resulting from operations after tax |
$ | 3,776 | $ | 11,255 | $ | 12,429 | $ | 9,462 | ||||||||
|
|
|
|||||||||||||||
| Net investment income per share (basic and diluted) |
$ | 0.59 | $ | 0.42 | $ | 0.42 | $ | 0.34 | ||||||||
|
|
|
|||||||||||||||
| Earnings per share (basic and diluted) |
$ | 0.13 | $ | 0.38 | $ | 0.42 | $ | 0.31 | ||||||||
|
|
|
|||||||||||||||
| Weighted average shares outstanding |
29,418,149 | 29,461,726 | 29,699,727 | 30,382,473 | ||||||||||||
|
|
|
|||||||||||||||
The sum of quarterly per share amounts may not equal per share amounts reported for the years ended December 31, 2016, 2015 and 2014. This is due to changes in the number of weighted average shares outstanding and the effects of rounding for each period.
134
| 13. | SUBSEQUENT EVENTS |
Subsequent events after the Consolidated Statements of Assets and Liabilities date have been evaluated through the date the consolidated financial statements were issued. Other than the items discussed below, the Company has concluded that there is no impact requiring adjustment or disclosure in the consolidated financial statements.
In January 2017, the Company and Cal Regents each contributed $3,900 to the Senior Credit Fund, a controlled affiliated investment.
On February 22, 2017, the Company’s Board of Directors declared a quarterly distribution of $0.45 per share payable on or about April 17, 2017 to holders of record as of March 31, 2017.
In February 2017, the Company’s Board of Directors renewed the Company’s stock repurchase plan to extend the expiration from March 18, 2017 to March 18, 2018. Under the stock repurchase plan, the Company may repurchase up to $25,000 of its common stock if the market price for the common stock is below the Company’s most recently announced net asset value per share, subject to certain limitations. The stock repurchase plan authorized the Company to enter into a plan that provides that purchases will be conducted on the open market on a programmatic basis or to repurchase in privately negotiated transactions in accordance with Rule 10b-18 under the Exchange Act and will otherwise be subject to applicable law, including Regulation M, which may prohibit purchases under certain circumstances.
135
Goldman Sachs BDC, Inc. — Tax Information (unaudited)
During the year ended December 31, 2016, the Goldman Sachs BDC, Inc. designates 100% of its distributions from net investment income and short-term gains as interest-related dividends and short-term capital gain dividends, respectively, pursuant to Section 871(k) of the Internal Revenue Code.
136
ITEM 9. CHANGES IN AND DISAGREEMENTS WITH ACCOUNTANTS ON ACCOUNTING AND FINANCIAL DISCLOSURE
None.
ITEM 9A. CONTROLS AND PROCEDURES
Evaluation of Disclosure Controls and Procedures. As of the end of the period covered by this report, our management carried out an evaluation, under the supervision and with the participation of our Chief Executive Officer and Chief Financial Officer, of the effectiveness of the design and operation of our disclosure controls and procedures (as defined in Rule 13a-15(e) under the Exchange Act). Based on that evaluation, our Chief Executive Officer and Chief Financial Officer have concluded that our current disclosure controls and procedures are effective in timely alerting them to material information relating to us that is required to be disclosed by us in the reports we file or submit under the Exchange Act. In designing and evaluating our disclosure controls and procedures, management recognizes that any controls and procedures, no matter how well designed and operated, can provide only reasonable assurance of achieving their objectives, and management necessarily applies its judgment in evaluating the benefits of possible controls and procedures relative to their costs.
Changes in Internal Control over Financial Reporting. There have been no changes in our internal control over financial reporting that occurred during our most recently completed fiscal quarter that have materially affected, or are reasonably likely to materially affect, our internal control over financial reporting.
Management’s Report on Internal Control Over Financial Reporting. Our management is responsible for establishing and maintaining adequate internal control over financial reporting (as defined in Rules 13a-15(f) and 15d-15(f) of the Exchange Act). Under the supervision and with the participation of management, including the Chief Executive Officer and Chief Financial Officer, we conducted an evaluation of the effectiveness of our internal control over financial reporting based on the criteria established in Internal Control—Integrated Framework (2013) issued by the Committee of Sponsoring Organizations of the Treadway Commission (2013 COSO Framework). Based on our evaluation under the framework in Internal Control—Integrated Framework, management concluded that our internal control over financial reporting was effective as of December 31, 2016.
Because of its inherent limitations, internal control over financial reporting may not prevent or detect misstatements. Also, projections of any evaluation of effectiveness to future periods are subject to the risk that controls may become inadequate because of changes in conditions, or that the degree of compliance with the policies or procedures may deteriorate.
None.
137
ITEM 10. DIRECTORS, EXECUTIVE OFFICERS AND CORPORATE GOVERNANCE
The information required by Item 10 is hereby incorporated by reference from our definitive Proxy Statement relating to our 2017 Annual Meeting of Stockholders, to be filed with the SEC within 120 days following the end of our fiscal year.
ITEM 11. EXECUTIVE COMPENSATION
The information required by Item 11 is hereby incorporated by reference from our definitive Proxy Statement relating to our 2017 Annual Meeting of Stockholders, to be filed with the SEC within 120 days following the end of our fiscal year.
ITEM 12. SECURITY OWNERSHIP OF CERTAIN BENEFICIAL OWNERS AND MANAGEMENT AND RELATED STOCKHOLDER MATTERS
The information required by Item 12 is hereby incorporated by reference from our definitive Proxy Statement relating to our 2017 Annual Meeting of Stockholders, to be filed with the SEC within 120 days following the end of our fiscal year.
ITEM 13. CERTAIN RELATIONSHIPS AND RELATED TRANSACTIONS, AND DIRECTOR INDEPENDENCE
The information required by Item 13 is hereby incorporated by reference from our definitive Proxy Statement relating to our 2017 Annual Meeting of Stockholders, to be filed with the SEC within 120 days following the end of our fiscal year.
ITEM 14. PRINCIPAL ACCOUNTING FEES AND SERVICES
The information required by Item 14 is hereby incorporated by reference from our definitive Proxy Statement relating to our 2017 Annual Meeting of Stockholders, to be filed with the SEC within 120 days following the end of our fiscal year.
138
ITEM 15. EXHIBITS, FINANCIAL STATEMENT SCHEDULES
The following documents are filed as part of this Annual Report on Form 10-K:
| (1) | Financial Statements—Financial statements are included in Item 8. See the Index to the Consolidated Financial Statements on page 93 of this Annual Report on Form 10-K. |
| (2) | Financial Statement Schedules—None. We have omitted financial statements schedules because they are not required or are not applicable, or the required information is shown in the consolidated financial statements or notes to the consolidated financial statements included in this Annual Report on Form 10-K. |
| (3) | Exhibits—The following is a list of all exhibits filed as a part of this Annual Report on Form 10-K, including those incorporated by reference. |
139
| Exhibit No |
Description of Exhibits | |
| 3.1 | Certificate of Incorporation (incorporated by reference to Exhibit (a) to pre-effective Amendment No. 7 to the Company’s Registration Statement on Form N-2 (file no. 333-187642), filed on March 3, 2015). | |
| 3.2 | Bylaws (incorporated by reference to Exhibit (a) to pre-effective Amendment No. 7 to the Company’s Registration Statement on Form N-2 (file no. 333-187642), filed on March 3, 2015). | |
| 4.1 | Indenture, dated October 3, 2016, between Goldman Sachs BDC, Inc. and Wells Fargo Bank, National Association, as Trustee (incorporated by reference to Exhibit 4.1 to the Company’s Current Report on Form 8-K (file no. 814-00998), filed on October 3, 2016). | |
| 4.2 | Form of 4.50% Convertible Note Due 2022 (incorporated by reference to Exhibit 4.2 to the Company’s Current Report on Form 8-K (file no. 814-00998), filed on October 3, 2016). | |
| 10.1 | Administration Agreement, dated as of April 1, 2013, between the Company and the Adviser (incorporated by reference to Exhibit (k)(3) to pre-effective Amendment No. 7 to the Company’s Registration Statement on Form N-2 (file no. 333-187642), filed on March 3, 2015). | |
| 10.2 | Senior Secured Revolving Credit Agreement, dated as of September 19, 2013 among the Company, as Borrower, the Lenders party thereto, and SunTrust Bank, as Administrative Agent (incorporated by reference to Exhibit (k)(5) to pre-effective Amendment No. 8 to the Company’s Registration Statement on Form N-2 (file no. 333-187642), filed on March 10, 2015). | |
| 10.3 | First Omnibus Amendment to Senior Secured Revolving Credit Agreement and Guarantee and Security Agreement, dated as of October 3, 2014 among the Company, as Borrower, the Lenders party thereto, and SunTrust Bank, as Administrative Agent and as Collateral Agent (incorporated by reference to Exhibit 10.1 to the Company’s Quarterly Report on Form 10-Q (file no. 001-35851), filed on May 14, 2015). | |
| 10.4 | Joinder Agreement, dated as of January 16, 2015, by HSBC Bank USA, National Association, as Assuming Lender, in favor of the Company as Borrower, and SunTrust Bank, as administrative agent under the Revolving Credit Facility (incorporated by reference to Exhibit 10.2 to the Company’s Quarterly Report on Form 10-Q (file no. 001-35851), filed on May 14, 2015). | |
| 10.5 | Joinder Agreement, dated as of March 27, 2015, by CIT Finance LLC, as Assuming Lender, in favor of the Company as Borrower, and Sun Trust Bank, as administrative agent under the Revolving Credit Facility (incorporated by reference to Exhibit 10.3 to the Company’s Quarterly Report on Form 10-Q (file no. 001-35851), filed on May 14, 2015). | |
| 10.6 | Second Amendment to Senior Secured Revolving Credit Agreement, dated as of November 4, 2015, among Goldman Sachs BDC, Inc., as Borrower, the Lenders party thereto, SunTrust Bank, as Administrative Agent and as Collateral Agent, and, solely with respect to Section 5.9, DDDS BL, LLC (incorporated by reference to Exhibit 10.1 to the Company’s Form 8-K (File No. 814-00998), filed on November 5, 2015). | |
| 10.7 | Third Amendment to Senior Secured Revolving Credit Agreement, dated as of December 16, 2016, among Goldman Sachs BDC, Inc., as Borrower, the Lenders party thereto, and SunTrust Bank, as Administrative Agent and as Collateral Agent (incorporated by reference to Exhibit 10.1 to the Company’s Form 8-K (file no. 814-00998), filed on December 21, 2016). | |
| 10.8 | Amended and Restated Investment Management Agreement, dated as of January 1, 2015, between the Company and Goldman Sachs Asset Management, L.P. (incorporated by reference to Exhibit (g) to pre-effective Amendment No. 7 to the Company’s Registration Statement on Form N-2 (file no. 333-187642), filed on March 3, 2015.) | |
| 10.9 | Dividend Reinvestment Plan (incorporated by reference to Exhibit (e) to pre-effective Amendment No. 10 to the Company’s Registration Statement on Form N-2 (file no. 333-187642), filed on March 17, 2015). | |
| 10.10 | Dividend Reinvestment Plan, amended as of May 2, 2016 (incorporated by reference to Exhibit 10.1 to the Company’s quarterly Report on Form 10-Q (file no. 814-00998), filed on May 9, 2016). | |
140
| Exhibit No |
Description of Exhibits | |
| 10.11 | Dividend Reinvestment Plan, amended as of August 2, 2016 (incorporated by reference to Exhibit 10.2 to the Company’s Quarterly Report on Form 10-Q (file no. 814-00998), filed on August 4, 2016). | |
| 10.12 | Custody Agreement, dated as of April 1, 2013, between Registrant and State Street Bank and Trust Company (incorporated by reference to Exhibit (j) to pre-effective Amendment No. 8 to the Company’s Registration Statement on Form N-2 (file no. 333-187642), filed on March 10, 2015). | |
| 10.13 | Senior Credit Fund, LLC Limited Liability Company Agreement, dated as of July 18, 2014, between Goldman Sachs BDC, Inc. and Regents of the University of California (incorporated by reference to Exhibit (k)(6) to pre-effective Amendment No. 7 to the Company’s Registration Statement on Form N-2 (file no. 333-187642), filed on March 3, 2015). | |
| 10.14 | First Amendment to Senior Credit Fund, LLC Limited Liability Company Agreement, dated as of October 1, 2014, between Goldman Sachs BDC, Inc. and Regents of the University of California (incorporated by reference to Exhibit (k)(6)(a) to pre-effective Amendment No. 10 to the Company’s Registration Statement on Form N-2 (file no. 333-187642), filed on March 17, 2015). | |
| 10.15 | Transfer Agency and Service Agreement between the Company and State Street Bank and Trust Company dated as of March 17, 2015 (incorporated by reference to Exhibit 10.5 to the Company’s Quarterly Report on Form 10-Q (file no. 001-35851), filed on May 14, 2015). | |
| 10.16 | Transfer Agency and Services Agreement, effective as of May 2, 2016, by and between the Company, Computershare Inc. and Computershare Trust Company, N.A. (incorporated by reference to Exhibit 10.2 to the to the Company’s Quarterly Report on Form 10-Q (file no. 814-00998), filed on May 9, 2016). | |
| 10.17 | License Agreement, dated as of April 1, 2013, between the Registrant and the Goldman, Sachs & Co. (incorporated by reference to Exhibit (k)(4) to pre-effective Amendment No. 7 to the Company’s Registration Statement on Form N-2 (file no. 333-187642), filed on March 3, 2015). | |
| 11.1 | Computation of Per Share Earnings (included in the notes to the audited consolidated financial statements contained in this report). | |
| 14.1 | Code of Ethics of the Registrant (incorporated by reference to Exhibit (r)(1) to the Company’s Registration Statement on Form N-2 (file no. 333- 214506), filed on November 8, 2016). | |
| 24 | Power of attorney (included on the signature page hereto). | |
| 31.1 | Certification of Chief Executive Officer pursuant to Securities Exchange Act Rule 13a-14(a), as adopted pursuant to Section 302 of the Sarbanes-Oxley Act of 2002. | |
| 31.2 | Certification of Chief Financial Officer pursuant to Securities Exchange Act Rule 13a-14(a), as adopted pursuant to Section 302 of the Sarbanes-Oxley Act of 2002. | |
| 32.1 | Certification of Chief Executive Officer and Chief Financial Officer pursuant to 18 U.S.C. Section 1350, as adopted pursuant to Section 906 of the Sarbanes-Oxley Act of 2002. | |
141
SIGNATURES
Pursuant to the requirements of Section 13 or 15(d) of the Securities Exchange Act of 1934, the registrant has duly caused this report to be signed on its behalf by the undersigned, thereunto duly authorized.
| Date: February 28, 2017 | GOLDMAN SACHS BDC, INC. | |||||
| /s/ Brendan McGovern | ||||||
| Name: Brendan McGovern | ||||||
| Title: Chief Executive Officer and President | ||||||
Each person whose signature appears below constitutes and appoints Brendan McGovern, Jonathan Lamm and Caroline Kraus, and each of them, such person’s true and lawful attorney-in-fact and agent, with full power of substitution and revocation, for such person and in such person’s name, place and stead, in any and all capacities, to sign one or more Annual Reports on Form 10-K for the fiscal year ended December 31, 2016, and any and all amendments thereto, and to file same with all exhibits thereto, and other documents in connection therewith, with the Securities and Exchange Commission, granting unto said attorneys-in-fact and agents, and each of them, full power and authority to do and perform each and every act and thing requisite and necessary to be done in connection therewith, as fully to all intents and purposes as such person might or could do in person, hereby ratifying and confirming all that said attorneys-in-fact and agents and each of them, or their or his substitute or substitutes, may lawfully do or cause to be done by virtue hereof.
Pursuant to the requirements of the Securities Exchange Act of 1934, this report has been signed below by the following persons on behalf of the registrant and in the capacities indicated on February 28, 2017.
| Signature |
Title | |
| /s/ Brendan McGovern Brendan McGovern |
Chief Executive Officer and President (Principal Executive Officer) | |
| /s/ Jonathan Lamm Jonathan Lamm |
Chief Financial Officer and Treasurer (Principal Financial Officer and Principal Accounting Officer) | |
| /s/ Ashok N. Bakhru Ashok N. Bakhru |
Chairman of the Board of Directors | |
| /s/ Jaime Ardila Jaime Ardila |
Director | |
| /s/ Janet F. Clark Janet F. Clark |
Director | |
| /s/ Ross J. Kari Ross J. Kari |
Director | |
| /s/ Ann B. Lane Ann B. Lane |
Director | |
| /s/ Katherine Uniacke Katherine Uniacke |
Director | |
142