Attached files
| file | filename |
|---|---|
| 8-K - NEW JERSEY RESOURCES CORP | c82095_8k.htm |
| EX-99.1 - NEW JERSEY RESOURCES CORP | c82095_ex99-1.htm |
Exhibit 99.2

FISCAL 2015 THIRD QUARTER UPDATE July 31, 2015
Regarding Forward - Looking Statements 1 Certain statements contained in this presentation are forward - looking statements within the meaning of the Private Securities Litigation Reform Act of 1995 . New Jersey Resources (NJR or the Company) cautions readers that the assumptions forming the basis for forward - looking statements include many factors that are beyond NJR’s ability to control or estimate precisely, such as estimates of future market conditions and the behavior of other market participants . Words such as “anticipates,” “estimates,” “expects,” “projects,” “may,” “will,” “intends,” “plans,” “believes,” “should” and similar expressions may identify forward - looking information and such forward - looking statements are made based upon management’s current expectations and beliefs as of this date concerning future developments and their potential effect upon NJR . There can be no assurance that future developments will be in accordance with management’s expectations or that the effect of future developments on NJR will be those anticipated by management . Forward - looking information in this presentation includes, but is not limited to, certain statements regarding NJR’s NFE guidance for fiscal 2015 and NFE growth beyond 2015 , forecasted contribution of business segments to fiscal 2015 NFE and to NFE beyond fiscal 2015 , forecasted dividend growth, future NJNG customer growth, future capital expenditures and infrastructure investments , NJNG’s base rate case, NJR’s cash flow and balance sheet forecast, the long - term outlook for NJRCEV, diversification of NJRCEV’s strategy, NJRCEV’s future solar and wind projects, and the PennEast Pipeline project . The factors that could cause actual results to differ materially from NJR’s expectations include, but are not limited to, weather and economic conditions ; demographic changes in the NJNG service territory and their effect on NJNG’s customer growth ; volatility of natural gas and other commodity prices and their impact on NJNG customer usage, NJNG’s Basic Gas Supply Service (BGSS) incentive programs, NJRES’ operations and on the Company’s risk management efforts ; changes in rating agency requirements and/or credit ratings and their effect on availability and cost of capital to the Company ; the impact of volatility in the credit markets ; the ability to comply with debt covenants ; the impact to the asset values and resulting higher costs and funding obligations of NJR’s pension and post employment benefit plans as a result of downturns in the financial markets, a lower discount rate, revised actuarial assumptions, and impacts associated with the Patient Protection and Affordable Care Act ; accounting effects and other risks associated with hedging activities and use of derivatives contracts ; commercial and wholesale credit risks, including the availability of creditworthy customers and counterparties and liquidity in the wholesale energy trading market ; regulatory approval of NJNG’s planned infrastructure programs ; the ability to obtain governmental and regulatory approvals, land - use rights, electric grid interconnection (in the case of distributed power projects) and/or financing for the construction, development and operation of NJR’s energy investments and NJNG’s infrastructure projects in a timely manner ; risks associated with the management of the Company’s joint ventures and partnerships ; risks associated with our investments in distributed power projects, including the availability of regulatory and tax incentives, the availability of viable projects and NJR’s eligibility for ITCs and PTCs, the future market for SRECs (including the pace of solar project development in New Jersey), and operational risks related to projects in service ; timing of qualifying for ITCs and PTCs due to delays or failures to complete planned solar and wind energy projects and the resulting effect on our effective tax rate and earnings ; the level and rate at which NJNG’s costs and expenses are incurred and the extent to which they are allowed to be recovered from customers through the regulatory process ; the possible expiration of the BGSS incentive programs ; access to adequate supplies of natural gas and dependence on third - party storage and transportation facilities for natural gas supply ; operating risks incidental to handling, storing, transporting and providing customers with natural gas ; risks related to our employee workforce ; the regulatory and pricing policies of federal and state regulatory agencies ; the costs of compliance with present and future environmental laws, including potential climate change - related legislation ; risks related to changes in accounting standards ; the disallowance of recovery of environmental - related expenditures and other regulatory changes ; environmental - related and other litigation and other uncertainties ; risks related to cyber - attack or failure of information technology systems ; and the impact of natural disasters, terrorist activities, and other extreme events on our operations and customers, including any impacts to utility gross margin, and restoration costs . The aforementioned factors are detailed in the “Risk Factors” sections of our Annual Report on Form 10 - K filed on November 25 , 2014 , as filed with the Securities and Exchange Commission (SEC), which is available on the SEC’s website at sec . gov . Information included in this presentation is representative as of today only and while NJR periodically reassesses material trends and uncertainties affecting NJR’s results of operations and financial condition in connection with its preparation of management’s discussion and analysis of results of operations and financial condition contained in its Quarterly and Annual Reports filed with the SEC, NJR does not, by including this statement, assume any obligation to review or revise any particular forward - looking statement referenced herein in light of future events .
Disclaimer Regarding Non - GAAP Financial Measures 2 This presentation includes the non - GAAP measures net financial earnings (NFE), utility gross margin and financial margin . As indicators of the Company’s operating performance, these measures should not be considered alternatives to, or more meaningful than, GAAP measures, such as cash flow, net income, operating income or earnings per share . NFE (loss) and financial margin exclude unrealized gains or losses on derivative instruments related to the company’s unregulated subsidiaries and certain realized gains and losses on derivative instruments related to natural gas that has been placed into storage at NJRES . Volatility associated with the change in value of these financial and physical commodity contracts is reported in the income statement in the current period . In order to manage its business, NJR views its results without the impacts of the unrealized gains and losses, and certain realized gains and losses, caused by changes in value of these financial instruments and physical commodity contracts prior to the completion of the planned transaction because it shows changes in value currently as opposed to when the planned transaction ultimately is settled . An annual estimated effective tax rate is calculated for NFE purposes and any necessary quarterly tax adjustment is applied to NJRCEV, as such adjustment is related to tax credits generated by NJRCEV . NJNG’s utility gross margin represents the results of revenues less natural gas costs, sales and other taxes and regulatory rider expenses, which are key components of the company’s operations that move in relation to each other . Natural gas costs, sales and other taxes and regulatory rider expenses are passed through to customers and, therefore, have no effect on gross margin . Management uses NFE, utility gross margin and financial margin as supplemental measures to other GAAP results to provide a more complete understanding of the Company’s performance . Management believes these non - GAAP measures are more reflective of the Company’s business model, provide transparency to investors and enable period - to - period comparability of financial performance . For a full discussion of our non - GAAP financial measures, please see NJR’s most recent Form 10 - K, Item 7 . This information has been provided pursuant to the requirements of SEC Regulation G .
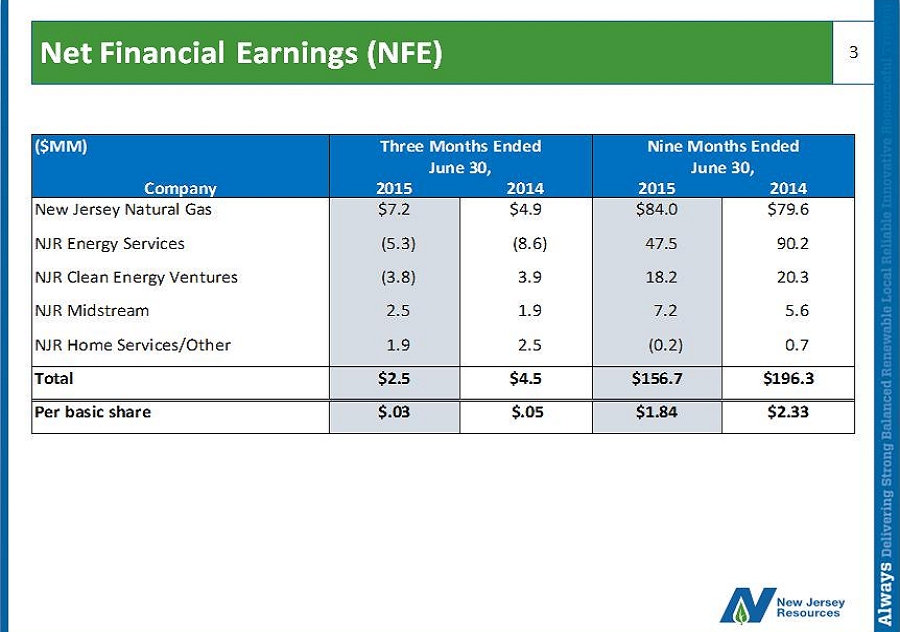
Net Financial Earnings (NFE) 3 ($MM) Company 2015 2014 2015 2014 New Jersey Natural Gas $7.2 $4.9 $84.0 $79.6 NJR Energy Services (5.3) (8.6) 47.5 90.2 NJR Clean Energy Ventures (3.8) 3.9 18.2 20.3 NJR Midstream 2.5 1.9 7.2 5.6 NJR Home Services/Other 1.9 2.5 (0.2) 0.7 Total $2.5 $4.5 $156.7 $196.3 Per basic share $.03 $.05 $1.84 $2.33 Three Months Ended June 30, Nine Months Ended June 30,

Increasing 2015 NFEPS Guidance to $1.70 - $1.80 4 New Jersey Natural Gas NJR Clean Energy Ventures NJR Energy Services NJR Midstream NJR Home Services $1.45 - $1.55 $1.60 - $1.70 $1.65 - $1.75 $0.00 $0.45 $0.90 $1.35 $1.80 $2.25 Original 2/4/2015 5/7/2015 Current $1.70 - $1.80 » NJRES exceeding fiscal 2015 expectations x Colder - than - normal weather created opportunities » NJNG benefitting from BGSS incentives » NJR expects regulated businesses to contribute 55 to 70 percent of fiscal 2015 NFE

Generating Average Annual NFE Growth of 5 – 9 Percent » Invest in Utility infrastructure projects that drive rate base growth x Organic customer growth x System and Facilities E nhancement program (SAFE) » Invest in Midstream projects such as PennEast Pipeline x Targeted NFE contribution from Regulated and Midstream of 65 – 80 percent » Provide physical and producer services to a variety of natural gas market participants through our Energy Services business x Targeted NFE contribution of 5 – 15 percent 5

Generating Average Annual NFE Growth of 5 – 9 Percent » Provide customers with cost - efficient renewable electricity through our Clean Energy business, while reducing ITC reliance x Targeted NFE contribution of 10 – 20 percent » Home Services will provide steady earnings x Targeted NFE contribution of 2 – 5 percent » Average annual dividend growth of 6 – 8 percent x Targeted payout of 60 – 65 percent 6
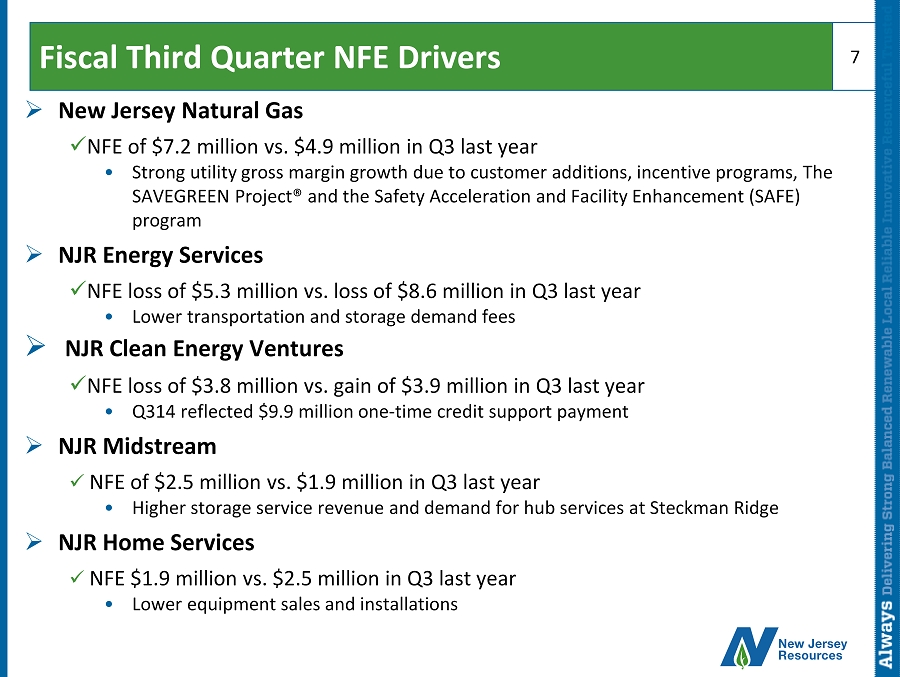
Fiscal Third Quarter NFE Drivers » New Jersey Natural Gas x NFE of $7.2 million vs. $4.9 million in Q3 last year • Strong utility gross margin growth due to customer additions, incentive programs, The SAVEGREEN Project® and the Safety Acceleration and Facility Enhancement (SAFE) program » NJR Energy Services x NFE loss of $5.3 million vs. loss of $8.6 million in Q3 last year • Lower transportation and storage demand fees » NJR Clean Energy Ventures x NFE loss of $3.8 million vs. gain of $3.9 million in Q3 last year • Q314 reflected $9.9 million one - time credit support payment » NJR Midstream x NFE of $2.5 million vs. $1.9 million in Q3 last year • Higher storage service revenue and demand for hub services at Steckman Ridge » NJR Home Services x NFE $1.9 million vs. $2.5 million in Q3 last year • Lower equipment sales and installations 7
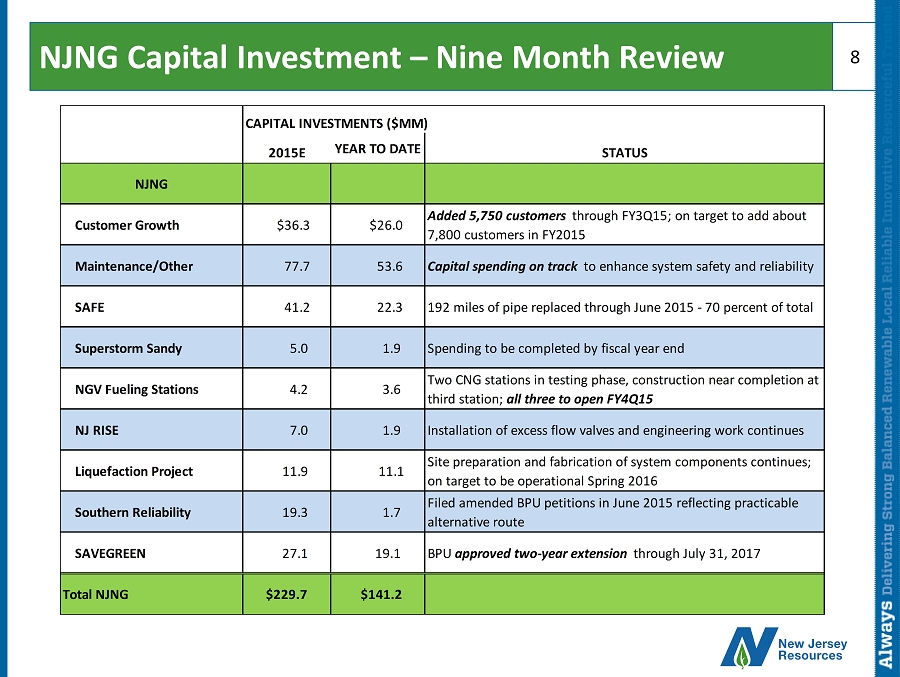
NJNG Capital Investment – Nine Month Review 8 CAPITAL INVESTMENTS ($MM) 2015E YEAR TO DATE STATUS NJNG Customer Growth $36.3 $26.0 Added 5,750 customers through FY3Q15; on target to add about 7,800 customers in FY2015 Maintenance/Other 77.7 53.6 Capital spending on track to enhance system safety and reliability SAFE 41.2 22.3 192 miles of pipe replaced through June 2015 - 70 percent of total Superstorm Sandy 5.0 1.9 Spending to be completed by fiscal year end NGV Fueling Stations 4.2 3.6 Two CNG stations in testing phase, construction near completion at third station; all three to open FY4Q15 NJ RISE 7.0 1.9 Installation of excess flow valves and engineering work continues Liquefaction Project 11.9 11.1 Site preparation and fabrication of system components continues; on target to be operational Spring 2016 Southern Reliability 19.3 1.7 Filed amended BPU petitions in June 2015 reflecting practicable alternative route SAVEGREEN 27.1 19.1 BPU approved two-year extension through July 31, 2017 Total NJNG $229.7 $141.2
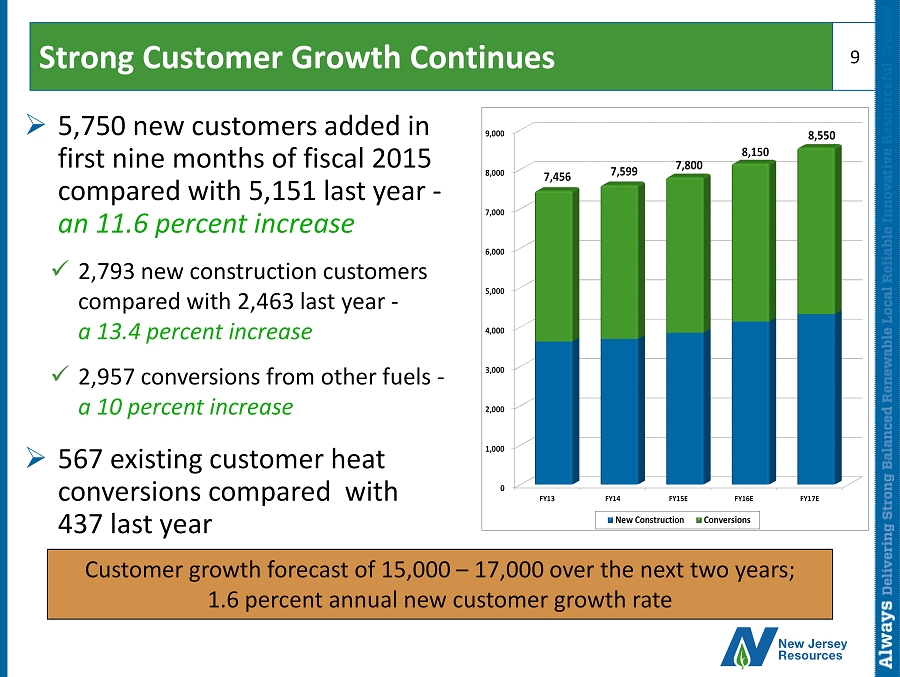
Strong Customer Growth Continues 9 » 5,750 new customers added in first nine months of fiscal 2015 compared with 5,151 last year - an 11.6 percent increase x 2,793 new construction customers compared with 2,463 last year - a 13.4 percent increase x 2,957 conversions from other fuels - a 10 percent increase » 567 existing customer heat conversions compared with 437 last year Customer growth forecast of 15,000 – 17,000 over the next two years; 1.6 percent a nnual new customer growth rate 0 1,000 2,000 3,000 4,000 5,000 6,000 7,000 8,000 9,000 FY13 FY14 FY15E FY16E FY17E 7,456 7,599 7,800 8,150 8,550 New Construction Conversions

November 2015 Rate Case Filing » Primarily driven by infrastructure investments » Required as part of the SAFE program approval » First base rate case filing since November 2007 Timeline and Current Status 10 Pre - hearing Hearings Summations Decision ALJ BPU 3 ½ Months 1 Month 1 ½ Months 3 Months November 15, 2015 March 1 April 1 May 15 August 15, 2016 » On track for November 2015 filing with a goal of new rates effective October 2016 » Preparing Rate Case Filing x Retaining outside consultants as witnesses in following areas: • Cost of Capital • Depreciation • Allocated Cost of Service Study/Rate design x Preparing pre - filed direct testimony supporting the following areas: • Rate base and a djustments to operating income • Tariff modification • Utility operations and projects

NJRES: Generated NFE Every Year Since 1995 » Serves wholesale customers across North America » Diverse portfolio of physical natural gas assets » 16 th largest North American Gas Marketer* » Firm storage (~40 Bcf in the US & Canada) » Firm transportation ( 1.4 Bcf/day ) » NJRES’ solid results driven by: x Periods of cold weather created short term increases in natural gas demand and price volatility » NJRES expected to contribute 5 to 15 percent of total NFE in fiscal 2016 and beyond. 11 $171.2 $89.6 $90.2 $47.5 $0 $20 $40 $60 $80 $100 $120 $140 $160 $180 Year to Date 2014 Year to Date 2015 $MM Financial Margin NFE * As reported by Natural Gas Intelligence, June 23, 2015

NJRCEV: Continued Portfolio Diversification Commercial Solar » 21 projects in service » 76.4 MW » Projects include roof - and ground - mounted installations, both grid - connected and net - metered Residential Solar - The Sunlight Advantage ® » 3,600+ customers added since inception » 32+ MW Onshore Wind » Two Dot - 9.7 MW, Montana – In service » Carroll Area – 20 MW, Iowa – In service » Alexander Wind Farm – 48 MW, Kansas – Under construction 12 Total of 138 MW installed; 22 percent of portfolio now wind assets

Improving SREC Fundamentals 13 Source: of Monthly Capacity Additions: NJ Clean Energy Program Source of SREC Prices: Karbone NJRCEV forecasts SREC production to grow to 214,000 by fiscal 2018 Installs (MW) $70 $235 $0 $50 $100 $150 $200 $250 SREC Prices 85.0 14.4 0 10 20 30 40 50 60 70 80 90 MW

SRECs Generated and Hedged 149 88 30 172 194 214 0 50 100 150 200 250 FY16 FY17 FY18 Thousands of SRECs Hedged Generated Current Generation 14 NJRCEV is actively hedging SRECs to reduce future price uncertainty Pct. Hedged: 87 45 14 Average Price: $207 $216 $217
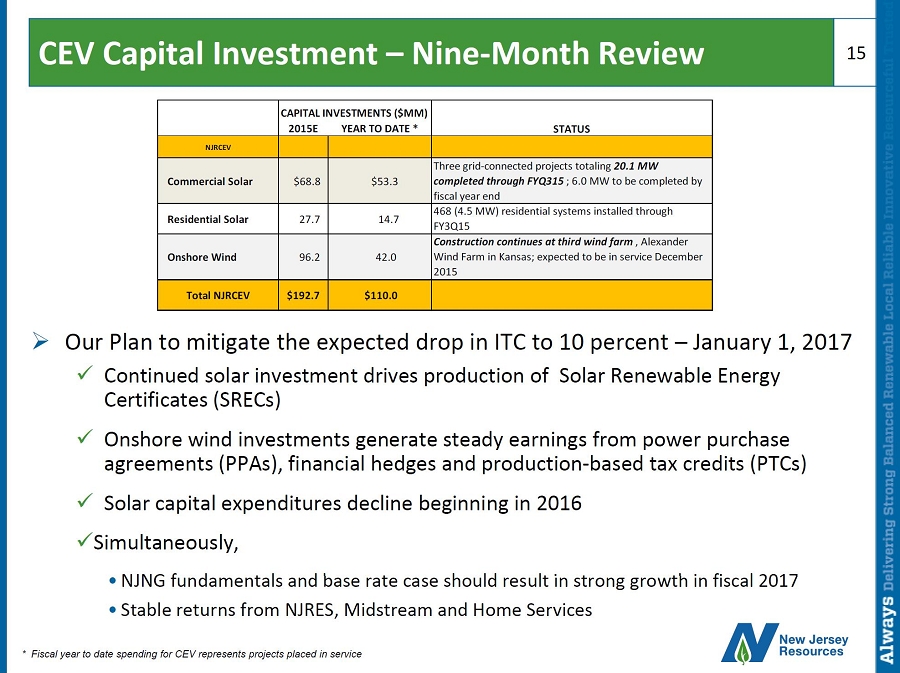
CEV Capital Investment – Nine - Month Review 15 CAPITAL INVESTMENTS ($MM) 2015E YEAR TO DATE * STATUS NJRCEV Commercial Solar $68.8 $53.3 Three grid-connected projects totaling 20.1 MW completed through FYQ315; 6.0 MW to be completed by fiscal year end Residential Solar 27.7 14.7 468 (4.5 MW) residential systems installed through FY3Q15 Onshore Wind 96.2 42.0 Construction continues at third wind farm, Alexander Wind Farm in Kansas; expected to be in service December 2015 Total NJRCEV $192.7 $110.0 * Fiscal year to date spending for CEV represents projects placed in service » Our Plan to mitigate the expected drop in ITC to 10 percent – January 1, 2017 x Continued solar investment drives production of Solar Renewable Energy Certificates (SRECs) x Onshore wind investments generate steady earnings from power purchase agreements ( PPAs ), financial hedges and production - based tax credits (PTCs) x Solar capital expenditures decline beginning in 2016 x Simultaneously, • NJNG fundamentals and base rate case should result in strong growth in fiscal 2017 • Stable returns from NJRES, Midstream and Home Services

Current Cash Flow Forecast 16 ($MM) 2015F 2016E 2017E Cash Flow from Operations $271.1 $237.5 $258.5 Uses of Funds Capital expenditures - NJNG ($189.4) ($233.7) ($153.9) Capital expenditures - PennEast (5.3) (42.2) (140.2) Capital expenditures - CEV (198.6) (157.3) (58.8) Dividends (76.1) (81.0) (87.0) Total Uses of Funds ($469.4) ($514.2) ($439.9) Financing Activities Common stock proceeds, net $30.0 $10.0 $10.0 Debt proceeds, net 168.3 266.7 171.4 Total Financing Activities $198.3 $276.7 $181.4 Incremental NJRES earnings used to reduce the need for future equity, while credit metrics expected to support current ratings
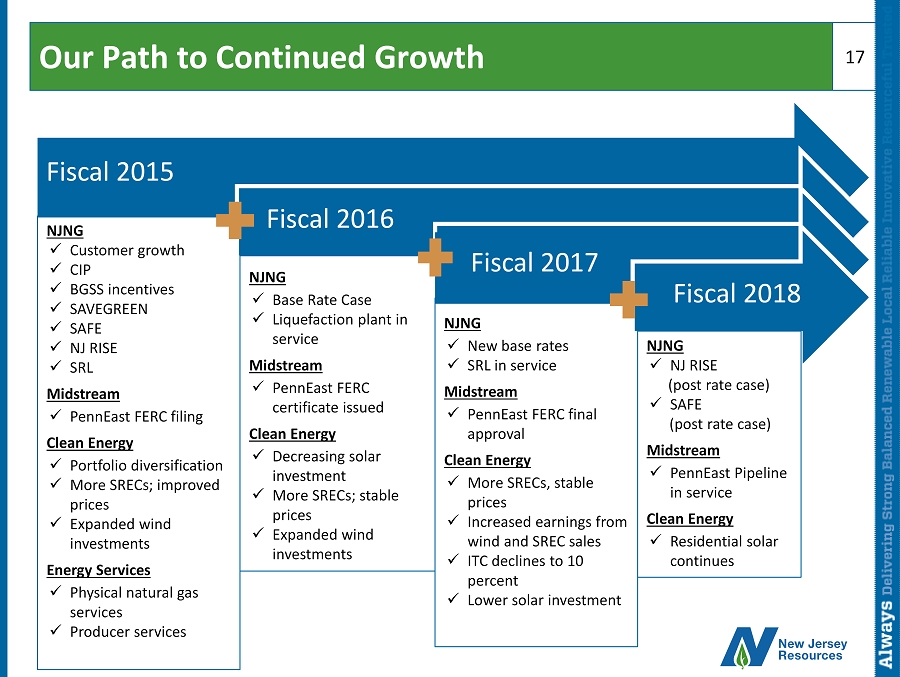
Our Path to Continued Growth 17 Fiscal 2015 NJNG x Customer growth x CIP x BGSS incentives x SAVEGREEN x SAFE x NJ RISE x SRL Midstream x PennEast FERC filing Clean Energy x Portfolio diversification x More SRECs; improved prices x Expanded wind investments Energy Services x Physical natural gas services x Producer services Fiscal 2016 NJNG x Base Rate Case x Liquefaction plant in service Midstream x PennEast FERC certificate issued Clean Energy x Decreasing solar investment x More SRECs; stable prices x Expanded wind investments Fiscal 2017 NJNG x New base rates x SRL in service Midstream x PennEast FERC final approval Clean Energy x More SRECs, stable prices x Increased earnings from wind and SREC sales x ITC declines to 10 percent x Lower solar investment Fiscal 2018 NJNG x NJ RISE (post rate case) x SAFE (post rate case) Midstream x PennEast Pipeline in service Clean Energy x Residential solar continues