Attached files
| file | filename |
|---|---|
| 8-K - FORM 8-K - ANCHOR BANCORP WISCONSIN INC | d73327d8k.htm |
| EX-99.1 - EX-99.1 - ANCHOR BANCORP WISCONSIN INC | d73327dex991.htm |
 Second
Quarter 2015 Earnings Presentation Exhibit 99.2
|
 2 This presentation does not constitute an offer to sell, nor a solicitation of an offer to buy, any securities of Anchor BanCorp Wisconsin, Inc. (the “Company”) by any person in any jurisdiction in which it is unlawful for such person to make such an offering or solicitation.
Neither the Securities and Exchange Commission nor any other regulatory body has approved or disapproved of the securities of Anchor or passed upon the accuracy or adequacy of this presentation. Any representation to the contrary is a criminal offense.
Except as otherwise indicated, this presentation speaks as of the date hereof. The
delivery of this presentation shall not, under any circumstances, create any implication that there has been no change in the affairs of the Company after the date hereof. Market and other statistical data used in this presentation has been obtained from independent industry sources and publications as well as from
research reports prepared for other purposes. Industry publications and
surveys and forecasts generally state that the information contained therein has been obtained from sources believed to be reliable. Anchor has not independently verified the data obtained from these sources. Forward-looking information obtained from these sources is
subject to the same qualifications and the additional uncertainties
regarding the other forward-looking statements in this presentation.
From time to time, Anchor may make forward-looking statements that reflect the
Company’s views with respect to, among other things, future events and financial performance. Words such as “may,” “should,” “could,” “predict,” “potential,” “believe,” “will
likely result,” “expect,” “continue,” “will,” “anticipate,” “seek,” “estimate,” “intend,” “plan,” “projection,”
“would” and “outlook,” or the negative version of those words or other comparable words are intended to identify forward-looking statements, but are not the exclusive means of identifying such statements. These forward-looking statements are not historical facts, and are based on current expectations, estimates and
projections about the Company’s industry, management’s beliefs
and certain assumptions made by management, many of which, by their nature, are inherently uncertain and beyond the Company’s control. Accordingly, you are cautioned that any such forward-looking statements are not guarantees of future performance and are subject to certain risks, uncertainties and assumptions that are difficult to predict. Although the Company believes that the expectations reflected in such forward-looking statements are
reasonable as of the date made, actual results may prove to be materially
different from the expected results expressed or implied by such forward-looking statements. Any forward-looking statement speaks only as of the date on which it was made, and unless otherwise required by law, the Company does not undertake any obligation to update or review any forward-looking statements, whether as a result of new information, future developments or otherwise. This presentation includes certain non-GAAP financial measures. These non-GAAP financial measures should be considered only as
supplemental to, and not as superior to, financial measures prepared in
accordance with GAAP. Please refer to the Appendix of this presentation for a reconciliation of the non-GAAP financial measures included in this presentation to the most directly comparable financial measures prepared in accordance with GAAP.
Cautionary Statement Regarding Forward-Looking
Information and Non-GAAP Financial Information |
 3 Continuing the Recovery & Executing Our Business Plan Continue Credit Improvement Execute Business Development Strategies Improve Efficiency Utilize the Value of the DTA¹ Normalize Excess Capital Building Shareholder Value 1) “DTA” refers to the Company’s deferred tax asset. |
 4 2015 Q2 Financial Highlights Non-Interest Expense Non-Interest Income Net Interest Income Asset Quality • NPLs down $7.5 million during Q2 2015, and a YTD decline of 50%. • OREO down $3.4 million during Q2 2015, and a YTD decline of 23%. • De-provision of $0.6 million in Q2 2015, ALLL coverage is strong. • Net interest income of $17.4 million during Q2 2015, up $0.4 million or 2% Q-O-MRQ.
• Net Interest Margin stable at 3.43%. • Earning asset yields and cost of funds stable at 3.65% and 0.24% respectively. • Non-interest income increased $1.0 million Q-O-MRQ (includes the Appleton – Fox building and Viroqua branch sales). • Non-interest income increased $2.1 million, or 28%, over Q-Q2 2014. • Gain on sale of loans and loan fees up Q-O-Q2 2014 by $1.2 million or 127%.
• Deposit Service Fees higher Q-O-Q2 2014 by $73,000 or an increase of 3%.
• Excluding one-time costs of $2.3 million, non-interest expense of $21 million was flat Q-
O-MRQ. • Non-interest expense (exclusive of one-time charges) is lower by $1.9 million Q-O-Q2
2014, or a decrease of 8%.
• Efficiency initiatives projected to lower expense by $5.4 million annually. Income • Net income of $107.5 million or $11.37 per diluted share. • Includes one-time tax benefit of $103.0 million or $10.89 per share related to reversal of
substantially all of the Company’s deferred tax asset valuation
allowance. •
Pre-tax income of $4.5 million or $0.48 per share includes one-time gains and
costs associated with previously announced efficiency
initiatives. |
 5 DTA Valuation Allowance Recapture DTA Valuation Allowance Reversal Update • Reversed substantially all of the DTA valuation allowance ($5.9 million state NOL DTA remains)
• Recognized $103.0 million of income tax benefit, net of current year provision, in Q2
• Evidence considered by management in supporting the reversal included: • Eight consecutive quarters of pre-tax earnings; • A three-year cumulative pre-tax book income position; • Significant reductions in the level of non-performing assets; • Successful execution of operational initiatives *Full Valuation Allowance Prior to 6/30/2015 Current Trading View on Tangible Book Value and Adjusted Tangible Book Value Basis
$ in Thousands $ Per Share $ in Thousands $ Per Share $ in Thousands $ Per Share Tangible Book Value $227,663 $23.85 $236,857 $24.66 $342,620 $35.68 Deferred Tax Assets* $113,099 $11.85 $109,452 $11.39 $5,900 $0.61 Tangible Book Value Including DTA $340,762 $35.70 $346,309 $36.05 $348,520 $36.30 Closing Stock Price $34.44 $34.73 $37.98 Stock Price Multiple to Tangible Book 144% 141% 106% Stock Price Multiple to Tangible Book Including DTA 96% 96% 105% 12/31/2014 3/31/2015 6/30/2015 |
 6 Net Interest Income * All data in millions 3.89% 3.77% 3.68% 3.64% 3.63% 3.65% Q1 '14 Q2 '14 Q3 '14 Q4 '14 Q1 '15 Q2 '15 Yield on Interest-earning Assets 0.25% 0.23% 0.22% 0.22% 0.23% 0.24% Q1 '14 Q2 '14 Q3 '14 Q4 '14 Q1 '15 Q2 '15 Cost of Interest-bearing Liabilities $18.3 $17.9 $17.6 $17.5 $17.1 $17.4 3.66% 3.55% 3.47% 3.43% 3.42% 3.43% Q1 '14 Q2 '14 Q3 '14 Q4 '14 Q1 '15 Q2 '15 Net Interest Income - Net Interest Margin (%) |
 7 Non-Interest Income 2 Other Non-interest Income includes investment and insurance commissions, gains/losses on sale of investment securities, other than temporary impairment of investment securities, gains/losses on sale of OREO, and other miscellaneous items 1 Includes $0.4 million and $1.4 million for Viroqua branch and Appleton – Fox facility sales * All data in millions $5.9 $7.6 $8.0 $9.0 $8.7 $9.7 Q1 '14 Q2 '14 Q3 '14 Q4 '14 Q1 '15 Q2 '15 Total Non-interest Income 1 |
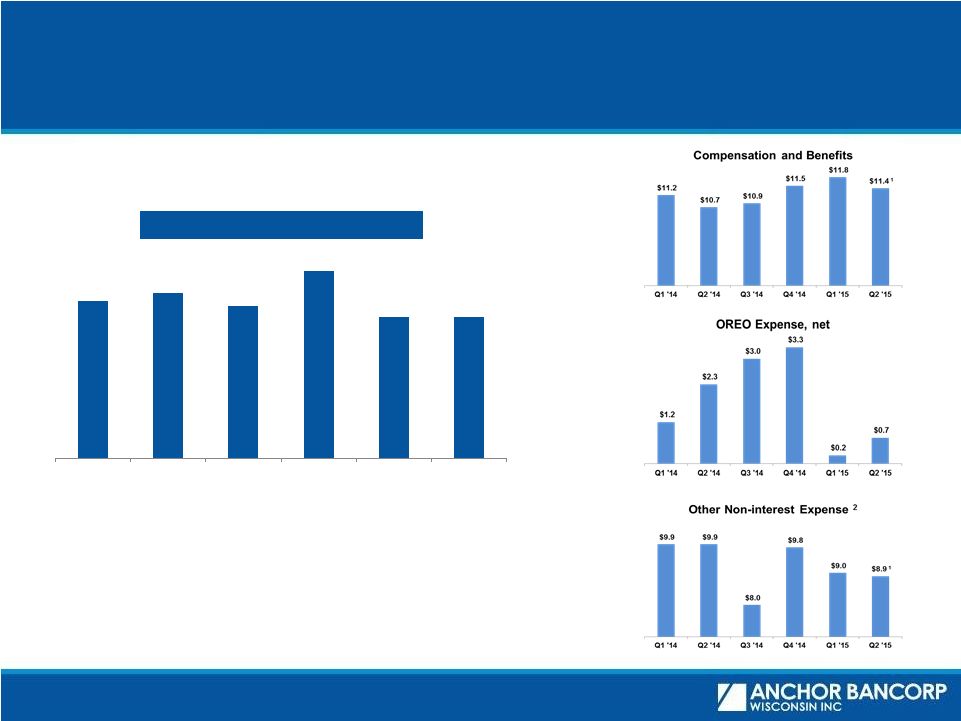 8 Non-Interest Expense 2 Other Non-interest Expense includes occupancy, FDIC insurance, furniture and equipment, data processing, marketing, MSR impairment/recovery, provision for unfunded commitments, and other miscellaneous items 1 Excludes $2.3 million of one-time changes ($2 million of compensation and $0.3 million of occupancy cost). Exclusive of one-time changes, non-interest expense was flat. * All data in millions $22.3 $22.9 $21.9 $24.6 $21.0 $21.0 Q1 '14 Q2 '14 Q3 '14 Q4 '14 Q1 '15 Q2 '15 Total Non-interest Expense 1 |
 9 Summary of Recent Initiatives Branch Rationalization Compensation & Benefits Occupancy Universal Banker Branch Staffing Model • 2014 Q4 – sold Richland Center Branch to Peoples Community Bank of Mazomanie • 2015 Q2 –sold Viroqua branch to Royal Bank of Elroy, announced sale of the
Winneconne branch to Premier Community Bank (settlement - September 2015) • 2015 Q2 – consolidating 6 branches in the Wisconsin communities of Appleton, Menasha, Oshkosh, Janesville, Franklin, and Madison, all with other branches within 5
miles • Expanded the Appleton Commercial facility for Retail Bank business • 2015 Q2 – New Universal Banker Branch staffing model – the majority of staff will be able to open new accounts and perform most branch transactions for customers improving branch efficiency and providing customers with strong customer service
• 2015 Q2 – Voluntary Separation Plan packages accepted by 78 of 140 eligible employees providing a variety of benefits including additional compensation, subsidized
COBRA health benefits, and optional job placement services
• 2015 Q1 - purchased new City View Madison Support Center consolidated various operational teams • 2015 Q2 – sold Appleton Fox facility for $1.4 million gain |
 10 Loan Portfolio & Yields Ending portfolio loan balances (1) are up Q-O-MRQ (March 2015) and Q-O-Q2 2014 (June 2014). Commercial and
Industrial loans and Commercial Real Estate loans are up 43% and 6% respectively since
June 2014. (1)
Loan balances reported per SEC categories gross of LIP, deferred fees, unearned
interest and ALLL Originated $216 million of portfolio loans in the
first and second quarters of 2015, and $429
million over the last 12 months, demonstrating
customer confidence in the Company. |
 Deposit
Mix Business Deposits Balances Trending Higher…
…Driven by Business Checking Growth
Business deposit data - monthly average balances 2015 Q2 Deposit Mix 2015 YTD Deposit Growth of $6.6 million includes the negative impact of branch deposit sales.
Adjusting for branch sales, deposits grew $17.8 million or 1%.
11 Attractive core deposit base with growing emphasis on relationship based commercial deposits driving low cost of funds. |
 Significantly Improved Asset Quality
Non-performing Asset Levels ($ millions)
¹ Non-performing loans and assets exclude troubled debt restructurings that are
now accruing. Source: Anchor SEC filings.
($000s) As of 12/31/2013 12/31/2014 6/30/2015 Nonaccrual loans $39,151 $18,632 $8,959 Troubled debt restructurings¹ 29,346 16,483 8,591 OREO 63,460 35,491 27,255 Total nonperforming assets $131,957 $70,606 $44,805 NPLs / Gross Loans 4.22% 2.22% 1.11% NPAs / Assets 6.25 3.39 2.03 ALLL / Gross Loans 4.02 2.97 2.97 ALLL / NPLs 95.16 133.95 268.02 12 Credit Quality Overview |
 Strong
Loan Loss Reserves Allowance to Total Loans
Held-for-Investment 1
Anchor peer group represents all Wisconsin banks and thrifts with total assets greater
than $500 million as of March 31, 2015. Note: Anchor data reflects
consolidated entity. Source: SNL Financial and Anchor SEC
filings. Anchor’s reserves are strong and sufficient to cover potential
credit losses. The ALLL to total NPLs was 268% at June 30, 2015, an
increase from 95% at December 31, 2013. Four consecutive quarters of de-provision. 13 |
 Strong
Capital Being strong and well capitalized allows Anchor to seek
opportunities to increase earnings and profitably grow our
company. Bank Tier 1 Core/Leverage Ratio
Bank Total Risk Based Capital Ratio
1 1 Capital ratios are reported for AnchorBank, fsb and calculated utilizing Basel III regulatory requirements effective
January 1, 2015 14 1 1 |
 15 ABCW Recent Market Performance Strong ABCW stock price performance since the public offering. Anchor committed to continued focus on building shareholder value. Volume (Shares) Stock Price Public Offering Russell Index Inclusion Russell Index Rebalancing 2015 Q1 Earnings Efficiency Initiatives 0 100,000 200,000 300,000 400,000 500,000 600,000 700,000 800,000 $25.00 $30.00 $35.00 $40.00 $45.00 |
 16 Highlights Delivered improved operating results Positive pre-tax net income since the recapitalization First quarter 2015 pre-tax income of $6.2 million, 220% increase over Q1 2014
Second quarter pre-tax income of $4.5 million, a 74% increase over Q2
2014 Maintaining attractive core deposits and low cost of
funds Rationalized
cost structure – lowering annual expense by an estimated $5.4 million Business plan execution and growth in loans Emphasis on growing C&I business – 43% loan growth in last 12 months - hired strong, experienced talent CRE lending remains strong and high quality Mortgage business transformation resulting in significant increase in production and
gain on sale year-over-year
Retail Bank branch rationalization and Universal Banker model allow for leveraging
sales and service culture and digital business delivery
Credit quality improved
NPAs decreased $25.8 million or 37% in 2015
OREO decreased $8.2 million or 23% in 2015
NPA/Total Assets improved from 3.39% to 2.03% during 2015
|
 17 Reconciliation of Non-GAAP Measures Non-GAAP Financial Measures¹ 1 Tangible common equity to tangible assets (the “tangible common equity ratio”) is a non-GAAP financial measure. The Company
calculates the tangible common equity ratio by excluding the balance of
preferred equity, goodwill and other intangible assets from common shareholders’ equity and assets. The Company considers this information important to shareholders as tangible equity is a measure that is consistent with the calculation of capital for bank regulatory purposes, which excludes intangible assets
from the calculation of risk-based ratios. This disclosure should not
be viewed as a substitute for results determined to be in accordance with GAAP, nor is it necessarily comparable to non-GAAP performance measures presented by other companies. ($000s) 12/31/2013 03/31/2014 06/30/2014 09/30/2014 12/31/2014 03/31/2015 06/30/2015 Total GAAP Equity / (Deficit) $202,198 $206,708 $211,507 $214,709 $227,663 $236,856 $342,620 Less: Preferred Equity - - - - - - - Less: Goodwill and Other Intangibles
- - - - - - - Tangible Common Equity
$202,198 $206,708 $211,507 $214,709 $227,663 $236,856 $342,620 Total GAAP Assets $2,112,474 $2,109,824 $2,121,249 $2,106,521 $2,082,379 $2,094,161 $2,205,595 Less: Goodwill and Other Intangibles - - - - - - - Tangible Assets
$2,112,474 $2,109,824 $2,121,249 $2,106,521 $2,082,379 $2,094,161 $2,205,595 Tang. Common Equity / Tang. Assets 9.57% 9.80% 9.97% 10.19% 10.93% 11.31% 15.53% As of, |