Attached files
UNITED STATES
SECURITIES AND EXCHANGE COMMISSION
Washington, D.C. 20549
FORM 10-K |
ý | ANNUAL REPORT PURSUANT TO SECTION 13 OR 15(d) OF THE SECURITIES EXCHANGE ACT OF 1934 |
For the year ended December 31, 2015
OR
¨ | TRANSITION REPORT PURSUANT TO SECTION 13 OR 15 (d) OF THE SECURITIES EXCHANGE ACT OF 1934 |
For the transition period from to
Commission File Number 001-34955
ANCHOR BANCORP WISCONSIN INC. | ||
(Exact name of registrant as specified in its charter) | ||
Delaware | 39-1726871 | |
(State or other jurisdiction of incorporation or organization) | (IRS Employer Identification No.) | |
25 West Main Street
Madison, Wisconsin 53703
(Address of principal executive office)
Registrant’s telephone number, including area code (608) 252-8700
Securities registered pursuant to Section 12 (b) of the Act:
Common stock, par value $0.01 per share | Nasdaq Global Market | |
(Title of Class) | (Name of each exchange on which registered) | |
Securities registered pursuant to Section 12 (g) of the Act:
Not Applicable
Indicate by check mark if the registrant is a well-known seasoned issuer, as defined in Rule 405 of the Securities Act. Yes ¨ No ý
Indicate by check mark if the registrant is not required to file reports pursuant to Section 13 or Section 15(d) of the Act. Yes ¨ No ý
Indicate by check mark whether the registrant (1) has filed all reports required to be filed by Section 13 or 15(d) of the Securities Exchange Act of 1934 during the preceding 12 months (or for such shorter period that the Registrant was required to file such reports) and (2) has been subject to such filing requirements for the past 90 days. Yes ý No ¨
Indicate by check mark whether the registrant has submitted electronically and posted on its corporate web site, if any, every Interactive Data File required to be submitted and posted pursuant to Rule 405 of Regulation S-T during the preceding 12 months (or for such shorter period that the registrant was required to submit and post such files). Yes ý No ¨
Indicate by check mark if disclosure of delinquent filers pursuant to Item 405 or Regulation S-K is not contained herein, and will not be contained, to the best of registrant’s knowledge, in definitive proxy or information statements incorporated by reference in Part III of the Form 10-K or any amendment to this Form 10-K. ý
Indicate by check mark whether the registrant is a large accelerated filer, an accelerated filer, a non-accelerated filer, or a smaller reporting company. See the definitions of “large accelerated filer,” “accelerated filer” and “smaller reporting company” in Rule 12b-2 of the Exchange Act.
Large accelerated filer | ¨ | Accelerated filer | ý | ||
Non-accelerated filer | ¨ (Do not check if a smaller reporting company) | Smaller reporting company | ¨ | ||
Indicate by check mark whether the Registrant is a shell company (as defined in Rule 12b-2 of the Act). Yes ¨ No ý
Indicate by check mark whether the registrant has filed all reports required to be filed by Section 12, 13 or 15(d) of the Securities Exchange Act of 1934 subsequent to the distribution of securities under a plan confirmed by the court. Yes ý No ¨
As of February 29, 2016, 9,597,392 shares of the Registrant’s common stock were outstanding. The aggregate market value of the outstanding shares of common stock (based upon the $37.98 last sale price on June 30, 2015, the last trading date of the Company’s second fiscal quarter) held by non-affiliates (excluding outstanding shares reported as beneficially owned by directors and executive officers; does not constitute an admission as to affiliate status) was approximately $287.1 million.
Documents Incorporated by Reference
The information required to be disclosed pursuant to Part III of this report either shall be (i) deemed to be incorporated by reference from selected portions of the Registrant’s definitive proxy statement for the 2016 annual meeting of stockholders, if such proxy statement is filed with the Securities and Exchange Commission (the “SEC”) pursuant to Regulation 14A not later than 120 days after the end of the Registrant’s most recently completed fiscal year, or (ii) included in an amendment to this report filed with the SEC on Form 10-K/A not later than the end of such 120 day period.
ANCHOR BANCORP WISCONSIN INC.
FORM 10-K ANNUAL REPORT
TABLE OF CONTENTS
Page | ||
PART I | ||
Item 1. | ||
Item 1A. | ||
Item 1B. | ||
Item 2. | ||
Item 3. | ||
Item 4. | ||
PART II | ||
Item 5. | ||
Item 6. | ||
Item 7. | ||
Item 7A. | ||
Item 8. | ||
Item 9. | ||
Item 9A. | ||
Item 9B. | ||
PART III | ||
Item 10. | ||
Item 11. | ||
Item 12. | ||
Item 13. | ||
Item 14. | ||
PART IV | ||
Item 15. | ||
i
FORWARD-LOOKING STATEMENTS
In the normal course of business, Anchor BanCorp Wisconsin Inc. (the "Company", “we”, “our”), in an effort to help keep our stockholders and the public informed about our operations, may from time to time issue or make certain statements, either in writing or orally, that are or contain forward-looking statements, as that term is defined in the U.S. federal securities laws. This annual report contains “forward-looking statements” within the meaning of the federal securities laws, which statements involve substantial risks and uncertainties. Forward-looking statements generally relate to business plans or strategies, projected or anticipated benefits from strategic transactions made by or to be made, projections involving anticipated revenues, earnings, liquidity, profitability or other aspects of operating results or other future developments in our affairs or the industry in which we conduct business. Forward-looking statements may be identified by reference to a future period or periods or by the use of forward-looking terminology such as “anticipate,” “believe,” “project,” “continue,” “ongoing,” “expect,” “intend,” “plan,” “estimate” or similar expressions.
Although we believe that the anticipated results or other expectations reflected in our forward-looking statements are based on reasonable assumptions, we can give no assurance that those results or expectations will be attained. Forward-looking statements involve risks, uncertainties and assumptions, some of which are beyond our control, and as a result, actual results may differ materially from those expressed in forward-looking statements due to several factors more fully described in “Risk Factors,” as well as elsewhere in this report. Factors that could cause actual results to differ from forward-looking statements include, but are not limited to, the following, as well as those discussed elsewhere herein:
• | our ability to successfully execute the merger with Old National Bancorp (as defined later); |
• | our ability to successfully transform our business and implement our business strategy; |
• | the risk that even though we have reversed substantially all of the deferred tax asset valuation allowance, we may be required to increase the valuation allowance in future periods, or we may not be able to realize the deferred tax assets in the future; |
• | changes in the quality or composition of our loan and investment portfolios, other real estate owned values and the allowance for loan losses; |
• | impact of potential impairment in a challenging economy; |
• | the ability of AnchorBank, fsb (the "Bank"), the Company's wholly owned subsidiary, to pay dividends; |
• | our ability to address our liquidity needs; |
• | deterioration in the value of commercial real estate, land and construction loan portfolios resulting in increased loan losses; |
• | uncertainties about market interest rates; |
• | demand for financial services, loss of customer confidence and customer deposit account withdrawals; |
• | competitive pressures intensifying and affecting our profitability, including as a result of continued industry consolidation, the increased availability of financial services from non-banks, technological developments or bank regulatory reform; |
• | security breaches of our information systems; |
• | changes in the conditions of the securities markets, which could adversely affect, among other things, the value or credit quality of our assets, the availability and terms of funding necessary to meet our liquidity needs and our ability to originate loans; |
• | soundness of other financial institutions with which we and the Bank engage in transactions; |
• | the performance of third party investment products we offer; |
• | environmental liability for properties which we own or to which we take title; |
• | the effects of any changes to the servicing compensation structure for mortgage servicers pursuant to the programs of government sponsored-entities; |
• | uncertainties relating to the Emergency Economic Stabilization Act of 2008, the American Recovery and Reinvestment Act of 2009, the Dodd-Frank Act (as defined later), the implementation by the U.S. Department of the Treasury and federal banking regulators of a number of programs to address capital and liquidity issues in the banking system and additional programs that will apply to us in the future, all of which may have significant effects on us and the financial services industry; and |
• | other risk factors included under “Risk Factors” in this report. |
Undue reliance should not be put on any forward-looking statements. Forward-looking statements speak only as of the date they are made and we undertake no obligation to update them in light of new information or future events, except to the extent required by federal securities laws.
ii
PART I
Item 1. | Business |
General
Anchor BanCorp Wisconsin Inc. (the “Company,” “we”, “our”) is a savings and loan holding company formed in 1992 to be the holding company for AnchorBank, fsb (the “Bank” or “AnchorBank”). The Company is headquartered in Madison, Wisconsin. In 2013, the Company was reincorporated as a Delaware corporation. Through the Bank we offer a full range of retail and commercial banking services to customers through our branch and commercial office locations in Wisconsin. The Company’s strategy focuses on building a strong franchise with meaningful commercial banking market share and growing revenues complemented by operational efficiencies that can produce attractive risk-adjusted returns to enhance stockholder value.
The Company is regulated as a savings and loan holding company and is subject to the periodic reporting requirements of the Securities and Exchange Commission (“SEC”) under the Securities Exchange Act of 1934, as amended (“Exchange Act”), and regulated by the Federal Reserve Bank. For further discussion, please refer to the "Regulation and Supervision” section.
The Bank was organized in 1919 as a Wisconsin chartered savings institution and converted to a federally chartered savings institution in 2000. The Bank is regulated by the Office of the Comptroller of the Currency (“OCC”). The Bank’s deposits are insured up to the maximum allowable amount by the Federal Deposit Insurance Company (“FDIC”).
The Bank’s core businesses listed below are dedicated to providing quality, personalized financial and investment services to local businesses and individuals:
• | Commercial banking division provides: |
• | Cash management services; |
• | Working capital lines of credit; |
• | Loans for fixed asset purchases; |
• | Lending for owner-occupied buildings; |
• | Construction lending; |
• | Commercial real estate lending including multi-family, retail, office and industrial; and |
• | A full range of deposit products. |
• | Retail banking division provides: |
• | Investment and advisory services; and |
• | A full range of consumer deposit and lending products, such as: |
• | Checking accounts; |
• | Interest-bearing checking accounts; |
• | Savings accounts; |
• | Money market accounts; |
• | Certificates of deposit accounts; |
• | Individual retirement accounts; and |
• | Consumer lending, including home equity loans. |
• | Retail lending division provides: |
• | Residential mortgage lending; |
• | Mortgage servicing; and |
• | Home construction financing. |
We believe our presence in the markets in which we serve, our local market knowledge and our ability to make responsive business decisions at the local level give us the ability to tailor our products and services to meet our customers' specific needs.
Business Combination
As previously announced on January 12, 2016, Evansville, Indiana based Old National Bancorp (NASDAQ: ONB) ("Old National") and the Company jointly announced the execution of a definitive agreement under which Old National will acquire the Company through a stock and cash merger.
Under the terms of the agreement, the Company's stockholders may elect to receive either 3.5505 shares of Old National common stock or $48.50 in cash for each share of the Company they hold, subject to the restriction that no more than 40% of the outstanding shares of the Company may receive cash. Based on Old National’s 10-day average closing share price through January 8, 2016, of $13.34, this represents a total transaction value of approximately $461.0 million. The transaction value is
1
likely to change until closing due to fluctuations in the price of Old National common stock and is also subject to adjustment under certain limited circumstances as provided in the merger agreement. The definitive merger agreement has been unanimously approved by the Board of both Old National and the Company. The transaction remains subject to regulatory approval and the vote of the Company's stockholders. The transaction is anticipated to close in the second quarter of 2016.
Our Path to the Present
As a result of the last economic downturn, beginning in fiscal 2009 we experienced significant operating losses, high levels of under-performing assets, depleted levels of capital and difficulty in raising additional capital necessary to stabilize the Bank as required by our banking regulators. The Company had credit obligations under a credit facility which we were unable to repay. As a consequence of the financial crisis and related challenges, on June 26, 2009, the Company and the Bank each consented to the issuance of an Order to Cease and Desist (individually, the “Company Order” and the “Bank Order”, respectively and collectively the “C&D Orders”). The C&D Orders were administered by the governing regulatory bodies of the Company and the Bank and required, among other things, a larger capital ratio and the submission of a capital restoration plan along with a revised business plan.
In late 2009, in an effort to raise necessary capital, we issued Fixed Rate Cumulative Perpetual Preferred Stock, Series B (the “TARP Preferred Stock”) and warrants to purchase common stock (the “TARP Warrant”) to the United States Department of the Treasury (the “Treasury”) as part of the Troubled Asset Relief Program (“TARP”). Thereafter, we and our advisors negotiated with the lenders and U.S. Bank National Association (“U.S. Bank”), as administrative agent (the “Administrative Agent”) for the lenders under the credit facility ("the Credit Agreement"), and with the U.S. Treasury, for a satisfactory settlement of our outstanding obligations. For further discussion please refer to the “Senior Debt Settlement” section below.
On August 12, 2013, we filed a Chapter 11 Case in the Bankruptcy Court to implement a Plan of Reorganization (“the Plan of Reorganization”) in order to facilitate the restructuring of the Company and the recapitalization of the Bank. Subsequently, the Bankruptcy Court entered a confirmation order (the “Confirmation Order”), whereby it confirmed the Plan of Reorganization. On September 27, 2013 (the “Effective Date”), the Plan of Reorganization became effective in accordance with its terms.
The following is a summary of the transactions consummated in connection with the Plan of Reorganization. Also see Note 2 to the Consolidated Financial Statements in Item 8.
• | Delaware Conversion and Reverse Stock Split |
Pursuant to the Plan of Reorganization, on September 25, 2013, we converted from a Wisconsin Corporation to a Delaware Corporation. The Certificate of Incorporation filed in Delaware as the result of the conversion was amended in October 2013 when we effected a reverse stock split (the “Reverse Stock Split”) reducing the authorized shares to 11,900,000 shares of common stock, par value $0.01 per share, and 100,000 shares of preferred stock, par value $0.01 per share. We sometimes refer to the Certificate of Incorporation, as amended, as the “Amended Charter.”
• | Private Placements |
In connection with the Plan of Reorganization, we entered into stock purchase agreements (the “Investor SPAs”) with certain investors for the purchase and sale of 1,750,000,000 shares of our common stock (adjusted to 8,750,000 shares as a result of the Reverse Stock Split) at a pre-Reverse Stock Split purchase price of $0.10 per share (implying a $20.00 per share price after giving effect to the Reverse Stock Split) and received gross proceeds of $175.0 million (the “Private Placements”) and incurred transaction costs of $14.4 million. The investors were certain institutional investors, other private investors, directors and officers.
• | TARP Exchange |
Also pursuant to the Plan of Reorganization, we exchanged the outstanding TARP Preferred Stock for 60,000,000 shares of common stock (adjusted to 300,000 common shares as a result of the Reverse Stock Split) (the “Treasury Issuance”) and cancelled the TARP Warrant in its entirety.
Following the effectiveness of the Plan of Reorganization, the Treasury sold to certain institutional investors (the “Secondary Investors”) all of the shares of common stock delivered to the Treasury in connection with the Treasury Issuance (the “Secondary Treasury Sales”). As a result of the Secondary Treasury Sales, the Treasury received gross proceeds of $6.0 million and ceased to be a stockholder.
2
• | Cancellation of Legacy Common Stock |
On the Effective Date, immediately following the consummation of the TARP Exchange and pursuant to the terms of the Plan of Reorganization, all 21,247,225 shares of previously issued and outstanding common stock of the Company (the “Legacy Common Stock”, including shares held as treasury stock and in any stock incentive plans), were cancelled for no consideration.
• | Senior Debt Settlement |
The aggregate amount of our obligations under the Credit Agreement was approximately $183.5 million as of August 12, 2013 (including with respect to unpaid principal balance, accrued but unpaid interest thereon and all administrative and other fees or penalties). On the Effective Date, pursuant to the Plan of Reorganization, we satisfied all of our obligations under the Credit Agreement by a cash payment to the lenders of $49.0 million (plus expense reimbursement as contemplated by the Credit Agreement). As a result of the transaction, we recognized a gain on extinguishment of debt of $134.5 million. All other claims were unaffected by, and were paid in full under, the Plan of Reorganization.
Emergence Accounting
Upon emergence from bankruptcy as a result of the Plan of Reorganization, we determined we did not meet the requirements to apply fresh start reporting under applicable accounting standards because we did not meet the solvency criteria of Accounting Standards Codification (“ASC”) Topic 852-10-45-19. The reorganization value immediately before the date of confirmation was greater than the total of all post-petition liabilities and allowed claims and, therefore, indicative of not meeting the test to require fresh start accounting under ASC Topic 852 - Reorganizations. As of the date of confirmation, we estimated our enterprise value (or reorganization value) to be approximately $2.2 billion. The Company utilized the equity value using the income and market approach to approximate fair value. Accordingly, the consolidated financial statements do not include fresh start reporting, whereby the Company would have to revalue all of its assets and liabilities.
Lifting of the Regulatory Orders
Having satisfied the conditions of the C&D Orders, the OCC notified the Bank on April 2, 2014, that it had terminated the Bank Order. The Federal Reserve Bank on July 31, 2014 notified the Company that it had terminated the Company Order. The Company and the Bank are no longer under any regulatory orders.
Initial Public Offering
In October 2014, the Company completed its initial public offering (the “IPO”) in which the Company issued and sold 250,000 shares of common stock along with 55,794 additional shares to cover overallotments. The Company’s common stock is now listed on the Nasdaq Global Market under the symbol “ABCW.”
Employees
As of December 31, 2015, the Company had 527 full-time equivalent employees. The Company promotes equal employment opportunity and considers employee relations to be excellent. None of the Bank or Company employees are represented by a collective bargaining group.
Company Filings
The Company maintains a website at www.anchorbank.com. All of the Company’s filings under the Exchange Act are available through our website, free of charge, including copies of Annual Reports on Form 10-K, Quarterly Reports on Form 10-Q, Current Reports on Form 8-K and amendments to those reports, on the date that the Company files those materials with, or furnishes them to, the SEC. The contents of our website are not incorporated by reference herein or otherwise as part of this annual report.
Market Area
The Bank provides products and services through 46 full-service branches located throughout the state of Wisconsin. The general business climate in Wisconsin has improved since 2010. CEO magazine indicates “The State of Wisconsin has moved to the 12th Best State To Do Business in 2015 from 42nd in 2010”. In addition, CNBC’s “Best Places To Do Business” has Wisconsin ranked #15 in 2015 up from #29 in 2010.
3
Our primary market area is concentrated within the triangle formed by the Madison, Fox Valley and Milwaukee markets in Wisconsin where the Bank has 28 of its 46 branches. Collectively, these areas account for nearly half of Wisconsin’s population and we believe they provide a desirable platform for long-term local and regional growth.
Our headquarters are located in Madison, Wisconsin which is a vibrant business community. Madison is the state capital and home to both state and county governments, as well as the University of Wisconsin-Madison. Dane County, where Madison is located, has enjoyed steady population growth of 5.8% annually since 2010, a median household income 15.0% above the national average and relatively low unemployment at 2.9% versus the state average of 4.3% and the national average of 5.0%, each as of December 2015, according to the U.S. Census data. In 2015, Dane County accounted for 14.2% of the employment growth in Wisconsin. The decline in unemployment rates from 2012 through 2015 in Dane County and in the State of Wisconsin were 1.6% and 2.6%, respectively. The Bank has 17 branches located in Dane County.
The Bank has five branches located in Wisconsin’s Fox Valley region, consisting primarily of the cities of Appleton and Oshkosh and their associated satellite communities. We are investing our efforts into developing more commercial business and commercial real estate opportunities for the Bank in this area as we believe that market is attractive for further development. The Bank has six branches in the greater Milwaukee area, one of the largest metropolitan areas in the Midwest and home to approximately 1.6 million people and close to 60,000 businesses according to SNL Financial LC. Milwaukee has been a solid source of commercial real estate and commercial banking business for the Bank and the real estate climate continues to improve in that region. The Bank’s remaining 18 locations are based primarily in counties adjacent to Dane and the southwestern region of Wisconsin.
Competition
The Bank encounters competition in attracting both loan and deposit customers. Such competition includes other banks, savings institutions, mortgage banking companies, credit unions, finance companies, mutual funds, insurance companies, brokerage, investment banking firms and other non-banks.
We believe that we are well-positioned to challenge our competition, grow our franchise and create value for our stockholders as a result of the following competitive strengths:
• | Experienced and respected management team with a proven track record. Our President and Chief Executive Officer, Chris Bauer, joined us in 2009 and recruited an executive management team, bringing in highly experienced community bankers with extensive knowledge of the Wisconsin banking market. Each of these executives has significant experience at nationally recognized mid- to large-cap commercial banking institutions. Mr. Bauer has 46 years of financial services experience, with a combined 16 years as bank president at First Wisconsin Bank and Firstar Bank Milwaukee, N.A. |
• | Strong capital position. At December 31, 2015, we had an 18.66% Common Equity Tier 1 ratio, an 18.66% tier 1 capital ratio, a 19.95% total capital ratio and a 13.52% tier 1 leverage ratio. |
• | Disciplined enterprise-wide and credit risk management. Since 2009, we have invested significantly in our risk management platform in order to provide a consistent approach to identifying, assessing, managing, monitoring and reporting risk across the Company. Our focus both on remediating our classified assets and improving and implementing enhanced credit underwriting and administration over the last six years has enabled us to significantly improve asset quality and create a stable banking platform from which to grow. |
• | Core funding. A significant component of our franchise is our core deposit base, such as checking and savings deposits, which we use to fund our loans and grow our balance sheet. At December 31, 2015, our total deposits were approximately $1.84 billion, 78.8% of which were core deposits (defined as total deposits excluding certificates of deposit). We seek to cross-sell deposit products at the time of loan origination to our clients as part of our focus on relationship banking in order to provide a stable source of funding. Our loan to deposit ratio was 89.7% at December 31, 2015. |
Business Strategy
Our business strategy centers around the following initiatives:
• | Strengthening our franchise by increasing commercial banking relationships and market share. Our primary strategic focus is the transformation of the Bank from a residential/commercial real estate lender to a service-driven, relationship-based franchise with a focus on building the commercial banking business and a continued dedication to our retail banking and commercial real estate businesses. We believe there is an underserved base of small and middle market businesses that are interested in banking with a company with leadership and decision-making authority based in the markets in which we operate. We intend to maintain disciplined growth, a strong credit culture and a |
4
relationship-based and community service-focused approach to banking. We continue to recruit seasoned commercial banking talent and transition our corporate culture toward building relationships and pursuing cross-selling opportunities through a sales and service model.
• | Expanding our commercial lending services. We plan to increase our commercial banking staff and sales efforts, emphasizing our multi-family and other commercial real estate banking businesses and a comprehensive commercial and industrial banking program designed to service manufacturing businesses, professional service firms and privately owned businesses and their related business owners. We believe these services are a key component in our transition to a commercial bank. |
• | Employing a sales and service culture and discipline. We are transitioning our corporate culture toward building relationships and pursuing cross-selling opportunities through a sales and service model. The sales and service model teaches the core elements of proactive sales and services, including bringing in more profitable sales from current clients, generating referrals, developing new relationships and servicing and retaining existing clients. |
• | Continuing to improve asset quality. Over the last six years, we have dedicated significant resources to reducing our level of problem assets and improving our credit risk function, including implementing comprehensive credit policies, procedures and monitoring systems in order to better manage the loan portfolio and any delinquent and troubled loans. Through these efforts and working with customers sooner to resolve delinquency issues, we have been able to show positive results in this area. |
• | Building a scalable and efficient operating model. Our management team is focused on sustainable expense control across all lines of business. We have made investments in information technology to improve efficiencies and enhance customer service, including upgraded account and data processing systems, improved loan monitoring and quality control systems and upgraded reporting systems. We implemented a sales activity database in the retail area of the Bank to better track sales performance and market penetration. In addition, we offered a Voluntary Separation Plan ("VSP") to eligible employees, consolidated six retail bank branches and created a new Universal Banker staffing model in the Bank's branch delivery system. |
• | Focusing on generating core deposits. We continue to focus on growing our retail and commercial core deposits to fund our lending and investment opportunities by expanding our business development efforts and improving product offerings, including a rebranding effort and execution of an integrated strategic marketing plan. As part of the strategic plan, we are placing an emphasis on providing ancillary services such as debit cards, online banking, online bill pay, mobile banking and most recently, mobile deposit via smart phones to enhance deposit growth. |
Recent Developments
Sale of Branches
Management regularly and periodically evaluates and assesses all aspects of the Bank’s operations, including, but not limited to, retail branch delivery and placement of its support functions, for opportunities to improve the profitability of the Company. In the case of branch delivery, this could include the closure, relocation, sale or other disposal of a branch or addition to the current branch structure.
The Bank sold its Viroqua branch operations on May 15, 2015. The sale consisted of selected loans and deposits. In addition, the sale included the building, furniture and equipment. As part of the sale, a lease on the land was terminated. Total deposits sold were $11.2 million and generated a gain on the sale of the branch operations of $448,000.
The Bank sold its Winneconne branch operations on September 25, 2015. The sale consisted of selected loans and deposits. In addition, the sale included the building, furniture and equipment. Total deposits sold were $11.9 million and generated a gain on the sale of the branch operations of $538,000. A gain of $294,000 was also recorded on the sale of the branch building.
Credit Card Arrangement
Up until December 31, 2014, credit was extended to Bank customers through credit cards issued by a third party, ELAN Financial Services (“ELAN”), pursuant to an agency arrangement under which the Company participated in outstanding balances, at levels of 25% to 28%. The Company also shared 33% to 37% of annual fees, and 30% of late payment, over limit and cash advance fees, as well as 25% to 30% of interchange income from the underlying portfolio net of our share of losses.
A new agreement was signed with ELAN effective January 1, 2015 providing the Bank an origination fee for each card sold. The Bank also receives a monthly fee from ELAN resulting from the performance of the originated portfolio, based on 11% of the interest income and 25% of the interchange income. As part of the new agreement, the Bank agreed to sell back to ELAN
5
its participation in outstanding credit card balances totaling $6.6 million with no gain or loss recognized. The Bank is therefore no longer exposed to credit risk from the underlying consumer credit.
Purchase of New Building
In January 2015, the Bank completed the purchase of a new building located on the east side of Madison at a purchase price of $4.0 million. This facility, which houses the Bank’s support departments, became operational during the second quarter of 2015.
Operational Efficiency Measures
The Bank completed several actions during the third quarter of 2015 to address and improve overall operational efficiency. Management anticipates that these actions will result in an annual net cost savings related to reduced compensation, occupancy and other operating costs of approximately $5.4 million. These actions included:
• | Offering a VSP to eligible employees. It was designed to provide eligible employees with a variety of benefits, including additional compensation, subsidized COBRA health benefits and optional job placement services. The program was offered to a group of 140 of the Bank’s 705 employees and 78 employees accepted the VSP with agreed-upon exit dates through September 30, 2015. |
• | Consolidating six retail bank branches in the Wisconsin communities of Appleton, Menasha, Oshkosh, Janesville, Franklin and Madison. Customers continue to have convenient and uninterrupted access to their deposit, lending and investment accounts at surrounding Bank locations in each of these markets, as well as access to online banking, ATMs and the Bank’s Contact Center. A total of 21 full- and part-time positions not eligible for the VSP were eliminated through the six branch consolidation. |
• | Creating a new Universal Banker staffing model in the Bank’s branch delivery system to address consumer shift towards digital products and services which has resulted in lower transaction volumes. The Universal Banker can perform most branch transactions for customers resulting in improved customer service. The Universal Bank staffing model has a core of employees who can process teller transactions, open new accounts and provide customer service. This core group of employees is further supported with one or more customer service associates. |
As a result of these operational efficiency measures, the Bank incurred one-time costs of $3.8 million, consisting primarily of employment severance and asset disposition costs. A gain of $1.4 million was recorded for the sale of the Appleton Fox River Drive branch building.
Deferred Tax Asset Valuation
During September 2009, the Company established a full deferred tax asset valuation allowance covering its federal and state tax loss carryforwards. As a result of management’s ongoing, periodic assessments of the deferred tax asset position, the Company determined that it is more likely than not it will be able to realize its deferred tax asset, including its entire federal tax loss carryforwards and a significant portion of its state tax loss carryforwards, with the exception of $4.2 million pertaining to certain multi state loss carryforwards, including states in which the Company no longer does business. Therefore, the Company reversed substantially all the deferred tax asset valuation allowance which resulted in the recognition of a $108.9 million income tax benefit, net of current tax provision.
Negative Provision for Loan Losses
The allowance for loan losses is maintained at a level believed appropriate by management to absorb probable and estimable losses inherent in the loan portfolio and is based on: the size and current risk characteristics of the loan portfolio; an assessment of individual impaired loans; actual and anticipated loss experience; and current economic events in specific industries and geographical areas. These economic events include unemployment levels, regulatory guidance and general economic conditions. Determination of the allowance is inherently subjective as it requires significant estimates, including the amounts and timing of expected future cash flows on impaired loans, estimated losses on pools of homogeneous loans based on historical loss experience and consideration of current economic trends, all of which may be susceptible to significant change. Therefore, the allowance for loan losses accounts for elements of imprecision and estimation risk inherent in the calculation.
During the year ended December 31, 2015, after a review of the factors listed above, the Company determined its levels of allowance were no longer warranted. The impact to the allowance for loan losses for the year ended December 31, 2015, was a $29.5 million negative provision for loan losses.
6
Lending Activities
General
The Bank originates residential loans secured by properties located primarily in Wisconsin, with adjustable-rate loans generally being originated for inclusion in the Bank’s loan portfolio and fixed-rate loans generally being originated for sale into the secondary market. The Bank also originates loans for commercial, corporate and business purposes, lines of credit, equipment, and owner occupied real estate loans as well as commercial real estate loans, which include land and construction, multifamily, retail/office and other commercial real estate. Further, the Bank offers consumer loans which are primarily made up of closed end second mortgage and home equity lines of credit (“HELOCs”) in order to provide a wider range of financial services to our customers.
At December 31, 2015, the Bank’s loans held for investment, net totaled $1.61 billion, representing approximately 71.8% of its $2.25 billion of total assets at that date. Loans held for investment, net based on the portfolio segment consist of single-family residential loans with a gross loan balance of $529.8 million, multi-family residential loans of $318.3 million, retail/office loans of $161.5 million, other commercial real estate loans of $143.7 million, land and construction loans of $143.4 million, commercial and industrial loans of $25.2 million and consumer loans of $319.0 million, net of an allowance for loan losses of $25.1 million.
Loan Portfolio Composition
The following table presents the composition of loans held for investment, net at the dates indicated:
December 31, | March 31, | |||||||||||||||||||||||||||||||||
2015 | 2014 | 2013 | 2013 | 2012 | ||||||||||||||||||||||||||||||
Amount | Percent of Total | Amount | Percent of Total | Amount | Percent of Total | Amount | Percent of Total | Amount | Percent of Total | |||||||||||||||||||||||||
(Dollars in thousands) | ||||||||||||||||||||||||||||||||||
Residential | $ | 529,775 | 32.3 | % | $ | 531,131 | 33.7 | % | $ | 519,455 | 32.2 | % | $ | 536,723 | 30.6 | % | $ | 548,393 | 25.2 | % | ||||||||||||||
Commercial and industrial loans | 25,199 | 1.5 | 16,514 | 1.0 | 21,591 | 1.3 | 30,574 | 1.7 | 38,977 | 1.8 | ||||||||||||||||||||||||
Commercial real estate: | ||||||||||||||||||||||||||||||||||
Land and construction | 143,419 | 8.7 | 106,436 | 6.8 | 92,050 | 5.7 | 111,953 | 6.4 | 186,048 | 8.6 | ||||||||||||||||||||||||
Multi-family | 318,313 | 19.4 | 265,735 | 16.9 | 281,917 | 17.5 | 287,447 | 16.4 | 342,216 | 15.8 | ||||||||||||||||||||||||
Retail/office | 161,497 | 9.8 | 155,095 | 9.9 | 154,075 | 9.6 | 198,686 | 11.3 | 298,277 | 13.7 | ||||||||||||||||||||||||
Other commercial real estate | 143,696 | 8.8 | 156,243 | 9.9 | 174,313 | 10.8 | 172,857 | 9.9 | 248,275 | 11.4 | ||||||||||||||||||||||||
Total commercial real estate | 766,925 | 46.7 | 683,509 | 43.5 | 702,355 | 43.6 | 770,943 | 44.0 | 1,074,816 | 49.5 | ||||||||||||||||||||||||
Consumer: | ||||||||||||||||||||||||||||||||||
Education | 91,671 | 5.6 | 108,384 | 6.9 | 129,520 | 8.0 | 166,429 | 9.5 | 240,331 | 11.1 | ||||||||||||||||||||||||
Other consumer | 227,283 | 13.9 | 233,482 | 14.9 | 238,307 | 14.9 | 247,527 | 14.2 | 269,528 | 12.4 | ||||||||||||||||||||||||
Total consumer | 318,954 | 19.5 | 341,866 | 21.8 | 367,827 | 22.9 | 413,956 | 23.7 | 509,859 | 23.5 | ||||||||||||||||||||||||
Total gross loans | 1,640,853 | 100.0 | % | 1,573,020 | 100.0 | % | 1,611,228 | 100.0 | % | 1,752,196 | 100.0 | % | 2,172,045 | 100.0 | % | |||||||||||||||||||
Unamortized loan fees, net | (753 | ) | (1,544 | ) | (1,722 | ) | (1,838 | ) | (3,086 | ) | ||||||||||||||||||||||||
Loans held for investment | 1,640,100 | 1,571,476 | 1,609,506 | 1,750,358 | 2,168,959 | |||||||||||||||||||||||||||||
Allowance for loan losses | (25,147 | ) | (47,037 | ) | (65,182 | ) | (79,815 | ) | (111,215 | ) | ||||||||||||||||||||||||
Loans held for investment, net | $ | 1,614,953 | $ | 1,524,439 | $ | 1,544,324 | $ | 1,670,543 | $ | 2,057,744 | ||||||||||||||||||||||||
7
The following table presents the scheduled contractual maturities of gross loans held for investment as of December 31, 2015, as well as the dollar amount of such loans which are scheduled to mature after one year which have fixed or adjustable interest rates disaggregated according to current classifications:
Residential | Commercial and Industrial | Commercial Real Estate | Consumer | Total | |||||||||||||||
(In Thousands) | |||||||||||||||||||
Amounts due: | |||||||||||||||||||
In one year or less | $ | 6,010 | $ | 8,689 | $ | 88,498 | $ | 13,216 | $ | 116,413 | |||||||||
After one year through five years | 9,069 | 15,669 | 396,657 | 96,393 | 517,788 | ||||||||||||||
After five years | 514,696 | 841 | 281,770 | 209,345 | 1,006,652 | ||||||||||||||
$ | 529,775 | $ | 25,199 | $ | 766,925 | $ | 318,954 | $ | 1,640,853 | ||||||||||
Interest rate terms on amounts due after one year: | |||||||||||||||||||
Fixed | $ | 218,251 | $ | 10,724 | $ | 365,794 | $ | 208,451 | $ | 803,220 | |||||||||
Adjustable | 305,514 | 5,786 | 312,633 | 97,287 | 721,220 | ||||||||||||||
Residential Loans. At December 31, 2015, $529.8 million, or 32.3%, of the total gross loans consisted of single-family residential loans. Residential loans consist of both adjustable and fixed-rate first lien mortgage loans. The adjustable-rate loans currently in the portfolio have up to 30-year maturities and terms which provide for annual increases or decreases of the rate on the loans, based on a margin over a designated index. These rate changes are generally subject to a limit of 2% per adjustment and an aggregate 6% adjustment over the life of the loan. These loans are underwritten and documented according to standard industry practices. The Company originates a very limited number of interest-only loans which tend to have a shorter term to maturity and does not originate negative amortization or option payment adjustable-rate mortgages.
Adjustable-rate loans decrease the risks associated with changes in interest rates but involve other risks, primarily because as interest rates rise, the payment by the borrower rises to the extent permitted by the terms of the loan, thereby increasing the potential for default. We believe that the risks associated with changes in interest rates, which have not had a material adverse effect to date, generally are less than the risks associated with holding fixed-rate loans in an increasing interest rate environment. Also, as interest rates decline, borrowers may refinance their mortgages into fixed-rate loans thereby prepaying the balance of the loan prior to maturity. At December 31, 2015, approximately $305.7 million, or 57.7%, of the held for investment residential gross loan balance consisted of loans with adjustable interest rates.
The Company originates intermediate and long-term, fixed-rate conventional mortgage loans. Current production of these loans (with terms of 15 years or more) are generally sold to institutional investors, while a portion of loan production is retained in the held for investment portfolio. In order to provide a full range of products to its customers, the Company also participates in the loan origination programs of Wisconsin Housing and Economic Development Authority (“WHEDA”). The right to service substantially all loans sold is retained.
At December 31, 2015, approximately $224.1 million, or 42.3%, of the held for investment residential gross loan balance consisted of loans with fixed rates of interest. Although these loans generally provide for repayments of principal over a fixed period of 10 to 30 years, because of prepayments and due-on-sale clauses, such loans generally remain outstanding for a shorter period of time.
Commercial and Industrial Loans. The Company originates loans for commercial and business purposes, including issuing letters of credit. At December 31, 2015, the gross loan balance of commercial and industrial loans amounted to $25.2 million, or 1.5%, of the total gross loans. The commercial and industrial loan portfolio is comprised of loans that are funded for a variety of business purposes and generally are secured by equipment, real estate and other business assets. These loans generally have terms of five years or less and interest rates that float in accordance with a designated published index. Substantially all such loans are secured and backed by the personal guarantees of the owners of the business.
Commercial Real Estate Loans. The Company originates commercial real estate loans which include land and construction, multi-family, retail/office and other commercial real estate. Such loans generally have shorter terms than single-family residential loans, thus increasing the earnings sensitivity of the loan portfolio to changes in interest rates, as well as providing higher fees and rates than residential loans. At December 31, 2015, $766.9 million of gross loans were secured by commercial real estate, which represented 46.7% of the total gross loans.
8
Commercial real estate loans are primarily secured by apartment buildings, office and industrial buildings, land, warehouses, small retail shopping centers and various special purpose properties, including community-based residential facilities and senior housing. Although terms vary, commercial real estate loans generally have fixed interest rates and amortization periods of 15 to 30 years, as well as balloon payments of two to seven years. The origination of such loans is generally limited to our primary market area.
Consumer Loans. The Company offers consumer loans in order to provide a wider range of financial services to its customers. At December 31, 2015, $319.0 million, or 19.5%, of the total gross loans consisted of consumer loans. Consumer loans, which include home equity loans, typically have higher interest rates than residential loans but generally involve more risk than residential loans because of the type and nature of the collateral and, in certain cases, the absence of collateral.
Approximately $91.7 million, or 5.6%, of the total gross loans at December 31, 2015 consisted of education loans. The origination of education loans was discontinued beginning October 1, 2010 following the March 2010 law ending loan guarantees provided by the U. S. Department of Education. Education loans generally have interest rates that adjust annually in accordance with a designated index. Both the principal amount of an education loan and interest thereon, up to 97% of the balance of the loan, are generally guaranteed by the Great Lakes Higher Education Company, which typically obtains reinsurance of its obligations from the U.S. Department of Education. Education loans may be sold to the U.S. Department of Education or to other investors. No education loans were sold during the years ended December 31, 2015 and 2014 and the nine months ended December 31, 2013.
Consumer loans secured by real estate include both first and second mortgages and consist primarily of the Express Refinance loan product (the Bank’s expedited first mortgage refinance and home equity loan product). Express Refinance loans are available for owner occupied one- to two-family residential properties, with loan amounts up to $200,000, a fixed interest rate, up to 15 year amortization, low fees and rapid closing timeframes. The primary home equity loan product is a home equity line of credit that has an adjustable rate linked to the prime interest rate and is secured by a mortgage, either a primary or a junior lien, on the borrower’s residence. New home equity lines do not exceed 85% of appraised value of the property at the loan origination date. A fixed-rate home equity second mortgage term product is also offered.
Beginning February 2015, the bank no longer offers the interest only payment option on new home equity lines of credit. Instead all loans are underwritten as if they were fully amortized over the life of the line and a minimum payment of 1% of the outstanding balance is due each month.
In May 2015, the Bank began offering a debit card for new and existing home equity lines of credit.
Net Fee Income From Lending Activities
Loan origination, commitment and other loan fees and certain direct loan origination costs are deferred and the net amounts are amortized as an adjustment to the related loan’s yield.
The Company also receives other fees and charges relating to existing residential, commercial and consumer loans, which include prepayment penalties, late charges and fees collected in connection with a change in borrower or other loan modifications. Other types of loans also generate fee income. These include annual fees assessed on credit card accounts, transactional fees relating to credit card usage and late charges on consumer loans.
In February 2015, the Bank began offering interest rate swap arrangements for certain commercial lending customers. The fees collected from the swap arrangements are recorded in loan fees in the Consolidated Financial Statements in Item 8.
Origination, Purchase and Sale of Loans
The Company’s new loan production comes from a number of sources. Residential mortgage loan production is originated primarily from depositors, branch customers, the Company’s website, non-compensated referrals from real estate brokers, builders and direct solicitations or purchased from other third-party mortgage originators. Commercial real estate and commercial and industrial loan production is obtained by direct solicitations and referrals. Consumer loans are originated from branch customers, existing depositors and mortgagors, and direct solicitation.
Credit Approvals. Loans may be approved by designated underwriting/concurrence officers or with the concurrence of the Chief Risk Officer, within pre-established limits, or by the Board. These pre-established limits are as follows:
• | Less than $3.0 million can be approved by a designated underwriting/concurrence officer; |
• | $3.0 million to $5.0 million must be approved by the Chief Risk Officer; |
• | In excess of $5.0 million must be approved by the Board. |
9
The Company regularly reviews its credit policies and these policies remain subject to amendment with the approval of the Board.
Appraisals and Underwriting. Property appraisals or evaluations on the real estate and improvements securing single-family residential loans are made by independent appraisers and managed by a third party appraisal management company during the underwriting process. Appraisals are performed in accordance with federal regulations and policies.
The Company’s general policy for residential mortgage loans is to lend up to 80% of the lesser of the appraised value or the purchase price of the property. However, the Company will lend more than 80% of the appraised value of the property, but will require that the borrower obtain private mortgage insurance in an amount intended to reduce exposure to 80% or less of the appraised value of the underlying property. The Company offers higher LTV lending on a limited basis for community oriented and personal loan programs.
The Company’s underwriting criteria generally require that commercial real estate loans have loan-to-value ratios of 80% or less and debt service coverage ratios of at least 1.2% to 1.3%, depending on the asset class. The Bank also has an underwriting criterion of a debt yield ratio which ranges from a minimum of 8.5% to 12%. Personal guarantees are obtained on most multi-family residential, commercial real estate loans and business loans. The Bank obtains appraisals of the collateral from independent appraisal firms.
The portfolio of commercial real estate and commercial and industrial loans is monitored on a continuing basis by the relationship manager who is responsible for identifying and reporting recommendations to mitigate risk ratings in the portfolio. The risk management function provides an independent review of this activity.
Loan Sales. The Company has been actively involved in the mortgage secondary market since the mid-1980s and generally originates single-family residential mortgage loans under terms, conditions and documentation which permit sale to investors. A significant portion of the fixed-rate, single-family residential loans with terms over 10 years originated are sold to investors. The Company attempts to limit any interest rate risk created by interest rate lock commitments by limiting the number of days between the commitment and closing, charging fees for commitments and limiting the amounts of unhedged commitments at any one time. Forward sale contracts and agency mortgage backed security commitments are used to economically hedge closed loans and rate lock commitments to customers range from 70% to 100% of the closed and committed amounts.
The following table presents the activity in loans held for sale:
Year Ended December 31, | Nine Months Ended December 31, | ||||||||||
2015 | 2014 | 2013 | |||||||||
(In thousands) | |||||||||||
Beginning Balance | $ | 6,594 | $ | 3,085 | $ | 18,058 | |||||
Originations | 264,244 | 146,894 | 228,748 | ||||||||
Sales | (260,515 | ) | (143,385 | ) | (243,721 | ) | |||||
Ending Balance | $ | 10,323 | $ | 6,594 | $ | 3,085 | |||||
Loan Servicing. The Company generally services all originated loans that have been sold into the secondary market. Servicing fees are recognized when the related loan payments are received. At December 31, 2015, $2.28 billion of loans are serviced for others.
At December 31, 2015, approximately $91.7 million of education loans and $3.7 million of purchased participation mortgage loans were being serviced for the Company by others.
Delinquency Procedures
Delinquent and problem loans are a normal part of any lending business. When a borrower fails to make a required payment by the 15th day after which the payment is due, internal collection procedures are instituted, if not earlier. The borrower is contacted to determine the reason for non-payment and attempts are made to cure the delinquency. Loan status, the condition of the property, and circumstances of the borrower are regularly reviewed. Based upon the results of our review, the Company may negotiate and accept a repayment program with the borrower, accept a voluntary deed in lieu of foreclosure, agree to the terms of a short sale or initiate foreclosure proceedings.
A decision as to whether and when to initiate foreclosure proceedings is based upon such factors as the amount of the outstanding loan in relation to the original indebtedness, the extent of delinquency, the value of the collateral, and the borrower’s financial ability and willingness to cooperate in curing the deficiencies. If foreclosed upon, the property is sold at a
10
public sale and the Company will generally bid an amount reasonably equivalent to the fair value of the foreclosed property or the amount of judgment due.
Real estate acquired by foreclosure or by deed in lieu of foreclosure as well as other repossessed assets (“OREO”) are held for sale and are initially recorded at fair value less a discount for estimated selling costs at the date of foreclosure. Any write down to fair value less estimated selling costs is charged to the allowance for loan losses. If the discounted fair value exceeds the net carrying value of the loans, recoveries to the allowance for loan losses are recorded to the extent of previous charge-offs, with any excess, which is infrequent, recognized as a gain in non-interest income. Subsequent to foreclosure, valuations are periodically performed and a valuation allowance is established if the carrying value exceeds the fair value less estimated selling costs. Costs relating to the development and improvement of the property may be capitalized, generally those greater than $10,000; holding period costs and subsequent changes to the valuation allowance are charged to OREO expense, net which is included in non-interest expense. Incremental valuation adjustments may be recognized in the Consolidated Statement of Operations if, in the opinion of management, additional losses are deemed probable.
For discussion of the Company’s asset quality, see “Management’s Discussion and Analysis of Financial Condition and Results of Operations” in Item 7. Also see Notes 1, 5 and 6 to the Consolidated Financial Statements in Item 8.
Investment Securities
In addition to lending activities, the Company conducts other investing activities on an ongoing basis in order to diversify assets, limit interest rate and credit risk, and meet regulatory liquidity requirements. The Company invests primarily in mortgage-related securities which are insured or guaranteed by Federal Home Loan Mortgage Corporation ("Freddie Mac"), Federal National Mortgage Association ("Fannie Mae") and the Government National Mortgage Association ("Ginnie Mae" or "GNMA"); and U.S. government agency obligations. Investment decisions are made by authorized officers in accordance with policies established by the Board.
Management determines the appropriate financial reporting classification of securities at the time of purchase. Debt securities may be classified as held to maturity when the Company has the intent and ability to hold the securities to maturity. Held to maturity securities are carried at amortized cost. Securities are classified as trading when the Company intends to actively buy and sell securities in order to make a profit. Trading securities are carried at fair value, with unrealized holding gains and losses included in earnings. Held to maturity securities at December 31, 2015 were $15.5 million. There were no securities designated as held to maturity at December 31, 2014. There were no securities designated as trading at December 31, 2015 and 2014.
Securities not classified as held to maturity or trading are classified as available for sale. Available for sale securities are carried at fair value, with the unrealized gains and losses, net of tax (if any), reported as a separate component of stockholders’ equity. For the years ended December 31, 2015 and 2014 and the nine months ended December 31, 2013, this component of stockholders’ equity decreased $848,000, increased $4.2 million and decreased $10.2 million, respectively, to reflect net unrealized gains and losses on holding securities classified as available for sale.
The Company’s investment policy, which conforms with OCC regulations, permits investments including U.S. Government obligations, municipal bonds, mortgage backed securities, securities issued by various federal agencies, corporate debt, certain certificates of deposit of insured banks and savings institutions, certain bankers’ acceptances, repurchase agreements and federal funds.
Agency-backed securities increase the quality of the Company’s assets by virtue of the insurance or guarantees of federal agencies that back them, require less capital under risk-based regulatory capital requirements than non-insured or guaranteed mortgage loans, are more liquid than individual mortgage loans and may be used to collateralize borrowings or other obligations of the Company. At December 31, 2015, all available for sale securities either were AAA rated or are guaranteed by government sponsored agencies. At December 31, 2015, $92.3 million of the Company’s securities available for sale were pledged to secure various obligations of the Company.
11
The table below sets forth information regarding the amortized cost and fair values of the Company’s investment securities at the dates indicated:
December 31, | |||||||||||||||||||||||
2015 | 2014 | 2013 | |||||||||||||||||||||
Amortized Cost | Fair Value | Amortized Cost | Fair Value | Amortized Cost | Fair Value | ||||||||||||||||||
(In thousands) | |||||||||||||||||||||||
Available for sale: | |||||||||||||||||||||||
U.S. government sponsored and federal agency obligations | $ | 3,130 | $ | 3,136 | $ | 3,245 | $ | 3,261 | $ | 3,359 | $ | 3,376 | |||||||||||
Mortgage backed securities | 342,211 | 338,384 | 293,755 | 291,335 | 281,047 | 274,141 | |||||||||||||||||
Other securities | 1 | 3 | 1 | 3 | 88 | 355 | |||||||||||||||||
$ | 345,342 | $ | 341,523 | $ | 297,001 | $ | 294,599 | $ | 284,494 | $ | 277,872 | ||||||||||||
Held to maturity: | |||||||||||||||||||||||
Corporate bonds | $ | 15,492 | $ | 15,422 | $ | — | $ | — | $ | — | $ | — | |||||||||||
The Company’s mortgage backed securities are made up of GNMA, government sponsored agency mortgage backed securities, and non-agency mortgage backed securities.
The following table sets forth the maturity and weighted average yield characteristics of investment securities at December 31, 2015, classified by term to maturity and reported at fair value:
Within One Year | One to Five Years | Five to Ten Years | Over Ten Years | ||||||||||||||||||||||||||||
Balance | Weighted Average Yield | Balance | Weighted Average Yield | Balance | Weighted Average Yield | Balance | Weighted Average Yield | Total | |||||||||||||||||||||||
(Dollars in thousands) | |||||||||||||||||||||||||||||||
Available for sale: | |||||||||||||||||||||||||||||||
U.S. government sponsored and federal agency obligations | $ | — | — | % | $ | 3,136 | 1.08 | % | $ | — | — | % | $ | — | — | % | $ | 3,136 | |||||||||||||
Mortgage backed securities | 3 | 1.78 | 127 | 4.87 | 9,675 | 1.75 | 328,579 | 1.88 | 338,384 | ||||||||||||||||||||||
Other securities | — | — | — | — | — | — | 3 | — | 3 | ||||||||||||||||||||||
$ | 3 | 1.78 | % | $ | 3,263 | 1.22 | % | $ | 9,675 | 1.75 | % | $ | 328,582 | 1.88 | % | $ | 341,523 | ||||||||||||||
Held to maturity: | |||||||||||||||||||||||||||||||
Corporate bonds | $ | — | — | % | $ | — | — | % | $ | 15,422 | 4.76 | % | $ | — | — | % | $ | 15,422 | |||||||||||||
Due to prepayments of the underlying loans, the actual maturities of certain investment securities are expected to be substantially earlier than the scheduled maturities.
For additional information regarding investment securities, see the Consolidated Financial Statements, including Note 4 thereto in Item 8.
Sources of Funds
General
Deposits are a major source of the Company’s funds for lending and other investment activities. In addition to retail and commercial deposits, funds are derived from principal repayments and prepayments on loan and mortgage backed securities, maturities of investment securities, sales of loans and securities, interest payments on loans and securities, advances from the Federal Home Loan Bank ("FHLB") of Chicago and, from time to time, repurchase agreements and other borrowings. Loan repayments and interest payments are a relatively stable source of funds, while deposit inflows and outflows and loan prepayments are significantly influenced by the general level of interest rates, economic conditions, the stock market and competition. Borrowings may be used on a short-term basis to compensate for reductions in the availability of funds from other sources. Borrowings may also be used on a longer term basis for general business purposes, including providing financing for lending and other investment activities and asset/liability management strategies.
12
Deposits
The Company’s deposit products include passbook and statement savings accounts, business and personal non-interest bearing checking, business and personal interest bearing checking accounts, business and personal money market deposit accounts and certificates of deposit ranging in terms from three months to five years. Included among these deposit products are Individual Retirement Account certificates and Keogh retirement certificates, as well as negotiable-rate certificates of deposit with balances of $100,000 or more (“jumbo certificates”).
Deposits are obtained primarily from residents of Wisconsin. The Company attracts deposits through a network of branch locations by utilizing a customer sales and service plan and by offering a wide variety of accounts and services, competitive interest rates and convenient customer hours. In determining the characteristics of deposit accounts, consideration is given to the profitability and liquidity of the Company, matching terms of the deposits with loan products, the attractiveness to customers and the rates offered by competitors.
The following table sets forth the amount and maturities of certificates of deposit by interest rate at December 31, 2015 and 2014:
Three Months and Less | Over Three Months Through One Year | Over One Year Through Two Years | Over Two Years Through Three Years | Over Three Years | Total | ||||||||||||||||||
(In thousands) | |||||||||||||||||||||||
December 31, 2015 | |||||||||||||||||||||||
0.00% to 0.99% | $ | 67,238 | $ | 147,119 | $ | 63,475 | $ | 7,022 | $ | 225 | $ | 285,079 | |||||||||||
1.00% to 1.99% | 1,329 | 13,046 | 36,512 | 20,900 | 25,299 | 97,086 | |||||||||||||||||
2.00% to 2.99% | 2,772 | 5,383 | — | — | — | 8,155 | |||||||||||||||||
$ | 71,339 | $ | 165,548 | $ | 99,987 | $ | 27,922 | $ | 25,524 | $ | 390,320 | ||||||||||||
December 31, 2014 | |||||||||||||||||||||||
0.00% to 0.99% | $ | 86,393 | $ | 186,310 | $ | 79,733 | $ | 6,707 | $ | 4,747 | $ | 363,890 | |||||||||||
1.00% to 1.99% | 270 | 2,757 | 15,571 | 23,419 | 29,601 | 71,618 | |||||||||||||||||
2.00% to 2.99% | 1,481 | 1,634 | 8,590 | — | — | 11,705 | |||||||||||||||||
$ | 88,144 | $ | 190,701 | $ | 103,894 | $ | 30,126 | $ | 34,348 | $ | 447,213 | ||||||||||||
At December 31, 2015, $64.8 million of certificates of deposit were greater than or equal to $100,000, of which $13.2 million are scheduled to mature in less than three months, $8.3 million in three to six months, $16.9 million in six to twelve months and $26.4 million in over twelve months. Certificates of deposit with balances greater than or equal to the FDIC insurance limit of $250,000 totaled $7.4 million at December 31, 2015.
Borrowings
From time to time the Company obtains advances from the FHLB of Chicago, which generally are secured by capital stock of the FHLB of Chicago and certain pledged mortgage loans and investment securities. Such advances are made pursuant to several different credit programs, each of which has its own interest rate and range of maturities.
The following table sets forth the outstanding balances and weighted average interest rates for borrowings at the dates indicated:
December 31, | ||||||||||||||||||||
2015 | 2014 | 2013 | ||||||||||||||||||
Balance | Weighted Average Rate | Balance | Weighted Average Rate | Balance | Weighted Average Rate | |||||||||||||||
(Dollars in thousands) | ||||||||||||||||||||
FHLB advances | $ | 10,000 | 2.33 | % | $ | 10,000 | 2.33 | % | $ | 10,000 | 2.33 | % | ||||||||
Repurchase agreements | 2,438 | 0.10 | 3,569 | 0.10 | 2,636 | 0.10 | ||||||||||||||
Long term lease obligation | 124 | 2.46 | 183 | 2.46 | 241 | 2.46 | ||||||||||||||
Total | $ | 12,562 | 1.90 | % | $ | 13,752 | 1.75 | % | $ | 12,877 | 1.88 | % | ||||||||
13
The following table sets forth information relating to short-term borrowings with original maturities of one year or less for the periods indicated:
December 31, | ||||||||||||||||||||
2015 | 2014 | 2013 | ||||||||||||||||||
Balance | Weighted Average Rate | Balance | Weighted Average Rate | Balance | Weighted Average Rate | |||||||||||||||
(Dollars in thousands) | ||||||||||||||||||||
Balance at end of period: | ||||||||||||||||||||
FHLB advances | $ | — | — | % | $ | — | — | % | $ | — | — | % | ||||||||
Credit agreement | — | — | — | — | — | — | ||||||||||||||
Repurchase agreements | 2,438 | 0.10 | 3,569 | 0.10 | 2,636 | 0.10 | ||||||||||||||
Maximum month-end balance: | ||||||||||||||||||||
FHLB advances | — | — | — | — | — | — | ||||||||||||||
Credit agreement | — | — | — | — | 116,300 | 15.00 | ||||||||||||||
Repurchase agreements | 6,629 | 0.10 | 3,569 | 0.10 | 4,949 | 0.12 | ||||||||||||||
Average balance: | ||||||||||||||||||||
FHLB advances | 48 | 0.02 | — | — | 3,055 | — | ||||||||||||||
Credit agreement | — | — | — | — | 75,701 | 9.30 | ||||||||||||||
Repurchase agreements | 3,014 | 0.10 | 3,030 | 0.10 | 5,122 | 0.09 | ||||||||||||||
Subsidiaries
Investment Directions, Inc. (“IDI”)
IDI is a wholly owned, non-banking subsidiary of the Company that has invested in various limited partnerships and subsidiaries funded by borrowings from us. The assets at IDI totaled $4.7 million at December 31, 2015, with $4.2 million related to deferred tax assets and the remaining assets primarily consisted of cash. For additional information regarding our deferred tax assets, see the Consolidated Financial Statements, including Note 17 thereto in Item 8. The assets at IDI totaled $520,000 at December 31, 2014, which primarily consisted of cash. IDI had net income of $5.9 million, $161,000, and $5.1 million for the years ended December 31, 2015 and 2014 and the nine months ended December 31, 2013.
ADPC Corporation (“ADPC”)
ADPC is a wholly owned subsidiary of the Bank that holds certain of the Bank’s foreclosed properties. The Bank's investment in ADPC at December 31, 2015 was $4.6 million, with $446,000 related to deferred tax assets and the remaining assets primarily consisted of cash. For additional information regarding our deferred tax assets, see the Consolidated Financial Statements, including Note 17 thereto in Item 8. The Bank’s investment in ADPC at December 31, 2014 was $4.1 million, which primarily consisted of cash. ADPC had net income of $526,000 for the year ended December 31, 2015, no net income or loss for the year ended December 31, 2014, and net income of $331,000 for the nine months ended December 31, 2013.
Regulation and Supervision
The U.S. banking industry is highly regulated under federal and state law. These regulations affect the operations of the Company and its subsidiaries. Statutes, regulations and policies limit the activities in which we may engage and the conduct of our permitted activities. Further, the regulatory system imposes reporting and information collection obligations. We incur significant costs relating to compliance with these laws and regulations. Banking statutes, regulations and policies are continually under review by federal and state legislatures and regulatory agencies, and a change in them, including changes in how they are interpreted or implemented, could have a material adverse effect on our business.
The material statutory and regulatory requirements that are applicable to us are summarized below. The description below is not intended to summarize all laws and regulations applicable to us.
The Bank as a Federal Savings Association
The Bank is a federal savings association organized under the federal Home Owners’ Loan Act (“HOLA”). A federal savings association is commonly referred to as a federal thrift. As a federal thrift, the Bank is currently subject to ongoing and comprehensive supervision, regulation, examination and enforcement by the OCC. The OCC regulates all areas of banking
14
operations, including investments, reserves, lending, mergers, payment of dividends, interest rates, transactions with affiliates (including the Company), establishment of branches and other aspects of the Bank’s operations. The Bank is subject to regular examinations by the OCC and is assessed amounts to cover the costs of such examinations.
The Company as a Savings and Loan Holding Company
Under Section 10 of HOLA, any entity that holds or acquires direct or indirect control of a thrift must obtain prior approval of the Federal Reserve to become a savings and loan holding company (“SLHC”). The Company, which controls the Bank, is registered with the Federal Reserve as an SLHC and is currently subject to ongoing and comprehensive Federal Reserve supervision, regulation, examination and enforcement. In addition, we must file quarterly and annual reports with the Federal Reserve describing the Company’s consolidated financial condition. This Federal Reserve jurisdiction also extends to any company that is directly or indirectly controlled by the Company.
FDIC Deposit Insurance
The FDIC is an independent federal agency that insures the deposits of federally insured depository institutions up to applicable limits. The FDIC also has certain regulatory, examination and enforcement powers with respect to FDIC-insured institutions. The deposits of the Bank are insured by the FDIC up to the applicable limits. As a general matter, the maximum deposit insurance amount is $250,000 per depositor.
Broad Supervision, Examination and Enforcement Powers
A principal objective of the U.S. bank regulatory system is to protect depositors by ensuring the financial safety and soundness of banking organizations. To that end, the banking regulators have broad regulatory, examination and enforcement authority. The regulators regularly examine the operations of banking organizations. In addition, banking organizations are subject to periodic reporting requirements. The regulators have various remedies available if they determine that the financial condition, capital resources, asset quality, earnings prospects, management, liquidity or other aspects of a banking organization’s operations are unsatisfactory. The regulators may also take action if they determine that the banking organization or its management is violating or has violated any law or regulation. The regulators have the power to, among other things:
• | enjoin “unsafe or unsound” practices; |
• | require affirmative actions to correct any violation or practice; |
• | issue administrative orders that can be judicially enforced; |
• | direct increases in capital; |
• | direct the sale of subsidiaries or other assets; |
• | limit dividends and distributions; |
• | restrict growth; |
• | assess civil monetary penalties; |
• | remove officers and directors; and |
• | terminate deposit insurance. |
The FDIC may terminate a depository institution’s deposit insurance after notice and a hearing upon a finding that the institution’s financial condition is unsafe or unsound or that the institution has engaged in unsafe or unsound practices or has violated any applicable rule, regulation, order or condition enacted or imposed by the institution’s regulatory agency. Engaging in unsafe or unsound practices or failing to comply with applicable laws, regulations and supervisory agreements could subject the Company, and subsidiaries of the Company or their officers, directors and institution-affiliated parties, to the remedies described above and other sanctions.
The Dodd-Frank Act
The Dodd-Frank Act imposes significant regulatory and compliance requirements on financial institutions, including the designation of certain financial companies as systemically important financial companies, the changing roles of credit rating agencies, the imposition of increased capital, leverage, and liquidity requirements, and numerous other provisions designed to improve supervision and oversight of, and strengthen safety and soundness within, the financial services sector. Additionally, the Dodd-Frank Act established a new framework of authority to conduct systemic risk oversight within the financial system to be distributed among new and existing federal regulatory agencies, including the Financial Stability Oversight Council, the Federal Reserve, the OCC and the FDIC. The following items provide a brief description of certain provisions of the Dodd-Frank Act that are most relevant to the Company and the Bank.
Under the Dodd-Frank Act, the risk-based and leverage capital standards currently applicable to U.S. insured depository institutions will be imposed on U.S. bank holding companies and SLHCs, and depository institutions and their holding
15
companies will be subject to minimum risk-based and leverage capital requirements on a consolidated basis. In addition, the Dodd-Frank Act requires that SLHCs be well capitalized and well managed in the same manner as bank holding companies in order to engage in the expanded financial activities permissible only for a financial holding company.
Source of strength. The Dodd-Frank Act requires all companies, including SLHCs, that directly or indirectly control an insured depository institution to serve as a source of strength for the institution. Under this requirement, the Company in the future could be required to provide financial assistance to the Bank should it experience financial distress.
Limitation on federal preemption. The Dodd-Frank Act significantly reduces the ability of national banks and federal thrifts to rely upon federal preemption of state consumer financial laws. Although the OCC, as the primary regulator of federal thrifts, will have the ability to make preemption determinations where certain conditions are met, the broad rollback of federal preemption has the potential to create a patchwork of federal and state compliance obligations. This could, in turn, result in significant new regulatory requirements applicable to us, with potentially significant changes in our operations and increases in our compliance costs. It could also result in uncertainty concerning compliance, with attendant regulatory and litigation risks.
Mortgage loan origination and risk retention. The Dodd-Frank Act contains additional regulatory requirements that may affect our operations and result in increased compliance costs. For example, the Dodd-Frank Act imposes new standards for mortgage loan originations on all lenders, including banking organizations, in an effort to require steps to verify a borrower’s ability to repay. In addition, the Dodd-Frank Act generally requires lenders or securitizers to retain an economic interest in the credit risk relating to loans the lender sells or mortgage and other asset-backed securities that the securitizer issues. The risk retention requirement generally will be 5%, but could be increased or decreased by regulation. On January 10, 2013, federal regulators released the “qualified mortgage” rule. The qualified mortgage rule is intended to clarify the application of the Dodd-Frank Act requirement that mortgage lenders have a reasonable belief that borrowers can afford their mortgages, or the lender may not be able to foreclose on the mortgage.
On August 28, 2013, the OCC, the Federal Reserve, the FDIC, the SEC, the Federal Housing Finance Agency and the U.S. Department of Housing and Urban Development issued a revised proposed rule in connection with the risk retention requirement mandated by Section 941 of the Dodd-Frank Act. The risk retention requirement generally requires a securitizer to retain no less than 5% of the credit risk in assets it sells into a securitization and prohibits a securitizer from directly or indirectly hedging or otherwise transferring the credit risk that the securitizer is required to retain, subject to limited exemptions.
The proposed rule includes alternatives for structuring the economic interest required to be retained and the application of the rules to specific types of securitization transactions, as well as exemptions from the standard 5% risk retention requirement. One significant exemption is for securities entirely collateralized by “qualified residential mortgages” (“QRMs”), which are loans deemed to have a lower risk of default. The proposed rule defines QRMs to have the same meaning as the term “qualified mortgage,” as defined by the Consumer Financial Protection Bureau. In addition, the Proposed Rule provides for reduced risk retention requirements for qualifying commercial loan, commercial real estate loan and auto loan securitizations.
Imposition of restrictions on certain activities. The Dodd-Frank Act imposes a new regulatory structure on the over-the-counter derivatives market, including requirements for clearing, exchange trading, capital, margin, reporting, and record keeping. In addition, certain swaps and other derivatives activities are required to be “pushed out” of insured depository institutions and conducted in separately capitalized non-bank affiliates. The Dodd-Frank Act also requires certain persons to register as a “major security-based swap participant” or a “security-based swap dealer.” The U.S. Commodity Futures Trading Commission, the SEC and other U.S. regulators are in the process of adopting regulations to implement the Dodd-Frank Act. It is anticipated that this rulemaking process will further clarify, among other things, reporting and recordkeeping obligations, margin and capital requirements, the scope of registration requirements, and what swaps are required to be centrally cleared and exchange-traded. Rules will also be issued to enhance the oversight of clearing and trading entities. These restrictions may affect our ability to manage certain risks in our business.
Expanded FDIC resolution authority. While insured depository institutions have long been subject to the FDIC’s resolution process, the Dodd-Frank Act creates a new mechanism for the FDIC to conduct the orderly liquidation of certain “covered financial companies,” including bank and thrift holding companies and systemically significant non-bank financial companies. Upon certain findings being made, the FDIC may be appointed receiver for a covered financial company, and would conduct an orderly liquidation of the entity. The FDIC liquidation process is modeled on the existing Federal Deposit Insurance Act (the “FDIA”) bank resolution process, and generally gives the FDIC more discretion than in the traditional bankruptcy context. The FDIC has issued final rules implementing the orderly liquidation authority.
Consumer Financial Protection Bureau. The Dodd-Frank Act created the Consumer Financial Protection Bureau (the “CFPB”). While technically located within the Federal Reserve, the CFPB is and functions as an independent agency. The CFPB is tasked with establishing and implementing rules and regulations under certain federal consumer protection laws with respect to the
16
conduct of providers of certain consumer financial products and services. The CFPB has rulemaking authority over many of the statutes governing products and services offered to bank and thrift consumers. For banking organizations with assets of more than $10 billion, the CFPB has exclusive rule making and examination, and primary enforcement authority under federal consumer financial law. For depository institutions with $10 billion or less in assets, such as the Bank, examination and primary enforcement authority will remain largely with the institutions’ primary regulator. However, the CFPB may participate in examinations of these smaller institutions on a “sampling basis” and may refer potential enforcement actions against such institutions to their primary regulator. In addition, the Dodd-Frank Act permits states to adopt consumer protection laws and regulations that are stricter than those regulations promulgated by the CFPB. Compliance with any such new regulations would increase our cost of operations.
Deposit insurance. The Dodd-Frank Act made permanent the general $250,000 deposit insurance limit for insured deposits. Amendments to the FDIA also revised the assessment base against which an insured depository institution’s deposit insurance premiums paid to the Deposit Insurance Fund (“DIF”) of the FDIC will be calculated. Under the amendments, the assessment base is no longer the institution’s deposit base, but rather its average consolidated total assets less its average tangible equity. Additionally, the Dodd-Frank Act makes changes to the minimum designated reserve ratio of the DIF, increasing the minimum from 1.15% to 1.35% of the estimated amount of total insured deposits, and eliminating the requirement that the FDIC pay dividends to depository institutions when the reserve ratio exceeds certain thresholds. Several of these provisions may impact the FDIC deposit insurance premiums paid by the Bank.
Transactions with affiliates and insiders. The Dodd-Frank Act generally enhanced the restrictions on transactions with affiliates under Section 23A and 23B of the Federal Reserve Act, including an expansion of the definition of “covered transactions” and a clarification of the amount of time for which collateral requirements regarding covered credit transactions must be satisfied. Insider transaction limitations were expanded through the strengthening of loan restrictions to insiders and the expansion of the types of transactions subject to the various limits, including derivatives transactions, repurchase agreements, reverse repurchase agreements and securities lending or borrowing transactions. Restrictions were also placed on certain asset sales to and from an insider to an institution, including requirements that such sales be on market terms and, in certain circumstances, approved by the institution’s board of directors.
Enhanced lending limits. The Dodd-Frank Act strengthened the existing limits on a depository institution’s credit exposure to one borrower. Federal banking law currently limits a federal thrift’s ability to extend credit to one person (or group of related persons) in an amount exceeding certain thresholds. The Dodd-Frank Act expanded the scope of these restrictions to include, for example, credit exposure arising from derivative transactions, repurchase agreements, and securities lending and borrowing transactions.
Corporate governance. The Dodd-Frank Act addresses many investor protection, corporate governance and executive compensation matters that will affect most U.S. publicly traded companies, including the Company. The Dodd-Frank Act (i) grants stockholders of U.S. publicly traded companies an advisory vote on executive compensation; (ii) enhances independence requirements for compensation committee members; (iii) requires companies listed on national securities exchanges to adopt incentive-based compensation clawback policies for executive officers; and (iv) provides the SEC with authority to adopt proxy access rules that would allow stockholders of publicly traded companies to nominate candidates for election as a director and have those nominees included in a company’s proxy materials.
Many of the requirements of the Dodd-Frank Act are in the process of being implemented and most will be subject to regulations implemented over the course of several years. Given the uncertainty associated with the manner in which the provisions of the Dodd-Frank Act will be implemented by the various regulatory agencies and through regulations, the full extent of the impact such requirements will have on our operations is unclear. The changes resulting from the Dodd-Frank Act may impact the profitability of our business activities, require changes to certain of our business practices, impose upon us more stringent capital, liquidity and leverage requirements or otherwise adversely affect our business. These changes may also require us to invest significant management attention and resources to evaluate and make any changes necessary to comply with new statutory and regulatory requirements. Failure to comply with the new requirements may negatively impact our results of operations and financial condition.
Notice and Approval Requirements Related to Control
Banking laws impose notice, approval, and ongoing regulatory requirements on any stockholder or other party that seeks to acquire direct or indirect “control” of an FDIC-insured depository institution. These laws include the Bank Holding Company Act, the Change in Bank Control Act, and the Savings and Loan Holding Company Act and the rules and regulations enacted thereunder. Among other things, these laws require regulatory filings by a stockholder or other party that seeks to acquire direct or indirect “control” of an FDIC-insured depository institution. The determination whether an investor “controls” a depository institution is based on all of the facts and circumstances surrounding the investment. As a general matter, a party is deemed to
17
control a depository institution or other company if the party owns or controls 25% or more of any class of voting stock. Subject to rebuttal, a party may be presumed to control a depository institution or other company if the investor owns or controls 10% or more of any class of voting stock and any of certain additional control factors exist. Ownership by affiliated parties, or parties acting in concert, is typically aggregated for these purposes. If a party’s ownership of the Company were to exceed certain thresholds, the investor could be deemed to “control” the Company for regulatory purposes. This could subject the investor to regulatory filings or other regulatory consequences.
In addition, except under limited circumstances, SLHCs are prohibited from acquiring, without prior approval:
• | control of any other savings institution or SLHC or all or substantially all the assets thereof; or |
• | more than 5% of the voting shares of a savings institution or SLHC which is not already a subsidiary. |
In evaluating an application by a holding company to acquire a savings association, the factors considered include the financial and managerial resources and future prospects of the holding company and savings association involved, the risk of the acquisition to the DIF, the convenience and needs of the community and the effect of the acquisition on competition.
Permissible Activities and Investments
A particular subset of SLHCs are generally permitted to engage in nonbanking and commercial activities without restriction. These SLHCs are known as “grandfathered unitary SLHCs.” A “grandfathered unitary SLHC” is a SLHC that owned a single savings association, or for which an application to acquire a single savings association was pending, on or before May 4, 1999. The Company currently qualifies as a grandfathered unitary SLHC and, as such, is generally permitted to engage in nonbanking and commercial activities without restriction.
In order to be able to continue to rely on this status, a grandfathered unitary SLHC must continue to control the thrift that caused it to qualify (or a successor to that thrift), and the thrift must meet the Qualified Thrift Lender ("QTL") test. If the savings association subsidiary of a grandfathered unitary SLHC fails to meet the QTL test, then the holding company will become subject to restrictions on its activities and, unless the savings association re-qualifies as a QTL within one year thereafter, would be required to register as, and become subject to the restrictions applicable to, a bank holding company. Regulation as a bank holding company could be adverse to our operations and impose additional and possibly more burdensome regulatory requirements on the Company.
In addition, if the OCC determines that there is reasonable cause to believe that the continuation by a SLHC, including a grandfathered unitary SLHC, of an activity constitutes a serious risk to the financial safety, soundness or stability of its subsidiary savings association, the OCC may impose such restrictions as it deems necessary to address such risk, including limiting (i) payment of dividends by the savings association; (ii) transactions between the savings association and its affiliates; and (iii) any activities of the savings association that might create a serious risk that the liabilities of the holding company and its affiliates may be imposed on the savings association.
The Dodd-Frank Act did not eliminate the general authority for grandfathered unitary SLHCs to conduct activities without restriction. However, under section 626 of the Dodd-Frank Act, the Federal Reserve is authorized to require a grandfathered unitary thrift holding company to put its financial activities beneath an intermediate holding company. Separating commercial and financial activities within an SLHC’s legal structure is intended, among other things, to make supervision of the financial activities easier and to reduce the reporting and supervision burden applicable at the top tier of a commercial SLHC. The Federal Reserve is required to promulgate rules setting forth the criteria for when a grandfathered unitary SLHC would be required to establish an intermediate holding company, but to date it has not yet proposed any such rules.
Qualified Thrift Lender Test
Federal banking laws require a thrift to meet the QTL test by maintaining at least 65% of its “portfolio assets” in certain “qualified thrift investments,” such as residential housing related loans, certain consumer and small business loans and residential mortgage backed securities, on a monthly average basis in at least nine months out of every twelve months. A thrift that fails the QTL test must either operate under certain restrictions on its activities or convert to a bank charter. The Dodd-Frank Act imposes additional restrictions on the ability of any thrift that fails to become or remain a QTL to pay dividends. Specifically, the thrift is not only subject to the general dividend restrictions as would apply to a national bank (as under prior law), but also is prohibited from paying dividends at all (regardless of its financial condition) unless required to meet the obligations of a company that controls the thrift, permissible for a national bank and specifically approved by the OCC and the Federal Reserve. In addition, violations of the QTL test now are treated as violations of federal banking laws subject to remedial enforcement action. At December 31, 2015, the amount of the Bank’s assets invested in qualified thrift investments exceeded the percentage required to qualify the Bank under the QTL test.
18
Regulatory Capital Requirements and Capital Adequacy
The federal banking regulators view capital levels as important indicators of an institution’s financial soundness. As a general matter, FDIC-insured depository institutions and their holding companies are required to maintain minimum capital relative to the amount and types of assets they hold. The final supervisory determination on an institution’s capital adequacy is based on the regulator’s assessment of numerous factors.
The OCC established risk-based and leverage capital guidelines applicable to federal thrifts, including the Bank. As noted above, as a result of the Dodd-Frank Act, SLHCs, including the Company, are subject to regulatory capital requirements. The SLHC capital requirements are discussed below in “—Basel III.”
Basel I was based upon the 1988 capital accord of the International Basel Committee on Banking Supervision (“Basel Committee”), a committee of central banks and bank supervisors, as implemented by the U.S. federal banking agencies. As discussed further below, the federal banking agencies have adopted separate risk-based capital guidelines for so-called “core banks” based upon the Revised Framework for the International Convergence of Capital Measurement and Capital Standards (“Basel II”) issued by the Basel Committee in November 2005, and recently adopted rules implementing the revised standards referred to as Basel III.
Basel I
OCC regulations implementing the Basel I standards required that federal thrifts maintain: (i) tier 1 capital in an amount not less than 4.0% (3.0% if the federal thrift is assigned the highest composite rating of 1 under the Uniform Financial Institutions Rating System) of adjusted total assets (the “leverage ratio”), (ii) tier 1 capital in an amount not less than 4.0% of risk-weighted assets and (iii) total risk-based capital in an amount not less than 8.0% of risk-weighted assets.
Tier 1 capital (core capital) included common stockholders’ equity (including common stock, additional paid-in capital and retained earnings, but excluded any net unrealized gains or losses, net of related taxes, on certain securities available for sale), noncumulative perpetual preferred stock and any related surplus and non-controlling interests in the equity accounts of fully consolidated subsidiaries. Intangible assets generally were deducted from tier 1 capital, other than certain servicing assets and purchased credit card relationships, subject to limitations. Total capital, for purposes of the risk-based capital requirement, equaled the sum of tier 1 capital plus supplementary (tier 2) capital up to 100% of core capital (which generally includes the sum of, among other items, perpetual preferred stock not counted as tier 1 capital, limited life preferred stock, subordinated debt and general loan and lease loss allowances up to 1.25% of risk-weighted assets) less certain deductions.
Risk-weighted assets were determined by multiplying certain categories of assets, including off-balance sheet equivalents, by an assigned risk weight of 0% to 100% (or more) based on the degree of credit risk associated with those assets as specified in OCC regulations.
Capital requirements higher than the generally applicable minimum requirement may be established for a particular savings association if the OCC determines that the institution’s capital was or may become inadequate in view of its particular circumstances.
Basel II
Under the final U.S. Basel II rules issued by the federal banking agencies, there were a small number of “core” banking organizations that were required to use the advanced approaches under Basel II for calculating risk-based capital related to credit risk and operational risk, instead of the methodology reflected in the regulations effective prior to adoption of Basel II. The rules also required core banking organizations to have rigorous processes for assessing overall capital adequacy in relation to their total risk profiles, and to publicly disclose certain information about their risk profiles and capital adequacy. The Company and the Bank were not among the core banking organizations required to use Basel II advanced approaches.
19
Basel III
On December 16, 2010, the Basel Committee released its final framework for strengthening international capital and liquidity regulation, known as Basel III. The Basel III calibration and phase-in arrangements were previously endorsed by the Seoul G20 Leaders Summit in November 2010. Under these standards, when fully phased-in on January 1, 2019, banking institutions will be required to satisfy three risk-based capital ratios:
• | A new common equity tier 1 capital to risk-weighted assets ratio of at least 7.0%, inclusive of a 4.5% minimum common equity tier 1 capital ratio, net of regulatory deductions, and the new 2.5% “capital conservation buffer” of common equity to risk-weighted assets; |
• | A tier 1 capital ratio of at least 8.5%, inclusive of the 2.5% capital conservation buffer; and |
• | A total capital ratio of at least 10.5%, inclusive of the 2.5% capital conservation buffer. |
The capital conservation buffer is designed to absorb losses during periods of economic stress. Banking institutions with a common equity tier 1 ratio above the minimum but below the conservation buffer may face constraints on dividends, equity repurchases, and compensation based on the amount of such shortfall. The Basel Committee also announced that a “countercyclical buffer” of 0% to 2.5% of common equity or other loss-absorbing capital “will be implemented according to national circumstances” as an “extension” of the conservation buffer during periods of excess credit growth.
Basel III also introduced a non-risk adjusted tier 1 leverage ratio of 3%, based on a measure of total exposure rather than total assets and new liquidity standards. The Basel Committee had initially planned for member nations to begin implementing the Basel III requirements by January 1, 2013, with full implementation by January 1, 2019. On November 9, 2012, U.S. regulators announced that implementation of Basel III’s first requirements would be delayed. In July 2013, the federal banking agencies published final rules (the “Basel III Capital Rules”) that revised their risk-based and leverage capital requirements and their method for calculating risk-weighted assets to implement, in part, agreements reached by the Basel Committee and certain provisions of the Dodd-Frank Act. The Basel III Capital Rules apply to banking organizations, including the Company and the Bank.
Among other things, the Basel III Capital Rules: (i) introduce a new capital measure entitled “Common Equity Tier 1” (“CET1”); (ii) specify that tier 1 capital consist of CET1 and additional financial instruments satisfying specified requirements that permit inclusion in tier 1 capital; (iii) define CET1 narrowly by requiring that most deductions or adjustments to regulatory capital measures be made to CET1 and not to the other components of capital; and (iv) expand the scope of the deductions or adjustments from capital as compared to the existing regulations. The Basel III Capital Rules also provide a permanent exemption from the proposed phase out of existing trust preferred securities and cumulative perpetual preferred stock from regulatory capital for banking organizations with less than $15 billion in total consolidated assets as of December 31, 2009.
The Basel III Capital Rules provide for the following minimum capital to risk-weighted assets ratios:
• | 4.5% based upon CET1; |
• | 6.0% based upon tier 1 capital; and |
• | 8.0% based upon total regulatory capital. |
A minimum leverage ratio (tier 1 capital as a percentage of total assets) of 4.0% is also required under the Basel III Capital Rules (even for highly rated institutions). The Basel III Capital Rules additionally require institutions to retain a capital conservation buffer of 2.5% above these required minimum capital ratio levels. Banking organizations that fail to maintain the minimum 2.5% capital conservation buffer could face restrictions on capital distributions or discretionary bonus payments to executive officers.
The Basel III Capital Rules did not address the proposed liquidity coverage ratio (“LCR”) called for by the Basel Committee’s Basel III framework. On October 24, 2013, the Federal Reserve issued a proposed rule implementing a LCR requirement in the United States for larger banking organizations. Neither the Company nor the Bank would be subject to the LCR requirement as proposed.
Finally, the Basel III Capital Rules amend the thresholds under the “prompt corrective action” framework enforced with respect to the Bank by the OCC to reflect both (i) the generally heightened requirements for regulatory capital ratios as well as (ii) the introduction of the CET1 capital measure.
As a result of the enactment of the Basel III Capital Rules the Company and the Bank are subject to increased required capital levels. The Basel III Capital Rules became effective as applied to us and the Bank on January 1, 2015, with a phase in period that generally extends from January 1, 2015 through January 1, 2019.
20
As of December 31, 2015, the Bank met the standard minimum regulatory capital requirements noted above, with CET1, tier 1 capital, total capital and tier 1 leverage ratios of 17.04%, 17.04%, 18.33% and 12.35%, respectively. As of December 31, 2015, the Bank was “well capitalized” under regulatory standards. See Note 11 in the Notes to Consolidated Financial Statements contained in Item 8.
Prompt Corrective Action ("PCA")
Under the FDIA, federal bank regulatory agencies must take “prompt corrective action” against undercapitalized U.S. depository institutions. U.S. depository institutions are assigned one of five capital categories: “well capitalized,” “adequately capitalized,” “undercapitalized,” “significantly undercapitalized,” and “critically undercapitalized,” and are subjected to differential regulation corresponding to the capital category within which the institution falls. A depository institution is currently deemed to be “well capitalized” if the banking institution has a total risk-based capital ratio of 10.0% or greater, a tier 1 risk-based capital ratio of 8.0% or greater, a CET1 of 6.5% or greater and a tier 1 leverage ratio of 5.0% or greater, and the institution is not subject to an order, written agreement, capital directive, or prompt corrective action directive to meet and maintain a specific level for any capital measure. Under certain circumstances, a well-capitalized, adequately capitalized or undercapitalized institution may be treated as if the institution were in the next lower capital category. A banking institution that is less than adequately capitalized is required to submit a capital restoration plan. Failure to meet capital guidelines could subject the institution to a variety of enforcement remedies by federal bank regulatory agencies, including: termination of deposit insurance by the FDIC, restrictions on certain business activities, and appointment of the FDIC as conservator or receiver.
In addition, the Basel III Capital Rules amended the thresholds under the PCA framework for enforcement with respect to the Bank by the OCC to reflect both (i) the generally heightened requirements for regulatory capital ratios as well as (ii) the introduction of the CET1 capital measure.
Regulatory Limits on Dividends and Distributions
OCC and Federal Reserve regulations govern capital distributions by savings institutions, which include cash dividends, stock repurchases and other transactions charged to the capital account of a savings institution to make capital distributions. Under applicable regulations, a savings institution must file an application for approval of the capital distribution if:
• | the total capital distributions for the applicable calendar year exceed the sum of the institution’s net income for that year to date plus the institution’s retained net income for the preceding two years; |
• | the institution would not be at least adequately capitalized under the PCA guidelines following the distribution; |
• | the distribution would violate any applicable statute, regulation, agreement or OCC-imposed condition; or |
• | the institution is not eligible for expedited treatment of its filings with the OCC. |
If an application is not required to be filed, savings institutions such as the Bank which are a subsidiary of a holding company (as well as certain other institutions) must still file a notice with the OCC and Federal Reserve at least 30 days before the board of directors declares a dividend or approves a capital distribution.
An institution that either before or after a proposed capital distribution fails to meet its then applicable minimum capital requirement or that has been notified that it needs more than normal supervision may not make any capital distributions without the prior written approval of the OCC. In addition, the OCC may prohibit a proposed capital distribution, which would otherwise be permitted by OCC regulations, if the OCC determines that such distribution would constitute an unsafe or unsound practice.
The FDIC prohibits an insured depository institution from paying dividends on its capital stock or interest on its capital notes or debentures (if such interest is required to be paid only out of net profits) or distributing any of its capital assets while it remains in default in the payment of any assessment due the FDIC. The Bank is currently not in default in any assessment payment to the FDIC.
We are a legal entity separate and distinct from the Bank and its subsidiary. Our principal source of revenue consists of dividends from the Bank. As noted above, the payment of dividends by the Bank is subject to various regulatory requirements, including a minimum of 30 days’ advance notice to the OCC of any proposed dividend to us.
Limits on Transactions with Affiliates and Insiders
Insured depository institutions are subject to restrictions on their ability to conduct transactions with affiliates and other related parties. Section 23A of the Federal Reserve Act imposes quantitative limits, qualitative requirements, and collateral requirements on certain transactions by an insured depository institution with, or for the benefit of, its affiliates. Transactions covered by Section 23A include loans, extensions of credit, investment in securities issued by an affiliate, and acquisitions of
21
assets from an affiliate. Section 23B of the Federal Reserve Act requires that most types of transactions by an insured depository institution with, or for the benefit of, an affiliate be on terms at least as favorable to the insured depository institution as if the transaction were conducted with an unaffiliated third party. Section 11 of HOLA applies Sections 23A and 23B to federal thrifts, including the Bank. In addition, Section 11 of HOLA prohibits the Bank from lending to any affiliate engaged in activities not permissible for a bank holding company and from acquiring the securities of any affiliate other than a subsidiary.
As noted above, the Dodd-Frank Act generally enhances the restrictions on transactions with affiliates under Section 23A and 23B of the Federal Reserve Act, including an expansion of the definition of “covered transactions” and a clarification of the amount of time for which collateral requirements regarding covered credit transactions must be satisfied. The ability of the Federal Reserve to grant exemptions from these restrictions is also narrowed by the Dodd-Frank Act, including by requiring coordination with other bank regulators.
The Federal Reserve’s Regulation O and OCC regulations impose restrictions and procedural requirements in connection with the extension of credit by an insured depository institution to directors, executive officers, principal stockholders and their related interests.
Brokered Deposits
The FDIC restricts the use of brokered deposits by certain depository institutions. Under the applicable regulations, (i) a “well capitalized insured depository institution” may solicit and accept, renew or roll over any brokered deposit without restriction, (ii) an “adequately capitalized insured depository institution” may not accept, renew or roll over any brokered deposit unless it has applied for and been granted a waiver of this prohibition by the FDIC and (iii) an “undercapitalized insured depository institution” may not accept, renew or roll over any brokered deposit or solicit deposits by offering an effective yield that exceeds by more than 75 basis points the prevailing effective yields on insured deposits of comparable maturity in such institution’s normal market area or in the market area in which such deposits are being solicited. The FDIC may, on a case-by-case basis and upon application by an adequately capitalized insured depository institution, waive the restriction on brokered deposits upon a finding that the acceptance of brokered deposits does not constitute an unsafe or unsound practice with respect to such institution.
At December 31, 2015 and 2014, the Bank was a well capitalized insured depository institution and had no outstanding brokered deposits.
Examination Fees
The OCC currently charges fees to recover the costs of examining national banks and federal thrifts, processing applications and other filings, and covering direct and indirect expenses in regulating national banks and federal thrifts and their affiliates. The Dodd-Frank Act provides various agencies with the authority to assess additional supervision fees.
Deposit Insurance Assessments
FDIC-insured depository institutions are required to pay deposit insurance assessments to the FDIC. The amount of a particular institution’s deposit insurance assessment is based on that institution’s risk classification under an FDIC risk-based assessment system. An institution’s risk classification is assigned based on its capital levels and the level of supervisory concern the institution poses to the regulators. Deposit insurance assessments fund the DIF. As noted above, the Dodd-Frank Act changed the way an insured depository institution’s deposit insurance premiums are calculated. These changes may impact assessment rates, which could impact the profitability of our operations.
Depositor Preference
The FDIC provides that, in the event of the “liquidation or other resolution” of an insured depository institution, the claims of depositors of the institution (including the claims of the FDIC as subrogee of insured depositors) and certain claims for administrative expenses of the FDIC as a receiver will have priority over other general unsecured claims against the institution. If we invest in or acquire an insured depository institution that fails, insured and uninsured depositors, along with the FDIC, will have priority in payment ahead of unsecured, non-deposit creditors, including us, with respect to any extensions of credit they have made to such insured depository institution.
Federal Reserve System and FHLB System
The Federal Reserve has adopted regulations that require savings associations to maintain non-earning reserves against their transaction accounts (primarily negotiable order of withdrawal accounts and regular checking accounts). These reserves may be used to satisfy liquidity requirements imposed by the OCC. Because required reserves must be maintained in the form of vault
22
cash, with a pass-through correspondent institution or an account at a Federal Reserve Bank, the effect of this reserve requirement is to potentially restrict the amount of the Bank’s assets.
The FHLB System consists of twelve regional Federal Home Loan Banks, each subject to supervision and regulation by the Federal Housing Finance Agency (“FHFA”). The Bank is a member of the FHLB of Chicago. The FHLBs provide a central credit facility for member savings associations, and impose collateral requirements on advances. The maximum amount that the FHLB of Chicago will advance fluctuates from time to time in accordance with changes in policies of the FHFB and the FHLB of Chicago, and the maximum amount generally is reduced by borrowings from any other source. In addition, the amount of FHLB of Chicago advances that a savings association may obtain is restricted in the event the institution fails to maintain its status as a QTL.
Bank Secrecy Act / Anti-Money Laundering
The Bank Secrecy Act (“BSA”), which is intended to require financial institutions to develop policies, procedures, and practices to prevent and deter money laundering, mandates that every financial institution have a written, board-approved program that is reasonably designed to assure and monitor compliance with the BSA. The program must, at a minimum: (1) provide for a system of internal controls to assure ongoing compliance; (2) provide for independent testing for compliance; (3) designate an individual responsible for coordinating and monitoring day-to-day compliance; and (4) provide training for appropriate personnel. In addition, financial institutions are required to adopt a customer identification program as part of its BSA compliance program. Financial institution are also required to file Suspicious Activity Reports when they detect certain known or suspected violations of federal law or suspicious transactions related to a money laundering activity or a violation of the BSA.
In addition to complying with the BSA, the Bank is subject to the Uniting and Strengthening America by Providing Appropriate Tools Required to Intercept and Obstruct Terrorism Act of 2001 (the “Patriot Act”). The Patriot Act is designed to deny terrorists and criminals the ability to obtain access to the United States’ financial system and has significant implications for depository institutions, brokers, dealers, and other businesses involved in the transfer of money. The Patriot Act mandates that financial service companies implement additional policies and procedures and take heightened measures designed to address any or all of the following matters: customer identification programs, money laundering, terrorist financing, identifying and reporting suspicious activities and currency transactions, currency crimes, and cooperation between financial institutions and law enforcement authorities.
Anti-Money Laundering and Office of Foreign Assets Control
Under federal law, financial institutions must maintain anti-money laundering programs that include established internal policies, procedures, and controls; a designated compliance officer; an ongoing employee training program; and testing of the program by an independent audit function. Financial institutions are also prohibited from entering into specified financial transactions and account relationships and must meet enhanced standards for due diligence and customer identification in their dealings with non-U.S. financial institutions, non-U.S. customers and other high-risk customers. Financial institutions must take reasonable steps to conduct enhanced scrutiny of account relationships to guard against money laundering and to report any suspicious transactions, and law enforcement authorities have been granted increased access to financial information maintained by financial institutions. Bank regulators routinely examine institutions for compliance with these obligations and they must consider an institution’s compliance in connection with the regulatory review of applications, including applications for banking mergers and acquisitions. The regulatory authorities have imposed “cease and desist” orders and civil money penalty sanctions against institutions found to be violating these obligations.
The U.S. Department of the Treasury’s Office of Foreign Assets Control (“OFAC”) is responsible for helping to insure that U.S. entities do not engage in transactions with certain prohibited parties, as defined by various executive orders and acts of Congress. OFAC publishes lists of persons, organizations, and countries suspected of aiding, harboring or engaging in terrorist acts, known as Specially Designated Nationals and Blocked Persons. If the Company or the Bank finds a name on any transaction, account or wire transfer that is on an OFAC list, the Company or Bank must freeze or block such account or transaction, file a suspicious activity report and notify the appropriate authorities.
23
Consumer Laws and Regulations
Banking organizations are subject to numerous laws and regulations intended to protect consumers. These laws include, among others:
• | Truth in Lending Act; |
• | Truth in Savings Act; |
• | Electronic Funds Transfer Act; |
• | Expedited Funds Availability Act; |
• | Equal Credit Opportunity Act; |
• | Fair and Accurate Credit Transactions Act; |
• | Fair Housing Act; |
• | Fair Credit Reporting Act; |
• | Fair Debt Collection Act; |
• | Gramm-Leach-Bliley Act; |
• | Home Mortgage Disclosure Act; |
• | Right to Financial Privacy Act; |
• | Real Estate Settlement Procedures Act; |
• | Laws regarding unfair and deceptive acts and practices; and |
• | Usury laws. |
Many states and local jurisdictions have consumer protection laws analogous, and in addition to, those listed above. These federal, state and local laws regulate the manner in which financial institutions deal with customers when taking deposits, making loans, or conducting other types of transactions. Failure to comply with these laws and regulations could give rise to regulatory sanctions, customer rescission rights, action by state and local attorneys general, and civil or criminal liability. The creation of the CFPB by the Dodd-Frank Act has led to enhanced enforcement of consumer financial protection laws.
The Community Reinvestment Act
The Community Reinvestment Act (“CRA”) is intended to encourage banks and thrifts to help meet the credit needs of their service areas, including low and moderate-income neighborhoods, consistent with safe and sound operations. The bank regulators examine and assign each bank a public CRA rating. The CRA then requires bank regulators to take into account the bank’s record in meeting the needs of its service area when considering an application by a bank to establish or relocate a branch or to conduct certain mergers or acquisitions. The Federal Reserve is required to consider the CRA records of an SLHC’s controlled thrift(s) when considering an application by the SLHC to acquire a banking organization or to merge with another SLHC. When the Company or the Bank applies for regulatory approval to make certain investments, the regulators will consider the CRA record of target institutions and the Bank. A less than satisfactory CRA record could substantially delay approval or result in denial of an application. The regulatory agency’s assessment of the institution’s record is made available to the public. Following its most recent CRA examination in June 2013, the Bank received an overall rating of “Satisfactory.”
Overdraft Fees
The Federal Reserve has adopted amendments under its Regulation E that impose restrictions on banks’ abilities to charge overdraft fees. The rule prohibits financial institutions from charging fees for paying overdrafts on ATM and one-time debit card transactions, unless a consumer consents, or opts in, to the overdraft service for those types of transactions.
Interchange Fees
The Dodd-Frank Act, through a provision known as the Durbin Amendment, required the Federal Reserve to establish standards for interchange fees that are “reasonable and proportional” to the cost of processing the debit card transaction and imposes other requirements on card networks. Institutions like the Bank with less than $10 billion in assets are exempt. However, while we are under the $10 billion level that caps income per transaction, we have been affected by federal regulations that prohibit network exclusivity arrangements and routing restrictions. Essentially, issuers and networks must allow transaction processing through a minimum of two unaffiliated networks. These additional processing alternatives have negatively affected interchange income from our PIN/point of sale network.
Changes in Laws, Regulations or Policies
Federal, state and local legislators and regulators regularly introduce measures or take actions that would modify the regulatory requirements applicable to banks, their holding companies and other financial institutions. Changes in laws, regulations or regulatory policies could adversely affect the operating environment for the Company and the Bank in substantial and
24
unpredictable ways, increase our cost of doing business, impose new restrictions on the way in which we conduct our operations or add significant operational constraints that might impair our profitability. We cannot predict whether new legislation will be enacted and, if enacted, the effect that it, or any implementing regulations, would have on our business, financial condition or results of operations. The Dodd-Frank Act imposes substantial changes to the regulatory framework applicable to us and our subsidiaries. The majority of these changes will be implemented over time by various regulatory agencies. The full effect that these changes will have on us remains uncertain at this time and may have a material adverse effect on our business and results of operations.
Federal Housing Finance Agency
In January 2011, the Federal Housing Finance Agency (“FHFA”) announced that it directed Fannie Mae and Freddie Mac to work on a joint initiative, in coordination with FHFA and HUD, to consider alternatives for future mortgage servicing structures and servicing compensation for their single-family mortgage loans. Not all aspects of the joint initiative have yet been implemented and it is as yet uncertain how the financial services industry in general and the Bank specifically will be affected by the final requirements.
The Volcker Rule
On December 10, 2013, five U.S. financial regulators, including the Federal Reserve and the OCC, adopted a final rule implementing the so-called “Volcker Rule.” The Volcker Rule was created by Section 619 of the Dodd-Frank Act and prohibits “banking entities” from engaging in “proprietary trading” and making investments and conducting certain other activities with “private equity funds and hedge funds.” Although the final rule provides some tiering of compliance and reporting obligations based on size, the fundamental prohibitions of the Volcker Rule apply to banking entities of any size, including the Company and the Bank. The final rule became effective April 1, 2014 and had no financial impact on the Company.
Legislative and Regulatory Proposals
Proposals to change the laws and regulations governing the operations and taxation of, and federal insurance premiums paid by, savings banks and other financial institutions and companies that control such institutions are frequently raised in the U.S. Congress, state legislatures and before the FDIC, the OCC and other bank regulatory authorities. The likelihood of any major changes in the future and the impact such changes might have on us or our subsidiaries are impossible to determine. Similarly, proposals to change the accounting treatment applicable to savings banks and other depository institutions are frequently raised by the SEC, the federal banking agencies, the Internal Revenue Service (“IRS”) and other appropriate authorities, including, among others, proposals relating to fair market value accounting for certain classes of assets and liabilities. The likelihood and impact of any additional future accounting rule changes and the impact such changes might have on us or our subsidiaries are impossible to determine at this time.
Taxation
Federal
The Company files a consolidated federal income tax return on behalf of itself, the Bank and its subsidiaries on a calendar tax year basis.
State
Under current law, the state of Wisconsin imposes a corporate franchise tax of 7.9% on the combined taxable incomes of the members of the Company’s consolidated income tax group.
Tax Attribute Preservation Provision
In connection with the Plan of Reorganization, the Amended Charter contains provisions to protect certain tax attributes of the Company and its subsidiaries following emergence from bankruptcy. Until the third anniversary of the Effective Date, unless approved by the Board in accordance with the procedures set forth in the Amended Charter and subject to certain exceptions for permitted transfers, any attempted transfer of the Company’s common stock is prohibited and void ab initio to the extent that, as a result of such transfer (or any series of transfers of which such transfer is a part), either (i) any person or group of persons will own 4.95% or more of the outstanding shares of common stock or preferred stock of the Company or (ii) the ownership interest in the Company of any of its existing 5% stockholders will be increased. The Expiration Date may be extended in the Board’s discretion until the sixth anniversary of the Effective Date in order to protect the tax attributes of the Company.
Old National and the Company jointly announced the execution of a definitive agreement under which Old National will acquire the Company through a stock and cash merger. The definitive merger agreement has been unanimously approved by the
25
Board of both Old National and the Company. The transaction remains subject to regulatory approval and the vote of the Company's stockholders. The transaction is anticipated to close in the second quarter of 2016.
Tax Bad Debt Reserves
Effective for tax years commencing January 1, 1996, federal tax legislation modified the methods by which a thrift computes its bad debt deduction. As a result, the Bank is only allowed to claim a deduction equal to its actual loss experience and the reserve method is no longer available. Any cumulative reserve additions (i.e. bad debt deductions) in excess of actual loss experience for tax years 1988 through 1995 have been fully recaptured over a six year period. Generally, reserve balances as of December 31, 1987 (the "Base Year Reserve") will only be subject to recapture upon distribution of such reserves to stockholders.
To the extent that the Bank makes nondividend distributions to stockholders, such distributions will be considered to result in distributions from the Bank’s Base Year Reserve to the extent thereof, and then from its supplemental tax-basis reserve for losses on loans and an amount based on the amount distributed, will be included in the Bank’s taxable income. Nondividend distributions include distributions in excess of Bank’s current and accumulated earnings and profits, as calculated for federal income tax purposes, distributions in redemption of stock and distributions in partial or complete liquidation. However, dividends paid out of the Bank’s current or accumulated earnings and profits will not constitute nondividend distributions and, therefore, will not be included in Bank’s taxable income.
Item 1A. | Risk Factors |
Set forth below and elsewhere in this Annual Report on Form 10-K and in other documents we file with the SEC are risks and uncertainties that could cause actual results to differ materially from the results contemplated by the forward-looking statements contained in this Annual Report on Form 10-K. The risks described below are not the only ones facing our company. Our business, consolidated financial condition, results of operations or prospects could be materially and adversely affected by any of these risks. The value of shares of our common stock could decline due to any of these risks. This report, including the documents incorporated by reference herein, also contain forward-looking statements that involve risks and uncertainties. Our actual results could differ materially from those anticipated in these forward-looking statements as a result of certain factors, including the risks described below.
Risks Related to Our Business
We may not be able to fully execute on our business initiatives, which could have a material adverse effect on our consolidated financial condition or results of operations.
We are primarily a community-oriented commercially focused retail bank offering traditional deposit products and have historically focused on retail banking and residential mortgage lending. We have been developing strategies to grow other loan categories to diversify earning assets and to increase low cost core deposits, including transforming our business to a relationship-focused commercial bank, expanding our commercial banking services and other business strategies. These strategies include, over time, expanding our business banking operations. Our business banking initiative includes focusing on small and mid-sized businesses, with an emphasis on attracting clients from competitors. There are costs, risks and uncertainties associated with the development, implementation and execution of these initiatives, including the investment of time and resources, the possibility that these initiatives will be unprofitable and the risk of additional liabilities associated with these initiatives. In addition, our ability to successfully execute on these new initiatives will depend in part on our ability to attract and retain talented individuals to help manage these initiatives and the existence of satisfactory market conditions that will allow us to profitably grow. Our potential inability to successfully execute these initiatives could have a material adverse effect on our business, consolidated financial condition or results of operations.
While we recently reversed substantially all of the valuation allowance for our deferred tax asset, we may not be able to realize the asset in the future and the deferred tax asset may be subject to additional valuation allowances.
During September 2009, the Company established a full deferred tax asset valuation allowance covering its federal and state tax loss carryforwards and other deferred tax assets. As a result of management’s ongoing periodic assessments of the deferred tax asset position, the Company determined that it was appropriate to substantially reverse this deferred tax asset valuation allowance. In 2015, the Company determined that it is more likely than not it will be able to realize its deferred tax asset, including its entire federal tax loss carryforwards and a significant portion of its state tax loss carryforwards, with the exception of $4.2 million pertaining to certain multi state loss carryforwards, including states in which the Company no longer does business. This action resulted in the recognition of a $108.9 million income tax benefit, net of current tax provision.
26
The ultimate realization of a deferred tax asset is dependent upon the generation of future taxable income during the periods that the related net operating losses and certain recognized built-in losses and net unrealized built-in losses, if any (collectively, “pre-change losses”), may be utilized and is also subject to the rules of Section 382 of the Code, described below. If our estimates and assumptions about future taxable income or our assessment of the positive and negative evidence are not accurate, the value of our deferred tax asset may not be recoverable and our cash flow available to fund operations could be adversely affected.
Our ability to realize the benefit of our deferred tax assets may be materially impaired.
Our ability to use our deferred tax assets to offset future taxable income will be limited if we experience an “ownership change” as defined in Section 382 of the Internal Revenue Code of 1986, as amended (the” Code”). Due to the complexity of Section 382, it is difficult to conclude with certainty at any given point in time whether an ownership change has occurred. A Company that experiences an ownership change will generally be subject to an annual limitation on the use of its pre-change losses equal to the equity value of the Company immediately before the ownership change (in some cases, reduced by certain capital contributions received in the two years preceding the ownership change), multiplied by the applicable “long-term tax-exempt rate” (a rate that changes monthly and was 2.61% for ownership changes occurring in December 2015). While the Tax Attribute Preservation Provision has been included in our Amended Charter to prohibit and void ab initio future transactions in our common stock that would result in an ownership change, such an ownership change nevertheless could occur in the future, which likely would have a material adverse effect on our results of operations, consolidated financial condition and stockholder value. Any change in applicable law may result in an ownership change. Further, this provision may limit our ability to raise capital by selling shares of our common stock.
Old National and the Company jointly announced the execution of a definitive agreement under which Old National will acquire the Company through a stock and cash merger. The definitive merger agreement has been unanimously approved by the Board of both Old National and the Company. The transaction remains subject to regulatory approval and the vote of the Company's stockholders. The transaction is anticipated to close in the second quarter of 2016 and upon consummation, it is anticipated that the Company will experience an ownership change under Section 382.
We depend on our key officers and employees to continue the implementation of our long-term business strategy and could be harmed by the loss of their services. Management’s ability to retain key officers and employees may change.
We believe that the implementation of our long-term business strategy and future success will depend in large part on the skills of our current senior management team. We believe our senior management team possesses valuable knowledge about and experience in the banking industry and that their knowledge and relationships would be very difficult to replace. Although most of our senior management team has entered into employment agreements with us, they may not complete the term of their employment agreements or renew them upon expiration. Our success also depends on the experience of our branch managers and lending officers and on their relationships with the customers and communities they serve.
Our future operating results also depend in significant part upon our ability to attract and retain qualified management, financial, technical, marketing, sales and support personnel, particularly in respect of the implementation of our business strategy, which may require the recruitment of new personnel in new or expanded business areas. Competition for qualified personnel is intense, and we may not be successful in attracting or retaining qualified personnel. There may be only a limited number of persons with the requisite skills to serve in these positions, and it may be increasingly difficult for us to hire personnel over time. The loss of service of one or more of our key officers and employees, or the inability to recruit and retain qualified personnel in the future, could have an adverse effect on our business, consolidated financial condition or operating results.
Our allowance for losses on loans may not be adequate to cover probable losses.
The allowance for loan losses is established through a provision for loan losses charged to expense. Loans are charged off against the allowance for loan losses when we believe that repayment of principal is unlikely. Our level of non-performing loans decreased significantly in the year ended December 31, 2015, relative to the prior year period.
However, any material declines in the creditworthiness of our customers, real estate market conditions and values, general economic conditions or changes in regulatory policies would likely result in a higher probability that principal on some loans will not be repaid and require us to increase our allowance for loan losses. A material increase in the allowance for loan losses would adversely affect our results of operations and our capital.
27
The Bank’s business is subject to liquidity risk and changes in its source of funds may adversely affect our performance and consolidated financial condition by increasing its cost of funds.
The Bank’s ability to make loans and fund expenses is directly related to its ability to secure funding. Retail and commercial core deposits are the Bank’s primary source of liquidity. The Bank also relies on cash from payments received from loans and investments, as well as advances from the FHLB of Chicago as a funding source.
Primary uses of funds include withdrawal of and interest payments on deposits, originations of loans and payment of operating expenses. Core deposits represent a significant source of low-cost funds. Alternative funding sources such as large balance time deposits or borrowings are a comparatively higher-cost source of funds. Liquidity risk arises from the inability to meet obligations when they come due or to manage unplanned decreases or changes in funding sources. Significant fluctuations in lower cost funding vehicles would cause the Bank to pursue higher-cost funding which would adversely affect our consolidated financial condition and results of operations.
The Company’s liquidity is dependent upon our ability to receive dividends from the Bank, which accounts for substantially all our revenue which could affect our ability to pay dividends, and we may be unable to generate liquidity from other sources.
We are a separate and distinct legal entity from our subsidiaries, including the Bank. We receive substantially all of our revenue from dividends from the Bank, which we use as the principal source of funds to pay our expenses. Various federal and/or state laws and regulations limit the amount of dividends that the Bank and certain of our non-bank subsidiaries may pay us. Such limits are also tied to the earnings of our subsidiaries. If the Bank does not receive regulatory approval or if our subsidiaries’ earnings are not sufficient to make dividend payments to us while maintaining adequate capital levels, our ability to pay our expenses, our business, our consolidated financial condition or our results of operations could be materially and adversely impacted. During the year ended December 31, 2015, the Bank declared and paid a dividend to us.
Increases in our level of non-performing assets would have an adverse effect on our consolidated financial condition and results of operations.
If loans that are currently performing become non-performing, we may need to increase our allowance for loan losses if additional losses are anticipated which would have an adverse impact on our consolidated financial condition and results of operations. The increased time and expense associated with the work out of non-performing assets and potential non-performing assets also could adversely affect our operations.
If our investment in the capital stock of the FHLB of Chicago is other than temporarily impaired, our consolidated financial condition and results of operations could be impaired.
The Bank owns capital stock of the FHLB of Chicago. The capital stock is held to qualify for membership in the FHLB System and to be eligible to borrow funds under the FHLB of Chicago’s advance program. There is no market for the FHLB of Chicago capital stock and, while redemptions may be requested, they are at the discretion of the FHLB of Chicago.
The Bank evaluates the FHLB of Chicago stock for impairment on a regular basis. The determination of whether FHLB of Chicago stock is impaired depends on a number of factors and is based on an assessment of the ultimate recoverability of cost rather than changes in the book value of the shares. If our investment in the capital stock of the FHLB of Chicago were to become other than temporarily impaired, our consolidated financial condition and results of operations could be affected.
Maintaining or increasing market share depends on market acceptance and regulatory approval of new products and services.
Our success depends, in part, on the ability to adapt products and services to evolving industry and regulatory standards. There is increasing pressure to provide products and services at lower prices. This can reduce net interest income and non-interest income from fee-based products and services. In addition, the widespread adoption of new technologies could require us to make substantial capital expenditures to modify or adapt existing products and services or develop new products and services. We may not be successful in introducing new products and services in response to industry trends or development in technology or those new products may not achieve market acceptance. As a result, we could lose business, be forced to price products and services on less advantageous terms to retain or attract clients, or be subject to cost increases.
Deterioration in the real estate markets and economic conditions could lead to additional losses, which could have a material negative effect on our consolidated financial condition and results of operations.
Our success depends on general and local economic conditions and the real estate and business markets in which we compete. Any future declines in real estate values may reduce the value of collateral securing loans and impact the customer’s ability to
28
borrow or repay. Increases in delinquency levels or declines in real estate values could have a material negative effect on our business and results of operations.
While we attempt to manage the risk from changes in market interest rates, interest rate risk management techniques are not exact. In addition, we may not be able to economically hedge our interest rate risk. A rapid or substantial increase or decrease in interest rates could adversely affect our net interest income and results of operations.
Our earnings and cash flows depend to a great extent upon the level of our net interest income. The amount of interest income is dependent on many factors, including the volume of earning assets, the general level of interest rates, the dynamics of changes in interest rates and the level of non-performing loans. The cost of funds varies with the amount of funds required to support earning assets, the rates paid to attract and hold deposits, rates paid on borrowed funds and the levels of non-interest-bearing demand deposits and equity capital.
Different types of assets and liabilities are impacted differently, and at different times, by changes in market interest rates. We are unable to predict changes in market interest rates, which are affected by many factors beyond our control including inflation, recession, unemployment, money supply, domestic and international events, changes in the United States and other financial markets and policies of various governmental and regulatory agencies, particularly the Board of Governors of the Federal Reserve System. Net interest income is not only affected by the level and direction of interest rates, but also by the shape of the yield curve, credit spreads, relationships between interest sensitive instruments and key driver rates, balance sheet growth, client loan and deposit preferences and the timing of changes in these variables. Additionally, an increase in interest rates may, among other things, reduce the demand for loans and our ability to originate loans and decrease loan repayment rates. A decrease in the general level of interest rates may affect us through, among other things, increased prepayments on our loan and mortgage backed securities portfolios and increased competition for deposits. Accordingly, changes in the level of market interest rates affect our net yield on interest earning assets, loan origination volume, loan and mortgage backed securities portfolios, and our overall results.
We attempt to manage our risk from changes in market interest rates through asset/liability management by adjusting the rates, maturity, repricing, and balances of the different types of interest-earning assets and interest-bearing liabilities. Interest rate risk management techniques, however, are not precise, and we may not be able to successfully manage our interest rate risk. As a result, a rapid increase or decrease in interest rates could have an adverse effect on our net interest margin and results of operations.
Since we engage in lending secured by real estate and may be forced to foreclose on the collateral property and own the underlying real estate, we may be subject to the increased costs and risks associated with the ownership of real property, which could have an adverse effect on our business and results of operations.
A significant portion of our loan portfolio is secured by real property. During the ordinary course of business, we may foreclose on and take title to properties securing certain loans, in which case, we are exposed to the risks inherent in the ownership of real estate. The amount that we, as a mortgagee, may realize after a default is dependent upon factors outside of our control, including:
• | general or local economic conditions; |
• | environmental cleanup liabilities; |
• | neighborhood values; |
• | real estate tax rates; |
• | operating expenses of the mortgaged properties; |
• | supply of and demand for rental units or properties; |
• | ability to obtain and maintain adequate occupancy of the properties; |
• | zoning laws; |
• | governmental rules, regulations and fiscal policies; and |
• | extreme weather conditions or other natural or man-made disasters. |
Certain expenditures associated with the ownership of real estate, principally maintenance costs, may also adversely affect our operating expenses.
An interruption in or breach in security of our information systems may result in a loss of customer business.
We rely heavily on communications and information systems to conduct our business. Any failure, interruptions or breach in security of these systems could result in failures or disruptions in our customer relationship management, general ledger, deposit, servicing or loan origination systems. The occurrence of any failures, interruptions or security breaches of information systems used to process customer transactions could damage our reputation, result in a loss of customer business, subject us to
29
additional regulatory scrutiny or expose us to civil litigation and possible financial liability, any of which could have a material adverse effect on our consolidated financial condition, results of operations and cash flows. Additionally, we outsource portions of our data processing to third parties. If our third party provider encounters difficulties or if we have difficulty in communicating with such third party, it will significantly affect our ability to adequately process and account for customer transactions, which would significantly affect our business operations. Furthermore, breaches of such third party’s technology may also cause reimbursable loss to our consumer and business customers, through no fault of our own.
Management regularly reviews and updates our internal controls, disclosure controls and procedures, and corporate governance policies and procedures. Any system of controls, however well designed and operated, is based in part on certain assumptions and can provide only reasonable, not absolute, assurances that the objectives of the system are met. Any failure or circumvention of our controls and procedures or failure to comply with regulations related to controls and procedures could have a material adverse effect on our business, results of operations, cash flows and consolidated financial condition.
Our regional concentration makes us particularly at risk for changes in economic conditions in our primary market.
Our business is primarily located in Wisconsin. Due to our lack of geographic diversification, we are particularly vulnerable to adverse changes in economic conditions in Wisconsin and the Midwest more generally. The economic conditions in Wisconsin and the Midwest affect our business, consolidated financial condition, results of operations and future prospects, where adverse economic developments, among other things, could affect the volume of loan originations, increase the level of non-performing assets, increase the rate of foreclosure losses on loans and reduce the value of our loans and loan servicing portfolio. Any regional or local economic downturn that affects existing or prospective borrowers or property values in such areas may affect us and our profitability more significantly and more adversely than our competitors whose operations are less geographically concentrated.
Our asset valuations include observable inputs and may include methodologies, estimations and assumptions that are subject to differing interpretations and could result in changes to asset valuations that may materially adversely affect our results of operations or consolidated financial condition.
We use estimates, assumptions and judgments when financial assets and liabilities are measured and reported at fair value. Assets and liabilities carried at fair value inherently result in a higher degree of financial statement volatility. Fair values and the information used to record valuation adjustments for certain assets and liabilities are based on quoted market prices and/or other observable inputs provided by independent third-party sources, when available. When such third-party information is not available, we estimate fair value primarily by using cash flows and other financial modeling techniques utilizing assumptions such as credit quality, liquidity, interest rates and other relevant inputs. Changes in underlying inputs, factors, assumptions or estimates in any of the areas underlying our estimates could materially impact our future consolidated financial condition and results of operations.
We may be required to repurchase mortgage loans or indemnify mortgage loan purchasers as a result of breaches of representations and warranties, borrower fraud or certain borrower defaults, which could harm our liquidity, results of operations and consolidated financial condition.
When we sell mortgage loans we are required to make customary representations and warranties to the purchaser about the mortgage loans and the manner in which they were originated. While we sell mortgage loans with no recourse, our whole loan sale agreements require us to repurchase or substitute mortgage loans in the event we breach any of these representations or warranties. In addition, we may be required to repurchase mortgage loans as a result of borrower fraud. If the level of repurchase and indemnity activity becomes material, our liquidity, results of operations and consolidated financial condition could be materially and adversely affected.
Certain provisions in our Amended Charter limit our likelihood of being acquired in a manner not approved by the Board.
The Plan of Reorganization the Amended Charter contain provisions to protect certain tax attributes of the Company and its subsidiaries following emergence from bankruptcy. Until the third anniversary of the Effective Date, unless approved by the Board in accordance with the procedures set forth in the Amended Charter and subject to certain exceptions for permitted transfers, any attempted transfer of the Company’s common stock is prohibited and void ab initio to the extent that, as a result of such transfer (or any series of transfers of which such transfer is a part), either (i) any person or group of persons will own 4.95% or more of the outstanding shares of common stock or preferred stock of the Company or (ii) the ownership interest in the Company of any of its existing 5% stockholders will be increased. The Expiration Date may be extended in the Board’s discretion until the sixth anniversary of the Effective Date in order to protect the tax attributes of the Company.
The existence of the Tax Attribute Preservation Provision may make it more difficult, delay, discourage, prevent or make it more costly to acquire us or affect a change in control that is not approved by the Board. This, in turn, could prevent our
30
stockholders from recognizing a gain in the event that a favorable offer is extended and could materially and adversely affect the market price of our common stock.
Old National and the Company jointly announced the execution of a definitive agreement under which Old National will acquire the Company through a stock and cash merger. The definitive merger agreement has been unanimously approved by the Board of both Old National and the Company. The transaction remains subject to regulatory approval and the vote of the Company's stockholders. The transaction is anticipated to close in the second quarter of 2016.
We offer third-party products, including mutual funds, annuities, life insurance, individual securities and other wealth management services which could experience significant declines in value subjecting us to reputational damage and litigation risk.
We offer third-party products, including mutual funds, annuities, life insurance, individual securities and other wealth management products and services. If these products do not generate competitive risk-adjusted returns that satisfy clients in a variety of asset classes, we will have difficulty maintaining existing business and attracting new business. Additionally, our investment services business involves the risk that clients or others may sue us, claiming that we have failed to perform under a contract or otherwise failed to carry out a duty owed to them. Our investment services businesses are particularly subject to this risk and this risk may be heightened during periods when credit, equity or other financial markets are deteriorating in value or are particularly volatile, or when clients or investors are experiencing losses. Significant declines in the performance of these third-party products could subject us to reputational damage and litigation risk.
We are exposed to risk of environmental liabilities with respect to properties to which we own or take title.
In the course of our business we may own or foreclose and take title to real estate that could be subject to environmental liabilities. We may be held liable to a governmental entity or to third parties for property damage, personal injury, investigation and clean-up costs incurred by these parties in connection with environmental contamination, or may be required to investigate or clean up hazardous or toxic substances or chemical releases at a property. The costs associated with investigation or remediation activities could be substantial. In addition, as the owner or former owner of a contaminated site, we may be subject to common law claims by third parties based on damages and costs resulting from environmental contamination emanating from the property. If we ever become subject to significant environmental liabilities, our business, consolidated financial condition, cash flows, liquidity and results of operations could be materially and adversely affected.
Risks Related to the Ownership of our Common Stock
An active, liquid and orderly trading market for our common stock may not develop and the stock price may be volatile.
Since our common stock is not widely traded, its market value could be subject to wide fluctuations in response to various risk factors including:
• | changes in laws or regulations applicable to our industry, products or services; |
• | additions or departures of key personnel; |
• | price and volume fluctuations in the overall stock market; |
• | volatility in the market value and trading volume of companies in our industry or companies that investors consider comparable; |
• | share price and volume fluctuations attributable to inconsistent trading volume levels of our shares; |
• | sales of our common stock by us or our stockholders; |
• | the expiration of contractual lock-up agreements; |
• | litigation involving us, our industry or both; |
• | the impact of changes in the economic environment; |
• | the impact of changes in the political environment; |
• | activities by our competitors; |
• | loss of significant customers; |
• | major catastrophic events; and |
• | general economic and market conditions and trends. |
As a result of the Plan of Reorganization, a limited number of stockholders are substantial holders of the shares of our common stock.
As a result of the Private Placements pursuant to the Plan of Reorganization, as of September 30, 2013, certain investors own up to 9.9% of our common stock and certain other investors own up to 4.9% of our common stock. Having a large portion of our shares of common stock held by a relatively small number of stockholders could result in a material impact on the trading
31
volume and price per share of our common stock if any of these stockholders decide to sell a significant portion of their holdings. As a result, a small number of holders of our common stock are able to exercise significant influence over matters requiring stockholder approval.
The Investor SPAs and the Secondary SPAs grant the Investors and the Secondary Investors, respectively, certain preemptive rights and approval rights which could impede our ability to raise additional equity capital. Under the Investor SPAs and the Secondary SPAs, in certain instances, the Investors and the Secondary Investors, respectively, have preemptive rights to purchase equity securities we may offer in non-SEC registered capital raising transactions. These rights may adversely affect our ability to raise additional equity capital on favorable terms. If management determines we need to raise additional equity capital for our business, our inability to do so on favorable terms may have a material adverse effect on our business, consolidated financial condition and results of operations and, as a result, a material adverse effect on our ability to satisfy our debt obligations.
“Anti-takeover” provisions and the regulations to which we are subject may make it more difficult for a third party to acquire control of us, even if the change in control would be beneficial to our stockholders.
Anti-takeover provisions in Delaware law and our Amended Charter and bylaws (the “Amended Bylaws”), as well as regulatory approvals that would be required under federal law, could make it more difficult for a third party to take control of us and may prevent stockholders from receiving a premium for their shares of our common stock. These provisions could adversely affect the market value of our common stock and could reduce the amount that stockholders might get if we are sold.
Our Amended Charter provides for, among other things:
• | advance notice for nomination of directors and other stockholder proposals; |
• | limitations on the ability of stockholders to call a special meeting of stockholders; |
• | the approval by a super-majority of outstanding shares to amend certain provisions of the Amended Bylaws and the certificate of incorporation; and |
• | the Tax Attribute Preservation Provision. |
Delaware law also imposes some restrictions on mergers and other business combinations between us and any holder of 15% or more of our outstanding common stock. We believe that these provisions protect our stockholders from coercive or otherwise unfair takeover tactics by requiring potential acquirers to negotiate with our Board and by providing our Board with more time to assess any acquisition proposal. However, these provisions apply even if the offer may be determined to be beneficial by some stockholders and could delay or prevent an acquisition that our Board determines is not in the best interest of our stockholders.
Furthermore, banking laws impose notice, approval and ongoing regulatory requirements on any stockholder or other party that seeks to acquire direct or indirect “control” of an FDIC-insured depository institution. These laws include the Federal Savings and Loan Holding Company Act, the Bank Holding Company Act of 1956 and the Change in Bank Control Act. These laws could delay or prevent an acquisition.
Old National and the Company jointly announced the execution of a definitive agreement under which Old National will acquire the Company through a stock and cash merger. The definitive merger agreement has been unanimously approved by the Board of both Old National and the Company. The transaction remains subject to regulatory approval and the vote of the Company's stockholders. The transaction is anticipated to close in the second quarter of 2016.
Risks Related to Our Industry
Our business may be adversely affected by the pace of economic activity and recovery, current conditions in the financial markets, the real estate market and economic conditions generally.
The pace of this economic recovery has resulted in lower levels of lending by some financial institutions to their customers in contrast to lending experienced in other periods of economic recovery. This has continued to result in a lack of customer confidence, increased market volatility and a widespread lower level of general business activity. Competition among financial institutions for deposits and loans continues to be high, and access to deposits or borrowed funds remains lower than average.
The soundness of other financial institutions could materially and adversely affect us.
Our ability to engage in routine funding transactions could be adversely affected by the actions and commercial soundness of other financial institutions. Transactions with other financial institutions expose us to credit risk in the event of default of our counterparty or client. In addition, our credit risk is likely to be exacerbated when the collateral held by us cannot be realized upon or is liquidated at prices not sufficient to recover the full amount of the financial instrument exposure due us. Any losses
32
resulting from such defaults by us, our counterparties or our clients could materially and adversely affect our results of operations.
Competition in the financial services industry is intense and could result in losing business or reducing margins.
We operate in a highly competitive industry that could become even more competitive as a result of legislative, regulatory and technological changes and continued consolidation. We face aggressive competition from other domestic and foreign lending institutions and from numerous other providers of financial services. The ability of non-banking financial institutions to provide services previously limited to commercial banks has intensified competition. Because non-banking financial institutions are not subject to the same regulatory restrictions as banks and bank holding companies, they can often operate with greater flexibility and lower cost structures.
Securities firms and insurance companies that elect to become financial holding companies may acquire banks and other financial institutions. This may significantly change the competitive environment in which we conduct business. As a result of these various sources of competition, we could lose business to competitors or be forced to price products and services on less advantageous terms to retain or attract clients, either of which would adversely affect our profitability.
We continually encounter technological change.
The financial services industry is continually undergoing rapid technological change with frequent introductions of new technology-driven products and services. Our future success depends, in part, upon our ability to address the needs of our customers by using technology to provide products and services that will satisfy customer demands, as well as to create additional efficiencies in our operations. We may not be able to effectively implement new technology-driven products and services or be successful in marketing these products and services to our customers. Failure to successfully keep pace with technological change affecting the financial services industry could have a material adverse impact on our business and, in turn, our consolidated financial condition, results of operations and cash flows.
Risks Related to Recent Market, Legislative and Regulatory Events
We are highly dependent upon programs administered by Fannie Mae, Freddie Mac and Ginnie Mae. Changes in existing U.S. government-sponsored mortgage programs or servicing eligibility standards could materially and adversely affect our business, financial position, results of operations or cash flows.
Our ability to generate revenues through mortgage loan sales to institutional buyers depends to a significant degree on programs administered by Fannie Mae, Freddie Mac, Ginnie Mae and others that facilitate the issuance of mortgage backed securities in the secondary market. Our status as a Fannie Mae and Freddie Mac approved seller/servicer is subject to compliance with each entity’s respective selling and servicing guides.
We also derive other material financial benefits from our relationships with Fannie Mae and Freddie Mac, including the assumption of credit risk by these entities on loans included in mortgage backed securities in exchange for our payment of guarantee fees and the ability to avoid certain loan inventory finance costs through streamlined loan funding and sale procedures. Any discontinuation of, or significant reduction or material change in, the operation of these entities or any significant adverse change in the level of activity in the secondary mortgage market or the underwriting criteria of these entities would likely prevent us from originating and selling most, if not all, of our mortgage loan originations.
In addition, we service loans on behalf of Fannie Mae and Freddie Mac, as well as loans that have been securitized pursuant to securitization programs sponsored by Fannie Mae and Freddie Mac in connection with the issuance of agency guaranteed mortgage backed securities and a majority of our mortgage servicing rights (“MSR”) relate to these servicing activities.
Potential changes to the government-sponsored mortgage programs, and related servicing compensation structures, could require us to fundamentally change our business model in order to effectively compete in the market. Our inability to make the necessary changes to respond to these changing market conditions or loss of our approved seller/servicer status with any of these entities, would have a material adverse effect on our overall business and our consolidated financial position, results of operations and cash flows.
We operate in a highly regulated environment and the laws and regulations that govern our operations, corporate governance, executive compensation and accounting principles, or changes in them, or our failure to comply with them, may adversely affect us.
As a SLHC and a federal savings association, we and the Bank are subject to extensive regulation, supervision and legal requirements that govern almost all aspects of our operations. These laws and regulations, among other matters, prescribe minimum capital requirements, impose limitations on the business activities in which we can engage, limit the dividends or
33
distributions that the Bank can pay to us, restrict the ability of institutions to guarantee our debt and impose certain specific accounting requirements on us that may be more restrictive and may result in greater or earlier charges to earnings or reductions in our capital than generally accepted accounting principles. Changes to statutes, regulations or regulatory policies, including interpretation or implementation of statutes, regulations or policies, could affect us adversely, including limiting the types of financial services and products we may offer and/or increasing the ability of non-banks to offer competing financial services and products. Compliance with laws and regulations can be difficult and costly and changes to laws and regulations often impose additional compliance costs. Our failure to comply with these laws and regulations, even if the failure follows good faith effort or reflects a difference in interpretation, could subject us to restrictions on our business activities, fines and other penalties, any of which could adversely affect our results of operations, capital base and the price of our securities. Further, any new laws, rules and regulations could make compliance more difficult or expensive or otherwise adversely affect our business and consolidated financial condition.
Federal banking agencies periodically conduct examinations of our business, including compliance with laws and regulations, and our failure to comply with any supervisory actions to which we are or become subject as a result of such examinations may adversely affect us.
Federal banking agencies, including the OCC and Federal Reserve, periodically conduct examinations of our business, including compliance with laws and regulations. If, as a result of an examination, a federal banking agency were to determine that the consolidated financial condition, capital resources, asset quality, earnings prospects, management, liquidity or other aspects of any of our operations had become unsatisfactory, or that we or the Bank or its management were in violation of any law or regulation, it may take a number of different remedial actions as it deems appropriate. These actions include the power to enjoin “unsafe or unsound” practices, to require affirmative actions to correct any conditions resulting from any violation or practice, to issue an administrative order that can be judicially enforced, to direct an increase in our or the Bank’s capital, to restrict our growth, to assess civil monetary penalties against us, our officers or directors, to remove officers and directors and, if it is concluded that such conditions cannot be corrected or there is an imminent risk of loss to depositors, to terminate the Bank’s deposit insurance.
Regulatory requirements may affect our ability to attract and retain management and directors.
If we fail to meet various regulatory requirements, such failure could potentially affect our ability to attract and retain management and directors.
Financial institutions, such as the Bank, face a risk of noncompliance and enforcement action with the Bank Secrecy Act and other anti-money laundering statutes and regulations.
The federal BSA, the USA PATRIOT Act, and other laws and regulations require financial institutions, among other duties, to institute and maintain an effective anti-money laundering program and file suspicious activity and currency transaction reports as appropriate. The federal Financial Crimes Enforcement Network, established by the U.S. Treasury Department to administer the BSA, is authorized to impose significant civil money penalties for violations of those requirements, and has recently engaged in coordinated enforcement efforts with the individual federal banking regulators, as well as the U.S. Department of Justice, U.S. Drug Enforcement Administration and IRS. There is also increased scrutiny of compliance with the sanctions programs and rules administered and enforced by the U.S. Treasury Department’s Office of Foreign Assets Control. In order to comply with regulations, guidelines and examination procedures in this area, we have dedicated significant resources to the development of our anti-money laundering program, adopting enhanced policies and procedures and implementing a robust automated anti-money laundering software solution. If our policies, procedures and systems are deemed deficient, we could be subject to liability, including fines and regulatory actions such as restrictions on our ability to pay dividends and the necessity to obtain regulatory approvals to proceed with certain aspects of our business plans.
We are subject to the CRA and fair lending laws, and failure to comply with these laws could lead to material penalties.
The CRA, the Equal Credit Opportunity Act, the Fair Housing Act and other fair lending laws and regulations impose nondiscriminatory lending requirements on financial institutions. The U.S. Department of Justice and other federal agencies are responsible for enforcing these laws and regulations. A successful challenge to an institution’s performance under the CRA or fair lending laws and regulations could result in a wide variety of sanctions, including the required payment of damages and civil money penalties, injunctive relief, imposition of restrictions on mergers and acquisitions activity and restrictions on expansion activity. Private parties may also have the ability to challenge an institution’s performance under fair lending laws in private class action litigation.
34
The FDIC’s restoration plan and the related increased assessment rate could adversely affect our earnings.
Market developments have significantly depleted the DIF of the FDIC and reduced the ratio of reserves to insured deposits. As a result of recent economic conditions and the enactment of the Dodd-Frank Act, the FDIC has increased the deposit insurance assessment rates and thus raised deposit premiums for insured depository institutions. If these increases are insufficient for the DIF to meet its funding requirements, further special assessments or increases in deposit insurance premiums may be required. We are generally unable to control the amount of premiums that we are required to pay for FDIC insurance. If there are additional bank or financial institution failures, we may be required to pay even higher FDIC premiums. Any future additional assessments, increases or required prepayments in FDIC insurance premiums may materially adversely affect results of operations.
We may be subject to more stringent capital requirements.
The Dodd-Frank Act requires the federal banking agencies to establish stricter risk-based capital requirements and leverage limits to apply to banks and bank and savings and loan holding companies. In July 2013, the federal banking agencies published the Basel III Capital Rules that revised their risk-based and leverage capital requirements and their method for calculating risk-weighted assets to implement, in part, agreements reached by the Basel Committee on Banking Supervision and certain provisions of the Dodd-Frank Act. The Basel III Capital Rules apply to banking organizations, including the Company and the Bank.
The Company and the Bank became subject to regulatory capital requirements under Basel III Capital Rules effective January 1, 2015, with a phase in period that generally extends from January 1, 2015 through January 1, 2019. Since the effective date of Basel III neither the Company nor the Bank has experienced any material impact involving the new rules. Subsequent potential rules adjustment by the regulatory governing bodies could still impact the Company or the Bank when they become effective.
The fiscal and monetary policies of the federal government and its agencies could have a material adverse effect on our earnings.
The Federal Reserve regulates the supply of money and credit in the United States. Its policies determine in large part the cost of funds for lending and investing and the return earned on those loans and investments, both of which affect the net interest margin. The resulting changes in interest rates can also materially decrease the value of certain financial assets we hold, such as debt securities. Its policies can also adversely affect borrowers, potentially increasing the risk that they may fail to repay their loans. Changes in Federal Reserve policies are beyond our control and difficult to predict.
Risks Relating to the Old National Merger
We will be subject to contractual restrictions and business uncertainties while the Old National merger is pending.
Our merger agreement with Old National restricts us from operating our business other than in the ordinary course and prohibits us from taking specified actions without Old National’s consent until the merger occurs. These restrictions may prevent us from pursuing attractive business opportunities that may arise prior to the completion of the merger. In addition, uncertainty about the effect of the Old National merger on our employees and clients may have an adverse effect on our business. We may have difficulty retaining employees while the merger is pending, as certain employees may experience uncertainty about their future roles with Old National. In addition, the uncertainty caused by the pending merger could cause our clients and business associates to seek to change their existing business relationships with us. These uncertainties may impair our ability to attract, retain and motivate key personnel and retain and grow our client base until we complete the merger.
The merger is subject to certain closing conditions that, if not satisfied or waived, will result in the merger not being completed. Failure to complete the merger with Old National could negatively affect our business.
The merger is subject to customary conditions to closing, including the receipt of required regulatory approvals and adoption of the merger by the Company's stockholders. If any condition to the merger is not satisfied or waived, to the extent permitted by law, including the absence of any materially burdensome condition in the regulatory approvals, the merger will not be completed. In addition, either Old National or the Company may terminate the merger agreement under certain circumstances even if the merger is adopted by the Company's stockholders, including but not limited to, if the merger has not been completed on or before October 11, 2016, provided that Old National may extend the date to January 11, 2017, if on October 11, 2016, all closing conditions except obtaining the required regulatory approvals have been satisfied or waived and Old National in good faith believes such regulatory approvals will be received by January 11, 2017. If we do not complete the merger, we would not
35
realize any of the expected benefits of having completed the merger. If the merger is not completed, additional risks could materialize, which could materially and adversely affect the business, financial results and consolidated financial condition.
If the merger is not completed, we will have incurred material expenses without realizing the expected benefits of the merger.
We will have incurred material expenses in connection with the negotiation and signing of the merger agreement, the receipt of regulatory and stockholder approvals and in anticipation of the completion of the merger. If the merger is not completed, we will have to recognize these expenses without realizing the expected benefits of the merger.
The merger is subject to the receipt of consents and approvals from governmental entities that may impose conditions that could have an adverse effect on the combined company following the merger.
Before the merger may be completed, various approvals or consents must be obtained from regulatory authorities. These regulatory authorities, including the Federal Reserve Board and the OCC, may impose conditions on the completion of the merger or require changes to the terms of the merger. Such conditions or changes could have the effect of delaying completion of the merger, giving Old National the right to terminate the merger agreement or imposing additional costs on or limiting the revenues of the combined company following the merger, any of which might have an adverse effect on the combined company following the merger. On February 12, 2016, the Federal Reserve Board granted Old National's request for a waiver of the Federal Reserve Board's application requirements. There can be no assurance as to whether all the regulatory approvals will be received, the timing of such approvals, or whether any conditions will be imposed.
We cannot be sure of the market value of the merger consideration that our stockholders will receive as a result of the announced merger with Old National.
If the merger is completed, each share of the Company's common stock will be converted into the right to receive, at the holder’s election and subject to the proration as set forth in the merger agreement, 3.5505 shares of Old National common stock or $48.50 in cash; however the exchange ratio for shares of stock is subject to adjustment if (i) the after-tax environmental costs in relation to our properties are in excess of $5,000,000 or (ii) at any time during the five-day period starting on the date on which all regulatory approvals required for the completion of the merger are received, the average closing price of a share of Old National common stock for the ten consecutive trading days prior to the first date on which all required regulatory approvals are received is less than $10.67 per share and decreases by more than 20% in relation to the change in the NASDAQ Bank Index.
Additionally, the market value of the merger consideration may vary from the closing price of Old National common stock on the date we announced the merger, on the date that the proxy statement/prospectus is mailed to our stockholders, on the date of the special meeting of our stockholders, on the date we complete the merger and thereafter. Stock price changes may result from a variety of factors, including general market and economic conditions, changes in our respective businesses, operations and prospects, and the regulatory situation of Old National and the Company. Many of these factors are beyond our control. Any change in the market price of Old National common stock prior to completion of the merger will affect the amount of and the market value of the merger consideration that our stockholders will receive upon completion of the merger. Accordingly, at the time of the special meeting, our stockholders will not know or be able to calculate the amount or the market value of the merger consideration they would receive upon completion of the merger.
Further, the businesses of Old National and the Company differ in important respects and, accordingly, the results of operations of the combined company and the market price of the combined company’s shares of common stock may be affected by factors different from those currently affecting the independent results of operations of Old National and the Company.
We may fail to realize all of the anticipated benefits of the merger.
The success of the merger will depend, in part, on Old National’s ability to realize anticipated benefits and cost savings from combining the businesses of Old National and the Company and to combine the businesses of Old National and the Company in a manner that permits growth opportunities and cost savings to be realized without materially disrupting the existing customer relationships of the Company or decreasing revenues due to loss of customers. However, to realize these anticipated benefits and cost savings, Old National must successfully combine the businesses of Old National and the Company. If the combined company is not able to achieve these objectives, the anticipated benefits and cost savings of the merger may not be realized fully or at all or may take longer to realize than expected.
The Company has operated and, until the completion of the merger, will continue to operate, independently. It is possible that the integration process could result in the loss of key employees who may then receive severance benefits, the disruption of each company’s ongoing business or inconsistencies in standards, controls, procedures and policies that adversely affect the
36
combined company’s ability to maintain relationships with clients, customers, depositors and employees or to achieve the anticipated benefits of the merger. The anticipated cost savings from the merger are largely expected to derive from the absorption by Old National of many of our back-office and other duplicative administrative functions. Integration efforts between the two companies will also divert significant management attention and resources that will not be available for normal operations. An inability to successfully market Old National’s products to the Company's customer base could cause the earnings of the combined company to be less than anticipated. An expected benefit from the merger is an expected increase in the revenues of the combined company from anticipated sales of Old National’s wide variety of financial products, and from increased lending out of the combined company’s larger capital base and legal lending limits. An inability to successfully market Old National’s products to our customer base could cause the earnings of the combined company to be less than anticipated. Integration matters and the transition to Old National could have an adverse effect on the Company and Old National during the pre-merger transition period, and on Old National for an undetermined period after consummation of the merger.
The merger agreement limits our ability to pursue an alternative acquisition proposal and could require us to pay a termination fee of $15.0 million under certain circumstances relating to alternative acquisition proposals.
The merger agreement prohibits the Company from soliciting, initiating or knowingly encouraging certain alternative acquisition proposals with any third party, subject to exceptions set forth in the merger agreement. The merger agreement also provides for the payment by the Company to Old National of a termination fee in the amount of $15.0 million (and, in some cases, Old National's documented out-of-pocket expenses incurred in connection with the merger) in the event that the Company or Old National terminates the merger agreement for certain specified reasons. These provisions might discourage a potential competing acquirer that might have an interest in acquiring all or a significant part of the Company from considering or proposing such an acquisition.
Item 1B. | Unresolved Staff Comments. |
Not applicable.
Item 2. | Properties |
At December 31, 2015, the Company conducted its business from its main office headquarters, which includes a full service branch, at 25 West Main Street, Madison, Wisconsin, 45 other full-service offices and one loan origination office. The Company leases 18 branch offices and office facilities under non-cancelable operating leases which expire on various dates through 2029. During 2015, the Bank sold its Viroqua branch, which was a leased facility, and its Winneconne branch. In addition, the Bank completed the purchase of a new building, located on the east side of Madison, to house the Bank's support departments, as well as opened a new branch in Appleton. As part of several actions to improve overall operational efficiencies, six retail bank branches in Wisconsin were consolidated. See Note 7 to the Consolidated Financial Statements included in Item 8 for a further discussion of these events.
Item 3. | Legal Proceedings |
In the ordinary course of business, there are legal proceedings against the Company and its subsidiaries. Management considers the aggregate liabilities, if any, resulting from such actions would not have a material, adverse effect on the consolidated financial position of the Company.
On February 25, 2016, a plaintiff filed a purported class action complaint in the United States District Court for the Western District of Wisconsin on behalf of himself and other Company stockholders against the Company, its Board, and Old National in connection with a proposed transaction between the Company and Old National, pursuant to which the Company will be acquired by Old National. The lawsuit is captioned Parshall v. Anchor Bancorp Wisconsin, Inc., et al., Case No. 16-CV-120 (W.D. Wis.), and alleges state law breach of fiduciary duty claims against the Company’s Board for, among other things, seeking to sell the Company through an allegedly defective process, for an unfair price and on unfair terms. The lawsuit seeks, among other things, to enjoin the consummation of the transaction and damages. The complaint alleges that Old National aided and abetted the directors’ breaches of fiduciary duty. The complaint also brings state and federal law claims alleging that the Form S-4 Registration Statement that was filed with the U.S. Securities and Exchange Commission on February 17, 2016 for the transaction, omitted certain material information.
37
Item 4. | Mine Safety Disclosures |
Not applicable.
38
PART II
Item 5. | Market for Registrant’s Common Equity, Related Stockholder Matters and Issuer Purchases of Equity Securities |
Common Stock
On October 22, 2014, the Company completed the IPO in which the Company issued and sold 250,000 shares of common stock at a public offering price of $26.00 per share. In addition, the underwriters of the offering purchased an additional 55,794 shares at the offering price on October 30, 2014 to cover over-allotments. Our common stock is listed on the NASDAQ Global Market under the symbol “ABCW.”
All shares of the outstanding Legacy Common Stock, including shares held as treasury stock and in any stock incentive plans, were cancelled on September 27, 2013 pursuant to the Plan of Reorganization.
The Company had 92 stockholders of record at February 29, 2016.
Quarterly Stock Price and Dividend Information
The table below presents the reported high and low sale prices of the Company’s common stock during the periods indicated. As noted previously, the Company completed its IPO of common stock in October 2014, and the common stock was listed for trading upon completion of the IPO. Accordingly, the table below begins with the fourth quarter of 2014.
Quarter Ended | High | Low | Cash Dividend | ||||||||
December 31, 2015 | $ | 45.42 | $ | 40.66 | $ | — | |||||
September 30, 2015 | 42.59 | 37.01 | — | ||||||||
June 30, 2015 | 38.30 | 34.29 | — | ||||||||
March 31, 2015 | 35.24 | 32.80 | — | ||||||||
December 31, 2014 | 35.00 | 29.51 | — | ||||||||
For information regarding restrictions on the payments of dividends by the Bank to the Company, see “Item 1. Business – Regulation and Supervision", “Item 1A. Risk Factors – Risks Related to Our Business” and “Item 7. Management’s Discussion and Analysis of Financial Condition and Results of Operations – Liquidity and Capital Resources.”
Dividends
There were no dividends declared or paid on the Company’s common stock for the years ended December 31, 2015 and 2014 or the nine months ended December 31, 2013.
Recent Sales of Unregistered Securities
There were no sales of unregistered securities for the quarter ended December 31, 2015.
Recent Repurchases of Common Stock
There were no repurchases of the Company’s common stock for the quarter ended December 31, 2015.
39
Performance Graph
Set forth below is a line graph comparing the yearly percentage change in the cumulative total stockholder return on the Company's common stock, based on the market price of the common stock and assuming reinvestment of cash dividends, with the cumulative total return of companies on the KBW Regional Banking Index and the NASDAQ Market Index. The graph assumes that $100 was invested on October 22, 2014, in Company common stock and each of those indices.
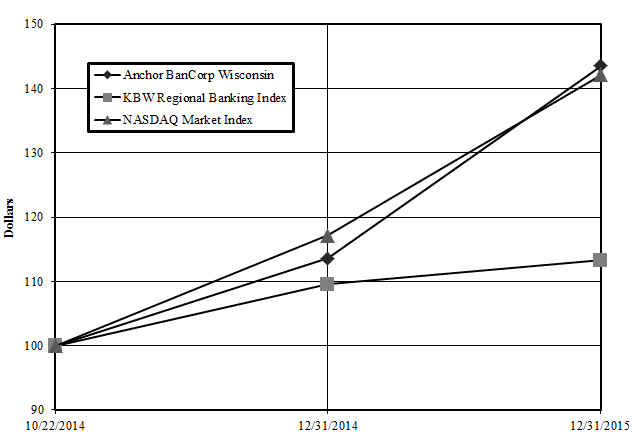
40
Item 6. | Selected Financial Data |
The following information at and for the years ended December 31, 2015 and 2014, the nine months ended December 31, 2013 and the fiscal years ended March 31, 2013 and 2012 has been derived primarily from the Company’s historical audited consolidated financial statements for those periods.
Year Ended December 31, | Nine Months Ended December 31, | Fiscal Year Ended March 31, | |||||||||||||||||
2015 | 2014 | 2013 | 2013 | 2012 | |||||||||||||||
(Dollars in thousands – except per share amounts) | |||||||||||||||||||
Operations: | |||||||||||||||||||
Interest income | $ | 73,210 | $ | 75,580 | $ | 62,223 | $ | 99,882 | $ | 127,253 | |||||||||
Interest expense | 4,429 | 4,344 | 14,117 | 37,399 | 55,329 | ||||||||||||||
Provision for loan losses | (29,496 | ) | (4,585 | ) | 275 | 7,733 | 33,887 | ||||||||||||
Non-interest income (1) | 34,971 | 30,519 | 159,533 | 45,901 | 49,261 | ||||||||||||||
Non-interest expense | 84,937 | 91,708 | 95,732 | 135,004 | 124,026 | ||||||||||||||
Income (loss) before income taxes | 48,311 | 14,632 | 111,632 | (34,353 | ) | (36,728 | ) | ||||||||||||
Income tax expense (benefit) | (89,447 | ) | 10 | 9 | (181 | ) | 10 | ||||||||||||
Net income (loss) | 137,758 | 14,622 | 111,623 | (34,172 | ) | (36,738 | ) | ||||||||||||
Preferred stock dividends in arrears (2) | — | — | (2,538 | ) | (6,560 | ) | (6,278 | ) | |||||||||||
Preferred stock discount accretion | — | — | (6,167 | ) | (7,412 | ) | (7,413 | ) | |||||||||||
Retirement of preferred shares | — | — | 104,000 | — | — | ||||||||||||||
Net income (loss) available to common equity | 137,758 | 14,622 | 206,918 | (48,144 | ) | (50,429 | ) | ||||||||||||
Per Common Share: | |||||||||||||||||||
Basic earnings (loss) | $ | 14.64 | $ | 1.61 | $ | 12.18 | $ | (2.27 | ) | $ | (2.37 | ) | |||||||
Diluted earnings (loss) | 14.57 | 1.60 | 12.18 | (2.27 | ) | (2.37 | ) | ||||||||||||
Book value | 38.20 | 23.85 | 22.34 | (7.99 | ) | (6.57 | ) | ||||||||||||
Dividends | — | — | — | — | — | ||||||||||||||
Financial Condition: | |||||||||||||||||||
Total assets | $ | 2,248,498 | $ | 2,082,379 | $ | 2,112,474 | $ | 2,367,583 | $ | 2,789,452 | |||||||||
Investment securities available for sale (AFS) | 341,523 | 294,599 | 277,872 | 266,787 | 242,299 | ||||||||||||||
Investment securities held to maturity (HTM) | 15,492 | — | — | — | — | ||||||||||||||
Loans held for investment, net | 1,614,953 | 1,524,439 | 1,544,324 | 1,670,543 | 2,057,744 | ||||||||||||||
Deposits | 1,840,724 | 1,814,171 | 1,875,293 | 2,025,025 | 2,264,901 | ||||||||||||||
Borrowed funds | 12,562 | 13,752 | 12,877 | 317,225 | 476,103 | ||||||||||||||
Stockholders’ equity (deficit) | 366,641 | 227,663 | 202,198 | (59,864 | ) | (29,550 | ) | ||||||||||||
Common shares outstanding (3) | 9,597,392 | 9,547,587 | 9,050,000 | 21,247,225 | 21,247,725 | ||||||||||||||
Other Financial Data: | |||||||||||||||||||
Yield on interest-earning assets | 3.59 | % | 3.74 | % | 3.80 | % | 3.96 | % | 4.34 | % | |||||||||
Cost of funds | 0.24 | 0.23 | 0.86 | 1.45 | 1.79 | ||||||||||||||
Interest rate spread | 3.35 | 3.51 | 2.94 | 2.51 | 2.55 | ||||||||||||||
Net interest margin (4) | 3.37 | 3.53 | 2.94 | 2.48 | 2.45 | ||||||||||||||
Return on average assets (5) | 6.36 | 0.69 | 6.54 | (1.30 | ) | (1.17 | ) | ||||||||||||
Average equity (deficit) to average assets | 13.59 | 10.04 | 1.19 | (1.32 | ) | (0.49 | ) | ||||||||||||
(1) The period ended December 31, 2013 includes $134.5 million for extinguishment of debt.
(2) All periods include compounding.
(3) At December 31, 2013 common shares outstanding represent all new common stock issued pursuant to the Plan of Reorganization. All legacy common shares were canceled.
(4) Net interest margin represents net interest income as a percentage of average interest-earning assets.
(5) Return on average assets represents net income (loss) as a percentage of average total assets.
41
Item 7. | Management’s Discussion and Analysis of Financial Condition and Results of Operations |
Set forth below is a discussion and analysis of the Company’s consolidated financial condition and results of operations, including information on asset/liability management strategies, sources of liquidity and capital resources and critical accounting policies at the dates and for the periods indicated. Management’s discussion and analysis should be read in conjunction with the consolidated financial statements and supplemental data contained elsewhere in this report.
Management is required to make estimates, assumptions and judgments that affect the amounts reported in the consolidated financial statements and accompanying notes. These estimates, assumptions and judgments are based on information available as of the date of the consolidated financial statements. Accordingly, as this information changes, actual results could differ from the estimates, assumptions and judgments reflected in the consolidated financial statements. Certain policies inherently have a greater reliance on the use of estimates, assumptions and judgments and, as such, have a greater possibility of producing results that could be materially different than originally reported. Management believes the following policies are both important to the portrayal of our consolidated financial condition and results of operations and require subjective or complex judgments; therefore, management considers the following to be its critical accounting policies. Management has reviewed the application of these polices with the Audit Committee of our Board.
Critical Accounting Estimates and Judgments
The consolidated financial statements are prepared by applying certain accounting policies. Certain of these policies require management to make estimates and strategic or economic assumptions that may prove inaccurate or be subject to variations that may significantly affect the reported results and consolidated financial position for the period or in future periods. Some of the more significant policies are as follows:
Fair Value Measurements
In preparing the consolidated financial statements, management is required to make estimates, assumptions and judgments when assets and liabilities are required to be recorded at, or adjusted to reflect, fair value under Generally Accepted Accounting Principles (“GAAP”). Actual results could differ from those estimates. Material estimates that are particularly susceptible to significant changes in the near term relate to the allowance for loan losses, the valuation of OREO, the net carrying value of MSRs, the valuation of deferred tax assets and the fair value of investment securities, interest rate lock commitments, forward contracts to sell mortgage loans, interest rate swap contracts and loans held for sale. The valuation of both financial and nonfinancial assets and liabilities in these transactions requires numerous assumptions and estimates and the use of third-party sources including appraisers and valuation specialists. For a more detailed discussion, see Notes 1 and 16 in the Notes to Consolidated Financial Statements contained in Item 8.
Assets and liabilities carried at fair value inherently result in a higher degree of financial statement volatility. Assets and liabilities measured at fair value on a recurring basis include available for sale investment securities, loans held for sale, interest rate lock commitments, forward contracts to sell mortgage loans and interest rate swap contracts. Assets and liabilities measured at fair value on a non-recurring basis may include certain impaired loans, MSRs and OREO. Fair values and the information used to record valuation adjustments for certain assets and liabilities are based on either quoted market prices or are provided by other independent third-party sources, when available. When such third-party information is not available, fair value is estimated primarily by using cash flow and other financial modeling techniques. Changes in underlying factors, assumptions or estimates in any of these areas could materially impact future financial condition and results of operations.
Investment Securities
Declines in the fair value of investment securities below amortized cost basis that are deemed to be an other-than-temporary impairment (“OTTI”), are reflected as impairment losses. To determine if an other-than-temporary impairment exists on a debt security, the Company first determines if (a) it intends to sell the security or (b) it is more likely than not that it will be required to sell the security before its anticipated recovery. If either of the conditions is met, the Company will recognize an other-than-temporary impairment in earnings equal to the difference between the fair value of the security and its amortized cost basis. If either of the conditions is met, the Company determines (a) the amount of the impairment related to credit loss and (b) the amount of the impairment due to all other factors. The difference between the present values of the cash flows expected to be collected discounted at the purchase yield or current accounting yield and the amortized cost basis is the credit loss. The amount of the credit loss is included in the consolidated statements of operations as an other-than-temporary impairment on securities and is a reduction in the cost basis of the security. The portion of the total impairment that is related to all other factors is included in other comprehensive income (loss). See Notes 1 and 4 in the Notes to Consolidated Financial Statements contained in Item 8.
42
Allowance for Loan Losses
The allowance for loan losses is a valuation account for probable and inherent losses incurred in the loan portfolio. Management maintains an allowance for loan losses at levels that we believe to be adequate to absorb estimated probable credit losses incurred in the loan portfolio. The adequacy of the allowance for loan losses is determined based on periodic evaluations of the loan portfolios and other relevant factors. The allowance for loan losses is comprised of general and specific components. Even though the entire allowance is available to cover losses on any loan, specific allowances are provided on impaired loans pursuant to accounting standards. The general allowance is based on historical loss experience, adjusted for qualitative factors. At least quarterly, management reviews the assumptions and methodology related to the general and specific allowance in an effort to update and refine the estimate. See Notes 1 and 5 in the Notes to Consolidated Financial Statements contained in Item 8.
Valuation of OREO
Real estate acquired by foreclosure or by deed in lieu of foreclosure as well as other repossessed assets are held for sale and are initially recorded at fair value less estimated selling costs at the date of foreclosure, establishing a new cost basis. When a loan is transferred to OREO the write down to fair value less estimated selling costs is charged to the allowance for loan losses. Subsequent to foreclosure, valuations are periodically performed and a valuation allowance is established if the carrying value exceeds the fair value less estimated selling costs. See Notes 1 and 6 in the Notes to Consolidated Financial Statements contained in Item 8.
Mortgage Servicing Rights
MSRs are recorded as an asset, measured at fair value, when loans are sold to third parties with servicing rights retained. MSRs are amortized in proportion to, and over the period of, estimated net servicing revenues. The carrying value of these assets is periodically reviewed for impairment using a lower of amortized cost or fair value methodology. See Notes 1 and 8 in the Notes to Consolidated Financial Statements contained in Item 8.
Deferred Tax Assets
The Company’s provision for federal and state income taxes results in the recognition of a deferred tax liability or deferred tax asset computed by applying the current statutory tax rates to net taxable or deductible differences between the tax basis of an asset or liability and its reported amount in the consolidated financial statements that will produce taxable income or deductible expenses in future periods. The Company regularly reviews the carrying amount of its net deferred tax assets to determine if the establishment of a valuation allowance is necessary. If based on the available evidence, it is more likely than not that all or a portion of the Company’s net deferred tax assets will not be realized in future periods, a deferred tax valuation allowance would be established. Consideration is given to various positive and negative factors that could affect the realization of the net deferred tax assets.
In evaluating this available evidence, management considers, among other things, historical financial performance, expectation of future earnings, the ability to carry back losses to recoup taxes previously paid, the length of statutory carry forward periods, experience with operating loss and tax credit carry forwards not expiring unused, tax planning strategies and timing of reversals of temporary differences. Significant judgment is required in assessing future earnings trends and the timing of reversals of temporary differences. The Company’s evaluation is based on current tax laws as well as management’s expectations of future performance.
As a result of this evaluation, the Company reversed substantially all its valuation allowance against the deferred tax asset during 2015. For additional information regarding our deferred taxes, see Notes 1 and 17 of the Notes to Consolidated Financial Statements contained in Item 8.
Recent Accounting Pronouncements
Refer to Note 1 of the Notes to Consolidated Financial Statements contained in Item 8 for a description of recent accounting pronouncements, including the respective dates of adoption and effects on results of operations and financial condition.
Comparison of Financial Condition at December 31, 2015 and December 31, 2014
Total assets increased $166.1 million, or 8.0%, to $2.25 billion at December 31, 2015, from $2.08 billion at December 31, 2014. The increase was primarily caused by a $90.6 million increase in the deferred tax asset, net, a $90.5 million increase in loans held for investment, net, and a $46.9 million increase in investment securities available for sale. These increases were partially offset by a decrease of $72.0 million in cash and cash equivalents.
43
The deferred tax asset, net, increased $90.6 million since December 31, 2014 due to the reversal of substantially all of the Company's deferred tax asset valuation allowance as a result of management's periodic assessment of all available evidence.
The increase in loans held for investment, net, of $90.5 million, or 5.9%, since December 31, 2014 was primarily due to increases of $52.6 million and $37.0 million in multi-family and land and constructions loans, respectively. These fluctuations were primarily due to loan originations exceeding repayments during the period. The Bank also purchased $33.7 million of residential loans, consisting of 1-4 family adjustable and fixed rate loans. Negative loan loss provision of $29.5 million was also recorded through the allowance for loan loss account. As a result of a review of all available evidence, the Company determined its levels of allowance were no longer warranted. The allowance for loan losses declined $21.9 million from December 31, 2014, as the loan portfolio continues to improve its performance with recoveries net of charge offs of $7.6 million for the year ended December 31, 2015.
Investment securities also increased $62.4 million, or 21.2%, from December 31, 2014 while cash and cash equivalents decreased $72.0 million, or 48.9%, from December 2014 as cash was invested into earning assets.
Total liabilities increased $27.1 million, or 1.5%, to $1.88 billion at December 31, 2015, from $1.85 billion at December 31, 2014. The increase was primarily due to a $26.6 million, or 1.5%, increase in deposits with an increase in checking accounts of $42.2 million, money market accounts of $26.4 million and in savings accounts of $15.0 million which was offset by a decrease in certificates of deposit of $56.9 million as a result of the low interest rate environment. The overall increase in deposits was accomplished despite the branch deposit sales of $23.1 million during the year ended December 31, 2015.
Stockholders’ equity increased $139.0 million, or 61.0%, to $366.6 million at December 31, 2015, from $227.7 million at December 31, 2014. The increase was primarily due to net income for the year ended December 31, 2015, of $137.8 million.
Comparison of the Results of Operations for the Years Ended December 31, 2015 and 2014
Net income from operations for the years ended December 31, 2015 increased $123.1 million, or 842.1%, to $137.8 million from $14.6 million in the year ended December 31, 2014. The increase in net income was primarily the result of an income tax benefit, net of tax provision, of $89.4 million from the reversal of substantially all of the Company’s valuation allowance against its deferred tax asset during the year ended December 31, 2015. In addition, a negative provision for loan losses of $29.5 million was recorded. In 2015, net interest income decreased $2.5 million, non-interest income increased $4.5 million and non-interest expense decreased $6.8 million compared to 2014. The discussion that follows in this section provides details regarding these results for the year ended December 31, 2015.
44
Net Interest Income
The following table shows the Company’s average balances, interest, average rates, the spread between the combined average rates earned on interest-earning assets and average cost of interest-bearing liabilities, net interest margin, which represents net interest income as a percentage of average interest-earning assets and the ratio of average interest-earning assets to average interest-bearing liabilities for the years ended December 31, 2015 and 2014. The average balances are derived from daily balances.
Year Ended December 31, | |||||||||||||||||||||
2015 | 2014 | ||||||||||||||||||||
Average Balance | Interest | Average Yield/ Cost | Average Balance | Interest | Average Yield/ Cost | ||||||||||||||||
(Dollars in thousands) | |||||||||||||||||||||
Interest-Earning Assets | |||||||||||||||||||||
Mortgage and commercial real estate loans | $ | 1,210,304 | $ | 49,837 | 4.12 | % | $ | 1,197,999 | $ | 51,379 | 4.29 | % | |||||||||
Consumer loans | 322,149 | 14,737 | 4.57 | 351,113 | 16,766 | 4.78 | |||||||||||||||
Commercial and industrial loans | 37,103 | 1,889 | 5.09 | 19,032 | 1,068 | 5.61 | |||||||||||||||
Total loans held for investment (1)(2) | 1,569,556 | 66,463 | 4.23 | 1,568,144 | 69,213 | 4.41 | |||||||||||||||
Investment securities - AFS (3) | 329,263 | 6,055 | 1.84 | 290,381 | 5,931 | 2.04 | |||||||||||||||
Investment securities - HTM | 6,387 | 298 | 4.67 | — | — | — | |||||||||||||||
Interest-earning deposits | 123,402 | 335 | 0.27 | 147,915 | 371 | 0.25 | |||||||||||||||
Federal Home Loan Bank stock | 11,940 | 59 | 0.49 | 11,940 | 65 | 0.54 | |||||||||||||||
Total interest-earning assets | 2,040,548 | 73,210 | 3.59 | 2,018,380 | 75,580 | 3.74 | |||||||||||||||
Non-interest-earning assets | 125,793 | 96,390 | |||||||||||||||||||
Total assets | $ | 2,166,341 | $ | 2,114,770 | |||||||||||||||||
Interest-Bearing Liabilities | |||||||||||||||||||||
Demand deposits | $ | 1,053,407 | $ | 1,515 | 0.14 | % | $ | 1,021,022 | $ | 1,178 | 0.12 | % | |||||||||
Regular savings | 361,579 | 351 | 0.10 | 348,680 | 353 | 0.10 | |||||||||||||||
Certificates of deposit | 415,705 | 2,320 | 0.56 | 496,189 | 2,568 | 0.52 | |||||||||||||||
Total deposits | 1,830,691 | 4,186 | 0.23 | 1,865,891 | 4,099 | 0.22 | |||||||||||||||
Other borrowed funds | 14,312 | 243 | 1.70 | 14,858 | 245 | 1.65 | |||||||||||||||
Total interest-bearing liabilities | 1,845,003 | 4,429 | 0.24 | 1,880,749 | 4,344 | 0.23 | |||||||||||||||
Non-interest-bearing liabilities | 26,826 | 21,748 | |||||||||||||||||||
Total liabilities | 1,871,829 | 1,902,497 | |||||||||||||||||||
Stockholders’ equity | 294,512 | 212,273 | |||||||||||||||||||
Total liabilities and stockholders’ equity | $ | 2,166,341 | $ | 2,114,770 | |||||||||||||||||
Net interest income/interest rate spread (4) | $ | 68,781 | 3.35 | % | $ | 71,236 | 3.51 | % | |||||||||||||
Net interest-earning assets | $ | 195,545 | $ | 137,631 | |||||||||||||||||
Net interest margin (5) | 3.37 | % | 3.53 | % | |||||||||||||||||
Ratio of average interest-earning assets to average interest-bearing liabilities | 110.60 | % | 107.32 | % | |||||||||||||||||
(1) | For the purpose of these computations, non-accrual loans are included in the average loan amounts outstanding. |
(2) | Interest earned on loans includes loan fees (which are not material in amount) and interest income which has been received from borrowers whose loans were removed from non-accrual status during the period indicated. |
(3) | Average balances of securities available for sale are based on fair value. |
(4) | Interest rate spread represents the difference between the weighted-average yield on interest-earning assets and the weighted-average cost of interest-bearing liabilities. |
(5) | Net interest margin represents net interest income as a percentage of average interest-earning assets. |
Net interest income decreased $2.5 million, or 3.4%, to $68.8 million for the year ended December 31, 2015, from $71.2 million for the comparable prior year period. Interest income decreased $2.4 million, or 3.1%, to $73.2 million for the year
45
ended December 31, 2015, compared to $75.6 million for the year ended December 31, 2014, due to a 15 basis point decrease in average yields to 3.59% from the comparable prior year period of 3.74%.
The average balance of loans held for investment increased $1.4 million to $1.57 billion and the average balance of interest-earning deposits decreased $24.5 million to $123.4 million in 2015. The average balance of investment securities available for sale increased $38.9 million to $329.3 million and average investment securities held to maturity increased $6.4 million in 2015 as the Company began investing in HTM investment securities in June 2015. These fluctuations were primarily due to loan originations exceeding loan repayments during the period and excess liquidity being invested into securities to improve the yield on assets as opposed to being held in cash. The decline in the average asset yield was the result of the low interest rate environment over the last several years.
Interest expense increased $85,000, or 2.0%, to $4.4 million for the year ended December 31, 2015, from $4.3 million for the prior year period. The average cost of interest-bearing liabilities increased 1 basis point to 0.24% for the year ended December 31, 2015, from 0.23% for the same period in 2014, while the average balance of interest-bearing liabilities decreased $35.7 million to $1.85 billion for the year ended December 31, 2015, from $1.88 billion for the year ended December 31, 2014.
The average balance of deposits decreased $35.2 million to $1.83 billion in 2015, from $1.87 billion in the prior year. The decrease was primarily due to a decrease of $80.5 million, to $415.7 million in average certificates of deposit in 2015, from $496.2 million in the prior year. The decline in average certificates was offset by a net increase in average demand deposits of $32.4 million and average regular savings accounts of $12.9 million. We were able to overcome average deposit decreases from branch sales of $16.6 million on December 31, 2014 related to the Richland Center branch sale, $11.2 million on May 15, 2015 related to the Viroqua branch sale and $11.9 million on September 25, 2015 related to the Winneconne branch sale. The average cost of deposits increased 1 basis point to 0.23% during the year ended December 31, 2015, from 0.22% in 2014.
The interest rate spread decreased 16 basis points to 3.35% for the year ended December 31, 2015, compared to 3.51% for the prior year period. Net interest margin was 3.37% for the year ended December 31, 2015, a decrease of 16 basis points from 3.53% for the year ended December 31, 2014. The decrease in net interest margin was due to a $2.5 million decrease in net interest income partially offset by a $22.2 million increase in total average interest-earning assets between 2015 and 2014.
The ratio of average interest-earning assets to average interest-bearing liabilities increased to 110.60% for the year ended December 31, 2015, from 107.32% for the prior year period. This increase was primarily due to the $35.7 million decrease in average interest-bearing liabilities during 2015.
Provision for Loan Losses
The negative provision for loan losses was $29.5 million for the year ended December 31, 2015, compared to a negative provision for loan losses of $4.6 million for the comparable prior year period. The increase in negative provision for loan losses was due to significant recoveries in consecutive quarters, improvements in the credit quality of the loan portfolio and the continued reduction of historical loss rates.
Future provisions for loan losses will continue to be based upon management’s assessment of the overall loan portfolio and the underlying collateral, trends in non-performing loans, current economic conditions and other relevant factors in order to maintain the allowance for loan losses at adequate levels to provide for probable and estimable future losses. The establishment of the amount of the loan loss allowance inherently involves judgments by management as to the adequacy of the allowance, which ultimately may change. Higher rates of loan defaults than anticipated would likely result in a need to increase provisions in future periods. Conversely, the provision for loan losses may decline should credit metrics, such as net charge-offs and the amount of non-performing loans, continue to improve in the future.
46
Non-Interest Income
The following table presents non-interest income by major category for the periods indicated:
Year Ended December 31, | Increase (Decrease) | |||||||||||||
2015 | 2014 | Amount | Percent | |||||||||||
(Dollars in thousands) | ||||||||||||||
Service charges on deposits | $ | 10,061 | $ | 10,017 | $ | 44 | 0.4 | % | ||||||
Investment and insurance commissions | 4,166 | 4,222 | (56 | ) | (1.3 | ) | ||||||||
Loan fees | 2,440 | 882 | 1,558 | 176.6 | ||||||||||
Loan servicing income, net of amortization | 2,035 | 2,821 | (786 | ) | (27.9 | ) | ||||||||
Loan processing fee income | 1,241 | 844 | 397 | 47.0 | ||||||||||
Net impairment losses recognized in earnings | — | (64 | ) | 64 | (100.0 | ) | ||||||||
Net gain on sale of loans | 6,083 | 2,797 | 3,286 | 117.5 | ||||||||||
Net gain on sale of investment securities | 63 | 746 | (683 | ) | (91.6 | ) | ||||||||
Net gain on sale of OREO | 3,828 | 2,540 | 1,288 | 50.7 | ||||||||||
Net gain on sale of disposal of premises and equipment | 1,676 | 1,328 | 348 | 26.2 | ||||||||||
Net gain on sale of branch | 986 | 991 | (5 | ) | (0.5 | ) | ||||||||
Other income | 2,392 | 3,395 | (1,003 | ) | (29.5 | ) | ||||||||
Total non-interest income | $ | 34,971 | $ | 30,519 | $ | 4,452 | 14.6 | % | ||||||
Non-interest income increased $4.5 million, or 14.6%, to $35.0 million for the year ended December 31, 2015, from $30.5 million for the prior year period. Net gain on sale of loans increased $3.3 million to $6.1 million for the year ended December 31, 2015 from $2.8 million for the prior year period, primarily due to higher loan volume in 2015. Loan fees increased $1.6 million from the prior year period due to fees collected from the interest rate swap contract program for certain commercial lending customers which began in the first quarter of 2015. Net gain on sale of OREO also increased $1.3 million from the prior year period due to sales volume and improved gains per property sold. We do not expect a strong net gain on sale of OREO to be repeated in future periods as we have been successful in reducing our OREO balances.
Offsetting these increases, loan servicing income, net of amortization, decreased $786,000 from the prior year period as a result of a decrease in the loan servicing portfolio and net gain on sale of investment securities decreased $683,000 as a result of securities sales of $14.6 million for the year ended December 31, 2015 compared to $17.6 million in the prior year period. Other income decreased $1.0 million from the prior year period due to gains on transfers to OREO declining $513,000 and rental income declining $351,000 due to the sale of the Bank's main office building in 2014.
47
Non-Interest Expense
The following table presents non-interest expense by major category for the periods indicated:
Year Ended December 31, | Increase (Decrease) | |||||||||||||
2015 | 2014 | Amount | Percent | |||||||||||
(Dollars in thousands) | ||||||||||||||
Compensation and benefits | $ | 45,831 | $ | 44,256 | $ | 1,575 | 3.6 | % | ||||||
Occupancy | 6,366 | 7,374 | (1,008 | ) | (13.7 | ) | ||||||||
Furniture and equipment | 2,602 | 3,038 | (436 | ) | (14.4 | ) | ||||||||
Federal deposit insurance premiums | 2,226 | 3,151 | (925 | ) | (29.4 | ) | ||||||||
Data processing | 6,512 | 5,602 | 910 | 16.2 | ||||||||||
Communications | 1,960 | 1,987 | (27 | ) | (1.4 | ) | ||||||||
Marketing | 2,698 | 3,676 | (978 | ) | (26.6 | ) | ||||||||
OREO expense, net | 2,344 | 9,779 | (7,435 | ) | (76.0 | ) | ||||||||
Investor loss reimbursement | (212 | ) | 50 | (262 | ) | (524.0 | ) | |||||||
MSR impairment (recovery) | (596 | ) | 534 | (1,130 | ) | (211.6 | ) | |||||||
Provision for unfunded commitments | 17 | (2,107 | ) | 2,124 | 100.8 | |||||||||
Loan processing and servicing expense | 2,774 | 2,435 | 339 | 13.9 | ||||||||||
Retail operations expense | 2,620 | 2,490 | 130 | 5.2 | ||||||||||
Legal services | 1,394 | 1,961 | (567 | ) | (28.9 | ) | ||||||||
Other professional fees | 1,899 | 1,452 | 447 | 30.8 | ||||||||||
Insurance | 916 | 1,057 | (141 | ) | (13.3 | ) | ||||||||
Lease termination expense | 1,454 | — | 1,454 | N/M | ||||||||||
Reorganization costs | — | (64 | ) | 64 | (100.0 | ) | ||||||||
Other expense | 4,132 | 5,037 | (905 | ) | (18.0 | ) | ||||||||
Total non-interest expense | $ | 84,937 | $ | 91,708 | $ | (6,771 | ) | (7.4 | )% | |||||
N/M = Not Meaningful
Non-interest expense decreased $6.8 million, or 7.4%, to $84.9 million for the year ended December 31, 2015, from $91.7 million for the prior year period. The decrease was primarily the result of OREO expense, net, decreasing $7.4 million due to a decline in OREO inventory compared to the prior year period. Within OREO expense, net, the provision for OREO losses declined $6.3 million, OREO operating expenses declined $892,000, OREO real estate taxes declined $798,000 and OREO management fees declined $637,000 compared to the year ended December 31, 2014. Offsetting these reductions included in OREO expense, net, was a decrease in OREO income of $1.4 million to the prior year period due to the reduced number of income producing OREO properties. In addition, the Bank recorded MSR recovery of $596,000 compared to MSR impairment of $534,000 in the years ended December 31, 2015 and 2014, respectively, as well as other smaller reductions in occupancy, marketing and legal services. Other expense decreased $905,000 primarily due to $844,000 of costs incurred from the settlement of the Village of Kronenwetter litigation in 2014.
Offsetting these decreases was an increase in provision for unfunded commitments of $2.1 million, to $17,000 for the year ended December 31, 2015. In 2014, a specific reserve of $2.7 million related to the Village of Kronenwetter was released. Compensation and benefits increased $1.6 million to $45.8 million due to an increase in restricted stock grant expense of $1.2 million compared to the prior year period and one-time retention and severance expense of $2.0 million offset by a reduction in salary and wages of $1.7 million as a result of the operational efficiency initiatives. Lease termination expense of $1.5 million was also due to the recognition of expense related to the operational efficiency initiatives completed in 2015.
Income Taxes
Income tax benefit, net of tax provision, of $89.4 million was recorded for the year ended December 31, 2015, compared to income tax expense of $10,000 in the prior year period. As a result of management’s ongoing periodic assessments of the deferred tax asset position, the Company determined that it was appropriate to substantially reverse this deferred tax asset valuation allowance. In 2015, the Company determined that it is more likely than not it will be able to realize its deferred tax asset, including its entire federal tax loss carryforwards and a significant portion of its state tax loss carryforwards, with the exception of $4.2 million pertaining to certain multi state loss carryforwards, including states in which the Company no longer does business.
48
Comparison of the Results of Operations for the Year Ended December 31, 2014 and 2013
Net income from operations for the year ended December 31, 2014 declined $83.0 million, or 85.0%, to $14.6 million from $97.6 million in the year ended December 31, 2013. The decrease in net income was primarily the result of a decline in non-interest income of $136.5 million as a result of the $134.5 million extinguishment of debt related to the payoff and settlement of the Credit Agreement. This was partially offset by a $39.7 million decline in non-interest expense, related to the prepayment of FHLB advances in 2013 which lowered our cost of funds, a decrease in provision for loan losses of $5.5 million and an increase in net interest income of $8.3 million compared to the year ended December 31, 2013.
Net Interest Income
The following table shows the Company’s average balances, interest, average rates, the spread between the combined average rates earned on interest-earning assets and average cost of interest-bearing liabilities, net interest margin, which represents net interest income as a percentage of average interest-earning assets, and the ratio of average interest-earning assets to average interest-bearing liabilities for the years ended December 31, 2014 and 2013. The average balances are derived from daily balances.
Year Ended December 31, | |||||||||||||||||||||
2014 | 2013 | ||||||||||||||||||||
Average Balance | Interest | Average Yield/ Cost | Average Balance | Interest | Average Yield/ Cost | ||||||||||||||||
(Dollars in thousands) | |||||||||||||||||||||
Interest-Earning Assets | |||||||||||||||||||||
Mortgage loans | $ | 1,197,999 | $ | 51,379 | 4.29 | % | $ | 1,299,424 | $ | 57,960 | 4.46 | % | |||||||||
Consumer loans | 351,113 | 16,766 | 4.78 | 396,590 | 19,242 | 4.85 | |||||||||||||||
Commercial and industrial loans | 19,032 | 1,068 | 5.61 | 24,592 | 1,688 | 6.86 | |||||||||||||||
Total loans held for investment (1)(2) | 1,568,144 | 69,213 | 4.41 | 1,720,606 | 78,890 | 4.59 | |||||||||||||||
Investment securities - AFS (3) | 290,381 | 5,931 | 2.04 | 278,770 | 5,517 | 1.98 | |||||||||||||||
Interest-earning deposits | 147,915 | 371 | 0.25 | 177,126 | 436 | 0.25 | |||||||||||||||
Federal Home Loan Bank stock | 11,940 | 65 | 0.54 | 23,755 | 96 | 0.40 | |||||||||||||||
Total interest-earning assets | 2,018,380 | 75,580 | 3.74 | 2,200,257 | 84,939 | 3.86 | |||||||||||||||
Non-interest-earning assets | 96,390 | 98,311 | |||||||||||||||||||
Total assets | $ | 2,114,770 | $ | 2,298,568 | |||||||||||||||||
Interest-Bearing Liabilities | |||||||||||||||||||||
Demand deposits | $ | 1,021,022 | $ | 1,178 | 0.12 | % | $ | 1,022,453 | $ | 1,241 | 0.12 | % | |||||||||
Regular savings | 348,680 | 353 | 0.10 | 331,044 | 369 | 0.11 | |||||||||||||||
Certificates of deposit | 496,189 | 2,568 | 0.52 | 626,182 | 4,208 | 0.67 | |||||||||||||||
Total deposits | 1,865,891 | 4,099 | 0.22 | 1,979,679 | 5,818 | 0.29 | |||||||||||||||
Other borrowed funds | 14,858 | 245 | 1.65 | 238,008 | 16,195 | 6.80 | |||||||||||||||
Total interest-bearing liabilities | 1,880,749 | 4,344 | 0.23 | 2,217,687 | 22,013 | 0.99 | |||||||||||||||
Non-interest-bearing liabilities | 21,748 | 72,403 | |||||||||||||||||||
Total liabilities | 1,902,497 | 2,290,090 | |||||||||||||||||||
Stockholders’ equity | 212,273 | 8,478 | |||||||||||||||||||
Total liabilities and stockholders’ equity | $ | 2,114,770 | $ | 2,298,568 | |||||||||||||||||
Net interest income/interest rate spread (4) | $ | 71,236 | 3.51 | % | $ | 62,926 | 2.87 | % | |||||||||||||
Net interest-earning assets | $ | 137,631 | $ | (17,430 | ) | ||||||||||||||||
Net interest margin (5) | 3.53 | % | 2.86 | % | |||||||||||||||||
Ratio of average interest-earning assets to average interest-bearing liabilities | 107.32 | % | 99.21 | % | |||||||||||||||||
(1) | For the purpose of these computations, non-accrual loans are included in the average loan amounts outstanding. |
(2) | Interest earned on loans includes loan fees (which are not material in amount) and interest income which has been received from borrowers whose loans were removed from non-accrual status during the period indicated. |
49
(3) | Average balances of securities available for sale are based on fair value. |
(4) | Interest rate spread represents the difference between the weighted-average yield on interest-earning assets and the weighted- average cost of interest-bearing liabilities. |
(5) | Net interest margin represents net interest income as a percentage of average interest-earning assets. |
Net interest income increased $8.3 million, or 13.2%, to $71.2 million for the year ended December 31, 2014 as compared to $62.9 million for the same period in 2013. Interest income decreased $9.4 million, or 11.0%, for the year ended December 31, 2014 compared to the year ended December 31, 2013, due primarily to a decrease of $181.9 million in average interest-earning assets. The average yield on interest-earning assets decreased 12 basis points to 3.74% in the year ended December 31, 2014 compared to 3.86% for the same period in 2013.
The average balance of loans held for investment, net decreased $152.5 million to $1.57 billion in 2014, interest-earning deposits decreased $29.2 million to $147.9 million offset by an increase in the average balance of investment securities of $11.6 million to $290.4 million in 2014. These decreases were primarily due to loan repayments exceeding loan originations during the period and the resulting excess liquidity being invested in securities as opposed to being held in cash to improve the yield on assets. The decline in the average yield was the result of the low interest rate environment over the last several years.
Interest expense decreased $17.7 million, or 80.3%, to $4.3 million for the year ended December 31, 2014 from $22.0 million for the year ended December 31, 2013. The average cost of interest-bearing liabilities decreased 76 basis points to 0.23% for the year ended December 31, 2014 from 0.99% for the same period in 2013 while the average balance of interest-bearing liabilities decreased $336.9 million to $1.88 billion for the year ended December 31, 2014 from $2.22 billion for the same period in 2013.
The average balance of deposits decreased $113.8 million to $1.87 billion in 2014 from $1.98 billion in 2013. The decrease was primarily due to a $130.0 million decrease to $496.2 million in certificates of deposit in 2014 from $626.2 million in 2013. The average cost of deposits decreased 7 basis points to 0.22% in 2014 from 0.29% in 2013. The average balance of other borrowed funds decreased $223.1 million to $14.9 million in 2014 from $238.0 million in 2013. The average cost of funds for the other borrowings decreased 515 basis points to 1.65% in 2014 from 6.80% in 2013. The decrease in average balance and cost of funds for other borrowings was due to the settlement of the Credit Agreement with U.S. Bank and the prepayment of FHLB of Chicago borrowings in 2013, the effect of these transactions was realized in 2014. The decrease in the average cost of funds was the result of the Bank following its interest rate risk strategic plan while minimizing its cost of funding.
The interest rate spread increased 64 basis points to 3.51% for the year ended December 31, 2014 compared to 2.87% for the year ended December 31, 2013. The increase was primarily the result of management’s strategic plan to settle the Credit Agreement with U.S. Bank and the prepayment of the FHLB of Chicago advances reducing interest expense on those borrowings $237.8 million during 2014 and the related cost of funding those borrowings by 515 basis points. Net interest margin was 3.53% for the year ended December 31, 2014 an increase of 67 basis points from 2.86% for the year ended December 31, 2013. The increase in net interest margin was due to an $8.3 million increase in net interest income and a $181.9 million decrease in total interest-earning assets between 2014 and 2013.
The ratio of average interest-earning assets to average interest-bearing liabilities increased to 107.32% at December 31, 2014 from 99.21% at December 31, 2013. This increase was primarily due to the $336.9 million decrease in average interest-bearing liabilities during 2014.
Provision for Loan Losses
The provision for loan losses decreased $5.5 million during the year ended December 31, 2014 to a negative provision of $4.6 million from a $950,000 provision for the year ended December 31, 2013. The reason for the decrease was due to the continued improvement in the credit quality of the loan portfolio during 2014 with non-performing loans decreasing $33.4 million, or 48.7%, to $35.1 million at December 31, 2014.
Future provisions for loan losses will continue to be based upon management’s assessment of the overall loan portfolio and the underlying collateral, trends in non-performing loans, current economic conditions and other relevant factors in order to maintain the allowance for loan losses at adequate levels to provide for probable and estimable future losses. The establishment of the amount of the loan loss allowance inherently involves judgments by management as to the adequacy of the allowance, which ultimately may change. Higher rates of loan defaults than anticipated would likely result in a need to increase provisions in future periods. Conversely, the provision for loan losses may decline should credit metrics such as net charge-offs and the amount of non-performing loans improve in the future.
50
Non-Interest Income
The following table presents non-interest income by major category for the periods indicated:
Year Ended December 31, | Increase (Decrease) | |||||||||||||
2014 | 2013 | Amount | Percent | |||||||||||
(Dollars in thousands) | ||||||||||||||
Service charges on deposits | $ | 10,017 | $ | 10,120 | $ | (103 | ) | (1.0 | )% | |||||
Investment and insurance commissions | 4,222 | 3,917 | 305 | 7.8 | ||||||||||
Loan fees | 882 | 1,272 | (390 | ) | (30.7 | ) | ||||||||
Loan servicing income, net of amortization | 2,821 | 1,437 | 1,384 | 96.3 | ||||||||||
Loan processing fee income | 844 | 1,303 | (459 | ) | (35.2 | ) | ||||||||
Net impairment losses recognized in earnings | (64 | ) | (106 | ) | 42 | (39.6 | ) | |||||||
Net gain on sale of loans | 2,797 | 8,116 | (5,319 | ) | (65.5 | ) | ||||||||
Net gain on sale of investment securities | 746 | 92 | 654 | N/M | ||||||||||
Net gain on sale of OREO | 2,540 | 4,597 | (2,057 | ) | (44.7 | ) | ||||||||
Extinguishment of debt | — | 134,514 | (134,514 | ) | N/M | |||||||||
Net gain (loss) on sale of disposal of premises and equipment | 1,328 | (82 | ) | 1,410 | N/M | |||||||||
Net gain on sale of branch | 991 | — | 991 | N/M | ||||||||||
Other income | 3,395 | 1,856 | 1,539 | 82.9 | ||||||||||
Total non-interest income | $ | 30,519 | $ | 167,036 | $ | (136,517 | ) | (81.7 | )% | |||||
N/M = Not Meaningful
Non-interest income decreased $136.5 million to $30.5 million for the year ended December 31, 2014 from $167.0 million for the year ended December 31, 2013. In 2013 the Company recorded non-interest income of $134.5 million resulting from the extinguishment of debt. Net gain on sale of loans decreased $5.3 million to $2.8 million for the year ended December 31, 2014 from $8.1 million for the year ended December 31, 2013 primarily due to lower loan volume in 2014.
51
Non-Interest Expense
The following table presents non-interest expense by major category for the periods indicated:
Year Ended December 31, | Increase (Decrease) | |||||||||||||
2014 | 2013 | Amount | Percent | |||||||||||
(Dollars in thousands) | ||||||||||||||
Compensation and benefits | $ | 44,256 | $ | 42,568 | $ | 1,688 | 4.0 | % | ||||||
Occupancy | 7,374 | 8,828 | (1,454 | ) | (16.5 | ) | ||||||||
Furniture and equipment | 3,038 | 3,272 | (234 | ) | (7.2 | ) | ||||||||
Federal deposit insurance premiums | 3,151 | 4,740 | (1,589 | ) | (33.5 | ) | ||||||||
Data processing | 5,602 | 6,162 | (560 | ) | (9.1 | ) | ||||||||
Communications | 1,987 | 1,929 | 58 | 3.0 | ||||||||||
Marketing | 3,676 | 2,605 | 1,071 | 41.1 | ||||||||||
OREO expense, net | 9,779 | 22,056 | (12,277 | ) | (55.7 | ) | ||||||||
Investor loss reimbursement | 50 | 3,497 | (3,447 | ) | (98.6 | ) | ||||||||
MSR impairment (recovery) | 534 | (3,854 | ) | 4,388 | 113.9 | |||||||||
Provision for unfunded commitments | (2,107 | ) | 3,133 | (5,240 | ) | (167.3 | ) | |||||||
Loan processing and servicing expense | 2,435 | 3,852 | (1,417 | ) | (36.8 | ) | ||||||||
Retail operations expense | 2,490 | 2,343 | 147 | 6.3 | ||||||||||
Legal services | 1,961 | 3,873 | (1,912 | ) | (49.4 | ) | ||||||||
Other professional fees | 1,452 | 2,358 | (906 | ) | (38.4 | ) | ||||||||
Insurance | 1,057 | 2,915 | (1,858 | ) | (63.7 | ) | ||||||||
Lease termination expense | — | — | — | N/M | ||||||||||
Debt prepayment penalty | — | 16,149 | (16,149 | ) | N/M | |||||||||
Reorganization costs | (64 | ) | 1,929 | (1,993 | ) | N/M | ||||||||
Other expense | 5,037 | 3,045 | 1,992 | 65.4 | ||||||||||
Total non-interest expense | $ | 91,708 | $ | 131,400 | $ | (39,692 | ) | (30.2 | )% | |||||
N/M = Not Meaningful
Non-interest expense decreased $39.7 million, or 30.2%, to $91.7 million for the year ended December 31, 2014 from $131.4 million for the year ended December 31, 2013. The decrease was primarily the result of a one-time debt prepayment penalty charge in 2013 of $16.1 million related to the early payoff of FHLB of Chicago borrowings of $176.0 million with no corresponding charges in 2014. In addition OREO expense decreased $12.3 million due to a decline in OREO inventory during 2014. The provision for OREO losses declined $6.3 million and OREO real estate taxes declined $3.3 million were the primary reason for the decrease in OREO expense as compared to the year ended December 31, 2013. Provision for unfunded commitments decreased $5.2 million as a result of the release of a specific reserve of $2.7 million no longer required in 2014 and investor loss reimbursement declined $3.4 million which included a $2.0 million reserve recorded in 2013 that was no longer needed in 2014. Offsetting these decreases was an increase in the mortgage servicing rights impairment (recovery) of $4.4 million to an expense of $534,000 for the year ended December 31, 2014 compared to a recovery of $3.9 million for the year ended December 31, 2013. This increase was the result of changes in the level of prepayment speeds and interest rate fluctuations during 2014. Other expense increased $2.0 million during the year ended December 31, 2014 primarily due to $844,000 of costs incurred from the settlement of the Village of Kronenwetter litigation. In addition, during 2013, a non-bank subsidiary of the holding company had a $1.2 million recovery of a previously written off receivable, there were no comparable transactions recorded during 2014.
Income Taxes
Income tax expense of $10,000 was recorded for the year period ended December 31, 2014 compared to $9,000 for the same period in 2013. While previously unrecognized net operating loss carryforwards were used to substantially offset taxable income, some states in which we operate have a minimum tax requirement which resulted in $10,000 of tax expense in the current year. As of December 31, 2014, a full valuation allowance was recorded on the remaining net deferred tax asset due to the uncertainty of our ability to create sufficient taxable income to utilize the tax asset.
52
Rate/Volume Analysis
The most significant impact on the Company’s net interest income between periods is derived from the interaction of changes in the volume of and rates earned on interest-earning assets or paid on interest-bearing liabilities. The volume of investments in loans and securities, compared to the volume of interest-bearing liabilities represented by deposits and borrowings, combined with the spread, produces the changes in net interest income between periods. The following table shows the relative contribution of the changes in average volume and average interest rates on changes in net interest income for the periods indicated. Information is provided with respect to the effects on net interest income attributable to (i) changes in rate (changes in rate multiplied by prior volume) and (ii) changes in volume (changes in volume multiplied by prior rate). The change in interest income due to both rate and volume have been allocated to rate and volume changes in proportion to the relationship of the absolute dollar amounts of the change in each.
Increase (Decrease) for the Year Ended | |||||||||||||||||||||||
Year Ended December 31, 2015 Compared to Year Ended December 31, 2014 | Year Ended December 31, 2014 Compared to Year Ended December 31, 2013 | ||||||||||||||||||||||
Rate | Volume | Net | Rate | Volume | Net | ||||||||||||||||||
(In thousands) | |||||||||||||||||||||||
Interest-earning assets | |||||||||||||||||||||||
Mortgage and commercial real estate loans | $ | (2,066 | ) | $ | 524 | $ | (1,542 | ) | $ | (2,174 | ) | $ | (4,407 | ) | $ | (6,581 | ) | ||||||
Consumer loans | (684 | ) | (1,345 | ) | (2,029 | ) | (300 | ) | (2,176 | ) | (2,476 | ) | |||||||||||
Commercial and industrial loans | (107 | ) | 928 | 821 | (277 | ) | (343 | ) | (620 | ) | |||||||||||||
Total loans held for investment (1)(2) | (2,857 | ) | 107 | (2,750 | ) | (2,751 | ) | (6,926 | ) | (9,677 | ) | ||||||||||||
Investment securities - AFS | (625 | ) | 749 | 124 | 180 | 234 | 414 | ||||||||||||||||
Investment securities - HTM | — | 298 | 298 | — | — | — | |||||||||||||||||
Interest-bearing deposits | 29 | (65 | ) | (36 | ) | 8 | (73 | ) | (65 | ) | |||||||||||||
Federal Home Loan Bank stock | (6 | ) | — | (6 | ) | 26 | (57 | ) | (31 | ) | |||||||||||||
Total increase (decrease) in interest income | (3,459 | ) | 1,089 | (2,370 | ) | (2,537 | ) | (6,822 | ) | (9,359 | ) | ||||||||||||
Interest-bearing liabilities | |||||||||||||||||||||||
Demand deposits | 299 | 38 | 337 | (61 | ) | (2 | ) | (63 | ) | ||||||||||||||
Regular savings | (15 | ) | 13 | (2 | ) | (35 | ) | 19 | (16 | ) | |||||||||||||
Certificates of deposit | 191 | (439 | ) | (248 | ) | (861 | ) | (779 | ) | (1,640 | ) | ||||||||||||
Total deposits | 475 | (388 | ) | 87 | (957 | ) | (762 | ) | (1,719 | ) | |||||||||||||
Other borrowed funds | 7 | (9 | ) | (2 | ) | (7,129 | ) | (8,821 | ) | (15,950 | ) | ||||||||||||
Total increase (decrease) in interest expense | 482 | (397 | ) | 85 | (8,086 | ) | (9,583 | ) | (17,669 | ) | |||||||||||||
Total increase (decrease) in net interest income | $ | (3,941 | ) | $ | 1,486 | $ | (2,455 | ) | $ | 5,549 | $ | 2,761 | $ | 8,310 | |||||||||
(1) | For the purpose of these computations, non-accrual loans are included in the daily average loan amounts outstanding. |
(2) | Interest earned on loans includes loan fees (which are not material in amount) and interest income which has been received from borrowers whose loans were removed from non-accrual status during the period indicated. |
RISK MANAGEMENT
The Bank encounters risk as part of its normal course of business and designs risk management processes to help manage these risks. This section describes the Bank’s risk management philosophy, principles, governance and various aspects of its risk management process.
Risk Management Philosophy
The Bank’s risk management philosophy is to manage to an overall level of risk while still allowing it to capture opportunities and optimize stockholder value. We have made significant and year over year improvements in reducing the level of non-performing assets since 2010. While improvements have occurred, the Bank desires to further lower its amount of non-performing assets.
53
The Bank views risk management as not about eliminating risks, but about identifying and accepting risks and then working to effectively manage them. Risk management includes, but is not limited to the following:
• | Taking only risks consistent with the Bank’s strategy and within its capability to manage; |
• | Ensuring strong underwriting and credit risk management practices; |
• | Practicing disciplined capital and liquidity management; |
• | Helping ensure that risks and earnings volatility are appropriately understood and measured; |
• | Avoiding excessive concentrations; and |
• | Helping support external stakeholder confidence. |
Although the Board is primarily responsible for oversight of risk management, committees of the Board may provide oversight to specific areas of risk with respect to the level of risk and risk management structure. The Bank uses management level risk committees to help ensure that business decisions are executed within our desired risk profile. Management provides oversight for the establishment and implementation of new risk management initiatives, reviews risk profiles and discusses key risk issues. The Chief Risk Officer is in charge of overseeing all risk management. The internal audit department performs an independent assessment of the internal control environment and plays a critical role in risk management, testing the operation of the internal control system and reporting findings to management and the Audit Committee of the Board.
CREDIT RISK MANAGEMENT
Credit risk represents the possibility that a customer, counterparty or issuer may not perform in accordance with contractual terms. Credit risk is inherent in the financial services business and results from extending credit to customers, purchasing investment securities and entering into certain guarantee contracts. Credit risk is one of the most significant risks facing the Bank.
In addition to credit policies and procedures and setting portfolio objectives for the level of credit risk, the Bank has established guidelines for problem loans, acceptable levels of total borrower exposure and other credit measures. Management continues to focus on loss mitigation and maximization of recoveries in the Bank’s non-performing assets portfolio.
The Bank seeks to achieve credit portfolio objectives by maintaining a customer base that is diverse in borrower exposure and industry types. Corporate credit personnel are responsible for loan underwriting and approval processes to help ensure that newly approved loans meet policy and portfolio objectives.
The Risk Management group is responsible for monitoring credit risk while considering regulatory guidance. Internal audit provides an independent assessment of the effectiveness of the credit risk management process. An external third party vendor also provides loan review services.
Non-Performing Loans
The composition of non-performing loans is summarized as follows:
December 31, 2015 | December 31, 2014 | ||||||||||||||||||
Balance | % of Non- Performing Loans | % of Total Gross Loans (1) | Balance | % of Non- Performing Loans | % of Total Gross Loans (1) | ||||||||||||||
(Dollars in thousands) | |||||||||||||||||||
Residential | $ | 4,995 | 32.6 | % | 0.30 | % | $ | 5,873 | 16.7 | % | 0.37 | % | |||||||
Commercial and industrial | 161 | 1.1 | 0.01 | 33 | 0.1 | — | |||||||||||||
Land and construction | 5,457 | 35.7 | 0.34 | 17,195 | 48.9 | 1.09 | |||||||||||||
Multi-family | 1,198 | 7.8 | 0.07 | 3,566 | 10.2 | 0.23 | |||||||||||||
Retail/office | 1,365 | 8.9 | 0.08 | 3,970 | 11.3 | 0.25 | |||||||||||||
Other commercial real estate | 1,146 | 7.5 | 0.07 | 3,622 | 10.3 | 0.23 | |||||||||||||
Education (2) | 191 | 1.2 | 0.01 | 205 | 0.6 | 0.01 | |||||||||||||
Other consumer | 796 | 5.2 | 0.05 | 651 | 1.9 | 0.04 | |||||||||||||
Total | $ | 15,309 | 100.0 | % | 0.93 | % | $ | 35,115 | 100.0 | % | 2.22 | % | |||||||
(1) | Gross loans are the unpaid principal balance before the unamortized loan fees, net, and the allowance for loans losses. |
(2) | Excludes the guaranteed portion of education loans 90+ days past due with an unpaid principal balance totaling $6.2 million and $6.6 million at December 31, 2015 and 2014, respectively, that are not considered impaired based on a guarantee provided by government agencies. |
54
The following is a summary of non-performing loan activity for the year ended December 31, 2015:
Non- Performing Loans December 31, 2014 | Additions | Transfer to Accrual Status | Transfer to OREO | Paid Down | Net Charged Off | Non- Performing Loans December 31, 2015 | Performing Loans December 31, 2015 | Total Gross Loans (1) | |||||||||||||||||||||||||||
(In thousands) | |||||||||||||||||||||||||||||||||||
Residential | $ | 5,873 | $ | 3,830 | $ | (1,417 | ) | $ | (1,427 | ) | $ | (2,208 | ) | $ | 344 | $ | 4,995 | $ | 524,780 | $ | 529,775 | ||||||||||||||
Commercial and industrial | 33 | 81 | — | (584 | ) | (551 | ) | 1,182 | 161 | 25,038 | 25,199 | ||||||||||||||||||||||||
Land and construction | 17,195 | 1,378 | — | (41 | ) | (14,681 | ) | 1,606 | 5,457 | 137,962 | 143,419 | ||||||||||||||||||||||||
Multi-family | 3,566 | — | — | (249 | ) | (4,272 | ) | 2,153 | 1,198 | 317,115 | 318,313 | ||||||||||||||||||||||||
Retail/office | 3,970 | 887 | (124 | ) | (655 | ) | (3,156 | ) | 443 | 1,365 | 160,132 | 161,497 | |||||||||||||||||||||||
Other commercial real estate | 3,622 | 794 | — | (300 | ) | (3,480 | ) | 510 | 1,146 | 142,550 | 143,696 | ||||||||||||||||||||||||
Education (2) | 205 | — | — | — | (14 | ) | — | 191 | 91,480 | 91,671 | |||||||||||||||||||||||||
Other consumer | 651 | 1,591 | (329 | ) | — | (709 | ) | (408 | ) | 796 | 226,487 | 227,283 | |||||||||||||||||||||||
Total | $ | 35,115 | $ | 8,561 | $ | (1,870 | ) | $ | (3,256 | ) | $ | (29,071 | ) | $ | 5,830 | $ | 15,309 | $ | 1,625,544 | $ | 1,640,853 | ||||||||||||||
(1) | Gross loans are the unpaid principal balance before the unamortized loan fees, net, and the allowance for loans losses. |
(2) | Excludes the guaranteed portion of education loans 90+ days past due with an unpaid principal balance totaling $6.2 million and $6.6 million at December 31, 2015 and 2014, respectively, that are not considered impaired based on a guarantee provided by government agencies. |
Non-performing loans decreased $19.8 million during the year ended December 31, 2015. The loan categories with the largest decline in non-performing loans were land and construction of $11.7 million, retail/office of $2.6 million, other commercial real estate of $2.5 million and multi-family of $2.4 million.
Non-Performing Assets
The composition of non-performing assets and related credit metrics are summarized as follows:
December 31, | |||||||
2015 | 2014 | ||||||
(Dollars in thousands) | |||||||
Non-performing loans – excluding TDRs | $ | 8,238 | $ | 18,632 | |||
Non-performing TDRs | 7,071 | 16,483 | |||||
Total non-performing loans | 15,309 | 35,115 | |||||
OREO | 20,371 | 35,491 | |||||
Total non-performing assets | $ | 35,680 | $ | 70,606 | |||
Non-performing loans to gross loans | 0.93 | % | 2.22 | % | |||
Non-performing assets to total assets | 1.59 | 3.39 | |||||
Allowance for loan losses to gross loans | 1.53 | 2.97 | |||||
Allowance for loan losses to non-performing loans | 164.26 | 133.95 | |||||
Allowance for loan losses plus OREO valuation allowance to non-performing assets | 110.41 | 95.77 | |||||
TDRs that are currently on non-accrual status will remain on non-accrual status for a period of at least six months, or longer period, sufficient to prove that the borrower demonstrates that they can make the payments under the modified terms. If after this period, the borrower has made payments in accordance with the modified terms, the loan is returned to accrual status but retains its designation as a TDR. Once a TDR loan is returned to accrual status, further review of the credit could take place resulting in a further upgrade into the pass category but still remaining as a TDR.
55
The following is a summary of non-performing asset activity for the year ended December 31, 2015:
Non-Performing Loans (1) | OREO | Total Non- Performing Assets | |||||||||
(In thousands) | |||||||||||
Balance at December 31, 2014 | $ | 35,115 | $ | 35,491 | $ | 70,606 | |||||
Additions | 8,561 | 1,133 | 9,694 | ||||||||
Transfer to OREO | (3,256 | ) | 3,256 | — | |||||||
Transfer to accrual status | (1,870 | ) | — | (1,870 | ) | ||||||
Sales | — | (18,175 | ) | (18,175 | ) | ||||||
Net charged-off | 5,830 | — | 5,830 | ||||||||
OREO valuation adjustments, net | — | (1,493 | ) | (1,493 | ) | ||||||
Capitalized improvements | — | 159 | 159 | ||||||||
Paid down | (29,071 | ) | — | (29,071 | ) | ||||||
Balance at December 31, 2015 | $ | 15,309 | $ | 20,371 | $ | 35,680 | |||||
(1) | Total non-performing loans exclude the guaranteed portion of education loans of $6.2 million and $6.6 million that are 90 days or more past due but still accruing interest at December 31, 2015 and 2014, respectively. |
Loan Delinquencies 30 Days and Over
The following table sets forth information relating to past due loans that were delinquent 30 days and over at the dates indicated:
December 31, | March 31, | |||||||||||||||||||||||||||||||||
2015 | 2014 | 2013 | 2013 | 2012 | ||||||||||||||||||||||||||||||
Days Past Due | Balance | % of Total Gross Loans | Balance | % of Total Gross Loans | Balance | % of Total Gross Loans | Balance | % of Total Gross Loans | Balance | % of Total Gross Loans | ||||||||||||||||||||||||
(Dollars in thousands) | ||||||||||||||||||||||||||||||||||
30 to 59 days | $ | 5,025 | 0.31 | % | $ | 5,795 | 0.37 | % | $ | 11,885 | 0.73 | % | $ | 14,294 | 0.81 | % | $ | 18,332 | 0.84 | % | ||||||||||||||
60 to 89 days | 3,129 | 0.19 | 3,097 | 0.20 | 4,280 | 0.26 | 10,109 | 0.57 | 12,230 | 0.56 | ||||||||||||||||||||||||
90 days and over | 9,089 | 0.55 | 20,338 | 1.28 | 49,017 | 3.03 | 92,209 | 5.23 | 190,663 | 8.71 | ||||||||||||||||||||||||
Total | $ | 17,243 | 1.05 | % | $ | 29,230 | 1.85 | % | $ | 65,182 | 4.02 | % | $ | 116,612 | 6.61 | % | $ | 221,225 | 10.11 | % | ||||||||||||||
Loans delinquent 30 to 89 days decreased $738,000 to $8.2 million at December 31, 2015 from $8.9 million at December 31, 2014 and loans delinquent 90 days and over decreased $11.2 million to $9.1 million at December 31, 2015 from $20.3 million at December 31, 2014 as a result of increased monitoring, loss mitigation efforts and improved economic conditions.
Impaired Loans
At December 31, 2015, the Company identified $43.9 million of loans as impaired, which includes $28.8 million of performing TDRs. At December 31, 2014, impaired loans were $95.3 million, which included $60.2 million of performing TDRs. A loan is identified as impaired when, based on current information and events, it is probable that the Bank will be unable to collect all amounts due according to the contractual terms of the loan agreement.
Interest income recognized on impaired loans on a cash basis was $2.0 million and $3.6 million for years ended December 31, 2015 and 2014, respectively, and $2.1 million for the nine months ended December 31, 2013.
Allowance for Loan Losses
The allowance for loan losses is maintained at a level believed appropriate by management to absorb probable and estimable losses inherent in the held for investment loan portfolio and is based on the size and current risk characteristics of the held for investment loan portfolio; an assessment of individual impaired loans; actual and anticipated loss experience; and current economic events in specific industries and geographical areas. These economic events include unemployment levels, regulatory guidance and general economic conditions. Determination of the allowance is inherently subjective as it requires significant estimates, including the amounts and timing of expected future cash flows on impaired loans, estimated losses on pools of homogeneous loans based on historical loss experience and consideration of current economic trends, all of which may be
56
susceptible to significant change. Therefore, the allowance for loan losses accounts for elements of imprecision and estimation risk inherent in the calculation.
Loan losses are charged off against the allowance, while recoveries of amounts previously charged off are credited to the allowance. A provision for loan losses is recorded in the statement of income based on management’s periodic evaluation of the factors previously mentioned as well as other pertinent factors. The provision for loan losses may increase or decline should credit metrics such as net charge offs and the amount of non-performing loans worsen or improve in the future.
The allowance for loan losses consists of specific and general components. Specific allowance allocations are established for probable losses resulting from analysis of impaired loans. A loan is considered impaired when it is probable that the Company will be unable to collect all contractual principal and interest due according to the terms of the loan agreement. Impaired loans include all nonaccrual loans and TDRs. TDRs are loans that have been modified, due to financial difficulties of the borrower, where the terms of the modified loan are more favorable for the borrower than what the Company would normally offer. Impairment is determined when the present value of expected future cash flows discounted at the loan’s effective interest rate or the fair value of the underlying collateral less costs to sell, if the loan is collateral dependent, is less than the carrying value of the loan. Cash collections on nonaccrual loans are generally credited to the loan balance and no interest income is recognized on those loans until the principal balance is current and collection of principal and interest becomes probable.
The general allowance component is based on historical net loss experience adjusted for qualitative factors. In determining the general allowance, the Company has defined the following segments within its loan portfolio: residential, commercial and industrial, commercial real estate and consumer. The Company has disaggregated those segments into the following classes based on risk characteristics: residential; commercial and industrial; land and construction, multi-family, retail/office and other commercial real estate within the commercial real estate segment; and education and other consumer within the consumer segment. Consistent with the Bank’s allowance for loan losses policy, the appropriateness of the segmentation is periodically reviewed. This additional detail allows management to better identify trends in borrower behavior and loss severity within the segments and classes of the loan portfolio. A historical loss factor is computed for each class of loan and is used as the major determinate of the general allowance for loan losses. In determining the appropriate period of activity to use in computing the historical loss factor, management considers trends in quarterly net charge-off ratios. It is management’s intention to utilize a period of activity that it believes to be most reflective of current experience. Changes in the historical period are made when there is a distinct change in the trend of net charge-off experience. Management reviews each class’ historical losses by quarter for any trends that indicate the most representative look-back period.
On a quarterly basis the Company analyzes its general allowance methodology and determined it was necessary to increase the historical loss period by an additional quarter. For the quarter ended December 31, 2015, the Bank utilized a fifteen quarter look-back period compared to a fourteen quarter look-back period for the quarter ended September 30, 2015. The modification is being done to reflect a more stable economic environment and to capture additional loss statistics considered reflective of the current portfolio. The impact to the allowance for loan losses at December 31, 2015 after implementing the modification was an increase of $536,000 in the required reserve as compared to the previous methodology. Management will continue to analyze the historical loss period utilized on a quarterly basis.
Management adjusts historical loss factors based on the following qualitative factors:
• | Changes in lending policies and procedures, including changes in underwriting standards and collection and charge-off and recovery practices not considered elsewhere in estimating credit losses; |
• | Changes in national, regional and local economic and business conditions and developments that affect the collectability of the portfolio, including the condition of various market segments; |
• | Changes in the nature and volume of the portfolio and in the terms of loans; |
• | Changes in the experience, ability and depth of lending management and other relevant staff; |
• | Changes in the volume and severity of past due loans, the volume of nonaccrual loans and the volume and severity of adversely classified or graded loans; |
• | Changes in the quality of the Bank’s loan review system; |
• | Changes in the value of underlying collateral for collateral-dependent loans; |
• | The existence and effect of any concentrations of credit and changes in the level of such concentrations; and |
• | The effect of other external factors, such as competition and legal and regulatory requirements on the level of estimated credit losses in the Bank’s current portfolio. |
In determining the impact, if any, of an individual qualitative factor, management compares the current underlying facts and circumstances surrounding a particular factor with those in the historical periods, adjusting the historical loss factor based on changes in the qualitative factor. Management will continue to analyze the qualitative factors on a quarterly basis, adjusting the
57
historical loss factor as necessary, to a factor believed to be appropriate for the probable and inherent risk of loss in the portfolio.
The following table presents the allowance for loan losses by component:
December 31, | |||||||
2015 | 2014 | ||||||
(In thousands) | |||||||
General reserve | $ | 20,840 | $ | 38,596 | |||
Specific reserve | 4,307 | 8,441 | |||||
Total allowance for loan losses | $ | 25,147 | $ | 47,037 | |||
The following table summarizes the activity in the allowance for loan losses for the periods indicated:
Year Ended December 31, | Nine Months Ended December 31, | Year Ended March 31, | |||||||||||||||||
2015 | 2014 | 2013 | 2013 | 2012 | |||||||||||||||
(Dollars in thousands) | |||||||||||||||||||
Allowance at beginning of period | $ | 47,037 | $ | 65,182 | $ | 79,815 | $ | 111,215 | $ | 150,122 | |||||||||
Charge-offs: | |||||||||||||||||||
Residential | (1,112 | ) | (2,212 | ) | (4,419 | ) | (6,659 | ) | (6,625 | ) | |||||||||
Multi-family | (37 | ) | (908 | ) | (2,972 | ) | (2,656 | ) | (4,247 | ) | |||||||||
Commercial real estate | (677 | ) | (8,317 | ) | (6,678 | ) | (13,390 | ) | (32,009 | ) | |||||||||
Land and construction | (982 | ) | (6,816 | ) | (3,450 | ) | (18,219 | ) | (21,429 | ) | |||||||||
Consumer | (1,105 | ) | (2,599 | ) | (1,903 | ) | (4,946 | ) | (3,259 | ) | |||||||||
Commercial and industrial | (106 | ) | (5,220 | ) | (864 | ) | (3,483 | ) | (14,993 | ) | |||||||||
Total charge-offs | (4,019 | ) | (26,072 | ) | (20,286 | ) | (49,353 | ) | (82,562 | ) | |||||||||
Recoveries: | |||||||||||||||||||
Residential | 1,569 | 436 | 729 | 1,743 | 1,711 | ||||||||||||||
Multi-family | 2,217 | 485 | 190 | 327 | 1,425 | ||||||||||||||
Commercial real estate | 2,468 | 7,346 | 2,274 | 3,686 | 2,670 | ||||||||||||||
Land and construction | 2,817 | 990 | 1,062 | 2,787 | 1,429 | ||||||||||||||
Consumer | 432 | 379 | 330 | 219 | 693 | ||||||||||||||
Commercial and industrial | 2,122 | 2,876 | 793 | 1,458 | 1,840 | ||||||||||||||
Total recoveries | 11,625 | 12,512 | 5,378 | 10,220 | 9,768 | ||||||||||||||
Net recoveries (charge-offs) | 7,606 | (13,560 | ) | (14,908 | ) | (39,133 | ) | (72,794 | ) | ||||||||||
Provision for loan losses | (29,496 | ) | (4,585 | ) | 275 | 7,733 | 33,887 | ||||||||||||
Allowance at end of period | $ | 25,147 | $ | 47,037 | $ | 65,182 | $ | 79,815 | $ | 111,215 | |||||||||
Net recoveries (charge-offs) to average loans held for sale and for investment (1) | 0.48 | % | (0.86 | )% | (1.18 | )% | (1.97 | )% | (3.14 | )% | |||||||||
(1) | The nine month period ended December 31, 2013 is annualized. |
Management monitors and evaluates the portfolio on an ongoing basis and also considered the decrease in non-performing loans to total loans to 0.93% at December 31, 2015 from 2.22% at December 31, 2014 to be a factor that warranted the decrease in allowance for loan losses.
The allowance process is analyzed regularly, with modifications made if needed, and those results are reported to the Bank’s Board. Although management believes that the December 31, 2015 allowance for loan losses is adequate based upon the current evaluation of loan delinquencies, non-performing assets, charge off trends, economic conditions and other factors, there can be no assurance that future adjustments to the allowance will not be necessary. Management also continues to pursue all practical and legal methods of collection, repossession and disposal, and adheres to high underwriting standards in the origination process in order to continue to improve asset quality. Determination as to the classification of assets and the amount
58
of valuation allowances is subject to review by the Bank's regulatory agencies which can recommend the establishment of additional general or specific loss allowances.
The following table presents the allocation of the allowance for loan losses in the loan categories previously presented.
As of December 31, | As of March 31, | |||||||||||||||||||||||||||||||||
2015 | 2014 | 2013 | 2013 | 2012 | ||||||||||||||||||||||||||||||
Balance | % of Loan Type to Total Loans | Balance | % of Loan Type to Total Loans | Balance | % of Loan Type to Total Loans | Balance | % of Loan Type to Total Loans | Balance | % of Loan Type to Total Loans | |||||||||||||||||||||||||
(Dollars in thousands) | ||||||||||||||||||||||||||||||||||
Residential | $ | 5,116 | 32.3 | % | $ | 10,684 | 33.7 | % | $ | 13,059 | 32.2 | % | $ | 14,525 | 30.6 | % | $ | 13,027 | 25.2 | % | ||||||||||||||
Multi-family | 4,753 | 19.4 | 6,053 | 16.9 | 8,049 | 17.5 | 10,753 | 16.4 | 15,714 | 15.8 | ||||||||||||||||||||||||
Other commercial real estate | 4,383 | 18.6 | 12,687 | 19.8 | 20,274 | 20.4 | 26,330 | 21.2 | 37,629 | 25.1 | ||||||||||||||||||||||||
Land and construction | 6,848 | 8.7 | 9,976 | 6.8 | 13,742 | 5.7 | 17,498 | 6.4 | 31,810 | 8.6 | ||||||||||||||||||||||||
Consumer | 3,691 | 19.5 | 6,201 | 21.8 | 3,656 | 22.9 | 3,637 | 23.7 | 2,467 | 23.5 | ||||||||||||||||||||||||
Commercial and industrial | 356 | 1.5 | 1,436 | 1.0 | 6,402 | 1.3 | 7,072 | 1.7 | 10,568 | 1.8 | ||||||||||||||||||||||||
Total allowance for loan losses | $ | 25,147 | 100.0 | % | $ | 47,037 | 100.0 | % | $ | 65,182 | 100.0 | % | $ | 79,815 | 100.0 | % | $ | 111,215 | 100.0 | % | ||||||||||||||
The following table presents the associated allowance for loan losses as a percent of the total in the loan categories previously reported:
As of December 31, | As of March 31, | |||||||||||||
2015 | 2014 | 2013 | 2013 | 2012 | ||||||||||
Residential | 20.4 | % | 22.7 | % | 20.0 | % | 18.2 | % | 11.7 | % | ||||
Multi-family | 18.9 | 12.9 | 12.4 | 13.5 | 14.1 | |||||||||
Other commercial real estate | 17.4 | 27.0 | 31.1 | 33.0 | 33.8 | |||||||||
Land and construction | 27.2 | 21.2 | 21.1 | 21.9 | 28.6 | |||||||||
Consumer | 14.7 | 13.2 | 5.6 | 4.6 | 2.2 | |||||||||
Commercial and industrial | 1.4 | 3.0 | 9.8 | 8.8 | 9.6 | |||||||||
Total allowance for loan losses | 100.0 | % | 100.0 | % | 100.0 | % | 100.0 | % | 100.0 | % | ||||
Other Real Estate Owned
OREO, net decreased $15.1 million during the year ended December 31, 2015. Individual properties included in OREO at December 31, 2015 with a recorded balance in excess of $1 million are listed below:
Description | Location | Carrying Value | ||||
(In thousands) | ||||||
Raw Land | Southeast Wisconsin | $ | 3,392 | |||
Raw Land | Northeast Wisconsin | 1,780 | ||||
Commercial Building | South Central Wisconsin | 1,605 | ||||
Commercial Building | Northwest Wisconsin | 1,538 | ||||
Raw Land | Southeast Wisconsin | 1,075 | ||||
Other properties individually less than $1.0 million | 10,981 | |||||
$ | 20,371 | |||||
Foreclosed properties are recorded at fair value less cost to sell upon transfer to OREO with shortfalls, if any, charged to the allowance for loan losses. Subsequent decreases in the valuation of OREO are recorded in a valuation account for the foreclosed property with a corresponding charge to OREO expense, net. The fair value is primarily based on appraisals. On a quarterly basis, the carrying values of OREO properties are reviewed and appropriate adjustments are made based upon updated appraisals, evaluations, signed sales contracts or list price reductions. Incremental valuation adjustments may be recognized in the Consolidated Statement of Operations if, in the opinion of management, additional losses are deemed probable.
59
LIQUIDITY RISK MANAGEMENT
Liquidity risk is the risk of potential loss if the Company were unable to meet its funding requirements at a reasonable cost. The Company manages liquidity risk to help ensure that it can obtain cost-effective funding to meet current and future obligations.
The largest source of liquidity on a consolidated basis is the deposit base that originates from retail and corporate banking businesses. Other borrowed funds are available from a diverse mix of short- and long-term funding sources. Liquid assets and unused borrowing capacity from a number of sources are also available to maintain an adequate liquidity position.
Liquidity and Capital Resources
On an unconsolidated basis, the Company’s typical source of funds is dividends from its subsidiaries, including the Bank. During the year ended December 31, 2015, the Bank declared and paid a dividend to the Company. The Company currently finances its operations through cash on hand. At December 31, 2015, the Company’s cash and cash equivalents, on an unconsolidated basis amounted to $21.8 million. A significant amount of our consolidated operating expenses are incurred by and paid directly by the Company’s subsidiaries. Net cash provided by operations during 2015 was $14.7 million while cash used in investing activities was $135.1 million and cash provided by financing activities was $48.4 million.
The Bank’s primary sources of funds are payments on loans and securities, deposits from retail and commercial banking businesses and wholesale funding sources (FHLB of Chicago advances and other borrowings). As of December 31, 2015, the Company had outstanding borrowings from the FHLB of Chicago of $10.0 million. The Bank pledges certain loans that meet underwriting criteria established by the FHLB of Chicago as collateral for outstanding advances. The unpaid principal balance of loans pledged to secure FHLB of Chicago borrowings totaled $595.6 million and $652.3 million at December 31, 2015 and 2014, respectively. The FHLB of Chicago borrowings are also collateralized by mortgage backed securities with a fair value of $55.9 million and $88.9 million at December 31, 2015 and 2014, respectively. At December 31, 2015, there were no FHLB of Chicago borrowings with call features that may be exercised by the FHLB of Chicago. The Bank has also been granted access to the Federal Reserve Bank of Chicago’s discount window but as of December 31, 2015, the Bank had no borrowings outstanding from this source. Additionally, the Bank has an unsecured federal funds line available with a correspondent bank, but as as of December 31, 2015, this line was unused.
Contractual Obligations and Commitments
At December 31, 2015, on a consolidated basis, the Company had outstanding commitments to originate $133.7 million of loans and commitments to extend credit to or on behalf of customers pursuant to lines and letters of credit of $395.9 million. Commitments to extend credit typically have a term of less than one year. Scheduled maturities of certificates of deposit for the Bank during the twelve months following December 31, 2015 amounted to $236.9 million. Scheduled maturities of borrowings during the same period totaled $2.5 million for the Bank. Management believes adequate capital and borrowings are available from various sources to fund all commitments to the extent required.
The following table summarizes our contractual principal cash obligations and other commitments at December 31, 2015:
Payment Due by Period | |||||||||||||||||||
Less than 1 Year | 1-3 Years | 4-5 Years | More than 5 Years | Total | |||||||||||||||
(In thousands) | |||||||||||||||||||
FHLB advances | $ | — | $ | 10,000 | $ | — | $ | — | $ | 10,000 | |||||||||
Repurchase agreements | 2,438 | — | — | — | 2,438 | ||||||||||||||
Long term lease obligations | 62 | 62 | — | — | 124 | ||||||||||||||
Total other borrowed funds | 2,500 | 10,062 | — | — | 12,562 | ||||||||||||||
Certificates of deposit | 236,887 | 127,909 | 25,524 | — | 390,320 | ||||||||||||||
Other deposits | 1,450,404 | — | — | — | 1,450,404 | ||||||||||||||
Lease obligations | 1,947 | 3,834 | 3,326 | 3,921 | 13,028 | ||||||||||||||
Total contractual obligations | $ | 1,691,738 | $ | 141,805 | $ | 28,850 | $ | 3,921 | $ | 1,866,314 | |||||||||
Investment Securities
Investment securities are subject to inherent risks based upon the future performance of the underlying collateral (i.e., mortgage loans) for these securities. Among these risks are prepayment risk, interest rate risk and credit risk. Should general interest rate levels decline, the mortgage-related securities portfolio would be subject to (i) prepayments as borrowers typically would seek
60
to obtain financing at lower rates, (ii) a decline in interest income received on adjustable-rate mortgage-related securities, and (iii) an increase in fair value of fixed-rate mortgage-related securities. Conversely, should general interest rate levels increase, the mortgage-related securities portfolio would be subject to (i) a longer term to maturity as borrowers would be less likely to prepay their loans, (ii) an increase in interest income received on adjustable-rate mortgage-related securities, (iii) a decline in fair value of fixed-rate mortgage-related securities, (iv) a decline in fair value of adjustable-rate mortgage-related securities to an extent dependent upon the level of interest rate increases, the time period to the next interest rate repricing date for the individual security and the applicable periodic (annual and/or lifetime) cap which could limit the degree to which the individual security may reprice within a given time period and (v) should default rates and loss severities increase on the underlying collateral of mortgage-related securities, credit losses may be experienced, which are recognized in earnings as net impairment losses.
Mortgage Partnership Finance Program of the FHLB of Chicago (“MPF Program”)
The Bank previously participated in the MPF Program of the FHLB of Chicago. Pursuant to the credit enhancement feature of the MPF Program, the Bank retained a secondary credit loss exposure in the amount of $3.4 million at December 31, 2015 related to approximately $122.7 million of residential mortgage loans that the Bank has originated and are still outstanding. The Bank acts as a servicing agent for the FHLB of Chicago. Under the credit enhancement, the FHLB of Chicago is liable for losses on loans up to one percent of the original delivered loan balances in each pool up to the point the credit enhancement is reset. After the credit enhancement resets, the FHLB of Chicago and the Bank’s loss contingency could be reduced depending upon losses experienced and loan balances remaining. The Bank is liable for losses over and above the FHLB of Chicago first loss position up to a contractually agreed-upon maximum amount in each pool that was delivered to the MPF Program. The Bank receives a monthly fee for this credit enhancement obligation based on the outstanding loan balances. The monthly fee received is net of losses under the MPF Program. The Bank discontinued funding loans through the MPF Program in 2008.
Brokered Deposits
The Bank has, in the past, entered into agreements with certain brokers that provided deposits obtained from their customers at specified interest rates for an identified fee, or so called “brokered deposits.” At December 31, 2015, the Bank had no brokered deposits.
Regulatory Capital
Under federal law and regulation the Company and the Bank are required to meet the regulatory capital ratios of CET1, tier 1 capital, total capital and tier 1 leverage. CET1 primarily consists of common stock, related surplus, net of Treasury stock, retained earnings less certain intangible assets and unrealized gains/losses on available for sale securities. Tier 1 capital is CET1 plus non-cumulative perpetual preferred stock less certain regulatory deductions. Total capital primarily consists of tier 1 capital plus a qualifying portion of the allowance for loan losses. The risk-based capital requirements presently address credit risk related to both recorded and off-balance sheet commitments and obligations.
Our ability to meet our short-term liquidity and capital resource requirements may be subject to our ability to obtain additional debt financing and equity capital. We may increase our capital resources through offerings of equity securities (possibly including common shares and one or more classes of preferred shares), commercial paper, medium-term notes, securitization transactions structured as secured financings and senior or subordinated notes.
61
The following table summarizes the Company and the Bank’s capital ratios:
December 31, 2015 | December 31, 2014 | ||||||||||||||||
Ratio | To be Adequately Capitalized | To be Well Capitalized | Ratio | To be Adequately Capitalized | To be Well Capitalized | ||||||||||||
Common equity tier 1 ratio (1) | |||||||||||||||||
Anchor Bancorp | 18.66 | % | 4.50 | % | N/A | N/A | N/A | N/A | |||||||||
AnchorBank, fsb | 17.04 | % | 4.50 | % | 6.50 | % | N/A | N/A | N/A | ||||||||
Tier 1 capital ratio (2) | |||||||||||||||||
Anchor Bancorp | 18.66 | % | 6.00 | % | N/A | N/A | N/A | N/A | |||||||||
AnchorBank, fsb | 17.04 | % | 6.00 | % | 8.00 | % | 16.97 | % | 4.00 | % | 6.00 | % | |||||
Total capital ratio (3) | |||||||||||||||||
Anchor Bancorp | 19.95 | % | 8.00 | % | N/A | N/A | N/A | N/A | |||||||||
AnchorBank, fsb | 18.33 | % | 8.00 | % | 10.00 | % | 18.25 | % | 8.00 | % | 10.00 | % | |||||
Tier 1 leverage ratio (4) | |||||||||||||||||
Anchor Bancorp | 13.52 | % | 4.00 | % | N/A | N/A | N/A | N/A | |||||||||
AnchorBank, fsb | 12.35 | % | 4.00 | % | 5.00 | % | 10.43 | % | 4.00 | % | 5.00 | % | |||||
(1) | CET1 capital divided by total risk-weighted assets |
(2) | Tier 1 capital divided by total risk-weighted assets |
(3) | Total risk-based capital divided by total risk-weighted assets |
(4) | Tier 1 capital divided by adjusted average total assets |
The following table reconciles the Bank’s stockholders’ equity to regulatory capital:
December 31, 2015 | December 31, 2014 | ||||||
(In thousands) | |||||||
Stockholders’ equity of the Bank | $ | 336,194 | $ | 216,030 | |||
Less: disallowed servicing assets | — | (1,773 | ) | ||||
Disallowed deferred tax assets | (69,254 | ) | — | ||||
Accumulated other comprehensive loss | 3,250 | 2,402 | |||||
Common equity tier 1 capital | 270,190 | N/A | |||||
Additional tier 1 capital | — | N/A | |||||
Tier 1 capital | 270,190 | 216,659 | |||||
Plus: allowable allowance for loan losses | 20,426 | 16,373 | |||||
Total risk-based capital | $ | 290,616 | $ | 233,032 | |||
The Company is a separate and distinct legal entity from our subsidiaries, including the Bank. As a holding company without independent operations, the Company’s liquidity (on an unconsolidated basis) is primarily dependent upon the Company’s ability to raise debt or equity capital from third parties and the receipt of dividends from the Bank and its non-bank subsidiary. We receive substantially all of our revenue from dividends from the Bank. These dividends are the principal source of funds to pay dividends on our preferred or common stock. Various federal and/or state laws and regulations limit the amount of dividends that the Bank may pay us. Additionally, if the Bank’s earnings are not sufficient to make dividend payments to the Company while maintaining adequate capital levels, our ability to make dividend payments to our preferred or common stockholders will be negatively impacted. During the year ended December 31, 2015, the Bank declared and paid a dividend to the Company.
MARKET RISK MANAGEMENT
Market risk is the risk of a loss in earnings or economic value due to adverse movements in market factors such as interest rates, credit spreads, foreign exchange rates and equity prices. The Company is exposed to market risk primarily by our involvement in, among others, traditional banking activities of taking deposits and extending loans.
While the Company attempts to manage its balance sheet to minimize the effect that a change in interest rates has on its net interest margin, it may utilize derivative financial instruments as part of its interest rate risk management strategy. The Company’s Board approved a program for the prudent use of interest rate swap transactions to manage the interest rate risk of
62
commercial loans and to manage other balance sheet interest rate risk. The Company enters into interest rate-related transactions to facilitate the interest rate risk management strategies of commercial customers. The Company then mitigates this risk by entering into equal and offsetting interest rate-related transactions with highly rated third party financial institutions. The Company’s objective with the use of derivatives is to add stability to its net interest margin and to manage its exposure to movements in interest rates. At December 31, 2015, the aggregate notional value of interest rate swaps with various commercial customers was $78.4 million.
COMPLIANCE RISK MANAGEMENT
Compliance risk represents the risk of regulatory sanctions, reputational impact or financial loss resulting from the Company’s failure to comply with regulations and standards of good banking practice. Activities which may expose the Company to compliance risk include, but are not limited to, those dealing with the prevention of money laundering, privacy and data protection, community reinvestment initiatives, fair lending challenges and employment and tax matters. The Company has a separate department with individuals having specialized training and experience tasked with ensuring compliance with state and federal public interest, consumer and civil rights oriented banking laws and regulations.
STRATEGIC AND/OR REPUTATION RISK MANAGEMENT
Strategic and/or reputation risk represents the risk of loss due to impairment of reputation, failure to fully develop and execute business plans, failure to assess current and new opportunities in business, markets and products and any other event not identified in the defined risk types mentioned previously. Mitigation of the various risk elements that represent strategic and/or reputation risk is achieved through initiatives to help the Company better understand, manage and report on the various risks.
Item 7A. | Quantitative and Qualitative Disclosures About Market Risk |
The business of the Company and the composition of its consolidated balance sheets consist of investments in interest-earning assets (primarily loans, mortgage backed securities and other securities) that are largely funded by interest-bearing liabilities (deposits and borrowings). All of the financial instruments of the Company as of December 31, 2015 were held for other-than-trading purposes. Such financial instruments have varying levels of sensitivity to changes in market rates of interest. The Company’s net interest income is dependent on the amounts of and yields on its interest-earning assets as compared to the amounts of and rates on its interest-bearing liabilities. Net interest income is therefore sensitive to changes in market rates of interest.
The Company’s asset/liability management strategy is to maximize net interest income while limiting exposure to risks associated with changes in interest rates. This strategy is implemented by the Company’s ongoing analysis and management of its interest rate risk. A principal function of asset/liability management is to coordinate the levels of interest-sensitive assets and liabilities to manage net interest income changes within limits in times of fluctuating market interest rates.
Interest rate risk results when the maturity or repricing intervals and interest rate indices of the interest-earning assets, interest-bearing liabilities, and off-balance sheet financial instruments are different, thus creating a risk that will result in disproportionate changes in the value of and the net earnings generated from these instruments. The Company’s exposure to interest rate risk is managed primarily through the strategy of selecting the types and terms of interest-earning assets and interest-bearing liabilities that generate favorable earnings while limiting the potential negative effects of changes in market interest rates. Because the primary source of interest-bearing liabilities is customer deposits, the Company’s ability to manage the types and terms of such deposits may be somewhat limited by customer maturity preferences in the market areas in which the Company operates. Deposit pricing is competitive with promotional rates frequently offered by competitors. Borrowings, which can include FHLB of Chicago advances, short-term borrowings and long-term borrowings, are generally structured with specific terms which, in management’s judgment, when aggregated with the terms for outstanding deposits and matched with interest-earning assets, reduce the Company’s exposure to interest rate risk. The rates, terms and interest rate indices of the interest-earning assets result primarily from the Company’s strategy of investing in securities and loans (a portion of which have adjustable rates). This permits the Company to limit its exposure to interest rate risk, together with credit risk, while at the same time achieving a positive interest rate spread from the difference between the income earned on interest-earning assets and the cost of interest-bearing liabilities.
The Company has developed a program to enter into interest rate swap arrangements to manage the interest rate risk exposure associated with specific commercial loan relationships at the time such loans are originated. These interest rate swaps, as well as the embedded derivatives associated with certain of its commercial loan relationships, are derivative financial instruments under GAAP. None of these derivative financial instruments would be designated by the Company as accounting hedges as specified in GAAP. As such, the fair market value of the interest rate swaps and embedded derivatives will be carried in the Consolidated Balance Sheets as derivative assets or liabilities, as the case may be, and periodic changes in fair market value of
63
such financial instruments will be recorded through periodic earnings in non-interest income in the Consolidated Statements of Operations.
Management uses a simulation model for internal asset/liability management. The model uses maturity and repricing information for securities, loans, deposits and borrowings plus repricing assumptions on products without specific repricing dates (e.g., savings and interest-bearing demand deposits), to calculate the cash flows, income and expense of assets and liabilities. In addition, the model computes a theoretical market value of equity by estimating the market values of its assets and liabilities using present value methodology. The model also projects the effect on earnings and theoretical value under various interest rate change scenarios. The Company’s exposure to interest rates is reviewed on a monthly basis by senior management and the Board.
Net Interest Income Sensitivity Analysis
The Company performs a net interest income sensitivity analysis as part of its asset/liability management processes. Net interest income sensitivity analysis measures the change in net interest income in the event of hypothetical changes in interest rates. This analysis assesses the risk of change in net interest income in the event of sudden and sustained 100 and 200 basis point increases in market interest rates. The table below presents the projected changes in twelve-month cumulative net interest income for the various rate shock levels at December 31, 2015 and 2014, respectively.
200 Basis Point Rate Increase | 100 Basis Point Rate Increase | ||||
December 31, 2015 | 4.8 | % | 2.4 | % | |
December 31, 2014 | 5.0 | % | 2.4 | % | |
As a result of current market conditions, 100 and 200 basis point decreases in market interest rates are not applicable for the periods presented as those decreases would result in some deposit interest rate assumptions falling below zero. Nonetheless, the Company’s net interest income may decline in declining rate environments as yields on earning assets could continue to adjust downward.
As shown above, at December 31, 2015, the effect of an immediate 200 basis point increase in interest rates would increase the Company’s net interest income by 4.8%. Overall net interest income sensitivity remains within the Company’s guidelines.
The changes in the Company’s net interest income reflected above were due, in large part, to the optionality on both sides of the balance sheet. The changes in net interest income over the one year horizon for December 31, 2015 under the 100 basis point and 200 basis point increases in market interest rates scenarios are reflective of this optionality. In general, in a rising rate environment, yields on loans and investment securities are expected to re-price upwards more quickly than the cost of funds.
Mortgage backed securities, including adjustable rate mortgage pools, are modeled in the above analysis based on their estimated repricing or principal paydowns obtained from outside analytical sources. Loans are modeled in the above analysis based on contractual maturity or contractual repricing dates, coupled with principal prepayment assumptions. Deposits are based on management’s analysis of industry trends and customer behavior.
The Company also uses these assumptions to estimate the market value of equity and the market risk to this value due to changes in interest rates. This focus helps model risks embedded in the balance sheet over a longer time horizon than the net interest income simulation. The calculation is based on the present value of projected future cash flows. As of December 31, 2015, the projected changes for the market value of equity were within the Company’s policy limits.
Computations of the prospective effects of hypothetical interest rate changes are dependent on numerous assumptions, including relative levels of market interest rates, loan prepayments and deposit decay rates. These computations should not be relied upon as indicative of actual results. Actual values may differ from those projections set forth above, should market conditions vary from assumptions used in preparing the analyses. Further, the computations do not contemplate any actions the Company may undertake in response to changes in interest rates. Because such assumptions can be no more than estimates, certain assets and liabilities modeled as maturing or otherwise repricing within a stated period may, in fact, mature or reprice at different times and at different volumes than those estimated. Also, the renewal or repricing of certain assets and liabilities can be discretionary and subject to competitive and other pressures. Therefore, the rate sensitivity results included above do not and cannot necessarily indicate the actual future impact of general interest rate movements on the Company’s net interest income.
64
Item 8. | Financial Statements and Supplementary Data |
INDEX TO CONSOLIDATED FINANCIAL STATEMENTS OF ANCHOR
BANCORP WISCONSIN INC.
Page | |
Consolidated Financial Statements | |
65
Report of Independent Registered Public Accounting Firm
To the Board of Directors and Stockholders
Anchor BanCorp Wisconsin Inc.
We have audited the accompanying consolidated balance sheets of Anchor BanCorp Wisconsin Inc. and Subsidiaries (the Company) as of December 31, 2015 and 2014, and the related consolidated statements of operations and comprehensive income (loss), changes in stockholders’ equity (deficit), and cash flows for the years ended December 31, 2015 and 2014 and the nine months ended December 31, 2013. These consolidated financial statements are the responsibility of the Company’s management. Our responsibility is to express an opinion on these consolidated financial statements based on our audits.
We conducted our audits in accordance with the standards of the Public Company Accounting Oversight Board (United States). Those standards require that we plan and perform the audit to obtain reasonable assurance about whether the financial statements are free of material misstatement. An audit includes examining, on a test basis, evidence supporting the amounts and disclosures in the financial statements. An audit also includes assessing the accounting principles used and significant estimates made by management, as well as evaluating the overall financial statement presentation. We believe that our audits provide a reasonable basis for our opinion.
In our opinion, the consolidated financial statements referred to above present fairly, in all material respects, the financial position of the Company as of December 31, 2015 and 2014, and the results of their operations and their cash flows for the years ended December 31, 2015 and 2014 and the nine months ended December 31, 2013, in conformity with U.S. generally accepted accounting principles.
We have also audited, in accordance with the standards of the Public Company Accounting Oversight Board (United States), the Company’s internal control over financial reporting as of December 31, 2015, based on criteria established in Internal Control - Integrated Framework issued by the Committee of Sponsoring Organizations of the Treadway Commission in 2013 and our report dated March 11, 2016 expressed an unqualified opinion on the effectiveness of the Company’s internal control over financial reporting.
/s/ RSM US LLP
Madison, Wisconsin
March 11, 2016
66
Report of Independent Registered Public Accounting Firm
To the Board of Directors and Stockholders
Anchor BanCorp Wisconsin Inc.
We have audited Anchor BanCorp Wisconsin Inc. and Subsidiaries’ (the Company’s) internal control over financial reporting as of December 31, 2015, based on criteria established in Internal Control-Integrated Framework issued by the Committee of Sponsoring Organizations of the Treadway Commission in 2013. The Company's management is responsible for maintaining effective internal control over financial reporting and for its assessment of the effectiveness of internal control over financial reporting included in the accompanying Management’s Annual Report on Internal Control over Financial Reporting. Our responsibility is to express an opinion on the Company's internal control over financial reporting based on our audit.
We conducted our audit in accordance with the standards of the Public Company Accounting Oversight Board (United States). Those standards require that we plan and perform the audit to obtain reasonable assurance about whether effective internal control over financial reporting was maintained in all material respects. Our audit included obtaining an understanding of internal control over financial reporting, assessing the risk that a material weakness exists, and testing and evaluating the design and operating effectiveness of internal control based on the assessed risk. Our audit also included performing such other procedures as we considered necessary in the circumstances. We believe that our audit provides a reasonable basis for our opinion.
A company's internal control over financial reporting is a process designed to provide reasonable assurance regarding the reliability of financial reporting and the preparation of financial statements for external purposes in accordance with generally accepted accounting principles. A company's internal control over financial reporting includes those policies and procedures that (a) pertain to the maintenance of records that, in reasonable detail, accurately and fairly reflect the transactions and dispositions of the assets of the company; (b) provide reasonable assurance that transactions are recorded as necessary to permit preparation of financial statements in accordance with generally accepted accounting principles, and that receipts and expenditures of the company are being made only in accordance with authorizations of management and directors of the company; and (c) provide reasonable assurance regarding prevention or timely detection of unauthorized acquisition, use, or disposition of the company's assets that could have a material effect on the financial statements.
Because of its inherent limitations, internal control over financial reporting may not prevent or detect misstatements. Also, projections of any evaluation of effectiveness to future periods are subject to the risk that controls may become inadequate because of changes in conditions, or that the degree of compliance with the policies or procedures may deteriorate.
In our opinion the Company maintained in all material respects effective internal control over financial reporting as of December 31, 2015, based on criteria established in Internal Control - Integrated Framework issued by the Committee of Sponsoring Organizations of the Treadway Commission in 2013.
We have also audited, in accordance with the standards of the Public Company Accounting Oversight Board (United States), the consolidated balance sheets of Anchor BanCorp Wisconsin Inc. as of December 31, 2015 and 2014 and the related consolidated statements of operations and comprehensive income (loss), changes in stockholders’ equity (deficit), and cash flows for the years ended December 31, 2015 and 2014 and the nine months ended December 31, 2013 and our report dated March 11, 2016 expressed an unqualified opinion.
/s/ RSM US LLP
Madison, Wisconsin
March 11, 2016
67
ANCHOR BANCORP WISCONSIN INC. AND SUBSIDIARIES
Consolidated Balance Sheets
December 31, | ||||||||
2015 | 2014 | |||||||
(In thousands, except share data) | ||||||||
Assets | ||||||||
Cash and due from banks | $ | 43,970 | $ | 46,400 | ||||
Interest-earning deposits | 31,297 | 100,873 | ||||||
Cash and cash equivalents | 75,267 | 147,273 | ||||||
Investment securities available for sale (AFS) | 341,523 | 294,599 | ||||||
Investment securities held to maturity (HTM) | 15,492 | — | ||||||
Loans held for sale | 10,323 | 6,594 | ||||||
Loans held for investment | 1,640,100 | 1,571,476 | ||||||
Less: allowance for loan losses | (25,147 | ) | (47,037 | ) | ||||
Loans held for investment, net | 1,614,953 | 1,524,439 | ||||||
Other real estate owned (OREO), net | 20,371 | 35,491 | ||||||
Premises and equipment, net | 26,224 | 23,569 | ||||||
Federal Home Loan Bank stock, at cost | 11,940 | 11,940 | ||||||
Mortgage servicing rights (MSRs), net | 18,942 | 19,404 | ||||||
Accrued interest receivable | 7,827 | 7,627 | ||||||
Deferred tax asset, net | 90,620 | — | ||||||
Other assets | 15,016 | 11,443 | ||||||
Total assets | $ | 2,248,498 | $ | 2,082,379 | ||||
Liabilities and Stockholders’ Equity | ||||||||
Deposits | ||||||||
Non-interest bearing | $ | 323,956 | $ | 291,248 | ||||
Interest bearing | 1,516,768 | 1,522,923 | ||||||
Total deposits | 1,840,724 | 1,814,171 | ||||||
Borrowed funds | 12,562 | 13,752 | ||||||
Accrued interest payable | 325 | 316 | ||||||
Accrued taxes, insurance and employee related expenses | 6,577 | 7,259 | ||||||
Other liabilities | 21,669 | 19,218 | ||||||
Total liabilities | 1,881,857 | 1,854,716 | ||||||
Preferred stock: par value $0.01, authorized 100,000 shares, none outstanding | — | — | ||||||
Common stock: par value $0.01, 11,900,000 shares authorized, 9,608,957 and 9,552,094 shares issued, 9,597,392 and 9,547,587 shares outstanding at December 31, 2015 and 2014, respectively | 96 | 95 | ||||||
Additional paid-in capital | 197,498 | 195,083 | ||||||
Retained earnings | 172,610 | 34,981 | ||||||
Accumulated other comprehensive loss | (3,250 | ) | (2,402 | ) | ||||
Treasury stock: 11,565 shares and 4,507 shares at December 31, 2015 and 2014, respectively, at cost | (313 | ) | (94 | ) | ||||
Total stockholders’ equity | 366,641 | 227,663 | ||||||
Total liabilities and stockholders’ equity | $ | 2,248,498 | $ | 2,082,379 | ||||
See accompanying Notes to Consolidated Financial Statements
68
ANCHOR BANCORP WISCONSIN INC. AND SUBSIDIARIES
Consolidated Statements of Operations and Comprehensive Income (Loss)
Year Ended December 31, 2015 | Year Ended December 31, 2014 | Nine Months Ended December 31, 2013 | |||||||||
(In thousands, except per share data) | |||||||||||
Interest income | |||||||||||
Loans | $ | 66,463 | $ | 69,213 | $ | 57,702 | |||||
Investment securities and Federal Home Loan Bank stock | 6,412 | 5,996 | 4,179 | ||||||||
Interest-earning deposits | 335 | 371 | 342 | ||||||||
Total interest income | 73,210 | 75,580 | 62,223 | ||||||||
Interest expense | |||||||||||
Deposits | 4,186 | 4,099 | 4,108 | ||||||||
Borrowed funds | 243 | 245 | 10,009 | ||||||||
Total interest expense | 4,429 | 4,344 | 14,117 | ||||||||
Net interest income | 68,781 | 71,236 | 48,106 | ||||||||
Provision for loan losses | (29,496 | ) | (4,585 | ) | 275 | ||||||
Net interest income after provision for loan losses | 98,277 | 75,821 | 47,831 | ||||||||
Non-interest income | |||||||||||
Service charges on deposits | 10,061 | 10,017 | 7,751 | ||||||||
Investment and insurance commissions | 4,166 | 4,222 | 2,965 | ||||||||
Loan fees | 2,440 | 882 | 939 | ||||||||
Loan servicing income, net of amortization | 2,035 | 2,821 | 1,382 | ||||||||
Loan processing fee income | 1,241 | 844 | 1,255 | ||||||||
Net impairment losses recognized in earnings | — | (64 | ) | (23 | ) | ||||||
Net gain on sale of loans | 6,083 | 2,797 | 5,086 | ||||||||
Net gain on sale of investment securities | 63 | 746 | 292 | ||||||||
Net gain on sale of OREO | 3,828 | 2,540 | 3,260 | ||||||||
Extinguishment of debt | — | — | 134,514 | ||||||||
Net gain (loss) on sale of disposal of premises and equipment | 1,676 | 1,328 | (3 | ) | |||||||
Net gain on sale of branches | 986 | 991 | — | ||||||||
Other income | 2,392 | 3,395 | 2,115 | ||||||||
Total non-interest income | 34,971 | 30,519 | 159,533 | ||||||||
69
ANCHOR BANCORP WISCONSIN INC. AND SUBSIDIARIES
Consolidated Statements of Operations and Comprehensive Income (Loss)
Year Ended December 31, 2015 | Year Ended December 31, 2014 | Nine Months Ended December 31, 2013 | |||||||||
(In thousands, except per share data) | |||||||||||
Non-interest expense | |||||||||||
Compensation and benefits | $ | 45,831 | $ | 44,256 | $ | 32,426 | |||||
Occupancy | 6,366 | 7,374 | 6,517 | ||||||||
Furniture and equipment | 2,602 | 3,038 | 2,510 | ||||||||
Federal deposit insurance premiums | 2,226 | 3,151 | 3,386 | ||||||||
Data processing | 6,512 | 5,602 | 4,300 | ||||||||
Communications | 1,960 | 1,987 | 1,517 | ||||||||
Marketing | 2,698 | 3,676 | 2,099 | ||||||||
OREO expense, net | 2,344 | 9,779 | 9,797 | ||||||||
Investor loss reimbursement | (212 | ) | 50 | 687 | |||||||
MSR impairment (recovery) | (596 | ) | 534 | (1,664 | ) | ||||||
Provision for unfunded commitments | 17 | (2,107 | ) | 2,708 | |||||||
Loan processing and servicing expense | 2,774 | 2,435 | 2,549 | ||||||||
Retail operations expense | 2,620 | 2,490 | 1,793 | ||||||||
Legal services | 1,394 | 1,961 | 2,773 | ||||||||
Other professional fees | 1,899 | 1,452 | 1,699 | ||||||||
Insurance | 916 | 1,057 | 2,497 | ||||||||
Lease termination expense | 1,454 | — | — | ||||||||
Debt prepayment penalty | — | — | 16,149 | ||||||||
Reorganization costs | — | (64 | ) | 1,929 | |||||||
Other expense | 4,132 | 5,037 | 2,060 | ||||||||
Total non-interest expense | 84,937 | 91,708 | 95,732 | ||||||||
Income before income taxes | 48,311 | 14,632 | 111,632 | ||||||||
Income tax expense (benefit) | (89,447 | ) | 10 | 9 | |||||||
Net income | 137,758 | 14,622 | 111,623 | ||||||||
Preferred stock dividends in arrears | — | — | (2,538 | ) | |||||||
Preferred stock discount accretion | — | — | (6,167 | ) | |||||||
Retirement of preferred shares | — | — | 104,000 | ||||||||
Net income available to common equity | $ | 137,758 | $ | 14,622 | $ | 206,918 | |||||
Net income | $ | 137,758 | $ | 14,622 | $ | 111,623 | |||||
Reclassification adjustment recognized in Consolidated Statements of Operations – Net gain on sale of investment securities | (63 | ) | (746 | ) | (292 | ) | |||||
Reclassification adjustments recognized in Consolidated Statements of Operations – Net impairment losses recognized in earnings: | |||||||||||
Net change in unrealized credit related other-than-temporary impairment | — | (157 | ) | (201 | ) | ||||||
Realized credit losses | — | 221 | 224 | ||||||||
Change in net unrealized gains (losses) on AFS securities | (1,354 | ) | 4,902 | (9,932 | ) | ||||||
Tax effect related to items of other comprehensive income | 569 | — | — | ||||||||
Total other comprehensive income (loss) | (848 | ) | 4,220 | (10,201 | ) | ||||||
Comprehensive income | $ | 136,910 | $ | 18,842 | $ | 101,422 | |||||
Income per common share: | |||||||||||
Basic | $ | 14.64 | $ | 1.61 | $ | 12.18 | |||||
Diluted | 14.57 | 1.60 | 12.18 | ||||||||
Dividends declared per common share | — | — | — | ||||||||
See accompanying Notes to Consolidated Financial Statements
70
ANCHOR BANCORP WISCONSIN INC. AND SUBSIDIARIES
Consolidated Statements of Changes in Stockholders’ Equity (Deficit)
Common Stock Shares | Preferred Stock | Common Stock | Additional Paid-in Capital | Retained Earnings (Deficit) | Accumulated Other Comprehensive Income (Loss) | Treasury Stock | Deferred Compensation Obligation | Total | ||||||||||||||||||||||||||
(In thousands) | ||||||||||||||||||||||||||||||||||
Balance at March 31, 2013 | 25,363,339 | $ | 103,833 | $ | 2,536 | $ | 110,034 | $ | (189,097 | ) | $ | 3,579 | $ | (89,848 | ) | $ | (901 | ) | $ | (59,864 | ) | |||||||||||||
Net income | — | $ | — | $ | — | $ | — | $ | 111,623 | $ | — | $ | — | $ | — | $ | 111,623 | |||||||||||||||||
Other comprehensive loss, net of tax | — | — | — | — | — | (10,201 | ) | — | — | (10,201 | ) | |||||||||||||||||||||||
Recapitalization transaction fees | — | — | — | (14,360 | ) | — | — | — | — | (14,360 | ) | |||||||||||||||||||||||
Cancellation of common stock | (25,363,339 | ) | — | (2,536 | ) | (88,213 | ) | — | — | 89,848 | 901 | — | ||||||||||||||||||||||
Issuance of common stock | 9,050,000 | — | 88 | 174,912 | — | — | — | — | 175,000 | |||||||||||||||||||||||||
Preferred stock exchanged for common stock | — | (110,000 | ) | 3 | 5,997 | 104,000 | — | — | — | — | ||||||||||||||||||||||||
Accretion of preferred stock discount | — | 6,167 | — | — | (6,167 | ) | — | — | — | — | ||||||||||||||||||||||||
Balance at December 31, 2013 | 9,050,000 | $ | — | $ | 91 | $ | 188,370 | $ | 20,359 | $ | (6,622 | ) | $ | — | $ | — | $ | 202,198 | ||||||||||||||||
Net income | — | $ | — | $ | — | $ | — | $ | 14,622 | $ | — | $ | — | $ | — | $ | 14,622 | |||||||||||||||||
Other comprehensive income, net of tax | — | — | — | — | — | 4,220 | — | — | 4,220 | |||||||||||||||||||||||||
Stock issuance cost | — | — | — | (2,324 | ) | — | — | — | — | (2,324 | ) | |||||||||||||||||||||||
Issuance of common stock | 305,794 | — | 3 | 7,948 | — | — | — | — | 7,951 | |||||||||||||||||||||||||
Issuance of shares of restricted stock | 196,300 | — | 1 | (83 | ) | — | — | 82 | — | — | ||||||||||||||||||||||||
Forfeiture of shares of restricted stock | — | — | — | 176 | — | (176 | ) | — | — | |||||||||||||||||||||||||
Stock-based compensation expense | — | — | — | 996 | — | — | — | — | 996 | |||||||||||||||||||||||||
Balance at December 31, 2014 | 9,552,094 | $ | — | $ | 95 | $ | 195,083 | $ | 34,981 | $ | (2,402 | ) | $ | (94 | ) | $ | — | $ | 227,663 | |||||||||||||||
Net income | — | $ | — | $ | — | $ | — | $ | 137,758 | $ | — | $ | — | $ | — | $ | 137,758 | |||||||||||||||||
Other comprehensive loss, net of tax | — | — | — | — | — | (848 | ) | — | — | (848 | ) | |||||||||||||||||||||||
Tax benefit for restricted stock | — | — | — | 205 | — | — | — | — | 205 | |||||||||||||||||||||||||
Retirement of vested shares | (8,984 | ) | — | — | (193 | ) | (129 | ) | — | — | — | (322 | ) | |||||||||||||||||||||
Issuance of shares of restricted stock | 65,847 | — | 1 | (26 | ) | — | — | 25 | — | — | ||||||||||||||||||||||||
Forfeiture of shares of restricted stock | — | — | — | 244 | — | — | (244 | ) | — | — | ||||||||||||||||||||||||
Stock-based compensation expense | — | — | — | 2,185 | — | — | — | — | 2,185 | |||||||||||||||||||||||||
Balance at December 31, 2015 | 9,608,957 | $ | — | $ | 96 | $ | 197,498 | $ | 172,610 | $ | (3,250 | ) | $ | (313 | ) | $ | — | $ | 366,641 | |||||||||||||||
71
ANCHOR BANCORP WISCONSIN INC. AND SUBSIDIARIES
Consolidated Statements of Cash Flows
Year Ended December 31, 2015 | Year Ended December 31, 2014 | Nine Months Ended December 31, 2013 | |||||||||
(In thousands) | |||||||||||
Operating Activities | |||||||||||
Net income | $ | 137,758 | $ | 14,622 | $ | 111,623 | |||||
Adjustments to reconcile net income to net cash provided by operating activities: | |||||||||||
Amortization of investment securities premium, net | 1,674 | 1,496 | 1,290 | ||||||||
Net gain on sale of investment securities | (63 | ) | (746 | ) | (292 | ) | |||||
Net impairment losses on investment securities | — | 64 | 27 | ||||||||
Origination of loans held for sale | (264,244 | ) | (146,894 | ) | (228,748 | ) | |||||
Proceeds from sale of loans held for sale | 266,598 | 146,182 | 248,807 | ||||||||
Net gain on sale of loans | (6,083 | ) | (2,797 | ) | (5,086 | ) | |||||
Provision for loan losses | (29,496 | ) | (4,585 | ) | 275 | ||||||
Provision for unfunded commitments | 17 | (2,107 | ) | 2,708 | |||||||
Valuation adjustments for OREO | 1,493 | 7,840 | 4,937 | ||||||||
Net gain on sale of OREO | (3,828 | ) | (2,540 | ) | (3,260 | ) | |||||
Net loss on transfer of premises to OREO | 111 | — | — | ||||||||
Depreciation and amortization | 2,887 | 2,404 | 1,871 | ||||||||
Net loss (gain) on disposal of premises and equipment | (1,676 | ) | (1,328 | ) | 3 | ||||||
Deferred gain on disposal of premises and equipment | — | (6,392 | ) | — | |||||||
Net gain on sale of branches | (986 | ) | (991 | ) | — | ||||||
Mortgage servicing rights impairment (recovery) | (596 | ) | 534 | (1,664 | ) | ||||||
Impairment of real estate held for development and sale | — | — | 212 | ||||||||
Stock-based compensation expense | 2,185 | 996 | — | ||||||||
Deferred income taxes | (90,051 | ) | — | — | |||||||
Extinguishment of debt | — | — | (134,514 | ) | |||||||
Net decrease (increase) in accrued interest receivable | (210 | ) | 583 | 1,347 | |||||||
Net decrease (increase) in other assets | (2,515 | ) | 4,000 | 5,726 | |||||||
Net increase (decrease) in accrued interest payable | 14 | (94 | ) | 6,339 | |||||||
Net increase (decrease) in accrued taxes, insurance and employee related expenses | (682 | ) | (43 | ) | 913 | ||||||
Net increase (decrease) in other liabilities | 2,434 | 6,936 | (5,837 | ) | |||||||
Net cash provided by operating activities | 14,741 | 17,140 | 6,677 | ||||||||
72
ANCHOR BANCORP WISCONSIN INC. AND SUBSIDIARIES
Consolidated Statements of Cash Flows
Year Ended December 31, 2015 | Year Ended December 31, 2014 | Nine Months Ended December 31, 2013 | |||||||||
(In thousands) | |||||||||||
Investing Activities | |||||||||||
Proceeds from sale of investment securities-AFS | $ | 14,647 | $ | 17,557 | $ | 356 | |||||
Purchase of investment securities-AFS | (133,845 | ) | (84,406 | ) | (63,293 | ) | |||||
Purchase of investment securities-HTM | (15,492 | ) | — | — | |||||||
Principal collected on investment securities-AFS | 69,246 | 53,528 | 40,626 | ||||||||
Net decrease (increase) in loans held for investment | (68,736 | ) | 11,724 | 106,592 | |||||||
Net cash delivered due to branch sales | (16,966 | ) | (13,173 | ) | — | ||||||
Proceeds from sale of premises and equipment | 1,831 | 10,550 | 27 | ||||||||
Purchases of premises and equipment | (7,642 | ) | (4,084 | ) | (2,232 | ) | |||||
Proceeds from sale of OREO | 22,003 | 33,301 | 38,864 | ||||||||
Capitalized improvements of OREO | (159 | ) | (251 | ) | (307 | ) | |||||
FHLB stock redemption | — | — | 13,690 | ||||||||
Net cash provided by (used in) investing activities | (135,113 | ) | 24,746 | 134,323 | |||||||
Financing Activities | |||||||||||
Net increase (decrease) in deposits | 49,890 | (46,257 | ) | (129,750 | ) | ||||||
Increase (decrease) in advance payments by borrowers for taxes and insurance | (217 | ) | 1,746 | (19,982 | ) | ||||||
Proceeds from borrowed funds | 114,066 | 106,327 | 718,989 | ||||||||
Repayment of borrowed funds | (115,256 | ) | (105,452 | ) | (956,037 | ) | |||||
Tax benefit for restricted stock | 205 | — | — | ||||||||
Retirement of vested shares | (322 | ) | — | — | |||||||
Issuance of common stock | — | 7,951 | 175,000 | ||||||||
Stock issuance cost | — | (2,324 | ) | — | |||||||
Recapitalization transaction fees | — | — | (14,360 | ) | |||||||
Net cash provided by (used in) financing activities | 48,366 | (38,009 | ) | (226,140 | ) | ||||||
Net increase (decrease) in cash and cash equivalents | (72,006 | ) | 3,877 | (85,140 | ) | ||||||
Cash and cash equivalents at beginning of period | 147,273 | 143,396 | 228,536 | ||||||||
Cash and cash equivalents at end of period | $ | 75,267 | $ | 147,273 | $ | 143,396 | |||||
Supplemental disclosures of cash flow information: | |||||||||||
Cash paid or credited to accounts: | |||||||||||
Interest on deposits and borrowings | $ | 4,420 | $ | 4,443 | $ | 7,778 | |||||
Income tax payments | 385 | 15 | 17 | ||||||||
Non-cash transactions: | |||||||||||
Transfer of loans to OREO | 3,256 | 10,381 | 19,352 | ||||||||
Transfer of premises to OREO | 1,133 | — | — | ||||||||
Tax effect of change in AFS unrealized gain/loss | 569 | — | — | ||||||||
See accompanying Notes to Consolidated Financial Statements
73
NOTES TO CONSOLIDATED FINANCIAL STATEMENTS
Note 1 – Summary of Significant Accounting Policies
Business. Anchor BanCorp Wisconsin Inc. (the “Company”) is a savings and loan holding company incorporated under the laws of the state of Delaware and headquartered in Madison, Wisconsin. Through its wholly owned subsidiary, AnchorBank, fsb (the “Bank”), it provides a full range of retail and commercial banking services to customers through its branch locations in Wisconsin. The Bank is subject to competition from other financial institutions, other financial service providers and non-banks. The Company and its subsidiary also are subject to the regulations of certain federal and state agencies and undergo periodic examinations by those regulatory authorities.
Change in Year End
On December 18, 2013, the Board of Directors (the “Board”) approved the change of the year end from March 31 to December 31, beginning with December 31, 2013. This report on Form 10-K covers the years ended December 31, 2015 and 2014 and the nine months ended December 31, 2013. The following table presents certain comparative transition period condensed financial information for the periods ended December 31, 2015, 2014 and 2013.
Year Ended December 31, | Nine Months Ended December 31, | ||||||||||||||
2015 | 2014 | 2013 | 2013 | ||||||||||||
(Unaudited) | |||||||||||||||
(In thousands) | |||||||||||||||
Interest income | $ | 73,210 | $ | 75,580 | $ | 84,939 | $ | 62,223 | |||||||
Interest expense | 4,429 | 4,344 | 22,013 | 14,117 | |||||||||||
Net interest income | 68,781 | 71,236 | 62,926 | 48,106 | |||||||||||
Provision for loan losses | (29,496 | ) | (4,585 | ) | 950 | 275 | |||||||||
Net interest income after provision for loan losses | 98,277 | 75,821 | 61,976 | 47,831 | |||||||||||
Non-interest income | 34,971 | 30,519 | 167,036 | 159,533 | |||||||||||
Non-interest expense | 84,937 | 91,708 | 131,400 | 95,732 | |||||||||||
Income before income taxes | 48,311 | 14,632 | 97,612 | 111,632 | |||||||||||
Income tax expense (benefit) | (89,447 | ) | 10 | 9 | 9 | ||||||||||
Net income | 137,758 | 14,622 | 97,603 | 111,623 | |||||||||||
Preferred stock dividends in arrears | — | — | (4,200 | ) | (2,538 | ) | |||||||||
Preferred stock discount accretion | — | — | (8,010 | ) | (6,167 | ) | |||||||||
Retirement of preferred shares | — | — | 104,000 | 104,000 | |||||||||||
Net income available to common equity | $ | 137,758 | $ | 14,622 | $ | 189,393 | $ | 206,918 | |||||||
Basis of Financial Statement Presentation. The consolidated financial statements have been prepared in accordance with U.S. generally accepted accounting principles (“GAAP”) and include the accounts and operations of the Company and its wholly owned subsidiaries, the Bank and Investment Directions, Inc. The Bank has one subsidiary ADPC Corporation. Significant intercompany accounts and transactions have been eliminated.
The unaudited consolidated financial statements included herein have been prepared in accordance with U.S. GAAP. In the opinion of management, all adjustments, including normal recurring accruals, necessary for a fair presentation of the unaudited consolidated financial statements have been included.
In preparing the consolidated financial statements, management is required to make estimates, assumptions and judgments when assets and liabilities are required to be recorded at, or adjusted to reflect, fair value under Generally Accepted Accounting Principles (“GAAP”). Actual results could differ from those estimates. Material estimates that are particularly susceptible to significant changes in the near term relate to the allowance for loan losses, the valuation of OREO, the net carrying value of MSRs, the valuation of deferred tax assets and the fair value of investment securities, interest rate lock commitments, forward contracts to sell mortgage loans, interest rate swap contracts and loans held for sale.
The Company has three distinct operating segments; the Bank, IDI and the holding company and produces discreet financial information for each which is available to management. However, operating revenues and related assets of IDI fall below the required reporting thresholds and therefore are not separately disclosed in the consolidated financial statements.
74
Subsequent Events. The Company has evaluated all subsequent events through the date of this filing. On January 12, 2016, Evansville, Indiana based Old National Bancorp (NASDAQ: ONB) ("Old National") and the Company jointly announced the execution of a definitive agreement under which Old National will acquire the Company through a stock and cash merger.
Under the terms of the agreement, the Company's stockholders may elect to receive either 3.5505 shares of Old National common stock or $48.50 in cash for each share of the Company they hold, subject to the restriction that no more than 40% of the outstanding shares of the Company may receive cash. Based on Old National’s 10-day average closing share price through January 8, 2016 of $13.34, this represents a total transaction value of approximately $461 million. The transaction value is likely to change until closing due to fluctuations in the price of Old National common stock and is also subject to adjustment under certain limited circumstances as provided in the merger agreement. The definitive merger agreement has been unanimously approved by the Board of both Old National and the Company. The transaction remains subject to regulatory approval and the vote of the Company's stockholders. The transaction is anticipated to close in the second quarter of 2016.
Old National was advised by Stephens, Inc. and the law firm of Krieg DeVault LLP. The Company was advised by J.P. Morgan Securities LLC and the law firm of Skadden, Arps, Slate, Meagher & Flom LLP.
Cash and Cash Equivalents. The Company considers interest-earning deposits that have an original maturity of three months or less to be cash equivalents.
Investment Securities. Debt securities that the Company has the intent and ability to hold to maturity may be classified as held to maturity and stated at amortized cost as adjusted for premium amortization and discount accretion. Securities would be classified as trading if the Company intends to actively buy and sell securities in order to make a profit. Trading securities are carried at fair value, with unrealized holding gains and losses included in earnings. There were no securities designated as trading during the years ended December 31, 2015 and 2014 and the nine months ended December 31, 2013. Securities not classified as held to maturity or trading are classified as available for sale. Available for sale securities are stated at fair value with unrealized gains and losses, reported as a separate component of accumulated other comprehensive income (loss), net of tax (if any), in stockholders’ equity.
Realized gains and losses are included in net gain (loss) on sale of investment securities in the consolidated statements of operations as a component of non-interest income. The cost of securities sold is based on the specific identification method.
Declines in the fair value of investment securities below amortized cost basis that are deemed to be an other-than-temporary impairment (“OTTI”), are reflected as impairment losses. To determine if an other-than-temporary impairment exists on a debt security, the Company first determines if (a) it intends to sell the security or (b) it is more likely than not that it will be required to sell the security before its anticipated recovery. If either of the conditions is met, the Company will recognize an other-than-temporary impairment in earnings equal to the difference between the fair value of the security and its amortized cost basis. If either of the conditions is met, the Company determines (a) the amount of the impairment related to credit loss and (b) the amount of the impairment due to all other factors. The difference between the present values of the cash flows expected to be collected discounted at the purchase yield or current accounting yield and the amortized cost basis is the credit loss. The amount of the credit loss is included in the consolidated statements of operations as an other-than-temporary impairment on securities and is a reduction in the cost basis of the security. The portion of the total impairment that is related to all other factors is included in other comprehensive income (loss).
Loans Held for Sale. Loans held for sale generally consist of the current origination of certain fixed- and adjustable-rate mortgage loans. Effective for loans originated on or after April 1, 2013, residential mortgage loans held for sale are carried at fair value and upfront costs and fees related to these loans are recognized in earnings as incurred. Prior to April 1, 2013, loans held for sale were recorded at the lower of cost or fair value with fees received from the borrower and direct costs to originate the loan deferred and included as a basis adjustment of the loan.
Loans Held for Investment, net. Loans held for investment, net, are stated at the amount of the gross principal, reduced by unamortized loan fees, net and an allowance for loan losses. Certain loan origination, commitment and other loan fees and associated direct loan origination costs are deferred and amortized as an adjustment to the related loan’s yield. These amounts, as well as discounts or premiums on purchased loans, are amortized using a method that approximates level yield, adjusted for prepayments, over the life of the related loans. Interest on loans is accrued into income on the gross loans as earned. Loans are placed on non-accrual status when they become 90 days past due or, when in the judgment of management, the probability of collection of principal and interest is deemed to be insufficient to warrant further accrual. Past due status is based on the contractual terms of the loan. Factors that management considers when assessing the collectability of principal and interest include early stage delinquencies and financial difficulties of the borrower. When a loan is placed on non-accrual status, previously accrued but unpaid interest is deducted from interest income. Payments received on non-accrual loans are generally credited to the loan balance and no interest income is recognized on those loans until the principal balance is current. In cases in which the unpaid contractual principal balance of the loan, is deemed to be fully collectible, interest payments received may
75
be recognized in income on a cash basis. Loans are restored to accrual status when the obligation is brought current, has performed in accordance with the contractual terms for a reasonable period of time, and the ultimate collectability of the total contractual principal and interest is no longer in doubt.
Loans held for investment are summarized into four different segments: residential loans, commercial and industrial loans, commercial real estate loans and consumer loans.
Residential Loans
Residential loans, substantially all of which finance the purchase of 1-to-4 family dwellings, are generally considered homogeneous as they exhibit similar product and risk characteristics. Residential loans are charged off to the fair value of collateral at the time:
• | of an approved short sale with funds received; |
• | information is received indicating an insufficient value and the borrower is 180 days past due; |
• | a foreclosure sale is complete and the loan is being moved to other real estate owned; or |
• | the loan is otherwise deemed uncollectible. |
Commercial and Industrial Loans
Commercial and industrial loans are funded for business purposes, including issuing letters of credit. The commercial and industrial loan portfolio is comprised of loans for a variety of purposes which are generally secured by equipment, owner occupied real estate and other working capital assets, such as accounts receivable and inventory. Commercial business loans typically have terms of five years or less and are divided between interest rates that float in accordance with a designated published index and fixed rates. Most loans are secured and backed by the personal guarantees of the owners of the business. Commercial and industrial loans are charged off to the fair value of collateral when information confirms that any portion of the recorded investment in a collateral dependent loan is a confirmed loss.
Commercial Real Estate Loans
Commercial real estate loans are primarily secured by apartment buildings, office and industrial buildings, land, warehouses, small retail shopping centers and various special purpose properties, including community-based residential facilities and senior housing. Although terms vary, commercial real estate loans generally have amortization periods of 15 to 30 years, as well as balloon payments of two to seven years. Commercial real estate loans are charged off to the fair value of the collateral when information confirms that any portion of the recorded investment in a collateral dependent loan is a confirmed loss.
Consumer Loans
Consumer loans generally have higher interest rates than residential loans. The risk involved in consumer loans is based on the type and nature of the collateral and, in certain cases, the absence of collateral. Consumer loans include first and second mortgage and home equity loans, consisting primarily of the Express Refinance Loan product which is the Bank’s expedited first mortgage refinance and home equity loan product. In addition, consumer loans include education loans, vehicle loans and other secured and unsecured loans that have been made for a variety of consumer purposes. Consumer loans are charged off to the fair value of collateral, upon repossession or sale of the collateral and deficiency is realized, upon reaching 120 days past due if unsecured or 180 days past due if secured, or when the loan is otherwise deemed uncollectible.
Allowance for Loan Losses. The allowance for loan losses is maintained at a level believed appropriate by management to absorb probable and estimable losses inherent in the held for investment loan portfolio and is based on the size and current risk characteristics of the held for investment loan portfolio; an assessment of individual impaired loans; actual and anticipated loss experience; and current economic events in specific industries and geographical areas. These economic events include unemployment levels, regulatory guidance and general economic conditions. Determination of the allowance is inherently subjective as it requires significant estimates, including the amounts and timing of expected future cash flows on impaired loans, estimated losses on pools of homogeneous loans based on historical loss experience and consideration of current economic trends, all of which may be susceptible to significant change. Therefore, the allowance for loan losses accounts for elements of imprecision and estimation risk inherent in the calculation.
Loan losses are charged off against the allowance, while recoveries of amounts previously charged off are credited to the allowance. A provision for loan losses is recorded in the statement of income based on management’s periodic evaluation of the factors previously mentioned as well as other pertinent factors. The provision for loan losses may increase or decline should credit metrics such as net charge offs and the amount of non-performing loans worsen or improve in the future.
76
The allowance for loan losses consists of specific and general components. Specific allowance allocations are established for probable losses resulting from analysis of impaired loans. A loan is considered impaired when it is probable that the Company will be unable to collect all contractual principal and interest due according to the terms of the loan agreement. Impaired loans include all nonaccrual loans and troubled debt restructurings ("TDRs"). TDRs are loans that have been modified, due to financial difficulties of the borrower, where the terms of the modified loan are more favorable for the borrower than what the Company would normally offer. Impairment is determined when the present value of expected future cash flows discounted at the loan’s effective interest rate or the fair value of the underlying collateral less costs to sell, if the loan is collateral dependent, is less than the carrying value of the loan. Cash collections on nonaccrual loans are generally credited to the loan balance and no interest income is recognized on those loans until the principal balance is current and collection of principal and interest becomes probable.
The general allowance component is based on historical net loss experience adjusted for qualitative factors. In determining the general allowance, the Company has defined the following segments within its loan portfolio: residential, commercial and industrial, commercial real estate and consumer. The Company has disaggregated those segments into the following classes based on risk characteristics: residential; commercial and industrial; land and construction, multi-family, retail/office and other commercial real estate within the commercial real estate segment; and education and other consumer within the consumer segment. Consistent with the Bank’s allowance for loan losses policy, the appropriateness of the segmentation is periodically reviewed. This additional detail allows management to better identify trends in borrower behavior and loss severity within the segments and classes of the loan portfolio. A historical loss factor is computed for each class of loan and is used as the major determinate of the general allowance for loan losses. In determining the appropriate period of activity to use in computing the historical loss factor, management considers trends in quarterly net charge-off ratios. It is management’s intention to utilize a period of activity that it believes to be most reflective of current experience. Changes in the historical period are made when there is a distinct change in the trend of net charge-off experience. Management reviews each class’ historical losses by quarter for any trends that indicate the most representative look-back period.
On a quarterly basis, the Company analyzes its general allowance methodology and has determined it is necessary to increase the historical loss period by an additional quarter. For the quarter ended December 31, 2015, the Bank utilized a fifteen quarter look-back period compared to a fourteen quarter look-back period for the quarter ended September 30, 2015. The modification is being done to reflect a more stable economic environment and to capture additional loss statistics considered reflective of the current portfolio. The impact to the allowance for loan losses at December 31, 2015 after implementing the modification was an increase of $536,000 in the required reserve as compared to the previous methodology. Management will continue to analyze the historical loss period utilized on a quarterly basis.
Management adjusts historical loss factors based on the following qualitative factors:
• | Changes in lending policies and procedures, including changes in underwriting standards and collection and charge-off and recovery practices not considered elsewhere in estimating credit losses; |
• | Changes in national, regional and local economic and business conditions and developments that affect the collectability of the portfolio including the condition of various market segments; |
• | Changes in the nature and volume of the portfolio and in the terms of loans; |
• | Changes in the experience, ability and depth of lending management and other relevant staff; |
• | Changes in the volume and severity of past due loans, the volume of nonaccrual loans and the volume and severity of adversely classified or graded loans; |
• | Changes in the quality of the Bank’s loan review system; |
• | Changes in the value of underlying collateral for collateral-dependent loans; |
• | The existence and effect of any concentrations of credit and changes in the level of such concentrations; and |
• | The effect of other external factors, such as competition and legal and regulatory requirements on the level of estimated credit losses in the Bank’s current portfolio. |
In determining the impact, if any, of an individual qualitative factor, management compares the current underlying facts and circumstances surrounding a particular factor with those in the historical periods, adjusting the historical loss factor based on changes in the qualitative factor. Management will continue to analyze the qualitative factors on a quarterly basis, adjusting the historical loss factor as necessary, to a factor believed to be appropriate for the probable and inherent risk of loss in the portfolio.
Other Real Estate Owned, net. Real estate acquired by foreclosure or by deed in lieu of foreclosure as well as other repossessed assets (“OREO”) are held for sale and are initially recorded at fair value less a discount for estimated selling costs at the date of foreclosure. Any write down to fair value less estimated selling costs is charged to the allowance for loan losses. If the discounted fair value exceeds the net carrying value of the loans, recoveries to the allowance for loan losses are recorded to the extent of previous charge-offs, with any excess, which is infrequent, recognized as a gain in non-interest income.
77
Subsequent to foreclosure, valuations are periodically performed and a valuation allowance is established if the carrying value exceeds the fair value less estimated selling costs. Costs relating to the development and improvement of the property may be capitalized; generally those greater than $10,000; holding period costs and subsequent changes to the valuation allowance are charged to OREO expense, net included in non-interest expense. Incremental valuation adjustments may be recognized in the Statement of Operations if, in the opinion of management, additional losses are deemed probable.
Premises and Equipment, net. Premises and equipment are recorded at cost and include expenditures for new facilities and items that substantially increase the estimated useful lives of existing buildings and equipment. Expenditures for normal repairs and maintenance are charged to operations as incurred. When properties are retired or otherwise disposed of, the related cost and accumulated depreciation are removed from the respective accounts and any resulting gain or loss is recorded in income. The cost of office properties and equipment is being depreciated principally by the straight-line method over the estimated useful lives (3 years to 40 years) of the assets. The cost of capitalized leasehold improvements is depreciated on the straight-line method over the lesser of the term of the respective lease or estimated economic life.
Federal Home Loan Bank Stock. The Bank is a member of the Federal Home Loan Bank (“FHLB”) system which is organized as a member owned cooperative. As a result of membership in the FHLB system, the Bank is required to maintain a minimum investment in FHLB stock. The stock is redeemable at par and is, therefore, carried at cost and periodically evaluated for impairment. Ownership in the FHLB provides a potential dividend and allows access to member privileges including loans, advances, letters of credit and mortgage purchases. The stock is not transferable and cannot be used as collateral. The Bank has concluded that its investment in the stock of FHLB Chicago was not impaired at December 31, 2015.
Mortgage Servicing Rights, net. Mortgage servicing rights are recorded as an asset when loans are sold to third parties with servicing rights retained. The amount allocated to the mortgage servicing rights retained has been recognized as a separate asset and is initially recorded at fair value and subsequently amortized in proportion to, and over the period of, estimated net servicing revenues. The carrying value of these assets is periodically reviewed for impairment using a lower of amortized cost or fair value methodology. Mortgage servicing rights are valued monthly by an independent third party valuation service with income adjustments recorded monthly. On an annual basis the valuation is validated by a separate third party valuation service. The fair value of the servicing rights is determined by estimating the present value of future net cash flows, taking into consideration market loan prepayment speeds, discount rates, servicing costs and other economic factors. For purposes of measuring fair value and impairment, the rights are stratified based on predominant risk characteristics of the underlying loans which include product type (i.e., fixed or adjustable) and interest rate. The amount of impairment recognized is the amount by which the amortized cost of the capitalized mortgage servicing rights on a product and interest rate strata basis exceed their fair value.
Transfers of Financial Assets. Transfers of financial assets are accounted for as sales when control over the assets has been surrendered. Control over transferred assets is deemed to be surrendered when (1) the assets have been isolated from the Company, (2) the transferee obtains the right (free of conditions that constrains it from taking advantage of that right) to pledge or exchange the transferred assets, and (3) the Company does not maintain effective control over the transferred assets through an agreement to repurchase them before their maturity.
Income Taxes. The Company’s deferred income tax assets and liabilities are computed for differences between the financial statement and tax basis of assets and liabilities that will result in taxable or deductible amounts in the future based on enacted tax laws and rates applicable to periods in which the differences are expected to affect taxable income. Valuation allowances are established, when necessary, to reduce deferred tax assets to the amount expected to be realized. Income tax expense (benefit) is the tax payable or refundable for the period adjusted for the change during the period in deferred tax assets and liabilities and associated valuation allowance. The Company and its subsidiaries file a consolidated federal income tax return and combined state income tax returns. An intercompany settlement of taxes paid is determined based on tax sharing agreements which generally provide for allocation of taxes to each entity on a separate return basis.
The Company is subject to the income tax laws of the U.S., its states and municipalities. These tax laws are complex and subject to different interpretations by the taxpayer and the relevant governmental taxing authorities. Accounting guidance related to uncertainty in income taxes provides a comprehensive model for how companies should recognize, measure, present and disclose in their financial statements uncertain tax positions taken or expected to be taken on a tax return. Under the guidance, tax positions shall initially be recognized in the financial statements when it is more likely than not the position will be sustained upon examination by the tax authorities. Such tax positions shall initially and subsequently be measured as the largest amount of tax benefit that is greater than 50% likely of being realized upon ultimate settlement with the tax authority assuming full knowledge of the position and all relevant facts. The guidance also revised disclosure requirements to include an annual tabular roll forward of unrecognized tax benefits. In establishing a provision for income tax expense (benefit), the Company must make judgments and interpretations about the application of these inherently complex tax laws within the
78
framework of existing U.S. GAAP. The Company recognizes interest and penalties related to uncertain tax positions in other non-interest expense if any were incurred.
Earnings Per Share. Basic earnings per share (“EPS”) is computed by dividing net income available to common equity of the Company by the weighted average number of common shares outstanding for the period. The basic EPS computation excludes the dilutive effect of all common stock equivalents, if any. Diluted EPS is computed by dividing net income available to common equity by the weighted average number of common shares outstanding plus all potentially dilutive common shares which could be issued if securities or other contracts to issue common stock were exercised or converted into common stock or resulted in the issuance of common stock (“common stock equivalents”). The Company’s common stock equivalents represent shares issuable under a stock compensation plan. Such common stock equivalents were computed based on the treasury stock method using the average market price for the period.
Comprehensive Income (Loss). Comprehensive income or loss is the total of reported net income or loss and all other revenues, expenses, gains and losses that under U.S. GAAP are not reported as net income (loss). As such, the Company includes unrealized gains or losses on securities available for sale in other comprehensive income (loss).
New Accounting Pronouncements. Accounting Standards Update ("ASU") No. 2016-02, "Leases (Topic 842)." ASU 2016-02 requires the recognition of lease assets and lease liabilities by lessees for those leases classified as operating leases. ASU 2016-02 requires that a lessee recognize in the statement of financial position a liability to make lease payments (the lease liability) and a right-of-use asset representing its right to use the underlying asset for the lease term (other than leases that meet the definition of a short-term lease). The liability will be equal to the present value of lease payments. The asset will be based on the liability, subject to adjustment, such as for initial direct costs. For income statement purposes, the Financial Accounting Standards Board (“FASB”) retained a dual model, requiring leases to be classified as either operating or finance. Operating leases will result in straight-line expense (similar to current operating leases) while finance leases will result in a front-loaded expense pattern (similar to current capital leases). Classification will be based on criteria that are largely similar to those applied in current lease accounting. For lessors, the guidance modifies the classification criteria and the accounting for sales-type and direct financing leases. This amendment is effective for fiscal years beginning after December 15, 2018 and early adoption is permitted. ASU 2016-02 must be adopted using a modified retrospective transition, and provides for certain practical expedients. The Company currently intends to adopt the accounting standard during the first quarter of 2019 and is currently evaluating the impact on its consolidated financial position.
ASU No. 2016-01, "Financial Instruments–Overall (Subtopic 825-10): Recognition and Measurement of Financial Assets and Financial Liabilities." ASU 2016-01 requires equity investments to be measured at fair value with changes in fair value recognized in net income; simplifies the impairment assessment of equity investments without readily determinable fair values by requiring a qualitative assessment to identify impairment; eliminates the requirement for public business entities to disclose the method(s) and significant assumptions used to estimate the fair value that is required to be disclosed for financial instruments measured at amortized cost on the balance sheet; requires public business entities to use the exit price notion when measuring the fair value of financial instruments for disclosure purposes; requires an entity to present separately in other comprehensive income the portion of the total change in the fair value of a liability resulting from a change in the instrument-specific credit risk when the entity has elected to measure the liability at fair value in accordance with the fair value option for financial instruments; requires separate presentation of financial assets and financial liabilities by measurement category and form of financial assets on the balance sheet or the accompanying notes to the financial statements and clarifies that an entity should evaluate the need for a valuation allowance on a deferred tax asset related to available-for-sale securities in combination with the entity’s other deferred tax assets. This amendment is effective for fiscal years beginning after December 15, 2017, and interim periods within those fiscal years. The Company currently intends to adopt the accounting standard during the first quarter of 2018 and is currently evaluating the impact on its consolidated financial position.
ASU No. 2015-15, "Interest–Imputation of Interest (Subtopic 835-30): Presentation and Subsequent Measurement of Debt Issuance Costs Associated with Line-of-Credit Arrangements." ASU 2015-15 requires entities to present debt issuance costs related to a recognized debt liability as a direct deduction from the carrying amount of that debt liability. Given the absence of authoritative guidance within ASU 2015-03, "Interest-Imputation of Interest (Subtopic 835-30): Simplifying the Presentation of Debt Issuance Costs", for debt issuance costs related to line-of-credit arrangements, the Securities and Exchange Commission ("SEC") staff stated they would not object to an entity deferring and presenting debt issuance costs as an asset and subsequently amortizing the deferred debt issuance costs ratably over the term of the line-of-credit arrangement, regardless of whether there are any outstanding borrowings on the line-of-credit arrangement. ASU 2015-15 adds these SEC comments to the "S" section of the Codification. The Company intends to adopt the accounting standard during the first quarter of 2016, as required, with no material impact.
ASU No. 2015-03 "Interest-Imputation of Interest (Subtopic 835-30): Simplifying the Presentation of Debt Issuance Costs." ASU 2015-03 simplifies the presentation of debt issuance costs, requiring that debt issuance costs related to a recognized debt
79
liability be presented in the balance sheet as a direct deduction from the carrying amount of that debt liability. This amendment is effective for fiscal years beginning after December 15, 2015, and interim periods within those fiscal years. Early adoption is permitted for financial statements that have not been previously issued. Entities should apply the new guidance on a retrospective basis, wherein the balance sheet of each individual period presented should be adjusted to reflect the period-specific effects of applying the new guidance. The Company intends to adopt the accounting standard during the first quarter of 2016, as required, with no material impact.
ASU No. 2015-02, "Consolidation (Topic 810): Amendments to the Consolidation Analysis." ASU 2015-02 is an amendment to the consolidation process and addresses the current accounting for consolidation of certain legal entities. All legal entities are subject to reevaluation under the revised consolidation model. The new standard reduces the number of consolidation models from four to two, simplifying consolidation by placing more emphasis on risk of loss when determining a controlling financial interest, reducing the frequency of the application of related-party guidance when determining a controlling financial interest in a variable interest entity and changing consolidation conclusions in several industries that typically make use of limited partnerships or VIEs. This amendment is effective for fiscal years, and interim periods within those fiscal years, beginning after December 15, 2015. Entities may apply the amendment prospectively or retrospectively to all prior periods presented in the financial statements. Early adoption is permitted provided that the guidance is applied from the beginning of the year of adoption. The Company intends to adopt the accounting standard during the first quarter of 2016, as required, with no material impact.
ASU No. 2015-01, “Income Statement-Extraordinary and Unusual Items (Subtopic 225-20): Simplifying Income Statement Presentation by Eliminating the Concept of Extraordinary Items.” ASU 2015-01 addresses the elimination from U.S. GAAP the concept of extraordinary items. Presently, an event or transaction is presumed to be an ordinary and usual activity of the reporting entity unless evidence clearly supports its classification as an extraordinary item. If an event or transaction meets the criteria for extraordinary classification, an entity is required to segregate the extraordinary item from the results of ordinary operations and show the item separately in the income statement, net of tax, after income from continuing operations. This amended guidance will prohibit separate disclosure of extraordinary items in the income statement. This amendment is effective for years, and interim periods within those years, beginning after December 15, 2015. Entities may apply the amendment prospectively or retrospectively to all prior periods presented in the financial statements. Early adoption is permitted provided that the guidance is applied from the beginning of the year of adoption. The Company intends to adopt the accounting standard during the first quarter of 2016, as required, with no material impact.
ASU No. 2014-09, “Revenue from Contracts with Customers (Topic 606).” In May 2014, FASB issued an amendment to clarify the principles for recognizing revenue and to develop a common revenue standard. The standard outlines a single comprehensive model for entities to use in accounting for revenue arising from contracts with customers and supersedes most current revenue recognition guidance, including industry-specific guidance. The core principle of the revenue model is that “an entity recognizes revenue to depict the transfer of promised goods or services to customers in an amount that reflects the consideration to which the entity expects to be entitled in exchange for those goods or services.” In applying the revenue model to contracts within its scope, an entity should apply the following steps: (1) Identify the contract(s) with a customer, (2) Identify the performance obligations in the contract, (3) Determine the transaction price, (4) Allocate the transaction price to the performance obligations in the contract, and (5) Recognize revenue when (or as) the entity satisfies a performance obligation. The standard applies to all contracts with customers except those that are within the scope of other topics in the FASB Codification. The standard also requires significantly expanded disclosures about revenue recognition. On August 12, 2015, the FASB issued ASU 2015-14, "Revenue from Contracts with Customers (Topic 606): Deferral of the Effective Date", which deferred the effective date by one year. The standard will be effective for annual periods beginning after December 15, 2017 but early adoption as of December 15, 2016 is permitted. The Company currently intends to adopt the accounting standard during the first quarter of 2018 and is currently evaluating the impact on its results of operations, financial position and liquidity.
ASU 2014-04, “Receivables – Troubled Debt Restructurings by Creditors (Subtopic 310-40) – Reclassification of Residential Real Estate Collateralized Consumer Mortgage Loans upon Foreclosure.” These amendments are intended to clarify when a creditor should be considered to have received physical possession of residential real estate property when collateralizing a consumer mortgage loan such that the loan should be derecognized and the real estate recognized. Further, this amendment clarifies that an in-substance repossession or foreclosure occurs, and a creditor is considered to have received physical possession of residential real estate property collateralizing a consumer mortgage loan, upon either: (1) the creditor obtaining legal title to the residential real estate property upon completion of a foreclosure, or (2) the borrower conveying all interest in the residential real estate property to the creditor to satisfy that loan through completion of a deed in lieu of foreclosure or through a similar legal agreement. ASU 2014-04 was effective for public companies for annual periods and interim periods within those annual periods beginning after December 15, 2014. The Company is in compliance with these requirements and adoption did not have an impact on the consolidated financial statements.
80
Reclassifications. Prior period amounts have been reclassified as needed to conform to the current period presentations. There was no impact on earnings or stockholders’ equity as a result of the reclassifications.
Note 2 – Significant Transactions
Sale of Bank Headquarters
In February 2014, the Bank entered into a purchase agreement with an unrelated third party to sell the Bank’s main office building located at 25 West Main Street, Madison, Wisconsin, the adjacent surface parking lot immediately behind the main office building at 115 South Carroll Street and the 261-stall parking ramp located at 126 South Carroll Street. The transaction closed on December 19, 2014 and a $1.4 million gain was recognized on the parcels that were not included in the subsequent lease between the Bank and the buyer. The Bank entered into a nine year lease to rent a portion of the office building to house the branch located in the building and for additional office space. The remaining gain of $6.4 million, related to the space sold and leased back, was deferred and is being amortized into income over the remaining term of the lease.
Sale of Branches
The Bank sold its Richland Center branch, which was a leased facility in rural Wisconsin, on December 31, 2014. The sale consisted of selected loans, furniture and equipment and deposits. The amount of deposits sold was $16.6 million and a gain of $1.0 million was recorded on the sale.
The Bank sold its Viroqua branch operations on May 15, 2015. The sale consisted of selected loans and deposits. In addition, the sale included the building, furniture and equipment. As part of the sale, a lease on the land was terminated. Total deposits sold were $11.2 million and generated a gain on the sale of the branch operations of $448,000.
The Bank sold its Winneconne branch operations on September 25, 2015. The sale consisted of selected loans and deposits. In addition, the sale included the building, furniture and equipment. Total deposits sold were $11.9 million and generated a gain on the sale of the branch operations of $538,000. A gain of $294,000 was also recorded on the sale of the branch building.
Purchase of New Building
In January 2015, the Bank completed the purchase of a new building located on the east side of Madison at a purchase price of $4.0 million. This facility, which houses the Bank’s support departments, became operational during the second quarter of 2015.
Operational Efficiency Measures
The Bank completed several actions during the third quarter of 2015 to address and improve overall operational efficiency. Management anticipates that these actions will result in an annual net cost savings related to reduced compensation, occupancy and other operating costs of approximately $5.4 million. These actions included:
• | Offering a Voluntary Separation Plan ("VSP") to eligible employees. The VSP was designed to provide eligible employees with a variety of benefits, including additional compensation, subsidized COBRA health benefits and optional job placement services. The program was offered to a group of 140 of the Bank’s 705 employees and 78 employees accepted the VSP with agreed-upon exit dates through September 30, 2015. |
• | Consolidating six retail bank branches in the Wisconsin communities of Appleton, Menasha, Oshkosh, Janesville, Franklin and Madison. Customers continue to have convenient and uninterrupted access to their deposit, lending and investment accounts at surrounding Bank locations in each of these markets, as well as access to online banking, ATMs and the Bank’s Contact Center. A total of 21 full- and part-time positions not eligible for the VSP were eliminated through the six branch consolidation. |
• | Creating a new Universal Banker staffing model in the Bank’s branch delivery system to address consumer shift towards digital products and services which resulted in lower transaction volumes. The Universal Banker can perform most branch transactions for customers resulting in improved customer service. The Universal Bank staffing model has a core of employees who can process teller transactions, open new accounts and provide customer service. This core group of employees is further supported with one or more customer service associates. |
As a result of these operational efficiency measures, the Bank incurred one-time costs of $3.8 million, composed primarily of employment severance and asset disposition costs. A gain of $1.4 million was recorded for the sale of the Appleton Fox River Drive branch building.
Deferred Tax Asset Valuation
81
During September 2009, the Company established a full deferred tax asset valuation allowance covering its federal and state tax loss carryforwards. As a result of management’s ongoing, periodic assessments of the deferred tax asset position, the Company determined that it is more likely than not it will be able to realize its deferred tax asset, including its entire federal tax loss carryforwards and a significant portion of its state tax loss carryforwards, with the exception of $4.2 million pertaining to certain multi state loss carryforwards, including states in which the Company no longer does business. Therefore, the Company reversed substantially all the deferred tax asset valuation allowance which resulted in the recognition of a $108.9 million income tax benefit, net of current tax provision.
Negative Provision for Loan Losses
The allowance for loan losses is maintained at a level believed appropriate by management to absorb probable and estimable losses inherent in the loan portfolio and is based on: the size and current risk characteristics of the loan portfolio; an assessment of individual impaired loans; actual and anticipated loss experience; and current economic events in specific industries and geographical areas. These economic events include unemployment levels, regulatory guidance and general economic conditions. Determination of the allowance is inherently subjective as it requires significant estimates, including the amounts and timing of expected future cash flows on impaired loans, estimated losses on pools of homogeneous loans based on historical loss experience and consideration of current economic trends, all of which may be susceptible to significant change. Therefore, the allowance for loan losses accounts for elements of imprecision and estimation risk inherent in the calculation.
During the year ended December 31, 2015, after a review of the factors listed above, the Company determined its levels of allowance were no longer warranted. The impact to the allowance for loan losses for the year ended December 31, 2015, was a $29.5 million negative provision for loan losses.
Initial Public Offering
In October 2014, the Company completed its initial public offering (the “IPO”) in which the Company issued and sold 250,000 shares of common stock at a public offering price of $26.00 per share. The Company also granted the underwriters a 30-day option to purchase up to 55,794 additional shares of common stock to cover any over-allotments which was executed for the full amount on October 30, 2014. The Company received net proceeds, which includes the proceeds from the over-allotments, of $5.6 million after deducting underwriting discounts and commissions of $517,000 and other offering expenses totaling $1.8 million. The underwriting discounts, commissions and other offering expenses were deducted against additional paid-in capital and were not included in operating expense of the Company. The Company’s shares are now listed on the Nasdaq Global Market under the symbol “ABCW.” Common shares outstanding at December 31, 2015 were 9,597,392.
Bankruptcy Proceedings and Emergence from Chapter 11
The Company experienced significant operating losses beginning in 2009, significant levels of criticized assets, depleted levels of capital and difficulty in raising additional capital necessary to stabilize the Bank as required by banking regulators, primarily due to the economic downturn that began in 2008. As a result, in 2009 both the Company and the Bank became subject to Orders to Cease and Desist. Also, the Company owed $183.5 million under a credit facility, which the Company was unable to repay. The Company issued $110 million of Fixed Rate Cumulative Perpetual Preferred Stock, Series B (the “TARP Preferred Stock”) and warrants to purchase common stock (the “TARP Warrant) to the United States Department of the Treasury (the “Treasury”) as part of the Troubled Asset Relief Program (“TARP”) in 2009. In order to facilitate the restructuring and the recapitalization of the Bank, on August 12, 2013 (the “Petition Date”), the Company filed a voluntary petition for relief (the “Chapter 11 Case”) under the provisions of Chapter 11 of title 11 of the United States Code, 11 U.S.C. §§ 101, et seq., in the United States Bankruptcy Court for the Western District of Wisconsin (the “Bankruptcy Court”) to implement a “pre-packaged” plan of reorganization (the “Plan of Reorganization”).
Plan of Reorganization
Pursuant to the Plan of Reorganization, the following transactions (collectively, the “Recapitalization”) were consummated on September 27, 2013 (the “Effective Date”)
• | Delaware Conversion and Reverse Stock Split |
Pursuant to the Plan of Reorganization, on September 25, 2013, the Company (i) converted from a Wisconsin Corporation to a Delaware Corporation in accordance with Section 265 of the Delaware General Company Law and (ii) filed a Certificate of Incorporation with the Secretary of State of the State of Delaware (the “Amended Charter”), to, among other things, declassify the Board, increase the number of authorized shares of common stock and adopt certain restrictions on acquisitions and dispositions of securities. The Amended Charter provides for (a) $2,000,000,000 shares of authorized common stock, par value $0.01 per share (the “Common Stock”), and
82
(b) 1,000,000 shares of authorized preferred stock, par value $0.01 per share. A reverse stock split was effected and a subsequent amendment to the corporate charter was filed on October 2, 2013 providing for 11,900,000 shares of authorized common stock, par value $0.01 per share and 100,000 shares of authorized preferred stock, par value $0.01.
• | Private Placements |
In connection with the Plan of Reorganization, the Company entered into stock purchase agreements (the “Investor SPAs”) with investors for the purchase and sale of 1,750,000,000 shares of our common stock (adjusted to 8,750,000 shares on October 2, 2013 as a result of the Reverse Stock Split) at a pre-Reverse Stock Split purchase price of $0.10 per share (implying a $20.00 per share price after giving effect to the Reverse Stock Split) and received gross proceeds of $175.0 million (the “Private Placements”) and incurred transaction costs of $14.4 million. The investors were certain of our officers and directors and institutional investors.
• | TARP Exchange |
On January 30, 2009, pursuant to the Treasury’s Capital Purchase Program, the Company issued and sold to the Treasury 110,000 shares of Fixed Rate Cumulative Perpetual Preferred Stock, Series B of the Company with an aggregate liquidation preference of $110.0 million (the “TARP Preferred Stock”). In addition, the Company issued to the Treasury a warrant (the “TARP Warrant”) to purchase up to 7,399,103 shares of our common stock, par value $0.10 per share (the “Legacy Common Stock”), at an initial per share exercise price of $2.23. Pursuant to the Plan of Reorganization, the Company, on the Effective Date (i) exchanged the TARP Preferred Stock for 60,000,000 shares of common stock (adjusted to 300,000 common shares as a result of the Reverse Stock Split) of common stock (the “Treasury Issuance”) and (ii) cancelled a warrant (the “TARP Warrant”) to purchase up to 7,399,103 shares of our pre-Reorganization common stock, par value $0.10 per share (the “Legacy Common Stock”) in its entirety (collectively, the “TARP Exchange”). The difference between the Common Stock issued and the Preferred Stock redeemed of $104.0 million was recorded as an increase directly to retained earnings. The $104.0 million represents a return from the Preferred stockholder thereby increasing the amount available to common stockholders for purposes of earnings per share.
Following the effectiveness of the Plan of Reorganization, the Treasury sold to certain institutional investors (the “Secondary Investors”) all of the shares of Common Stock delivered to the Treasury in connection with the Treasury Issuance at a purchase price equal to $0.10 per share (the “Secondary Treasury Sales”) under the securities purchase agreements, dated as of September 19, 2013, among the Treasury, the Secondary Investor and (with respect to certain provisions) the Company. In connection with the Secondary Treasury Sales, the Company entered into secondary sale purchaser agreements with the Secondary Investors pursuant to which the company made certain representations and warranties to the Investor and provided rights to the Secondary Investors similar to the rights provided to Investors under the Stock Purchase Agreements. The Treasury then sold all of the shares of common stock delivered and received gross proceeds of $6.0 million and ceased to be a stockholder.
• | Cancellation of Legacy Common Stock |
On the Effective Date of the Plan of Reorganization, all shares of the outstanding Legacy Common Stock including those shares held as treasury stock and in any stock incentive plans were cancelled for no consideration.
• | Senior Debt Settlement |
The aggregate amount of obligations under the Credit Agreement was approximately $183.5 million as of August 12, 2013 (including with respect to gross loans, accrued but unpaid interest thereon and all administrative and other fees or penalties). On the Effective Date the Company satisfied all of our obligations under the Credit Agreement by a cash payment to the Lenders of $49.0 million (plus expense reimbursement as contemplated by the Credit Agreement). As a result of the transaction, the Company recognized a gain on extinguishment of debt of $134.5 million. All other claims were unaffected by, and were paid in full under, the Plan of Reorganization.
Emergence Accounting
Upon emergence, we determined we did not meet the requirements to apply fresh start reporting under applicable accounting standards because we did not meet the solvency criteria of ASC Topic 852-10-45-19. The reorganization value immediately before the date of confirmation was greater than the total of all post-petition liabilities and allowed claims and, therefore, indicative of not meeting the test to require fresh start accounting under ASC Topic 852 - Reorganizations. As of the date of confirmation, the estimated enterprise value (or reorganization value) was approximately $2.2 billion. The Company utilized
83
the equity value using the income and market approach to approximate fair value. Accordingly, the consolidated financial statements do not include fresh start reporting, whereby the Company would have to revalue all of its assets and liabilities. At the time of filing for the Chapter 11 Case, the Company identified liabilities subject to compromise of $188.3 million, which included the outstanding Credit Agreement of approximately $116.3 million, interest and fees due under the Credit Agreement of $67.2 million and $4.8 million in other liabilities.
Lifting of the Regulatory Orders
The Bank’s primary regulator is the Office of the Comptroller of the Currency (“OCC”). The Federal Reserve is the primary regulator of the Company. On June 26, 2009, the Company and the Bank each consented to the issuance of an Order to Cease and Desist (the “Company Order” and the “Bank Order,” respectively). On August 31, 2010, a Prompt and Corrective Action Directive (“PCA Directive”) was issued for the Bank. The Company Order required among other things a larger capital ratio and the submission of a capital restoration plan along with a revised business plan.
On April 2, 2014, the Bank was notified that the Bank Order and the PCA Directive were terminated. On July 31, 2014, the Company was notified that the Company Order was terminated.
Note 3 – Cash and Due From Banks
The Bank is required to maintain reserve balances in cash or on deposit with the Federal Reserve Bank based on a percentage of deposits. The average amount of required reserve balances was approximately $1.0 million and $1.3 million, for the year ended December 31, 2015 and 2014, respectively. The Bank met the required reserves with cash balances in the branch system.
The Bank is required to maintain an account with its official check service provider equal to one day’s average remittance. The balance in this restricted account for the years ended December 31, 2015 and 2014, was $2.5 million for both periods.
The nature of the Company’s business requires that it maintain amounts due from banks and federal funds sold which, at times, may exceed federally insured limits. Management monitors these correspondent relationships and has not experienced any losses in such accounts.
Note 4 – Investment Securities
The amortized cost and fair value of investment securities are as follows:
Amortized Cost | Gross Unrealized | Fair Value | |||||||||||||
Gains | Losses | ||||||||||||||
(In thousands) | |||||||||||||||
December 31, 2015 | |||||||||||||||
Available for sale: | |||||||||||||||
U.S. government sponsored and federal agency obligations | $ | 3,130 | $ | 6 | $ | — | $ | 3,136 | |||||||
Mortgage backed securities | 342,211 | 350 | (4,177 | ) | 338,384 | ||||||||||
Other securities | 1 | 2 | — | 3 | |||||||||||
$ | 345,342 | $ | 358 | $ | (4,177 | ) | $ | 341,523 | |||||||
Held to maturity: | |||||||||||||||
Corporate bonds | $ | 15,492 | $ | — | $ | (70 | ) | $ | 15,422 | ||||||
December 31, 2014 | |||||||||||||||
Available for sale: | |||||||||||||||
U.S. government sponsored and federal agency obligations | $ | 3,245 | $ | 16 | $ | — | $ | 3,261 | |||||||
Mortgage backed securities | 293,755 | 822 | (3,242 | ) | 291,335 | ||||||||||
Other securities | 1 | 2 | — | 3 | |||||||||||
$ | 297,001 | $ | 840 | $ | (3,242 | ) | $ | 294,599 | |||||||
84
The table below presents the fair value and gross unrealized losses of securities in a loss position, aggregated by investment category and length of time that individual holdings have been in a continuous unrealized loss position at December 31, 2015 and 2014:
Unrealized Loss Position | |||||||||||||||||||||||
Less than 12 months | 12 months or More | Total | |||||||||||||||||||||
Fair Value | Unrealized Loss | Fair Value | Unrealized Loss | Fair Value | Unrealized Loss | ||||||||||||||||||
(In thousands) | |||||||||||||||||||||||
December 31, 2015 | |||||||||||||||||||||||
Available for sale: | |||||||||||||||||||||||
Mortgage backed securities | $ | 223,464 | $ | (2,138 | ) | $ | 74,678 | $ | (2,039 | ) | $ | 298,142 | $ | (4,177 | ) | ||||||||
Held to maturity: | |||||||||||||||||||||||
Corporate bonds | $ | 15,422 | $ | (70 | ) | $ | — | $ | — | $ | 15,422 | $ | (70 | ) | |||||||||
December 31, 2014 | |||||||||||||||||||||||
Available for sale: | |||||||||||||||||||||||
Mortgage backed securities | $ | 81,135 | $ | (339 | ) | $ | 106,433 | $ | (2,903 | ) | $ | 187,568 | $ | (3,242 | ) | ||||||||
Management evaluates securities for other-than-temporary impairment on a quarterly basis, and more frequently when economic or market concerns warrant such evaluation. To determine if an other-than-temporary impairment exists on a debt security, the Company first determines if (a) it intends to sell the security or (b) it is more likely than not that it will be required to sell the security before its anticipated recovery.
Unrealized losses on available for sale investment securities as of December 31, 2015 and 2014 due to changes in interest rates and other non-credit related factors totaled $4.2 million and $3.2 million, respectively. The number of individual available for sale securities in the tables above totaled 63 at December 31, 2015 and 34 at December 31, 2014 and the number of individual held to maturity securities totaled 4 at December 31, 2015. The Company has analyzed these securities for evidence of other-than-temporary impairment and concluded that no other-than-temporary impairment ("OTTI") exists and that the unrealized losses are properly classified in accumulated other comprehensive income (loss).
At December 31, 2015 and 2014, there were no securities classified as other-than-temporarily impaired. Unrealized other-than-temporary impairment due to credit losses of $64,000 and $23,000 was included in earnings for the year ended December 31, 2014 and for the nine months ended December 31, 2013, respectively. For the year ended December 31, 2014 and for the nine months ended December 31, 2013, respectively, realized losses of $221,000 and $224,000 related to credit issues (i.e. – principal reduced without a receipt of cash) were incurred that were previously recognized in earnings as unrealized OTTI. During 2014, these other-than-temporarily impaired securities were sold at a loss of $37,000.
The following table is a roll forward of the amount of OTTI related to credit losses that have been recognized in earnings for which a portion of impairment was deemed temporary and recognized in other comprehensive income (loss) for the periods presented:
Year Ended December 31, 2014 | Nine Months Ended December 31, 2013 | ||||||
(In thousands) | |||||||
Beginning balance of unrealized OTTI related to credit losses | $ | 801 | $ | 1,002 | |||
Additional unrealized OTTI related to credit losses for which OTTI was previously recognized | 64 | 23 | |||||
Additional debit related OTTI previously recognized for OTTI recovery during the period | 4 | 5 | |||||
Credit related OTTI previously recognized for securities sold during the period | (644 | ) | — | ||||
Decrease for realized amount of credit losses for which unrealized credit related OTTI was previously recognized | (225 | ) | (229 | ) | |||
Ending balance of unrealized OTTI related to credit losses | $ | — | $ | 801 | |||
85
The cost of investment securities sold is determined using the specific identification method. Sales of investment securities available for sale are summarized below:
Year Ended December 31, 2015 | Year Ended December 31, 2014 | Nine Months Ended December 31, 2013 | |||||||||
(In thousands) | |||||||||||
Proceeds from sales | $ | 14,647 | $ | 17,557 | $ | 356 | |||||
Gross gains | $ | 65 | $ | 825 | $ | 292 | |||||
Gross losses | (2 | ) | (79 | ) | — | ||||||
Net gain on sales | $ | 63 | $ | 746 | $ | 292 | |||||
At December 31, 2015 and 2014, investment securities with a fair value of approximately $92.3 million and $121.5 million, respectively, were pledged to secure deposits, borrowings and for other purposes as permitted or required by law.
The fair values of investment securities by contractual maturity at December 31, 2015 are shown below. Actual maturities may differ from contractual maturities because issuers have the right to call or prepay obligations with or without call or prepayment penalties.
Available for Sale | Held to Maturity | ||||||||||||||
Amortized Cost | Fair Value | Amortized Cost | Fair Value | ||||||||||||
(In thousands) | |||||||||||||||
Within 1 Year | $ | 3 | $ | 3 | $ | — | $ | — | |||||||
After 1 Year through 5 Years | 3,254 | 3,263 | — | — | |||||||||||
After 5 Years through 10 Years | 9,736 | 9,675 | 15,492 | 15,422 | |||||||||||
After Ten Years | 332,349 | 328,582 | — | — | |||||||||||
Total | $ | 345,342 | $ | 341,523 | $ | 15,492 | $ | 15,422 | |||||||
In 2008, the Company received proceeds in connection with shares redeemed as part of the Visa, Inc. initial public offering. The Bank was a member of the former Visa, Inc. payments organization and was issued shares when Visa, Inc. was organized. Approximately 39% of those shares were redeemed in connection with the public offering. The remaining shares are restricted because of unsettled litigation pending against Visa, Inc. At its discretion, Visa, Inc. may redeem additional shares in order to resolve pending litigation. The restriction expires upon resolution of the pending litigation. Accordingly, the Company has recorded these shares at zero in the consolidated balance sheets. Upon expiration of the restriction, the Company expects to record the fair value of the remaining shares.
86
Note 5 – Loans Held for Investment, net
Loans held for investment, net consist of the following:
December 31, | |||||||
2015 | 2014 | ||||||
(In thousands) | |||||||
Residential | $ | 529,775 | $ | 531,131 | |||
Commercial and industrial | 25,199 | 16,514 | |||||
Commercial real estate: | |||||||
Land and construction | 143,419 | 106,436 | |||||
Multi-family | 318,313 | 265,735 | |||||
Retail/office | 161,497 | 155,095 | |||||
Other commercial real estate | 143,696 | 156,243 | |||||
Total commercial real estate | 766,925 | 683,509 | |||||
Consumer: | |||||||
Education | 91,671 | 108,384 | |||||
Other consumer | 227,283 | 233,482 | |||||
Total consumer loans | 318,954 | 341,866 | |||||
Total gross loans | 1,640,853 | 1,573,020 | |||||
Unamortized loan fees, net | (753 | ) | (1,544 | ) | |||
Loans held for investment | 1,640,100 | 1,571,476 | |||||
Allowance for loan losses | (25,147 | ) | (47,037 | ) | |||
Loans held for investment, net | $ | 1,614,953 | $ | 1,524,439 | |||
Residential Loans
At December 31, 2015, $529.8 million, or 32.3%, of the total gross loans consisted of residential loans, substantially all of which were 1-to-4 family dwellings. Residential loans consist of both adjustable and fixed-rate loans. The adjustable-rate loans currently in the portfolio were originated with up to 30-year maturities and terms which provide for annual increases or decreases of the rate on the loans, based on a designated index. These rate changes are generally subject to a limit of 2% per adjustment and an aggregate 6% adjustment over the life of the loan. These loans are documented according to standard industry practices. The Company does not originate negative amortization and option payment adjustable rate mortgages.
At December 31, 2015, approximately $305.7 million, or 57.7%, of the held for investment residential gross loans consisted of loans with adjustable interest rates. At December 31, 2015, approximately $224.1 million, or 42.3%, of the held for investment residential gross loans consisted of loans with fixed rates of interest. Although these loans generally provide for repayments of principal over a fixed period of 10 to 30 years, because of prepayments and due-on-sale clauses, such loans generally remain outstanding for a shorter period of time.
Commercial and Industrial Loans
The Company originates loans for commercial and business purposes, including issuing letters of credit. At December 31, 2015, the commercial and industrial gross loans amounted to $25.2 million, or 1.5%, of the total gross loans.
Commercial Real Estate Loans
At December 31, 2015, $766.9 million of gross loans were secured by commercial real estate, which represented 46.7% of the total gross loans. The origination of such loans is generally limited to the Company’s primary market area.
Consumer Loans
The Company offers consumer loans in order to provide a wider range of financial services to its customers. Consumer loans consist of education loans and other consumer loans. At December 31, 2015, $319.0 million, or 19.5%, of the total gross loans consisted of consumer loans.
Approximately $91.7 million, or 5.6%, of the total gross loans at December 31, 2015 consisted of education loans. The origination of student loans was discontinued October 1, 2010 following the March 2010 law ending loan guarantees provided by the U.S. Department of Education. Both the principal amount of an education loan and interest thereon, up to 97% of the balance of the loan, are generally guaranteed by the Great Lakes Higher Education Company. Education loans may be sold to
87
the U.S. Department of Education or to other investors. No education loans were sold during the years ended December 31, 2015 and 2014.
Other consumer loans primarily consist of home equity loans and lines. The primary home equity loan product has an adjustable rate that is linked to the prime interest rate and is secured by a mortgage, either a primary or a junior lien, on the borrower’s residence. In addition, other consumer loans include vehicle loans and other secured and unsecured loans made for a variety of consumer purposes.
Credit is extended to Bank customers through credit cards issued by a third party, ELAN Financial Services ("ELAN"), pursuant to an agency arrangement. A new agreement was signed with ELAN on December 31, 2014, effective January 1, 2015, providing the Company an origination fee for each card sold. The Bank also receives a monthly fee from ELAN resulting from the performance of the originated portfolio, based on 11% of the interest income and 25% of the interchange income. The Bank is no longer exposed to credit risk from the underlying consumer credit. As part of the new agreement, the Bank agreed to sell back to ELAN its participation in outstanding credit card balances totaling $6.6 million with no gain or loss recognized. This transaction settled on February 10, 2015.
Allowances for Loan Losses
The following table presents the allowance for loan losses by component:
December 31, | |||||||
2015 | 2014 | ||||||
(In thousands) | |||||||
General reserve | $ | 20,840 | $ | 38,596 | |||
Specific reserve | 4,307 | 8,441 | |||||
Total allowance for loan losses | $ | 25,147 | $ | 47,037 | |||
The following table presents activity in the allowance for loan losses by portfolio segment:
Residential | Commercial and Industrial | Commercial Real Estate | Consumer | Total | |||||||||||||||
(In thousands) | |||||||||||||||||||
For the Year Ended: | |||||||||||||||||||
December 31, 2015 | |||||||||||||||||||
Beginning balance | $ | 10,684 | $ | 1,436 | $ | 28,716 | $ | 6,201 | $ | 47,037 | |||||||||
Provision | (6,025 | ) | (3,096 | ) | (18,538 | ) | (1,837 | ) | (29,496 | ) | |||||||||
Charge-offs | (1,112 | ) | (106 | ) | (1,696 | ) | (1,105 | ) | (4,019 | ) | |||||||||
Recoveries | 1,569 | 2,122 | 7,502 | 432 | 11,625 | ||||||||||||||
Ending balance | $ | 5,116 | $ | 356 | $ | 15,984 | $ | 3,691 | $ | 25,147 | |||||||||
Allowance for loan losses: | |||||||||||||||||||
Associated with impaired loans | $ | 1,421 | $ | 118 | $ | 2,218 | $ | 550 | $ | 4,307 | |||||||||
Associated with all other loans | 3,695 | 238 | 13,767 | 3,140 | 20,840 | ||||||||||||||
Total | $ | 5,116 | $ | 356 | $ | 15,985 | $ | 3,690 | $ | 25,147 | |||||||||
Loans: | |||||||||||||||||||
Impaired loans individually evaluated | $ | 11,659 | $ | 184 | $ | 29,692 | $ | 2,367 | $ | 43,902 | |||||||||
All other loans | 518,116 | 25,015 | 737,233 | 316,587 | 1,596,951 | ||||||||||||||
Total | $ | 529,775 | $ | 25,199 | $ | 766,925 | $ | 318,954 | $ | 1,640,853 | |||||||||
For the Year Ended: | |||||||||||||||||||
December 31, 2014 | |||||||||||||||||||
Beginning balance | $ | 13,059 | $ | 6,402 | $ | 42,065 | $ | 3,656 | $ | 65,182 | |||||||||
Provision | (599 | ) | (2,622 | ) | (6,129 | ) | 4,765 | (4,585 | ) | ||||||||||
Charge-offs | (2,212 | ) | (5,220 | ) | (16,041 | ) | (2,599 | ) | (26,072 | ) | |||||||||
Recoveries | 436 | 2,876 | 8,821 | 379 | 12,512 | ||||||||||||||
88
Ending balance | $ | 10,684 | $ | 1,436 | $ | 28,716 | $ | 6,201 | $ | 47,037 | |||||||||
Allowance for loan losses: | |||||||||||||||||||
Associated with impaired loans | $ | 1,400 | $ | 140 | $ | 6,475 | $ | 426 | $ | 8,441 | |||||||||
Associated with all other loans | 9,284 | 1,296 | 22,241 | 5,775 | 38,596 | ||||||||||||||
Total | $ | 10,684 | $ | 1,436 | $ | 28,716 | $ | 6,201 | $ | 47,037 | |||||||||
Loans: | |||||||||||||||||||
Impaired loans individually evaluated | $ | 14,497 | $ | 113 | $ | 79,160 | $ | 1,515 | $ | 95,285 | |||||||||
All other loans | 516,634 | 16,401 | 604,349 | 340,351 | 1,477,735 | ||||||||||||||
Total | $ | 531,131 | $ | 16,514 | $ | 683,509 | $ | 341,866 | $ | 1,573,020 | |||||||||
For the Nine Months Ended: | |||||||||||||||||||
December 31, 2013 | |||||||||||||||||||
Beginning balance | $ | 14,525 | $ | 7,072 | $ | 54,581 | $ | 3,637 | $ | 79,815 | |||||||||
Provision | 2,224 | (599 | ) | (2,942 | ) | 1,592 | 275 | ||||||||||||
Charge-offs | (4,419 | ) | (864 | ) | (13,100 | ) | (1,903 | ) | (20,286 | ) | |||||||||
Recoveries | 729 | 793 | 3,526 | 330 | 5,378 | ||||||||||||||
Ending balance | $ | 13,059 | $ | 6,402 | $ | 42,065 | $ | 3,656 | $ | 65,182 | |||||||||
Allowance for loan losses: | |||||||||||||||||||
Associated with impaired loans | $ | 2,424 | $ | 1,745 | $ | 19,845 | $ | 477 | $ | 24,491 | |||||||||
Associated with all other loans | 10,635 | 4,657 | 22,220 | 3,179 | 40,691 | ||||||||||||||
Total | $ | 13,059 | $ | 6,402 | $ | 42,065 | $ | 3,656 | $ | 65,182 | |||||||||
Loans: | |||||||||||||||||||
Impaired loans individually evaluated | $ | 20,502 | $ | 2,315 | $ | 106,657 | $ | 3,284 | $ | 132,758 | |||||||||
All other loans | 509,275 | 19,276 | 595,698 | 364,547 | 1,488,796 | ||||||||||||||
Total | $ | 529,777 | $ | 21,591 | $ | 702,355 | $ | 367,831 | $ | 1,621,554 | |||||||||
A substantial portion of loans, 99%, are collateralized by real estate in Wisconsin and adjacent states. Accordingly, the ultimate collectability of the loan portfolio is susceptible to changes in real estate market conditions in that area.
89
The following table presents impaired loans segregated by loans with no specific allowance and loans with an allowance by class of loans. The recorded investment amounts represent the gross loan balance less charge-offs. The unpaid principal balance represents the contractual loan balance less any principal payments applied. The interest income recognized column represents all interest income recorded either on a cash or accrual basis after the loan became impaired.
Recorded Investment | Unpaid Principal Balance | Associated Allowance | Average Carrying Amount | Year-to-Date Interest Income Recognized | |||||||||||||||
(In thousands) | |||||||||||||||||||
December 31, 2015 | |||||||||||||||||||
With no specific allowance recorded: | |||||||||||||||||||
Residential | $ | 4,143 | $ | 5,193 | $ | — | $ | 5,303 | $ | 171 | |||||||||
Commercial and industrial | 65 | 88 | — | 16 | 3 | ||||||||||||||
Land and construction | 798 | 1,125 | — | 3,515 | 36 | ||||||||||||||
Multi-family | 10,932 | 11,300 | — | 15,995 | 574 | ||||||||||||||
Retail/office | 2,235 | 2,593 | — | 5,775 | 83 | ||||||||||||||
Other commercial real estate | 1,479 | 2,114 | — | 9,046 | 115 | ||||||||||||||
Education (1) | — | — | — | — | — | ||||||||||||||
Other consumer | 1,105 | 1,218 | — | 1,181 | 69 | ||||||||||||||
Subtotal | $ | 20,757 | $ | 23,631 | $ | — | $ | 40,831 | $ | 1,051 | |||||||||
With an allowance recorded: | |||||||||||||||||||
Residential | $ | 7,516 | $ | 7,551 | $ | 1,421 | $ | 6,843 | $ | 285 | |||||||||
Commercial and industrial | 119 | 119 | 118 | 63 | — | ||||||||||||||
Land and construction | 4,795 | 9,062 | 980 | 3,917 | 181 | ||||||||||||||
Multi-family | 9,027 | 9,027 | 1,166 | 8,421 | 387 | ||||||||||||||
Retail/office | 390 | 390 | 50 | 6,073 | 21 | ||||||||||||||
Other commercial real estate | 36 | 48 | 22 | 168 | — | ||||||||||||||
Education (1) | 191 | 191 | 191 | 104 | — | ||||||||||||||
Other consumer | 1,071 | 1,073 | 359 | 560 | 64 | ||||||||||||||
Subtotal | $ | 23,145 | $ | 27,461 | $ | 4,307 | $ | 26,149 | $ | 938 | |||||||||
Total | |||||||||||||||||||
Residential | $ | 11,659 | $ | 12,744 | $ | 1,421 | $ | 12,146 | $ | 456 | |||||||||
Commercial and industrial | 184 | 207 | 118 | 79 | 3 | ||||||||||||||
Land and construction | 5,593 | 10,187 | 980 | 7,432 | 217 | ||||||||||||||
Multi-family | 19,959 | 20,327 | 1,166 | 24,416 | 961 | ||||||||||||||
Retail/office | 2,625 | 2,983 | 50 | 11,848 | 104 | ||||||||||||||
Other commercial real estate | 1,515 | 2,162 | 22 | 9,214 | 115 | ||||||||||||||
Education (1) | 191 | 191 | 191 | 104 | — | ||||||||||||||
Other consumer | 2,176 | 2,291 | 359 | 1,741 | 133 | ||||||||||||||
$ | 43,902 | $ | 51,092 | $ | 4,307 | $ | 66,980 | $ | 1,989 | ||||||||||
(1) Excludes the guaranteed portion of education loans 90+ days past due with balance of $6.2 million and average carrying amounts totaling $6.0 million at December 31, 2015.
90
Recorded Investment | Unpaid Principal Balance | Associated Allowance | Average Carrying Amount | Year-to-Date Interest Income Recognized | |||||||||||||||
(In thousands) | |||||||||||||||||||
December 31, 2014 | |||||||||||||||||||
With no specific allowance recorded: | |||||||||||||||||||
Residential | $ | 4,992 | $ | 6,406 | $ | — | $ | 5,455 | $ | 165 | |||||||||
Commercial and industrial | — | 268 | — | 843 | 26 | ||||||||||||||
Land and construction | 9,421 | 19,334 | — | 12,192 | 208 | ||||||||||||||
Multi-family | 17,614 | 19,863 | — | 17,979 | 780 | ||||||||||||||
Retail/office | 7,840 | 15,581 | — | 8,040 | 354 | ||||||||||||||
Other commercial real estate | 13,972 | 15,318 | — | 14,617 | 467 | ||||||||||||||
Education (1) | 205 | 205 | — | 101 | — | ||||||||||||||
Other consumer | 469 | 845 | — | 1,003 | 89 | ||||||||||||||
Subtotal | $ | 54,513 | $ | 77,820 | $ | — | $ | 60,230 | $ | 2,089 | |||||||||
With an allowance recorded (2): | |||||||||||||||||||
Residential | $ | 9,505 | $ | 9,671 | $ | 1,400 | $ | 8,574 | $ | 403 | |||||||||
Commercial and industrial | 113 | 236 | 140 | 111 | 1 | ||||||||||||||
Land and construction | 8,362 | 12,536 | 3,657 | 4,440 | 180 | ||||||||||||||
Multi-family | 11,641 | 11,641 | 1,308 | 10,465 | 485 | ||||||||||||||
Retail/office | 9,387 | 9,566 | 1,391 | 8,207 | 356 | ||||||||||||||
Other commercial real estate | 923 | 936 | 119 | 854 | 17 | ||||||||||||||
Education (1) | — | — | — | — | — | ||||||||||||||
Other consumer | 841 | 841 | 426 | 617 | 48 | ||||||||||||||
Subtotal | $ | 40,772 | $ | 45,427 | $ | 8,441 | $ | 33,268 | $ | 1,490 | |||||||||
Total | |||||||||||||||||||
Residential | $ | 14,497 | $ | 16,077 | $ | 1,400 | $ | 14,029 | $ | 568 | |||||||||
Commercial and industrial | 113 | 504 | 140 | 954 | 27 | ||||||||||||||
Land and construction | 17,783 | 31,870 | 3,657 | 16,632 | 388 | ||||||||||||||
Multi-family | 29,255 | 31,504 | 1,308 | 28,444 | 1,265 | ||||||||||||||
Retail/office | 17,227 | 25,147 | 1,391 | 16,247 | 710 | ||||||||||||||
Other commercial real estate | 14,895 | 16,254 | 119 | 15,471 | 484 | ||||||||||||||
Education (1) | 205 | 205 | — | 101 | — | ||||||||||||||
Other consumer | 1,310 | 1,686 | 426 | 1,620 | 137 | ||||||||||||||
$ | 95,285 | $ | 123,247 | $ | 8,441 | $ | 93,498 | $ | 3,579 | ||||||||||
(1) | Excludes the guaranteed portion of education loans 90+ days past due with balance of $6.6 million and average carrying amounts totaling $7.7 million at December 31, 2014. |
(2) | Includes ratio-based allowance for loan losses of $0.5 million associated with loans totaling $1.9 million at December 31, 2014, for which individual reviews have not been completed but an allowance established based on the ratio of allowance for loan losses to gross loans individually reviewed, by class of loan. |
91
The average recorded investment in impaired loans and interest income recognized on impaired loans follows:
Year Ended December 31, 2015 | Year Ended December 31, 2014 | Nine Months Ended December 31, 2013 | |||||||||||||||||||||
Average Carrying Amount | Interest Income Recognized | Average Carrying Amount | Interest Income Recognized | Average Carrying Amount | Interest Income Recognized | ||||||||||||||||||
(In thousands) | |||||||||||||||||||||||
Residential | $ | 12,146 | $ | 456 | $ | 14,029 | $ | 568 | $ | 18,847 | $ | 344 | |||||||||||
Commercial and industrial | 79 | 3 | 954 | 27 | 992 | 316 | |||||||||||||||||
Land and construction | 7,432 | 217 | 16,632 | 388 | 19,973 | 142 | |||||||||||||||||
Multi-family | 24,416 | 961 | 28,444 | 1,265 | 11,456 | 233 | |||||||||||||||||
Retail/office | 11,848 | 104 | 16,247 | 710 | 25,988 | 604 | |||||||||||||||||
Other commercial real estate | 9,214 | 115 | 15,471 | 484 | 14,821 | 312 | |||||||||||||||||
Education | 104 | — | 101 | — | 343 | — | |||||||||||||||||
Other consumer | 1,741 | 133 | 1,620 | 137 | 3,031 | 146 | |||||||||||||||||
$ | 66,980 | $ | 1,989 | $ | 93,498 | $ | 3,579 | $ | 95,451 | $ | 2,097 | ||||||||||||
Although the Company is currently not committed to lend any additional funds on impaired loans in accordance with the original terms of these loans, it is not legally obligated to, and will cautiously disburse additional funds on any loans while in nonaccrual status or if the borrower is in default.
The following table presents the aging of the recorded investment in past due loans by class of loans:
Days Past Due | |||||||||||||||||||
30-59 | 60-89 | 90 or More | Current | Total | |||||||||||||||
(In thousands) | |||||||||||||||||||
December 31, 2015 | |||||||||||||||||||
Residential | $ | 663 | $ | 58 | $ | 883 | $ | 528,171 | $ | 529,775 | |||||||||
Commercial and industrial | 223 | 177 | 149 | 24,650 | 25,199 | ||||||||||||||
Land and construction | 910 | — | 267 | 142,242 | 143,419 | ||||||||||||||
Multi-family | — | — | — | 318,313 | 318,313 | ||||||||||||||
Retail/office | — | 398 | 791 | 160,308 | 161,497 | ||||||||||||||
Other commercial real estate | — | 315 | 83 | 143,298 | 143,696 | ||||||||||||||
Education | 2,700 | 2,097 | 6,375 | 80,499 | 91,671 | ||||||||||||||
Other consumer | 529 | 84 | 541 | 226,129 | 227,283 | ||||||||||||||
$ | 5,025 | $ | 3,129 | $ | 9,089 | $ | 1,623,610 | $ | 1,640,853 | ||||||||||
December 31, 2014 | |||||||||||||||||||
Residential | $ | 1,186 | $ | 802 | $ | 2,995 | $ | 526,148 | $ | 531,131 | |||||||||
Commercial and industrial | 205 | — | 196 | 16,113 | 16,514 | ||||||||||||||
Land and construction | 267 | 29 | 1,111 | 105,029 | 106,436 | ||||||||||||||
Multi-family | — | — | 3,518 | 262,217 | 265,735 | ||||||||||||||
Retail/office | — | — | 2,172 | 152,923 | 155,095 | ||||||||||||||
Other commercial real estate | — | — | 3,011 | 153,232 | 156,243 | ||||||||||||||
Education | 3,505 | 2,140 | 6,818 | 95,921 | 108,384 | ||||||||||||||
Other consumer | 632 | 126 | 517 | 232,207 | 233,482 | ||||||||||||||
$ | 5,795 | $ | 3,097 | $ | 20,338 | $ | 1,543,790 | $ | 1,573,020 | ||||||||||
Non-accrual loans were $15.3 million and $35.1 million as of December 31, 2015 and 2014, respectively. The Company has experienced a significant reduction in delinquencies since December 31, 2014 primarily due to improving credit conditions and $3.3 million of loans moving to OREO. The Company has $6.2 million of education loans past due 90 days or more at December 31, 2015 that are still accruing interest due to the approximate 97% guarantee provided by governmental agencies. Loans less than 90 days delinquent may be placed on non-accrual status when the probability of collection of principal and interest is deemed to be insufficient to warrant further accrual.
92
Credit Quality Indicators:
The Company classifies commercial and industrial loans and commercial real estate loans into risk categories based on relevant information about the ability of borrowers to service their debt such as: current financial information, historical payment experience, credit documentation, public information and current economic trends, among other factors. This analysis is updated on a monthly basis. The following definitions are used for risk ratings:
Pass. Loans classified as pass represent assets that are evaluated and are performing under the stated terms.
Watch. Loans classified as watch possess potential weaknesses that require management attention, but do not yet warrant adverse classification. These loans are treated the same as loans classified as “Pass” for reporting purposes.
Special Mention. Loans classified as special mention exhibit material negative financial trends due to company specific or industry conditions which, if not corrected or mitigated, threaten their capacity to meet current or continuing debt obligations.
Substandard. Loans classified as substandard are inadequately protected by the current net worth, paying capacity of the obligor, or by the collateral pledged. Substandard assets must have a well-defined weakness or weaknesses that jeopardize the liquidation of the debt.
Non-Accrual. Loans classified as non-accrual have the weaknesses of those classified as Substandard, with the added characteristic that the weaknesses make collection or liquidation in full, on the basis of currently existing facts, conditions and values, highly questionable and improbable.
The risk category of loans by class of loans, and based on the most recent analysis performed, is as follows:
Pass (1) | Special Mention | Substandard | Non-Accrual | Total Gross Loans | |||||||||||||||
(In thousands) | |||||||||||||||||||
December 31, 2015 | |||||||||||||||||||
Commercial and industrial | $ | 24,364 | $ | — | $ | 674 | $ | 161 | $ | 25,199 | |||||||||
Commercial real estate: | |||||||||||||||||||
Land and construction | 137,383 | — | 579 | 5,457 | 143,419 | ||||||||||||||
Multi-family | 315,366 | — | 1,749 | 1,198 | 318,313 | ||||||||||||||
Retail/office | 156,737 | 274 | 3,121 | 1,365 | 161,497 | ||||||||||||||
Other | 131,647 | — | 10,903 | 1,146 | 143,696 | ||||||||||||||
$ | 765,497 | $ | 274 | $ | 17,026 | $ | 9,327 | $ | 792,124 | ||||||||||
Percent of total gross loans | 96.6 | % | — | % | 2.2 | % | 1.2 | % | 100.0 | % | |||||||||
December 31, 2014 | |||||||||||||||||||
Commercial and industrial | $ | 14,990 | $ | — | $ | 1,491 | $ | 33 | $ | 16,514 | |||||||||
Commercial real estate: | |||||||||||||||||||
Land and construction | 85,425 | 946 | 2,870 | 17,195 | 106,436 | ||||||||||||||
Multi-family | 261,254 | — | 915 | 3,566 | 265,735 | ||||||||||||||
Retail/office | 143,260 | 4,753 | 3,112 | 3,970 | 155,095 | ||||||||||||||
Other | 145,995 | 174 | 6,452 | 3,622 | 156,243 | ||||||||||||||
$ | 650,924 | $ | 5,873 | $ | 14,840 | $ | 28,386 | $ | 700,023 | ||||||||||
Percent of total gross loans | 93.0 | % | 0.8 | % | 2.1 | % | 4.1 | % | 100.0 | % | |||||||||
(1) | Includes TDR accruing loans. |
93
Residential and consumer loans are managed on a pool basis due to their homogeneous nature. Loans that are delinquent 90 days or more are considered non-accrual. The following table presents the residential and consumer gross loans based on accrual status:
December 31, 2015 | December 31, 2014 | ||||||||||||||||||||||
Accrual (1) | Non-Accrual | Total Gross Loans | Accrual (1) | Non-Accrual | Total Gross Loans | ||||||||||||||||||
(In thousands) | |||||||||||||||||||||||
Residential | $ | 524,780 | $ | 4,995 | $ | 529,775 | $ | 525,258 | $ | 5,873 | $ | 531,131 | |||||||||||
Consumer | |||||||||||||||||||||||
Education (2) | 91,480 | 191 | 91,671 | 108,179 | 205 | 108,384 | |||||||||||||||||
Other consumer | 226,487 | 796 | 227,283 | 232,831 | 651 | 233,482 | |||||||||||||||||
$ | 842,747 | $ | 5,982 | $ | 848,729 | $ | 866,268 | $ | 6,729 | $ | 872,997 | ||||||||||||
(1) | Accrual residential and consumer loans includes substandard rated loans including TDR-accrual. |
(2) | Non-accrual education loans represent the portion of these loans 90+ days past due that are not covered by a guarantee provided by government agencies that is limited to approximately 97% of the outstanding balance. |
Troubled Debt Restructurings
Modifications of loan terms in a TDR are generally in the form of an extension of payment terms or lowering of the interest rate, although occasionally the Company has reduced the outstanding principal balance.
Loans modified in a troubled debt restructuring that are on non-accrual status at the time of modification will remain on non-accrual status for a period of at least six months, or longer period, sufficient to prove that the borrower demonstrates that they can make the payments under the modified terms. If after this period, the borrower has made payments in accordance with the modified terms, the loan is returned to accrual status but retains its designation as a TDR. Once a TDR loan is returned to accrual, further review of the credit could take place resulting in a further upgrade into the pass category but still remaining as a TDR.
The following table presents information related to loans modified in a troubled debt restructuring by class:
Number of Modifications (1) | Gross Loans (2) (at beginning of period) | Gross Loans (2) (at period end) | ||||||||
(Dollars in thousands) | ||||||||||
For the Year Ended December 31, 2015 | ||||||||||
Residential | 7 | $ | 549 | $ | 582 | |||||
Commercial and industrial | 1 | 12 | 11 | |||||||
Retail/office | 1 | 752 | 510 | |||||||
Other consumer | 24 | 1,259 | 1,251 | |||||||
33 | $ | 2,572 | $ | 2,354 | ||||||
For the Year Ended December 31, 2014 | ||||||||||
Residential | 13 | $ | 1,632 | $ | 1,620 | |||||
Commercial and industrial | 2 | 64 | 97 | |||||||
Land and construction | 3 | 427 | 410 | |||||||
Multi-family | 3 | 1,283 | 1,183 | |||||||
Other commercial real estate | 2 | 251 | 256 | |||||||
Other consumer | 11 | 353 | 305 | |||||||
34 | $ | 4,010 | $ | 3,871 | ||||||
(1) | Loans modified in a TDR that were fully paid down, charged-off or foreclosed upon by period end are not reported in this table. |
(2) | Gross loans is inclusive of all partial paydowns and charge-offs since the modification date. |
94
The following tables present gross loans modified in a troubled debt restructuring during the years ended December 31, 2015 and 2014 by class and by type of modification:
Principal and Interest to Interest Only | Interest Rate Reduction | Interest Rate Reduction To Below Market Rate (1) | Other (2) | Total | |||||||||||||||
(In thousands) | |||||||||||||||||||
For the Year Ended December 31, 2015 | |||||||||||||||||||
Residential | $ | — | $ | 380 | $ | 78 | $ | 124 | $ | 582 | |||||||||
Commercial and industrial | — | 11 | — | — | 11 | ||||||||||||||
Retail/office | — | — | — | 510 | 510 | ||||||||||||||
Other consumer | — | 454 | 210 | 587 | 1,251 | ||||||||||||||
$ | — | $ | 845 | $ | 288 | $ | 1,221 | $ | 2,354 | ||||||||||
For the Year Ended December 31, 2014 | |||||||||||||||||||
Residential | $ | 175 | $ | 788 | $ | 119 | $ | 538 | $ | 1,620 | |||||||||
Commercial and industrial | — | — | — | 97 | 97 | ||||||||||||||
Land and construction | — | 63 | — | 347 | 410 | ||||||||||||||
Multi-family | — | — | 921 | 262 | 1,183 | ||||||||||||||
Other commercial real estate | — | — | 214 | 42 | 256 | ||||||||||||||
Other consumer | — | 252 | — | 53 | 305 | ||||||||||||||
$ | 175 | $ | 1,103 | $ | 1,254 | $ | 1,339 | $ | 3,871 | ||||||||||
(1) | Includes loans modified at below market rates for borrowers with similar risk profiles and having comparable loan terms and conditions. Market rates are determined by reference to internal new loan pricing grids that specify credit spreads based on loan risk rating and term to maturity. |
(2) | Other modifications primarily include providing for the deferral of interest currently due to the new maturity date of the loan. |
There were no loans modified in a troubled debt restructuring during the years ended December 31, 2015 and 2014, that subsequently defaulted.
Pledged Loans
At December 31, 2015 and 2014, residential, multi-family, education and other consumer loans with unpaid principal balances of approximately $661.8 million and $726.6 million, respectively were pledged to secure borrowings and for other purposes as permitted or required by law. Certain real-estate related loans are pledged as collateral for FHLB borrowings. See Note 10 -Borrowed Funds.
Related Party Loans
In the ordinary course of business, the Bank has granted loans to principal officers and directors and their affiliates with outstanding balances amounting to $16,000 and $49,000 at December 31, 2015 and 2014, respectively. During the year ended December 31, 2015, there were no principal additions and principal payments totaled $33,000.
95
Note 6 – Other Real Estate Owned
A summary of the activity in OREO is as follows:
Year Ended December 31, 2015 | Year Ended December 31, 2014 | ||||||
(In thousands) | |||||||
Balance at beginning of period | $ | 35,491 | $ | 63,460 | |||
Additions | 4,389 | 10,381 | |||||
Capitalized improvements | 159 | 251 | |||||
OREO valuation adjustments, net | (1,493 | ) | (7,840 | ) | |||
Sales | (18,175 | ) | (30,761 | ) | |||
Balance at end of period | $ | 20,371 | $ | 35,491 | |||
The balances at end of period above are net of a valuation allowance of $14.2 million, $20.6 million and $30.8 million at December 31, 2015, 2014 and 2013, respectively, recognized during the holding period for declines in fair value subsequent to foreclosure or acceptance of deed in lieu of foreclosure. A summary of activity in the OREO valuation allowance is as follows:
Year Ended December 31, 2015 | Year Ended December 31, 2014 | Nine Months Ended December 31, 2013 | |||||||||
(In thousands) | |||||||||||
Balance at beginning of period | $ | 20,583 | $ | 30,842 | $ | 36,009 | |||||
OREO valuation adjustments, net | 1,493 | 7,840 | 4,937 | ||||||||
Sales | (7,827 | ) | (18,099 | ) | (10,104 | ) | |||||
Balance at end of period | $ | 14,249 | $ | 20,583 | $ | 30,842 | |||||
OREO expense, net, consisted of the following components:
Year Ended December 31, 2015 | Year Ended December 31, 2014 | Nine Months Ended December 31, 2013 | |||||||||
(In thousands) | |||||||||||
OREO valuation adjustments, net | $ | 1,493 | $ | 7,840 | $ | 4,937 | |||||
Foreclosure cost expense | 361 | 498 | 1,541 | ||||||||
Expenses from operations, net | 490 | 1,441 | 3,319 | ||||||||
OREO expense, net | $ | 2,344 | $ | 9,779 | $ | 9,797 | |||||
The recorded investment of loans secured by 1-4 family residential real estate for which foreclosure proceedings are in process was $709,000 at December 31, 2015. The recorded investment in 1-4 family residential real estate properties in OREO was $424,000 at December 31, 2015.
Note 7 – Premises, Equipment and Lease Commitments
Premises and equipment are summarized as follows:
December 31, 2015 | December 31, 2014 | ||||||
(In thousands) | |||||||
Land and land improvements | $ | 6,495 | $ | 6,615 | |||
Office buildings | 31,658 | 30,930 | |||||
Furniture and equipment | 26,544 | 26,444 | |||||
Leasehold improvements | 3,698 | 4,171 | |||||
68,395 | 68,160 | ||||||
Less accumulated depreciation and amortization | (42,171 | ) | (44,591 | ) | |||
$ | 26,224 | $ | 23,569 | ||||
Depreciation and amortization expense for the years ended December 31, 2015 and 2014 and the nine months ended December 31, 2013 was $2.9 million, $2.4 million and $1.9 million, respectively.
96
The Company leases 18 branch offices and office facilities under non-cancelable operating leases which expire on various dates through 2029. Future minimum payments under non-cancelable operating leases with initial terms of one year or more at December 31, 2015 are as follows:
Year Ending December 31, | Amount of Future Minimum Payments | ||
(In thousands) | |||
2016 | $ | 1,947 | |
2017 | 1,872 | ||
2018 | 1,962 | ||
2019 | 1,693 | ||
2020 | 1,633 | ||
Thereafter | 3,921 | ||
Total | $ | 13,028 | |
For the years ended December 31, 2015 and 2014 and the nine months ended December 31, 2013, land and building lease rental expense was $1.9 million, $1.8 million, and $1.3 million, respectively.
In January 2015, the Bank completed the purchase of a new building located on the east side of Madison at a purchase price of $4.0 million. This facility, which houses the Bank's support departments, became operational during the second quarter of 2015. In May 2015, the Bank sold the Viroqua branch, which was a leased facility. The sale included furniture and equipment. The future lease payments for this facility have been removed from the table above presenting “Amount of Future Minimum Payments.” In September 2015, the Bank sold the Winneconne branch operations. The sales included furniture and equipment.
During 2015, the Bank completed several actions to improve overall operational efficiencies. As part of these initiatives, six retail bank branches in Wisconsin were consolidated. A gain on the sale of the Appleton Fox River Drive branch building, one of the consolidated branches, of $1.4 million was recorded in 2015. Lease termination expense of $1.5 million was recorded during 2015 for the consolidated Menasha and Madison branches. The remaining facilities in Oshkosh, Janesville, and Franklin were transferred to OREO. As of December 31, 2015, the Janesville and Franklin facilities remained in OREO.
In February 2014, the Bank entered into a purchase agreement with an unrelated third party to sell the Bank’s main office building located at 25 West Main Street, Madison, Wisconsin, the adjacent surface parking lot immediately behind the main office building at 115 South Carroll Street and the 261-stall parking ramp located at 126 South Carroll Street. The transaction closed on December 19, 2014 and a $1.4 million gain was recognized on the parcels that were not included in the subsequent lease between the Bank and the buyer. The Bank entered into a nine year lease to rent a portion of the building to house the branch located in the building and to provide additional office space. The future lease payments for this facility have been added to the table above presenting “Amount of Future Minimum Payments.” The gain of $6.4 million related to the leased space sold was deferred and is being amortized into income over the remaining term of the lease. During the years ended December 31, 2015 and 2014, the Bank recognized $1.4 million and $59,000, respectively, of the deferred gain.
In December 2014, the Bank sold the Richland Center branch, which was a leased facility, in rural Wisconsin. The sale included furniture and equipment. The future lease payments for this facility have been removed from the table above presenting “Amount of Future Minimum Payments.”
Note 8 – Mortgage Servicing Rights
Accounting for MSRs is based on the amortization method. Under this method, servicing assets are amortized in proportion to and over the period of net servicing income. Income generated as the result of the capitalization of new servicing assets is reported as net gain on sale of loans and the amortization of servicing assets is reported as a reduction to loan servicing income in the consolidated statements of operations. Ancillary income is recorded in other non-interest income.
97
Information regarding the Company’s MSRs is as follows:
Year Ended December 31, 2015 | Year Ended December 31, 2014 | ||||||
(Dollars in thousands) | |||||||
Balance at beginning of period | $ | 20,685 | $ | 23,041 | |||
Additions | 2,952 | 1,442 | |||||
Amortization | (4,010 | ) | (3,798 | ) | |||
Balance at end of period | 19,627 | 20,685 | |||||
Valuation allowance at end of period | (685 | ) | (1,281 | ) | |||
Balance at end of period, net | $ | 18,942 | $ | 19,404 | |||
Fair value at end of the period | $ | 19,252 | $ | 19,590 | |||
Key assumptions: | |||||||
Weighted average discount rate | 11.35 | % | 11.45 | % | |||
Weighted average prepayment speed | 11.31 | % | 10.01 | % | |||
The projections of amortization expense for mortgage servicing rights set forth below are based on asset balances as of December 31, 2015 and an assumed amortization rate of 17.4% per year. Future amortization expense may be significantly different depending upon changes in the mortgage servicing portfolio, mortgage interest rates and market conditions.
MSR Amortization | |||
(In thousands) | |||
Year Ended December 31, 2015 | $ | 4,010 | |
Estimate for the year ended December 31, | |||
2016 | $ | 3,406 | |
2017 | 2,813 | ||
2018 | 2,323 | ||
2019 | 1,918 | ||
2020 | 1,584 | ||
Thereafter | 7,583 | ||
Total | $ | 19,627 | |
The unpaid principal balance of mortgage loans serviced for others is not included in the consolidated balance sheets. The unpaid principal of mortgage loans serviced for others was approximately $2.28 billion and $2.47 billion at December 31, 2015 and 2014, respectively.
Note 9 – Deposits
Deposits are summarized as follows:
December 31, 2015 | December 31, 2014 | ||||||||||||
Carrying Amount | Weighted Average Rate | Carrying Amount | Weighted Average Rate | ||||||||||
(Dollars in thousands) | |||||||||||||
Non-interest bearing checking | $ | 323,956 | — | % | $ | 291,248 | — | % | |||||
Interest bearing checking | 314,506 | 0.06 | 305,004 | 0.06 | |||||||||
Total checking accounts | 638,462 | 0.03 | 596,252 | 0.03 | |||||||||
Money market accounts | 482,028 | 0.24 | 455,594 | 0.20 | |||||||||
Certificates of deposit | 390,320 | 0.62 | 447,213 | 0.52 | |||||||||
Regular savings | 327,563 | 0.10 | 312,544 | 0.10 | |||||||||
Advance payments by borrowers for taxes and insurance | 2,351 | 0.03 | 2,568 | 0.07 | |||||||||
Total deposits | $ | 1,840,724 | 0.22 | % | $ | 1,814,171 | 0.21 | % | |||||
98
The Bank has previously entered into agreements with certain brokers that will provide deposits obtained from their customers at specified interest rates for an identified fee (“brokered deposits”). Deposits gathered through the Certificate of Deposit Account Registry Service ("CDARS") are considered to be brokered deposits for regulatory purposes. There were no active brokered deposit arrangements or outstanding brokered deposits at December 31, 2015 and 2014.
Annual maturities of certificates of deposit outstanding at December 31, 2015 are summarized as follows:
Amount | |||
(In thousands) | |||
Matures During Year Ending December 31, | |||
2016 | $ | 236,887 | |
2017 | 99,987 | ||
2018 | 27,922 | ||
2019 | 13,260 | ||
2020 | 12,264 | ||
Total | $ | 390,320 | |
Certificates of deposit with balances greater than or equal to the FDIC insurance limit of $250,000 totaled $7.4 million and $7.9 million at December 31, 2015 and 2014, respectively.
Note 10 – Borrowed Funds
Other borrowed funds consist of the following:
December 31, | |||||||||||||||
2015 | 2014 | ||||||||||||||
Maturing | Amount | Weighted Average Rate | Amount | Weighted Average Rate | |||||||||||
(Dollars in thousands) | |||||||||||||||
FHLB advances | Dec 19, 2018 | $ | 10,000 | 2.33 | % | $ | 10,000 | 2.33 | % | ||||||
Repurchase agreements | 2,438 | 0.10 | 3,569 | 0.10 | |||||||||||
Long term lease obligation | 124 | 2.46 | 183 | 2.46 | |||||||||||
$ | 12,562 | 1.90 | % | $ | 13,752 | 1.75 | % | ||||||||
FHLB Advances
The Bank pledges certain loans that meet underwriting criteria established by the Federal Home Loan Bank of Chicago (“FHLB of Chicago”) as collateral for outstanding advances. The unpaid principal balance of loans pledged to secure FHLB of Chicago borrowings totaled $595.6 million and $652.3 million at December 31, 2015 and 2014, respectively. The FHLB of Chicago borrowings are also collateralized by mortgage-related securities totaling $55.9 million and $88.9 million at December 31, 2015 and 2014, respectively. At December 31, 2015, there were no FHLB of Chicago borrowings with call features that may be exercised by the FHLB of Chicago.
On September 19, 2013, FHLB of Chicago advances totaling $176.0 million were prepaid. The prepaid advances were fixed rate, due to mature in January 2018, with a then-current weighted average rate of 3.18%. The prepayment triggered an early termination penalty of $16.1 million, which was recorded in non-interest expense for the nine months ended December 31, 2013.
Repurchase Agreements
The Company enters into agreements under which it sells securities subject to an obligation to repurchase the same or similar securities. Under these arrangements, the Company may transfer legal control over the assets but still retain effective control through an agreement that both entitles and obligates the Company to repurchase the assets. As a result, these repurchase agreements are accounted for as collateralized financing arrangements (i.e., secured borrowings) and not as a sale and subsequent repurchase of securities. The obligation to repurchase the securities is reflected as a liability in the Company’s Consolidated Balance Sheets, while the securities underlying the repurchase agreements remain in the respective investment securities asset accounts.
99
Long Term Lease Obligation
The Company enters into agreements from time to time that give the right to use property in exchange for making a series of payments. The term of the lease obligations typically exceed three years and provide an opportunity to purchase the leased item at the end of the lease term at a price below market rate. These types of lease are considered a capital lease because the Company has in essence accepted the risks and benefits of ownership. As a result a capital lease requires an asset must be subsequently depreciated and included as property and equipment in the Company's Consolidated Balance Sheets.
Note 11 – Regulatory Capital
The Company and Bank are subject to various regulatory capital requirements administered by the federal banking agencies. Failure to meet minimum capital requirements can initiate certain mandatory, and possibly additional discretionary actions by regulators that, if undertaken, could have a direct material effect on the consolidated financial statements. Under capital adequacy guidelines and the regulatory framework for prompt corrective action, the Bank must meet specific capital guidelines that involve quantitative measures of the Bank’s assets, liabilities and certain off-balance sheet items as calculated under regulatory accounting practices. The Bank’s capital amounts and classification are also subject to qualitative judgments by the regulators about components, risk weightings, and other factors.
Qualitative measures established by regulation to ensure capital adequacy require the Company and Bank to maintain minimum amounts and ratios of common equity tier 1 ("CET1"), tier 1 capital, total regulatory capital and tier 1 leverage. As of January 1, 2015, the requirements are:
• | 4.5% based upon CET1 capital |
• | 6.0% based upon tier 1 capital |
• | 8.0% based on total regulatory capital |
• | Leverage ratio of tier 1 Capital assets equal to 4.0% |
The following table summarizes the Company’s and Bank capital ratios:
December 31, 2015 | December 31, 2014 | ||||||||||||||||
Ratio | To be Adequately Capitalized | To be Well Capitalized | Ratio | To be Adequately Capitalized | To be Well Capitalized | ||||||||||||
Common equity tier 1 ratio (1) | |||||||||||||||||
Anchor Bancorp | 18.66 | % | 4.50 | % | N/A | N/A | N/A | N/A | |||||||||
AnchorBank, fsb | 17.04 | % | 4.50 | % | 6.50 | % | N/A | N/A | N/A | ||||||||
Tier 1 capital ratio (2) | |||||||||||||||||
Anchor Bancorp | 18.66 | % | 6.00 | % | N/A | N/A | N/A | N/A | |||||||||
AnchorBank, fsb | 17.04 | % | 6.00 | % | 8.00 | % | 16.97 | % | 4.00 | % | 6.00 | % | |||||
Total capital ratio (3) | |||||||||||||||||
Anchor Bancorp | 19.95 | % | 8.00 | % | N/A | N/A | N/A | N/A | |||||||||
AnchorBank, fsb | 18.33 | % | 8.00 | % | 10.00 | % | 18.25 | % | 8.00 | % | 10.00 | % | |||||
Tier 1 leverage ratio (4) | |||||||||||||||||
Anchor Bancorp | 13.52 | % | 4.00 | % | N/A | N/A | N/A | N/A | |||||||||
AnchorBank, fsb | 12.35 | % | 4.00 | % | 5.00 | % | 10.43 | % | 4.00 | % | 5.00 | % | |||||
(1) | CET1 capital divided by total risk-weighted assets |
(2) | Tier 1 capital divided by total risk-weighted assets |
(3) | Total risk-based capital divided by total risk-weighted assets |
(4) | Tier 1 capital divided by adjusted average total assets |
100
The following table reconciles the Bank's stockholders' equity to regulatory capital:
December 31, 2015 | December 31, 2014 | ||||||
(In thousands) | |||||||
Stockholders’ equity of the Bank | $ | 336,194 | $ | 216,030 | |||
Less: disallowed servicing assets | — | (1,773 | ) | ||||
Disallowed deferred tax assets | (69,254 | ) | — | ||||
Accumulated other comprehensive loss | 3,250 | 2,402 | |||||
Common equity tier 1 capital | 270,190 | N/A | |||||
Additional tier 1 capital | — | N/A | |||||
Tier 1 capital | 270,190 | 216,659 | |||||
Plus: allowable allowance for loan losses | 20,426 | 16,373 | |||||
Total risk-based capital | $ | 290,616 | $ | 233,032 | |||
Prior to January 1, 2015, the Company as a Savings & Loan Holding Company ("SLHC") was not subject to calculating regulatory capital ratios, as required under the Basel III Capital Rules. For December 31, 2014, regulatory capital ratios were calculated under Basel I rules.
In July 2013, the federal banking agencies published final rules (the “Basel III Capital Rules”) that revised their risk-based and leverage capital requirements and their method for calculating risk-weighted assets to implement, in part, agreements reached by the Basel Committee and certain provisions of the Dodd-Frank Act. The Basel III Capital Rules apply to banking organizations, including the Company and the Bank.
Among other things, the Basel III Capital Rules: (i) introduce a new capital measure entitled CET1; (ii) specify that tier 1 capital consist of CET1 and additional financial instruments satisfying specified requirements that permit inclusion in tier 1 capital; (iii) define CET1 narrowly by requiring that most deductions or adjustments to regulatory capital measures be made to CET1 and not to the other components of capital; and (iv) expand the scope of the deductions or adjustments from capital as compared to the existing regulations.
A minimum leverage ratio (tier 1 capital as a percentage of adjusted average total assets) of 4.0% is also required under the Basel III Capital Rules (even for highly rated institutions). The Basel III Capital Rules additionally require institutions to retain a capital conservation buffer of 2.5% above these required minimum capital ratio levels. Banking organizations that fail to maintain the minimum 2.5% capital conservation buffer could face restrictions on capital distributions or discretionary bonus payments to executive officers.
The Basel III Capital Rules became effective as applied to the Company and the Bank on January 1, 2015, with a phase in period that generally extends from January 1, 2015 through January 1, 2019.
Note 12 – Employee Benefit Plans
Defined Contribution Plan
The Company maintains a defined contribution plan under Sections 401(a) and 401(k) of the Internal Revenue Code, the AnchorBank, fsb Retirement Plan, in which substantially all employees are eligible to participate. Employees become eligible on the first of the month following 60 days of employment. Participating employees may contribute up to 100% of their base compensation on a pre-tax basis up to annual Internal Revenue Service limits. In January 2013, the Company reinstated the matching contribution which had been suspended since October 2009. The Company previously matched the first 2% contributed with a dollar-for-dollar match and the next 2% of employee contributions at a rate of $.50 for each dollar. These amounts were increased beginning in January 2014 to the first 2% contributed with a dollar-for-dollar match, the next 2% matched at a rate of $0.50 for each dollar and the next 4% matched at $0.25 for each dollar. Employees are allowed to self-direct their investments on a daily basis. The Company may also contribute additional amounts at its discretion. The Company contributed $1.1 million and $992,000 for the years ended December 31, 2015 and 2014, respectively, and $579,000 for the nine months ended December 31, 2013.
Omnibus Incentive Plan
On August 12, 2014, the Board of Directors (“Board”) of the Company approved a new incentive plan, the Anchor Bancorp Wisconsin Inc. 2014 Omnibus Incentive Plan (the “Omnibus Plan”) which was subsequently approved by stockholders. The
101
Omnibus Plan provides for the issuance of awards of incentive or nonqualified stock options, stock appreciation rights, performance and restricted stock awards or units, dividend equivalent units and other stock based awards as determined by the Board or the Plan Administrator. The purpose of the Omnibus Plan is to promote the interest of the Company and its stockholders by attracting, retaining and motivating executives and other selected employees, directors, consultants and advisors by enabling such individuals to participate in the long-term growth and financial success of the Company.
The maximum number of shares of common stock (each, a “share”) that may be issued to participants pursuant to awards under the 2014 Omnibus Plan will be equal to 600,000. Such shares may be either authorized and unissued shares or shares reacquired at any time and now or hereafter held as treasury stock. At December 31, 2015, 349,411 shares were available to grant pursuant to the 2014 Plan.
Restricted stock grants vest over various periods of time typically from one to three years and are included in outstanding shares at the time of grant. The fair value of restricted stock grants determined at the grant date is amortized to compensation and benefits expense over the vesting period. The restricted stock grant plan expense for the years ended December 31, 2015 and 2014 was $2.2 million and $1.0 million, respectively. Dividends, if declared, will accrue for the benefit of the individuals who are granted restricted stock and will be paid out as the stock vests. Unvested shares will be voted by the employees in the same manner as the vested shares.
The restricted stock activity is summarized as follows:
December 31, 2015 | December 31, 2014 | ||||||||||||
Shares | Weighted Average Grant Date Fair Value | Shares | Weighted Average Grant Date Fair Value | ||||||||||
Nonvested balance as of beginning of period | 179,300 | $ | 21.20 | — | $ | — | |||||||
Granted | 67,047 | 34.77 | 200,200 | 21.17 | |||||||||
Vested | (75,283 | ) | 21.15 | (12,500 | ) | 20.95 | |||||||
Forfeited | (8,258 | ) | 29.51 | (8,400 | ) | 20.95 | |||||||
Nonvested balance as of end of period | 162,806 | $ | 26.39 | 179,300 | $ | 21.20 | |||||||
Available to grant | 349,411 | 408,200 | |||||||||||
There was approximately $3.0 million and $3.1 million of unrecognized compensation expense related to nonvested restricted stock awards granted under the Omnibus Plan as of December 31, 2015 and 2014, respectively. The remaining weighted average term of nonvested awards is 0.9 years.
Note 13 – Commitments and Contingent Liabilities
The Company is a party to financial instruments with off-balance sheet risk in the normal course of business to meet the financial needs of its customers. These financial instruments include commitments to extend credit and financial guarantees which involve, to varying degrees, elements of credit and interest rate risk in excess of the amount recognized in the Consolidated Balance Sheets. The contract amounts of those instruments reflect the extent of involvement and exposure to credit loss the Company has in particular classes of financial instruments. The same credit policies are used in making commitments and conditional obligations as for on-balance sheet instruments.
Financial instruments whose contract amounts represent credit risk are as follows:
December 31, | |||||||
2015 | 2014 | ||||||
(In thousands) | |||||||
Commitments to extend credit | $ | 133,670 | $ | 39,251 | |||
Unused lines of credit: | |||||||
Home equity | 111,185 | 111,365 | |||||
Credit cards | — | 23,249 | |||||
Commercial | 281,459 | 144,333 | |||||
Letters of credit | 3,237 | 8,564 | |||||
Credit enhancement under the FHLB of Chicago Mortgage Partnership Finance ("MPF") Program | 3,387 | 7,644 | |||||
102
Commitments to extend credit are in the form of a loan in the near future. Unused lines of credit are agreements to lend to a customer as long as there is no violation of any condition established in the contract and may be drawn upon at the borrowers’ discretion. Letters of credit commit the Company to make payments on behalf of customers when certain specified future events occur. Commitments and letters of credit primarily have fixed expiration dates or other termination clauses and may require payment of a fee. As some such commitments expire without being drawn upon, the total commitment amounts do not necessarily represent future cash requirements. The Company evaluates each customer’s creditworthiness on a case-by-case basis. The Company primarily extends credit on a secured basis. Collateral obtained consists primarily of single-family residences and income-producing commercial properties.
The Bank previously participated in the MPF Program of the FHLB of Chicago. Pursuant to the credit enhancement feature of the MPF Program, the Bank retained a secondary credit loss exposure in the amount of $3.4 million at December 31, 2015 related to approximately $122.7 million of residential mortgage loans that the Bank has originated and are still outstanding. The Bank acts as a servicing agent for the FHLB of Chicago. Under the credit enhancement, the FHLB of Chicago is liable for losses on loans up to one percent of the original delivered loan balances in each pool up to the point the credit enhancement is reset. After the credit enhancement resets, the FHLB of Chicago and the Bank’s loss contingency could be reduced depending upon losses experienced and loan balances remaining. The Bank is liable for losses over and above the FHLB of Chicago first loss position up to a contractually agreed-upon maximum amount in each pool that was delivered to the MPF Program. The Bank receives a monthly fee for this credit enhancement obligation based on the outstanding loan balances. The monthly fee received is net of losses under the MPF Program. The Bank discontinued funding loans through the MPF Program in 2008.
Unfunded Commitments
In addition to the allowance for loan losses reflected in the Consolidated Balance Sheets, a reserve is also provided for unfunded loan commitments. The reserve for unfunded loan commitments includes unfunded commitments to lend and commercial letters of credit. This reserve is classified in other liabilities in the Consolidated Balance Sheets.
The balances of this reserve for the periods presented is as follows:
Year Ended December 31, 2015 | Year Ended December 31, 2014 | Nine Months Ended December 31, 2013 | |||||||||
(In thousands) | |||||||||||
Reserve for unfunded commitment losses beginning balance | $ | 2,557 | $ | 4,664 | $ | 1,956 | |||||
Provision for unfunded commitments | 17 | (2,107 | ) | 2,708 | |||||||
Ending reserve for unfunded commitment losses | $ | 2,574 | $ | 2,557 | $ | 4,664 | |||||
The amount of the allowance for unfunded loan commitments is determined using the average reserve rate that applies to the associated funded loan category multiplied by the unfunded commitment amount. The reserve also covers potential loss on letters of credit outstanding for which the Bank may be unable to recover the amount outstanding. At December 31, 2015 and 2014, a liability of $2.6 million was required compared to a liability of $4.7 million at December 31, 2013 and reflects a decrease primarily due to a release of a $2.7 million specific reserve related to letter of credit litigation that was resolved during 2014.
Repurchase Loan Reserve
Loans intended to be sold are originated in accordance with specific criteria established by the investor agencies – these are known as “conforming loans.” During the sale of these loans, certain representations and warranties are made that the loans conform to these previously established underwriting standards. In the event that any of these representations and warranties or standards are found to be out of compliance, the Company may be responsible for repurchasing the loan at the unpaid principal balance or indemnifying the buyer against loss related to that loan.
Other loans sold to investors must meet specific criteria as determined by the investor at the time of sale. If it is determined at a later date, that a loan did not meet these requirements or was a fraudulent transaction, the investor may require the Bank to either repurchase the loan or make the investor whole in the event of a loss. As the Company expects relatively few such loans to become delinquent, the total amount of loans sold with recourse does not necessarily represent future cash requirements. Collateral obtained on such loans consists primarily of single-family residences. The unpaid principal balance of loans repurchased from investors totaled $1.0 million, $1.1 million and $1.8 million during the years ended December 31, 2015 and 2014 and the nine months ended December 31, 2013, respectively. Alternatively, investors make requests to be made whole on a loan whereby the property has been disposed of at a loss. The related amounts for requests by the investor to be made whole was $125,000, $754,000 and $687,000 for the years ended December 31, 2015 and 2014 and the nine months ended
103
December 31, 2013, respectively. All losses incurred are recorded against the reserve for repurchased loans in the Consolidated Balance Sheets.
Accordingly, in addition to the allowance for loan losses reflected on the Consolidated Balance Sheets, a reserve is also provided for the repurchase of previously sold loans. This reserve is classified in other liabilities on the Consolidated Balance Sheets.
The balances of this reserve for the periods presented is as follows:
Year Ended December 31, 2015 | Year Ended December 31, 2014 | Nine Months Ended December 31, 2013 | |||||||||
(In thousands) | |||||||||||
Reserve for repurchased loans beginning balance | $ | 1,338 | $ | 2,600 | $ | 2,600 | |||||
Charge off | (172 | ) | (1,176 | ) | — | ||||||
Recovery | 74 | 27 | — | ||||||||
Provision for repurchased loans | (212 | ) | (113 | ) | — | ||||||
Ending reserve for repurchased loans | $ | 1,028 | $ | 1,338 | $ | 2,600 | |||||
The amount of the reserve for repurchased loans is determined using the serviced portfolio balances multiplied by historical and expected loss rates to provide for the probable losses related to sold mortgage loans. The reserve declined $310,000 during the year ended December 31, 2015. During the year ended December 31, 2014 the reserve declined $1.3 million. Total income incurred for investor loss reimbursements, including any provision recorded or reserve released, was $212,000 for the year ended December 31, 2015 and total expense incurred for the year ended December 31, 2014 was $50,000. Losses may result from the repurchase of loans or indemnification of losses incurred upon foreclosure and disposition of related collateral. The analysis of the reserve at December 31, 2015 required a liability of $1.0 million.
Legal Proceedings
In the ordinary course of business, there are legal proceedings against the Company and its subsidiaries. Management considers that the aggregate liabilities, if any, resulting from such actions would not have a material, adverse effect on the consolidated financial position of the Company.
On February 25, 2016, a plaintiff filed a purported class action complaint in the United States District Court for the Western District of Wisconsin on behalf of himself and other Company stockholders against the Company, its Board, and Old National in connection with a proposed transaction between the Company and Old National, pursuant to which the Company will be acquired by Old National. The lawsuit is captioned Parshall v. Anchor Bancorp Wisconsin, Inc., et al., Case No. 16-CV-120 (W.D. Wis.), and alleges state law breach of fiduciary duty claims against the Company’s Board for, among other things, seeking to sell the Company through an allegedly defective process, for an unfair price and on unfair terms. The lawsuit seeks, among other things, to enjoin the consummation of the transaction and damages. The complaint alleges that Old National aided and abetted the directors’ breaches of fiduciary duty. The complaint also brings state and federal law claims alleging that the Form S-4 Registration Statement that was filed with the U.S. Securities and Exchange Commission on February 17, 2016 for the transaction, omitted certain material information.
Note 14 – Derivative Financial Instruments
The Company enters into contracts that meet the definition of derivative financial instruments in accordance with ASC Topic 815 – Derivative and Hedging. Derivatives are used as part of a risk management strategy to address exposure to changes in interest rates including those inherent in the Company’s origination and sale of certain residential mortgages into the secondary market. These derivative contracts used for risk management purposes include: (1) interest rate lock commitments provided to customers to fund mortgage loans intended to be sold; (2) forward sale contracts for the future delivery of funded residential mortgages; and (3) interest rate swap contracts.
Forward sale contracts are entered into when interest rate lock commitments are granted to customers in an effort to economically hedge the effect of future changes in interest rates on the commitments to fund mortgage loans intended to be sold (the “pipeline”), as well as on the portfolio of funded mortgages not yet sold (the “warehouse”). For accounting purposes, these derivatives are not designated as being in a hedging relationship. The contracts are carried at fair value in the Consolidated Balance Sheets, with changes in fair value recorded in the Consolidated Statements of Operations.
104
The Company has developed a program to enter into interest rate swap arrangements to manage the interest rate risk exposure associated with specific commercial loan relationships at the time such loans are originated. These interest rate swaps, as well as the embedded derivatives associated with certain of its commercial loan relationships, are derivative financial instruments under GAAP. None of these derivative financial instruments are designated by the Company as accounting hedges as specified in GAAP. As such, the fair market value of the interest rate swaps and embedded derivatives are carried in the Consolidated Balance Sheets as derivative assets or liabilities, as the case may be, and periodic changes in fair market value of such financial instruments are recorded through periodic earnings in other non-interest income in the Consolidated Statements of Operations.
The Company's derivative financial instruments are summarized as follows:
December 31, | |||||||||||||||||
2015 | 2014 | ||||||||||||||||
Balance Sheet Location | Notional Amount | Estimated Fair Value | Notional Amount | Estimated Fair Value | |||||||||||||
(In thousands) | |||||||||||||||||
Derivative assets: | |||||||||||||||||
Interest rate lock commitments (1) | Other assets | $ | 18,605 | $ | 189 | $ | 14,633 | $ | 154 | ||||||||
Forward contracts to sell mortgage loans (2) | Other assets | — | — | 4,000 | 2 | ||||||||||||
Interest rate swap contracts | Other assets | 78,433 | 2,081 | — | — | ||||||||||||
Derivative liabilities: | |||||||||||||||||
Interest rate lock commitments (1) | Other liabilities | 555 | 6 | 2,108 | 14 | ||||||||||||
Forward contracts to sell mortgage loans (2) | Other liabilities | 24,000 | 90 | 16,000 | 174 | ||||||||||||
Interest rate swap contracts | Other liabilities | 78,433 | 2,081 | — | — | ||||||||||||
(1) | Interest rate lock commitments include $11.8 million and $7.9 million of commitments not yet approved in the credit underwriting process at December 31, 2015 and 2014, respectively, yet represent potential interest rate risk exposure to the extent those mortgage loan applications are eventually approved for funding. |
(2) | The Company, as of the quarter ended September 30, 2015, has elected to offset the fair value of individual forward sale contracts and present a net amount in the Consolidated Balance Sheets in accordance with ASC Topic 815-45. |
Net gains (losses) included in the Consolidated Statements of Operations related to derivative financial instruments, recognized in net gain on sale of loans, are summarized as follows:
Year Ended December 31, 2015 | Year Ended December 31, 2014 | Nine Months Ended December 31, 2013 | |||||||||
(In thousands) | |||||||||||
Interest rate lock commitments | $ | 44 | $ | 141 | $ | (688 | ) | ||||
Unused commitments | — | (26 | ) | 26 | |||||||
Forward contracts to sell mortgage loans | (192 | ) | (848 | ) | 2,463 | ||||||
Total | $ | (148 | ) | $ | (733 | ) | $ | 1,801 | |||
Note 15 – Offsetting Assets and Liabilities
Offsetting, otherwise known as netting, takes place when entities present their rights and obligations to each other as a net amount in their statement of financial condition. The Company has certain assets and liabilities in the Consolidated Balance Sheets which could be subject to the right of offset and related arrangements associated with financial instruments and derivatives. Derivative instruments reported are used as part of a risk management strategy to address exposure to changes in interest rates including those inherent in the Company’s origination and sale of certain residential mortgages into the secondary market, as presented in Note 14 – Derivative Financial Instruments. In addition, the Company enters into interest rate-related instruments to facilitate the interest rate risk management strategies of commercial customers. The interest agreements are derivatives and are recorded at fair value in the Company’s Consolidated Balance Sheets. A repurchase agreement is a transaction in which the Company sells securities subject to an obligation to repurchase the same or similar securities. Under these arrangements, the Company may transfer legal control over the assets but still retain effective control through an agreement that both entitles and obligates the Company to repurchase the assets.
105
The following table reflects the gross and net amounts of such assets and liabilities as of December 31, 2015 and 2014.
Gross Amounts of Recognized Assets or Liabilities | Gross Amounts Offset in the Consolidated Balance Sheets | Net Amount of Assets Presented in the Consolidated Balance Sheets | |||||||||
(In thousands) | |||||||||||
As of December 31, 2015 | |||||||||||
Assets: | |||||||||||
Interest rate commitments | $ | 189 | $ | — | $ | 189 | |||||
Interest rate swap contracts | 2,081 | — | 2,081 | ||||||||
Liabilities: | |||||||||||
Interest rate commitments | 6 | — | 6 | ||||||||
Interest rate swap contracts | 2,081 | — | 2,081 | ||||||||
Forward contracts to sell mortgage loans | 90 | — | 90 | ||||||||
Repurchase agreements | 2,438 | — | 2,438 | ||||||||
As of December 31, 2014 | |||||||||||
Assets: | |||||||||||
Interest rate commitments | $ | 154 | $ | — | $ | 154 | |||||
Forward sale contracts | 2 | — | 2 | ||||||||
Liabilities: | |||||||||||
Interest rate commitments | 14 | — | 14 | ||||||||
Forward contracts to sell mortgage loans | 174 | — | 174 | ||||||||
Repurchase agreements | 3,569 | — | 3,569 | ||||||||
Note 16 – Fair Value of Financial Instruments
ASC Topic 820 - Fair Value Measurement establishes a framework for measuring fair value and disclosures about fair value measurements. Fair value is defined as the price that would be received to sell an asset or paid to transfer a liability in an orderly transaction between market participants at the measurement date.
In determining fair value, various valuation methods are used including market, income and cost approaches. Assumptions that market participants would use in pricing the asset or liability are utilized in these valuation methods, including assumptions about risk and the risks inherent in the inputs to the valuation technique. These inputs may be readily observable, market corroborated or generally unobservable inputs. Valuation methodologies are employed that maximize the use of observable inputs and minimize the use of unobservable inputs. Based on observability of the inputs used in the valuation methodologies, financial assets and liabilities measured at fair value on a recurring and nonrecurring basis are categorized according to the fair value hierarchy. The fair value hierarchy ranks the quality and reliability of the information used to determine fair values. Financial assets and liabilities that are adjusted to fair value are classified in one of the following three categories:
• | Level 1: Quoted prices (unadjusted) for identical assets or liabilities in active markets that the entity has the ability to access as of the measurement date. |
• | Level 2: Significant other observable inputs other than Level 1 prices such as quoted prices for similar assets or liabilities; quoted prices in markets that are not active; or other inputs that are observable or can be corroborated by observable market data. |
• | Level 3: Significant unobservable inputs that reflect a reporting entity’s own assumptions about the assumptions that market participants would use in pricing an asset or liability. |
Fair Value on a Recurring Basis
The following methods and assumptions were used for financial instruments measured at fair value:
Investment securities available for sale: The fair values for investment securities available for sale are obtained from an independent pricing service using a market data model. For securities where quoted prices or market prices of similar securities are not available, fair values are calculated using other market indicators. As of December 31, 2015, the Bank has one remaining non-agency CMO which is not validated by an independent pricing service.
106
Loans held for sale: The fair values for loans held for sale are based on commitments on hand from investors or quoted market prices.
Other assets and liabilities: Other assets and other liabilities include interest rate lock commitments provided to customers to fund mortgage loans intended to be sold, forward sale contracts for future delivery of funded residential mortgages to investors and interest rate swap contracts.
The Company relies on an internal valuation model to estimate the fair value of its interest rate lock commitments, which includes applying an estimated pull-through rate (the percentage of commitments expected to result in a closed loan) based on historical experience; multiplied by quoted investor prices on closed loans for future delivery determined to be reasonably applicable to the loan commitment based on interest rate, terms and rate lock expiration.
The Company also relies on an internal valuation model to estimate the fair value of its forward contracts to sell residential mortgage loans (i.e., an estimate of what the Company would receive or pay to terminate the forward delivery contract) based on market prices for similar financial instruments, which includes matching specific terms and maturities of the forward commitments against applicable investor pricing available.
The Company relies on valuations provided by a third party to value its interest rate swap contracts. These valuations are corroborated by comparison with valuation provided by the counter parties to the contracts.
The table below presents the financial instruments carried at fair value by the valuation hierarchy:
Level 1 | Level 2 | Level 3 | Total | ||||||||||||
(In thousands) | |||||||||||||||
December 31, 2015 | |||||||||||||||
Financial assets | |||||||||||||||
Investment securities available for sale: | |||||||||||||||
U.S. government sponsored and federal agency obligations | $ | — | $ | 3,136 | $ | — | $ | 3,136 | |||||||
Mortgage backed securities | — | 338,384 | — | 338,384 | |||||||||||
Other securities | 3 | — | — | 3 | |||||||||||
Loans held for sale | — | 10,323 | — | 10,323 | |||||||||||
Other assets: | |||||||||||||||
Interest rate lock commitments | — | 189 | — | 189 | |||||||||||
Interest rate swap contacts | — | 2,081 | — | 2,081 | |||||||||||
Total | $ | 3 | $ | 354,113 | $ | — | $ | 354,116 | |||||||
Financial liabilities | |||||||||||||||
Other liabilities: | |||||||||||||||
Interest rate lock commitments | $ | — | $ | 6 | $ | — | $ | 6 | |||||||
Forward contracts to sell mortgage loans | — | 90 | — | 90 | |||||||||||
Interest rate swap contacts | — | 2,081 | — | 2,081 | |||||||||||
Total | $ | — | $ | 2,177 | $ | — | $ | 2,177 | |||||||
107
Level 1 | Level 2 | Level 3 | Total | ||||||||||||
(In thousands) | |||||||||||||||
December 31, 2014 | |||||||||||||||
Financial assets | |||||||||||||||
Investment securities available for sale: | |||||||||||||||
U.S. government sponsored and federal agency obligations | $ | — | $ | 3,261 | $ | — | $ | 3,261 | |||||||
Mortgage backed securities | — | 291,335 | — | 291,335 | |||||||||||
Other securities | 3 | — | — | 3 | |||||||||||
Loans held for sale | — | 6,594 | — | 6,594 | |||||||||||
Other assets: | |||||||||||||||
Interest rate lock commitments | — | 154 | — | 154 | |||||||||||
Forward contracts to sell mortgage loans | — | 2 | — | 2 | |||||||||||
Total | $ | 3 | $ | 301,346 | $ | — | $ | 301,349 | |||||||
Financial liabilities | |||||||||||||||
Other liabilities: | |||||||||||||||
Interest rate lock commitments | $ | — | $ | 14 | $ | — | $ | 14 | |||||||
Forward contracts to sell mortgage loans | — | 174 | — | 174 | |||||||||||
Total | $ | — | $ | 188 | $ | — | $ | 188 | |||||||
The following is a reconciliation of assets measured at fair value on a recurring basis using significant unobservable inputs (Level 3):
Year Ended December 31, 2014 | ||||
(In thousands) | ||||
Non-agency CMOs | ||||
Beginning balance | $ | 6,208 | ||
Total realized/unrealized gains (losses): | ||||
Included in earnings | (37 | ) | ||
Included in other comprehensive income | 212 | |||
Included in earnings as unrealized other-than-temporary impairment | (64 | ) | ||
Included in earnings as realized other-than-temporary impairment | 222 | |||
Principal repayments | (1,126 | ) | ||
Sales | (5,388 | ) | ||
Transfers out of level 3 | (27 | ) | ||
Ending balance | $ | — | ||
There were no transfers out of Level 3 to Level 2 for the year ended December 31, 2015. During the year ended December 31, 2014, there was a transfer out of Level 3 to Level 2 of $27,000. The Company’s policy for determining transfers between levels occurs at the end of the reporting period when circumstances in the underlying valuation criteria changes and result in transfers between levels.
Fair Value on a Nonrecurring Basis
Certain assets are measured at fair value on a nonrecurring basis; that is, the instruments are not measured at fair value on an ongoing basis but are subject to fair value adjustments in certain circumstances (for example, when there is evidence of impairment). Mortgage servicing rights includes only those items that were adjusted to fair value as of the dates indicated.
108
The following table presents such assets carried on the consolidated balance sheets by caption and by level within the fair value hierarchy:
Level 1 | Level 2 | Level 3 | Total | ||||||||||||
(In thousands) | |||||||||||||||
December 31, 2015 | |||||||||||||||
Impaired loans, with an allowance recorded, net | $ | — | $ | — | $ | 18,838 | $ | 18,838 | |||||||
Mortgage servicing rights | — | — | 5,789 | 5,789 | |||||||||||
Other real estate owned | — | — | 20,371 | 20,371 | |||||||||||
Total assets at fair value | $ | — | $ | — | $ | 44,998 | $ | 44,998 | |||||||
December 31, 2014 | |||||||||||||||
Impaired loans, with an allowance recorded, net | $ | — | $ | — | $ | 32,331 | $ | 32,331 | |||||||
Mortgage servicing rights | — | — | 18,918 | 18,918 | |||||||||||
Other real estate owned | — | — | 35,491 | 35,491 | |||||||||||
Total assets at fair value | $ | — | $ | — | $ | 86,740 | $ | 86,740 | |||||||
The significant inputs for those assets measured at fair value on a nonrecurring basis are as follows:
December 31, 2015 | |||
Method | Inputs | ||
Impaired loans, with an allowance recorded, net | Appraised Values | External appraised values- adjustments made to values due to management factors including age of appraisal, age of comparables, known changes in the market and in the collateral and selling and commission cost of 15% to 35%. | |
Mortgage servicing rights | Discounted Cash Flow | Weighted average prepayment speed 11.31%; weighted average discount rate 11.35%. | |
Other real estate owned | Appraised Values | External appraised values less selling and commission cost of 15% to 35%. | |
The Company does not adjust loans held for investment to fair value on a recurring basis. However, some loans are considered impaired and an allowance for loan losses is established. The specific reserves for collateral dependent impaired loans are based on the fair value of the underlying collateral less estimated costs to sell. The fair value of collateral is usually determined based on appraisals. In some cases, adjustments are made to appraised values due to various factors including age of the appraisal, age of comparables included in the appraisal, and known changes in the market and in the collateral. Since adjustments to appraised values are based on unobservable inputs, the resulting fair value measurement is categorized as a Level 3 measurement.
MSRs are recorded as an asset when loans are sold to third parties with servicing rights retained. Mortgage servicing rights are initially recorded at fair value and subsequently amortized in proportion to, and over the period of, estimated net servicing revenues. The carrying value of these assets is reviewed for impairment on a monthly basis using a lower of carrying value or fair value methodology. Mortgage servicing rights are valued monthly by an independent third party valuation service with income adjustments recorded monthly. On an annual basis the valuation is validated by a separate third party valuation service. The fair value of servicing rights is determined by estimating the present value of future net cash flows using a discounted cash flow model, taking into consideration certain critical assumptions, such as market loan prepayment speeds, discount rates, costs to service and other economic factors. For purposes of measuring impairment, the rights are stratified based on predominant risk characteristics of the underlying loans which include product type (i.e., fixed, adjustable or balloon) and interest rate. If the aggregate carrying value of the capitalized mortgage servicing rights for a stratum exceeds its fair value, the difference is recognized in non-interest expense as an impairment loss.
Variations in the assumptions used in the MSR discounted cash flow model could materially affect the estimated fair values. Changes to the assumptions are made when market data indicate that new trends have developed. Current market participant assumptions based on loan product types – fixed rate, adjustable rate and balloon loans – include discount rates in the range of 11.00% to 20.00% as well as portfolio weighted average prepayment speeds of 6.67% to 39.90% annual CPR. Many of these assumptions are subjective and involve a high degree of management judgment. MSR valuation assumptions are reviewed and approved by management on a quarterly basis.
109
Prepayment speeds may be affected by economic factors such as changes in home prices, market interest rates, the availability of other credit products to borrowers and customer payment patterns. Prepayment speeds include the impact of all borrower prepayments, including full payoffs, additional principal payments and the impact of loans paid off due to foreclosure liquidations. As market interest rates decline, prepayment speeds will generally increase as customers refinance existing mortgages to more favorable interest rate terms. As prepayment speeds increase, anticipated cash flows will generally decline resulting in a potential reduction, or impairment, of the fair value of the capitalized MSRs. Alternatively, an increase in market interest rates may cause a decrease in prepayment speeds and therefore an increase in fair value of MSRs. Annually, external data is obtained to test the values and assumptions that are used for the initial valuations in the discounted cash flow model.
Real estate acquired by foreclosure, real estate acquired by deed in lieu of foreclosure and other repossessed assets (OREO) are held for sale and are initially recorded at fair value less estimated selling expenses at the date of foreclosure. OREO is re-measured at the lower of cost or fair value after initial recognition and reported using a valuation allowance on OREO. Fair value is generally based on third party appraisals subject to discounting and is therefore considered a Level 3 measurement.
Fair Value Summary
ASC Topic 825 Financial Instruments requires disclosure of fair value information about financial instruments, for which it is practicable to estimate that value, whether or not recognized in the Consolidated Balance Sheets, including those financial assets and liabilities that are not measured and reported at fair value on a recurring or nonrecurring basis. In cases where quoted market prices are not available, fair values are based on estimates using present value or other valuation techniques. Results from these techniques are significantly affected by the assumptions used, including the discount rate and estimates of future cash flows. In that regard, the derived fair value estimates cannot be substantiated by comparison to independent markets and, in many cases, may not be realized in immediate settlement of the instruments. Certain financial instruments with a fair value that is not practicable to estimate and all non-financial instruments are excluded from the disclosure requirements. Accordingly, the aggregate fair value amounts presented in the table below do not necessarily represent the underlying value of the Company.
The following methods and assumptions were used in estimating the fair value of financial instruments that were not previously disclosed:
Cash and cash equivalents and accrued interest: The carrying amounts reported in the balance sheets approximate the fair values for those assets and liabilities. In accordance with ASC Topic 820, cash and cash equivalents and accrued interest have been categorized as a Level 2 fair value measurement.
Investment securities held to maturity: The fair value of investment securities are determined by an independent pricing service. In accordance with ASC 820, investment securities held to maturity have been categorized as a Level 2 fair value measurement.
Loans held for investment, net: The fair value of loans held for investment are estimated using observable inputs including estimated cash flows, and discount rates based on interest rates currently being offered for loans with similar terms, to borrowers of similar credit quality. In accordance with ASC Topic 820, loans held for investment that are not included with impaired loans in the preceding section titled Fair Value on a Nonrecurring Basis have been categorized as a Level 2 fair value measurement.
Federal Home Loan Bank stock: The carrying amount of FHLB stock approximates its fair value as it can only be redeemed with the FHLB at par value. In accordance with ASC Topic 820, Federal Home Loan Bank stock has been categorized as a Level 2 fair value measurement.
Deposits: The fair value of checking, savings and money market accounts are reported at book value, which is the amount payable on demand. The fair values of fixed-rate certificates of deposit are estimated using a discounted cash flow calculation that applies current interest rates being offered on certificates of deposit to a schedule of aggregated expected monthly maturities of the outstanding certificates of deposit. In accordance with ASC Topic 820, deposits have been categorized as a Level 2 fair value measurement.
Other borrowed funds: The fair value of FHLB advances and repurchase agreements are estimated using discounted cash flow analysis, based on the Company’s current incremental borrowing rates for similar types of borrowing arrangements. The fair value of the long-term lease obligation is reported at book value, which represents the present value of the cash flows at the time of inception and is indicative of the fair value in the current stable rate environment. In accordance with ASC Topic 820, other borrowed funds have been categorized as a Level 2 fair value measurement.
110
Off-balance sheet instruments: The fair value of off-balance sheet instruments (held for investment lending commitments and unused lines of credit) are based on fees currently charged to enter into similar agreements, taking into account the remaining terms of the agreements, the counterparties’ credit standing and discounted cash flow analyses. The fair value of these off-balance sheet items approximates the recorded amounts of the related fees and is not material at December 31, 2015 and 2014.
The carrying amount and fair value of the Company’s financial instruments consist of the following:
December 31, | |||||||||||||||
2015 | 2014 | ||||||||||||||
Carrying Amount | Fair Value | Carrying Amount | Fair Value | ||||||||||||
(In thousands) | |||||||||||||||
Financial assets: | |||||||||||||||
Cash and cash equivalents | $ | 75,267 | $ | 75,267 | $ | 147,273 | $ | 147,273 | |||||||
Investment securities available for sale | 341,523 | 341,523 | 294,599 | 294,599 | |||||||||||
Investment securities held to maturity | 15,492 | 15,422 | — | — | |||||||||||
Loans held for sale | 10,323 | 10,323 | 6,594 | 6,594 | |||||||||||
Loans held for investment, net | 1,614,953 | 1,579,582 | 1,524,439 | 1,496,791 | |||||||||||
Mortgage servicing rights | 18,942 | 19,252 | 19,404 | 19,590 | |||||||||||
Federal Home Loan Bank stock | 11,940 | 11,940 | 11,940 | 11,940 | |||||||||||
Accrued interest receivable | 7,827 | 7,827 | 7,627 | 7,627 | |||||||||||
Interest rate lock commitments | 189 | 189 | 154 | 154 | |||||||||||
Unused commitments | — | — | — | — | |||||||||||
Forward contracts to sell mortgage loans (1) | — | — | 2 | 2 | |||||||||||
Interest rate swap contracts | 2,081 | 2,081 | — | — | |||||||||||
Financial liabilities: | |||||||||||||||
Non-maturity deposits | 1,450,404 | 1,450,404 | 1,366,958 | 1,366,958 | |||||||||||
Deposits with stated maturities | 390,320 | 388,285 | 447,213 | 445,938 | |||||||||||
Borrowed funds | 12,562 | 12,837 | 13,752 | 14,077 | |||||||||||
Accrued interest payable | 325 | 325 | 316 | 316 | |||||||||||
Interest rate lock commitments | 6 | 6 | 14 | 14 | |||||||||||
Unused commitments | — | — | — | — | |||||||||||
Forward contracts to sell mortgage loans (1) | 90 | 90 | 174 | 174 | |||||||||||
Interest rate swap contracts | 2,081 | 2,081 | — | — | |||||||||||
(1) | The Company, as of the quarter ended September 30, 2015, has elected to offset the fair value of individual forward sale contracts and present a net amount on the Consolidated Balance Sheets in accordance with ASC Topic 815-45. |
Note 17 – Income Taxes
The Company and its subsidiaries file a consolidated federal income tax return and combined state income tax returns.
The Bank’s retained earnings at December 31, 2015 and 2014 includes base-year bad debt reserves, created for tax purposes prior to 1988, totaling $50.9 million. Base-year reserves are subject to recapture in the unlikely event that Bank (1) makes distributions in excess of current and accumulated earnings and profits, as calculated for federal income tax purposes, (2) redeems its stock, or (3) liquidates. The Bank has no intention of making such a non-dividend distribution. Accordingly, under current accounting principles, a related deferred income tax liability of $20.4 million has not been recognized.
111
The provision for income taxes consists of the following:
Year Ended December 31, 2015 | Year Ended December 31, 2014 | Nine Months Ended December 31, 2013 | |||||||||
(In thousands) | |||||||||||
Current: | |||||||||||
Federal | $ | 558 | $ | — | $ | — | |||||
State | 46 | 10 | 9 | ||||||||
604 | 10 | 9 | |||||||||
Deferred: | |||||||||||
Federal | (67,724 | ) | — | — | |||||||
State | (22,327 | ) | — | — | |||||||
(90,051 | ) | — | — | ||||||||
Total income tax expense | $ | (89,447 | ) | $ | 10 | $ | 9 | ||||
At December 31, 2015 and 2014, the affiliated group had federal net operating loss carryovers of $175.4 million and $195.0 million, respectively, and at December 31, 2015 and 2014, certain subsidiaries had state net operating loss carryovers of $294.2 million and $314.0 million, respectively. These carryovers expire in varying amounts from 2016 through 2034.
The provision for income taxes differs from that computed at the federal statutory corporate tax rate as follows:
Year Ended December 31, 2015 | Year Ended December 31, 2014 | Nine Months Ended December 31, 2013 | ||||||||||||||||||
Amount | % of Pretax Income | Amount | % of Pretax Income | Amount | % of Pretax Income | |||||||||||||||
(Dollars in thousands) | ||||||||||||||||||||
Net income before income taxes | $ | 48,311 | 100.0 | % | $ | 14,632 | 100.0 | % | $ | 111,632 | 100.0 | % | ||||||||
Income tax expense at federal statutory rate | $ | 16,909 | 35.0 | $ | 5,121 | 35.0 | $ | 39,071 | 35.0 | |||||||||||
State income taxes, net of federal income tax benefits | 2,507 | 5.2 | 746 | 5.1 | (1,008 | ) | (0.9 | ) | ||||||||||||
Cancellation of indebtedness income exclusion | — | — | — | — | (47,080 | ) | (42.2 | ) | ||||||||||||
Increase (decrease) in valuation allowance | (108,899 | ) | (225.6 | ) | (5,806 | ) | (39.7 | ) | 7,906 | 7.1 | ||||||||||
Other | 36 | 0.2 | (51 | ) | (0.3 | ) | 1,120 | 1.0 | ||||||||||||
Income tax expense (benefit) | $ | (89,447 | ) | (185.2 | )% | $ | 10 | 0.1 | % | $ | 9 | — | % | |||||||
As of December 31, 2015 and December 31, 2014, the net deferred tax asset, prior to any valuation allowance, was $94.8 million and $113.1 million, respectively. Management recorded a full valuation allowance against the deferred tax asset in September 2009 based largely on negative evidence represented by the losses in prior years caused by significant provisions associated with its loan portfolio coupled with excessive debt costs. As of December 31, 2014, the Company determined that a full valuation allowance was still necessary. The realization of the deferred tax asset is assessed and a valuation allowance is recorded if it is “more likely than not” that all or a portion of the DTA will not be realized. The determination of the realizability of the deferred tax asset is highly subjective and dependent upon management’s evaluation and judgement of both positive and negative evidence, the forecasts of future income, applicable tax planning strategies and assessments of the current and future economic and business conditions. All available evidence, both positive and negative, is considered to determine whether, based on the weight of that evidence, a valuation allowance against the net deferred tax asset is required.
Based on the Company’s periodic assessment of all of the positive and negative evidence regarding the deferred tax asset position in 2015, it was determined that it is more likely than not that the Company would be able to realize all of the federal deferred tax asset, including all net operating loss carryforwards. The Company also determined that it is more likely than not that it would be able to realize substantially all of the state deferred tax asset, with the exception of $4.2 million pertaining to certain multi state loss carryforwards, including states in which the Company no longer does business. Consequently, the Company has substantially reversed this valuation allowance on the deferred tax asset during 2015.
The positive evidence considered by management in arriving at the conclusion to reverse substantially all of the valuation allowance during the year ended December 31, 2015 included: (1) ten consecutive quarters of pre-tax earnings; (2) a twelve
112
quarter cumulative pre-tax book income position; (3) significant reductions in the level of non-performing assets since their peak, which was the primary source of the losses generated in prior periods; (4) the successful execution of operational efficiency initiatives in 2015; (5) adequacy of capital to fund balance sheet and future asset growth; and (6) forecasted positive core earnings trends which allow for the utilization of substantially all net operating losses before the statutory expiration periods. The negative evidence considered by management included: (1) operating losses and the lack of taxes paid in prior years; (2) the charges in 2015 pertaining to the operational efficiency initiatives; and (3) classified asset levels relative to peers. All these factors were given the appropriate weighting based on the extent to which the positive and negative evidence can be objectively verified. Based on management’s analysis, it was concluded that the positive evidence was sufficient to overcome the weight of negative evidence.
Based on the Company's assessment of all of the positive and negative evidence as of December 31, 2015, it was determined that a net valuation allowance reduction of $108.9 million during the year ended December 31, 2015, was necessary.
The Company’s ultimate realization of the deferred tax asset will be dependent upon the generation of future taxable income during the periods in which temporary differences become deductible. Management considers the nature and amount of historical and projected future taxable income, the scheduled reversal of deferred tax assets and liabilities and available tax planning strategies in making this assessment. The amount of deferred taxes recognized could be impacted by changes to any of these variables.
The significant components of deferred tax assets (liabilities) are as follows:
December 31, 2015 | December 31, 2014 | ||||||
(In thousands) | |||||||
Deferred tax assets: | |||||||
Allowance for loan losses | $ | 10,086 | $ | 18,870 | |||
OREO valuation allowance and other loss reserves | 7,506 | 10,307 | |||||
Federal NOL carryforwards | 61,392 | 68,237 | |||||
State NOL carryforwards | 15,319 | 16,343 | |||||
Unrealized securities losses, net | 1,532 | 963 | |||||
Alternative minimum tax credit carryforward | 2,522 | 2,129 | |||||
Deferred gain on sales leaseback | 1,986 | 2,541 | |||||
Other | 3,381 | 2,994 | |||||
Total deferred tax assets | 103,724 | 122,384 | |||||
Valuation allowance | (4,200 | ) | (113,099 | ) | |||
Adjusted deferred tax assets | 99,524 | 9,285 | |||||
Deferred tax liabilities: | |||||||
FHLB stock dividends | (833 | ) | (833 | ) | |||
Mortgage servicing rights | (7,597 | ) | (7,784 | ) | |||
Other | (474 | ) | (668 | ) | |||
Total deferred tax liabilities | (8,904 | ) | (9,285 | ) | |||
Net deferred tax assets | $ | 90,620 | $ | — | |||
The Company is subject to U.S. federal income tax as well as income tax of various state jurisdictions. The tax years 2012-2015 remain open to examination by the Internal Revenue Service and certain state jurisdictions while the years 2011-2015 remain open to examination by certain other state jurisdictions.
Note 18 – Earnings Per Share
Basic earnings per share for the years ended December 31, 2015 and 2014 have been determined by dividing net income available to common equity for the respective periods by the weighted average number of shares of common stock outstanding. Unvested shares of restricted stock are not considered outstanding for purposes of basic earnings per share. Diluted earnings per share is computed by dividing net income by the weighted average number of common shares outstanding plus the effect of dilutive securities. The effects of dilutive securities, if any, are computed using the treasury stock method.
113
The computation of earnings per share is as follows:
Year Ended December 31, 2015 | Year Ended December 31, 2014 | Nine Months Ended December 31, 2013 (1) | |||||||||
(In thousands, except per share data) | |||||||||||
Numerator: | |||||||||||
Numerator for basic and diluted earnings per share – net income available to common equity | $ | 137,758 | $ | 14,622 | $ | 206,918 | |||||
Denominator: | |||||||||||
Denominator for basic earnings per share – weighted average shares | 9,407 | 9,107 | 16,989 | ||||||||
Effect of dilutive securities: | |||||||||||
Restricted stock (2) | 51 | 44 | — | ||||||||
Denominator for diluted earnings per share – weighted average shares | $ | 9,458 | $ | 9,151 | $ | 16,989 | |||||
Basic income per common share | $ | 14.64 | $ | 1.61 | $ | 12.18 | |||||
Diluted income per common share | $ | 14.57 | $ | 1.60 | $ | 12.18 | |||||
(1) | The calculation of weighted average shares included 21,247,000 shares of Legacy Common Stock outstanding through September 26, 2013 and 9,050,000 shares of common stock outstanding from September 27 through December 31, 2013. |
(2) | Computed based on the treasury stock method using the average market price per period. The value used prior to the issuance of shares pursuant to the recapitalization transaction on September 27, 2013 was approximately 90% of book value. Since the time of the transaction, the position of the Company has remained relatively the same, therefore the issuance of the August 15, 2014 grant of restricted stock shares at 90% of book value as of the most recent month end was a reasonable approximation of fair value. |
Note 19 – Condensed Parent Only Financial Information
The following represents parent company only financial information:
Condensed Balance Sheets
December 31, | |||||||
2015 | 2014 | ||||||
(In thousands) | |||||||
Assets | |||||||
Cash and cash equivalents | $ | 21,847 | $ | 10,081 | |||
Investment in subsidiaries | 342,621 | 216,547 | |||||
Intercompany receivable from non-bank subsidiaries | 1,327 | 996 | |||||
Other assets | 1,480 | 133 | |||||
Total assets | $ | 367,275 | $ | 227,757 | |||
Liabilities | |||||||
Total liabilities | $ | 634 | $ | 94 | |||
Stockholders’ Equity | |||||||
Total stockholders’ equity | 366,641 | 227,663 | |||||
Total liabilities and stockholders’ equity | $ | 367,275 | $ | 227,757 | |||
114
Condensed Statements of Operations
Year Ended December 31, 2015 | Year Ended December 31, 2014 | Nine Months Ended December 31, 2013 | |||||||||
(In thousands) | |||||||||||
Interest income | $ | 15 | $ | 8 | $ | 4 | |||||
Interest expense | — | — | 7,053 | ||||||||
Net interest income (expense) | 15 | 8 | (7,049 | ) | |||||||
Equity in net income from subsidiaries | 138,719 | 15,502 | 18,787 | ||||||||
Non-interest income | — | 100 | — | ||||||||
Extinguishment of debt | — | — | 134,514 | ||||||||
Income from operations | 138,734 | 15,610 | 146,252 | ||||||||
Reorganization costs | — | (64 | ) | 1,929 | |||||||
Non-interest expense | 2,002 | 1,052 | 1,031 | ||||||||
Income before income taxes | 136,732 | 14,622 | 143,292 | ||||||||
Income tax expense (benefit) | (1,026 | ) | — | 31,669 | |||||||
Net income | 137,758 | 14,622 | 111,623 | ||||||||
Preferred stock dividends in arrears | — | — | (2,538 | ) | |||||||
Preferred stock discount accretion | — | — | (6,167 | ) | |||||||
Retirement of preferred shares | — | — | 104,000 | ||||||||
Net income available to common equity | $ | 137,758 | $ | 14,622 | $ | 206,918 | |||||
115
Condensed Statements of Cash Flows
Year Ended December 31, 2015 | Year Ended December 31, 2014 | Nine Months Ended December 31, 2013 | |||||||||
(In thousands) | |||||||||||
Operating Activities | |||||||||||
Net income | $ | 137,758 | $ | 14,622 | $ | 111,623 | |||||
Adjustments to reconcile net income to net cash used in operating activities: | |||||||||||
Equity in net income of subsidiaries | (138,719 | ) | (15,502 | ) | (18,787 | ) | |||||
Extinguishment of debt | — | — | (134,514 | ) | |||||||
Decrease in accrued interest and fees payable | — | — | 7,053 | ||||||||
Costs associated with stock plan | — | — | 2,922 | ||||||||
Stock-based compensation expense | 2,185 | 996 | — | ||||||||
Increase in other assets and liabilities | (1,341 | ) | (900 | ) | (2,872 | ) | |||||
Net cash used in operating activities | (117 | ) | (784 | ) | (34,575 | ) | |||||
Investing Activities | |||||||||||
Dividend received from subsidiaries | 12,000 | — | 5,402 | ||||||||
Capital contribution to subsidiaries | — | — | (80,205 | ) | |||||||
Net cash provided by (used in) investing activities | 12,000 | — | (74,803 | ) | |||||||
Financing Activities | |||||||||||
Repayment of borrowed funds | — | — | (49,000 | ) | |||||||
Recapitalization transaction fees | — | — | (14,360 | ) | |||||||
Tax benefit for restricted stock | 205 | — | — | ||||||||
Retirement of vested shares | (322 | ) | — | — | |||||||
Issuance of common stock | — | 7,951 | 175,000 | ||||||||
Stock issuance cost | — | (2,324 | ) | — | |||||||
Net cash provided by financing activities | (117 | ) | 5,627 | 111,640 | |||||||
Increase in cash and cash equivalents | 11,766 | 4,843 | 2,262 | ||||||||
Cash and cash equivalents at beginning of year | 10,081 | 5,238 | 2,976 | ||||||||
Cash and cash equivalents at end of year | $ | 21,847 | $ | 10,081 | $ | 5,238 | |||||
116
Note 20 – Quarterly Financial Data (unaudited)
Unaudited condensed financial data by quarter for year ended December 31, 2015 and 2014 is as follows:
Three Months Ended | |||||||||||||||||||||||||||||||
12/31/2015 | 9/30/2015 | 6/30/2015 | 3/31/2015 | 12/31/2014 | 9/30/2014 | 6/30/2014 | 3/31/2014 | ||||||||||||||||||||||||
(In thousands, except per share data) | |||||||||||||||||||||||||||||||
Operations Data: | |||||||||||||||||||||||||||||||
Net interest income | $ | 17,015 | $ | 17,286 | $ | 17,424 | $ | 17,056 | $ | 17,501 | $ | 17,558 | $ | 17,862 | $ | 18,315 | |||||||||||||||
Provision for loan losses | (5,086 | ) | (22,410 | ) | (646 | ) | (1,354 | ) | (3,281 | ) | (1,304 | ) | — | — | |||||||||||||||||
Non-interest income | 7,772 | 8,721 | 9,738 | 8,740 | 8,962 | 8,015 | 7,610 | 5,932 | |||||||||||||||||||||||
Non-interest expense | 18,149 | 22,552 | 23,263 | 20,973 | 24,621 | 21,915 | 22,855 | 22,317 | |||||||||||||||||||||||
Income before income tax expense | 11,724 | 25,865 | 4,545 | 6,177 | 5,123 | 4,962 | 2,617 | 1,930 | |||||||||||||||||||||||
Income tax expense (benefit) | 3,103 | 10,394 | (102,976 | ) | 32 | — | — | 10 | — | ||||||||||||||||||||||
Net income | 8,621 | 15,471 | 107,521 | 6,145 | 5,123 | 4,962 | 2,607 | 1,930 | |||||||||||||||||||||||
Per Share: | |||||||||||||||||||||||||||||||
Basic income per common share | $ | 0.91 | $ | 1.64 | $ | 11.42 | $ | 0.66 | $ | 0.56 | $ | 0.55 | $ | 0.29 | $ | 0.21 | |||||||||||||||
Diluted income per common share | 0.91 | 1.62 | 11.37 | 0.65 | 0.55 | 0.55 | 0.29 | 0.21 | |||||||||||||||||||||||
Dividends per common share | — | — | — | — | — | — | — | — | |||||||||||||||||||||||
Book value per common share | 38.20 | 37.49 | 35.68 | 24.66 | 23.85 | 23.22 | 23.37 | 22.84 | |||||||||||||||||||||||
Item 9. | Changes in and Disagreements with Accountants on Accounting and Financial Disclosure |
None.
Item 9A. | Controls and Procedures |
Disclosure Controls and Procedures
The Company maintains disclosure controls and procedures that are designed to ensure that information required to be disclosed in the Company’s reports under the Exchange Act is recorded, processed, summarized and reported within the time periods specified in the SEC’s rules and forms, and that such information is accumulated and communicated to management, including the Company’s Chief Executive Officer and Chief Financial Officer, as appropriate, to allow timely decisions regarding required disclosures. The design of any system of disclosure controls and procedures is based in part upon certain assumptions about the likelihood of future events, and there can be no assurance that any disclosure controls and procedures will succeed in achieving their stated goals under all potential future conditions.
Evaluation of Disclosure Controls and Procedures
Our Chief Executive Officer ("CEO") and Chief Financial Officer ("CFO") have evaluated the effectiveness of the design and operation of our disclosure and control procedures as of December 31, 2015. As of December 31, 2015, the CEO and CFO have concluded that the disclosure and control procedures set forth above were effective.
Management’s Annual Report on Internal Control over Financial Reporting
Our management is responsible for establishing and maintaining adequate internal control over financial reporting, as such term is defined in Exchange Act Rule 13a-15(f). Our internal control over financial reporting is a process designed by, or under the supervision of, our Chief Executive Officer and Chief Financial Officer, to provide reasonable assurance regarding the reliability of financial reporting and the preparation of financial statements for external purposes in accordance with generally accepted accounting principles. Internal control over financial reporting includes those policies and procedures that:
• | Pertain to the maintenance of reports that, in reasonable detail, accurately and fairly reflect the transactions and dispositions of assets of the Company; |
117
• | Provide reasonable assurance that transactions are recorded as necessary to permit preparation of financial statements in accordance with generally accepted accounting principles, and that receipts and expenditures of the Company are being made in accordance with authorizations of management and directors of the Company; and |
• | Provide reasonable assurance regarding prevention or timely detection of unauthorized acquisition, use or disposition of Company assets. |
Because of its inherent limitations, internal control over financial reporting may not prevent or detect misstatements. Also, projections of any evaluation of effectiveness to future periods are subject to the risk that controls may become inadequate because of the changes in conditions, or that the degree of compliance with the policies or procedures may deteriorate.
Management has assessed the effectiveness of the Company’s internal control over financial reporting as of December 31, 2015. In making its assessment, management used the criteria set forth by the Committee of Sponsoring Organizations of the Treadway Commission (“COSO”) Internal Control – Integrated Framework in 2013. These criteria include the control environment, risk assessment, control activities, information and communication and monitoring of each of the above criteria. Based on management’s assessment, it determined that the Company’s internal control over financial reporting was effective as of December 31, 2015.
RSM US LLP, an independent registered public accounting firm that audited the Consolidated Financial Statements of the Company included in this Annual Report on Form 10-K, has issued an attestation report on the effectiveness of the Company’s internal control over financial reporting as of December 31, 2015. The report, which expresses an unqualified opinion of the effectiveness of the Company’s internal control over financial reporting as of December 31, 2015, is included in this Item under the heading “Report of Independent Registered Public Accounting Firm.”
Changes in Internal Control over Financial Reporting
There has been no change in the Company’s internal control over financial reporting (as defined in Rule 13a-15(f) of the Exchange Act) that occurred during the three months ended December 31, 2015 that has materially affected, or is reasonably likely to materially affect, the Company’s internal control over financial reporting.
Item 9B. | Other Information |
None.
118
PART III
Item 10. | Directors, Executive Officers and Corporate Governance |
The information required to be disclosed pursuant to this item shall be included in an amendment to this report filed with the SEC on Form 10-K/A not later than 120 days after December 31, 2015 or incorporated by reference from our definitive proxy statement for the election of directors, to the extent required, not later than 120 days after December 31, 2015.
The Company has adopted a code of business conduct and ethics for the CEO and CFO which is available on the Company’s website at www.anchorbank.com.
Item 11. | Executive Compensation |
The information required to be disclosed pursuant to this item shall be included in an amendment to this report filed with the SEC on Form 10-K/A not later than 120 days after December 31, 2015 or incorporated by reference from our definitive proxy statement for the election of directors, to the extent required, not later than 120 days after December 31, 2015.
Item 12. | Security Ownership of Certain Beneficial Owners and Management and Related Shareholder Matters. |
The information required to be disclosed pursuant to this item shall be included in an amendment to this report filed with the SEC on Form 10-K/A not later than 120 days after December 31, 2015 or incorporated by reference from our definitive proxy statement for the election of directors, to the extent required, not later than 120 days after December 31, 2015.
Item 13. | Certain Relationships and Related Transactions, and Director Independence |
The information required to be disclosed pursuant to this item shall be included in an amendment to this report filed with the SEC on Form 10-K/A not later than 120 days after December 31, 2015 or incorporated by reference from our definitive proxy statement for the election of directors, to the extent required, not later than 120 days after December 31, 2015.
Item 14. | Principal Accountant Fees and Services |
The information required to be disclosed pursuant to this item shall be included in an amendment to this report filed with the SEC on Form 10-K/A not later than 120 days after December 31, 2015 or incorporated by reference from our definitive proxy statement for the election of directors, to the extent required, not later than 120 days after December 31, 2015.
119
PART IV
Item 15. | Exhibits and Financial Statement Schedules |
(a) (1) Financial Statements
The following consolidated audited financial statements of the Company and its subsidiaries, together with the related reports of RSM US LLP, dated March 11, 2016, are incorporated herein by reference to Item 8 of this Annual Report on Form 10-K:
Consolidated Balance Sheets at December 31, 2015 and 2014.
Consolidated Statements of Operations and Comprehensive Income (Loss) for the year ended December 31, 2015, 2014 and the nine months ended December 31, 2013.
Consolidated Statements of Changes in Stockholders’ Equity (Deficit) for the year ended December 31, 2015, 2014 and the nine months ended December 31, 2013.
Consolidated Statements of Cash Flows for the year ended December 31, 2015, 2014 and the nine months ended December 31, 2013.
Report of Independent Registered Public Accounting Firm on Consolidated Financial Statements.
Report of Independent Registered Public Accounting Firm on Internal Control Over Financial Reporting.
Notes to Consolidated Financial Statements.
(a) (2) Financial Statement Schedules
All schedules are omitted because they are not required or are not applicable or the required information is shown in the consolidated financial statements or notes thereto.
(a) (3) Exhibits
Exhibit Number | Description | |
2.1 | Confirmation Order, dated August 30, 2013 (incorporated by reference to Exhibit 3.1 of the Registrant’s Form 8-K filed on September 6, 2013). | |
2.2 | Agreement and Plan of Merger, dated January 11, 2016, between Old National Bancorp and Anchor BanCorp Wisconsin Inc. (incorporated by reference to Exhibit 2.1 of the Registrant's Current Report on Form 8-K filed January 12, 2016). | |
3.1 | Amended and Restated Certificate of Incorporation of Anchor BanCorp Wisconsin Inc. (incorporated by reference to Exhibits 3.1 of the Registrant’s Forms 8-K filed on September 27, 2013 and November 29, 2013). | |
3.2 | Amended and Restated Bylaws of Anchor BanCorp Wisconsin Inc. (Effective September 25, 2013) (incorporated by reference to Exhibit 3.2 of the Registrant’s Form 8-K filed on September 27, 2013). | |
4.1 | Form of 9.9% Investor Stock Purchase Agreement dated August 12, 2013 by and between the Company and the investors named therein (incorporated by reference to Exhibit 10.1 of the Registrant’s Form 8-K filed on August 13, 2013). | |
4.2 | Form of 4.9% Investor Stock Purchase Agreement dated August 12, 2013 by and between the Company and the investors named therein (incorporated by reference to Exhibit 10.2 of the Registrant’s Form 8-K filed on August 13, 2013). | |
4.3 | Form of Management Investor Stock Purchase Agreement dated August 12, 2013 by and between the Company and the investors named therein (incorporated by reference to Exhibit 10.3 of the Registrant’s Form 8-K filed on August 13, 2013). | |
4.4 | Form of Secondary Sale Purchaser Agreement dated September 19, 2013 by and between the Company and the investors named therein (incorporated by reference to Exhibit 4.5 of the Registrant’s Form S-1 Registration Statement filed on December 19, 2013). | |
10.1 | Anchor BanCorp Wisconsin Inc. Retirement Plan (incorporated by reference to Exhibit 10.1 of Registrant’s Form S-1 Registration Statement filed on March 19, 1992). | |
10.2 | Employment Agreement between the Bank and Chris M. Bauer, dated September 5, 2014 (incorporated by reference to Exhibit 10.9 of the Company’s Registration Statement on Form S-1, filed September 9, 2014, File No. 333-192964). | |
120
Exhibit Number | Description | |
10.3 | Key Executive Employment and Severance Agreement between the Bank and Thomas Dolan, dated September 5, 2014 and effective September 3, 2014 (incorporated by reference to Exhibit 10.10 of the Company’s Registration Statement on Form S-1, filed September 9, 2014, File No. 333-192964). | |
10.4 | Key Executive Employment and Severance Agreement between the Bank and Martha M. Hayes, dated September 5, 2014 (incorporated by reference to Exhibit 10.11 of the Company’s Registration Statement on Form S-1, filed September 9, 2014, File No. 333-192964). | |
10.5 | Key Executive Employment and Severance Agreement between the Bank and William T. James, dated September 5, 2014 and effective September 3, 2014 (incorporated by reference to Exhibit 10.12 of the Company’s Registration Statement on Form S-1, filed September 9, 2014, File No. 333-192964). | |
10.6 | Key Executive Employment and Severance Agreement between the Bank and Scott M. McBrair, dated September 5, 2014 (incorporated by reference to Exhibit 10.13 of the Company’s Registration Statement on Form S-1, filed September 9, 2014, File No. 333-192964). | |
10.7 | Key Executive Employment and Severance Agreement between the Bank and Mark D. Timmerman, dated September 5, 2014 (incorporated by reference to Exhibit 10.14 of the Company’s Registration Statement on Form S-1, filed September 9, 2014, File No. 333-192964). | |
10.8 | Anchor BanCorp Wisconsin Inc. 2014 Omnibus Incentive Plan (incorporated by reference to Exhibit 99.1 to the Company's Current Report on Form 8-K filed with the SEC August 14, 2014). | |
11.1 | Computation of Earnings per Share. Refer to Note 18 – Earnings Per Share to the Consolidated Financial Statements in Item 8. | |
21.1 | List of Subsidiaries of the Registrant. Subsidiary information is incorporated by reference to “Part I, Item 1, Business – General” and “Part I, Item 1, Business – Subsidiaries.” | |
23.1 | Consent of RSM US LLP. | |
24.1 | Powers of Attorney. | |
31.1 | Certification of Chief Executive Officer Pursuant to Rules 13a-14 and 15d-14 of the Securities Exchange Act of 1934 and Section 302 of the Sarbanes-Oxley Act of 2002. | |
31.2 | Certification of Chief Financial Officer Pursuant to Rules 13a-14 and 15d-14 of the Securities Exchange Act of 1934 and Section 302 of the Sarbanes-Oxley Act of 2002. | |
32.1 | Certification of Chief Executive Officer pursuant to Section 906 of the Sarbanes-Oxley Act of 2002 (18 U.S.C. 1350). | |
32.2 | Certification of Chief Financial Officer pursuant to Section 906 of the Sarbanes-Oxley Act of 2002 (18 U.S.C. 1350). | |
101 | The following financial statements from the Anchor Bancorp Wisconsin, Inc. Annual Report on Form 10-K for the year ended December 31, 2014, formatted in Extensive Business Reporting Language (XBRL): (i) Consolidated Balance Sheets, (ii) Consolidated Statements of Operations and Comprehensive Income (Loss), (iii) Consolidated Statements of Changes in Stockholders’ Equity (Deficit), (iv) Consolidated Statements of Cash Flows and (v) the Notes to Consolidated Financial Statements. | |
(b)Exhibits
Exhibits to the Form 10-K required by Item 601 of Regulation S-K are attached or incorporated herein by reference as stated in (a)(3) and the Index to Exhibits.
(c)Financial Statements excluded from Annual Report to Stockholders pursuant to Rule 14a-3(b)
Not applicable
121
Signatures
Pursuant to the requirements of Section 13 or 15(d) of the Securities Exchange Act of 1934, the registrant has duly caused this report to be signed on its behalf by the undersigned, thereunto duly authorized.
ANCHOR BANCORP WISCONSIN INC. | ||||
By: | /s/ Chris M. Bauer | |||
Name: | Chris M. Bauer | |||
Title: | President and Chief Executive Officer | |||
Date: | March 11, 2016 | |||
In accordance with the requirements of the Securities Exchange Act of 1934, this annual report has been signed by the following persons in the capacities and on the dates stated.
By: | * | By: | * | |||
Chris M. Bauer President and Chief Executive Officer, Director (principal executive officer) Date: March 11, 2016 | William T James Senior Vice President, Chief Financial Officer and Treasurer Date: March 11, 2016 | |||||
By: | * | By: | * | |||
Richard A. Bergstrom Director Date: March 11, 2016 | Pat Richter Director Date: March 11, 2016 | |||||
By: | * | By: | * | |||
David L. Omachinski Director Date: March 11, 2016 | Holly Cremer Director Date: March 11, 2016 | |||||
By: | * | By: | * | |||
Martin S. Friedman Director Date: March 11, 2016 | Bradley E. Cooper Director Date: March 11, 2016 | |||||
*By: | /s/ Chris M. Bauer | |
Chris M. Bauer Attorney-in-fact | ||
122