Attached files
| file | filename |
|---|---|
| 8-K - FORM 8-K - SEACOAST BANKING CORP OF FLORIDA | v416415_8k.htm |
| EX-99.1 - EXHIBIT 99.1 - SEACOAST BANKING CORP OF FLORIDA | v416415_ex99-1.htm |
| EX-99.2 - EXHIBIT 99.2 - SEACOAST BANKING CORP OF FLORIDA | v416415_ex99-2.htm |
Exhibit 99.3
Second Quarter 2015 July 24, 2015
2 Cautionary Notice Regarding Forward - Looking Statements This press release contains “forward - looking statements” within the meaning of Section 27 A of the Securities Act of 1933 and Section 21 E of the Securities Exchange Act of 1934 , including, without limitation, statements about future financial and operating results, ability to realized deferred tax assets, cost savings, enhanced revenues, economic and seasonal conditions in our markets, and improvements to reported earnings that may be realized from cost controls and for integration of banks that we have acquired, as well as statements with respect to Seacoast’s objectives, expectations and intentions and other statements that are not historical facts . Actual results may differ from those set forth in the forward - looking statements . Forward - looking statements include statements with respect to our beliefs, plans, objectives, goals, expectations, anticipations, estimates and intentions, and involve known and unknown risks, uncertainties and other factors, which may be beyond our control, and which may cause the actual results, performance or achievements of Seacoast to be materially different from future results, performance or achievements expressed or implied by such forward - looking statements . You should not expect us to update any forward - looking statements . You can identify these forward - looking statements through our use of words such as “may,” “will,” “anticipate,” “assume,” “should,” “support”, “indicate,” “would,” “believe,” “contemplate,” “expect,” “estimate,” “continue,” “further”, “point to,” “project,” “could,” “intend” or other similar words and expressions of the future . These forward - looking statements may not be realized due to a variety of factors, including, without limitation : the effects of future economic and market conditions, including seasonality ; governmental monetary and fiscal policies, as well as legislative, tax and regulatory changes ; changes in accounting policies, rules and practices ; the risks of changes in interest rates on the level and composition of deposits, loan demand, liquidity and the values of loan collateral, securities, and interest sensitive assets and liabilities ; interest rate risks, sensitivities and the shape of the yield curve ; the effects of competition from other commercial banks, thrifts, mortgage banking firms, consumer finance companies, credit unions, securities brokerage firms, insurance companies, money market and other mutual funds and other financial institutions operating in our market areas and elsewhere, including institutions operating regionally, nationally and internationally, together with such competitors offering banking products and services by mail, telephone, computer and the Internet ; and the failure of assumptions underlying the establishment of reserves for possible loan losses . The risks of mergers and acquisitions, include, without limitation : unexpected transaction costs, including the costs of integrating operations ; the risks that the businesses will not be integrated successfully or that such integration may be more difficult, time - consuming or costly than expected ; the potential failure to fully or timely realize expected revenues and revenue synergies, including as the result of revenues following the merger being lower than expected ; the risk of deposit and customer attrition ; any changes in deposit mix ; unexpected operating and other costs, which may differ or change from expectations ; the risks of customer and employee loss and business disruption, including, without limitation, as the result of difficulties in maintaining relationships with employees ; increased competitive pressures and solicitations of customers by competitors ; as well as the difficulties and risks inherent with entering new markets . All written or oral forward - looking statements attributable to us are expressly qualified in their entirety by this cautionary notice, including, without limitation, those risks and uncertainties described in our annual report on Form 10 - K for the year ended December 31 , 2014 under “Special Cautionary Notice Regarding Forward - Looking Statements” and “Risk Factors”, and otherwise in our SEC reports and filings . Such reports are available upon request from the Company, or from the Securities and Exchange Commission, including through the SEC’s Internet website at http : //www . sec . gov . Second Quarter 2015

Second Quarter 2015 3 Financial Highlights Growth Highlights Q2 2015 Financial and Growth Highlights • Loans increased $83 million or 18% annualized compared to Q1 2015, and rose 45% year - on - year. Excluding the acquisition of The BANKshares , loans increased $238 million or 18% compared to Q2 2014 • Total households increased a strong 5%, annualized from Q1 and 20% compared to Q2 2014. Excluding BANKshares customers, year - over - year household growth was 5.3 % • Achieved record levels of business and consumer lending, reflecting success in Accelerate Commercial Banking as well as digitally enabled marketing and cross - sell • Closed the Grand Bancshares, Inc. acquisition and completed the conversion of Grand’s customers over the July 17 weekend, adding approximately $190 million in deposits and $121 million in gross loans in the attractive Palm Beach market • Q2 Net Income Rises More Than 200% Year - on - Year to $5.8 Million, or $.18 per Share • Revenues increased $1.5 million, or 4.5%, sequentially to $34.5 million compared to Q1 2015, and $11.9 million, or 53%, compared to Q2 2014 • Net interest margin increased 40 basis points (0.40%) year - on - year, reflecting improved balance sheet mix • Adjusted net income excluding merger costs and other adjustments increased 106% to $6.2 million, or $ 0.19 per diluted share, compared to $3.0 million, or $0.12 per diluted share, in Q2 2014 Non - GAAP measure (1) (1) Non - GAAP measure, excludes merger related charges, branch closure expenses, and other adjustments (See Appendix for reconciliation to GAA P)
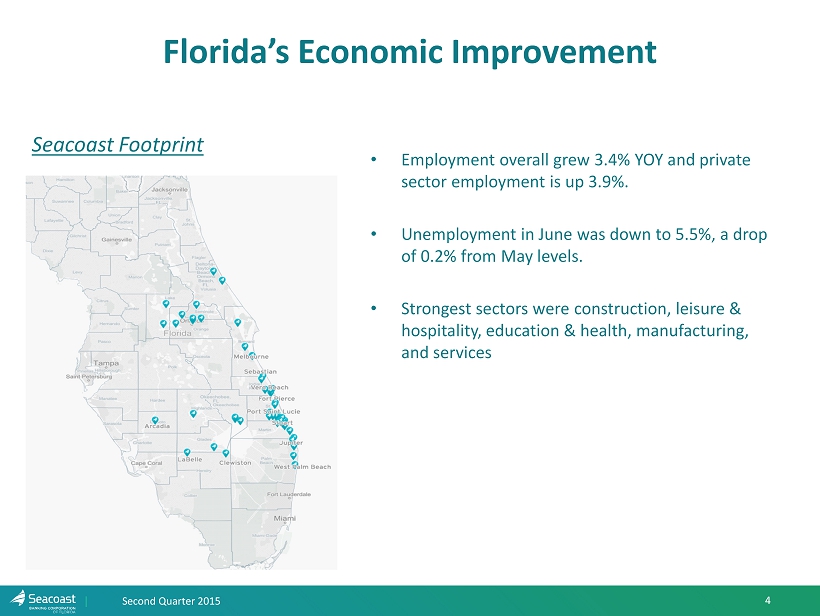
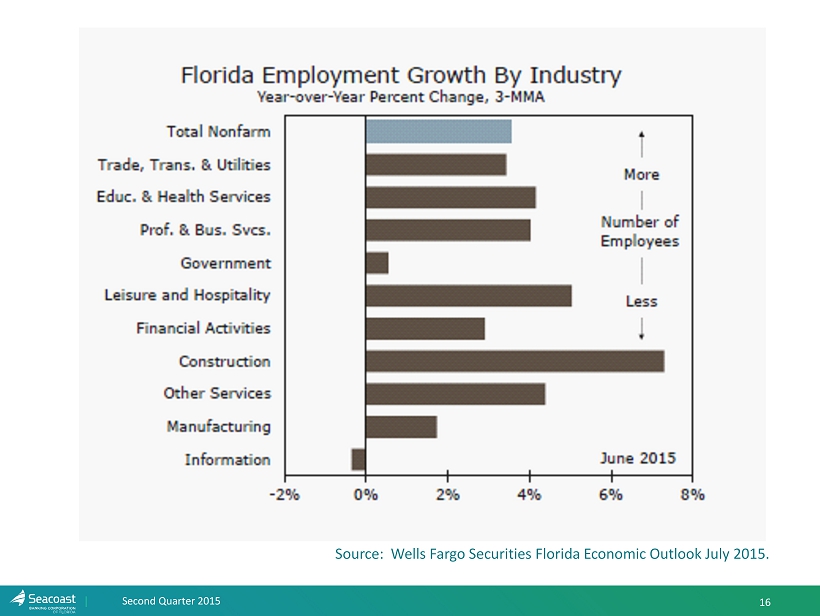
Florida’s Economic Improvement Second Quarter 2015 4 • Employment overall grew 3.4% YOY and private sector employment is up 3.9%. • Unemployment in June was down to 5.5%, a drop of 0.2% from May levels. • Strongest sectors were construction, leisure & hospitality, education & health, manufacturing, and services Seacoast Footprint
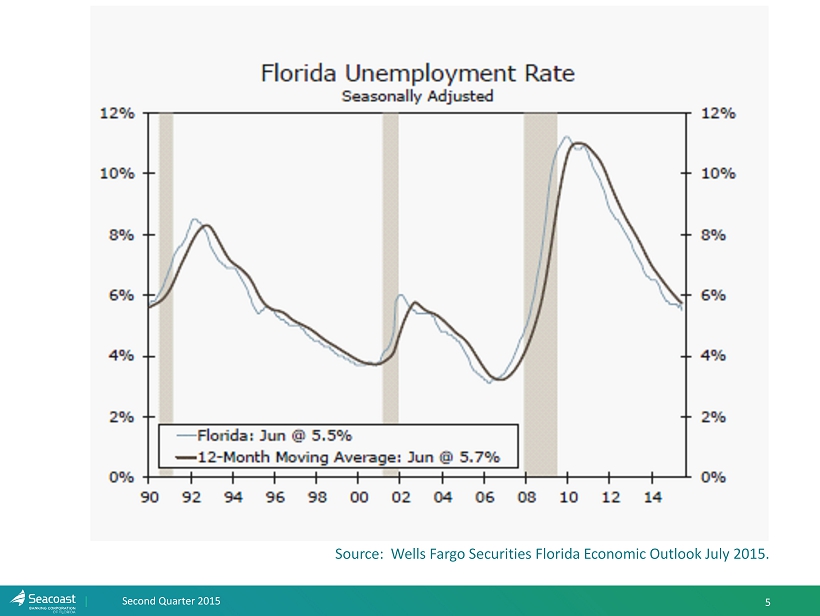
5 Source: Wells Fargo Securities Florida Economic Outlook July 2015 . Second Quarter 2015
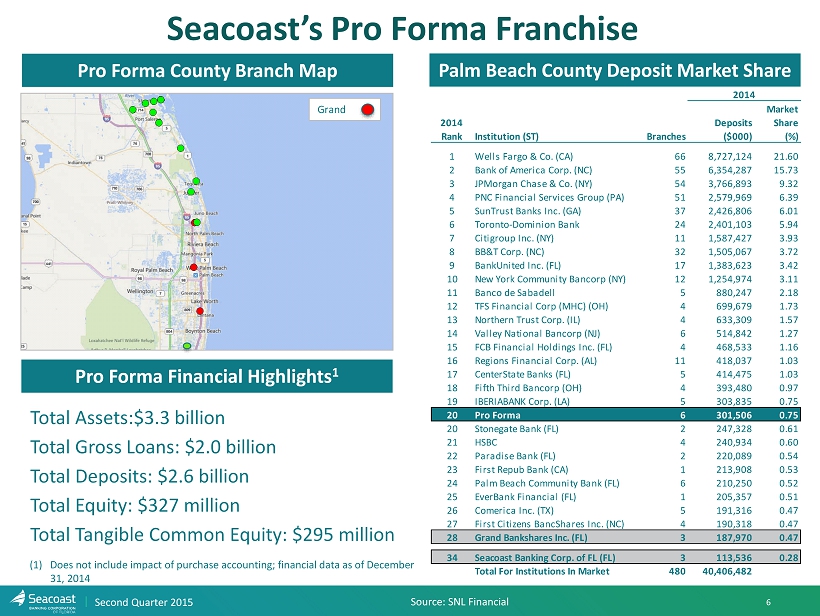
Second Quarter 2015 6 Pro Forma County Branch Map Palm Beach County Deposit Market Share Pro Forma Financial Highlights 1 2014 Rank Institution (ST) Branches Deposits ($000) Market Share (%) 1 Wells Fargo & Co. (CA) 66 8,727,124 21.60 2 Bank of America Corp. (NC) 55 6,354,287 15.73 3 JPMorgan Chase & Co. (NY) 54 3,766,893 9.32 4 PNC Financial Services Group (PA) 51 2,579,969 6.39 5 SunTrust Banks Inc. (GA) 37 2,426,806 6.01 6 Toronto-Dominion Bank 24 2,401,103 5.94 7 Citigroup Inc. (NY) 11 1,587,427 3.93 8 BB&T Corp. (NC) 32 1,505,067 3.72 9 BankUnited Inc. (FL) 17 1,383,623 3.42 10 New York Community Bancorp (NY) 12 1,254,974 3.11 11 Banco de Sabadell 5 880,247 2.18 12 TFS Financial Corp (MHC) (OH) 4 699,679 1.73 13 Northern Trust Corp. (IL) 4 633,309 1.57 14 Valley National Bancorp (NJ) 6 514,842 1.27 15 FCB Financial Holdings Inc. (FL) 4 468,533 1.16 16 Regions Financial Corp. (AL) 11 418,037 1.03 17 CenterState Banks (FL) 5 414,475 1.03 18 Fifth Third Bancorp (OH) 4 393,480 0.97 19 IBERIABANK Corp. (LA) 5 303,835 0.75 20 Pro Forma 6 301,506 0.75 20 Stonegate Bank (FL) 2 247,328 0.61 21 HSBC 4 240,934 0.60 22 Paradise Bank (FL) 2 220,089 0.54 23 First Repub Bank (CA) 1 213,908 0.53 24 Palm Beach Community Bank (FL) 6 210,250 0.52 25 EverBank Financial (FL) 1 205,357 0.51 26 Comerica Inc. (TX) 5 191,316 0.47 27 First Citizens BancShares Inc. (NC) 4 190,318 0.47 28 Grand Bankshares Inc. (FL) 3 187,970 0.47 34 Seacoast Banking Corp. of FL (FL) 3 113,536 0.28 Total For Institutions In Market 480 40,406,482 2014 Grand Total Assets:$3.3 billion Total Gross Loans: $2.0 billion Total Deposits: $2.6 billion Total Equity: $327 million Total Tangible Common Equity: $295 million (1) Does not include impact of purchase accounting; financial data as of December 31, 2014 Seacoast’s Pro Forma Franchise Source: SNL Financial
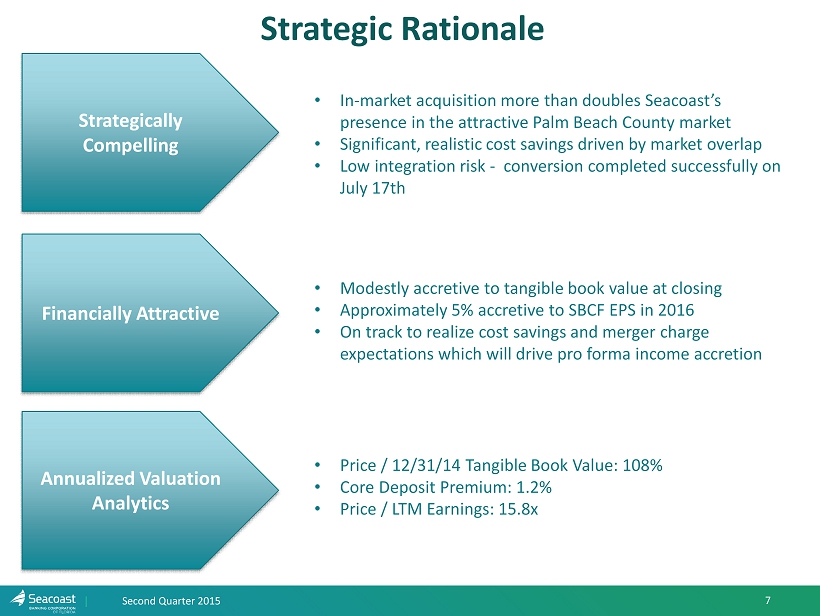
7 Strategic Rationale Second Quarter 2015 • Price / 12/31/14 Tangible Book Value: 108% • Core Deposit Premium: 1.2% • Price / LTM Earnings: 15.8x Strategically Compelling Financially Attractive Annualized Valuation Analytics • In - market acquisition more than doubles Seacoast’s presence in the attractive Palm Beach County market • Significant, realistic cost savings driven by market overlap • Low integration risk - conversion completed successfully on July 17th • Modestly accretive to tangible book value at closing • Approximately 5% accretive to SBCF EPS in 2016 • On track to realize cost savings and merger charge expectations which will drive pro forma income accretion

Second Quarter 2015 8 Earnings Improvement Trend • Adjusted Pretax, pre - provision income (1) significantly improved indicative of higher quality earnings. (1) Non - GAAP measure, excludes merger related charges, branch closure expenses, and other adjustments (See Appendix for reconciliation to GAA P) (Dollars in thousands) Second Quarter First Quarter Fourth Quarter Third Quarter Second Quarter 2015 2015 2014 2014 2014 GAAP Net Income $5,805 $5,859 ($1,517) $2,996 $1,918 GAAP Earnings per diluted share $ 0.18 $0.18 ($0.05) $ 0.12 $ 0.07 Adjusted Net Income (1) $ 6,172 $6,177 $4,179 $3,286 $2,990 Adjusted Pretax, pre - provision income (1) $ 10,815 $10,342 $7,464 $4,341 $3,821 Adjusted Earnings per diluted share (1) $0.19 $ 0.19 $0.13 $0.13 $0.12 Average shares outstanding 33,234 33,136 33,124 26,026 25,998
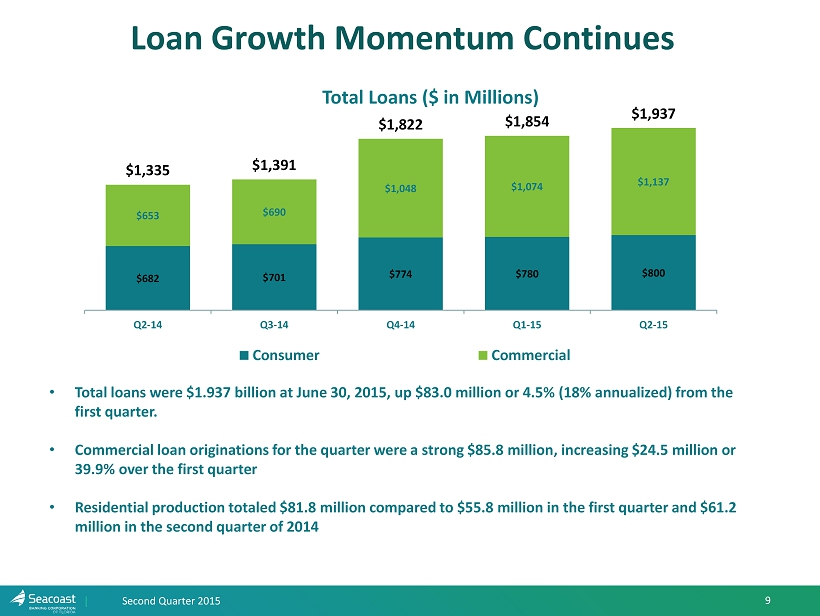
Second Quarter 2015 9 Loan Growth Momentum Continues • Total loans were $ 1.937 billion at June 30, 2015, up $83.0 million or 4.5% (18% annualized) from the first quarter. • Commercial loan originations for the quarter were a strong $85.8 million, increasing $24.5 million or 39.9% over the first quarter • Residential production totaled $81.8 million compared to $55.8 million in the first quarter and $61.2 million in the second quarter of 2014 $682 $701 $774 $780 $800 $653 $690 $1,048 $1,074 $ 1,137 $1,335 $1,391 $1,822 $1,854 $1,937 Q2-14 Q3-14 Q4-14 Q1-15 Q2-15 Total Loans ($ in Millions) Consumer Commercial
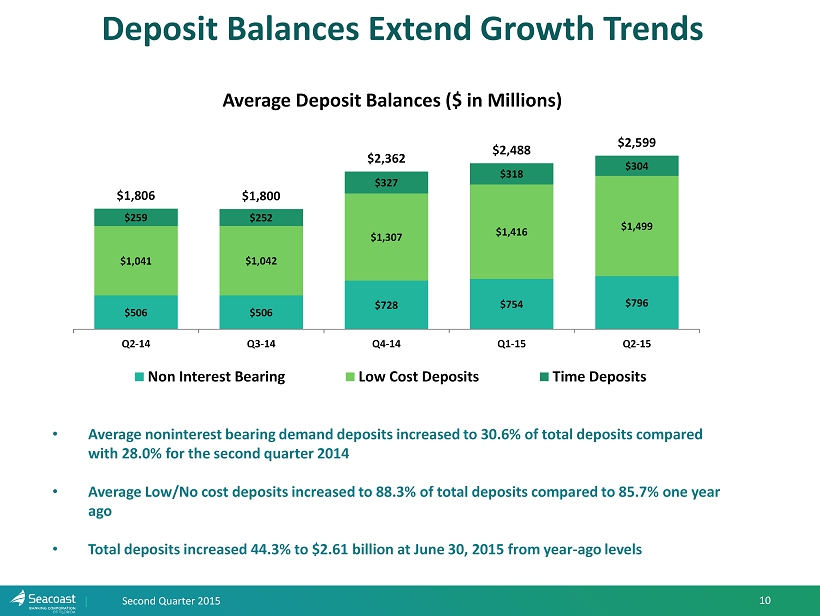
Second Quarter 2015 10 Deposit Balances Extend Growth Trends • Average noninterest bearing demand deposits increased to 30.6% of total deposits compared with 28.0% for the second quarter 2014 • Average Low/No cost deposits increased to 88.3% of total deposits compared to 85.7% one year ago • Total deposits increased 44.3% to $2.61 billion at June 30, 2015 from year - ago levels $506 $506 $728 $754 $796 $ 1,041 $ 1,042 $ 1,307 $ 1,416 $ 1,499 $259 $252 $327 $318 $304 $1,806 $1,800 $2,362 $2,488 $ 2,599 Q2-14 Q3-14 Q4-14 Q1-15 Q2-15 Average Deposit Balances ($ in Millions) Non Interest Bearing Low Cost Deposits Time Deposits
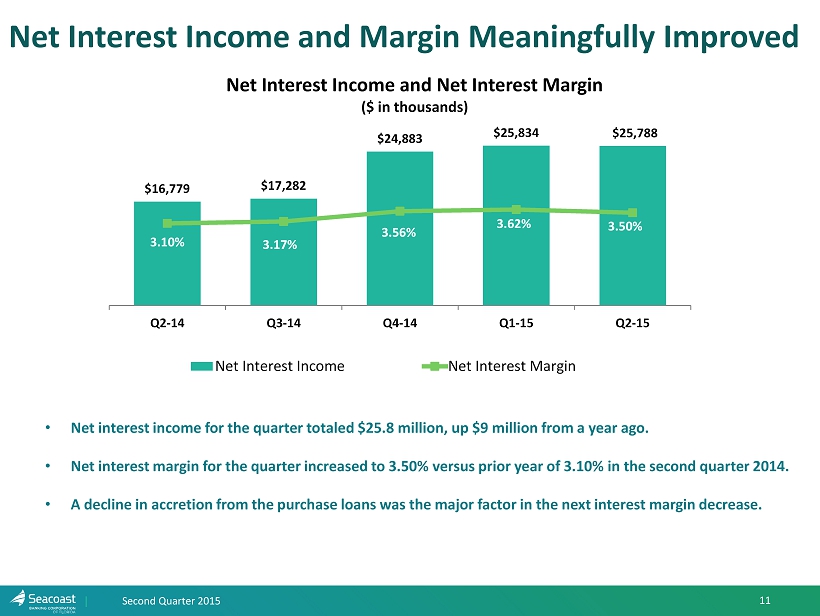
Second Quarter 2015 11 • Net interest income for the quarter totaled $ 25.8 million, up $9 million from a year ago. • Net interest margin for the quarter increased to 3.50% versus prior year of 3.10% in the second quarter 2014. • A decline in accretion from the purchase loans was the major factor in the next interest margin decrease. $16,779 $17,282 $24,883 $25,834 $25,788 3.10% 3.17% 3.56% 3.62% 3.50% 0 5,000 10,000 15,000 20,000 25,000 30,000 0.00% 1.00% 2.00% 3.00% 4.00% 5.00% 6.00% 7.00% Q2-14 Q3-14 Q4-14 Q1-15 Q2-15 Net Interest Income and Net Interest Margin ($ in thousands) Net Interest Income Net Interest Margin Net Interest Income and Margin Meaningfully Improved
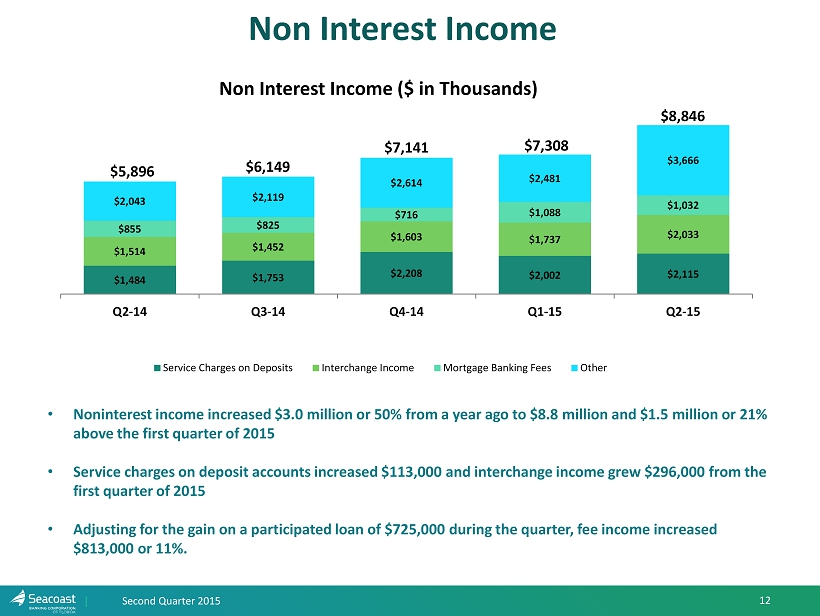
Second Quarter 2015 12 Non Interest Income • Noninterest income increased $3.0 million or 50% from a year ago to $8.8 million and $1.5 million or 21% above the first quarter of 2015 • Service charges on deposit accounts increased $113,000 and interchange income grew $296,000 from the first quarter of 2015 • Adjusting for the gain on a participated loan of $725,000 during the quarter, fee income increased $813,000 or 11%. $1,484 $1,753 $2,208 $2,002 $2,115 $1,514 $1,452 $1,603 $1,737 $2,033 $855 $825 $716 $1,088 $1,032 $2,043 $2,119 $2,614 $2,481 $3,666 Q2-14 Q3-14 Q4-14 Q1-15 Q2-15 Non Interest Income ($ in Thousands) Service Charges on Deposits Interchange Income Mortgage Banking Fees Other $6,149 $5,896 $7,141 $7,308 $8,846
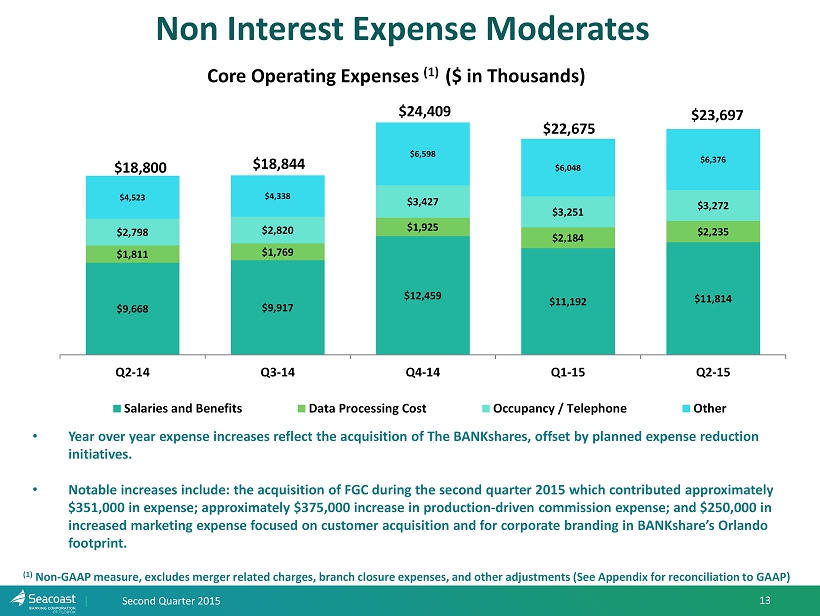
Second Quarter 2015 13 Non Interest Expense Moderates $9,668 $9,917 $12,459 $11,192 $ 11,814 $1,811 $1,769 $1,925 $2,184 $2,235 $2,798 $2,820 $ 3,427 $ 3,251 $ 3,272 $4,523 $4,338 $6,598 $6,048 $6,376 Q2-14 Q3-14 Q4-14 Q1-15 Q2-15 Core Operating Expenses (1) ($ in Thousands) Salaries and Benefits Data Processing Cost Occupancy / Telephone Other $22,675 $18,800 $18,844 $24,409 $23,697 • Year over year expense increases reflect the acquisition of The BANKshares , offset by planned expense reduction initiatives. • Notable increases include: the acquisition of FGC during the second quarter 2015 which contributed approximately $351,000 in expense; approximately $375,000 increase in production - driven commission expense; and $250,000 in increased marketing expense focused on customer acquisition and for corporate branding in BANKshare’s Orlando footprint. (1) Non - GAAP measure, excludes merger related charges, branch closure expenses, and other adjustments (See Appendix for reconciliation to GAA P)

Second Quarter 2015 14 $12,481 $8,000 $9,000 $10,000 $11,000 $12,000 $13,000 $14,000 $15,000 Jan-10 Mar-10 May-10 Jul-10 Sep-10 Nov-10 Jan-11 Mar-11 May-11 Jul-11 Sep-11 Nov-11 Jan-12 Mar-12 May-12 Jul-12 Sep-12 Nov-12 Jan-13 Mar-13 May-13 Jul-13 Sep-13 Nov-13 Jan-14 Mar-14 May-14 Jul-14 Sep-14 Nov-14 Jan-15 Mar-15 May-15 Deposits ($)* Per Square Foot Industry “sweet spot” for branches: $10,000 in deposits - per - square - foot** * Includes total low/no cost deposits (excludes CDs) ** Source: BAI Banking Strategies, Rightsizing the Branch, Oct. 29, 2014 “Generally , financial institutions should strive for a minimum of $10,000 in deposit balances per - square - foot for each branch. This magic number doesn’t guarantee a branch’s success, but it does provide a suitable benchmark that can help institutions right - size their locations and branch network .” ~BAI Increased Branch Network Efficiency

Second Quarter 2015 15 Appendix
16 Source: Wells Fargo Securities Florida Economic Outlook July 2015 . Second Quarter 2015
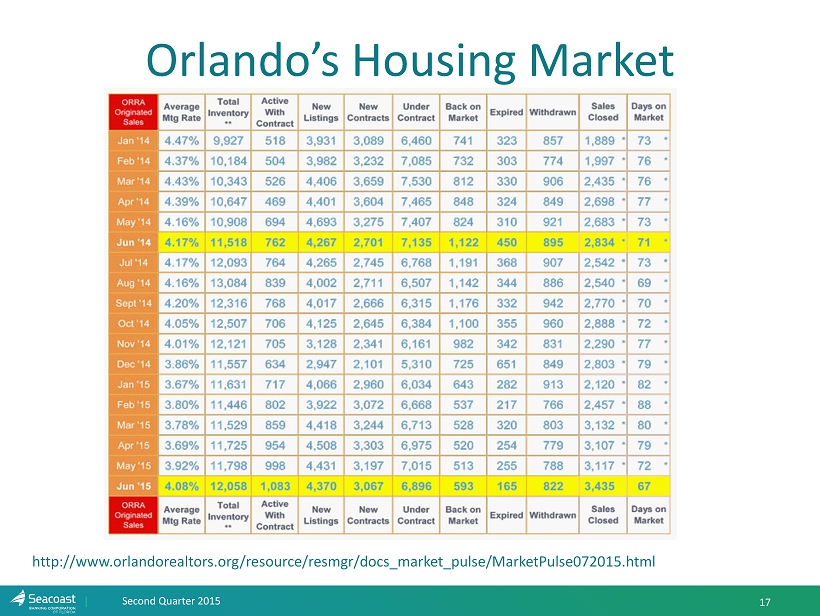
17 Second Quarter 2015 Orlando’s Housing Market http:// www.orlandorealtors.org/resource/resmgr/docs_market_pulse/MarketPulse072015.html
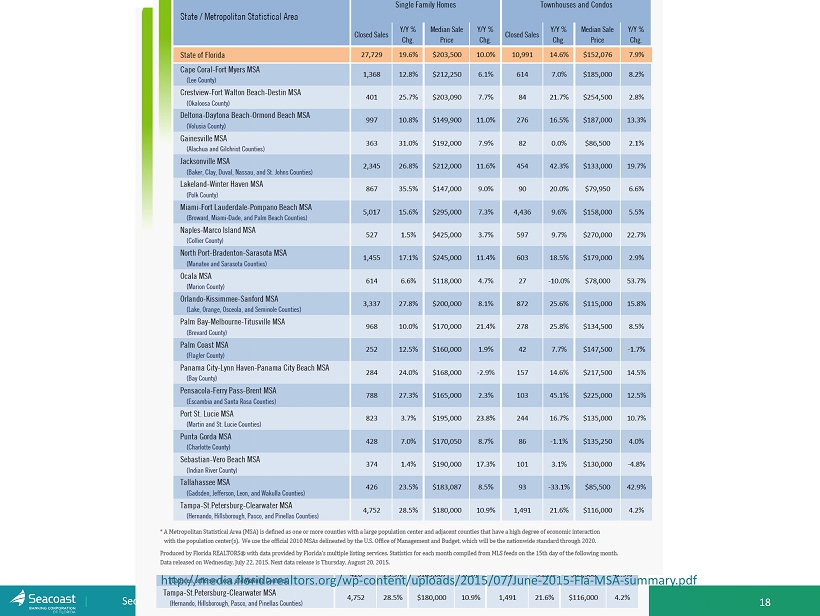
18 Second Quarter 2015 http://media.floridarealtors.org/wp - content/uploads/2015/07/June - 2015 - Fla - MSA - summary.pdf
Second Quarter 2015 19 Explanation of Certain Unaudited Non - GAAP Financial M easures • This press release contains financial information determined by methods other than Generally Accepted Accounting Principles (“GAAP”). The financial highlights provide reconciliations between GAAP net income and adjusted net income, GAAP income and adjusted pretax, preprovision income. Management uses these non - GAAP financial measures in its analysis of the Company’s performance and believes these presentations provide useful supplemental information, and a clearer understanding of the Company’s performance. The Company believes the non - GAAP measures enhance investors’ understanding of the Company’s business and performance. These measures are also useful in understanding performance trends and facilitate comparisons with the performance of other financial institutions. The limitations associated with operating measures are the risk that persons might disagree as to the appropriateness of items comprising these measures and that different companies might calculate these measures differently. The Company provides reconciliations between GAAP and these non - GAAP measures. These disclosures should not be considered an alternative to GAAP.

Second Quarter 2015 20 Net Income - GAAP to Non - GAAP Reconciliation Presented below is net income excluding adjustments for merger related charges, branch closure charges, and other non core expenses. The Company believes that these results of operations are a more meaningful depiction of the underlying fundamentals of its business and ove rall performance. (1) Non - GAAP measure, excludes merger related charges, branch closure expenses, and other adjustments (See Appendix for reconciliation to GAA P) (Dollars in thousands) Second Quarter 2015 First Quarter 2015 Fourth Quarter 2014 Third Quarter 2014 Second Quarter 2014 Net income $5,805 $5,859 ($1,517) $2,996 $1,918 Severance 29 12 478 328 181 Merger related charges 337 275 2,722 399 1,234 Branch closure charges and costs related to expense initiatives 0 0 4,261 68 114 Marketing and brand refresh expense 0 0 697 0 0 Stock compensation expense and other incentive costs related to improved outlook 0 0 1,213 0 0 Security (gains) 0 0 (108) (344) 0 Miscellaneous losses (gains) 0 0 119 (45) 144 Recovery of nonaccrual loan interest 0 0 0 (192) 0 Net loss on OREO and repossessed assets 53 81 9 156 92 Asset dispositions expense 173 143 103 139 118 Effective tax rate on adjustments (225) (193) (3,798) (219) (811) Adjusted Net Income (1) $6,172 $6,177 $4,179 $3,286 $2,990 Provision (recapture) for loan losses 855 433 118 (1,425) (1,444) Income taxes 3,788 3,732 3,167 2,480 2,275 Adjusted pretax, pre-provision income (1) $10,815 $10,342 $7,464 $4,341 $3,821 Adjusted earnings per diluted share (1) $0.19 $0.19 $0.13 $0.13 $0.12 Average shares outstanding 33,234 33,136 33,124 26,026 25,998

Second Quarter 2015 21 Non - Interest Expense - GAAP to Non - GAAP Reconciliation Presented below is core operating expenses and other non core expenses. The Company believes that these results of operations are a more meaningful depiction of the underlying fundamentals of its business and overall performance. (1) Non - GAAP measure, excludes merger related charges, branch closure expenses, and other adjustments (See Appendix for reconciliation to GAA P) (Dollars in thousands) Second Quarter 2015 First Quarter 2015 Fourth Quarter 2014 Third Quarter 2014 Second Quarter 2014 Noninterest Expense: Salaries and wages $9,273 $8,777 $9,998 $7,868 $7,587 Employee benefits 2,541 2,415 2,461 2,049 2,081 Outsourced data processing costs 2,235 2,184 1,925 1,769 1,811 Telephone / data lines 443 496 419 313 306 Occupancy expense 2,010 2,023 2,325 1,879 1,888 Furniture and equipment expense 819 732 683 628 604 Marketing expense 1,225 975 1,072 717 675 Legal and professional fees 1,255 1,388 1,741 884 924 FDIC assessments 520 589 476 387 411 Amortization of intangibles 315 315 446 195 196 Other 3,061 2,781 2,863 2,155 2,317 Total Core Operating Expense 23,697 22,675 24,409 18,844 18,800 Non-GAAP adjustments Severance 29 12 478 328 181 Merger related charges 337 275 2,722 399 1,234 Branch closure charges and costs related to expense initiatives 0 0 4,261 68 114 Marketing and brand refresh expense 0 0 697 0 0 Stock compensation expense and other incentive costs related to improved outlook 0 0 1,213 0 0 Miscellaneous losses (gains) 0 0 119 (45) 144 Net loss on OREO and repossessed assets 53 81 9 156 92 Asset dispositions expense 173 143 103 139 118 Total Adjusted Operating Expenses $24,288 $23,186 $34,011 $19,889 $20,683