Attached files
| file | filename |
|---|---|
| 8-K - AMERICAN CAMPUS COMMUNITIES, INC. 8-K - AMERICAN CAMPUS COMMUNITIES INC | a51150130.htm |
| EX-99.1 - EXHIBIT 99.1 - AMERICAN CAMPUS COMMUNITIES INC | a51150130ex99_1.htm |
Exhibit 99.2

SUPPLEMENTAL ANALYST PACKAGE 2Q 2015 July 27, 2015
Table of Contents
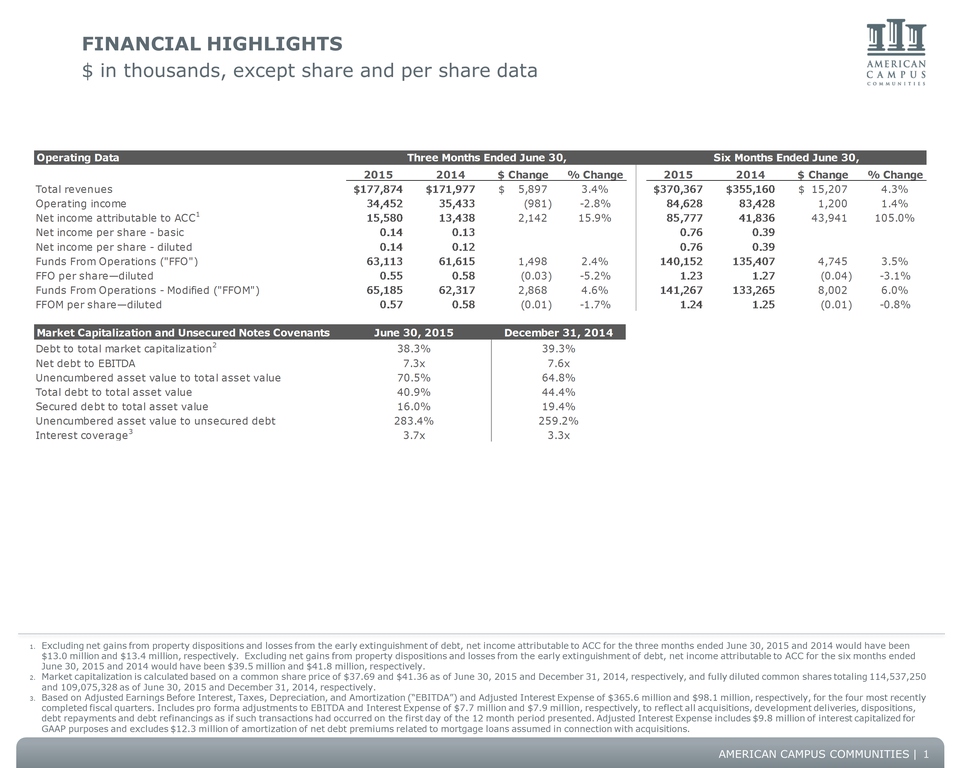
FINANCIAL highlights $ in thousands, except share and per share data 1 Excluding net gains from property dispositions and losses from the early extinguishment of debt, net income attributable to ACC for the three months ended June 30, 2015 and 2014 would have been $13.0 million and $13.4 million, respectively. Excluding net gains from property dispositions and losses from the early extinguishment of debt, net income attributable to ACC for the six months ended June 30, 2015 and 2014 would have been $39.5 million and $41.8 million, respectively. Market capitalization is calculated based on a common share price of $37.69 and $41.36 as of June 30, 2015 and December 31, 2014, respectively, and fully diluted common shares totaling 114,537,250 and 109,075,328 as of June 30, 2015 and December 31, 2014, respectively.Based on Adjusted Earnings Before Interest, Taxes, Depreciation, and Amortization (“EBITDA”) and Adjusted Interest Expense of $365.6 million and $98.1 million, respectively, for the four most recently completed fiscal quarters. Includes pro forma adjustments to EBITDA and Interest Expense of $7.7 million and $7.9 million, respectively, to reflect all acquisitions, development deliveries, dispositions, debt repayments and debt refinancings as if such transactions had occurred on the first day of the 12 month period presented. Adjusted Interest Expense includes $9.8 million of interest capitalized for GAAP purposes and excludes $12.3 million of amortization of net debt premiums related to mortgage loans assumed in connection with acquisitions.
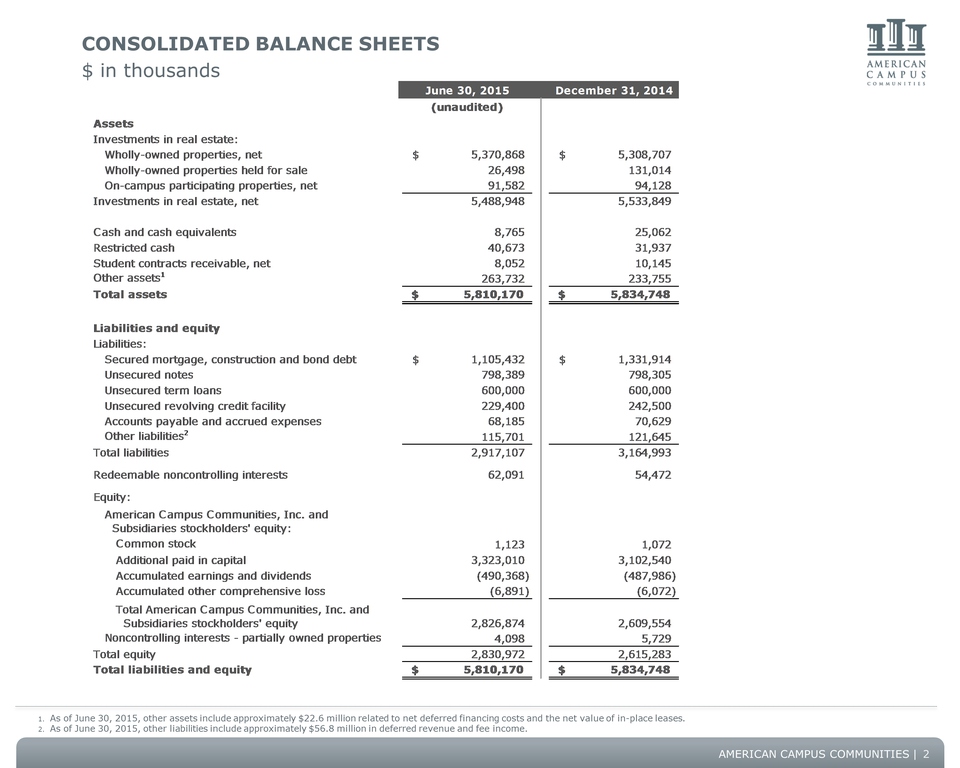
Consolidated balance sheets $ in thousands 2 As of June 30, 2015, other assets include approximately $22.6 million related to net deferred financing costs and the net value of in-place leases.As of June 30, 2015, other liabilities include approximately $56.8 million in deferred revenue and fee income.
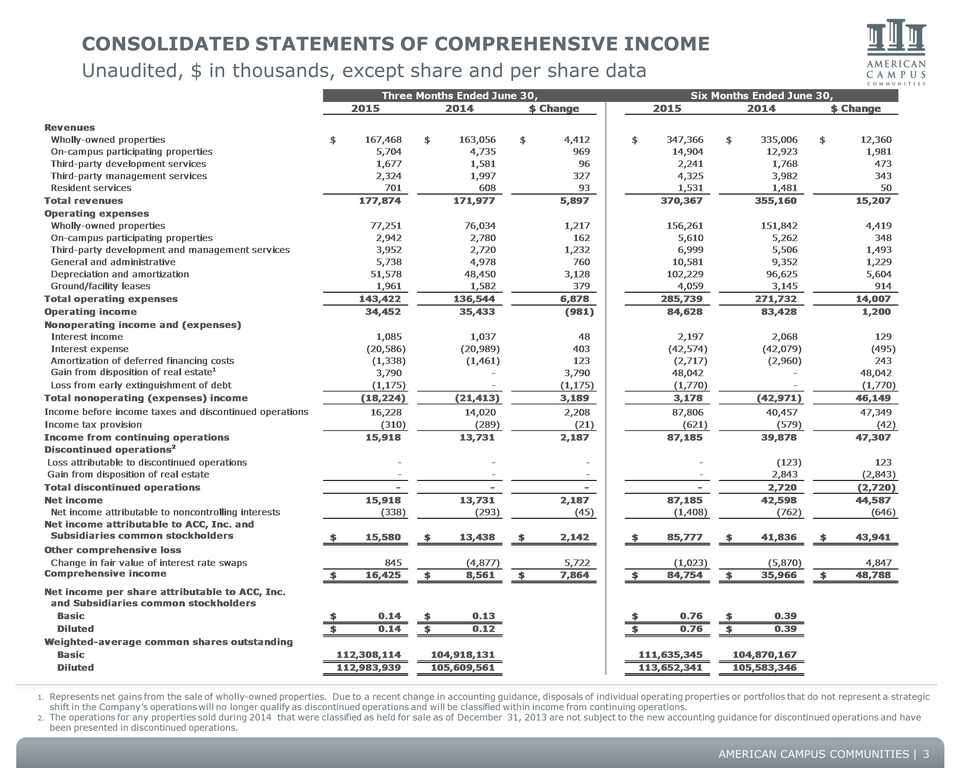
Consolidated statements of Comprehensive Income Unaudited, $ in thousands, except share and per share data 3 Represents net gains from the sale of wholly-owned properties. Due to a recent change in accounting guidance, disposals of individual operating properties or portfolios that do not represent a strategic shift in the Company’s operations will no longer qualify as discontinued operations and will be classified within income from continuing operations.The operations for any properties sold during 2014 that were classified as held for sale as of December 31, 2013 are not subject to the new accounting guidance for discontinued operations and have been presented in discontinued operations.
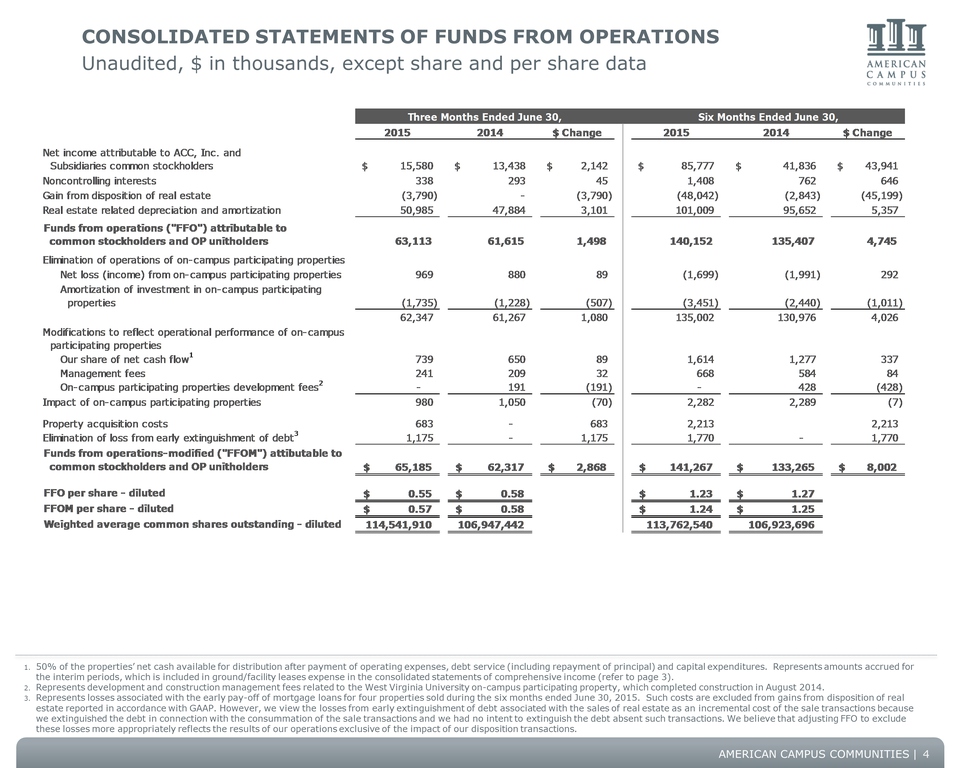
Consolidated statements of funds from operations Unaudited, $ in thousands, except share and per share data 4 50% of the properties’ net cash available for distribution after payment of operating expenses, debt service (including repayment of principal) and capital expenditures. Represents amounts accrued for the interim periods, which is included in ground/facility leases expense in the consolidated statements of comprehensive income (refer to page 3).Represents development and construction management fees related to the West Virginia University on-campus participating property, which completed construction in August 2014.Represents losses associated with the early pay-off of mortgage loans for four properties sold during the six months ended June 30, 2015. Such costs are excluded from gains from disposition of real estate reported in accordance with GAAP. However, we view the losses from early extinguishment of debt associated with the sales of real estate as an incremental cost of the sale transactions because we extinguished the debt in connection with the consummation of the sale transactions and we had no intent to extinguish the debt absent such transactions. We believe that adjusting FFO to exclude these losses more appropriately reflects the results of our operations exclusive of the impact of our disposition transactions.
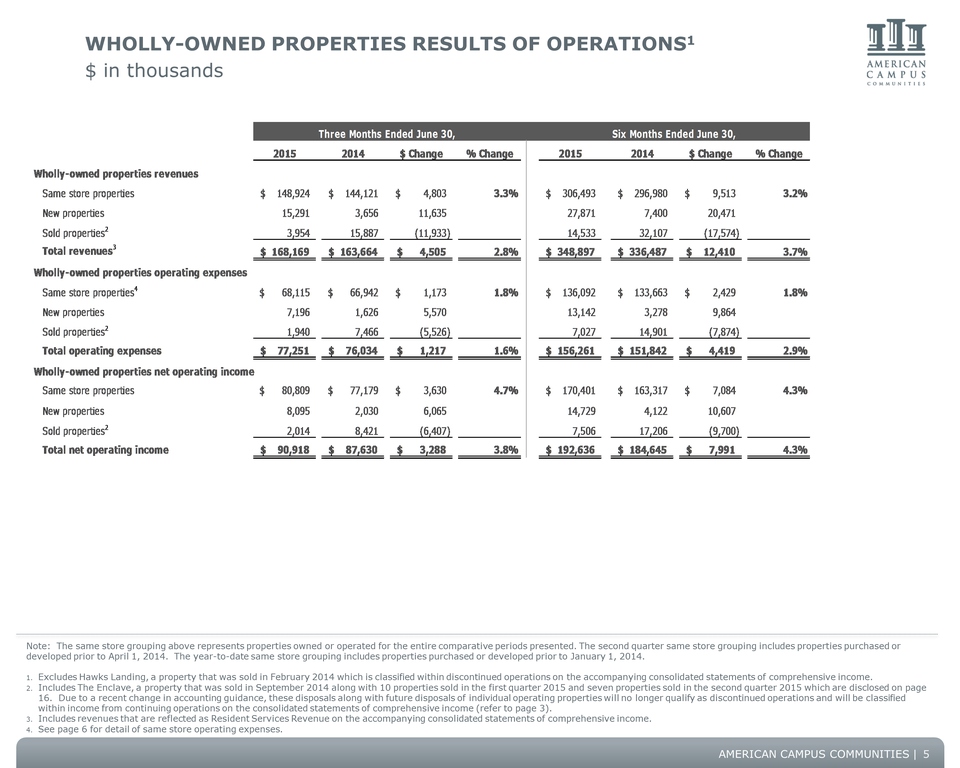
Wholly-owned properties results of operations1 $ in thousands Note: The same store grouping above represents properties owned or operated for the entire comparative periods presented. The second quarter same store grouping includes properties purchased or developed prior to April 1, 2014. The year-to-date same store grouping includes properties purchased or developed prior to January 1, 2014.Excludes Hawks Landing, a property that was sold in February 2014 which is classified within discontinued operations on the accompanying consolidated statements of comprehensive income.Includes The Enclave, a property that was sold in September 2014 along with 10 properties sold in the first quarter 2015 and seven properties sold in the second quarter 2015 which are disclosed on page 16. Due to a recent change in accounting guidance, these disposals along with future disposals of individual operating properties will no longer qualify as discontinued operations and will be classified within income from continuing operations on the consolidated statements of comprehensive income (refer to page 3).Includes revenues that are reflected as Resident Services Revenue on the accompanying consolidated statements of comprehensive income. See page 6 for detail of same store operating expenses. 5
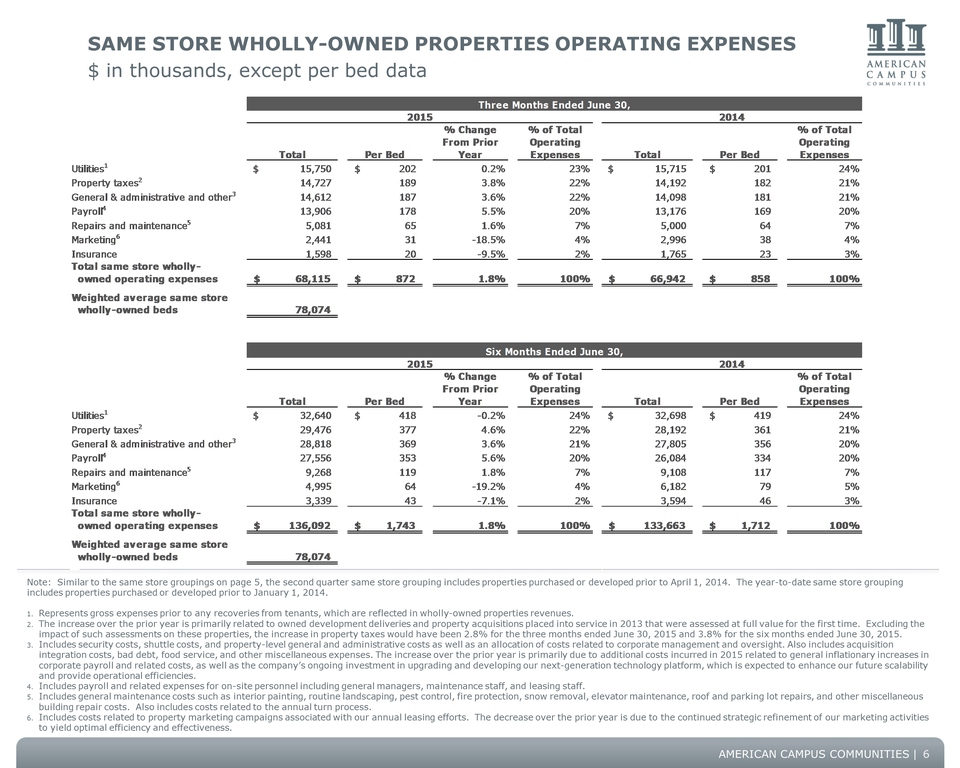
Same store wholly-owned properties operating expenses$ in thousands, except per bed data Note: Similar to the same store groupings on page 5, the second quarter same store grouping includes properties purchased or developed prior to April 1, 2014. The year-to-date same store grouping includes properties purchased or developed prior to January 1, 2014. Represents gross expenses prior to any recoveries from tenants, which are reflected in wholly-owned properties revenues. The increase over the prior year is primarily related to owned development deliveries and property acquisitions placed into service in 2013 that were assessed at full value for the first time. Excluding the impact of such assessments on these properties, the increase in property taxes would have been 2.8% for the three months ended June 30, 2015 and 3.8% for the six months ended June 30, 2015. Includes security costs, shuttle costs, and property-level general and administrative costs as well as an allocation of costs related to corporate management and oversight. Also includes acquisition integration costs, bad debt, food service, and other miscellaneous expenses. The increase over the prior year is primarily due to additional costs incurred in 2015 related to general inflationary increases in corporate payroll and related costs, as well as the company’s ongoing investment in upgrading and developing our next-generation technology platform, which is expected to enhance our future scalability and provide operational efficiencies.Includes payroll and related expenses for on-site personnel including general managers, maintenance staff, and leasing staff. Includes general maintenance costs such as interior painting, routine landscaping, pest control, fire protection, snow removal, elevator maintenance, roof and parking lot repairs, and other miscellaneous building repair costs. Also includes costs related to the annual turn process. Includes costs related to property marketing campaigns associated with our annual leasing efforts. The decrease over the prior year is due to the continued strategic refinement of our marketing activities to yield optimal efficiency and effectiveness. 6

Seasonality of operations $ in thousands, except for per bed amounts Note: The same store grouping above includes properties owned or operating for the entire year ended December 31, 2014 (i.e. properties purchased or developed on or prior to December 31, 2013.) Other income is all income other than Net Student Rent. This includes, but is not limited to, utility income, damages, parking income, summer conference rent, application and administration fees, income from retail tenants, etc.The decrease in the average number of owned beds from prior quarters is due to a fire at one of our properties that damaged 32 beds which were rebuilt and available for occupancy in the first quarter 2015.The decrease in the average number of owned beds from the prior quarter is due to the sale of one building containing 20 beds at Campustown Rentals in Champaign, Illinois.Includes The Enclave, a property that was sold in September 2014 along with 17 properties sold in the first six months of 2015 which are disclosed on page 16. 7

PORTFOLIO OVERVIEWSummary 8 Note: The same store grouping above includes all properties in the same store grouping for the first quarter 2015. This represents properties purchased or developed prior to January 1, 2014.Represents The Standard, a property located in Athens, GA that was purchased in October 2014.Includes four wholly-owned properties that were acquired in the first quarter 2015 and two that were acquired in the second quarter 2015. Refer to page 16 for additional information about these property acquisitions. Includes five wholly-owned properties that completed construction and opened for occupancy in June and August 2014. Also includes University Walk, a property subject to a pre-sale agreement that completed construction in August 2014 and was purchased by the company in February 2015. Represents University Crossings in Philadelphia, PA which is currently undergoing significant redevelopment activity and is anticipated to stabilize by Fall 2016.Properties not owned or under ACC management during the prior year are excluded for purposes of calculating the prior year occupancy. Occupancy at our on-campus participating properties is low during the summer months due to the expiration of the nine-month leases concurrent with the end of the spring semester.
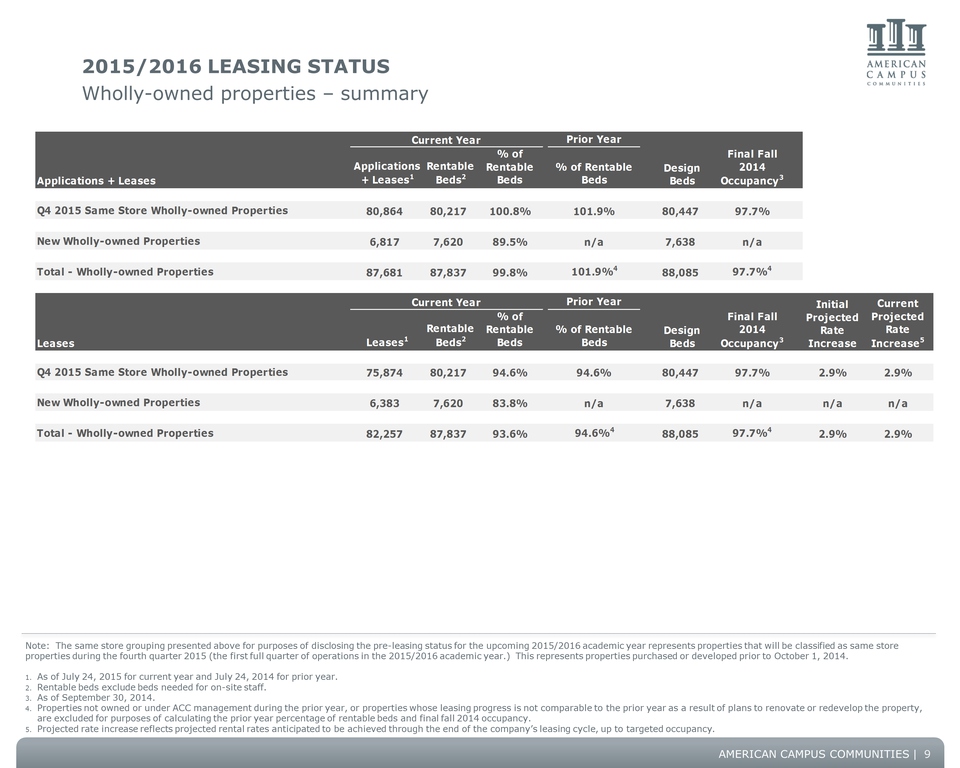
2015/2016 Leasing StatusWholly-owned properties – summary 9 Note: The same store grouping presented above for purposes of disclosing the pre-leasing status for the upcoming 2015/2016 academic year represents properties that will be classified as same store properties during the fourth quarter 2015 (the first full quarter of operations in the 2015/2016 academic year.) This represents properties purchased or developed prior to October 1, 2014. As of July 24, 2015 for current year and July 24, 2014 for prior year. Rentable beds exclude beds needed for on-site staff.As of September 30, 2014. Properties not owned or under ACC management during the prior year, or properties whose leasing progress is not comparable to the prior year as a result of plans to renovate or redevelop the property, are excluded for purposes of calculating the prior year percentage of rentable beds and final fall 2014 occupancy.Projected rate increase reflects projected rental rates anticipated to be achieved through the end of the company’s leasing cycle, up to targeted occupancy.
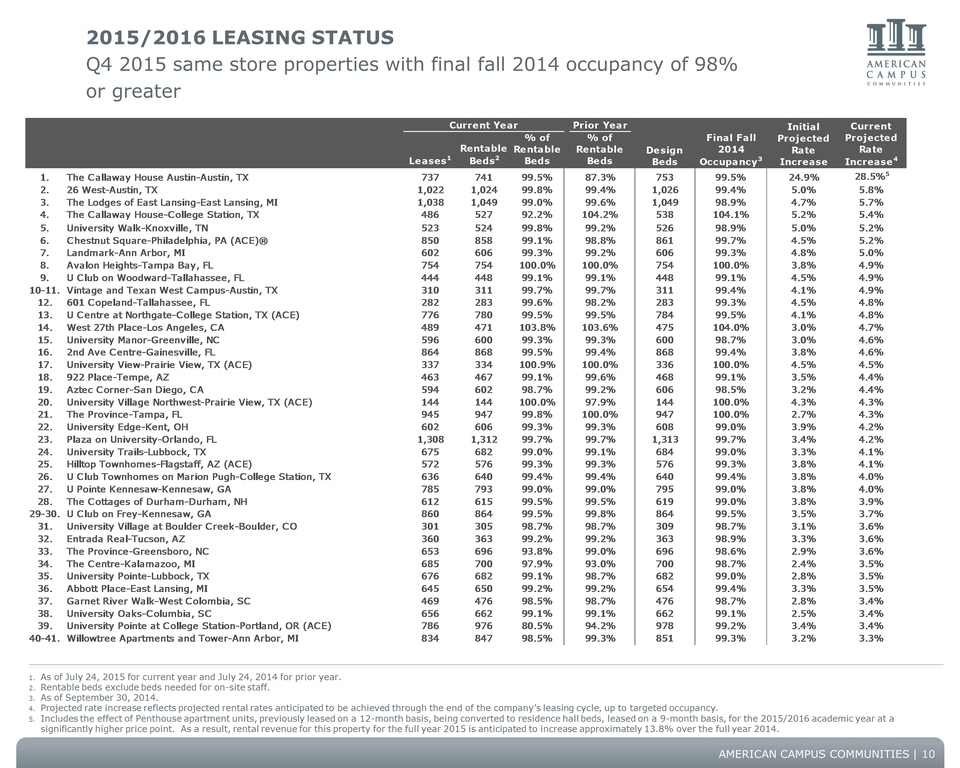
2015/2016 Leasing Status Q4 2015 same store properties with final fall 2014 occupancy of 98% or greater 10 As of July 24, 2015 for current year and July 24, 2014 for prior year. Rentable beds exclude beds needed for on-site staff.As of September 30, 2014.Projected rate increase reflects projected rental rates anticipated to be achieved through the end of the company’s leasing cycle, up to targeted occupancy.Includes the effect of Penthouse apartment units, previously leased on a 12-month basis, being converted to residence hall beds, leased on a 9-month basis, for the 2015/2016 academic year at a significantly higher price point. As a result, rental revenue for this property for the full year 2015 is anticipated to increase approximately 13.8% over the full year 2014.
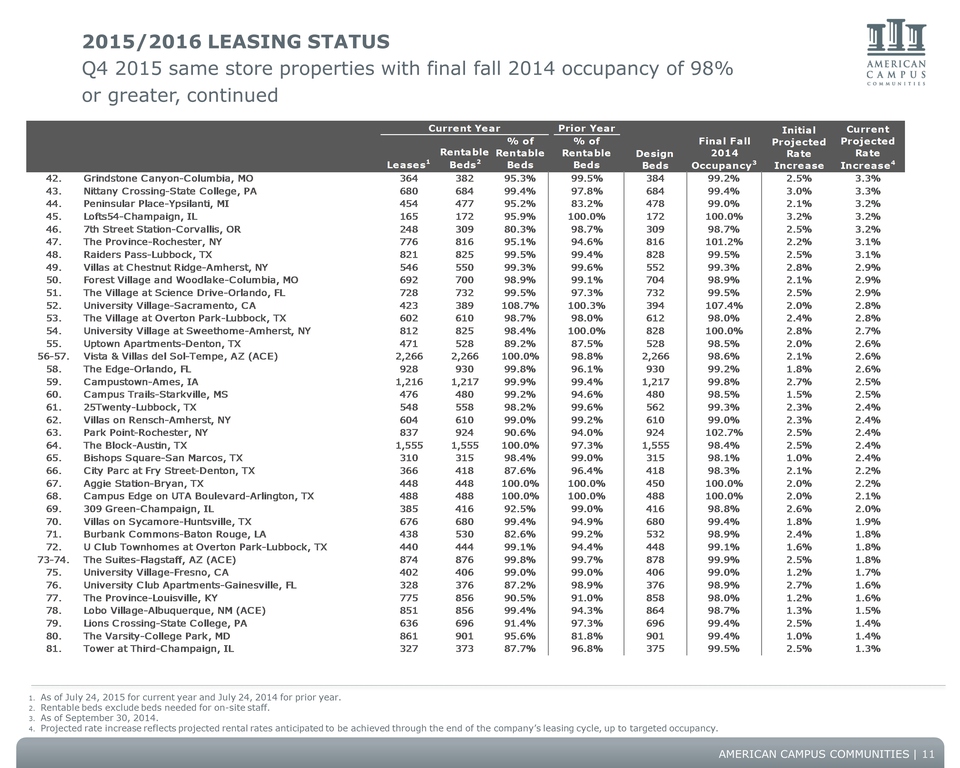
2015/2016 Leasing Status Q4 2015 same store properties with final fall 2014 occupancy of 98% or greater, continued 11 As of July 24, 2015 for current year and July 24, 2014 for prior year. Rentable beds exclude beds needed for on-site staff.As of September 30, 2014.Projected rate increase reflects projected rental rates anticipated to be achieved through the end of the company’s leasing cycle, up to targeted occupancy.
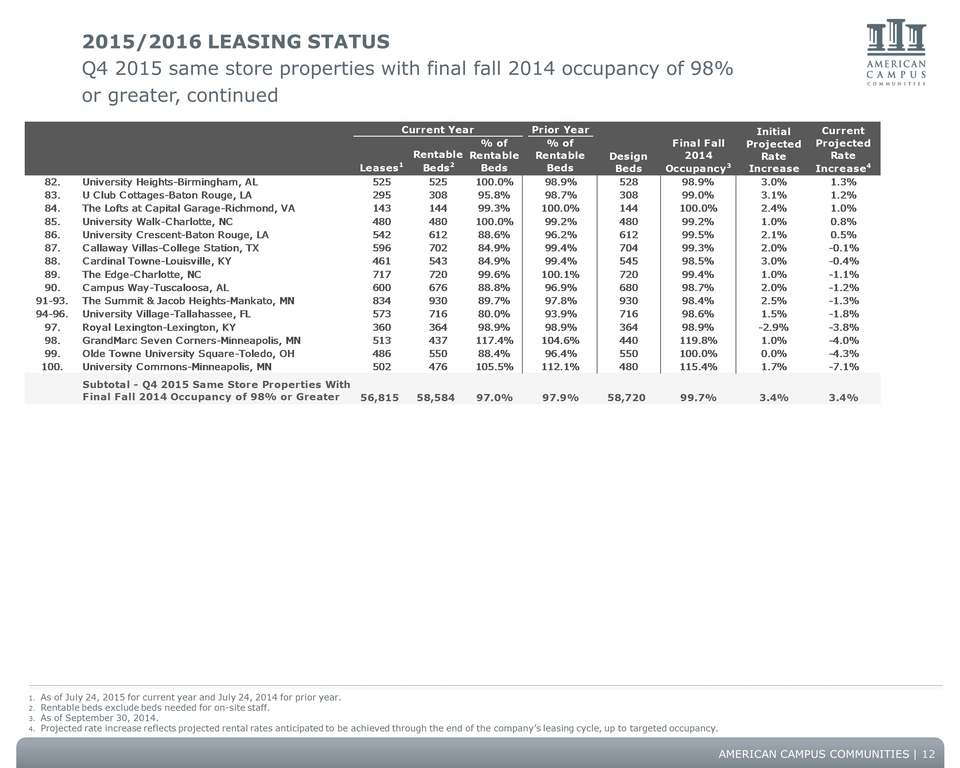
2015/2016 Leasing Status Q4 2015 same store properties with final fall 2014 occupancy of 98% or greater, continued 12 As of July 24, 2015 for current year and July 24, 2014 for prior year. Rentable beds exclude beds needed for on-site staff.As of September 30, 2014.Projected rate increase reflects projected rental rates anticipated to be achieved through the end of the company’s leasing cycle, up to targeted occupancy.
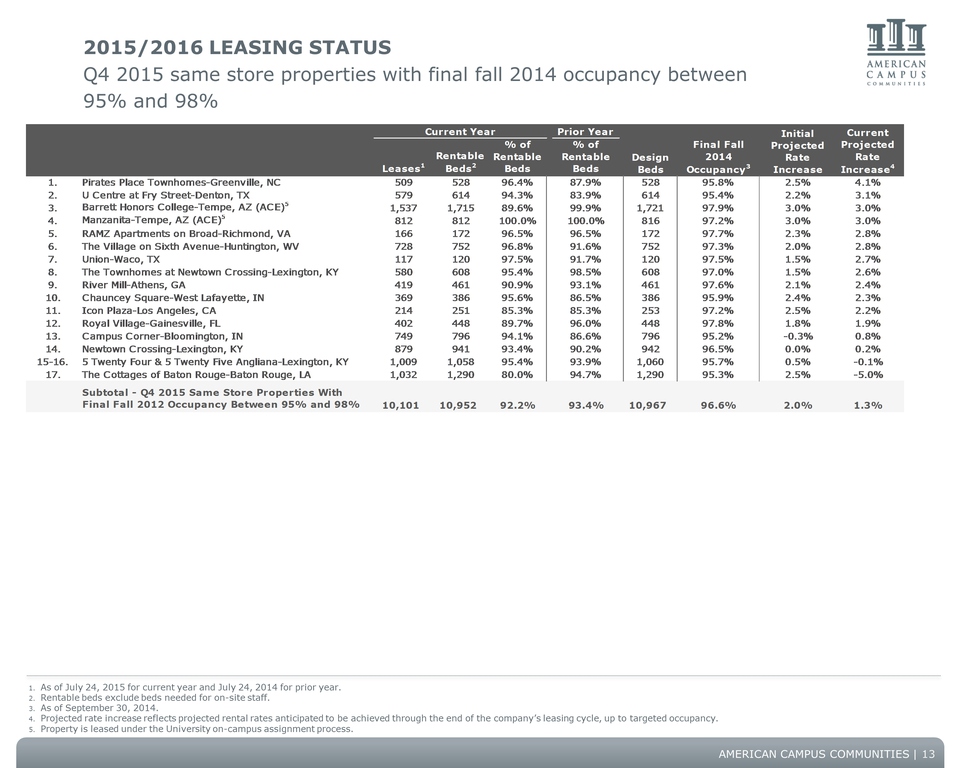
2015/2016 Leasing Status Q4 2015 same store properties with final fall 2014 occupancy between 95% and 98% 13 As of July 24, 2015 for current year and July 24, 2014 for prior year. Rentable beds exclude beds needed for on-site staff.As of September 30, 2014.Projected rate increase reflects projected rental rates anticipated to be achieved through the end of the company’s leasing cycle, up to targeted occupancy.Property is leased under the University on-campus assignment process.

2015/2016 Leasing Status Q4 2015 same store properties with final fall 2014 occupancy less than 95% As of July 24, 2015 for current year and July 24, 2014 for prior year. Rentable beds exclude beds needed for on-site staff.As of September 30, 2014.Projected rate increase reflects projected rental rates anticipated to be achieved through the end of the company’s leasing cycle, up to targeted occupancy.Property is leased under the University on-campus assignment process. 14
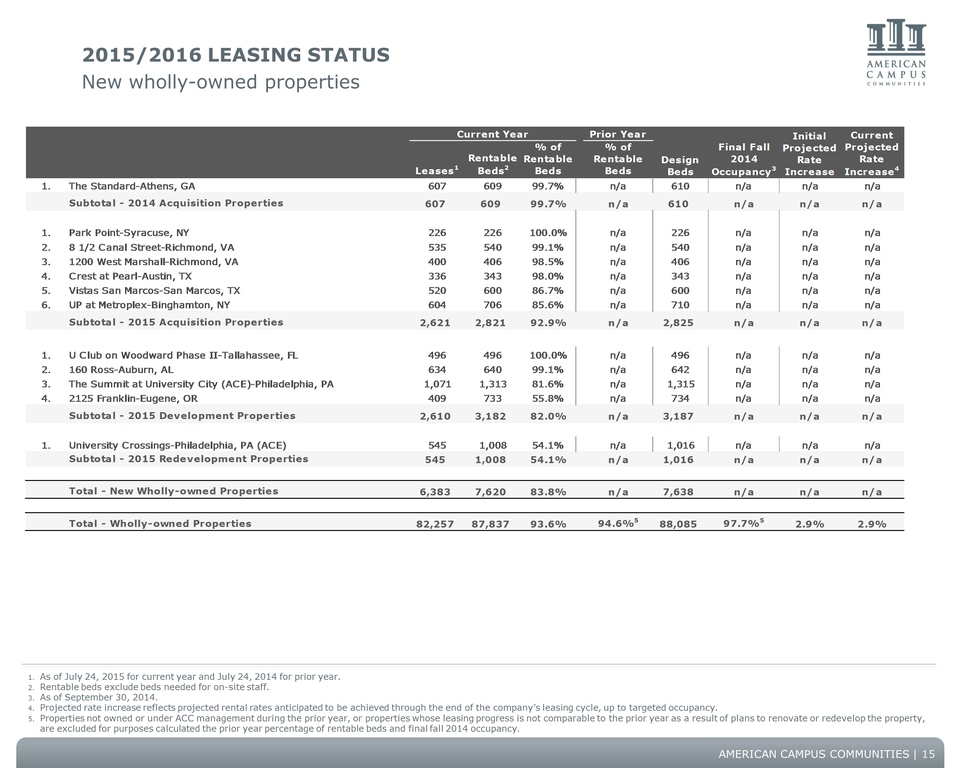
2015/2016 Leasing Status New wholly-owned properties As of July 24, 2015 for current year and July 24, 2014 for prior year.Rentable beds exclude beds needed for on-site staff.As of September 30, 2014.Projected rate increase reflects projected rental rates anticipated to be achieved through the end of the company’s leasing cycle, up to targeted occupancy.Properties not owned or under ACC management during the prior year, or properties whose leasing progress is not comparable to the prior year as a result of plans to renovate or redevelop the property, are excluded for purposes calculated the prior year percentage of rentable beds and final fall 2014 occupancy. 15
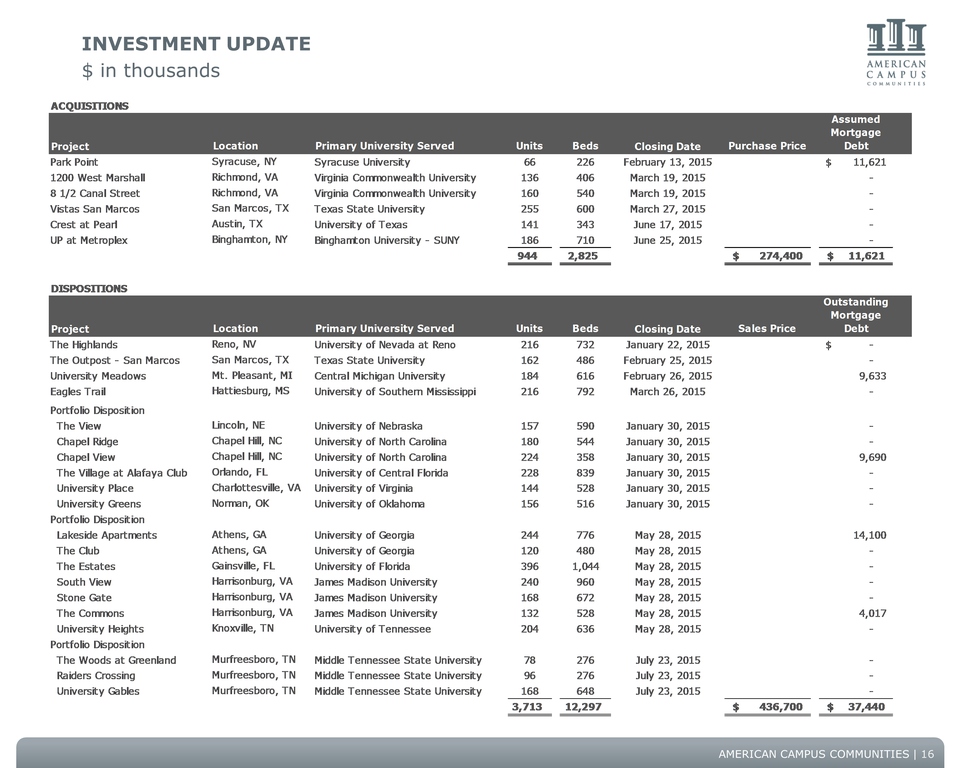
INVESTMENT UPDATE $ in thousands 16
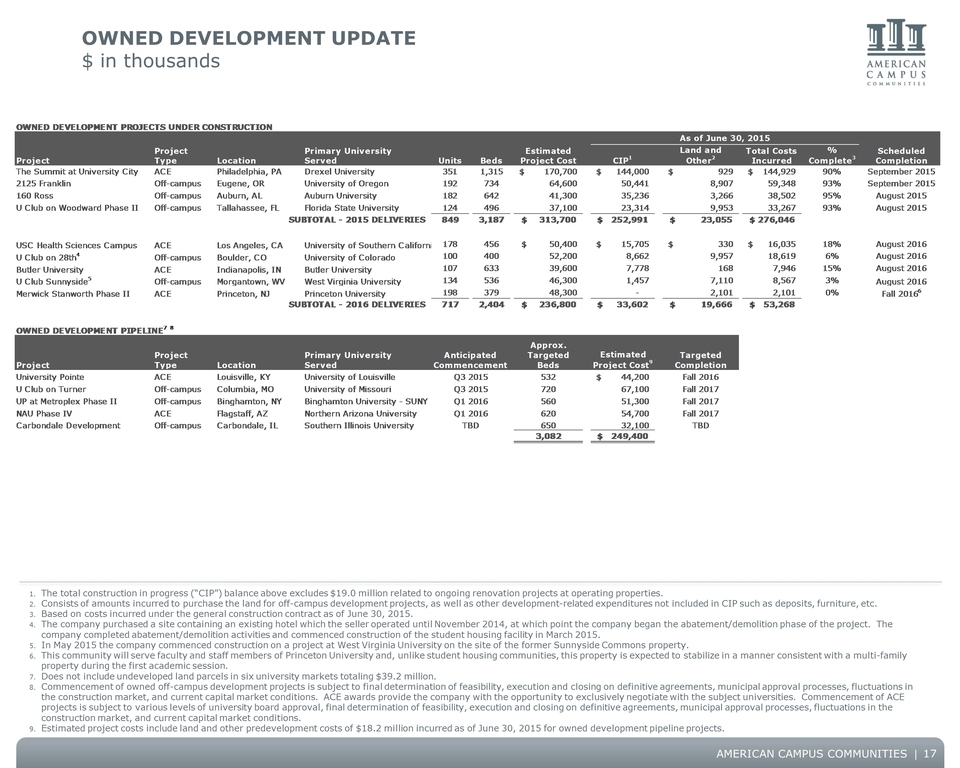
OWNED DEVELOPMENT UPDATE $ in thousands 17 The total construction in progress (“CIP”) balance above excludes $19.0 million related to ongoing renovation projects at operating properties.Consists of amounts incurred to purchase the land for off-campus development projects, as well as other development-related expenditures not included in CIP such as deposits, furniture, etc.Based on costs incurred under the general construction contract as of June 30, 2015.The company purchased a site containing an existing hotel which the seller operated until November 2014, at which point the company began the abatement/demolition phase of the project. The company completed abatement/demolition activities and commenced construction of the student housing facility in March 2015.In May 2015 the company commenced construction on a project at West Virginia University on the site of the former Sunnyside Commons property.This community will serve faculty and staff members of Princeton University and, unlike student housing communities, this property is expected to stabilize in a manner consistent with a multi-family property during the first academic session.Does not include undeveloped land parcels in six university markets totaling $39.2 million. Commencement of owned off-campus development projects is subject to final determination of feasibility, execution and closing on definitive agreements, municipal approval processes, fluctuations in the construction market, and current capital market conditions. ACE awards provide the company with the opportunity to exclusively negotiate with the subject universities. Commencement of ACE projects is subject to various levels of university board approval, final determination of feasibility, execution and closing on definitive agreements, municipal approval processes, fluctuations in the construction market, and current capital market conditions.Estimated project costs include land and other predevelopment costs of $18.2 million incurred as of June 30, 2015 for owned development pipeline projects.
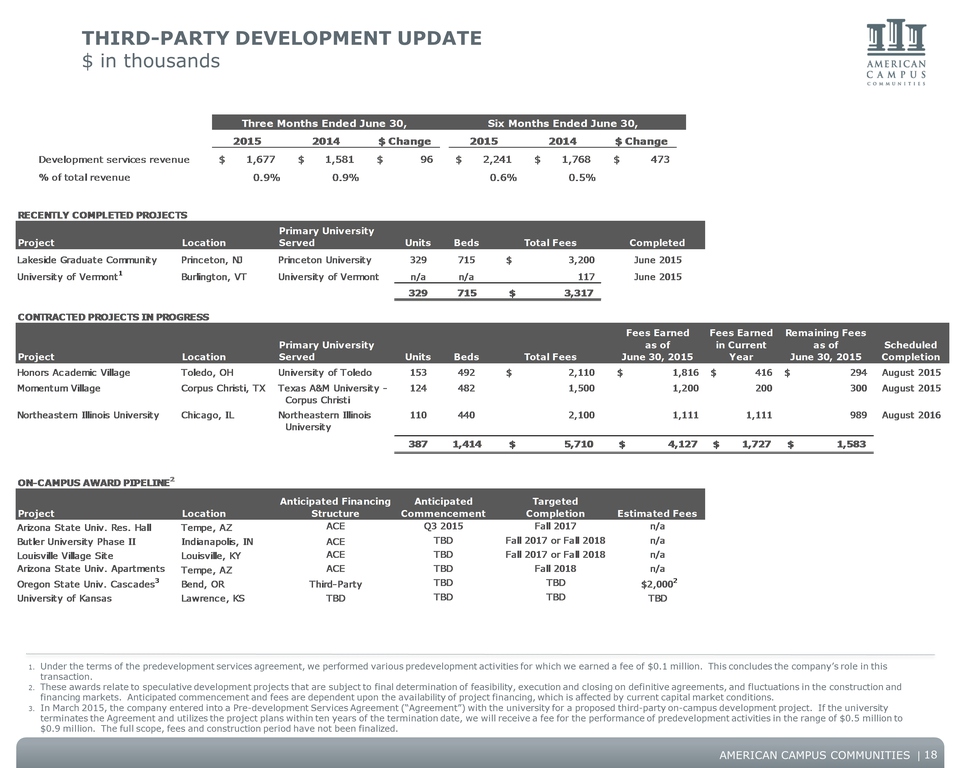
Third-party development update $ in thousands 18 Under the terms of the predevelopment services agreement, we performed various predevelopment activities for which we earned a fee of $0.1 million. This concludes the company’s role in this transaction.These awards relate to speculative development projects that are subject to final determination of feasibility, execution and closing on definitive agreements, and fluctuations in the construction and financing markets. Anticipated commencement and fees are dependent upon the availability of project financing, which is affected by current capital market conditions.In March 2015, the company entered into a Pre-development Services Agreement (“Agreement”) with the university for a proposed third-party on-campus development project. If the university terminates the Agreement and utilizes the project plans within ten years of the termination date, we will receive a fee for the performance of predevelopment activities in the range of $0.5 million to $0.9 million. The full scope, fees and construction period have not been finalized.
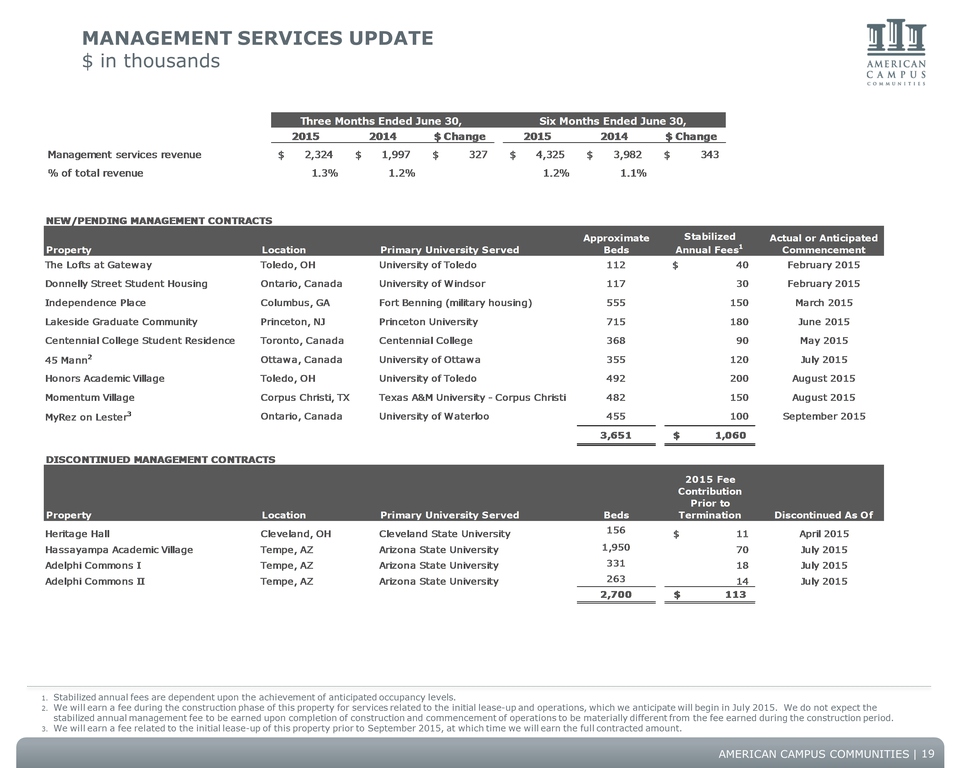
Management services update $ in thousands 19 Stabilized annual fees are dependent upon the achievement of anticipated occupancy levels.We will earn a fee during the construction phase of this property for services related to the initial lease-up and operations, which we anticipate will begin in July 2015. We do not expect the stabilized annual management fee to be earned upon completion of construction and commencement of operations to be materially different from the fee earned during the construction period. We will earn a fee related to the initial lease-up of this property prior to September 2015, at which time we will earn the full contracted amount.
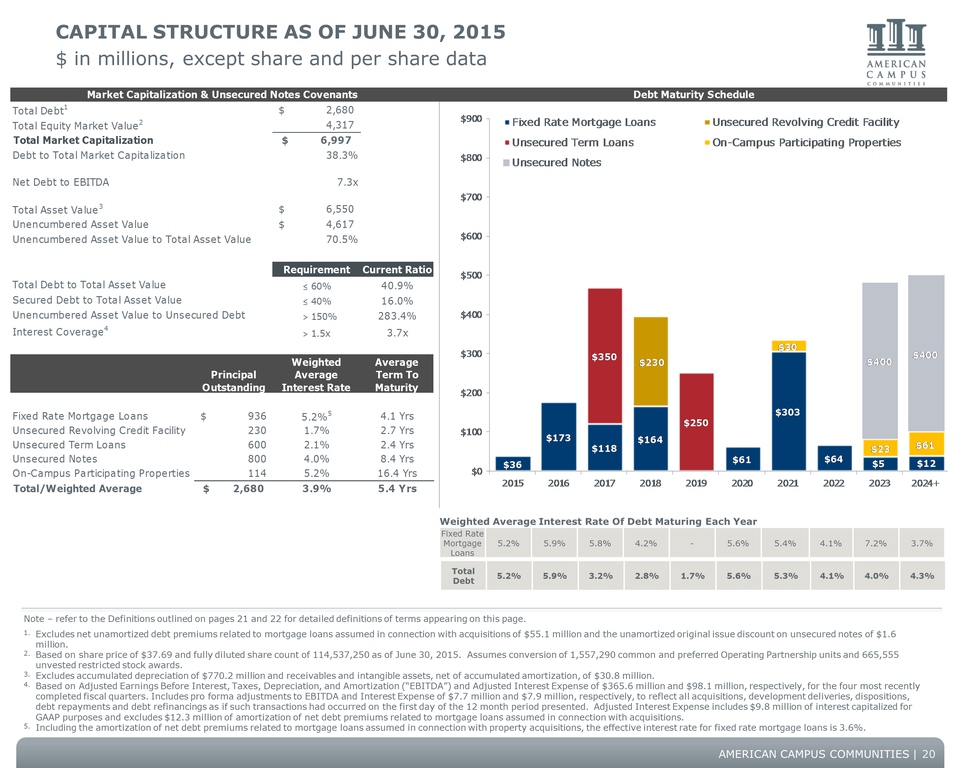
CAPITAL STRUCTURE AS OF June 30, 2015 $ in millions, except share and per share data Note – refer to the Definitions outlined on pages 21 and 22 for detailed definitions of terms appearing on this page.Excludes net unamortized debt premiums related to mortgage loans assumed in connection with acquisitions of $55.1 million and the unamortized original issue discount on unsecured notes of $1.6 million.Based on share price of $37.69 and fully diluted share count of 114,537,250 as of June 30, 2015. Assumes conversion of 1,557,290 common and preferred Operating Partnership units and 665,555 unvested restricted stock awards.Excludes accumulated depreciation of $770.2 million and receivables and intangible assets, net of accumulated amortization, of $30.8 million. Based on Adjusted Earnings Before Interest, Taxes, Depreciation, and Amortization (“EBITDA”) and Adjusted Interest Expense of $365.6 million and $98.1 million, respectively, for the four most recently completed fiscal quarters. Includes pro forma adjustments to EBITDA and Interest Expense of $7.7 million and $7.9 million, respectively, to reflect all acquisitions, development deliveries, dispositions, debt repayments and debt refinancings as if such transactions had occurred on the first day of the 12 month period presented. Adjusted Interest Expense includes $9.8 million of interest capitalized for GAAP purposes and excludes $12.3 million of amortization of net debt premiums related to mortgage loans assumed in connection with acquisitions.Including the amortization of net debt premiums related to mortgage loans assumed in connection with property acquisitions, the effective interest rate for fixed rate mortgage loans is 3.6%. 20 TotalDebt 5.2% 5.9% 3.2% 2.8% 1.7% 5.6% 5.3% 4.1% 4.0% 4.3% Fixed Rate Mortgage Loans 5.2% 5.9% 5.8% 4.2% - 5.6% 5.4% 4.1% 7.2% 3.7% Weighted Average Interest Rate Of Debt Maturing Each Year
DEFINITIONS 21 * These definitions are provided for purposes of calculating the company’s bond covenants and other key ratios.
DEFINITIONS, continued 22 * These definitions are provided for purposes of calculating the company’s bond covenants and other key ratios.

Investor information 23

Forward-looking statementS In addition to historical information, this supplemental package contains forward-looking statements under the federal securities law. These statements are based on current expectations, estimates and projections about the industry and markets in which American Campus operates, management's beliefs, and assumptions made by management. Forward-looking statements are not guarantees of future performance and involve certain risks and uncertainties, which are difficult to predict.