Attached files
| file | filename |
|---|---|
| EX-99.1 - EX-99.1 - JANUS CAPITAL GROUP INC | a15-15892_1ex99d1.htm |
| 8-K - 8-K - JANUS CAPITAL GROUP INC | a15-15892_18k.htm |
Exhibit 99.2
|
|
Second Quarter 2015 Earnings Presentation July 23, 2015 Dick Weil Chief Executive Officer Jennifer McPeek Chief Financial Officer |
|
|
2Q 2015 total company long-term net flows of $0.2 billion, the third consecutive quarter of positive long-term net flows, led by Janus equity inflows Janus equity net inflows of $1.0 billion in 2Q 2015 marked the third consecutive quarter of inflows for this business; annualized organic growth of 5% continued to outperform the industry (1) Complex-wide investment performance continues to be strong with more than 50% of assets in the top 2 Morningstar quartiles on a 1-, 3- and 5-year basis (2) Operating margins increased to 30.2% in 2Q 2015 compared to 28.9% in 1Q 2015 and 30.6% in 2Q 2014 The acquisition of Kapstream Capital Pty Limited (“Kapstream”) furthers our commitment to expanding our fixed income capabilities and reinforces our efforts to build a global macro fixed income team offering best-in-class global unconstrained bond strategies Executive summary Notes: Industry data reflects U.S. Mutual Fund data from Simfund. References Morningstar relative performance as of June 30, 2015. Refer to p. 29 for 10-year period and quantity of funds in the analysis. (1) (2) |
|
|
Janus Capital Group 2Q 2015 results 2Q 2015 EPS of $0.23 compared to $0.23 in 1Q 2015 Assets Under Management of $189.5 billion at June 30, 2015, decreased 0.1% versus March 31, 2015 Operating margin in 2Q 2015 of 30.2% vs. 28.9% in 1Q 2015 Total company long-term net flows were $0.2 billion in 2Q 2015 compared to $1.1 billion in 1Q 2015 Generated LTM cash flow from operations of $216.9 million EPS AUM(1) Long-Term Net Flows Margin LTM Cash Flow From Operations Note: AUM does not include $3.0 billion of VelocityShares assets.(1) |
|
|
2Q 2015 Results Jennifer McPeek Chief Financial Officer |

|
|
2Q 2015 financial review EPS Average AUM(1) ($ in billions) Total Revenue ($ in millions) Operating Income & Operating Margin ($ in millions) Quarter over Quarter Year over Year Note: AUM does not include $3.0 billion of VelocityShares assets. $262.7 $271.9 1Q 2015 2Q 2015 $76.0 $82.1 28.9% 30.2% 1Q 2015 2Q 2015 $186.0 $193.0 1Q 2015 2Q 2015 $0.23 $0.23 1Q 2015 2Q 2015 $0.19 $0.23 2Q 2014 2Q 2015 $174.4 $193.0 2Q 2014 2Q 2015 $70.7 $82.1 30.6% 30.2% 2Q 2014 2Q 2015 $231.2 $271.9 2Q 2014 2Q 2015 (1) |
|
|
2Q 2015 investment performance summary Notes: References Morningstar relative performance on an asset-weighted, total return basis as of June 30, 2015. Refer to p. 22 and 23 for the 1-, 3- and 5-year periods and p. 29 for the 10-year period for percent of assets, percent of funds in top 2 Morningstar quartiles for all periods and quantity of funds in analysis. Excludes absolute volatility strategies. References relative performance net of fees as of June 30, 2015, as shown on p. 26 and 27. Refer to p. 28 for INTECH mutual fund analysis and disclosure. Complex-wide as of June 30, 2015. Refer to p. 29 for 3-, 5- and 10-year Morningstar ratings and quantity of funds in the analysis. Morningstar ratings are based on risk-adjusted returns. Period Ending June 30, 2015 1-Year 3-Year 5-Year % of Assets in Top Two Morningstar Quartiles Complex-Wide Mutual Fund Assets (1) 58% 75% 55% Fundamental Equity Mutual Fund Assets (1) 68% 71% 50% Fixed Income Mutual Fund Assets (1) 6% 100% 83% % of Relative Return Strategies Which Outperformed Respective Benchmarks Mathematical Equity Strategies (2) 55% 43% 58% % of Complex-Wide Mutual Funds with 4- or 5-Star Overall Morningstar Rating TM Complex-Wide Mutual Funds (3) 50% (1) (2) (3) |
|
|
2Q 2015 long-term net flow summary Notes: Long-term flows exclude money market flows. Annualized sales and redemption rates calculated as a percentage of beginning of period assets. Long-term flows do not include VelocityShares. 16% 22% 29% 27% 25% Total Company Long-Term Flows (1,2) ($ in billions) Gross Redemptions Gross Sales Net Sales Annualized Redemption Rate Annualized Gross Sales Rate 14% 22% 24% 31% 27% 26% 30% 25% 24% 27% 12% 13% 16% 11% 17% 17% 15% 21% 22% 18% 33% 39% 67% 41% 30% 29% 35% 32% 32% 27% Fundamental Equity ($ in billions) Mathematical Equity ($ in billions) Fixed Income ($ in billions) 24% 27% 25% 25% 24% $2.5 $3.1 $5.3 $3.5 $2.7 ($2.2) ($2.8) ($2.5) ($2.7) ($2.4) $0.3 $0.3 $2.8 $0.8 $0.3 ($10) ($6) ($2) $2 $6 $10 2Q14 3Q14 4Q14 1Q15 2Q15 $1.4 $1.6 $2.0 $1.4 $2.2 ($2.0) ($1.9) ($2.6) ($2.7) ($2.2) ($0.6) ($0.3) ($0.6) ($1.3) ($0.0) ($6) ($3) $0 $3 $6 2Q14 3Q14 4Q14 1Q15 2Q15 $3.2 $5.2 $5.6 $7.4 $6.7 ($6.2) ($7.3) ($5.8) ($5.8) ($6.8) ($3.0) ($2.1) ($0.2) $1.6 ($0.1) ($20) ($10) $0 $10 $20 2Q14 3Q14 4Q14 1Q15 2Q15 $7.1 $9.9 $12.9 $12.3 $11.6 ($10.4) ($12.0) ($10.9) ($11.2) ($11.4) ($3.3) ($2.1) $2.0 $1.1 $0.2 ($32) ($16) $0 $16 $32 2Q14 3Q14 4Q14 1Q15 2Q15 (1) (2) |
|
|
2Q 2015 total revenue Total Revenue ($ in millions) Note: Includes mutual fund and private account performance fees. (1) Management Fees Shareowner Servicing Fees and Other Performance Fees Total revenue increased 4% quarter over quarter, driven primarily by an increase in average AUM Average AUM of $193.0 billion in 2Q 2015 increased from $186.0 billion in 1Q 2015 The 5% increase in management fees is primarily attributable to higher average assets Performance fees declined by $2.1 million versus 1Q 2015 due to lower private account performance fees partially offset by better mutual fund performance fees $42.4 $42.6 ($2.3) ($4.4) $222.6 $233.7 $262.7 $271.9 1Q 2015 2Q 2015 (1) |
|
|
2Q 2015 operating expenses 2Q 2015 operating expenses of $189.8 million increased $3.1 million compared to 1Q 2015 Employee compensation and benefits was down slightly compared to the prior quarter as the seasonal affect of higher payroll taxes and retirement plan contributions from 1Q 2015 was offset by higher variable compensation in 2Q 2015 G&A increased 12% driven primarily by deal related expenses associated with the Kapstream acquisition 2Q 2015 operating margin improved to 30.2% from 28.9% in 1Q 2015 Operating Expenses ($ in millions) Note: 2015 annual long-term incentive compensation is currently expected to be $75 - $80 million. (1) $27.8 $31.1 $7.4 $7.6 $34.2 $34.7 $5.7 $5.5 $20.2 $19.7 $91.4 $91.2 $186.7 $189.8 1Q 2015 2Q 2015 $79.9 $71.2 $17.7 $16.4 $8.2 $6.2 $39.6 $35.5 $8.4 $8.1 $28.4 $25.3 2Q 2011 3Q 2011 Employee Compensation & Benefits Long - Term Incentive Compensation Marketing & Advertising Distribution Depreciation & Amortization G&A (1) |
|
|
2Q 2015 balance sheet profile 6/30/2015 2017 Maturity Investment Securities (2) 3/31/2015 Cash & Investments Debt Debt Cash and Cash Equivalents Notes: Numbers may not foot due to rounding. Includes Seed Investments of $317.8 million, Investments in Advised Mutual Funds of $4.5 million and Investments Related to Deferred Compensation Plans of $12.4 million as of March 31, 2015; includes Seed Investments of $338.2 million, Investments in Advised Mutual Funds of $4.5 million and Investments Related to Deferred Compensation Plans of $12.4 million as of June 30, 2015. Total cash and marketable securities decreased $36 million versus 1Q 2015 Cash and cash equivalents decreased by $56 million, driven primarily by cash escrowed for the Kapstream acquisition, which was classified as other non-current asset at the end of the quarter Investment securities increased by $20 million, driven by the launch of our Adaptive Global Allocation products During 2Q 2015, we used cash to fund the following: Share buybacks – $11 million (repurchased 0.6 million shares at an average price of $17.85 per share) Quarterly dividends – $17 million Generated cash flow from operations of $217 million over the last 12 months 2018 Maturity Cash & Investments Balance Sheet Profile (Carrying Value) (1) – 3/31/2015 vs. 6/30/2015 ($ in millions) $355 $299 $335 $355 $690 $654 $345 $345 $107 $108 $451 $452 (1) (2) |
|
|
Topics of Discussion Jennifer McPeek Chief Financial Officer Dick Weil Chief Executive Officer |

|
|
Kapstream Capital Pty Limited AUM by Client Type (as of June 30, 2015) Total Revenue (USD$ in millions) (1) (Fiscal Years 2010 – 2015; Kapstream Fiscal Year ends June 30th) Institutional 61% 6/30/15 AUM: USD$7.0 billion Company and Transaction Details Founded in 2007 as an alternative to conventional fixed income portfolios; headquartered in Sydney, Australia, with 10 employees AUM as of June 30, 2015, was USD$7.0 billion; average annualized organic growth over the last 3 years has been 20% Strong eight-year track record managing absolute return fixed income portfolios with a global, unconstrained approach Distribution efforts today are focused in the Institutional and Retail channels in Australia and New Zealand Transaction included initial upfront cash consideration of ~USD$85 million 51% equity interest Option to purchase remaining 49% interest Retention of existing distribution partner in Australia Retail 39% Note: 2015 reflects preliminary revenue estimate for the month of June. $2.1 $4.6 $6.3 $10.4 $15.7 $19.3 2010 2011 2012 2013 2014 2015 (1) |

|
|
Kapstream Transaction Rationale Great Business – Over the last five years, total revenue has grown at a CAGR of 55%, driven by strong organic growth Great Investors – The flagship strategy has delivered consistent, positive absolute and relative returns over the 1-, 3-, 5-year and since inception periods (1) Great Market – The Australian asset management market has been growing at a CAGR of ~9% over the last 14 years, with a strong structural commitment to growing retirement savings (2) Potential Synergies and Support – Team is uniquely positioned to reinforce Bill Gross, creating a seamless, client-focused effort, with a like-minded investment philosophy focused on building a world-class global unconstrained bond business Further Diversification – The transaction increases both our total non-U.S. and Fixed Income AUM by approximately 20%, while providing for future opportunities in the Asia / Pacific region Notes: Returns net of fees since inception on May 31, 2007; relative returns versus benchmark of RBA Cash Rate from May 31, 2007, until February 1, 2014, and 50% UBS Bank Bill and 50% UBS Composite 0 to 3-Year Maturity from February 1, 2014, to June 30, 2015. Source: Australian Bureau of Statistics, Reserve Bank of Australia. (1) (2) |
|
|
South Korea Non-U.S. business update Denmark France Germany Ireland Italy Luxembourg Netherlands Spain Sweden Switzerland United Kingdom Japan Taiwan Hong Kong Singapore Australia China United Arab Emirates = International Office Location Botswana Distribution Footprint (1) (as of June 30, 2015) Notes: Countries in blue have client AUM of $100 million or greater. Annualized net flow rates calculated as a percentage of beginning of period assets. Long-term net flows, organic growth rates and CAGR do not include flows/assets from Kapstream. Proforma AUM as of June 30, 2015, includes Kapstream. AUM by Business and Region(3) (as of June 30, 2015) Ending AUM and Long-Term Net Flows ($ in billions) (2)(3) (2010 - 2014 as of December 31st; 2015 YTD as of June 30th) By Business By Region Fundamental Equity 25% Fixed Income 31% Mathematical 44% Japan 26% Europe 25% Other 2% Australia 29% Asia (ex-Japan) 18% Long-Term Net Flows Annualized Organic Growth $(0.8) $0.5 $1.3 $2.9 -6.2% 4.0% 8.5% 17.4% In 2015, we are seeing net flows across strategies and regions Year to date, we have experienced nearly 14% annualized organic growth Our acquisition of Kapstream is expected to provide additional momentum to this business, particularly in Australia 6/30/15 AUM: $38.7 billion(3) CAGR of 21% (2) (December 31, 2010 to June 30, 2015) We are seeing continued momentum in our non-U.S. business $3.4 $1.9 14.3% 13.6% Proforma AUM including Kapstream 31.7 13.3 15.3 16.7 23.8 28.9 38.7 2010 2011 2012 2013 2014 2015 (1) (2) (3) |
|
|
Q&A Jennifer McPeek Chief Financial Officer Dick Weil Chief Executive Officer |

|
|
Appendix |

|
|
AUM by investment discipline and distribution channel $189.5 billion in AUM as of 6/30/15 (1) By Investment Discipline By Distribution Channel Retail Intermediary ($117.6bn) Growth / Core ($67.1bn) Money Market ($1.2bn) Mathematical ($50.8bn) U.S. Institutional ($40.2bn) International ($31.7bn) Fixed Income ($35.7bn) Global / International ($24.3bn) Value ($10.4bn) Note: AUM does not include $3.0 billion of VelocityShares assets. Percentages and numbers may not foot due to rounding. 62% 21% 17% 35% 27% 19% 13% 5% 1% (1) |
|
|
2Q 2015 EPS of $0.23 compared to $0.23 in 1Q 2015 June 30, March 31, Variance June 30, June 30, Variance ($ in millions, except AUM and per share) 2015 2015 (%) 2015 2014 (%) Average AUM ($ in billions) 193.0 $ 186.0 $ 3.8% 193.0 $ 174.4 $ 10.7% Revenues 271.9 $ 262.7 $ 3.5% 271.9 $ 231.2 $ 17.6% Operating expenses 189.8 186.7 1.7% 189.8 160.5 18.3% Operating income 82.1 $ 76.0 $ 8.0% 82.1 $ 70.7 $ 16.1% Operating margin 30.2% 28.9% 30.2% 30.6% Interest expense (7.2) $ (7.3) $ 1.4% (7.2) $ (8.9) $ 19.1% Investment gains (losses), net (3.1) 4.4 n/m (3.1) 0.9 n/m Other income (expense), net (2.2) (0.1) n/m (2.2) 0.4 n/m Income tax provision (24.7) (26.8) 7.8% (24.7) (26.2) 5.7% Net income 44.9 $ 46.2 $ -2.8% 44.9 $ 36.9 $ 21.7% Noncontrolling interests (0.2) (1.6) 87.5% (0.2) (0.6) 66.7% Net income attributable to JCG 44.7 $ 44.6 $ 0.2% 44.7 $ 36.3 $ 23.1% Allocation of earnings to restricted stock 1.6 1.6 0.0% 1.6 1.2 33.3% Net income attributable to JCG common shareholders 43.1 $ 43.0 $ 0.2% 43.1 $ 35.1 $ 22.8% Diluted earnings per share attributable to JCG common shareholders 0.23 $ 0.23 $ 0.0% 0.23 $ 0.19 $ 21.1% Diluted weighted average shares outstanding (in millions) 189.4 188.1 0.7% 189.4 184.5 2.7% Quarter Ended Quarter Ended |
|
|
2Q 2015 operating margin of 30.2% versus 28.9% in 1Q 2015 June 30, March 31, Variance June 30, June 30, Variance ($ in millions, except AUM) 2015 2015 (%) 2015 2014 (%) Average AUM ($ in billions) 193.0 $ 186.0 $ 3.8% 193.0 $ 174.4 $ 10.7% Revenues Investment management fees 233.7 $ 222.6 $ 233.7 $ 210.5 $ Performance fees - mutual funds (6.6) (8.7) (6.6) (17.9) Performance fees - private accounts 2.2 6.4 2.2 0.6 Shareowner servicing fees and other 42.6 42.4 42.6 38.0 Total revenues 271.9 $ 262.7 $ 3.5% 271.9 $ 231.2 $ 17.6% Basis points Investment management fees 48.6 48.5 48.6 48.4 Investment management fees and performance fees 47.7 48.0 47.7 44.4 Operating expenses Employee compensation and benefits 91.2 $ 91.4 $ 91.2 $ 77.8 $ Long-term incentive compensation 19.7 20.2 19.7 12.5 Marketing and advertising 5.5 5.7 5.5 4.5 Distribution 34.7 34.2 34.7 32.5 Depreciation and amortization 7.6 7.4 7.6 6.2 General, administrative and occupancy 31.1 27.8 31.1 27.0 Total operating expenses 189.8 $ 186.7 $ 1.7% 189.8 $ 160.5 $ 18.3% Operating income 82.1 $ 76.0 $ 8.0% 82.1 $ 70.7 $ 16.1% Operating margin 30.2% 28.9% 30.2% 30.6% Quarter Ended Quarter Ended |
|
|
Mutual funds with performance-based advisory fees Please refer to footnotes on p. 21. Mutual Funds with Performance Fees (1) (AUM $ in millions, performance fees $ in thousands) EOP AUM 6/30/2015 Benchmark Base Fee Performance Fee (2) Performance Hurdle vs. Benchmark 2Q 2015 P&L Impact Janus Contrarian Fund (3) $3,912.2 S&P 500 ® Index 0.64% ± 15 bps ± 7.00% $1,260.0 Janus Research Fund (3) 4,733.0 Russell 1000 ® Growth Index 0.64% ± 15 bps ± 5.00% 1,466.2 Janus Global Research Fund (3,4) 3,580.2 MSCI World Index SM 0.60% ± 15 bps ± 6.00% 305.6 Janus Global Real Estate Fund (5) 299.3 FTSE EPRA / NAREITGlobal Index 0.75% ± 15 bps ± 4.00% 56.5 Janus International Equity Fund (6) 286.4 MSCI EAFE ® Index 0.68% ± 15 bps ± 7.00% (42.8) INTECH U.S. Core Fund (7) 704.7 S&P 500 ® Index 0.50% ± 15 bps ± 4.00% 9.8 Perkins Mid Cap Value Fund (3) 5,712.3 Russell Midcap ® Value Index 0.64% ± 15 bps ± 4.00% (3,854.4) Perkins Small Cap Value Fund (8) 1,702.2 Russell 2000 ® Value Index 0.72% ± 15 bps ± 5.50% (783.0) Perkins Large Cap Value Fund (8) 168.8 Russell 1000 ® Value Index 0.64% ± 15 bps ± 3.50% (55.3) Janus Fund (9) 9,260.9 Core Growth Index 0.64% ± 15 bps ± 4.50% 75.0 Perkins Global Value Fund (9,10) 277.0 MSCI World Index SM 0.64% ± 15 bps ± 7.00% (80.1) Janus Aspen Overseas Portfolio (11) 1,067.4 MSCI All Country World ex-U.S. Index SM 0.64% ± 15 bps ± 7.00% (508.0) Janus Overseas Fund (12) 2,761.5 MSCI All Country World ex-U.S. Index SM 0.64% ± 15 bps ± 7.00% (1,802.8) Janus Twenty Fund (13) 9,150.1 Russell 1000 ® Growth Index 0.64% ± 15 bps ± 8.50% (2,918.3) Janus Forty Fund (13) 3,086.3 Russell 1000 ® Growth Index 0.64% ± 15 bps ± 8.50% 240.5 Janus Emerging Markets Fund (14) 40.1 MSCI Emerging Markets Index SM 1.00% ± 15 bps ± 6.00% 6.1 Janus Asia Equity (15) 13.9 MSCI All Country Asia ex-Japan Index SM 0.92% ± 15 bps ± 7.00% 1.4 Perkins Select Value (16) 78.6 Russell 3000 ® Value Index 0.70% ± 15 bps ± 5.00% (28.4) Total Existing Funds with Fees $46,835.1 ($6,652.2) |
|
|
Mutual funds with performance-based advisory fees (cont.) Notes: The funds listed have a performance-based investment advisory fee that adjusts upward or downward based on each fund’s performance relative to an approved benchmark index over a performance measurement period. Please see the funds’ Statements of Additional Information for more details. Actual performance measurement periods used for calculating the performance fees are from 12 months up to 36 months, and then over 36-month rolling periods. Adjustment of ± 15 bps assumes constant assets and could be higher or lower depending on asset fluctuations. The performance measurement period began on 2/1/2006, and the performance adjustment was implemented as of 2/1/2007. Effective close of business on March 15, 2013, Janus Global Research Fund merged with and into Janus Worldwide Fund; following the merger, Janus Worldwide Fund was renamed Janus Global Research Fund (the “Combined Fund”). The Combined Fund’s surviving performance track record is that of the former Janus Global Research Fund, and the performance measurement benchmark is the MSCI World Index. For three years after the merger, Janus will waive its management fee to at least a level that is equivalent to the fee rate the Combined Fund would have paid if, after the merger, the performance history of Janus Worldwide Fund were used to calculate the performance fee adjustment to the base management fee. The performance measurement period began on 12/1/2007 and the performance adjustment was implemented as of 12/1/2008. Beginning 7/1/2010, Janus Global Real Estate Fund’s benchmark index changed from the FTSE EPRA/NAREIT Developed Index to the FTSE EPRA/NAREIT Global Index for purposes of measuring the Fund’s performance and calculating the performance adjustment. Because the Fund’s performance adjustment is based upon a rolling 36-month performance measurement period, comparisons to the FTSE EPRA/NAREIT Global Index will not be fully implemented until 36 months after July 1, 2010. During this transition period, the Fund's returns will be compared to a blended index return. The performance measurement period began on 12/1/2006, and the performance adjustment was implemented as of 12/1/2007. The performance measurement period began on 1/1/2006, and the performance adjustment was implemented as of 1/1/2007. Effective 12/7/11, INTECH Risk-Managed Core Fund was renamed INTECH U.S. Core Fund. The performance measurement period began on 1/1/2009, and the performance adjustment was implemented as of 1/1/2010. The performance measurement period began on 7/1/2010, and the performance adjustment was implemented as of 6/30/2011. Effective 7/1/10, Janus Global Opportunities Fund was renamed Perkins Global Value Fund. The performance measurement period began on 7/1/2010, and the performance adjustment was implemented as of 9/30/2011. The performance measurement period began on 8/1/2010, and the performance adjustment was implemented as of 10/31/2011. The performance measurement period began on 7/1/2010, and the performance adjustment was implemented as of 12/31/2011. The performance measurement period began on 12/31/2010, and the performance adjustment was implemented as of 12/31/2011. The performance measurement period began on 7/29/2011, and the performance adjustment was implemented as of 7/31/2012. The performance measurement period began on 1/1/2012, and the performance adjustment was implemented as of 12/31/2012. (1) (2) (3) (4) (5) (6) (7) (8) (9) (10) (11) (12) (13) (14) (15) (16) |
|
|
Complex-Wide: Percent in Top 2 Morningstar Quartiles Based on Total Returns 1-Year 3-Year 5-Year % of Funds % of Assets Complex-wide performance (1) Note: References Morningstar relative performance as of June 30, 2015. Refer to p. 29 for 10-year periods and quantity of funds in the analysis. 46% 61% 63% 61% 48% 24% 27% 31% 33% 39% 88% 94% 88% 94% 71% 0% 10% 20% 30% 40% 50% 60% 70% 80% 90% 100% 3/31/09 6/30/09 9/30/09 12/31/09 3/31/10 Percent of Janus Managed Equity JIF Funds . 1st Quartile 2nd Quartile 46% 61% 63% 61% 48% 24% 27% 31% 33% 39% 88% 94% 88% 94% 71% 0% 10% 20% 30% 40% 50% 60% 70% 80% 90% 100% 3/31/09 6/30/09 9/30/09 12/31/09 3/31/10 Percent of Janus Managed Equity JIF Funds . 1st Quartile 2nd Quartile 13% 32% 56% 60% 56% 53% 29% 1% 3% 2% 67% 62% 57% 63% 58% 0% 10% 20% 30% 40% 50% 60% 70% 80% 90% 100% 6/30/14 9/30/14 12/31/14 3/31/15 6/30/15 25% 29% 46% 47% 41% 37% 42% 35% 22% 35% 63% 71% 82% 69% 75% 0% 10% 20% 30% 40% 50% 60% 70% 80% 90% 100% 6/30/14 9/30/14 12/31/14 3/31/15 6/30/15 15% 14% 22% 27% 23% 21% 37% 31% 28% 32% 36% 50% 53% 55% 55% 0% 10% 20% 30% 40% 50% 60% 70% 80% 90% 100% 6/30/14 9/30/14 12/31/14 3/31/15 6/30/15 20% 31% 44% 49% 38% 35% 31% 11% 18% 24% 56% 63% 56% 67% 62% 0% 10% 20% 30% 40% 50% 60% 70% 80% 90% 100% 6/30/14 9/30/14 12/31/14 3/31/15 6/30/15 36% 26% 32% 37% 32% 29% 38% 34% 24% 32% 64% 64% 66% 61% 64% 0% 10% 20% 30% 40% 50% 60% 70% 80% 90% 100% 6/30/14 9/30/14 12/31/14 3/31/15 6/30/15 23% 28% 28% 33% 26% 30% 35% 35% 28% 26% 53% 63% 63% 60% 51% 0% 10% 20% 30% 40% 50% 60% 70% 80% 90% 100% 6/30/14 9/30/14 12/31/14 3/31/15 6/30/15 |

|
|
Fundamental Equity: Percent in Top 2 Morningstar Quartiles Based on Total Returns Fundamental equity performance (1) 1-Year 3-Year 5-Year % of Funds % of Assets Note: References Morningstar relative performance as of June 30, 2015. Refer to p. 29 for 10-year periods and quantity of funds in the analysis. 46% 61% 63% 61% 48% 24% 27% 31% 33% 39% 88% 94% 88% 94% 71% 0% 10% 20% 30% 40% 50% 60% 70% 80% 90% 100% 3/31/09 6/30/09 9/30/09 12/31/09 3/31/10 Percent of Janus Managed Equity JIF Funds . 1st Quartile 2nd Quartile 17% 33% 50% 55% 45% 36% 29% 14% 19% 21% 52% 62% 64% 74% 67% 0% 10% 20% 30% 40% 50% 60% 70% 80% 90% 100% 6/30/14 9/30/14 12/31/14 3/31/15 6/30/15 29% 24% 36% 38% 35% 29% 35% 31% 23% 25% 57% 59% 67% 60% 60% 0% 10% 20% 30% 40% 50% 60% 70% 80% 90% 100% 6/30/14 9/30/14 12/31/14 3/31/15 6/30/15 22% 22% 25% 25% 22% 22% 34% 31% 28% 22% 44% 56% 56% 53% 44% 0% 10% 20% 30% 40% 50% 60% 70% 80% 90% 100% 6/30/14 9/30/14 12/31/14 3/31/15 6/30/15 12% 34% 64% 70% 67% 51% 21% 1% 2% 1% 63% 55% 66% 73% 68% 0% 10% 20% 30% 40% 50% 60% 70% 80% 90% 100% 6/30/14 9/30/14 12/31/14 3/31/15 6/30/15 20% 33% 54% 54% 48% 36% 33% 27% 15% 23% 57% 66% 81% 68% 71% 0% 10% 20% 30% 40% 50% 60% 70% 80% 90% 100% 6/30/14 9/30/14 12/31/14 3/31/15 6/30/15 16% 14% 24% 30% 27% 13% 31% 24% 21% 24% 29% 45% 48% 50% 50% 0% 10% 20% 30% 40% 50% 60% 70% 80% 90% 100% 6/30/14 9/30/14 12/31/14 3/31/15 6/30/15 (1) |

|
|
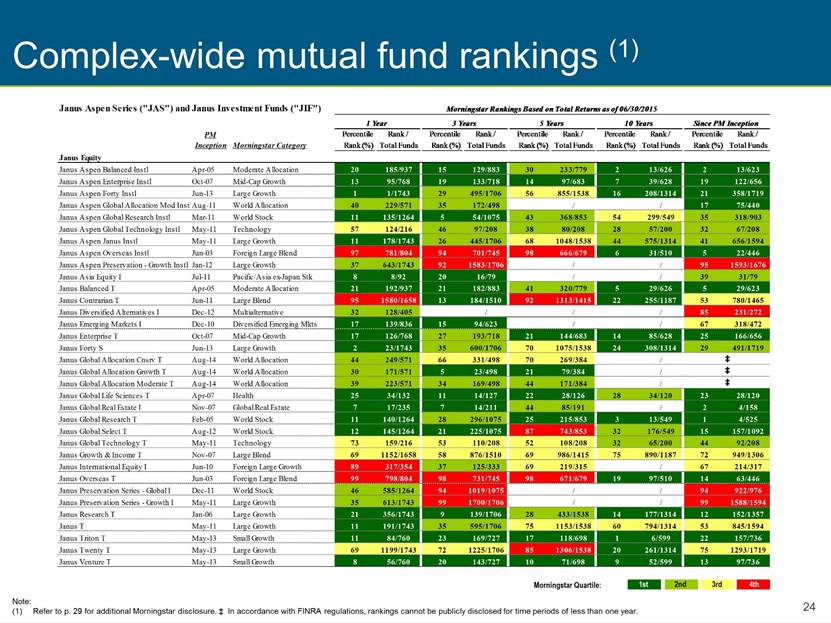
Complex-wide mutual fund rankings (1) Morningstar Quartile: 1st 2nd 3rd 4th Note: Refer to p. 29 for additional Morningstar disclosure. ‡ In accordance with FINRA regulations, rankings cannot be publicly disclosed for time periods of less than one year. Janus Aspen Series ("JAS") and Janus Investment Funds ("JIF") PM Percentile Rank / Percentile Rank / Percentile Rank / Percentile Rank / Percentile Rank / Inception Morningstar Category Rank (%) Total Funds Rank (%) Total Funds Rank (%) Total Funds Rank (%) Total Funds Rank (%) Total Funds Janus Equity Janus Aspen Balanced Instl Apr-05 Moderate Allocation 20 185/937 15 129/883 30 233/779 2 13/626 2 13/623 Janus Aspen Enterprise Instl Oct-07 Mid-Cap Growth 13 95/768 19 133/718 14 97/683 7 39/628 19 122/656 Janus Aspen Forty Instl Jun-13 Large Growth 1 1/1743 29 495/1706 56 855/1538 16 208/1314 21 358/1719 Janus Aspen Global Allocation Mod Instl Aug-11 World Allocation 40 229/571 35 172/498 / / 17 75/440 Janus Aspen Global Research Instl Mar-11 World Stock 11 135/1264 5 54/1075 43 368/853 54 299/549 35 318/903 Janus Aspen Global Technology Instl May-11 Technology 57 124/216 46 97/208 38 80/208 28 57/200 32 67/208 Janus Aspen Janus Instl May-11 Large Growth 11 178/1743 26 445/1706 68 1048/1538 44 575/1314 41 656/1594 Janus Aspen Overseas Instl Jun-03 Foreign Large Blend 97 781/804 94 701/745 98 666/679 6 31/510 5 22/446 Janus Aspen Preservation - Growth Instl Jan-12 Large Growth 37 643/1743 92 1583/1706 / / 95 1593/1676 Janus Asia Equity I Jul-11 Pacific/Asia ex-Japan Stk 8 8/92 20 16/79 / / 39 31/79 Janus Balanced T Apr-05 Moderate Allocation 21 192/937 21 182/883 41 320/779 5 29/626 5 29/623 Janus Contrarian T Jun-11 Large Blend 95 1580/1658 13 184/1510 92 1313/1415 22 255/1187 53 780/1465 Janus Diversified Alternatives I Dec-12 Multialternative 32 128/405 / / / 85 231/272 Janus Emerging Markets I Dec-10 Diversified Emerging Mkts 17 139/836 15 94/623 / / 67 318/472 Janus Enterprise T Oct-07 Mid-Cap Growth 17 126/768 27 193/718 21 144/683 14 85/628 25 166/656 Janus Forty S Jun-13 Large Growth 2 23/1743 35 600/1706 70 1075/1538 24 308/1314 29 491/1719 Janus Global Allocation Cnsrv T Aug-14 World Allocation 44 249/571 66 331/498 70 269/384 / ‡ Janus Global Allocation Growth T Aug-14 World Allocation 30 171/571 5 23/498 21 79/384 / ‡ Janus Global Allocation Moderate T Aug-14 World Allocation 39 223/571 34 169/498 44 171/384 / ‡ Janus Global Life Sciences T Apr-07 Health 25 34/132 11 14/127 22 28/126 28 34/120 23 28/120 Janus Global Real Estate I Nov-07 Global Real Estate 7 17/235 7 14/211 44 85/191 / 2 4/158 Janus Global Research T Feb-05 World Stock 11 140/1264 28 296/1075 25 215/853 3 13/549 1 4/525 Janus Global Select T Aug-12 World Stock 12 145/1264 21 225/1075 87 743/853 32 176/549 15 157/1092 Janus Global Technology T May-11 Technology 73 159/216 53 110/208 52 108/208 32 65/200 44 92/208 Janus Growth & Income T Nov-07 Large Blend 69 1152/1658 58 876/1510 69 986/1415 75 890/1187 72 949/1306 Janus International Equity I Jun-10 Foreign Large Growth 89 317/354 37 125/333 69 219/315 / 67 214/317 Janus Overseas T Jun-03 Foreign Large Blend 99 798/804 98 731/745 98 671/679 19 97/510 14 63/446 Janus Preservation Series - Global I Dec-11 World Stock 46 585/1264 94 1019/1075 / / 94 922/976 Janus Preservation Series - Growth I May-11 Large Growth 35 613/1743 99 1700/1706 / / 99 1588/1594 Janus Research T Jan-06 Large Growth 21 356/1743 9 139/1706 28 433/1538 14 177/1314 12 152/1357 Janus T May-11 Large Growth 11 191/1743 35 595/1706 75 1153/1538 60 794/1314 53 845/1594 Janus Triton T May-13 Small Growth 11 84/760 23 169/727 17 118/698 1 6/599 22 157/736 Janus Twenty T May-13 Large Growth 69 1199/1743 72 1225/1706 85 1306/1538 20 261/1314 75 1293/1719 Janus Venture T May-13 Small Growth 8 56/760 20 143/727 10 71/698 9 52/599 13 97/736 Morningstar Rankings Based on Total Returns as of 06/30/2015 3 Years 1 Year 5 Years 10 Years Since PM Inception |
|
|
Complex-wide mutual fund rankings, cont. (1) Morningstar Quartile: 1st 2nd 3rd 4th Note: Refer to p. 29 for additional Morningstar disclosure. Since PM inception performance for Perkins Small Cap Value T Shares is not available for comparison. Janus Aspen Series ("JAS") and Janus Investment Funds ("JIF") PM Percentile Rank / Percentile Rank / Percentile Rank / Percentile Rank / Percentile Rank / Inception Morningstar Category Rank (%) Total Funds Rank (%) Total Funds Rank (%) Total Funds Rank (%) Total Funds Rank (%) Total Funds Fixed Income Janus Aspen Flexible Bond Instl May-07 Intermediate-Term Bond 46 504/1088 27 277/1040 20 193/974 3 25/862 3 23/907 Janus Flexible Bond T May-07 Intermediate-Term Bond 54 589/1088 32 328/1040 29 277/974 7 57/862 6 52/907 Janus Global Bond I Dec-10 World Bond 44 168/385 37 125/337 / / 29 85/289 Janus High-Yield T Dec-03 High Yield Bond 65 507/780 47 325/697 37 229/615 29 152/529 31 156/510 Janus Multi-Sector Income I Feb-14 Multisector Bond 6 17/298 / / / 9 25/283 Janus Real Return I Oct-12 Multisector Bond 29 85/298 72 178/247 / / 56 138/247 Janus Short-Term Bond T May-07 Short-Term Bond 76 427/559 50 258/519 52 251/482 27 112/414 30 137/459 INTECH Janus Aspen INTECH US Low Volatil Svc Sep-12 Large Blend 13 204/1658 / / / 69 1071/1542 INTECH Global Income Mgd Vol I Dec-11 World Stock 89 1126/1264 85 922/1075 / / 89 871/976 INTECH Intl Mgd Volatility I May-07 Foreign Large Blend 56 453/804 18 129/745 21 144/679 / 37 211/576 INTECH U.S. Core T Feb-03 Large Growth 74 1294/1743 45 764/1706 31 475/1538 57 750/1314 30 362/1216 INTECH US Mgd Volatility I Dec-05 Large Value 38 549/1429 19 241/1310 13 159/1225 / 34 369/1095 Perkins Janus Aspen Perkins Mid Cap Value Svc Dec-02 Mid-Cap Value 83 420/505 93 436/468 96 411/425 67 237/350 66 207/312 Perkins Global Value T Apr-05 World Stock 69 879/1264 77 832/1075 66 562/853 65 357/549 71 391/548 Perkins International Value I Apr-13 Foreign Large Value 31 108/351 / / / 50 175/352 Perkins Large Cap Value I Dec-08 Large Value 65 929/1429 78 1023/1310 84 1031/1225 / 75 912/1215 Perkins Mid Cap Value T Aug-98 Mid-Cap Value 78 396/505 92 434/468 96 412/425 68 239/350 10 17/162 Perkins Select Value I Dec-11 Mid-Cap Value 53 269/505 93 435/468 / / 94 428/455 Perkins Small Cap Value T Feb-97 Small Value 14 61/433 77 318/409 89 321/358 15 46/311 N/A N/A Perkins Value Plus Income I Jul-10 Moderate Allocation 52 485/937 61 542/883 / / 44 349/790 Morningstar Rankings Based on Total Returns as of 06/30/2015 1 Year 3 Years 5 Years 10 Years Since PM Inception |

|
|
Mathematical equity performance: relative return strategies (1) Past performance is no guarantee of future results. Notes: Excludes absolute volatility strategies. Returns for periods greater than 1 year are annualized. Refer to p. 28 for performance disclosure. Differences may not agree with input data due to rounding. Inception Since Composite and Respective Benchmark Date 1 Year 3 Year 5 Year 10 Year Inception U.S. Enhanced Plus Gross 7/87 9.66 18.20 18.14 8.57 10.93 U.S. Enhanced Plus Net 9.35 17.86 17.79 8.24 10.53 S&P 500 ® Index 7.42 17.31 17.34 7.89 9.52 Difference versus S&P 500 ® Index Net of Fees 1.93 0.55 0.45 0.35 1.01 U.S. Large Cap Growth Gross 7/93 7.11 16.14 17.39 8.44 12.67 U.S. Large Cap Growth Net 6.60 15.60 16.84 7.95 12.10 S&P 500 ® Growth Index 10.07 17.79 18.65 8.97 9.50 Difference versus S&P 500 ® Growth Index Net of Fees (3.47) (2.19) (1.81) (1.02) 2.59 U.S. Enhanced Index Gross 4/98 6.69 16.62 17.18 8.25 6.55 U.S. Enhanced Index Net 6.38 16.26 16.81 7.91 6.21 S&P 500 ® Index 7.42 17.31 17.34 7.89 5.64 Difference versus S&P 500 ® Index Net of Fees (1.05) (1.05) (0.53) 0.02 0.56 U.S. Broad Large Cap Growth Gross 11/00 11.69 17.94 18.99 8.70 5.08 U.S. Broad Large Cap Growth Net 11.15 17.35 18.40 8.16 4.54 Russell 1000 ® Growth Index 10.56 17.99 18.59 9.10 2.97 Difference versus Russell 1000 ® Growth Index Net of Fees 0.59 (0.64) (0.19) (0.95) 1.58 U.S. Broad Enhanced Plus Gross 4/01 8.64 18.09 18.21 8.33 7.82 U.S. Broad Enhanced Plus Net 8.32 17.72 17.85 8.01 7.48 Russell 1000 ® Index 7.37 17.73 17.58 8.13 6.59 Difference versus Russell 1000 ® Index Net of Fees 0.95 (0.01) 0.27 (0.12) 0.89 U.S. Large Cap Core Gross 8/01 9.62 18.13 17.75 8.28 7.71 U.S. Large Cap Core Net 9.08 17.56 17.18 7.77 7.21 S&P 500 ® Index 7.42 17.31 17.34 7.89 5.99 Difference versus S&P 500 ® Index Net of Fees 1.66 0.25 (0.16) (0.12) 1.21 U.S. Broad Large Cap Value Gross 8/04 2.94 16.87 17.29 7.61 8.80 U.S. Broad Large Cap Value Net 2.56 16.44 16.85 7.21 8.39 Russell 1000 ® Value Index 4.13 17.34 16.50 7.05 7.87 Difference versus Russell 1000 ® Value Index Net of Fees (1.58) (0.90) 0.35 0.16 0.53 Global Large Cap Core Gross 1/05 3.17 16.44 15.56 8.44 8.31 Global Large Cap Core Net 2.71 15.91 15.02 7.90 7.76 MSCI World ® Index 1.97 14.90 13.72 6.96 6.58 Difference versus MSCI World ® Index Net of Fees 0.74 1.02 1.30 0.93 1.18 International Large Cap Core Gross 11/06 (2.21) 14.58 12.17 - 5.02 International Large Cap Core Net (2.62) 14.10 11.70 - 4.58 MSCI EAFE ® Index (3.82) 12.45 10.03 - 2.67 Difference versus MSCI EAFE ® Index Net of Fees 1.20 1.65 1.67 - 1.91 U.S. Broad Enhanced Index Gross 10/08 6.50 17.23 17.41 - 11.32 U.S. Broad Enhanced Index Net 6.27 16.97 17.15 - 11.04 Russell 1000 ® Index 7.37 17.73 17.58 - 11.57 Difference versus Russell 1000 ® Index Net of Fees (1.10) (0.76) (0.43) - (0.53) Annualized Returns (%) for Periods Ended 6/30/2015 (2) (1) (2) |

|
|
Mathematical equity performance: relative return strategies (cont.) (1) Past performance is no guarantee of future results. Notes: Excludes absolute volatility strategies. Returns for periods greater than 1 year are annualized. Refer to p. 28 for performance disclosure. Differences may not agree with input data due to rounding. Inception Since Composite and Respective Benchmark Date 1 Year 3 Year 5 Year 10 Year Inception Global Large Cap Core ex Japan (Kokusai) Gross 5/09 1.46 16.43 15.71 - 15.85 Global Large Cap Core ex Japan (Kokusai) Net 1.02 15.87 15.13 - 15.25 MSCI KOKUSAI ® World ex Japan Index 1.36 15.02 14.23 - 14.93 Difference versus MSCI KOKUSAI ® World ex Japan Index Net of Fees (0.34) 0.85 0.90 - 0.32 European Large Cap Core Gross (EUR) 1/10 16.61 21.63 16.25 - 15.36 European Large Cap Core Net (EUR) 16.02 20.99 15.62 - 14.74 MSCI Europe ® Index (EUR) 14.08 18.00 12.79 - 11.16 Difference versus MSCI Europe ® Index (EUR) Net of Fees 1.95 2.99 2.84 - 3.58 Global All Country Enhanced Index Gross 11/11 0.85 13.80 - - 12.32 Global All Country Enhanced Index Net 0.50 13.40 - - 11.93 MSCI All Country World ® Index 1.23 13.61 - - 11.82 Difference versus MSCI All Country World ® Index Net of Fees (0.73) (0.20) - - 0.12 Enhanced Index North America Gross 7/12 5.10 16.31 - - 16.31 Enhanced Index North America Net 4.81 15.99 - - 15.99 MSCI North America ® Index 5.96 16.54 - - 16.54 Difference versus MSCI North America ® Index Net of Fees (1.15) (0.55) - - (0.55) Large Cap Core USA Gross 8/12 5.75 - - - 17.62 Large Cap Core USA Net 5.29 - - - 17.14 MSCI USA ® Index 7.60 - - - 17.51 Difference versus MSCI USA ® Index Net of Fees (2.31) - - - (0.37) Global All Country Core Gross 5/13 1.83 - - - 9.69 Global All Country Core Net 1.31 - - - 9.08 MSCI All Country World ® Index 1.23 - - - 9.31 Difference versus MSCI All Country World ® Index Net of Fees 0.08 - - - (0.23) Emerging Markets Core Gross 6/13 (1.44) - - - 1.40 Emerging Markets Core Net (2.22) - - - 0.60 MSCI Emerging Markets® Index (4.77) - - - 1.10 Difference versus MSCI Emerging Markets ® Index Net of Fees 2.55 - - - (0.50) Global All Country Core Select Gross 6/13 2.29 - - - 10.64 Global All Country Core Select Net 1.60 - - - 9.89 MSCI All Country World ® Index 1.23 - - - 9.80 Difference versus MSCI All Country World ® Index Net of Fees 0.37 - - - 0.09 Global Defensive Core Gross 4/14 4.67 - - - 7.18 Global Defensive Core Net 4.10 - - - 6.59 Russell Global Large Cap Defensive ® Index 0.04 - - - 4.29 Difference versus Russell Global Large Cap Defensive ® Index Net of Fees 4.06 - - - 2.30 Global All Country Core ex U.S. Gross 7/14 (4.59) - - - (4.59) Global All Country Core ex U.S. Net (5.16) - - - (5.16) MSCI All Country World ® ex USA Index (4.85) - - - (4.85) Difference versus MSCI All Country World ® ex USA Index Net of Fees (0.31) - - - (0.31) Annualized Returns (%) for Periods Ended 6/30/2015 (2) (1) (2) |

|
|
Mathematical equity performance disclosure For the period ending June 30, 2015, 25%, 75%, 67% and 40% of the mathematical equity mutual funds were beating their benchmarks on a 1-, 3-, 5-year and since-fund inception basis. Funds included in the analysis and their inception dates are: INTECH U.S. Core Fund – Class T (2/03); INTECH US Managed Volatility Fund – Class I (12/05); INTECH International Managed Volatility Fund – Class I (5/07), INTECH Global Income Managed Volatility Fund – Class I (12/11) and INTECH Emerging Markets Fund – Class I (12/14). INTECH's focus on managed volatility may keep the Fund from achieving excess returns over its index. The strategy may underperform during certain periods of up markets and may not achieve the desired level of protection in down markets. The proprietary mathematical process used by INTECH may not achieve the desired results. Since the portfolios are regularly re-balanced, this may result in a higher portfolio turnover rate, higher expenses and potentially higher net taxable gains or losses compared to a "buy and hold" or index fund strategy. Past performance cannot guarantee future results. Investing involves risk, including the possible loss of principal and fluctuation of value. Performance results reflect the reinvestment of dividends and other earnings. Composite performance results shown are time-weighted rates of return using daily valuation, include the effect of transaction costs (commissions, exchange fees, etc.), and are gross of non-reclaimable withholding taxes, if any. The composites include all actual fee-paying accounts managed on a fully discretionary basis according to the investment strategy from inception date, including those no longer under management. Portfolios meeting such criteria enter the composite upon the full first month under management. Reporting currency is USD, unless otherwise noted. The gross performance results presented do not reflect the deduction of investment advisory fees. Returns will be reduced by such advisory fees and other contractual expenses as described in each client’s individual contract. The net performance results do not reflect the deduction of investment advisory fees actually charged to the accounts in the composite. However, the net performance results do reflect the deduction of model investment advisory fees. Through 12/31/04, net returns were derived using the maximum fixed fee in effect for each strategy. As of 1/1/05, net returns are calculated by applying the standard fee schedule in effect for the respective period to each account in the composite on a monthly basis. Actual advisory fees may vary among clients invested in this strategy. Actual advisory fees paid may be higher or lower than model advisory fees. Some clients may utilize a performance-based fee. For U.S. Large Cap Growth from inception to 12/31/05, the composite’s benchmark was the S&P 500/Barra Growth Index (“Barra Growth Index”). In 2005, S&P announced index name and methodology changes affecting the Barra Growth Index, which later became the S&P 500/Citigroup Growth Index (“Citigroup Growth Index”). During the transitional period, from 1/1/06 to 3/31/06, the benchmark return consisted partially of the return of the Barra Growth Index and the Citigroup Growth Index. On 4/1/06, the composite’s benchmark was changed to the Citigroup Growth Index. Effective 12/9/2009, the Citigroup Growth Index's name was changed to S&P 500 Growth Index. The S&P 500 Growth Index is a market-capitalization-weighted index developed by Standard and Poor's consisting of those stocks within the S&P 500 Index that exhibit strong growth characteristics. The index measures the performance of the growth style of investing in large cap U.S. stocks. The S&P 500 Growth Index will be reconstituted annually. Prior to May 21, 2010, with respect to non-U.S. securities traded on non-U.S. exchanges, INTECH used fair value prices that reflected current market conditions at the end of regular trading hours of the NYSE, normally 4:00 PM ET, rather than unadjusted closing prices in local markets. Therefore, the prices as well as foreign exchange rates used to calculate the U.S. dollar market values of securities may have differed from those used by an index. Indices typically use the unadjusted closing price in local markets instead of fair value pricing. As of May 21, 2010, prices for non-U.S. securities traded on non-U.S. exchanges are valued as of the close of their respective local markets. Non-U.S. securities are translated into U.S. dollars using the 4:00 PM London spot rate. Non-U.S. investments are subject to certain risks of overseas investing, including currency fluctuations and changes in political and economic conditions, which could result in significant market fluctuations. These risks are magnified in emerging markets. With respect to European Large Cap Core, prices assigned to investments are published prices on their primary markets or exchanges since the composite’s inception. The returns for the indices shown do not include any transaction costs, management fees or other costs, and are gross of dividend tax withholdings. Mathematical equity strategies included in the investment performance summaries include those strategies with at least a 1-year track record. Absolute volatility strategies are excluded. MSCI makes no express or implied warranties or representations and shall have no liability whatsoever with respect to any MSCI data contained herein. The MSCI data may not be further redistributed or used as a basis for other indices or any securities or financial products This report has not been approved, reviewed or produced by MSCI. |
|
|
Other important disclosures Data presented reflects past performance, which is no guarantee of future results. Due to market volatility, current performance may be higher or lower than the performance shown. Call 877.33JANUS (52687) or visit janus.com/advisor/mutual-funds for performance, rankings and ratings current to the most recent month-end. Janus Capital Group Inc. (“JCG”) provides investment advisory services through its primary subsidiaries, Janus Capital Management LLC (“Janus”), INTECH Investment Management LLC (“INTECH”) and Perkins Investment Management LLC (“Perkins”). VelocityShares ETNs are issued by Credit Suisse AG (Credit Suisse), the Janus Volatility Hedged Large Cap ETF and the Janus Velocity Tail Risk Hedged ETF are advised by ALPS Advisors, Inc. (ALPS), and the Janus Equal Risk Weighted Large Cap ETF is advised by Exchange Traded Concepts, LLC (ETC). Credit Suisse, ALPS and ETC are not affiliated with Janus Capital Group Inc. “Complex-Wide Mutual Funds” means all affiliated mutual funds managed by Janus, INTECH and Perkins. “Fundamental Equity Mutual Funds” means all mutual funds managed by Janus or Perkins that invest in equity securities. “Fixed Income Mutual Funds” means all mutual funds managed by Janus that invest primarily in fixed income securities. “Mathematical Equity Strategies” means all relative return, discretionary managed accounts (not mutual funds) that are advised or sub-advised by INTECH. "Janus Equity Mutual Funds" means all mutual funds managed by Janus that invest in equity securities. Perkins and INTECH funds are excluded. Mutual fund relative performance analysis shown is for each Fund's parent share class (typically the share class with the longest performance history): Class T, S or I Shares in the Janus retail fund (“JIF”) trust and the Institutional or Service Shares in the Janus Aspen Series (“JAS”). These share classes may not be eligible for purchase by all investors. Other share classes may have higher sales and management fees, which can result in differences in performance. Morningstar Comparative Performance Morningstar performance on an asset-weighted basis is calculated by taking all funds and assigning the assets under management ("AUM") in each respective fund to either the 1st, 2nd, 3rd or 4th quartile bucket based on each fund's respective Morningstar relative ranking. The total AUM of each quartile’s bucket is then divided by complex-wide total AUM to arrive at the respective percent of AUM in each bucket. The Morningstar percentile ranking is based on the fund’s total-return percentile rank relative to all funds that have the same category for the same time period. The highest (or most favorable) percentile rank is 1%, and the lowest (or least favorable) percentile rank is 100%. Morningstar total-return includes both income and capital gains or losses and is not adjusted for sales charges. The top-performing funds in a category will always receive a rank of 1. For the 1-, 3-, 5- and 10-year periods ending June 30, 2015, 62%, 64%, 51% and 77% of the 55, 50, 39 and 31 Complex-Wide mutual funds; 67%, 60%, 44% and 77% of the 42, 40, 32 and 26 Fundamental Equity mutual funds; 50%, 83%, 75%; and 100% of the 8, 6, 4 and 4 Fixed Income mutual funds outperformed the majority of their Morningstar peers based on total returns. On an asset-weighted basis, 81% of the Complex-Wide mutual fund assets, 78% of the Fundamental Equity mutual fund assets and 100% of the Fixed Income mutual fund assets outperformed the majority of their Morningstar peers based on total returns for the 10-year period. The Overall Morningstar RatingTM for a fund is derived from a weighted-average of the performance figures associated with its three-, five- and ten-year (if applicable) Morningstar RatingTM metrics. For each fund with at least a three-year history, Morningstar calculates a Morningstar RatingTM based on a Morningstar Risk-Adjusted Return measure that accounts for variation in a fund’s monthly performance (including the effects of sales charges, loads, and redemption fees), placing more emphasis on downward variations and rewarding consistent performance. The top 10% of the funds in each category receive 5 stars, the next 22.5% receive 4 stars, the next 35% receive 3 stars, the next 22.5% receive 2 stars and the bottom 10% receive 1 star. (Each share class is counted as a fraction of one fund within this scale and rated separately, which may cause slight variations in the distribution percentages.) The Morningstar RatingTM may differ among share classes of a mutual fund as a result of different sales loads and/or expense structures. It may be based, in part, on the performance of a predecessor fund. Morningstar does not rate funds with less than a 3-year performance history. For the period ending June 30, 2015, 50%, 44% and 61% of Complex-Wide mutual funds had a 4- or 5-star Morningstar rating for the 3-, 5- and 10-year periods based on risk-adjusted returns for 50, 39 and 31 funds, respectively. 50 funds were included in the analysis for the Overall period. Investing involves risk, including the possible loss of principal. The value of your investment will fluctuate over time and you may gain or lose money. A fund’s performance may be affected by risks that include those associated with non-diversification, non-investment grade debt securities, high-yield/high-risk securities, undervalued or overlooked companies, investments in specific industries or countries and potential conflicts of interest. Additional risks to funds may include those associated with investing in foreign securities, emerging markets, initial public offerings, real estate investment trusts (REITs), derivatives, short sales, commodity linked Investments and companies with relatively small market capitalizations. Each fund has different risks, please see a Janus prospectus for more information about risks, fund holdings and other details. |
|
|
Other important disclosures Indexes are not available for direct investment; therefore, their performance does not reflect the expenses associated with the active management of an actual portfolio. Russell 1000® Growth Index measures the performance of those Russell 1000 companies with higher price-to-book ratios and higher forecasted growth values. Russell 1000® Value Index measures the performance of those Russell 1000 companies with lower price-to-book ratios and lower forecasted growth values. Russell Midcap® Value Index measures the performance of those Russell Midcap® companies with lower price-to-book ratios and lower forecasted growth rates. Russell 2000® Value Index measures the performance of those Russell 2000® companies with lower price-to-book ratios and lower forecasted growth values. S&P 500® Index is a commonly recognized, market capitalization weighted index of 500 widely held equity securities, designed to measure broad U.S. equity performance. MSCI World IndexSM is a market capitalization weighted index composed of companies representative of the market structure of Developed Market countries in North America, Europe and the Asia/Pacific Region. MSCI EAFE® Index is a market capitalization weighted index composed of companies representative of the market structure of Developed Market countries in Europe, Australasia and the Far East. MSCI World Growth Index is a subset of the Morgan Stanley Capital WorldSM Index which is a market capitalization weighted index composed of companies representative of the market structure of developed market countries around the world. The index includes reinvestment of dividends, net of foreign withholding taxes. MSCI All Country World Index is a free float-adjusted market capitalization weighted index that is designed to measure performance of global developed and emerging equity markets. MSCI All Country World ex-U.S. IndexSM is an unmanaged, free float-adjusted, market capitalization weighted index composed of stocks of companies located in countries throughout the world, excluding the United States. It is designed to measure equity market performance in global developed and emerging markets outside the United States. The index includes reinvestment of dividends, net of foreign withholding taxes. Russell 1000 Index measures performance of the 1,000 largest companies in the Russell 3000 Index. Core Growth Index is an internally calculated, hypothetical combination of unmanaged indices that combines total returns from the Russell 1000® Growth Index (50%) and the S&P 500® Index (50%). MSCI USA Index is a free float-adjusted market capitalization index that is designed to measure large and mid cap U.S. equity market performance. MSCI World ex Australia Index is a free float-adjusted market capitalization weighted index that is designed to measure the equity market performance of developed markets excluding Australia. MSCI KOKUSAI World ex Japan Index is a free float-adjusted market capitalization index that is designed to measure the equity market performance of developed markets excluding Japan. MSCI Europe Index is a free float-adjusted market capitalization weighted index that is designed to measure the equity market performance of the developed markets in Europe. MSCI North America Index is a free float-adjusted market capitalization-weighted index that is designed to measure the performance of the developed equity markets in Canada and the United States. MSCI Emerging Markets Index is a free float-adjusted market capitalization index that is designed to measure equity market performance in the global emerging markets. Russell Global Large Cap Defensive Index measures the performance of the investable securities in the Global Large Cap Defensive segment of the market. Please consider the charges, risks, expenses and investment objectives carefully before investing. For a prospectus or, if available, a summary prospectus containing this and other information, please call Janus at 1-800-525-3713 or download the file from www.janus.com. Read it carefully before you invest or send money. Funds distributed by Janus Distributors LLC. C-0715-94220 10-15-15 |
|
|
Safe harbor statement This presentation includes statements concerning potential future events involving Janus Capital Group Inc. that could differ materially from the events that actually occur. The differences could be caused by a number of factors including those factors identified in Janus’ Annual Report on Form 10-K for the year ended December 31, 2014, on file with the Securities and Exchange Commission (Commission file no. 001-15253), including those that appear under headings such as “Risk Factors” and “Management’s Discussion and Analysis of Financial Condition and Results of Operations.” Many of these factors are beyond the control of the company and its management. Any forward-looking statements contained in this presentation are as of the date on which such statements were made. The company assumes no duty to update them, even if experience, unexpected events, or future changes make it clear that any projected results expressed or implied therein will not be realized. |