Attached files
| file | filename |
|---|---|
| EX-31.4 - EXHIBIT 31.4 - PENN VIRGINIA CORP | pva-20141231xex314.htm |
| EX-31.3 - EXHIBIT 31.3 - PENN VIRGINIA CORP | pva-20141231xex313.htm |
| EX-23.1 - EXHIBIT 23.1 - PENN VIRGINIA CORP | pva-20141231xexx231.htm |
UNITED STATES
SECURITIES AND EXCHANGE COMMISSION
Washington, D.C. 20549
________________________________________________________
FORM 10-K/A
(Amendment No. 1)
________________________________________________________
ANNUAL REPORT PURSUANT TO SECTION 13 OR 15(d) OF THE
SECURITIES EXCHANGE ACT OF 1934
For the fiscal year ended December 31, 2014
Commission file number: 1-13283
_________________________________________________________

PENN VIRGINIA CORPORATION
(Exact name of registrant as specified in its charter)
Virginia | 23-1184320 | |
(State or other jurisdiction of incorporation or organization) | (I.R.S. Employer Identification Number) | |
Four Radnor Corporate Center, Suite 200
100 Matsonford Road
Radnor, Pennsylvania 19087
(Address of principal executive offices)
Registrant’s telephone number, including area code: (610) 687-8900
Securities registered pursuant to Section 12(b) of the Act: None
Securities registered pursuant to Section 12(g) of the Act:
Title of each class | Name of exchange on which registered | |
Common Stock, $0.01 Par Value | New York Stock Exchange | |
__________________________________________________________
Indicate by check mark if the registrant is a well-known seasoned issuer, as defined in Rule 405 of the Securities Act. Yes ý No ¨
Indicate by check mark if the registrant is not required to file reports pursuant to Section 13 or Section 15(d) of the Securities Exchange Act of 1934 (“Exchange Act”). Yes ¨ No ý
Indicate by check mark whether the registrant (1) has filed all reports required to be filed by Section 13 or 15(d) of the Exchange Act during the preceding 12 months (or for such shorter period that the registrant was required to file such reports), and (2) has been subject to such filing requirements for the past 90 days. Yes ý No ¨
Indicate by check mark whether the registrant has submitted electronically and posted on its corporate Web site, if any, every Interactive Data File required to be submitted and posted pursuant to Rule 405 of Regulation S-T during the preceding 12 months (or for such shorter period that the registrant was required to submit and post such files). Yes ý No ¨
Indicate by check mark if disclosure of delinquent filers pursuant to Item 405 of Regulation S-K is not contained herein, and will not be contained, to the best of the registrant’s knowledge, in definitive proxy or information statements incorporated by reference in Part III of this Form 10-K or any amendment to this Form 10-K. ý
Indicate by check mark whether the registrant is a large accelerated filer, an accelerated filer, a non-accelerated filer or a smaller reporting company. See the definitions of “large accelerated filer,” “accelerated filer” and “smaller reporting company” in Rule 12b-2 of the Exchange Act. (Check One)
Large accelerated filer | ý | Accelerated filer | o | Non-accelerated filer | o | Smaller reporting company | o | |||
Indicate by check mark whether the registrant is a shell company (as defined in Rule 12b-2 of the Exchange Act). Yes ¨ No ý
The aggregate market value of common stock held by non-affiliates of the registrant was $1,152,221,812 as of June 30, 2014 (the last business day of its most recently completed second fiscal quarter), based on the last sale price of such stock as quoted on the New York Stock Exchange. For purposes of making this calculation only, the registrant has defined affiliates as including all directors and executive officers of the registrant. This determination of affiliate status is not necessarily a conclusive determination for other purposes.
As of July 14, 2015, 71,676,606 shares of common stock of the registrant were outstanding.
DOCUMENTS INCORPORATED BY REFERENCE - NONE
PENN VIRGINIA CORPORATION AND SUBSIDIARIES
ANNUAL REPORT (Amendment) ON FORM 10-K/A
For the Fiscal Year Ended December 31, 2014
Table of Contents
Page | ||
Explanatory Note | ||
Forward-Looking Statements | ||
Glossary of Certain Industry Terminology | ||
Part I | ||
Item | ||
2. | Properties | |
Part II | ||
7. | Management’s Discussion and Analysis of Financial Condition and Results of Operations: | |
Overview and Executive Summary | ||
Key Developments | ||
Results of Operations | ||
Financial Condition | ||
Off-Balance Sheet Arrangements | ||
Contractual Obligations | ||
Critical Accounting Estimates | ||
Part IV | ||
15. | Exhibits and Financial Statement Schedules | |
Signatures | ||
EXPLANATORY NOTE
This Amendment No. 1 on Form 10-K/A (“Form 10-K/A”) to the Annual Report on Form 10-K of Penn Virginia Corporation (the “Company”) for the fiscal year ended December 31, 2014, originally filed with the Securities and Exchange Commission on February 25, 2015 (the “Original 10-K”), is being filed for the purpose of amending certain disclosures, and providing further disclosures, regarding the Company's proved undeveloped reserves as set forth on page 22 of the Original 10-K and the effect of commodity price changes on the Company's proved reserves as set forth on page 30 of the Original 10-K.
This Form 10-K/A includes Item 2 of Part I, Item 7 of Part II and Item 15 of Part IV. This Form 10-K/A also includes a currently dated consent of the Company’s independent petroleum engineers, as well as CEO and CFO certifications pursuant to Section 302 of the Sarbanes Oxley Act of 2002. Because no financial statements have been included in this Form 10-K/A, and this Form 10-K/A does not contain or amend any disclosure with respect to Items 307 and 308 of Regulation S-K, paragraph 3 of the CEO and CFO certifications has been revised to omit the reference to financial statements and paragraphs 4 and 5 of the CEO and CFO certifications have been omitted.
Except as described above, this Form 10-K/A does not modify or update disclosures in, or exhibits to, the Original 10-K. Furthermore, this Form 10-K/A does not change any previously reported financial results, nor does it reflect events occurring after the date of the Original 10-K. Information not affected by this Form 10-K/A remains unchanged and reflects the disclosures made at the time the Original 10-K was filed.
1
Forward-Looking Statements
Certain statements contained herein that are not descriptions of historical facts are “forward-looking” statements within the meaning of Section 27A of the Securities Act of 1933, as amended, and Section 21E of the Securities Exchange Act of 1934, as amended, or the Exchange Act. Because such statements include risks, uncertainties and contingencies, actual results may differ materially from those expressed or implied by such forward-looking statements. These risks, uncertainties and contingencies include, but are not limited to, the following:
• | the volatility of commodity prices for oil, natural gas liquids and natural gas; |
• | our ability to develop, explore for, acquire and replace oil and gas reserves and sustain production; |
• | our ability to generate profits or achieve targeted reserves in our development and exploratory drilling and well operations; |
• | any impairments, write-downs or write-offs of our reserves or assets; |
• | the projected demand for and supply of oil, natural gas liquids and natural gas; |
• | reductions in the borrowing base under our revolving credit facility; |
• | our ability to contract for drilling rigs, supplies and services at reasonable costs; |
• | our ability to obtain adequate pipeline transportation capacity for our oil and gas production at reasonable cost and to sell the production at, or at reasonable discounts to, market prices; |
• | the uncertainties inherent in projecting future rates of production for our wells and the extent to which actual production differs from estimated proved oil and gas reserves; |
• | drilling and operating risks; |
• | our ability to compete effectively against other oil and gas companies; |
• | our ability to successfully monetize select assets and repay our debt; |
• | leasehold terms expiring before production can be established; |
• | environmental obligations, costs and liabilities that are not covered by an effective indemnity or insurance; |
• | the timing of receipt of necessary regulatory permits; |
• | the effect of commodity and financial derivative arrangements; |
• | our ability to maintain adequate financial liquidity and to access adequate levels of capital on reasonable terms; |
• | the occurrence of unusual weather or operating conditions, including force majeure events; |
• | our ability to retain or attract senior management and key technical employees; |
• | counterparty risk related to the ability of these parties to meet their future obligations; |
• | compliance with and changes in governmental regulations or enforcement practices, especially with respect to environmental, health and safety matters; |
• | physical, electronic and cybersecurity breaches; |
• | uncertainties relating to general domestic and international economic and political conditions; and |
• | other factors set forth in our periodic filings with the Securities and Exchange Commission, including the risks set forth in Item 1A of this Annual Report on Form 10-K for the year ended December 31, 2014. |
Additional information concerning these and other factors can be found in our press releases and public periodic filings with the Securities and Exchange Commission. Many of the factors that will determine our future results are beyond the ability of management to control or predict. Readers should not place undue reliance on forward-looking statements, which reflect management’s views only as of the date hereof. All subsequent written and oral forward-looking statements attributable to us or persons acting on our behalf are expressly qualified in their entirety by these cautionary statements. We undertake no obligation to revise or update any forward-looking statements, or to make any other forward-looking statements, whether as a result of new information, future events or otherwise, except as may be required by applicable law.
2
Glossary of Certain Industry Terminology
The following abbreviations, terms and definitions are commonly used in the oil and gas industry and are used within this Annual Report on Form 10-K/A.
AMI. Area of mutual interest.
Bbl. A standard barrel of 42 U.S. gallons liquid volume of oil or other liquid hydrocarbons.
Bcf. One billion cubic feet of natural gas.
Bcfe. One billion cubic feet of natural gas equivalent with one barrel of crude oil, condensate or natural gas liquids converted to six thousand cubic feet of natural gas based on the estimated relative energy content.
BOE. One barrel of oil equivalent with six thousand cubic feet of natural gas converted to one barrel of crude oil based on the estimated relative energy content.
BOEPD. Barrels of oil equivalent per day.
Borrowing base. The value assigned to a collection of borrower’s assets used by lenders to determine an initial and/or continuing amount for loans. In the case of oil and gas exploration and development companies, the borrowing base is generally based on proved developed reserves.
Completion. A process of treating a drilled well, including hydraulic fracturing among other stimulation processes, followed by the installation of permanent equipment for the production of oil or gas.
Condensate. A mixture of hydrocarbons that exists in the gaseous phase at original reservoir temperature and pressure, but that, when produced, is in the liquid phase at surface temperature and pressure.
Development well. A well drilled within the proved area of an oil or gas reservoir to the depth of a stratigraphic horizon known to be productive.
Dry hole. A well found to be incapable of producing either oil or gas in sufficient commercial quantities to justify completion of the well.
Drilling carry. A working interest that will be carried through the drilling and completion of a well.
Exploratory well. A well drilled to find a new field or to find a new reservoir in a field previously found to be productive of oil or gas in another reservoir. Generally, an exploratory well is any well that is not a development well, a service well or a stratigraphic test well.
EUR. Estimated ultimate reserves, the sum of reserves remaining as of a given date and cumulative production as of that date.
GAAP. Accounting principles generally accepted in the Unites States of America.
Gas lift. A method of artificial lift that uses an external source of high-pressure gas for supplementing formation gas for lifting the well fluids.
Gross acre or well. An acre or well in which a working interest is owned.
HBP. Held by production is a provision in an oil and gas or mineral lease that perpetuates the leaseholder’s right to operate the property as long as the property produces a minimum paying quantity of oil or gas.
Henry Hub. The Erath, Louisiana settlement point price for natural gas.
IP. Initial production, a measurement of a well’s production at the outset.
LLS. Light Louisiana Sweet is a crude oil pricing index reference.
LIBOR. London Interbank Offered Rate.
MBbl. One thousand barrels of oil or other liquid hydrocarbons.
MBOE. One thousand barrels of oil equivalent.
Mcf. One million barrels of oil or other liquid hydrocarbons.
MMBbl. One million barrels of oil or other liquid hydrocarbons.
MMBOE. One million barrels of oil equivalent.
MMBtu. One million British thermal units, a measure of energy content.
MMcf. One million cubic feet of natural gas.
Net acre or well. The number of gross acres or wells multiplied by the owned working interest in such gross acres or wells.
NGL. Natural gas liquid.
NYMEX. New York Mercantile Exchange.
3
NYSE. New York Stock Exchange.
Operator. The entity responsible for the exploration and/or production of a lease or well.
Play. A geological formation with potential oil and gas reserves.
Preferential rights. The rights that nonselling participating parties have in a lease, well or unit to proportionately acquire the interest that a participating party proposes to sell to a third party.
Productive wells. Wells that are not dry holes.
Possible reserves. Those additional reserves that are less certain to be recovered than probable reserves. When probabilistic methods are used, there should be at least a 10% probability that the total quantities ultimately recovered will equal or exceed the proved plus probable plus possible reserves estimates.
Probable reserves. Those additional reserves that are less certain to be recovered than proved reserves but which, together with proved reserves, are as likely as not to be recovered. When probabilistic methods are used, there should be at least a 50% probability that the actual quantities recovered will equal or exceed the proved plus probable reserves estimates.
Proved reserves. Those quantities of oil and gas which, by analysis of geoscience and engineering data, can be estimated with reasonable certainty to be economically producible from a given date forward, from known reservoirs, and under existing economic conditions, operating methods and government regulations before the time at which contracts providing the right to operate expire, unless evidence indicates that renewal is reasonably certain, regardless of whether deterministic or probabilistic methods are used for the estimation.
Proved developed reserves. Proved reserves that can be expected to be recovered: (a) through existing wells with existing equipment and operating methods or in which the cost of the required equipment is relatively minor compared with the cost of a new well or (b) through installed extraction equipment and infrastructure operational at the time of the reserves estimate if the extraction is by means not involving a well.
Proved undeveloped reserves. Proved reserves that are expected to be recovered from new wells on undrilled acreage, or from existing wells where a relatively major expenditure is required for recompletion. Reserves on undrilled acreage are limited to those directly offsetting development spacing areas that are reasonably certain of production when drilled.
PV10. Present value of estimated future oil and gas revenues, net of estimated direct expenses, discounted at an annual discount rate of 10%.
Reservoir. A porous and permeable underground formation containing a natural accumulation of hydrocarbons that is confined by impermeable rock or water barriers and is separate from other reservoirs.
SEC. United States Securities and Exchange Commission.
Standardized measure. The present value, discounted at 10% per year, of estimated future cash inflows from the production of proved reserves, computed by applying prices used in estimating proved oil and gas reserves to the year-end quantities of those reserves (except for consideration of future price changes to the extent provided by contractual arrangements in existence at year-end), reduced by estimated future development and production costs, computed by estimating the expenditures to be incurred in developing and producing the proved oil and gas reserves at the end of the year (including the settlement of asset retirement obligations), based on year-end costs and assuming continuation of existing economic conditions, further reduced by estimated future income tax expenses, computed by applying the appropriate year-end statutory tax rates, with consideration of future tax rates already legislated, to the future pretax net cash flows relating to the proved oil and gas reserves, less the tax basis of the properties involved and giving effect to the tax deductions and tax credits and allowances relating to the proved oil and gas reserves.
Revenue interest. An economic interest in production of hydrocarbons from a specified property.
Royalty interest. An interest in the production of a well entitling the owner to a share of production generally free of the costs of exploration, development and production.
Unconventional. Generally refers to hydrocarbon reservoirs that lack discrete boundaries that typically define conventional reservoirs. They are typically referred to as shales, tight sands or coal beds.
Undeveloped acreage. Lease acreage on which wells have not been drilled or completed to a point that would permit the production of economic quantities of oil or gas, regardless of whether such acreage contains proved reserves.
WTI. West Texas Intermediate, a crude oil pricing index reference.
Working interest. A cost-bearing interest under an oil and gas lease that gives the holder the right to develop and produce the minerals under the lease.
4
Part I
Item 2 | Properties |
The following map shows the general locations of our oil and gas assets as of December 31, 2014:
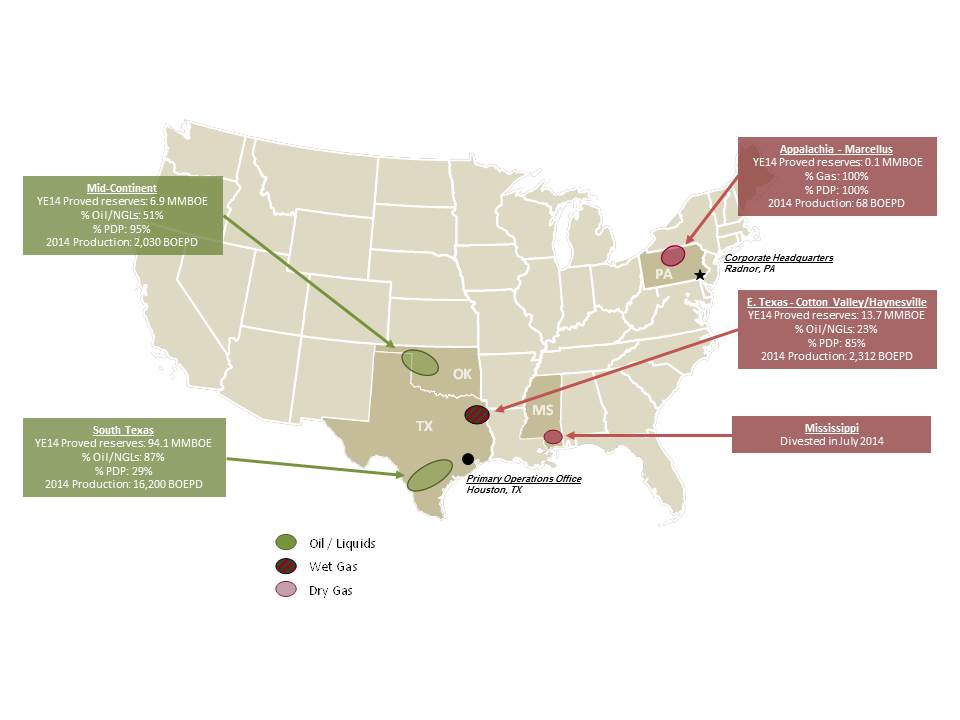
Facilities
All of our office facilities are leased with the exception of our district operations facilities in Scottsville, Texas. We believe that our facilities are adequate for our current needs.
Title to Oil and Gas Properties
Prior to completing an acquisition of producing oil and gas assets, we review title opinions on all material leases. However, as is customary in the oil and gas industry, we make a cursory review of title to farmout acreage and when we acquire undeveloped oil and gas leases. Prior to the commencement of drilling operations, a thorough title examination is conducted. To the extent the title examination reflects defects, we cure such title defects. If we are unable to cure any title defect of a nature such that it would not be prudent to commence drilling operations on a property, we could suffer a loss of our investment in the property. Our oil and gas properties are subject to customary royalty interests, liens for debt obligations, current taxes and other burdens that we believe do not materially interfere with the use or materially affect the value of such properties. We believe that we have satisfactory title to all of our properties and the associated oil and gas in accordance with standards generally accepted in the oil and gas industry.
5
Summary of Oil and Gas Reserves
Proved Reserves
The following tables summarize certain information regarding our estimated proved reserves as of December 31 for each of the years presented:
Crude Oil | NGLs | Natural Gas | Oil Equivalents | Standardized Measure | Price Measurement Used 1 | ||||||||||||||||||||||
(MMBbl) | (MMBbl) | (Bcf) | (MMBOE) | $ in millions | $/Bbl of Oil | $/Bbl of NGLs | $/MMBtu | ||||||||||||||||||||
2014 | |||||||||||||||||||||||||||
Developed | |||||||||||||||||||||||||||
Producing | 21.8 | 7.4 | 77.9 | 42.1 | $ | 794.9 | |||||||||||||||||||||
Non-producing | 0.3 | 0.7 | 16.6 | 3.8 | 8.6 | ||||||||||||||||||||||
22.1 | 8.1 | 94.5 | 45.9 | 803.5 | |||||||||||||||||||||||
Undeveloped | 47.0 | 11.1 | 64.7 | 68.9 | 378.9 | ||||||||||||||||||||||
69.0 | 19.2 | 159.2 | 114.8 | $ | 1,182.4 | $ | 92.91 | $ | 25.49 | $ | 4.32 | ||||||||||||||||
2013 | |||||||||||||||||||||||||||
Developed | |||||||||||||||||||||||||||
Producing | 19.0 | 7.5 | 146.5 | 50.9 | $ | 701.7 | |||||||||||||||||||||
Non-producing | 0.3 | 1.0 | 16.7 | 4.1 | 7.3 | ||||||||||||||||||||||
19.3 | 8.5 | 163.2 | 55.0 | 709.0 | |||||||||||||||||||||||
Undeveloped | 41.4 | 13.4 | 158.9 | 81.3 | 554.8 | ||||||||||||||||||||||
60.7 | 21.9 | 322.1 | 136.3 | $ | 1,263.8 | $ | 103.11 | $ | 31.10 | $ | 3.47 | ||||||||||||||||
2012 | |||||||||||||||||||||||||||
Developed | |||||||||||||||||||||||||||
Producing | 10.2 | 7.0 | 152.0 | 42.5 | $ | 408.5 | |||||||||||||||||||||
Non-producing | 0.3 | 1.2 | 17.4 | 4.5 | 43.0 | ||||||||||||||||||||||
10.5 | 8.3 | 169.4 | 47.0 | 451.5 | |||||||||||||||||||||||
Undeveloped | 14.4 | 12.4 | 238.1 | 66.5 | 46.4 | ||||||||||||||||||||||
24.9 | 20.7 | 407.5 | 113.5 | $ | 497.9 | $ | 102.24 | $ | 39.48 | $ | 2.47 | ||||||||||||||||
1 Crude oil and natural gas prices were based on average (beginning of month basis) sales prices per Bbl and MMBtu with the representative price of natural gas adjusted for basis premium and energy content to arrive at the appropriate net price. NGL prices were estimated as a percentage of the base crude oil price.
All of our reserves are located in the continental United States. The following table sets forth by region the estimated quantities of proved reserves and the percentages thereof that are represented by proved developed reserves as of December 31, 2014:
Proved | % of Total Proved | % Proved | |||||||
Region | Reserves | Reserves | Developed | ||||||
(MMBOE) | |||||||||
Texas | |||||||||
South Texas | 94.1 | 82 | % | 29 | % | ||||
East Texas | 13.7 | 12 | % | 85 | % | ||||
Mid-Continent | 6.9 | 6 | % | 95 | % | ||||
Other 1 | 0.1 | — | % | 100 | % | ||||
114.8 | 100 | % | 40 | % | |||||
___________________
1 Comprised of our three active Marcellus Shale wells.
6
Proved Undeveloped Reserves
The proved undeveloped reserves included in our reserve estimates relate to wells that are forecasted to be drilled within five years of the initial booking of such reserves. The following table sets forth the changes in our proved undeveloped reserves during the year ended December 31, 2014:
Crude Oil | NGLs | Natural Gas | Oil Equivalents | ||||||||
(MMBbl) | (MMBbl) | (Bcf) | (MMBOE) | ||||||||
Proved undeveloped reserves at beginning of year | 41.4 | 13.4 | 158.9 | 81.3 | |||||||
Revisions of previous estimates | (5.1 | ) | (5.4 | ) | (84.2 | ) | (24.5 | ) | |||
Extensions, discoveries and other additions | 18.4 | 5.1 | 26.5 | 28.0 | |||||||
Sale of reserves in place | — | — | (26.1 | ) | (4.4 | ) | |||||
Conversion to proved developed reserves | (7.7 | ) | (2.0 | ) | (10.5 | ) | (11.5 | ) | |||
Proved undeveloped reserves at end of year | 47.0 | 11.1 | 64.7 | 68.9 | |||||||
In 2014, our proved undeveloped reserves decreased by 12.4 MMBOE. Proved undeveloped reserves were revised downward from previous estimates by 24.5 MMBOE, consisting of 19.1 MMBOE in the Cotton Valley and Haynesville Shale in East Texas, 1.6 MMBOE in the Granite Wash in the Mid-Continent and 3.8 MMBOE in the Eagle Ford in South Texas. The East Texas revisions resulted from us removing predomininantly natural gas reserves associated with locations the we determined would likely not be drilled during a five-year period from initial booking because of the continued depression of natural gas prices and the better economic returns in the Eagle Ford. The Granite Wash revisions resulted from the operator of our non-operated acreage deciding to defer the drilling of several non-operated locations. We eliminated the reserves associated with those locations when we determined that the rescheduled drilling dates were beyond five years from initial booking. The Eagle Ford revisions resulted from our determination that the reserves associated with those locations would be captured by existing producing wells.
Extensions, discoveries and other additions of 28.0 MMBOE were attributable to our activities in the Eagle Ford.
We sold our Selma Chalk assets in Mississippi resulting in a decrease of 4.4 MMBOE of proved undeveloped reserves.
We also converted 11.5 MMBOE from proved undeveloped to proved developed reserves in the Eagle Ford. During 2014, we incurred capital expenditures of approximately $381 million in connection with the conversion of proved undeveloped reserves to proved developed reserves. Several factors impacted the rate at which proved undeveloped reserves were converted to developed status. Our Eagle Ford Shale development plan was significantly affected by the dramatic drop in oil prices in the second half of 2014. As we continued to develop and become more knowledgeable about our Eagle Ford Shale acreage up to and through 2014, we also changed our development plan so that we could concentrate our limited capital on our highest economic return locations. This resulted in in the deferral of our planned development of certain proved undeveloped reserves. Our conversion rate was also affected by the decision of the operator of several non-operated locations in teh Granite Wash in the Mid-Continent to defer drilling of those locations initially scheduled for 2014.
The following table sets forth the total proved undeveloped reserves as of December 31, 2014 by region:
Crude Oil | NGLs | Natural Gas | Oil Equivalents | ||||||||
(MMBbl) | (MMBbl) | (Bcf) | (MMBOE) | ||||||||
Texas | |||||||||||
South Texas | 46.7 | 10.7 | 54.7 | 66.5 | |||||||
East Texas | 0.2 | 0.3 | 8.9 | 2.0 | |||||||
Mid-Continent | 0.1 | 0.1 | 1.1 | 0.4 | |||||||
47.0 | 11.1 | 64.7 | 68.9 | ||||||||
Preparation of Reserves Estimates and Internal Controls
The proved reserve estimates were prepared by Wright & Company, Inc., our independent third party petroleum engineers. For additional information regarding estimates of proved reserves and other information about our oil and gas reserves, see the Supplemental Information on Oil and Gas Producing Activities (Unaudited) in our Notes to the Consolidated Financial Statements and the report of Wright & Company, Inc., prepared for us and dated January 9, 2015, which is included as an Exhibit to this Annual Report on Form 10-K. We did not file any reports during the year ended December 31, 2014 with any federal authority or agency with respect to our estimate of oil and gas reserves.
7
Our policies and practices regarding the recording of reserves are structured to objectively and accurately estimate our oil and gas reserve quantities and present values in compliance with the SEC’s regulations and GAAP. Our Vice President, Operations & Engineering is primarily responsible for overseeing the preparation of the reserve estimate by Wright & Company, Inc. Our Vice President, Operations & Engineering has over 29 years of industry experience in the estimation and evaluation of reserve information, holds a B.S. degree in Petroleum Engineering from Texas A&M University and is licensed by the State of Texas as a Professional Engineer. Our internal controls over reserve estimates include reconciliation and review controls, including an independent internal review of assumptions used in the estimation.
There are numerous uncertainties inherent in estimating quantities of reserves and in projecting future rates of production and timing of development expenditures, including many factors beyond our control. For additional information about the risks inherent in our estimates of proved reserves, see Item 1A, “Risk Factors.”
Qualifications of Third Party Petroleum Engineers
The technical person primarily responsible for review of our reserve estimates at Wright & Company, Inc. meets the requirements regarding qualifications, independence, objectivity and confidentiality set forth in the Standards Pertaining to the Estimating and Auditing of Oil and Gas Reserves Information promulgated by the Society of Petroleum Engineers. Wright & Company, Inc. is an independent firm of petroleum engineers, geologists, geophysicists and petro physicists; they do not own an interest in our properties and are not employed on a contingent fee basis.
Oil and Gas Production, Production Prices and Production Costs
Oil and Gas Production by Region
The following tables set forth by region the total production and average daily production for the periods presented:
Total Production for the Year Ended December 31, | |||||||||||||||
Region | 2014 | 2013 | 2012 | ||||||||||||
(MBOE) | |||||||||||||||
Texas | |||||||||||||||
South Texas 1 | 5,913 | 4,091 | 2,334 | ||||||||||||
East Texas | 844 | 1,020 | 1,337 | ||||||||||||
Mid-Continent | 741 | 937 | 1,211 | ||||||||||||
Other 2 | 437 | 776 | 1,631 | ||||||||||||
7,934 | 6,824 | 6,513 | |||||||||||||
Average Daily Production for the Year Ended December 31, | |||||||||||||||
2014 | 2013 | 2012 | |||||||||||||
(BOEPD) | |||||||||||||||
Texas | |||||||||||||||
South Texas 1 | 16,201 | 11,208 | 6,377 | ||||||||||||
East Texas | 2,311 | 2,795 | 3,653 | ||||||||||||
Mid-Continent | 2,029 | 2,567 | 3,309 | ||||||||||||
Other 2 | 1,196 | 2,126 | 4,456 | ||||||||||||
21,738 | 18,696 | 17,795 | |||||||||||||
1 We completed the EF Acquisition in April 2013.
2 Currently consists of our three active Marcellus Shale wells. We sold all of our properties in the Selma Chalk in Mississippi in July 2014, which represented annual production and average daily production of approximately 412 MBOE (1,946 BOEPD), 751 MBOE (2,058 BOEPD) and 847 MBOE (2,314 BOEPD) in 2014, 2013 and 2012, respectively. We sold all of our properties in West Virginia, Kentucky and Virginia in July 2012, which represented annual production and average daily production of approximately 741 MBOE (2,100 BOEPD) in 2012.
8
Production Prices and Production Costs
The following table sets forth the average sales prices per unit of volume and our average production costs, not including ad valorem and production/severance taxes, per unit of production for the periods presented:
Year Ended December 31, | |||||||||||
2014 | 2013 | 2012 | |||||||||
Average prices: | |||||||||||
Crude oil ($ per Bbl) | $ | 90.50 | $ | 101.13 | $ | 101.95 | |||||
NGLs ($ per Bbl) | $ | 31.14 | $ | 31.30 | $ | 35.13 | |||||
Natural gas ($ per Mcf) | $ | 4.44 | $ | 3.64 | $ | 2.46 | |||||
Aggregate ($ per BOE) | $ | 64.64 | $ | 63.11 | $ | 47.67 | |||||
Average production and lifting cost ($ per BOE): | |||||||||||
Lease operating | $ | 6.09 | $ | 5.20 | $ | 4.80 | |||||
Gathering processing and transportation | 2.31 | 1.88 | 2.18 | ||||||||
$ | 8.40 | $ | 7.08 | $ | 6.98 | ||||||
Significant Fields
Our properties in the Eagle Ford in South Texas, which contain primarily oil reserves, represent approximately 82 percent of our total equivalent proved reserve quantities and approximately 93 percent of our total crude oil and NGL reserves as of December 31, 2014. This is the only field that comprises 15% or more of our total proved reserves as of that date.
The following table sets forth certain information with respect to this field for the periods presented:
Year Ended December 31, | |||||||||||
2014 | 2013 | 2012 | |||||||||
Production: | |||||||||||
Crude oil (MBbl) | 4,450 | 3,197 | 1,960 | ||||||||
NGLs (MBbl) | 773 | 478 | 205 | ||||||||
Natural gas (MMcf) | 4,070 | 2,406 | 1,015 | ||||||||
Total (MBOE) | 5,901 | 4,077 | 2,334 | ||||||||
Percent of total company production | 74 | % | 60 | % | 36 | % | |||||
Average prices: | |||||||||||
Crude oil ($ per Bbl) | $ | 90.57 | $ | 101.55 | $ | 103.33 | |||||
NGLs ($ per Bbl) | $ | 25.23 | $ | 26.68 | $ | 31.43 | |||||
Natural gas ($ per Mcf) | $ | 4.20 | $ | 3.52 | $ | 2.56 | |||||
Aggregate ($ per BOE) | $ | 74.49 | $ | 84.85 | $ | 90.63 | |||||
Average production and lifting cost ($ per BOE)1: | |||||||||||
Lease operating | $ | 5.36 | $ | 4.30 | $ | 3.12 | |||||
Gathering processing and transportation | 1.76 | 1.08 | 0.72 | ||||||||
$ | 7.12 | $ | 5.38 | $ | 3.84 | ||||||
1 Excludes production/severance and ad valorem taxes.
9
Drilling and Other Exploratory and Development Activities
The following table sets forth the gross and net development and exploratory wells that we drilled during the years ended December 31, 2014, 2013 and 2012 and wells that were in progress at the end of each year. The number of wells drilled refers to the number of wells completed at any time during the year, regardless of when drilling was initiated.
2014 | 2013 | 2012 | |||||||||||||||
Gross | Net | Gross | Net | Gross | Net | ||||||||||||
Development | |||||||||||||||||
Productive | 83 | 50.8 | 58 | 34.1 | 36 | 27.8 | |||||||||||
Non-productive | 1 | 0.8 | — | — | — | — | |||||||||||
Under evaluation | — | — | 1 | 0.5 | — | — | |||||||||||
Total development | 84 | 51.6 | 59 | 34.6 | 36 | 27.8 | |||||||||||
Exploratory | |||||||||||||||||
Productive | — | — | — | — | 5 | 3.9 | |||||||||||
Non-productive | — | — | — | — | — | — | |||||||||||
Under evaluation | — | — | — | — | 1 | 1.0 | |||||||||||
Total exploratory | — | — | — | — | 6 | 4.9 | |||||||||||
Total | 84 | 51.6 | 59 | 34.6 | 42 | 32.7 | |||||||||||
Wells in progress at end of year1 | 28 | 14.3 | 16 | 11.5 | 3 | 2.7 | |||||||||||
1 Includes 12 gross (5.4 net) wells completing or flowing back, 11 gross (5.9 net) waiting on completion and five gross (3.0 net) wells being drilled as of December 31, 2014.
The following table sets forth the regions in which we drilled our wells for the periods presented:
2014 | 2013 | 2012 | ||||||||||||||||
Region | Gross | Net | Gross | Net | Gross | Net | ||||||||||||
Texas | ||||||||||||||||||
South Texas 1 | 84 | 51.6 | 57 | 34.1 | 35 | 29.5 | ||||||||||||
East Texas | — | — | — | — | — | — | ||||||||||||
Mid-Continent | — | — | 2 | 0.5 | 7 | 3.2 | ||||||||||||
Other | — | — | — | — | — | — | ||||||||||||
84 | 51.6 | 59 | 34.6 | 42 | 32.7 | |||||||||||||
1 Includes six gross (2.2 net) wells acquired in 2013 in connection with the EF Acquisition that were in progress when acquired.
Present Activities
As of December 31, 2014, we had 28 gross (14.3 net) wells in progress, all of which were located in the Eagle Ford in South Texas. As of February 20, 2015, 17 gross (8.6 net) of these wells had been successfully completed and were producing.
Delivery Commitments
We generally sell our oil, NGL and natural gas products using short-term floating price physical and spot market contracts. Although it is not our general practice, from time to time we enter into certain transactions in which we provide production commitments extending beyond one month. As of December 31, 2014, we did not have any material commitments to provide a fixed and determinable quantity of our products beyond the current month.
10
Productive Wells
The following table sets forth by region the productive wells in which we had a working interest as of December 31, 2014:
Primarily Oil | Primarily Natural Gas | Total | ||||||||||||||||
Region | Gross | Net | Gross | Net | Gross | Net | ||||||||||||
Texas | ||||||||||||||||||
South Texas 1 | 275 | 175.2 | — | — | 275 | 175.2 | ||||||||||||
East Texas | — | — | 356 | 254.9 | 356 | 254.9 | ||||||||||||
Mid-Continent | 5 | 3.1 | 99 | 42.6 | 104 | 45.7 | ||||||||||||
Other 2 | — | — | 3 | 3.0 | 3 | 3.0 | ||||||||||||
280 | 178.3 | 458 | 300.5 | 738 | 478.8 | |||||||||||||
_______________________
1 Includes wells in both the lower and upper Eagle Ford, or Marl, as well as the Pearsall Shale and Austin Chalk.
2 Consists of our three active Marcellus wells.
Of the total wells presented in the table above, we are the operator of 607 gross (246 oil and 361 gas) and 433.0 net (165.3 oil and 267.7 gas) wells. In addition to the above working interest wells, we own royalty interests in nine gross wells.
Acreage
The following table sets forth by region our developed and undeveloped acreage as of December 31, 2014 (in thousands):
Developed | Undeveloped | Total | ||||||||||||||||
Region | Gross | Net | Gross | Net | Gross | Net | ||||||||||||
Texas | ||||||||||||||||||
South Texas | 70.4 | 45.2 | 69.3 | 56.6 | 139.7 | 101.8 | ||||||||||||
East Texas | 45.3 | 32.0 | 2.1 | 0.6 | 47.4 | 32.6 | ||||||||||||
Mid-Continent | 16.5 | 8.0 | 5.0 | 1.8 | 21.5 | 9.8 | ||||||||||||
Other | 1.7 | 1.3 | 13.7 | 13.1 | 15.4 | 14.4 | ||||||||||||
133.9 | 86.5 | 90.1 | 72.1 | 224.0 | 158.6 | |||||||||||||
The primary terms of our leases generally range from three to five years and we do not have any concessions. As of December 31, 2014, our net undeveloped acreage is scheduled to expire as shown in the table below, unless the primary lease terms are, where appropriate, extended, HBP or otherwise changed:
2015 | 2016 | 2017 | Thereafter | ||||||||
Percent of gross undeveloped acreage | 20 | % | 44 | % | 24 | % | 12 | % | |||
Percent of net undeveloped acreage | 15 | % | 45 | % | 26 | % | 14 | % | |||
We do not believe that the scheduled expiration of our undeveloped acreage will substantially affect our ability or plans to conduct our exploration and development activities.
11
Part II
Item 7 | Management’s Discussion and Analysis of Financial Condition and Results of Operations |
The following discussion and analysis of our financial condition and results of operations should be read in conjunction with our Consolidated Financial Statements and Notes thereto included in Item 8, “Financial Statements and Supplementary Data.” All dollar amounts presented in the tables that follow are in thousands unless otherwise indicated. Certain year-over-year changes are presented as not meaningful, or “NM,” where disclosure of the actual value does not otherwise enhance the analysis. Also, due to the combination of different units of volumetric measure and the number of decimal places presented, certain results may not calculate explicitly from the values presented in the tables.
Overview and Executive Summary
We are an independent oil and gas company engaged in the exploration, development and production of oil, NGLs and natural gas in various onshore regions of the United States. Our current operations consist primarily of drilling unconventional horizontal development wells in the Eagle Ford Shale in South Texas. We also have operations in the Granite Wash in Oklahoma and the Haynesville Shale and Cotton Valley in East Texas. As of December 31, 2014, we had proved oil and gas reserves of approximately 115 MMBOE.
The following table sets forth certain summary operating and financial statistics for the periods presented:
Year Ended December 31, | |||||||||||
2014 | 2013 | 2012 | |||||||||
Total production (MBOE) | 7,934 | 6,824 | 6,513 | ||||||||
Average daily production (BOEPD) | 21,738 | 18,696 | 17,795 | ||||||||
Crude oil and NGL production (MBbl) | 5,754 | 4,417 | 3,136 | ||||||||
Crude oil and NGL production as a percent of total | 73 | % | 65 | % | 48 | % | |||||
Product revenues, as reported | $ | 512,882 | $ | 430,693 | $ | 310,484 | |||||
Product revenues, adjusted for derivatives | $ | 505,458 | $ | 429,651 | $ | 338,802 | |||||
Crude oil and NGL revenues as a percent of total, as reported | 89 | % | 88 | % | 84 | % | |||||
Realized prices: | |||||||||||
Crude oil ($/Bbl) | $ | 90.50 | $ | 101.13 | $ | 101.95 | |||||
NGL ($/Bbl) | $ | 31.14 | $ | 31.30 | $ | 35.13 | |||||
Natural gas ($/Mcf) | $ | 4.44 | $ | 3.64 | $ | 2.46 | |||||
Aggregate ($/BOE) | $ | 64.64 | $ | 63.11 | $ | 47.67 | |||||
Production and lifting costs ($/BOE): | |||||||||||
Lease operating | $ | 6.09 | $ | 5.20 | $ | 4.80 | |||||
Gathering, processing and transportation | $ | 2.31 | $ | 1.88 | $ | 2.18 | |||||
Production and ad valorem taxes ($/BOE) | $ | 3.53 | $ | 3.28 | $ | 1.63 | |||||
General and administrative ($/BOE) 1 | $ | 5.15 | $ | 6.46 | $ | 5.96 | |||||
Total operating costs ($/BOE) | $ | 17.08 | $ | 16.82 | $ | 14.57 | |||||
Depreciation, depletion and amortization ($/BOE) | $ | 37.85 | $ | 35.99 | $ | 31.68 | |||||
Cash provided by operating activities 2 | $ | 282,724 | $ | 261,512 | $ | 241,458 | |||||
Cash paid for capital expenditures, excluding 2013 EF Acquisition | $ | 774,139 | $ | 504,203 | $ | 370,907 | |||||
Cash and cash equivalents at end of period | $ | 6,252 | $ | 23,474 | $ | 17,650 | |||||
Debt outstanding, net of discount, at end of period | $ | 1,110,000 | $ | 1,281,000 | $ | 594,759 | |||||
Credit available under revolving credit facility at end of period 3 | $ | 413,196 | $ | 191,346 | $ | 297,922 | |||||
Proved reserves (MMBOE) | 115 | 136 | 113 | ||||||||
Net development wells drilled | 51.6 | 34.6 | 27.8 | ||||||||
Net exploratory wells drilled | — | — | 4.9 | ||||||||
1 Excludes equity-classified share-based compensation, which is a non-cash expense, of $0.46, $0.84 and $0.98 and liability-classified share-based compensation of $0.57, $0.60 and $0.11 for the years ended December 31, 2014, 2013 and 2012.
2 Includes the receipt of a federal income tax refund of approximately $32 million in the year ended December 31, 2012 attributable to 2010 and prior years.
3 As reduced by outstanding borrowings and letters of credit. Also, excludes an additional $50 million attributable to the excess of the borrowing base of $500 million over the current commitment of $450 million for 2014.
12
In 2014, our crude oil and NGL production increased to 73 percent compared to 65 percent of our total production in 2013. Consistent with our growth in liquids-focused production, our cash from operating activities, excluding working capital changes, increased approximately $41 million, or 17 percent, for 2014 compared to 2013, despite declining crude oil and NGL prices during the second half of 2014.
Our growth in crude oil and NGL production has been focused exclusively in the Eagle Ford in South Texas. Since our initial acquisition in this region in 2010 and through February 20, 2015, we have added a total of 280 gross wells, including 246 gross wells that are operated by us and 34 gross wells that are operated by our partners. We are currently operating a total of three drilling rigs, all in the Eagle Ford. Our capital program, which is substantially dedicated to this play, is being financed with a combination of cash from operating activities and borrowings under the Revolver.
To mitigate the volatile effect of commodity price fluctuations, we have a comprehensive hedging program in place. The Financial Condition discussion that follows and Note 5 to the Consolidated Financial Statements provide a detailed summary of our open commodity derivative positions as well as the historical results of our hedging program for the years ended December 31, 2014, 2013 and 2012.
Key Developments
The following general business developments and corporate actions in 2014 had or are expected to have a significant impact on our results of operations, financial position and cash flows: (i) significant decline in commodity prices and the addition of crude oil hedge contracts for calendar year 2015 and 2016, (ii) drilling results and future development plans in the Eagle Ford, (iii) an increase in our borrowing base under the Revolver, (iv) the acquisition of additional Eagle Ford acreage, (v) the sale of our Mississippi assets, South Texas oil gathering rights and South Texas natural gas gathering and gas lift assets, (vi) the resolution of arbitration related to the EF Acquisition and (vii) our recent preferred stock offering.
Significant Decline in Commodity Prices and Addition of Crude Oil Hedge Contracts for Calendar Years 2015 and 2016
In the second half of 2014, commodity prices, particularly crude oil, began to decline from recent high levels. The decline became precipitous late in the fourth quarter of 2014 and into the first quarter of 2015. As discussed below, the significant magnitude of this price decline has led to substantial changes in our operating and drilling programs.
In addition to adjusting our capital program as a result of the decline in commodity pricing, we were also able to enter into additional crude oil derivative contracts for calendar years 2015 and 2016 in order to hedge a portion of our crude oil production for those periods prior to the most significant price declines. Accordingly, in 2014, we provided additional hedge contracts for an average of 9,500 BOPD at a weighted-average price of $89.47 per Bbl for 2015 and 4,000 BOPD at a price of $88.12 per Bbl for 2016. The addition of these contracts has increased our total hedged crude oil production to 13,000 BOPD at a weighted-average price of $90.48 per Bbl for the first half of 2015 and 11,000 BOPD at a weighted-average price of $89.86 per Bbl for the second half of 2015. As a result of these activities, approximately 80 to 90 percent of our total estimated crude oil production for 2015 is subject to favorable hedges.
A prolonged period of depressed commodity prices could have a significant impact on the value and volumetric quantities of our proved reserve portfolio, assuming no other changes in our development plans. At year-end NYMEX calendar year forward contract strip prices, the present value (discounted at 10% per annum) of estimated future net revenues of our proved reserves would be approximately 63% smaller and total proved reserve equivalent volumes would be approximately 24% smaller compared to the results obtained using SEC-mandated 2014 beginning of teh month average prices held constant, as is required for the estimation of proved reserves and the calculation of the related standardized measure of discounted future net cash flows.
Drilling Results and Future Development Plans for the Eagle Ford
During 2014, we completed and turned in line 84 gross (51.6 net) operated wells in the Eagle Ford. Our Eagle Ford production was 17,459 net barrels of oil equivalent per day, or BOEPD, during the three months ended December 31, 2014 with oil comprising 12,676 BOPD, or 73 percent, and NGLs and natural gas comprising approximately 14 percent and 13 percent, respectively. In the month of December 2014, our average Eagle Ford production was 18,636 BOEPD, 71 percent of which was crude oil, 15 percent was NGLs and 14 percent was natural gas.
Beginning in March 2014, we have completed and turned in line 17 Upper Eagle Ford wells, including one well that had an operational issue. The average IP rate for the other 16 wells was1,217 BOEPD (61 percent crude oil) and the average 30-day rate for 14 of these 16 wells with sufficient production history was 1,009 BOEPD (61 percent crude oil). The early performance and lower initial rates of decline for the Upper Eagle Ford wells are an improvement over what we have experienced thus far in the Lower Eagle Ford. The internal EUR for these wells averaged approximately 717 MBOE, with a range of 388 to 1,231 MBOE. Due to these favorable results, we plan to devote approximately 42 percent of our 2015 capital expenditures to drilling additional Upper Eagle Ford wells.
Our total capital expenditures for 2015 are anticipated to be up to approximately $345 million, of which 90 percent has been allocated to drilling and completion activities. We intend to operate three to four drilling rigs in the Eagle Ford during
13
2015. We expect to drill and complete approximately 64 gross wells in the Eagle Ford in 2015 including 24 gross wells in the Upper Eagle Ford. We anticipate our 2015 drilling and completion costs to decrease from 2014 levels as a result of: (i) a decrease in the number of frac stages per well due to an increase in the distance between stages, (ii) a reduction in the amount of proppant per stage, (iii) renegotiated service sector costs and (iv) an ongoing improvement in operational execution of the drilling and completion program. In the event that commodity prices continue to decline, or if prices remain depressed for an extended period beyond 2015, we may be required to further reduce that magnitude of our drilling program.
Borrowing Base Increase
In October 2014, the borrowing base under the Revolver was increased to $500 million from $437.5 million in connection with our regular semi-annual redetermination. For more information about our Revolver, please read “Capital Resources—Revolver Borrowings.”
Acquisition of Additional Eagle Ford Acreage
In July 2014, we entered into a definitive agreement to acquire approximately 13,125 gross (11,660 net) acres in Lavaca County, Texas, the vast majority of which are in the “volatile oil window” of the Eagle Ford. The transaction closed in August 2014 for $45.6 million, of which $34.9 million was paid at closing and the balance of $10.6 million will be paid over the next three years as a drilling carry. We anticipate commencing drilling activities on this acreage in 2015. The transaction, combined with recent leasing, brings our total Eagle Ford acreage position to approximately 140,000 gross (101,800 net) acres. The acquired acreage, most of which we expect will be prospective in the Upper Eagle Ford, is adjacent to our Shiner area.
2014 Asset Dispositions
Sale of Mississippi Assets. In July 2014, we sold our Selma Chalk assets in Mississippi for proceeds of $67.9 million, net of transaction costs and customary closing adjustments. An impairment charge of $117.9 million was recognized in the three months ended June 30, 2014 to write down these assets to their estimated fair value.
Sale of Rights to Construct an Oil Gathering System in South Texas. In July 2014, we sold the rights to construct a crude oil gathering and intermediate transportation system in South Texas to Republic Midstream, LLC, or Republic, for proceeds of $147.1 million, net of transaction costs. Concurrent with the sale, we entered into agreements with Republic to provide us gathering and intermediate pipeline transportation services for a substantial portion of our South Texas crude oil and condensate production for a term of 25 years. We realized a gain of $147.1 million, of which $63.0 million was recognized upon the closing of the transaction and the remaining $84.1 million was deferred and will be recognized over a twenty-five year period after the system has been constructed and is operational, currently expected to be in the third quarter of 2015.
Sale of South Texas Natural Gas Gathering and Gas Lift Assets. In January 2014, we sold our natural gas gathering and gas lift assets in South Texas to American Midstream Partners, LP, or AMID, for proceeds of approximately $96 million, net of transaction costs. Concurrent with the sale, we entered into an agreement with AMID to provide us natural gas gathering, compression and gas lift services for a substantial portion of our current and future South Texas natural gas production. We realized a gain of $67.3 million, of which $56.7 million was recognized upon the closing of the transaction and the remaining $10.6 million was deferred and is being recognized over a twenty-five year period.
Settlement of Arbitration
Commencing December 2013, we were involved in arbitration with Magnum Hunter Resources Corporation, or MHR, the seller in the EF Acquisition. The arbitration related to disputes we had with MHR regarding contractual adjustments to the purchase price for the EF Acquisition and suspense funds that we believed MHR was obligated to transfer to us. In July 2014, we received the arbitrator’s determination, which required MHR to pay us a total of $35.1 million, including purchase price adjustments, revenue suspense funds due to partners and royalty owners and interest ($1.3 million) on the funds since the date of acquisition. Payment of the arbitration settlement was made by MHR in August 2014.
Preferred Stock Offering and Induced Conversion of Outstanding Preferred Stock
In June 2014, we completed a private offering of 3,250,000 depositary shares each representing 1/100th interest in a share of our 6% Series B Convertible Perpetual Preferred Stock, or the Series B Preferred Stock, for approximately $313 million of proceeds, net of underwriting fees and issuance costs. Concurrent with the Series B Preferred Stock offering and subsequently in July 2014, we paid a total of $4.3 million to induce the conversion of 3,527 shares, or 352,732 depositary shares, of our 6% Series A Convertible Perpetual Preferred Stock, or the Series A Preferred Stock. A total of 5.9 million shares of our common stock were issued in connection with the induced conversion of the Series A Preferred Stock.
14
Results of Operations
Production
The following tables set forth a summary of our total and daily production volumes by product and geographic region for the periods presented (certain results in the tables below may not calculate due to rounding):
Total Production | Average Daily Production | ||||||||||||||||||||||||||||
Crude oil | Year Ended December 31, | 2014 vs. | 2013 vs. | Year Ended December 31, | 2014 vs. | 2013 vs. | |||||||||||||||||||||||
2014 | 2013 | 2012 | 2013 | 2012 | 2014 | 2013 | 2012 | 2013 | 2012 | ||||||||||||||||||||
(MBbl) | (Bbl per day) | ||||||||||||||||||||||||||||
Texas | |||||||||||||||||||||||||||||
South Texas | 4,459 | 3,199 | 1,960 | 1,259 | 1,240 | 12,216 | 8,766 | 5,354 | 3,451 | 3,412 | |||||||||||||||||||
East Texas | 54 | 63 | 71 | (10 | ) | (8 | ) | 148 | 174 | 194 | (26 | ) | (20 | ) | |||||||||||||||
Mid-Continent | 126 | 160 | 206 | (35 | ) | (46 | ) | 345 | 440 | 563 | (94 | ) | (124 | ) | |||||||||||||||
Other | 5 | 12 | 15 | (7 | ) | (3 | ) | 14 | 33 | 41 | (19 | ) | (8 | ) | |||||||||||||||
4,644 | 3,435 | 2,252 | 1,209 | 1,183 | 12,723 | 9,412 | 6,153 | 3,311 | 3,259 | ||||||||||||||||||||
% Change | 35 | % | 53 | % | |||||||||||||||||||||||||
NGLs | Year Ended December 31, | 2014 vs. | 2013 vs. | Year Ended December 31, | 2014 vs. | 2013 vs. | |||||||||||||||||||||||
2014 | 2013 | 2012 | 2013 | 2012 | 2014 | 2013 | 2012 | 2013 | 2012 | ||||||||||||||||||||
(MBbl) | (Bbl per day) | ||||||||||||||||||||||||||||
Texas | |||||||||||||||||||||||||||||
South Texas | 775 | 485 | 205 | 289 | 280 | 2,122 | 1,330 | 561 | 793 | 769 | |||||||||||||||||||
East Texas | 122 | 191 | 281 | (68 | ) | (90 | ) | 335 | 523 | 767 | (187 | ) | (244 | ) | |||||||||||||||
Mid-Continent | 213 | 306 | 397 | (94 | ) | (91 | ) | 582 | 840 | 1,085 | (257 | ) | (246 | ) | |||||||||||||||
Other | — | — | 1 | — | (1 | ) | — | — | 2 | — | (2 | ) | |||||||||||||||||
1,110 | 982 | 884 | 127 | 98 | 3,040 | 2,692 | 2,415 | 348 | 277 | ||||||||||||||||||||
% Change | 13 | % | 11 | % | |||||||||||||||||||||||||
Natural gas | Year Ended December 31, | 2014 vs. | 2013 vs. | Year Ended December 31, | 2014 vs. | 2013 vs. | |||||||||||||||||||||||
2014 | 2013 | 2012 | 2013 | 2012 | 2014 | 2013 | 2012 | 2013 | 2012 | ||||||||||||||||||||
(MMcf) | (MMcf per day) | ||||||||||||||||||||||||||||
Texas | |||||||||||||||||||||||||||||
South Texas | 4,081 | 2,436 | 1,015 | 1,644 | 1,422 | 11 | 7 | 3 | 5 | 4 | |||||||||||||||||||
East Texas | 4,004 | 4,593 | 5,909 | (588 | ) | (1,316 | ) | 11 | 13 | 16 | (2 | ) | (4 | ) | |||||||||||||||
Mid-Continent | 2,413 | 2,823 | 3,646 | (410 | ) | (823 | ) | 7 | 8 | 10 | (1 | ) | (2 | ) | |||||||||||||||
Other | 2,586 | 4,583 | 9,692 | (1,996 | ) | (5,109 | ) | 7 | 13 | 26 | (5 | ) | (14 | ) | |||||||||||||||
13,085 | 14,435 | 20,261 | (1,350 | ) | (5,826 | ) | 36 | 40 | 55 | (4 | ) | (16 | ) | ||||||||||||||||
% Change | (9 | )% | (29 | )% | |||||||||||||||||||||||||
Combined total | Year Ended December 31, | 2014 vs. | 2013 vs. | Year Ended December 31, | 2014 vs. | 2013 vs. | |||||||||||||||||||||||
2014 | 2013 | 2012 | 2013 | 2012 | 2014 | 2013 | 2012 | 2013 | 2012 | ||||||||||||||||||||
(MBOE) | (BOE per day) | ||||||||||||||||||||||||||||
Texas | |||||||||||||||||||||||||||||
South Texas | 5,913 | 4,091 | 2,334 | 1,823 | 1,757 | 16,201 | 11,208 | 6,378 | 4,994 | 4,830 | |||||||||||||||||||
East Texas | 844 | 1,020 | 1,337 | (176 | ) | (317 | ) | 2,311 | 2,794 | 3,653 | (482 | ) | (859 | ) | |||||||||||||||
Mid-Continent | 741 | 937 | 1,211 | (197 | ) | (273 | ) | 2,029 | 2,568 | 3,308 | (539 | ) | (740 | ) | |||||||||||||||
Other 1 | 437 | 776 | 1,631 | (339 | ) | (855 | ) | 1,196 | 2,126 | 4,457 | (929 | ) | (2,332 | ) | |||||||||||||||
7,934 | 6,824 | 6,513 | 1,111 | 311 | 21,738 | 18,696 | 17,795 | 3,043 | 900 | ||||||||||||||||||||
% Change | 16 | % | 5 | % | |||||||||||||||||||||||||
1 Comprised of: (i) our three active Marcellus Shale wells in Pennsylvania, (ii) for periods through July 2014, our divested Selma Chalk assets in Mississippi, and (iii) for periods through July 2012, our divested Appalachian natural gas properties in West Virginia, Kentucky and Virginia.
2014 vs. 2013. Total production increased during the year ended December 31, 2014 compared to 2013 due primarily to production from the continued expansion of our Eagle Ford development program in South Texas. The increase was partially offset by natural production declines in our East Texas, Mid-Continent and Mississippi regions, as well as the effect of the sale of our Mississippi properties in July 2014. Approximately 73 percent of total production during 2014 was attributable to oil and NGLs, which represents an increase of approximately 30 percent over 2013. During 2014, our Eagle Ford production represented approximately 74 percent of our total production compared to approximately 60 percent from this play during 2013.
15
2013 vs. 2012. Total production increased during 2013 compared to 2012 due primarily to the EF Acquisition and the continued expansion of our development program in the Eagle Ford. The increase was partially offset by the effect of production declines in our East Texas and Mid-Continent regions and the sale of our Appalachian properties in July 2012. Approximately 65% of total production during 2013 was attributable to oil and NGLs, which represents an increase of approximately 41% over 2012. During 2013, our Eagle Ford production represented approximately 60 percent of our total production compared to approximately 36 percent during 2012.
Product Revenues and Prices
The following tables set forth a summary of our revenues and prices per unit of volume by product and geographic region for the periods presented:
Crude oil | Year Ended December 31, | 2014 vs. | 2013 vs. | Year Ended December 31, | 2014 vs. | 2013 vs. | |||||||||||||||||||||||||||||||||
2014 | 2013 | 2012 | 2013 | 2012 | 2014 | 2013 | 2012 | 2013 | 2012 | ||||||||||||||||||||||||||||||
($ per Bbl) | |||||||||||||||||||||||||||||||||||||||
Texas | |||||||||||||||||||||||||||||||||||||||
South Texas | $ | 403,879 | $ | 324,899 | $ | 202,479 | $ | 78,980 | $ | 122,420 | $ | 90.58 | $ | 101.55 | $ | 103.33 | $ | (10.96 | ) | $ | (1.78 | ) | |||||||||||||||||
East Texas | 4,852 | 6,325 | 6,862 | (1,473 | ) | (537 | ) | 90.08 | 99.69 | 96.55 | (9.61 | ) | 3.14 | ||||||||||||||||||||||||||
Mid-Continent | 11,027 | 14,920 | 18,667 | (3,893 | ) | (3,747 | ) | 87.59 | 93.01 | 90.55 | (5.42 | ) | 2.46 | ||||||||||||||||||||||||||
Other | 528 | 1,263 | 1,564 | (735 | ) | (301 | ) | 96.02 | 104.75 | 103.81 | (8.73 | ) | 0.94 | ||||||||||||||||||||||||||
$ | 420,286 | $ | 347,407 | $ | 229,572 | $ | 72,879 | $ | 117,835 | $ | 90.50 | $ | 101.13 | $ | 101.95 | $ | (10.62 | ) | $ | (0.83 | ) | ||||||||||||||||||
% Change | (11 | )% | (1 | )% | |||||||||||||||||||||||||||||||||||
NGLs | Year Ended December 31, | 2014 vs. | 2013 vs. | Year Ended December 31, | 2014 vs. | 2013 vs. | |||||||||||||||||||||||||||||||||
2014 | 2013 | 2012 | 2013 | 2012 | 2014 | 2013 | 2012 | 2013 | 2012 | ||||||||||||||||||||||||||||||
($ per Bbl) | |||||||||||||||||||||||||||||||||||||||
Texas | |||||||||||||||||||||||||||||||||||||||
South Texas | $ | 19,555 | $ | 12,969 | $ | 6,451 | $ | 6,586 | $ | 6,518 | $ | 25.24 | $ | 26.72 | $ | 31.43 | $ | (1.48 | ) | $ | (4.71 | ) | |||||||||||||||||
East Texas | 5,440 | 6,743 | 10,195 | (1,303 | ) | (3,452 | ) | 44.44 | 35.35 | 36.32 | 9.09 | (0.97 | ) | ||||||||||||||||||||||||||
Mid-Continent | 9,557 | 11,036 | 14,365 | (1,479 | ) | (3,329 | ) | 44.95 | 36.01 | 36.16 | 8.94 | (0.15 | ) | ||||||||||||||||||||||||||
Other | — | — | 40 | — | (40 | ) | — | — | 51.61 | — | (51.61 | ) | |||||||||||||||||||||||||||
$ | 34,552 | $ | 30,748 | $ | 31,051 | $ | 3,804 | $ | (303 | ) | $ | 31.14 | $ | 31.30 | $ | 35.13 | $ | (0.17 | ) | $ | (3.82 | ) | |||||||||||||||||
% Change | (1 | )% | (11 | )% | |||||||||||||||||||||||||||||||||||
Natural gas | Year Ended December 31, | 2014 vs. | 2013 vs. | Year Ended December 31, | 2014 vs. | 2013 vs. | |||||||||||||||||||||||||||||||||
2014 | 2013 | 2012 | 2013 | 2012 | 2014 | 2013 | 2012 | 2013 | 2012 | ||||||||||||||||||||||||||||||
($ per Mcf) | |||||||||||||||||||||||||||||||||||||||
Texas | |||||||||||||||||||||||||||||||||||||||
South Texas | $ | 17,132 | $ | 8,586 | $ | 2,593 | $ | 8,546 | $ | 5,993 | $ | 4.20 | $ | 3.52 | $ | 2.56 | $ | 0.67 | $ | 0.97 | |||||||||||||||||||
East Texas | 17,875 | 15,571 | 13,607 | 2,304 | 1,964 | 4.46 | 3.39 | 2.30 | 1.07 | 1.09 | |||||||||||||||||||||||||||||
Mid-Continent | 11,060 | 10,655 | 7,920 | 405 | 2,735 | 4.58 | 3.77 | 2.17 | 0.81 | 1.60 | |||||||||||||||||||||||||||||
Other | 11,977 | 17,726 | 25,741 | (5,749 | ) | (8,015 | ) | 4.63 | 3.87 | 2.66 | 0.76 | 1.21 | |||||||||||||||||||||||||||
$ | 58,044 | $ | 52,538 | $ | 49,861 | $ | 5,506 | $ | 2,677 | $ | 4.44 | $ | 3.64 | $ | 2.46 | $ | 0.80 | $ | 1.18 | ||||||||||||||||||||
% Change | 22 | % | 48 | % | |||||||||||||||||||||||||||||||||||
Combined total | Year Ended December 31, | 2014 vs. | 2013 vs. | Year Ended December 31, | 2014 vs. | 2013 vs. | |||||||||||||||||||||||||||||||||
2014 | 2013 | 2012 | 2013 | 2012 | 2014 | 2013 | 2012 | 2013 | 2012 | ||||||||||||||||||||||||||||||
($ per BOE) | |||||||||||||||||||||||||||||||||||||||
Texas | |||||||||||||||||||||||||||||||||||||||
South Texas | $ | 440,566 | 346,454 | 211,523 | $ | 94,112 | $ | 134,931 | $ | 74.50 | $ | 84.69 | $ | 90.62 | $ | (10.19 | ) | $ | (5.93 | ) | |||||||||||||||||||
East Texas | 28,167 | 28,639 | 30,664 | (472 | ) | (2,025 | ) | 33.39 | 28.09 | 22.94 | 5.29 | 5.15 | |||||||||||||||||||||||||||
Mid-Continent | 31,644 | 36,611 | 40,952 | (4,967 | ) | (4,341 | ) | 42.72 | 39.09 | 33.83 | 3.63 | 5.27 | |||||||||||||||||||||||||||
Other | 12,505 | 18,989 | 27,345 | (6,484 | ) | (8,356 | ) | 28.64 | 24.48 | 16.76 | 4.17 | 7.71 | |||||||||||||||||||||||||||
$ | 512,882 | $ | 430,693 | $ | 310,484 | $ | 82,189 | $ | 120,209 | $ | 64.64 | $ | 63.11 | $ | 47.67 | $ | 1.53 | $ | 15.44 | ||||||||||||||||||||
% Change | 2 | % | 32 | % | |||||||||||||||||||||||||||||||||||
16
The following table provides an analysis of the changes in our revenues for the periods presented:
2014 vs. 2013 Revenue Variance Due to | 2013 vs. 2012 Revenue Variance Due to | ||||||||||||||||||||||
Volume | Price | Total | Volume | Price | Total | ||||||||||||||||||
Crude oil | $ | 122,219 | $ | (49,340 | ) | $ | 72,879 | $ | 120,652 | $ | (2,817 | ) | $ | 117,835 | |||||||||
NGLs | 3,987 | (183 | ) | 3,804 | 3,460 | (3,763 | ) | (303 | ) | ||||||||||||||
Natural gas | (4,962 | ) | 10,468 | 5,506 | (14,356 | ) | 17,033 | 2,677 | |||||||||||||||
$ | 121,244 | $ | (39,055 | ) | $ | 82,189 | $ | 109,756 | $ | 10,453 | $ | 120,209 | |||||||||||
Effects of Derivatives
In 2014 and 2013, respectively, we paid $7.4 million and $1.0 million, and in 2012, we received $28.3 million from cash settlements of oil and gas derivatives. The following table reconciles crude oil and natural gas revenues to realized prices, as adjusted for derivative activities, for the periods presented:
Year Ended December 31, | Increase | Year Ended December 31, | Favorable | ||||||||||||||||||||
2014 | 2013 | (Unfavorable) | 2013 | 2012 | (Unfavorable) | ||||||||||||||||||
Crude oil revenues as reported | $ | 420,286 | $ | 347,407 | $ | 72,879 | $ | 347,407 | $ | 229,572 | $ | 576,979 | |||||||||||
Derivative settlements, net | (6,170 | ) | (2,624 | ) | (3,546 | ) | (2,624 | ) | 8,428 | 5,804 | |||||||||||||
$ | 414,116 | $ | 344,783 | $ | 69,333 | $ | 344,783 | $ | 238,000 | $ | 582,783 | ||||||||||||
Crude oil prices per Bbl, as reported | $ | 90.50 | $ | 101.13 | $ | (10.63 | ) | $ | 101.13 | $ | 101.94 | $ | (0.81 | ) | |||||||||
Derivative settlements per Bbl | (1.33 | ) | (0.76 | ) | (0.57 | ) | (0.76 | ) | 3.74 | (4.50 | ) | ||||||||||||
$ | 89.17 | $ | 100.37 | $ | (11.20 | ) | $ | 100.37 | $ | 105.68 | $ | (5.31 | ) | ||||||||||
Natural gas revenues as reported | $ | 58,044 | $ | 52,538 | $ | 5,506 | $ | 52,538 | $ | 49,861 | $ | 2,677 | |||||||||||
Derivative settlements, net | (1,254 | ) | 1,582 | (2,836 | ) | 1,582 | 19,890 | (18,308 | ) | ||||||||||||||
$ | 56,790 | $ | 54,120 | $ | 2,670 | $ | 54,120 | $ | 69,751 | $ | (15,631 | ) | |||||||||||
Natural gas prices per Mcf, as reported | $ | 4.44 | $ | 3.64 | $ | 0.80 | $ | 3.64 | $ | 2.46 | $ | 1.18 | |||||||||||
Derivative settlements per Mcf | (0.10 | ) | 0.11 | (0.21 | ) | 0.11 | 0.98 | (0.87 | ) | ||||||||||||||
$ | 4.34 | $ | 3.75 | $ | 0.59 | $ | 3.75 | $ | 3.44 | $ | 0.31 | ||||||||||||
Gain (Loss) on Sales of Property and Equipment
In 2014, we recognized a gain of $63.0 million in connection with the sale of rights to construct a crude oil gathering and intermediate transportation system and a gain of $57.1 million on the sale of our natural gas gathering and gas lift assets in South Texas, including $56.7 million recognized upon the closing of the sale and $0.4 million attributable to the deferred portion of the gain. In 2013, we recognized losses of $0.3 million related primarily to certain post-closing adjustments for asset sales that occurred in prior years. In 2012, we recognized gains of $3.9 million attributable to the sale of substantially all of our Appalachian natural gas assets as well as certain undeveloped Marcellus Shale acreage in Pennsylvania. In addition, we recognized several individually insignificant gains and losses on the sale of property, equipment, tubular inventory and well material during all periods presented.
Other Revenues
2014 vs. 2013. Other revenues, which includes gathering, transportation, compression, water supply and disposal fees that we charge to other parties, net of marketing and related expenses and accretion of our unused firm transportation obligation, increased during 2014 from 2013 due primarily to income related to water supply and disposal which began in April 2014. The increase was partially offset by the effect of a $1.6 million gain in 2013 attributable to the sale of certain proprietary seismic data.
2013 vs. 2012. Net revenues from gathering, transportation and compression decreased during 2013 from 2012 due to lower production by other parties in our East Texas AMI. In addition, we recognized a full year of accretion expense, or $1.7 million, in 2013 on our unused firm transportation obligation as compared to one quarter in 2012. These decreases were partially offset by a $1.6 million gain on the sale of certain proprietary seismic data in 2013.
17
Production and Lifting Costs
Year Ended December 31, | 2014 vs. | 2013 vs. | |||||||||||||||||
2014 | 2013 | 2012 | 2013 | 2012 | |||||||||||||||
Favorable (unfavorable) | |||||||||||||||||||
Lease operating | $ | 48,298 | $ | 35,461 | $ | 31,266 | $ | (12,837 | ) | $ | (4,195 | ) | |||||||
Per unit of production ($/BOE) | $ | 6.09 | $ | 5.20 | $ | 4.80 | $ | (0.89 | ) | $ | (0.40 | ) | |||||||
% Change per unit of production | (17 | )% | (8 | )% | |||||||||||||||
2014 vs. 2013. Lease operating expense increased on an absolute and per-unit basis during 2014 compared to 2013 due primarily to higher production volume during 2014. Most volume-based costs, including chemical, water disposal and labor costs increased on an absolute basis, but decreased on a per-unit basis. As discussed in Key Developments, we sold our natural gas gathering and gas lift assets in the South Texas region and entered into an agreement with the buyer to provide us natural gas gathering, compression and gas lift services. We began incurring costs for these services in February 2014. Finally, we also experienced higher workover and subsurface maintenance costs in both South and East Texas in 2014 compared to 2013.
2013 vs. 2012. Lease operating expense increased during 2013 compared to 2012 due primarily to higher subsurface maintenance costs for wells located in East Texas. In addition, we incurred subsurface maintenance costs for certain wells in the EF Acquisition in which we had to remove submersible pumps and replace them with rod pumps. We also incurred higher water disposal and chemical costs associated with our increased oil production. These increases were partially offset by the effect of the sale of our higher-cost Appalachian gas properties in July 2012.
Year Ended December 31, | 2014 vs. | 2013 vs. | |||||||||||||||||
2014 | 2013 | 2012 | 2013 | 2012 | |||||||||||||||
Favorable (unfavorable) | |||||||||||||||||||
Gathering, processing and transportation | $ | 18,294 | $ | 12,839 | $ | 14,196 | $ | (5,455 | ) | $ | 1,357 | ||||||||
Per unit production ($/BOE) | $ | 2.31 | $ | 1.88 | $ | 2.18 | $ | (0.42 | ) | $ | 0.30 | ||||||||
% Change per unit of production | (23 | )% | 14 | % | |||||||||||||||
2014 vs. 2013. Gathering, processing and transportation charges increased during 2014 compared to 2013 due primarily to additional gathering and compression charges for natural gas and NGL production in the South Texas region attributable to the new gathering, compression and gas lift services agreement discussed above, partially offset by the effect of lower natural gas and NGL production volume in our East Texas and Mid-Continent regions as well as the effect of lower natural gas production following the sale of our Mississippi assets in July 2014.
2013 vs. 2012. Gathering, processing and transportation charges decreased during 2013 compared to 2012 due primarily to the effect of the sale of our higher-cost Appalachian properties in July 2012, partially offset by an increase in processing costs related to expanded natural gas production in the Eagle Ford.
Production and Ad Valorem Taxes
Year Ended December 31, | 2014 vs. | 2013 vs. | |||||||||||||||||
2014 | 2013 | 2012 | 2013 | 2012 | |||||||||||||||
Favorable (unfavorable) | |||||||||||||||||||
Production/severance taxes | $ | 22,567 | $ | 17,355 | $ | 7,534 | $ | (5,212 | ) | $ | (9,821 | ) | |||||||
Ad valorem taxes | 5,423 | 5,049 | 3,100 | (374 | ) | (1,949 | ) | ||||||||||||
$ | 27,990 | $ | 22,404 | $ | 10,634 | $ | (5,586 | ) | $ | (11,770 | ) | ||||||||
Per unit production ($/BOE) | $ | 3.53 | $ | 3.28 | $ | 1.63 | $ | (0.24 | ) | $ | (1.65 | ) | |||||||
Production/severance tax rate | 4.4 | % | 4.0 | % | 2.4 | % | |||||||||||||
% Change per unit of production | (7 | )% | NM | ||||||||||||||||
2014 vs. 2013. Production taxes increased during 2014 compared to 2013 due primarily to increased crude oil production in the South Texas region, which carries a higher severance tax rate than our other operating areas, partially offset by severance tax audit refunds for natural gas production in Mississippi attributable to periods prior to the sale of those properties.
2013 vs. 2012. Production and ad valorem taxes increased during 2013 compared to 2012 due primarily to our increased activities in the Eagle Ford. In addition, we recognized approximately $4 million of non-recurring credits in 2012 for severance tax rebates on certain horizontal and ultra-deep natural gas wells in Oklahoma and Texas.
18
General and Administrative
Year Ended December 31, | 2014 vs. | 2013 vs. | |||||||||||||||||
2014 | 2013 | 2012 | 2013 | 2012 | |||||||||||||||
Favorable (unfavorable) | |||||||||||||||||||
General and administrative expenses | $ | 39,106 | $ | 40,410 | $ | 37,555 | $ | 1,304 | $ | (2,855 | ) | ||||||||
Share-based compensation (liability-classified) | 4,519 | 4,116 | 714 | (403 | ) | (3,402 | ) | ||||||||||||
Share-based compensation (equity-classified) | 3,627 | 5,781 | 6,347 | 2,154 | 566 | ||||||||||||||
Significant non-recurring expenses: | |||||||||||||||||||
ERP system development costs | 1,154 | 655 | — | (499 | ) | (655 | ) | ||||||||||||
EF Acquisition-related transaction costs | — | 2,587 | — | 2,587 | (2,587 | ) | |||||||||||||
EF Acquisition-related arbitration and other costs | 589 | 442 | — | (147 | ) | (442 | ) | ||||||||||||
Restructuring expenses | 10 | 7 | 1,284 | (3 | ) | 1,277 | |||||||||||||
$ | 49,005 | $ | 53,998 | $ | 45,900 | $ | 4,993 | $ | (8,098 | ) | |||||||||
Per unit of production ($/BOE) | $ | 6.18 | $ | 7.91 | $ | 7.05 | $ | 1.74 | $ | (0.87 | ) | ||||||||
Per unit of production excluding liability and equity-classified share-based compensation ($/BOE) | $ | 5.15 | $ | 6.46 | $ | 5.96 | $ | 1.31 | $ | (0.50 | ) | ||||||||
Per unit of production excluding share-based compensation and other non-recurring expenses identified above ($/BOE) | $ | 4.93 | $ | 5.92 | $ | 5.77 | $ | 0.99 | $ | (0.15 | ) | ||||||||
2014 vs. 2013. Our total general and administrative expenses decreased on both an absolute and per unit basis during 2014 compared to 2013, reflecting lower incentive compensation costs partially offset by higher employee benefits and occupancy costs. Liability-classified share-based compensation is attributable to our performance-based restricted stock units, or PBRSUs, and represents mark-to-market charges associated with the increase in fair value of the 2012 through 2014 PBRSU grants. The increase in the fair value of the PBRSUs is attributable to our common stock performance relative to a defined peer group. Equity-classified share-based compensation charges attributable to stock options and restricted stock units, which represent non-cash expenses, decreased during 2014 compared to 2013 due primarily to fewer employees receiving grants and the elimination of retirement age-eligible, or grant-date vesting provisions. In 2014, we incurred certain costs not eligible for capitalization, including post-implementation support and training with respect to our recently completed ERP system replacement. Similar charges incurred during 2013 include preliminary project analysis and other non-capitalizable costs. In 2013, we incurred transaction costs associated with the EF Acquisition, including advisory, legal, due diligence and other professional fees. In 2014, we incurred costs including legal and litigation support fees attributable to our arbitration with MHR.
2013 vs. 2012. General and administrative expenses increased in 2013 compared to 2012 due primarily to higher compensation, benefits and cash-based incentive charges resulting from higher employee headcount as our operations and support organization expanded commensurate with our focus in the Eagle Ford. The mark-to-market charges attributable to our PBRSUs were higher in 2013 compared to 2012 due to a combination of our common stock performance as well as the fact that 2013 included grants for two years while 2012 included only one. Equity-classified share-based compensation was lower during 2013 compared to 2012 due to a narrowing of the employee distribution base for such awards. As referenced above, we incurred certain costs in 2013 attributable to the EF Acquisition as well as those related to the implementation of a new ERP system. In 2012 we incurred restructuring charges including employee termination benefits and a provision for lease costs attributable to exit activities in connection with the sale of our Appalachian assets.
Exploration
The following table sets forth the components of exploration expenses for the periods presented:
Year Ended December 31, | 2014 vs. | 2013 vs. | |||||||||||||||||
2014 | 2013 | 2012 | 2013 | 2012 | |||||||||||||||
Favorable (unfavorable) | |||||||||||||||||||
Unproved leasehold amortization | $ | 10,346 | $ | 17,451 | $ | 32,634 | $ | 7,105 | $ | 15,183 | |||||||||
Geological and geophysical costs | 5,106 | 2,882 | 816 | (2,224 | ) | (2,066 | ) | ||||||||||||
Drilling rig termination charges | 751 | — | — | (751 | ) | — | |||||||||||||
Other, primarily delay rentals | 860 | 661 | 642 | (199 | ) | (19 | ) | ||||||||||||
$ | 17,063 | $ | 20,994 | $ | 34,092 | $ | 3,931 | $ | 13,098 | ||||||||||
2014 vs. 2013. Unproved leasehold amortization decreased during 2014 compared to 2013 due primarily to the classification of our unproved property in the Eagle Ford as a “significant leasehold” effective July 1, 2013. Accordingly, our
19
unproved acreage in this region is no longer subject to systematic amortization. Geological and geophysical costs increased due to higher seismic data acquisition costs attributable primarily to our development program in the South Texas region. We incurred a charge during the fourth quarter of 2014 in connection with the early termination of a drilling rig contract that was to expire later in 2015 under the terms of the original agreement. Delay rentals increased due primarily to a larger inventory of undeveloped acreage in the South Texas region.
2013 vs. 2012. Unproved leasehold amortization declined during 2013 compared to 2012 as costs related to successful Eagle Ford wells were transferred to proved properties as well as aforementioned classification of our unproved Eagle Ford property as a “significant leasehold” in 2013. Geological and geophysical costs increased during 2013 due primarily to the purchase of seismic data for the South Texas region.
Depreciation, Depletion and Amortization (DD&A)
The following table sets forth the nature of the DD&A variances for the periods presented:
Year Ended December 31, | 2014 vs. | 2013 vs. | |||||||||||||||||
2014 | 2013 | 2012 | 2013 | 2012 | |||||||||||||||
Favorable (unfavorable) | |||||||||||||||||||
DD&A expense | $ | 300,299 | $ | 245,594 | $ | 206,336 | $ | (54,705 | ) | $ | (39,258 | ) | |||||||
DD&A rate ($/BOE) | $ | 37.85 | $ | 35.99 | $ | 31.68 | $ | (1.86 | ) | $ | (4.31 | ) | |||||||
DD&A Variance due to: | |||||||||||||||||||
Production | Rates | Total | |||||||||||||||||
2014 to 2013 DD&A variance due to: | $ | (39,955 | ) | $ | (14,750 | ) | $ | (54,705 | ) | ||||||||||
2013 to 2012 DD&A variance due to: | $ | (9,789 | ) | $ | (29,469 | ) | $ | (39,258 | ) | ||||||||||
2014 vs. 2013. Higher overall production volumes as well as higher depletion rates associated with oil and NGL production in 2014 compared to 2013 were the primary factors affecting the increase in DD&A expense. Our average DD&A rate increased due to the higher-cost oil drilling program in the Eagle Ford coupled with downward revisions of proved undeveloped reserves in East Texas.
2013 vs. 2012. Higher production volume and depletion rates attributable to the focus on oil and NGL production in the Eagle Ford resulted in higher DD&A expense in 2013 compared to 2012. In addition, the DD&A rate was impacted by lower proved undeveloped reserves due to revisions, primarily in East Texas and the Mid-Continent regions.
Impairments
In 2014, we recognized oil and gas asset impairments of: (i) $667.8 million in the East Texas, Granite Wash and Marcellus regions due to the substantial decline in current and expected future commodity prices in the fourth quarter of 2014, (ii) $6.1 million in connection with an uneconomic field drilled in the Mid-Continent region and (iii) $117.9 million with respect to our Selma Chalk assets in Mississippi triggered by the disposition of those properties. In 2013, we recognized oil and gas asset impairments of: (i) $121.8 million in the Granite Wash, (ii) $9.5 million in the Marcellus Shale and (iii) $0.9 million in the Selma Chalk, in each case due primarily to market declines in current and expected future natural gas prices. In June 2012, we recognized a $28.4 million impairment of our Appalachian assets triggered by the disposition of those properties and a $75.0 million impairment of our Marcellus Shale assets due primarily to market declines in natural gas prices and the resultant reduction in proved natural gas reserves. We also recognized impairments of $1.1 million attributable to tubular inventory and well materials in 2012.
Loss on Firm Transportation Commitment
We have a contractual commitment for certain firm transportation capacity in the Appalachian region that expires in 2022. As a result of the sale of our natural gas assets in that region in 2012, we no longer have production to satisfy this commitment. Accordingly, we recorded a charge of $17.3 million in 2012 representing the liability for estimated discounted future net cash outflows over the remaining term of the contract.
20
Interest Expense
The following table summarizes the components of our interest expense for the periods presented:
Year Ended December 31, | 2014 vs. | 2013 vs. | |||||||||||||||||
2014 | 2013 | 2012 | 2013 | 2012 | |||||||||||||||
Favorable (unfavorable) | |||||||||||||||||||
Interest on borrowings and related fees | $ | 91,866 | $ | 80,263 | $ | 56,080 | $ | (11,603 | ) | $ | (24,183 | ) | |||||||
Amortization of debt issuance costs | 4,197 | 3,413 | 2,695 | (784 | ) | (718 | ) | ||||||||||||
Accretion of original issue discount | — | 431 | 1,367 | 431 | 936 | ||||||||||||||
Capitalized interest | (7,232 | ) | (5,266 | ) | (803 | ) | 1,966 | 4,463 | |||||||||||
$ | 88,831 | $ | 78,841 | $ | 59,339 | $ | (9,990 | ) | $ | (19,502 | ) | ||||||||
Weighted-average debt outstanding | $ | 1,205,077 | $ | 1,022,337 | $ | 697,786 | $ | (182,740 | ) | $ | (324,551 | ) | |||||||
Weighted average interest rate | 7.97 | % | 8.23 | % | 8.62 | % | |||||||||||||
2014 vs. 2013. Interest expense increased during 2014 compared to 2013 due primarily to higher weighted-average debt outstanding following the issuance of the 8.5% Senior Notes due 2020, or the 2020 Senior Notes, in April 2013 and higher average outstanding borrowings under the Revolver. The increase in interest expense was partially offset by higher capitalized interest resulting from the significant increase in the value of our proved undeveloped and unproved properties following the EF Acquisition and the absence of accretion of original issue discount attributable to the 10.375% Senior Notes due 2016, or the 2016 Senior Notes, which were redeemed in May 2013. The weighted-average interest rate declined during 2014 as compared to 2013 due primarily to the replacement of the 2016 Senior Notes with the 2020 Senior Notes as well as lower interest rates on borrowings under the Revolver.
2013 vs. 2012. Interest expense increased during 2013 compared to 2012 due primarily to higher overall weighted-average debt outstanding and a larger proportion of fixed-rate debt with higher interest rates in the 2013 period, compared to a larger proportion of Revolver borrowings at lower variable interest rates in 2012. The increase was partially offset by higher capitalized interest resulting from the significant increase in the value of our proved undeveloped and unproved properties following the EF Acquisition.
Loss on Extinguishment of Debt
In 2013, we redeemed all of the 2016 Senior Notes. We paid a total of $330.9 million, including consent payments and accrued interest, and recognized a loss on the extinguishment of debt of $29.2 million. The loss on extinguishment of debt included non-cash charges of $10.0 million attributable to the write-off of unamortized debt issuance costs and the remaining debt discount associated with the 2016 Senior Notes. In 2012 in connection with our entry into the Revolver, we expensed issuance costs of $3.2 million attributable to our previous credit facility.
Derivatives
The following table summarizes the components of our derivatives income (loss) for the periods presented:
Year Ended December 31, | 2014 vs. | 2013 vs. | |||||||||||||||||
2014 | 2013 | 2012 | 2013 | 2012 | |||||||||||||||
Favorable (unfavorable) | |||||||||||||||||||
Oil and gas derivatives settled | $ | (7,424 | ) | $ | (1,042 | ) | $ | 28,317 | $ | 29,359 | |||||||||
Oil and gas derivative gain (loss) | 169,636 | (19,810 | ) | 6,464 | (189,446 | ) | 26,274 | ||||||||||||
Interest rate swap gain | — | — | 1,406 | — | 1,406 | ||||||||||||||
$ | 162,212 | $ | (20,852 | ) | $ | 36,187 | $ | (189,446 | ) | $ | 57,039 | ||||||||
We paid settlements of $6.2 million for crude oil derivatives and $1.2 million for natural gas derivatives during 2014 and paid settlements of $2.6 million for crude oil derivatives and received settlements of $1.6 million from natural gas derivatives during 2013. We received settlements of $8.4 million from crude oil derivatives and $19.9 million from natural gas derivatives during 2012 as well as $1.4 million attributable to the termination of an interest rate swap agreement. The oil and gas derivative gains and losses loss in the periods presented is due primarily to period-end oil prices differing from hedged prices as well as a substantially lower volume of natural gas production being hedged during 2013 as compared to 2012.
21
Other
The increase in other income during 2014 compared to 2013 is substantially attributable to $1.3 million of interest received in connection with the arbitration settlement with MHR.
Income Taxes
Year Ended December 31, | 2014 vs. | 2013 vs. | |||||||||||||||||
2014 | 2013 | 2012 | 2013 | 2012 | |||||||||||||||
Favorable (unfavorable) | |||||||||||||||||||
Income tax expense (benefit) | $ | 131,678 | $ | 77,696 | $ | 68,702 | $ | (53,982 | ) | $ | (8,994 | ) | |||||||
Effective tax rate | 24.3 | % | 35.2 | % | 39.6 | % | |||||||||||||
Due to the pre-tax operating loss incurred in 2014, we recognized an income tax benefit. Our income tax benefit was reduced by a combined federal and state $62.8 million valuation allowance against our net deferred tax assets. The federal portion of the valuation allowance was $61.1 million which reduced the carrying value of our federal net deferred tax assets to zero.
The significant difference between our blended federal and state statutory income tax rate of 35.7% and our effective income tax rate of 24.3% in 2014 was almost entirely attributable to the incremental valuation allowance placed against our deferred tax assets. Absent this valuation allowance, our effective income tax rate would have been 35.6%.
Due to the pre-tax operating losses incurred in 2012 and 2013, we recognized an income tax benefit during both periods. The effective tax rate for both of these years included a deferred tax asset valuation allowance for state net operating losses.
22
Financial Condition
Liquidity
Our primary sources of liquidity include cash on hand, cash from operating activities, borrowings under the Revolver, proceeds from the sales of assets and, when appropriate, proceeds from capital market transactions including the sale of debt and equity securities. Our cash flows from operating activities are subject to significant volatility due to changes in commodity prices for our crude oil, NGL and natural gas products, as well as variations in our production. The prices for these commodities are driven by a number of factors beyond our control, including global and regional product supply and demand, weather, product distribution, refining and processing capacity and other supply chain dynamics, among other factors.
Our business plan contemplates capital expenditures in excess of our projected cash from operating activities for 2015. Subject to the variability of commodity prices and production that impacts our cash from operating activities, anticipated timing of our capital projects and unanticipated expenditures such as acquisitions, we plan to fund our 2015 capital program with cash from operating activities and borrowings under the Revolver. We have no debt maturities until September 2017 when the Revolver matures. We believe that our cash from operating activities and borrowing capacity under the Revolver will be sufficient to meet our debt service, preferred stock dividends and working capital requirements, as well as our anticipated capital expenditures.
Capital Resources
In 2015, we anticipate making capital expenditures, excluding acquisitions, of up to approximately $345 million. We expect to allocate substantially all of our capital expenditures to the Eagle Ford. This includes approximately 90 percent for drilling and completions, six percent for leasehold acquisition and four percent for facilities and other projects. The 2015 capital expenditures budget assumes a drilling program utilizing three to four operated drilling rigs in the Eagle Ford. We continually review drilling and other capital expenditure plans and may change the amount we spend, or the allocations, based on available opportunities, industry conditions, cash from operating activities and the overall availability of capital. For a detailed analysis of our historical capital expenditures, see the Cash Flows discussion that follows.
Cash From Operating Activities. In addition to commodity price volatility, as discussed in detail below, our cash from operating activities is impacted by the timing of our working capital requirements. The most significant component thereof is attributable to the timing of payments made for drilling and completion capital expenditures and the related billing and collection of amounts from our partners. This can be substantial to the extent that we are the operator of lower working interest wells. In certain circumstances, we have and will continue to utilize capital cash calls to mitigate our related working capital burden.
We actively manage the exposure of our revenues to commodity price fluctuations by hedging the commodity price risk for a portion of our expected production, typically through the use of collar, swap and swaption contracts. The level of our hedging activity and duration of the instruments employed depend on our cash flow at risk, available hedge prices, the magnitude of our capital program and our operating strategy. During 2014, our commodity derivatives portfolio resulted in $6.2 million of net cash payments related to higher than anticipated prices received for our crude oil production and $1.2 million of net cash payments attributable to higher than anticipated prices received for our natural gas production. In the second half of 2014, commodity prices decreased significantly. If commodity prices remain at current levels, we anticipate that our derivative portfolio will result in receipts from settlements for 2015.
We have hedged approximately 13,000 BOPD of our estimated crude oil production at a weighted-average price of $90.48 per Bbl for the first half of 2015 and 11,000 BOPD of our estimated crude oil production at a weighted-average price of $89.86 per Bbl for the second half of 2015. For 2016, we have hedged approximately 4,000 barrels of daily crude oil production at weighted-average floor/swap prices of $88.12 per barrel. We have also hedged 5,000 million MMBtu of daily natural gas production, or approximately 14 percent of our estimated natural gas production for the first quarter of 2015 at a weighted-average floor/swap price of $4.50 per MMBtu.
Revolver Borrowings. The Revolver provides for a $450 million revolving commitment. The Revolver has an accordion feature that allows us to increase the commitment by up to an additional $150 million upon receiving additional commitments from one or more lenders. The Revolver also includes a $20 million sublimit for the issuance of letters of credit. The Revolver is governed by a borrowing base calculation, which is re-determined semi-annually, and the availability under the Revolver may not exceed the lesser of the aggregate commitments and the borrowing base. In October 2014, the borrowing base was increased to $500 million in connection with the regular semi-annual redetermination. The next semi-annual redetermination is scheduled for May 2015. Based on current commodity price levels and our reduced capital expenditure plans, we anticipate the borrowing base to decline with the next re-determination. Furthermore, our current business plans for 2015 are projected to have us approaching the limits of our allowable leverage beginning in the second half of 2015, based on the existing covenants under the Revolver. Accordingly, we plan to assess our financing and liquidity requirements as we progress into 2015. To the extent that we may be challenged with respect to our allowable leverage, we will review our available alternatives and remedies which include, but are not limited to: (i) seeking an amendment to the leverage covenant, (ii) adjusting the pace or magnitude of our capital program or (iii) assessing the potential for a capital markets transaction.
23
The Revolver is available to us for general purposes, including working capital, capital expenditures and acquisitions. The Revolver matures in September 2017. We had letters of credit of $1.8 million outstanding as of December 31, 2014. As of December 31, 2014, our available borrowing capacity under the Revolver was $413.2 million.
For additional information regarding the terms and covenants associated with our Revolver, see the Capitalization discussion that follows. The following table summarizes our borrowing activity under the Revolver during the periods presented:
Borrowings Outstanding | ||||||||||
Weighted- Average | Maximum | Weighted- Average Rate | ||||||||
Three months ended December 31, 2014 | $ | 10,663 | $ | 35,000 | 1.7970 | % | ||||
Year ended December 31, 2014 | $ | 130,438 | $ | 407,000 | 2.2179 | % | ||||
Proceeds from Sales of Assets. We continually evaluate potential sales of non-core assets, including certain oil and gas properties and non-strategic undeveloped acreage, among others. For a discussion of our historical proceeds from asset sales and other dispositions, see the Cash Flows discussion that follows.
Capital Market Transactions. From time-to-time and under market conditions that we believe are favorable to us, we consider capital market transactions, including the offering of debt and equity securities. Historically, we have entered into such transactions to facilitate acquisitions and to pursue opportunities to adjust our total capitalization. For a discussion of our historical proceeds from capital markets transactions, including the Series B Preferred Stock and the 2020 Senior Notes, see the Cash Flows discussion that follows.
Cash Flows
The following table summarizes our cash flows for the periods presented:
Year Ended December 31, | |||||||||||
2014 | 2013 | Variance | |||||||||
Cash flows from operating activities | |||||||||||
Operating cash flows, net | $ | 372,611 | $ | 314,424 | $ | 58,187 | |||||
Working capital changes (excluding interest and income taxes), net | 9,033 | 19,120 | (10,087 | ) | |||||||
Commodity derivative settlements (paid) received, net: | — | ||||||||||
Crude oil | (6,170 | ) | (2,624 | ) | (3,546 | ) | |||||
Natural gas | (1,254 | ) | 1,582 | (2,836 | ) | ||||||
Interest payments, net of amounts capitalized | (84,797 | ) | (65,107 | ) | (19,690 | ) | |||||
Income taxes paid | (3,612 | ) | — | (3,612 | ) | ||||||
EF Acquisition arbitration, transaction, integration and other costs paid | (589 | ) | (3,029 | ) | 2,440 | ||||||
Restructuring and exit costs paid | (2,498 | ) | (2,854 | ) | 356 | ||||||
Net cash provided by operating activities | 282,724 | 261,512 | 21,212 | ||||||||
Cash flows from investing activities | |||||||||||
EF Acquisition and working capital-related settlements, net | 33,712 | (380,694 | ) | 414,406 | |||||||
Capital expenditures – property and equipment | (774,139 | ) | (504,203 | ) | (269,936 | ) | |||||
Proceeds from sales of assets, net | 313,933 | (54 | ) | 313,987 | |||||||
Net cash used in investing activities | (426,494 | ) | (884,951 | ) | 458,457 | ||||||
Cash flows from financing activities | |||||||||||
Proceeds from the issuance of preferred stock, net | 313,330 | — | 313,330 | ||||||||
Payments made to induce conversion of preferred stock | (4,256 | ) | — | (4,256 | ) | ||||||
Proceeds from the issuance of senior notes | — | 775,000 | (775,000 | ) | |||||||
Retirement of senior notes | — | (319,090 | ) | 319,090 | |||||||
Proceeds (repayments) from revolving credit facility borrowings, net | (171,000 | ) | 206,000 | (377,000 | ) | ||||||
Debt issuance costs paid | (151 | ) | (25,634 | ) | 25,483 | ||||||
Dividends paid on preferred stock | (12,803 | ) | (6,862 | ) | (5,941 | ) | |||||
Other, net | 1,428 | (151 | ) | 1,579 | |||||||
Net cash provided by financing activities | 126,548 | 629,263 | (502,715 | ) | |||||||
Net increase in cash and cash equivalents | $ | (17,222 | ) | $ | 5,824 | $ | (23,046 | ) | |||
24
Cash Flows From Operating Activities. Increased crude oil and NGL production resulted in higher operating cash flows during 2014 compared to 2013; however, this increase was offset to some extent by the higher working capital requirements of our expanded drilling program. Specifically, during 2014, we began drilling several wells with lower working interests resulting in significantly larger payments for drilling and completion costs and larger corresponding receivables from our joint interest partners when compared to the prior year period. In addition, our commodity derivatives portfolio generated higher net payments during 2014 as compared to 2013 due primarily to realized crude oil and natural gas prices exceeding hedged prices. Due primarily to the issuance of the 2020 Senior Notes in 2013 and higher average outstanding borrowings under the Revolver, we had significantly higher interest payments during the 2014 period.
Cash Flows From Investing Activities. Capital expenditures were substantially higher during 2014 compared to 2013 due primarily to a higher level of drilling activity and lease acquisitions in the Eagle Ford. Our capital expenditures during 2014 period were partially offset by the receipt of net proceeds from the sale of assets, including approximately $147 million from the sale of rights to construct an oil gathering and intermediate transportation system in South Texas in July 2014, approximately $68 million from the sale of our Selma Chalk assets in Mississippi in July 2014 and approximately $96 million from the sale of our natural gas gathering and gas lift assets in South Texas in January 2014. A portion of those proceeds was used to pay down outstanding borrowings under the Revolver. We also received approximately $35 million in August 2014 with respect to the resolution of arbitration matters in connection with the EF Acquisition. Approximately $34 million, net of interest income on the settlement, was classified as an investing activity. Net proceeds from asset sales during the 2013 period were attributable primarily to the sale of surplus tubular inventory and well materials as well as certain of our Appalachian natural gas assets. Receipt of these proceeds in 2013 were more than offset by the payment of certain post-closing adjustments attributable to asset sales completed in prior years.
The following table sets forth costs related to our capital expenditure program for the periods presented:
Year Ended December 31, | |||||||
2014 | 2013 | ||||||
Oil and gas: | |||||||
Drilling and completion | $ | 667,385 | $ | 418,246 | |||
Lease acquisitions and other land-related costs 1 | 98,443 | 69,155 | |||||
Geological and geophysical (seismic) costs | 5,106 | 2,882 | |||||
Pipeline, gathering facilities and other equipment | 21,538 | 17,583 | |||||
792,472 | 507,866 | ||||||
Other – Corporate 2 | 1,463 | 2,370 | |||||
Total capital program costs | $ | 793,935 | $ | 510,236 | |||
_________________
1 Includes site-preparation and other pre-drilling costs.
2 Includes $0.8 million in 2014 and $2 million in 2013 for an integrated enterprise-wide information technology platform.
The following table reconciles the total costs of our capital expenditure program with the net cash paid for capital expenditures for additions to property and equipment as reported in our Consolidated Statements of Cash Flows for the periods presented:
Year Ended December 31, | |||||||
2014 | 2013 | ||||||
Total capital program costs | $ | 793,935 | $ | 510,236 | |||
Increase in accrued capitalized costs | (24,715 | ) | (6,356 | ) | |||
Less: | |||||||
Exploration expenses charged to operations: | |||||||
Geological and geophysical (seismic) | (5,106 | ) | (2,882 | ) | |||
Other, primarily delay rentals | (860 | ) | (661 | ) | |||
Transfers from tubular inventory and well materials | (403 | ) | (2,471 | ) | |||
Add: | |||||||
Tubular inventory and well materials purchased in advance of drilling | 4,056 | 1,071 | |||||
Capitalized interest | 7,232 | 5,266 | |||||
Total cash paid for capital expenditures | $ | 774,139 | $ | 504,203 | |||
25
We received proceeds, net of related costs, and other settlements from asset sales and the the disposition of certain non-core properties during both 2014 and 2013 as follows:
Year Ended December 31, | |||||||
2014 | 2013 | ||||||
Rights to construct an oil gathering system in South Texas, net | $ | 147,149 | $ | — | |||
South Texas natural gas gathering and gas lift system, net | 95,964 | — | |||||
Oil and gas properties, net | 70,818 | 85 | |||||
Tubular inventory and well materials, net | 2 | 399 | |||||
Proceeds from the sales of assets, net | 313,933 | 484 | |||||
Payments of post-closing adjustments attributable to sales of assets | — | (538 | ) | ||||
$ | 313,933 | $ | (54 | ) | |||
Cash Flows From Financing Activities. In June 2014, we issued the Series B Preferred Stock for net proceeds of approximately $313 million. Cash flows from financing activities for 2014 also included net repayments under the Revolver, funded primarily with proceeds from the issuance of Series B Preferred Stock and asset sales, while 2013 included net borrowings under the Revolver, which were used to finance a portion of our capital program. In June and July of 2014, we paid a total of $4.3 million to induce the conversion of approximately 30 percent of the outstanding shares of the Series A Preferred Stock. Both 2014 and 2013 included dividends paid on the Series A Preferred Stock while 2014 also included the initial payment of dividends on the Series B Preferred Stock. In April 2013, we issued the 2020 Senior Notes, the proceeds of which were used to fund the EF Acquisition and a portion of the tender offer and the redemption of the 2016 Senior Notes. We incurred and paid costs in the 2014 and 2013 periods associated with amendments to the Revolver in advance of the Series B Preferred Stock and the 2020 Senior Notes offering transactions as well as costs paid in the 2013 period associated with the issuance of the 2020 Senior Notes. We also received proceeds of $1.4 million during 2014 from the exercise of stock options.
Capitalization
The following table summarizes our total capitalization as of the dates presented:
As of December 31, | |||||||
2014 | 2013 | ||||||
Revolving credit facility | $ | 35,000 | $ | 206,000 | |||
Senior notes due 2019 | 300,000 | 300,000 | |||||
Senior notes due 2020 | 775,000 | 775,000 | |||||
Total debt | 1,110,000 | 1,281,000 | |||||
Shareholders’ equity 1 | 675,817 | 788,804 | |||||
$ | 1,785,817 | $ | 2,069,804 | ||||
Debt as a % of total capitalization | 62 | % | 62 | % | |||
_________________
1 Includes 7,945 and 11,500 shares of the Series A Preferred Stock as of December 31, 2014 and 2013, respectively, and 32,500 shares of the Series B Preferred Stock as of December 31, 2014. Both series of preferred stock have a liquidation preference of $10,000 per share representing a total of $404 million and $115 million as of December 31, 2014 and 2013, respectively.
Revolving Credit Facility. Borrowings under the Revolver bear interest, at our option, at either (i) a rate derived from LIBOR, as adjusted for statutory reserve requirements for Eurocurrency liabilities, or Adjusted LIBOR, plus an applicable margin (ranging from 1.500% to 2.500%) or (ii) the greater of (a) the prime rate, (b) the federal funds effective rate plus 0.5% or (c) the one-month Adjusted LIBOR plus 1.0%, plus, in each case, an applicable margin (ranging from 0.500% to 1.500%). In each case, the applicable margin is determined based on the ratio of our outstanding borrowings to the available Revolver capacity. As of December 31, 2014, the actual interest rate applicable to the Revolver was 1.6875% which is derived from an Adjusted LIBOR rate of 0.1875% plus an applicable margin of 1.50%. Commitment fees are charged at 0.375% to 0.500% on the undrawn portion of the Revolver depending on our ratio of outstanding borrowings to the available Revolver capacity. As of December 31, 2014, commitment fees were being charged at a rate of 0.375%.
The Revolver is guaranteed by Penn Virginia and all of our material subsidiaries, or the Guarantor Subsidiaries. The obligations under the Revolver are secured by a first priority lien on substantially all of our proved oil and gas reserves and a pledge of the equity interests in the Guarantor Subsidiaries.
2019 Senior Notes. The 7.25% Senior Notes due 2019, or the 2019 Senior Notes, which were issued at par in April 2011, bear interest at an annual rate of 7.25% and are payable on April 15 and October 15 of each year. The 2019 Senior Notes are
26
senior to our existing and future subordinated indebtedness and are subordinated to all of our secured indebtedness, including the Revolver, to the extent of the collateral securing that indebtedness. The 2019 Senior Notes are fully and unconditionally guaranteed by the Guarantor Subsidiaries.
2020 Senior Notes. The 2020 Senior Notes, which were issued at par in April 2013, bear interest at an annual rate of 8.5% and are payable on May 1 and November 1 of each year. The 2020 Senior Notes are senior to our existing and future subordinated indebtedness and are subordinated to all of our secured indebtedness, including the Revolver, to the extent of the collateral securing that indebtedness. The 2020 Senior Notes are fully and unconditionally guaranteed by the Guarantor Subsidiaries.
Series A Preferred Stock. The annual dividend on each share of the Series A Preferred Stock is 6.00% per annum on the liquidation preference of $10,000 per share and is payable quarterly, in arrears, on each of January 15, April 15, July 15 and October 15 of each year. We may, at our option, pay dividends in cash, common stock or a combination thereof.
Each share of the Series A Preferred Stock is convertible, at the option of the holder, into a number of shares of our common stock equal to the liquidation preference of $10,000 divided by the conversion price, which is initially $6.00 per share and is subject to specified anti-dilution adjustments. The initial conversion rate is equal to 1,666.67 shares of our common stock for each share of the Series A Preferred Stock. The initial conversion price represents a premium of 20 percent relative to the October 2012 common stock offering price of $5.00 per share. The Series A Preferred Stock is not redeemable for cash by us or the holders at any time. At any time on or after October 15, 2017, we may, at our option, cause all outstanding shares of the Series A Preferred Stock to be automatically converted into shares of our common stock at the then-applicable conversion price if the closing sale price of our common stock exceeds 130% of the then-applicable conversion price for a specified period prior to conversion. If a holder elects to convert shares of the Series A Preferred Stock upon the occurrence of certain specified fundamental changes, we may be obligated to deliver an additional number of shares above the applicable conversion rate to compensate the holder for lost option value. During 2014, a total of 3,555 shares, or 355,482 depositary shares, of the Series A Preferred Stock were converted into 5.9 million shares of common stock.
Series B Preferred Stock. The annual dividend on each share of the Series B Preferred Stock is 6.00% per annum on the liquidation preference of $10,000 per share and is payable quarterly, in arrears, on each of January 15, April 15, July 15 and October 15 of each year. We may, at our option, pay dividends in cash, common stock or a combination thereof.
Each share of the Series B Preferred Stock is convertible, at the option of the holder, into a number of shares of our common stock equal to the liquidation preference of $10,000 divided by the conversion price, which is initially $18.34 per share and is subject to specified anti-dilution adjustments. The initial conversion rate is equal to 545.17 shares of our common stock for each share of the Series B Preferred Stock. The initial conversion price represents a premium of 30 percent relative to the last reported sales price of $14.11 per common share prior to the offering of the Series B Preferred Stock. The Series B Preferred Stock is not redeemable for cash by us or the holders at any time. At any time on or after July 15, 2019, we may, at our option, cause all outstanding shares of the Series B Preferred Stock to be automatically converted into shares of our common stock at the then-applicable conversion price if the closing sale price of our common stock exceeds 130% of the then-applicable conversion price for a specified period prior to conversion. If a holder elects to convert shares of the Series B Preferred Stock upon the occurrence of certain specified fundamental changes, we may be obligated to deliver an additional number of shares above the applicable conversion rate to compensate the holder for lost option value.
Covenant Compliance. The Revolver and the indentures governing our senior notes require us to maintain certain financial and non-financial covenants. These covenants impose limitations on our ability to pay dividends as well as our ability to incur indebtedness, grant liens, make certain loans, acquisitions and investments, make any material change to the nature of our business, or enter into a merger or sale of our assets, including the sale or transfer of interests in our subsidiaries, among other requirements. As of December 31, 2014 and through the date upon which our Consolidated Financial Statements were issued, we were in compliance with these covenants.
In the event that we would be in default of a covenant under the Revolver, we could request a waiver of the covenant from our bank group. Should the banks deny our request to waive the covenant requirement, any outstanding borrowings under the Revolver would become payable on demand and would be reclassified as a component of current liabilities on our Consolidated Balance Sheets.
The Revolver requires us to maintain certain financial covenants as follows:
• | Total debt to EBITDAX, each as defined in the Revolver, for any four consecutive quarters may not exceed 4.25 to 1.0 for periods through December 31, 2014 and 4.0 to 1.0 for periods through maturity in 2017. EBITDAX, which is a non-GAAP measure, generally means net income plus interest expense, taxes, depreciation, depletion and amortization expenses, exploration expenses, impairments and other non-cash charges or losses. |
• | The current ratio, as of the last day of any quarter, may not be less than 1.0 to 1.0. The current ratio is generally defined as current assets to current liabilities. Current assets and current liabilities attributable to derivative instruments are excluded. In addition, current assets include the amount of any unused commitment under the Revolver. |
27
The indentures governing our senior notes include an incurrence test which is determined by an interest coverage ratio, as defined in the indentures. The interest coverage ratio may not be less than 2.25 times consolidated EBITDAX, a non-GAAP measure.
As of December 31, 2014 and through the date upon which the Consolidated Financial Statements were issued, we were in compliance with these financial covenants.
The following table summarizes the actual results of our financial covenant compliance under the Revolver and senior note indentures as of and for the period ended December 31, 2014:
Required | Actual | |||
Description of Covenant | Covenant | Results | ||
Total debt to EBITDAX | < 4.25 to 1 | 3.0 to 1 | ||
Current ratio | > 1.00 to 1 | 2.0 to 1 | ||
Interest coverage | > 2.25 to 1 | 3.4 to 1 | ||
Off-Balance Sheet Arrangements
We may enter into off-balance sheet arrangements and transactions that can give rise to material off-balance sheet obligations. As of December 31, 2014, the material off-balance sheet arrangements and transactions that we have entered into included operating lease arrangements, well drilling commitments, well completion service commitments, firm transportation agreements and letters of credit, all of which are customary in our business. See Contractual Obligations summarized below for more details related to the value of our off-balance sheet arrangements. We did not have any relationships with unconsolidated entities or financial partnerships, such as structured finance or special purpose entities, which would have been established for the purpose of facilitating off-balance sheet arrangements or other contractually narrow or limited purposes. We are, therefore, not materially exposed to any financing, liquidity, market or credit risk that could arise if we had engaged in such relationships.
Contractual Obligations
The following table summarizes our contractual obligations as of December 31, 2014:
Payments Due by Period | |||||||||||||||||||
Total | Less than 1 Year | 1-3 Years | 3-5 Years | More Than 5 Years | |||||||||||||||
Revolver 1 | $ | 35,000 | $ | — | $ | 35,000 | $ | — | $ | — | |||||||||
Senior Notes due 2019 and 2020 2 | 1,075,000 | — | — | 300,000 | 775,000 | ||||||||||||||
Interest payments on long-term debt 3 | 461,813 | 88,216 | 176,285 | 164,375 | 32,937 | ||||||||||||||
Operating leases 4 | 6,482 | 1,967 | 3,166 | 1,349 | — | ||||||||||||||
Well drilling and completion commitments | 33,660 | 33,660 | — | — | — | ||||||||||||||
Firm transportation commitments 5 | 37,412 | 4,789 | 7,762 | 7,762 | 17,099 | ||||||||||||||
Asset retirement obligations 6 | 76,969 | — | — | — | 76,969 | ||||||||||||||
Other commitments 7 | 139,124 | 10,337 | 32,899 | 27,376 | 68,512 | ||||||||||||||
Total contractual obligations | $ | 1,865,460 | $ | 138,969 | $ | 255,112 | $ | 500,862 | $ | 970,517 | |||||||||
_______________________________________
1 Assumes that the amount outstanding of $35 million as of December 31, 2014 will remain outstanding until its maturity in 2017.
2 Upon their maturities in April 2019 and May 2020, the principal amounts of $300 million and $775 million each will be due.
3 Represents estimated interest payments that will be due under the Revolver, assuming the amount outstanding of $35 million as of December 31, 2014 will remain until its maturity in 2017, as well as contractual interest payments on the 2019 Senior Notes and the 2020 Senior Notes.
4 Relates primarily to office and equipment leases.
5 Includes $21.4 million of undiscounted payments attributable to a firm transportation obligation for which $14.9 million has been recognized on our Consolidated Balance Sheet as of December 31, 2014.
6 Represents the undiscounted balance payable in periods more than five years in the future for which $5.9 million has been recognized on our Consolidated Balance Sheet as of December 31, 2014. While we anticipate making payments to settle asset retirement obligations during each of the next five years, none are currently required by contract to be made during this time frame.
7 Represents all other significant obligations including minimum commitments under a natural gas gathering and compression service agreement, a crude oil gathering and intermediate transportation agreement and information technology licensing and service agreements, among others.
28
Critical Accounting Estimates
The process of preparing financial statements in accordance with GAAP requires our management to make estimates and judgments regarding certain items and transactions. It is possible that materially different amounts could be recorded if these estimates and judgments change or if the actual results differ from these estimates and judgments. We consider the following to be the most critical accounting estimates requiring judgment of our management.
Oil and Gas Reserves
Estimates of our oil and gas reserves are the most critical estimate included in our Consolidated Financial Statements. Reserve estimates become the basis for determining depletive write-off rates, recoverability of historical cost investments and the fair value of properties acquired as well as those subject to potential impairments. There are many uncertainties inherent in estimating crude oil, NGL and natural gas reserve quantities, including projecting the total quantities in place, future production rates and the amount and timing of future development expenditures. In addition, reserve estimates of new discoveries are less precise than those of producing properties due to the lack of a production history. Accordingly, these estimates are subject to change as additional information becomes available.
There are several factors which could change the estimates of our oil and gas reserves. Significant rises or declines in commodity product prices as well as changes in our drilling plans could lead to changes in the amount of reserves as production activities become more or less economical. An additional factor that could result in a change of recorded reserves is the reservoir decline rates differing from those assumed when the reserves were initially recorded. Estimation of future production and development costs is also subject to change partially due to factors beyond our control, such as energy costs and inflation or deflation of oil field service costs.
Oil and Gas Properties
We use the successful efforts method to account for our oil and gas properties. Under this method, costs of acquiring properties, costs of drilling successful exploration wells and development costs are capitalized. Geological and geophysical costs, delay rentals and costs to drill exploratory wells that do not find proved reserves are expensed as oil and gas exploration. We will carry the costs of an exploratory well as an asset if the well has found a sufficient quantity of reserves to justify its completion as a producing well and as long as we are making sufficient progress assessing the reserves and the economic and operating viability of the project. For certain projects, it may take us more than one year to evaluate the future potential of the exploratory well and make a determination of its economic viability. Our ability to move forward on a project may be dependent on gaining access to transportation or processing facilities or obtaining permits and government or partner approval, the timing of which is beyond our control. In such cases, exploratory well costs remain suspended as long as we are actively pursuing access to the necessary facilities or receiving to such permits and approvals and believe that they will be obtained. We assess the status of suspended exploratory well costs on a quarterly basis.
We assess our proved oil and gas properties for impairment on a geographic basis, generally at the field level, based upon a periodic review of commodity prices and, when available, updated oil and gas reserve data. Generally, we compile updated oil and gas reserve data once during the calendar year and again at year-end on a more formal basis. The assessment is performed by comparing the carrying value of proved properties for each field to the undiscounted estimated future cash flows. Undiscounted estimated future cash flows are based on updated oil and gas reserve data, when available, and include the impact of risk-adjusted probable and possible reserves, future commodity prices, anticipated production and forecasted operating and capital expenditures. Commodity prices are estimated based on five-year NYMEX strip prices, adjusted accordingly for basis differentials and other factors consistent with management’s assumptions utilized for internal planning and budgeting purposes. If, based on the assessment, the carrying value of the proved properties exceeds the undiscounted estimated future cash flows, the cost of the proved properties are written down to fair value. In certain circumstances, significant management judgment is applied to consideration of the results of such assessment described above. Accordingly, it is possible that impairment would not be appropriate for certain properties that failed the objective assessment based on consideration of other factors, including the timeliness of reserve assignment, among others. Likewise, impairment may be appropriate for other properties that otherwise passed the objective assessment based on the trending of prices, lease expirations and future development plans.
A portion of the carrying value of our oil and gas properties is attributable to unproved properties. As of December 31, 2014, the costs attributable to unproved properties, net of accumulated amortization, were $125.7 million. Unproved properties whose acquisition costs are insignificant are amortized as a component of exploration expense in the aggregate over the lesser of five years or the average remaining lease term. We assess unproved properties whose acquisition costs are relatively significant, if any, for impairment on a stand-alone basis. As exploration and development work progresses and the reserves on properties are proven, capitalized costs of these properties are subject to depreciation and depletion. If exploration activities are unsuccessful, the capitalized costs of the properties related to the unsuccessful work is charged to exploration expense. The timing of any write-downs of any significant unproved properties depends upon the nature, timing and extent of future exploration and development activities and their results.
Prior to 2013, we have not had any unproved properties that were deemed significant as described above. Subsequent to the EF Acquisition our unproved properties in the Eagle Ford are now considered significant and became subject to impairment
29
on a stand-alone basis effective July 1, 2013. Furthermore, we anticipate transferring material amounts representing the cost of unproved leaseholds to proved properties in future periods as our activities in the Eagle Ford continue to be successful. Accordingly, we anticipate that our future charges for unproved leasehold amortization will decline from historical levels.
Depreciation, Depletion and Amortization
We determine depreciation and depletion of oil and gas producing properties by the units-of-production method and these amounts could change with revisions to estimated proved recoverable reserves. We compute depreciation and amortization of other property and equipment using the straight-line balance method over the estimated useful life of each asset.
Derivative Activities
From time to time, we enter into derivative instruments to mitigate our exposure to crude oil and natural gas price volatility and interest rate fluctuations. The derivative financial instruments, which are placed with financial institutions that we believe are of acceptable credit risk, take the form of collars, swaps and swaptions, among others. All derivative instruments are recognized in our Consolidated Financial Statements at fair value with the changes recorded currently in earnings. The fair values of our derivative instruments are determined based on discounted cash flows derived from quoted forward prices and rates. All derivative transactions are subject to our risk management policy, which has been reviewed and approved by our board of directors.
Deferred Tax Asset Valuation Allowance
We record a valuation allowance to reduce our deferred tax assets to an amount that is more likely than not to be realized after consideration of future taxable income and reasonable tax planning strategies. In the event that we were to determine that we would not be able to realize all or a part of our deferred tax assets for which a valuation allowance had not been established, an adjustment to the deferred tax asset will be reflected in income in the period such determination is made. The most significant matter applicable to the realization of our deferred tax assets is attributable to net operating losses in certain states. Estimates of future taxable income inherently reflect a significant degree of uncertainty. During the years ended December 31, 2014 and 2012, we increased the valuation allowance for our deferred tax assets due primarily to our inability to project sufficient future taxable income in certain states.
Share-Based Compensation
In May 2014, May 2013 and February 2012, we granted PBRSUs to certain executive officers. Vested PBRSUs are payable in cash on the third anniversary of the date of grant based upon the achievement of specified market-based performance metrics with respect to each of a one-year, two-year and three-year performance period, in each case commencing on the date of grant. The number of PBRSUs vested can range from 0% to 200% of the initial grant. The PBRSUs do not have voting rights and do not participate in dividends.
Because the PBRSUs are payable solely in cash, they are considered liability-classified awards and are included in the Other liabilities caption on our Consolidated Balance Sheets. Compensation cost associated with the PBRSUs is measured at the end of each reporting period based on the fair value derived from a Monte Carlo model and recognized based on the period of time that has elapsed during each of the individual performance periods. The Monte Carlo model is a binomial valuation model that requires significant judgment with respect to certain assumptions, including volatility, dividends and other factors. Due primarily to the sensitivity of certain model assumptions, as well as the inherent variability of modeling market-based performance over future periods, our compensation expense with respect to the PBRSUs can be volatile.
Recent Accounting Standards
In May 2014, the FASB issued Accounting Standards Update No. 2014-09, Revenues from Contracts with Customers, or ASU 2014-09, which requires an entity to recognize the amount of revenue to which it expects to be entitled for the transfer of promised goods or services to customers. ASU 2014-09 will replace most existing revenue recognition guidance in U.S. GAAP when it becomes effective on January 1, 2017. The standard permits the use of either the retrospective or cumulative effect transition method upon adoption. We are evaluating the effect that ASU 2014-09 will have on our Consolidated Financial Statements and related disclosures. We have not yet selected a transition method nor have we determined the effect of ASU 2014-09 on our ongoing financial reporting.
30
Part IV
Item 15 | Exhibit and Financial Statement Schedules |
(1) | Financial Statements — The financial statements filed herewith are listed in the Index to Consolidated Financial Statements on page 50 of the Annual Report on Form 10-K (previously filed as Exhibit 1 to the Annual Report on Form 10-K (File No. 001-13283) originally filed on February 25, 2015). |
(2.1) | Purchase and Sale Agreement, dated May 30, 2014, by and between Penn Virginia Oil & Gas Corporation and KKR Management Holdings L.P. (incorporated by reference to Exhibit 2.1 to Registrant’s Current Report on Form 8-K (File No. 001-13283) filed on June 2, 2014). |
(3.1) | Restated Articles of Incorporation of Penn Virginia Corporation (incorporated by reference to Exhibit 3.1 to Registrant’s Current Report on Form 8-K (File No. 001-13283) filed on July 30, 2013). |
(3.1.1) | Articles of Amendment of the Restated Articles of Incorporation of Penn Virginia Corporation (incorporated by reference to Exhibit 3.1 to Registrant’s Current Report on Form 8-K (File No. 001-13283) filed on June 16, 2014). |
(3.2) | Amended and Restated Bylaws of Penn Virginia Corporation (incorporated by reference to Exhibit 3.2 to Registrant’s Current Report on Form 8-K (File No. 001-13283) filed on June 16, 2014). |
(4.1) | Senior Indenture dated June 15, 2009 among Penn Virginia Corporation, as Issuer, the Subsidiary Guarantors named therein, and Wells Fargo Bank, National Association, as Trustee (incorporated by reference to Exhibit 4.1 to Registrant’s Current Report on Form 8-K (File No. 001-13283) filed on June 16, 2009). |
(4.1.1) | First Supplemental Indenture relating to the 10.375% Senior Notes due 2016, dated June 15, 2009, among Penn Virginia Corporation, as Issuer, the Subsidiary Guarantors named therein and Wells Fargo Bank, National Association, as Trustee (incorporated by reference to Exhibit 4.1 to Registrant’s Current Report on Form 8-K/A (File No. 001-13283) filed on June 18, 2009). |
(4.1.2) | Second Supplemental Indenture relating to the 10.375% Senior Notes due 2016, dated April 4, 2011, among Penn Virginia Corporation, as Issuer, the Subsidiary Guarantors named therein and Wells Fargo Bank, National Association, as Trustee (incorporated by reference to Exhibit 4.1 to Registrant’s Current Report on Form 8-K (File No. 001-13283) filed on April 5, 2011). |
(4.1.3) | Third Supplemental Indenture relating to the 7.25% Senior Notes due 2019, dated April 13, 2011, among Penn Virginia Corporation, as Issuer, the Subsidiary Guarantors named therein and Wells Fargo Bank, National Association, as Trustee (incorporated by reference to Exhibit 4.2 to Registrant’s Current Report on Form 8-K (File No. 001-13283) filed on April 14, 2011). |
(4.1.4) | Form of Note for 7.25% Senior Notes due 2019 (incorporated by reference to Annex A to Exhibit 4.3 to Registrant’s Current Report on Form 8-K (File No. 001-13283) filed on April 14, 2011). |
(4.1.5) | Fourth Supplemental Indenture relating to the 8.500% Senior Notes due 2020, dated April 24, 2013, among Penn Virginia Corporation, as Issuer, the Subsidiary Guarantors named therein and Wells Fargo Bank, National Association, as Trustee (incorporated by reference to Exhibit 4.2 to Registrant’s Current Report on Form 8-K (File No. 001-13283) filed on April 29, 2013). |
(4.1.6) | Form of 8.500% Senior Notes due 2020 (incorporated by reference to Exhibit 4.3 contained in Exhibit 1 to Exhibit 4.2 to Registrant’s Current Report on Form 8-K (File No. 001-13283) filed on April 29, 2013). |
(4.1.7) | Fifth Supplemental Indenture relating to the 10.375% Senior Notes due 2016, dated April 24, 2013, among Penn Virginia Corporation, as Issuer, the Subsidiary Guarantors named therein and Wells Fargo Bank, National Association, as Trustee (incorporated by reference to Exhibit 4.6 to Registrant’s Current Report on Form 8-K (File No. 001-13283) filed on April 29, 2013). |
(4.2) | Deposit Agreement, dated October 17, 2012, among Penn Virginia Corporation, American Stock Transfer & Trust Company, LLC and the holders from time to time of the depositary shares described therein (incorporated by reference to Exhibit 4.1 to Registrant’s Current Report on Form 8-K (File No. 001-13283) filed on October 17, 2012). |
(4.2.1) | Form of depositary receipt representing the Depositary Shares (incorporated by reference to Exhibit A to Exhibit 4.1 to Registrant’s Current Report on Form 8-K (File No. 001-13283) filed on October 17, 2012). |
(4.3) | Deposit Agreement, dated June 16, 2014, among Penn Virginia Corporation, American Stock Transfer & Trust Company, LLC and the holders from time to time of the depositary receipts described therein (incorporated by reference to Exhibit 4.1 to Registrant’s Current Report on Form 8-K (File No. 001-13283) filed on June 16, 2014). |
(4.3.1) | Form of depositary receipt representing the Depositary Shares (incorporated by reference to Exhibit A to Exhibit 4.1 to Registrant’s Current Report on Form 8-K (File No. 001-13283) filed on June 16, 2014). |
(10.1) | Credit Agreement dated as of September 28, 2012 among Penn Virginia Holding Corp., as borrower, Penn Virginia Corporation, as parent, the lenders party thereto and Wells Fargo Bank, National Association, as administrative agent (incorporated by reference to Exhibit 10.1 to Registrant’s Current Report on Form 8-K (File No. 001-13283) filed on October 2, 2012). |
(10.1.1) | Waiver and First Amendment to Credit Agreement dated as of April 2, 2013 by and among Penn Virginia Holding Corp., as borrower, Penn Virginia Corporation, as parent, the lenders party thereto and Wells Fargo Bank, National Association, as administrative agent (incorporated by reference to Exhibit 10.1 to Registrant’s Current Report on Form 8-K (File No. 001-13283) filed on April 3, 2013). |
31
(10.1.2) | Waiver and Second Amendment to Credit Agreement dated as of April 2, 2013 by and among Penn Virginia Holding Corp., as borrower, Penn Virginia Corporation, as parent, the lenders party thereto and Wells Fargo Bank, National Association, as administrative agent (incorporated by reference to Exhibit 10.1 to Registrant’s Current Report on Form 8-K (File No. 001-13283) filed on April 11, 2013). |
(10.1.3) | Assignment and Third Amendment to Credit Agreement dated as of May 20, 2013 by and among Penn Virginia Holding Corp., as borrower, Penn Virginia Corporation, as parent, the lenders party thereto and Wells Fargo Bank, National Association, as administrative agent (incorporated by reference to Exhibit 10.1 to Registrant’s Current Report on Form 8-K (File No. 001-13283) filed on June 3, 2013). |
(10.1.4) | Assignment and Fourth Amendment to Credit Agreement dated as of October 28, 2013 by and among Penn Virginia Holding Corp., as borrower, Penn Virginia Corporation, as parent, the lenders party thereto and Wells Fargo Bank, National Association, as administrative agent (incorporated by reference to Exhibit 10.1 to Registrant’s Current Report on Form 8-K (File No. 001-13283) filed on October 30, 2013). |
(10.1.5) | Fifth Amendment and Borrowing Base Redetermination dated as of May 12, 2014 among Penn Virginia Holding Corp., as borrower, Penn Virginia Corporation, as parent, the lenders party thereto and Wells Fargo Bank, National Association, as administrative agent (incorporated by reference to Exhibit 10.1 to Registrant’s Current Report on Form 8-K (File No. 001-13283) filed on May 15, 2014). |
(10.1.6) | Sixth Amendment to Credit Agreement dated as of June 16, 2014 by and among Penn Virginia Holding Corp., as borrower, Penn Virginia Corporation, as parent, the lenders party thereto and Wells Fargo Bank, National Association, as administrative agent (incorporated by reference to Exhibit 10.1 to Registrant’s Current Report on Form 8-K (File No. 001-13283) filed on June 16, 2014). |
(10.1.7) | Seventh Amendment and Borrowing Base Redetermination dated as of October 23, 2014 among Penn Virginia Holding Corp., as borrower, Penn Virginia Corporation, as parent, the lenders party thereto and Wells Fargo Bank, National Association, as administrative agent (incorporated by reference to Exhibit 10.1 to Registrant’s Current Report on Form 8-K (File No. 001-13283) filed on October 27, 2014). |
(10.1.8) | Eighth Amendment to Credit Agreement dated as of November 7, 2014 by and among Penn Virginia Holding Corp., as borrower, Penn Virginia Corporation, as parent, the lenders party thereto and Wells Fargo Bank, National Association, as administrative agent (incorporated by reference to Exhibit 10.1 to Registrant’s Current Report on Form 8-K (File No. 001-13283) filed on November 12, 2014). |
(10.2) | Penn Virginia Corporation Supplemental Employee Retirement Plan (incorporated by reference to Exhibit 10.1 to Registrant’s Current Report on Form 8-K (File No. 001-13283) filed on October 29, 2007).* |
(10.2.1) | Amendment 2009-1 to the Penn Virginia Corporation Supplemental Employee Retirement Plan (incorporated by reference to Exhibit 10.4.1 to Registrant’s Annual Report on Form 10-K (File No. 001-13283) filed on February 27, 2012).* |
(10.3) | Penn Virginia Corporation Amended and Restated Non-Employee Directors Deferred Compensation Plan (incorporated by reference to Exhibit 10.2 to Registrant’s Current Report on Form 8-K (File No. 001-13283) filed on October 29, 2007).* |
(10.3.1) | Amendment One to the Penn Virginia Corporation Amended and Restated Non-Employee Directors Deferred Compensation Plan (incorporated by reference to Exhibit 10.1 to Registrant’s Current Report on Form 8-K (File No. 001-13283) filed on May 6, 2011).* |
(10.4) | Penn Virginia Corporation Fifth Amended and Restated 1995 Directors’ Compensation Plan (incorporated by reference to Exhibit 10.29 to Registrant’s Annual Report on Form 10-K (File No. 001-13283) filed on February 29, 2008). * |
(10.4.1) | Form of Agreement for Deferred Common Stock Unit Grants under the Penn Virginia Corporation Fifth Amended and Restated 1995 Directors’ Compensation Plan (incorporated by reference to Exhibit 10.30 to Registrant’s Annual Report on Form 10-K (File No. 001-13283) filed on February 29, 2008).* |
(10.5) | Penn Virginia Corporation 2013 Amended and Restated Long-Term Incentive Plan (incorporated by reference to Exhibit 10.1 to Registrant’s Current Report on Form 8-K (File No. 001-13283) filed on May 3, 2013).* |
(10.5.1) | Form of Agreement for Restricted Stock Unit Awards under the Penn Virginia Corporation 2013 Amended and Restated Long-Term Incentive Plan (incorporated by reference to Exhibit 10.2 to Registrant’s Current Report on Form 8-K (File No. 001-13283) filed on May 3, 2013).* |
(10.5.2) | Form of Agreement for Performance Based Restricted Stock Unit Awards under the Penn Virginia Corporation 2013 Amended and Restated Long-Term Incentive Incentive Plan (incorporated by reference to Exhibit 10.3 to Registrant’s Current Report on Form 8-K (File No. 001-13283) filed on May 3, 2013).* |
(10.5.3) | Form of Agreement for Stock Option Grants under the Penn Virginia Corporation Amended and Restated 2013 Long-Term Incentive Plan (incorporated by reference to Exhibit 10.4 to Registrant’s Current Report on Form 8-K (File No. 001-13283) filed on May 3, 2013).* |
(10.5.4) | Form of Agreement for Deferred Common Stock Unit Awards under the Penn Virginia Corporation 2013 Amended and Restated Long-Term Incentive Plan (incorporated by reference to Exhibit 10.1 to Registrant’s Current Report on Form 8-K (File No. 001-13283) filed on July 30, 2013).* |
(10.5.5) | 2014 Form of Agreement for Restricted Stock Unit Awards under the Penn Virginia Corporation 2013 Amended and Restated Long-Term Incentive Plan (previously filed as Exhibit 10.5.5 to the Annual Report on Form 10-K (File No. 001-13283) originally filed on February 25, 2015).* |
32
(10.5.6) | 2014 Form of Agreement for Performance Based Restricted Stock Unit Awards under the Penn Virginia Corporation 2013 Amended and Restated Long-Term Incentive Incentive Plan (previously filed as Exhibit 10.5.6 to the Annual Report on Form 10-K(File No. 001-13283) originally filed on February 25, 2015).* |
(10.5.7) | 2014 Form of Agreement for Stock Option Grants under the Penn Virginia Corporation Amended and Restated 2013 Long-Term Incentive Plan (previously filed as Exhibit 10.5.7 to the Annual Report on Form 10-K (File No. 001-13283) originally filed on February 25, 2015).* |
(10.6) | Amended and Restated Executive Change of Control Severance Agreement dated December 20, 2012 between Penn Virginia Corporation and H. Baird Whitehead (incorporated by reference to Exhibit 10.1 to Registrant’s Current Report on Form 8-K (File No. 001-13283) filed on December 21, 2012).* |
(10.7) | Amended and Restated Executive Change of Control Severance Agreement dated December 20, 2012 between Penn Virginia Corporation and Nancy M. Snyder (incorporated by reference to Exhibit 10.2 to Registrant’s Current Report on Form 8-K (File No. 001-13283) filed on December 21, 2012).* |
(10.8) | Amended and Restated Executive Change of Control Severance Agreement dated December 20, 2012 between Penn Virginia Corporation and Steven A. Hartman (incorporated by reference to Exhibit 10.3 to Registrant’s Current Report on Form 8-K (File No. 001-13283) filed on December 21, 2012).* |
(10.9) | Executive Change of Control Severance Agreement dated January 29, 2013 between Penn Virginia Corporation and John A. Brooks (incorporated by reference to Exhibit 10.1 to Registrant’s Current Report on Form 8-K (File No. 001-13283) filed on February 1, 2013). * |
(10.10) | Amended and Restated Change of Location Severance Agreement dated December 20, 2012 between Penn Virginia Corporation and Nancy M. Snyder (incorporated by reference to Exhibit 10.4 to Registrant’s Current Report on Form 8-K (File No. 001-13283) filed on December 21, 2012).* |
(10.11) | Penn Virginia Corporation Amended and Restated Annual Incentive Cash Bonus and Long-Term Equity Compensation Guidelines (incorporated by reference to Exhibit 10.1 to Registrant’s Current Report on Form 8-K/A (File No. 001-13283) filed on February 19, 2014).* |
(10.12) | Purchase and Sale Agreement dated December 13, 2013, by and among Penn Virginia Oil & Gas, L.P., Ted Collins, Jr., Plein Sud Holdings, LLC as sellers and HPIP LaVaca, LLC as buyer (incorporated by reference to Exhibit 10.14 to Registrant’s Annual Report on Form 10-K (previously filed as an exhibit to the Annual Report on Form 10-K (File No. 001-13283) filed on February 24, 2014). |
(10.13) | Construction and Field Gathering Agreement dated July 30, 2014 by and between Penn Virginia Oil & Gas, L.P. and Republic Midstream, LLC (incorporated by reference to Exhibit 10.1 to Registrant’s Quarterly Report on Form 10-Q (File No. 001-13283)filed on October 29, 2014). |
(12.1) | Statement of Computation of Ratio of Earnings to Fixed Charges and Preferred Dividends Calculation (previously filed as Exhibit 12.1 to the Annual Report on Form 10-K (File No. 001-13283) originally filed on February 25, 2015). |
(21.1) | Subsidiaries of Penn Virginia Corporation (previously filed as Exhibit 21.1 to the Annual Report on Form 10-K (File No. 001-13283) originally filed on February 25, 2015). |
(23.1) | Consent of Wright & Company, Inc. (filed herewith). |
(31.1) | Certification Pursuant to 18 U.S.C. Section 1350, as Adopted Pursuant to Section 302 of the Sarbanes-Oxley Act of 2002 (previously filed as Exhibit 31.1 to the Annual Report on Form 10-K (File No. 001-13283) originally filed on February 25, 2015). |
(31.2) | Certification Pursuant to 18 U.S.C. Section 1350, as Adopted Pursuant to Section 302 of the Sarbanes-Oxley Act of 2002 (previously filed as Exhibit 31.2 to the Annual Report on Form 10-K (File No. 001-13283) originally filed on February 25, 2015). |
(31.3) | Certification Pursuant to 18 U.S.C. Section 1350, as Adopted Pursuant to Section 302 of the Sarbanes-Oxley Act of 2002 (filed herewith). |
(31.4) | Certification Pursuant to 18 U.S.C. Section 1350, as Adopted Pursuant to Section 302 of the Sarbanes-Oxley Act of 2002 (filed herewith). |
(32.1) | Certification Pursuant to 18 U.S.C. Section 1350, as Adopted Pursuant to Section 906 of the Sarbanes-Oxley Act of 2002(previously filed as Exhibit 32.1 to the Annual Report on Form 10-K (File No. 001-13283) originally filed on February 25, 2015). |
(32.2) | Certification Pursuant to 18 U.S.C. Section 1350, as Adopted Pursuant to Section 906 of the Sarbanes-Oxley Act of 2002(previously filed as Exhibit 32.2 to the Annual Report on Form 10-K (File No. 001-13283) originally filed on February 25, 2015). |
(99.1) | Report of Wright & Company, Inc. dated January 9, 2015 concerning evaluation of oil and gas reserves (previously filed as Exhibit 99.1 to the Annual Report on Form 10-K (File No. 001-13283) originally filed on February 25, 2015). |
(101.INS) | XBRL Instance Document (previously filed as Exhibit 101.INS to the Annual Report on Form 10-K (File No. 001-13283) originally filed on February 25, 2015). |
33
(101.SCH) | XBRL Taxonomy Extension Schema Document (previously filed as Exhibit 101.SCH to the Annual Report on Form 10-K (File No. 001-13283) originally filed on February 25, 2015). |
(101.CAL) | XBRL Taxonomy Extension Calculation Linkbase Document (previously filed as Exhibit 101.CAL to the Annual Report on Form 10-K (File No. 001-13283) originally filed on February 25, 2015). |
(101.DEF) | XBRL Taxonomy Extension Definition Linkbase Document (previously filed as Exhibit 101.DEF to the Annual Report on Form 10-K (File No. 001-13283) originally filed on February 25, 2015). |
(101.LAB) | XBRL Taxonomy Extension Label Linkbase Document (previously filed as Exhibit 101.LAB to the Annual Report on Form 10-K (File No. 001-13283) originally filed on February 25, 2015). |
(101.PRE) | XBRL Taxonomy Extension Presentation Linkbase Document (previously filed as Exhibit 101.PRE to the Annual Report on Form 10-K (File No. 001-13283) originally filed on February 25, 2015). |
_________________________
* | Management contract or compensatory plan or arrangement. |
34
SIGNATURES
Pursuant to the requirements of Section 13 or 15(d) of the Securities Exchange Act of 1934, the Registrant has duly caused this report to be signed on its behalf by the undersigned, thereunto duly authorized.
PENN VIRGINIA CORPORATION | ||
By: | /s/ STEVEN A. HARTMAN | |
Steven A. Hartman | ||
Senior Vice President and Chief Financial Officer | ||
July 15, 2015 | By: | /s/ JOAN C. SONNEN |
Joan C. Sonnen | ||
Vice President, Chief Accounting Officer and Controller | ||
(Principal Accounting Officer) | ||
35