Attached files
| file | filename |
|---|---|
| 8-K - NEW JERSEY RESOURCES CORP | c81758_8k.htm |
Exhibit 99.1

A CHAT WITH THE NEW YORK INVESTMENT COMMUNITY New Jersey Natural Gas – Marketing and Customer Growth Thomas J. Massaro – Vice President, Marketing and Energy Efficiency Mark R. Sperduto – Senior Vice President, Regulatory Affairs June 23, 2015

Regarding Forward - Looking Statements 2 Certain statements contained in this presentation are forward - looking statements within the meaning of the Private Securities Litigation Reform Act of 1995 . New Jersey Resources (NJR or the Company) cautions readers that the assumptions forming the basis for forward - looking statements include many factors that are beyond NJR’s ability to control or estimate precisely, such as estimates of future market conditions and the behavior of other market participants . Words such as “anticipates,” “estimates,” “expects,” “projects,” “may,” “will,” “intends,” “plans,” “believes,” “should” and similar expressions may identify forward - looking information and such forward - looking statements are made based upon management’s current expectations and beliefs as of this date concerning future developments and their potential effect upon NJR . There can be no assurance that future developments will be in accordance with management’s expectations or that the effect of future developments on NJR will be those anticipated by management . Forward - looking information in this presentation includes, but is not limited to, certain statements regarding NJR's NFE guidance for fiscal 2015 , forecasted contribution of business segments to fiscal 2015 NFE and to NFE beyond fiscal 2015 , future NJNG customer growth, future capital expenditures and infrastructure investments, NJR’s cash flow forecast, the long - term outlook for NJRCEV, diversification of NJRCEV’s strategy, NJRCEV’s future solar and wind projects, and the PennEast Pipeline project . The factors that could cause actual results to differ materially from NJR’s expectations include, but are not limited to, weather and economic conditions ; demographic changes in the NJNG service territory and their effect on NJNG's customer growth ; volatility of natural gas and other commodity prices and their impact on NJNG customer usage, NJNG's Basic Gas Supply Service (BGSS) incentive programs, NJRES' operations and on the Company's risk management efforts ; changes in rating agency requirements and/or credit ratings and their effect on availability and cost of capital to the Company ; the impact of volatility in the credit markets ; the ability to comply with debt covenants ; the impact to the asset values and resulting higher costs and funding obligations of NJR's pension and post employment benefit plans as a result of downturns in the financial markets, a lower discount rate, revised actuarial assumptions, and impacts associated with the Patient Protection and Affordable Care Act ; accounting effects and other risks associated with hedging activities and use of derivatives contracts ; commercial and wholesale credit risks, including the availability of creditworthy customers and counterparties and liquidity in the wholesale energy trading market ; regulatory approval of NJNG’s planned infrastructure programs ; the ability to obtain governmental and regulatory approvals, land - use rights, electric grid interconnection (in the case of distributed power projects) and/or financing for the construction, development and operation of NJR’s energy investments and NJNG’s infrastructure projects in a timely manner ; risks associated with the management of the Company's joint ventures and partnerships ; risks associated with our investments in distributed power projects, including the availability of regulatory and tax incentives, the availability of viable projects and NJR's eligibility for ITCs and PTCs, the future market for SRECs (including the pace of solar project development in New Jersey), and operational risks related to projects in service ; timing of qualifying for ITCs and PTCs due to delays or failures to complete planned solar and wind energy projects and the resulting effect on our effective tax rate and earnings ; the level and rate at which NJNG's costs and expenses are incurred and the extent to which they are allowed to be recovered from customers through the regulatory process ; the possible expiration of the BGSS incentive programs ; access to adequate supplies of natural gas and dependence on third - party storage and transportation facilities for natural gas supply ; operating risks incidental to handling, storing, transporting and providing customers with natural gas ; risks related to our employee workforce ; the regulatory and pricing policies of federal and state regulatory agencies ; the costs of compliance with present and future environmental laws, including potential climate change - related legislation ; risks related to changes in accounting standards ; the disallowance of recovery of environmental - related expenditures and other regulatory changes ; environmental - related and other litigation and other uncertainties ; risks related to cyber - attack or failure of information technology systems ; and the impact of natural disasters, terrorist activities, and other extreme events on our operations and customers, including any impacts to utility gross margin, and restoration costs . The aforementioned factors are detailed in the “Risk Factors” sections of our Annual Report on Form 10 - K filed on November 25 , 2014 , as filed with the Securities and Exchange Commission (SEC), which is available on the SEC’s website at sec . gov . Information included in this presentation is representative as of today only and while NJR periodically reassesses material trends and uncertainties affecting NJR's results of operations and financial condition in connection with its preparation of management's discussion and analysis of results of operations and financial condition contained in its Quarterly and Annual Reports filed with the SEC, NJR does not, by including this statement, assume any obligation to review or revise any particular forward - looking statement referenced herein in light of future events .

Disclaimer Regarding Non - GAAP Financial Measures 3 This presentation includes the non - GAAP measures net financial earnings (NFE), utility gross margin and financial margin . As indicators of the Company’s operating performance, these measures should not be considered alternatives to, or more meaningful than, GAAP measures, such as cash flow, net income, operating income or earnings per share . NFE (loss) and financial margin exclude unrealized gains or losses on derivative instruments related to the company’s unregulated subsidiaries and certain realized gains and losses on derivative instruments related to natural gas that has been placed into storage at NJRES . Volatility associated with the change in value of these financial and physical commodity contracts is reported in the income statement in the current period . In order to manage its business, NJR views its results without the impacts of the unrealized gains and losses, and certain realized gains and losses, caused by changes in value of these financial instruments and physical commodity contracts prior to the completion of the planned transaction because it shows changes in value currently as opposed to when the planned transaction ultimately is settled . An annual estimated effective tax rate is calculated for NFE purposes and any necessary quarterly tax adjustment is applied to NJRCEV, as such adjustment is related to tax credits generated by NJRCEV . NJNG’s utility gross margin represents the results of revenues less natural gas costs, sales and other taxes and regulatory rider expenses, which are key components of the company’s operations that move in relation to each other . Natural gas costs, sales and other taxes and regulatory rider expenses are passed through to customers and, therefore, have no effect on gross margin . Management uses NFE, utility gross margin and financial as supplemental measures to other GAAP results to provide a more complete understanding of the Company’s performance . Management believes these non - GAAP measures are more reflective of the Company’s business model, provide transparency to investors and enable period - to - period comparability of financial performance . For a full discussion of our non - GAAP financial measures, please see NJR’s most recent Form 10 - K, Item 7 . This information has been provided pursuant to the requirements of SEC Regulation G .

NJR Business Segment NFEPS Contributions; Updated Fiscal 2015 NFEPS Guidance to $1.65 - $1.75 from $1.60 - $1.70 4 New Jersey Natural Gas NJR Clean Energy Ventures NJR Energy Services NJR Midstream NJR Home Services » NJR expects regulated businesses to contribute 55 to 70 percent of fiscal 2015 NFE » NJRES exceeding fiscal 2015 expectations $1.45 - $1.55 $1.60 - $1.70 $1.65 - $1.75 $0.00 $0.50 $1.00 $1.50 $2.00 Original Previous Current

Our Growth and Earnings Strategy » Increased regulated infrastructure investments drive safe, reliable service and anchors our business portfolio x NJNG drives our long - term growth x PennEast Pipeline » Provide customers with cost - efficient renewable electricity, while reducing ITC reliance x Portfolio diversification » Provide physical and producer services to a variety of natural gas market participants » Steady contributions from NJR Home Services 5 Long - term average annual NFE growth goal remains 5 to 9 percent Fundamentals provide the opportunity to achieve top quartile total return performance

C apital Investment Plan 6 • Solar investment for residential and commercial projects in Q1Fiscal 2017 estimated at $33.2 million. Plan assumes $25.6 million beyond December 31, 2016, assuming appropriate economics allow. ($MM) 2015E 2015A (FYTD) 2016E 2017E Total Immediate Return NJNG Customer Growth $33.9 $18.5 $26.9 $27.0 $87.8 Yes Maintenance/Other 66.9 31.7 54.4 56.2 177.5 AIP/SAFE 41.2 11.8 39.0 2.4 82.6 Yes Superstorm Sandy 5.0 1.1 - - 5.0 NGV Fueling Stations 4.2 2.4 - - 4.2 Yes NJ RISE 7.0 0.2 14.7 27.0 48.7 Yes Liquefaction Project 11.9 6.4 11.8 - 23.7 Southern Reliability 19.3 - 86.9 41.3 147.5 SAVEGREEN 30.4 13.3 - - 30.4 Yes Subtotal NJNG $219.8 $85.4 $233.7 $153.9 $607.4 NJRCEV Solar* $102.2 $31.1 $74.3 $58.8 $235.3 Onshore Wind 96.4 58.8 83.0 - 179.4 Subtotal NJRCEV $198.6 $89.9 $157.3 $58.8 $414.7 TOTAL NJR $418.4 $175.3 $391.0 $212.7 $1,022.1
![]()
Current Cash Flow Forecast 7 Incremental NJRES earnings used to reduce the need for future equity, while credit metrics expected to support current ratings ($MM) 2015F 2016E 2017E Cash Flow from Operations $271.1 $237.5 $258.5 Uses of Funds Capital expenditures - NJNG ($189.4) ($233.7) ($153.9) Capital expenditures - PennEast (12.3) (47.9) (124.5) Capital expenditures - CEV (198.6) (157.3) (58.8) Dividends (76.1) (81.0) (87.0) Total Uses of Funds ($476.4) ($519.9) ($424.2) Financing Activities Common stock proceeds, net $30.0 $10.0 $10.0 Debt proceeds, net 175.3 272.4 155.7 Total Financing Activities $205.3 $282.4 $165.7

New Jersey Natural Gas: The Foundation of Our Business » Growing customer base – serving more than 512,000 residential and commercial customers x New construction continues to expand x Strong conversion market » Infrastructure investments to strengthen distribution and transmission system are supported by regulatory mechanisms » History of collaborative regulatory relationships » 22 consecutive years with fewest customer complaints with the New Jersey Board of Public Utilities of major electric and gas companies » Excellent safety record 8 NJNG’s strong fundamentals drive the majority of earnings growth

NJRES: Generated NFE Every Year Since 1995 » Serves wholesale customers across North America » Diverse portfolio of physical natural gas assets » Firm storage (~40 Bcf in the US and Canada) » Firm transportation ( 1.4 Bcf/day) » NJRES’ good results driven by: x Periods of cold weather which created short term increases in natural gas demand and price volatility which generated higher than expected margin . x While not as extreme as last year, 2015 has also been colder than normal creating opportunities for NJRES, particularly in the daily natural gas markets. » NJRES expected to contribute 5 to 15 percent of total NFE in fiscal 2016 and beyond. 9 $179.3 $98.8 $94.5 $52.8 $0 $20 $40 $60 $80 $100 $120 $140 $160 $180 $200 FY2Q14 FY2Q15 $MM Financial Margin NFE

PennEast Pipeline 10 » 115 - mile , 36 - inch pipeline connecting Northeast Marcellus supply to Northeast markets » Contracted volume up to 1,000,000 dth/day » Total capex $1 billion » Current ownership: NJR, GAS, SJI, UGI at 20 percent and PEG and SE at 10 percent » Open season concluded August 29 – 1,085k/d » Pre - filed with FERC October 2014 » File full 7(c) with FERC July 2015 » Construction commences April 2017 » Commercial operation late 2017

NJRCEV: Continued Portfolio Diversification Commercial Solar » 20 projects in service » 72.4 MW » Projects include roof - and ground - mounted installations, both grid - connected and net - metered Residential Solar - The Sunlight Advantage ® » Second largest residential solar provider in New Jersey » 3,400 customers added since inception » 30+ MW Onshore Wind » Two Dot - 9.7 MW, Montana – In service » Carroll Area – 20 MW, Iowa – In service » Alexander Wind Farm – 48 MW, Kansas – Under construction 11 Total of 132.2 MW installed; 23 percent of portfolio now wind assets

Our ITC Transition Plan » Expected drop in ITC to 10 percent – January 1, 2017 » Our plan: x Continued solar investment drives production of Solar Renewable Energy Certificates (SRECs) – NJRCEV forecasts annual SREC production to grow in excess of 194,000 in fiscal 2017 x Onshore wind investment generates steady earnings from long - term power purchase agreements (PPAs), financial hedges and production - based tax credits (PTCs) x Solar capital expenditures decline beginning in fiscal 2016 x Simultaneously • NJNG fundamentals and base rate case should result in strong growth in fiscal 2017 • Stable earnings from NJRES, Midstream and Home Services 12

A Growing Service Area 13 0.0% 5.0% 10.0% 15.0% N.J. Morris Monmouth Ocean 1.2% 6.2% 2.3% 14.1% Population Change 2000 - 2013* Monmouth 43% Ocean 44% Middlesex/ Burlington 1% Morris 12% Service Territory Customer Breakdown Our service territory is among the fastest growing in the state w ith Ocean County accounting for half our growth * Source: US Census data, 2013 estimates
Our Marketing Strategy » Our marketing strategy is based on our competitive advantages » Why are we growing faster than other companies? x Demographics • Median household income above national average • Median home value above the national average x Geographic proximity • About an hour’s commute to NYC or Philadelphia x Price Advantage • Natural gas enjoys a healthy price advantage over competing fuels 14

Value for Customers 15 $0.00 $1.00 $2.00 $3.00 $4.00 $5.00 NJNG Fuel Oil Propane Electricity $0.92 $2.45 $4.08 $4.10 Source: US Energy Information Administration Data as of March 2015. Based on 100,000 comparable BTUs NJNG enjoys a distinct price advantage in our service area
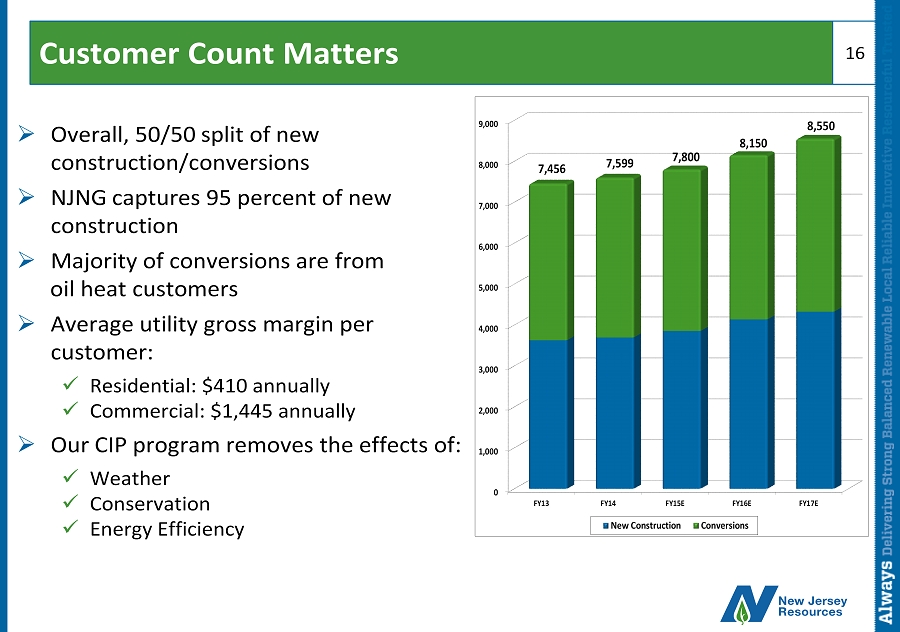
Customer Count Matters » Overall, 50/50 split of new construction/conversions » NJNG captures 95 percent of new construction » Majority of conversions are from oil heat customers » Average utility gross margin per customer: x Residential: $410 annually x Commercial: $1,445 annually » Our CIP program removes the effects of: x Weather x Conservation x Energy Efficiency 16 0 1,000 2,000 3,000 4,000 5,000 6,000 7,000 8,000 9,000 FY13 FY14 FY15E FY16E FY17E 7,456 7,599 7,800 8,150 8,550 New Construction Conversions
![]()
Residential New Construction 17 » Strong relationships with planning officials, builders, and developers to promote the benefits of natural gas » Utilize internal and external sources to forecast new construction » There are 200 developments in our “land - bank”, which represent 26,639 potential new meters » Natural gas remains the preferred fuel in the multi - family market » Additionally, the “spot lot” market adds about 700 customers annually

Conversion Market » Aggressive marketing to communities using a mix of fuels including oil, electric and propane » To encourage conversions: x Fuel cost comparisons x Promote high - efficiency rebates and incentives x Partner with contractors, community organizations, and municipalities » P rescreening for targets based on: x Demographics x Proximity to existing mains x Current fuels 18 Source: Harte Hanks

Evolution of a Community Conversion Customer 19 Install meter sets for new customer additions Install mains and services Work order/permitting/easement preparation Hit conversion sales goal for productive community conversion project HVAC contractor interaction / Marketing follow up and enlist “street captains” Present NJ Natural Gas Advantage Program at Clubhouse Screen and qualify community/meet with Owner/Board of Trustees Month Step 1 2 3 4 5 6 7
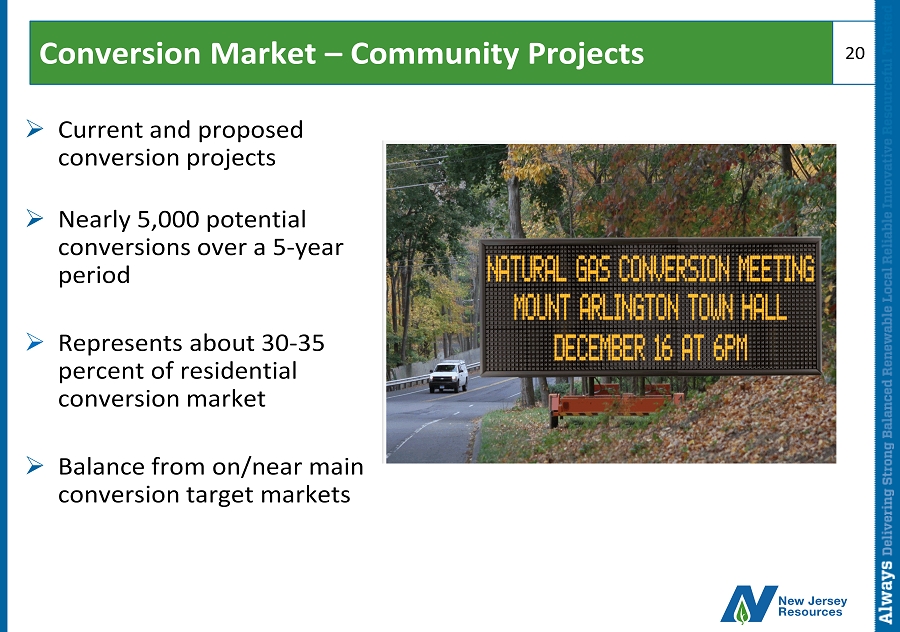
Conversion Market – Community Projects 20 » Current and proposed conversion projects » Nearly 5,000 potential conversions over a 5 - year period » Represents about 30 - 35 percent of residential conversion market » Balance from on/near main conversion target markets

Key Trends Support Future Customer Growth 21 2015 - 2017, 10,920 2018 - Build Out, 74,922 New Construction 1 Total = 85,842 1. Source: A.D. Little Non Heat 6,900 On Main 36,322 Near Main 28,974 Off Main 47,840 Conversions 2 Total = 120,036 2. Source: NJNG Marketing » NJNG expects annual new customer growth rate to average 1.6 percent through FY2017 » NJNG captures 95 percent of new construction » Conversions are expected to represent half of new customer additions

Our Path to Continued Growth 22 Fiscal 2015 NJNG x Customer growth x CIP x BGSS incentives x SAVEGREEN x SAFE x NJ RISE x SRL Energy Services x Physical natural gas services x Producer services Clean Energy x Portfolio diversification x More SRECs; improved prices x Expanded wind investments Midstream x PennEast FERC filing Fiscal 2016 NJNG x Base Rate Case x Liquefaction plant in service Midstream x PennEast FERC certificate issued Clean Energy x Decreasing solar investment x More SRECs; stable prices x Expanded wind investments Fiscal 2017 NJNG x New base rates x SRL in service Midstream x PennEast FERC final approval Clean Energy x More SRECs, stable prices x Increased earnings from wind and SREC sales x ITC declines to 10 percent x Lower solar investment Fiscal 2018 NJNG x NJ RISE (post rate case) x SAFE (post rate case) Midstream x PennEast Pipeline in service Clean Energy x Residential solar continues