Attached files
| file | filename |
|---|---|
| 8-K - 8-K - Xenia Hotels & Resorts, Inc. | a8-kjune2015investorpresen.htm |
Investor Presentation June 2015
2 Forward-Looking Statements; Non-GAAP Financial Measures This presentation has been prepared by Xenia Hotels & Resorts, Inc. (the “Company” or “Xenia”) solely for informational purposes. This presentation contains, and our responses to various questions from investors may include, “forward-looking statements”within the meaning of the Private Securities Litigation Reform Act of 1995. These statements include statements about our plans, strategies and financial performance, the amount and timing of future cash distributions, our lodging portfolio, \and our prospects and future events. Such statements involve known and unknown risks that are difficult to predict. As a result, our actual financial results, performance, achievements or prospects may differ materially from those expressed or implied by these forward-looking statements. In some cases, you can identify forward-looking statements by the use of words such as “may,” “could,” “expect,” “intend,” “plan,” “seek,” “anticipate,” “believe,” “estimate,” “predict,” “potential,” “continue,” “likely,” “will,” “would,” “illustrative” and variations of these terms and similar expressions, or the negative of these terms or similar expressions. Such forward-looking statements are necessarily based upon estimates and assumptions that, while considered reasonable by the Company and its management based on their knowledge and understanding of the business and industry, are inherently uncertain. These statements are not guarantees of future performance, and stockholders should not place undue reliance on forward-looking statements. Actual results may differ materially from those expressed or forecasted in the forward-looking statements due to a variety of risks, uncertainties and other factors, including but not limited to the factors listed and described under “Risk Factors” in the Company’s most recent Annual Report on Form 10-K, as updated by any subsequent Quarterly Report on Form 10-Q, in each case as filed with the U.S. Securities and Exchange Commission (“SEC”). These factors are not necessarily all of the important factors that could cause our actual financial results, performance, achievements or prospects to differ materially from those expressed in or implied by any of our forward-looking statements. Other unknown or unpredictable factors also could harm our results. All forward-looking statements attributable to us or persons acting on our behalf are expressly qualified in their entirety by the cautionary statements set forth above. Forward-looking statements speak only as of the date they are made, and we do not undertake or assume any obligation to update publicly any of these forward-looking statements to reflect actual results, new information or future events, changes in assumptions or changes in other factors affecting forward-looking statements, except to the extent required by applicable laws. If we update one or more forward- looking statements, no inference should be drawn that we will make additional updates with respect to those or other forward-looking statements. On February 3, 2015, Xenia was spun off from InvenTrust Properties Corp. (“InvenTrust”). Prior to the separation, the Company effectuated certain reorganization transactions which were designed to consolidate the ownership of its hotels into its operating partnership, consolidate its TRS lessees in its TRS, facilitate its separation from InvenTrust, and enable the Company to qualify as a REIT for federal income tax purposes. Unless otherwise indicated or the context otherwise requires, all financial and operating data herein reflect the operations of the Company after giving effect to the reorganization transactions, the disposition of other hotels previously owned by the Company, and the spin-off. Xenia™ and related trademarks, trade names and service marks of Xenia appearing in this presentation are the property of Xenia. Unless otherwise noted, all other trademarks, trade names or service marks appearing in this presentation are the property of their respective owners, including but not limited to Marriott International, Inc., Hilton Worldwide Holdings Inc., Hyatt Hotels Corporation and Starwood Hotels and Resorts Worldwide, Inc., or their respective parents, subsidiaries or affiliates. None of the owners of these trademarks, their respective parents, subsidiaries or affiliates or any of their respective officers, directors, members, managers, shareholders, owners, agents or employees, has any responsibility for the creation or contents of this presentation. This document is not an offer to buy or the solicitation of an offer to sell any securities of the Company.
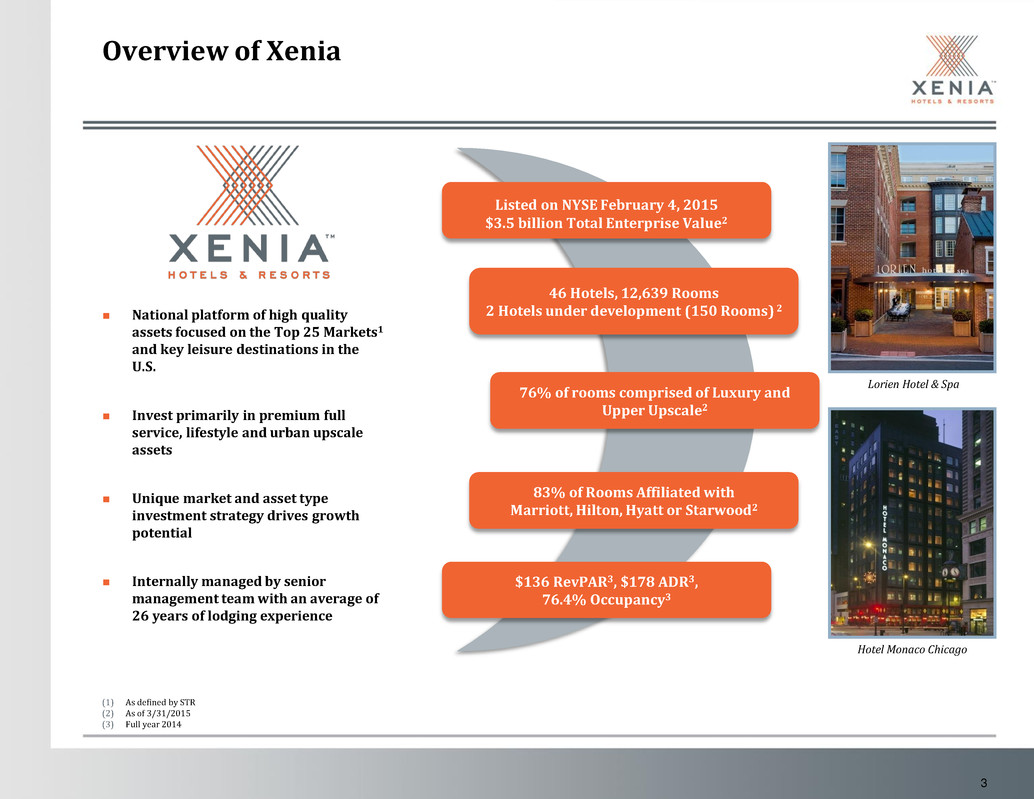
3 Overview of Xenia National platform of high quality assets focused on the Top 25 Markets1 and key leisure destinations in the U.S. Invest primarily in premium full service, lifestyle and urban upscale assets Unique market and asset type investment strategy drives growth potential Internally managed by senior management team with an average of 26 years of lodging experience 46 Hotels, 12,639 Rooms 2 Hotels under development (150 Rooms) 2 76% of rooms comprised of Luxury and Upper Upscale2 $136 RevPAR3, $178 ADR3, 76.4% Occupancy3 83% of Rooms Affiliated with Marriott, Hilton, Hyatt or Starwood2 Hotel Monaco Chicago Lorien Hotel & Spa (1) As defined by STR (2) As of 3/31/2015 (3) Full year 2014 Listed on NYSE February 4, 2015 $3.5 billion Total Enterprise Value2

4 Seasoned Management Team with Strong Governance Marcel Verbaas President & CEO IA Lodging / Xenia CEO since 2007 Previously CIO of CNL Hotels & Resorts Andrew J. Welch EVP & CFO Joined IA Lodging / Xenia as CFO in June 2014 Previously EVP & CFO of FelCor Lodging Trust (NYSE: FCH) Barry A.N. Bloom, Ph.D. EVP & COO Joined IA Lodging / Xenia as COO in July 2013 Previously Co-Founder of Abacus Lodging Investors and EVP of CNL Hotels & Resorts Philip A. Wade SVP & CIO Joined IA Lodging / Xenia as VP of Investments in 2007 Previously with The Procaccianti Group, CNL Hotels & Resorts and PKF Consulting Joseph T. Johnson SVP & CAO Joined Xenia as CAO in May 2015 Previously CFO of CNL Healthcare Properties and CNL Lifestyle Properties Jeffrey H. Donahue Chairman Chairman of Health Care REIT (NYSE: HCN) since April 2014, director of HCN since 1997 Former EVP and CFO of The Rouse Company (NYSE: RSE) Seasoned executive management team along with a strong independent Board led by reputable REIT veteran
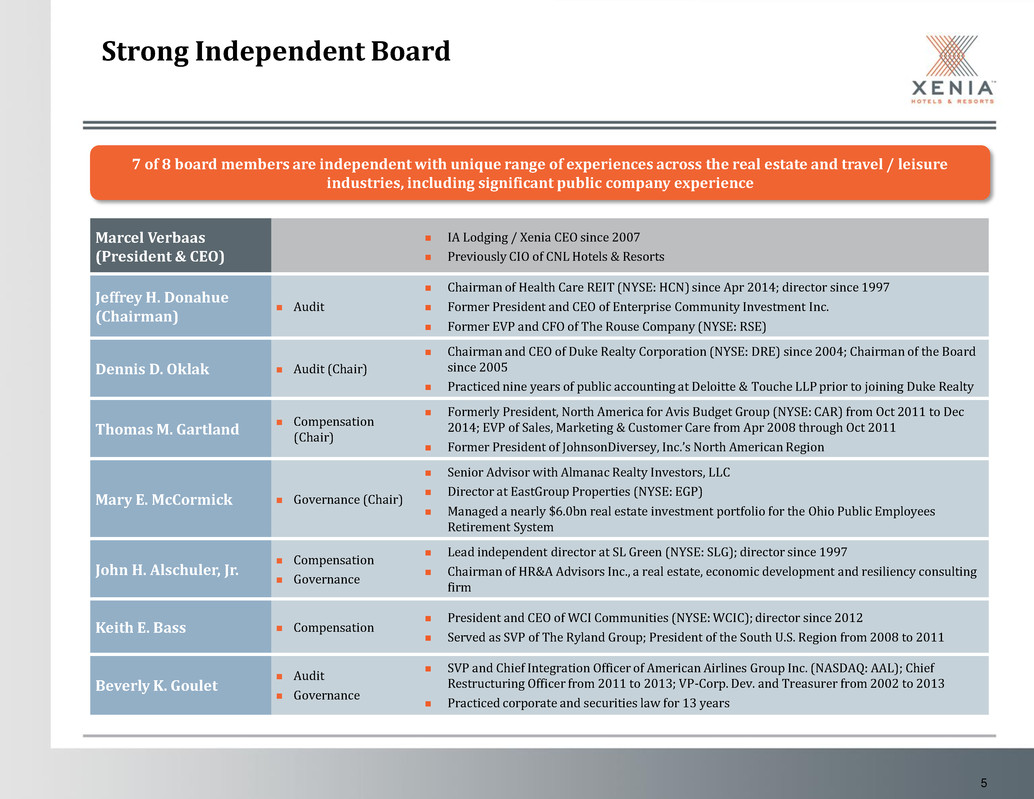
5 Strong Independent Board Marcel Verbaas (President & CEO) IA Lodging / Xenia CEO since 2007 Previously CIO of CNL Hotels & Resorts Jeffrey H. Donahue (Chairman) Audit Chairman of Health Care REIT (NYSE: HCN) since Apr 2014; director since 1997 Former President and CEO of Enterprise Community Investment Inc. Former EVP and CFO of The Rouse Company (NYSE: RSE) Dennis D. Oklak Audit (Chair) Chairman and CEO of Duke Realty Corporation (NYSE: DRE) since 2004; Chairman of the Board since 2005 Practiced nine years of public accounting at Deloitte & Touche LLP prior to joining Duke Realty Thomas M. Gartland Compensation (Chair) Formerly President, North America for Avis Budget Group (NYSE: CAR) from Oct 2011 to Dec 2014; EVP of Sales, Marketing & Customer Care from Apr 2008 through Oct 2011 Former President of JohnsonDiversey, Inc.’s North American Region Mary E. McCormick Governance (Chair) Senior Advisor with Almanac Realty Investors, LLC Director at EastGroup Properties (NYSE: EGP) Managed a nearly $6.0bn real estate investment portfolio for the Ohio Public Employees Retirement System John H. Alschuler, Jr. Compensation Governance Lead independent director at SL Green (NYSE: SLG); director since 1997 Chairman of HR&A Advisors Inc., a real estate, economic development and resiliency consulting firm Keith E. Bass Compensation President and CEO of WCI Communities (NYSE: WCIC); director since 2012 Served as SVP of The Ryland Group; President of the South U.S. Region from 2008 to 2011 Beverly K. Goulet Audit Governance SVP and Chief Integration Officer of American Airlines Group Inc. (NASDAQ: AAL); Chief Restructuring Officer from 2011 to 2013; VP-Corp. Dev. and Treasurer from 2002 to 2013 Practiced corporate and securities law for 13 years 7 of 8 board members are independent with unique range of experiences across the real estate and travel / leisure industries, including significant public company experience

6 Strong Corporate Governance Structure 7 of the 8 members of our board satisfy listing standards for independence of the NYSE Independent Board Chairman Non-staggered board with each director subject to re-election annually No InvenTrust board representation Transition Services Agreement with InvenTrust covering limited services for an estimated cost of $500K to $800K Majority of services under this agreement have been terminated to date Confident in our ability to terminate the balance of the services before the end of this year
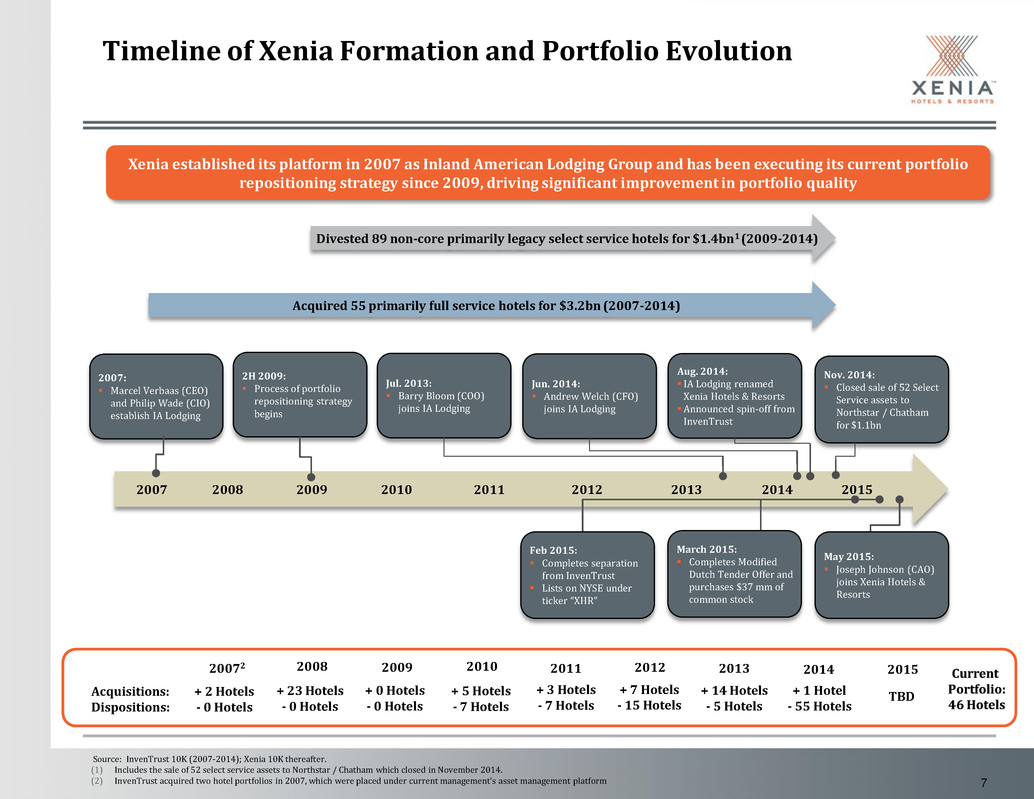
7 Timeline of Xenia Formation and Portfolio Evolution Divested 89 non-core primarily legacy select service hotels for $1.4bn1 (2009-2014) Xenia established its platform in 2007 as Inland American Lodging Group and has been executing its current portfolio repositioning strategy since 2009, driving significant improvement in portfolio quality Acquired 55 primarily full service hotels for $3.2bn (2007-2014) Source: InvenTrust 10K (2007-2014); Xenia 10K thereafter. (1) Includes the sale of 52 select service assets to Northstar / Chatham which closed in November 2014. (2) InvenTrust acquired two hotel portfolios in 2007, which were placed under current management’s asset management platform 2007: Marcel Verbaas (CEO) and Philip Wade (CIO) establish IA Lodging 2H 2009: Process of portfolio repositioning strategy begins Aug. 2014: IA Lodging renamed Xenia Hotels & Resorts Announced spin-off from InvenTrust Jun. 2014: Andrew Welch (CFO) joins IA Lodging Nov. 2014: Closed sale of 52 Select Service assets to Northstar / Chatham for $1.1bn Jul. 2013: Barry Bloom (COO) joins IA Lodging 2007 2008 2009 2010 2011 2012 2013 2014 2015 May 2015: Joseph Johnson (CAO) joins Xenia Hotels & Resorts March 2015: Completes Modified Dutch Tender Offer and purchases $37 mm of common stock Feb 2015: Completes separation from InvenTrust Lists on NYSE under ticker “XHR” Acquisitions: Dispositions: 20072 2008 2009 2010 2011 2012 2013 2014 2015 Current Portfolio: 46 Hotels + 2 Hotels - 0 Hotels + 23 Hotels - 0 Hotels + 0 Hotels - 0 Hotels + 5 Hotels - 7 Hotels + 3 Hotels - 7 Hotels + 7 Hotels - 15 Hotels + 14 Hotels - 5 Hotels + 1 Hotel - 55 Hotels TBD
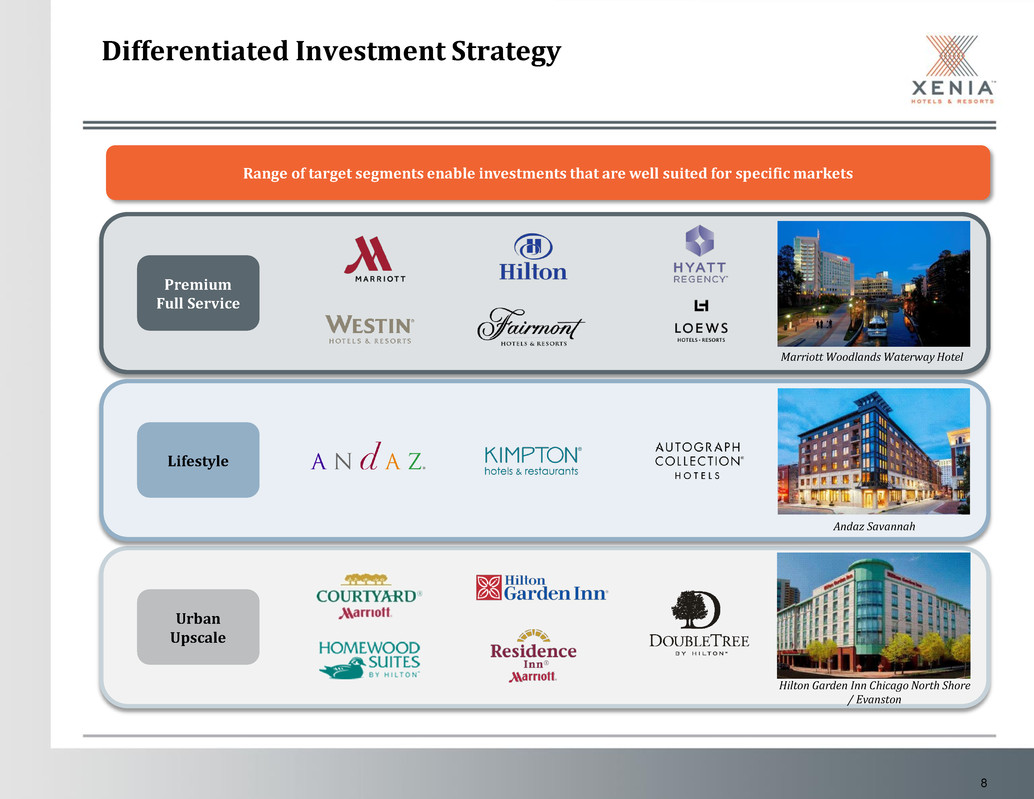
8 Differentiated Investment Strategy Premium Full Service Urban Upscale Lifestyle Andaz Savannah Hilton Garden Inn Chicago North Shore / Evanston Marriott Woodlands Waterway Hotel Range of target segments enable investments that are well suited for specific markets
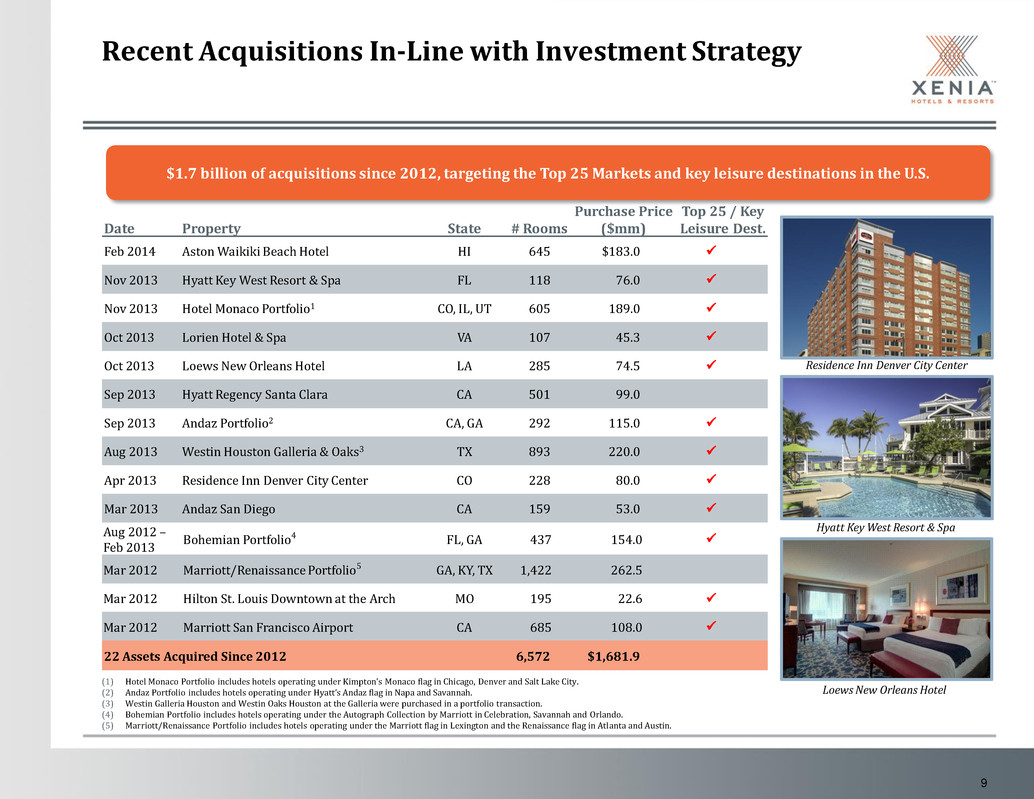
9 (1) Hotel Monaco Portfolio includes hotels operating under Kimpton’s Monaco flag in Chicago, Denver and Salt Lake City. (2) Andaz Portfolio includes hotels operating under Hyatt’s Andaz flag in Napa and Savannah. (3) Westin Galleria Houston and Westin Oaks Houston at the Galleria were purchased in a portfolio transaction. (4) Bohemian Portfolio includes hotels operating under the Autograph Collection by Marriott in Celebration, Savannah and Orlando. (5) Marriott/Renaissance Portfolio includes hotels operating under the Marriott flag in Lexington and the Renaissance flag in Atlanta and Austin. Recent Acquisitions In-Line with Investment Strategy Date Property State # Rooms Purchase Price ($mm) Top 25 / Key Leisure Dest. Feb 2014 Aston Waikiki Beach Hotel HI 645 $183.0 Nov 2013 Hyatt Key West Resort & Spa FL 118 76.0 Nov 2013 Hotel Monaco Portfolio1 CO, IL, UT 605 189.0 Oct 2013 Lorien Hotel & Spa VA 107 45.3 Oct 2013 Loews New Orleans Hotel LA 285 74.5 Sep 2013 Hyatt Regency Santa Clara CA 501 99.0 Sep 2013 Andaz Portfolio2 CA, GA 292 115.0 Aug 2013 Westin Houston Galleria & Oaks3 TX 893 220.0 Apr 2013 Residence Inn Denver City Center CO 228 80.0 Mar 2013 Andaz San Diego CA 159 53.0 Aug 2012 – Feb 2013 Bohemian Portfolio4 FL, GA 437 154.0 Mar 2012 Marriott/Renaissance Portfolio5 GA, KY, TX 1,422 262.5 Mar 2012 Hilton St. Louis Downtown at the Arch MO 195 22.6 Mar 2012 Marriott San Francisco Airport CA 685 108.0 22 Assets Acquired Since 2012 6,572 $1,681.9 $1.7 billion of acquisitions since 2012, targeting the Top 25 Markets and key leisure destinations in the U.S. Residence Inn Denver City Center Hyatt Key West Resort & Spa Loews New Orleans Hotel
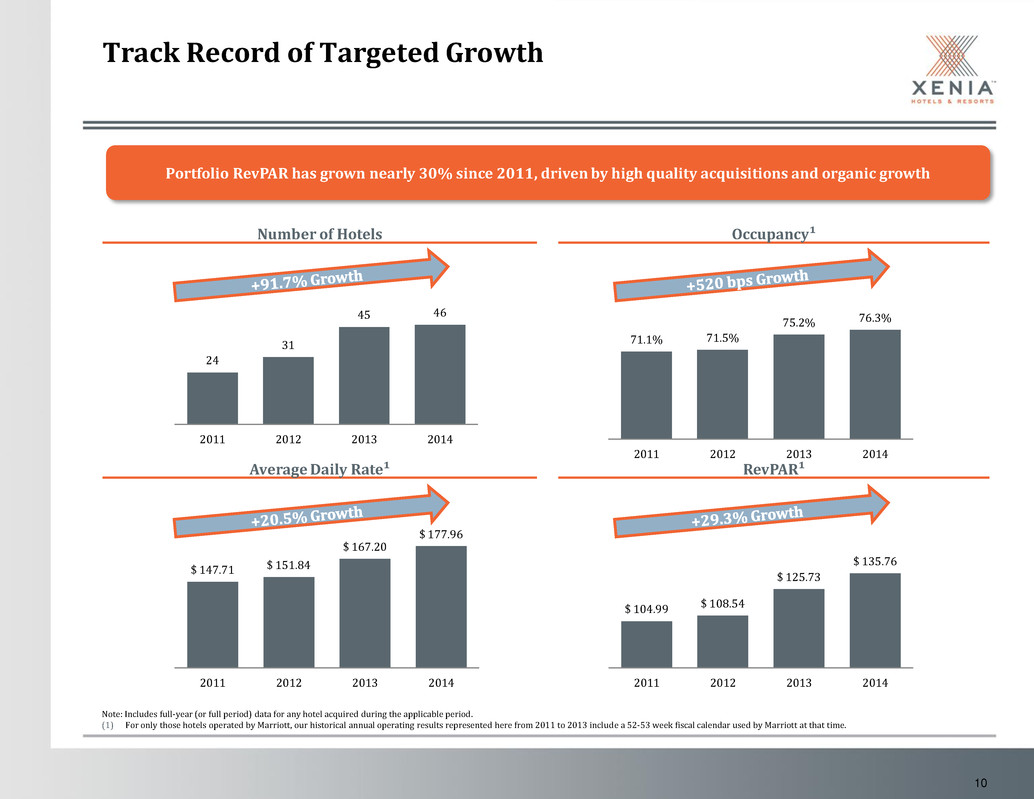
10 Number of Hotels Occupancy¹ Average Daily Rate¹ RevPAR¹ Note: Includes full-year (or full period) data for any hotel acquired during the applicable period. (1) For only those hotels operated by Marriott, our historical annual operating results represented here from 2011 to 2013 include a 52-53 week fiscal calendar used by Marriott at that time. Track Record of Targeted Growth 76.3%75.2% 71.5%71.1% 2014201320122011 4645 31 24 2014201320122011 $ 177.96 $ 167.20 $ 151.84 $ 147.71 2014201320122011 $ 135.76 $ 125.73 $ 108.54 $ 104.99 2014201320122011 Portfolio RevPAR has grown nearly 30% since 2011, driven by high quality acquisitions and organic growth

11 Chain Scale Brand Family Property Managers1 Note: Categories by number of rooms. Totals may not equal 100% due to rounding. (1) Other managers include: Kessler, Concord, Kimpton, Interstate, Loews and White Lodging. Portfolio Overview Upper Upscale 66% Luxury 10% Upscale 22% Upper Midscale 2% High quality, predominantly luxury and upper upscale portfolio affiliated with leading brands and a diversified group of property managers 46% 16% 14% 7% 6% 5% Marriott 32% Hyatt 14% Sage 4% Hilton 9% Aston 5% Other 15% Starwood 7% Urgo 5% Davidson 5% Fairmont 4% 2% 4%
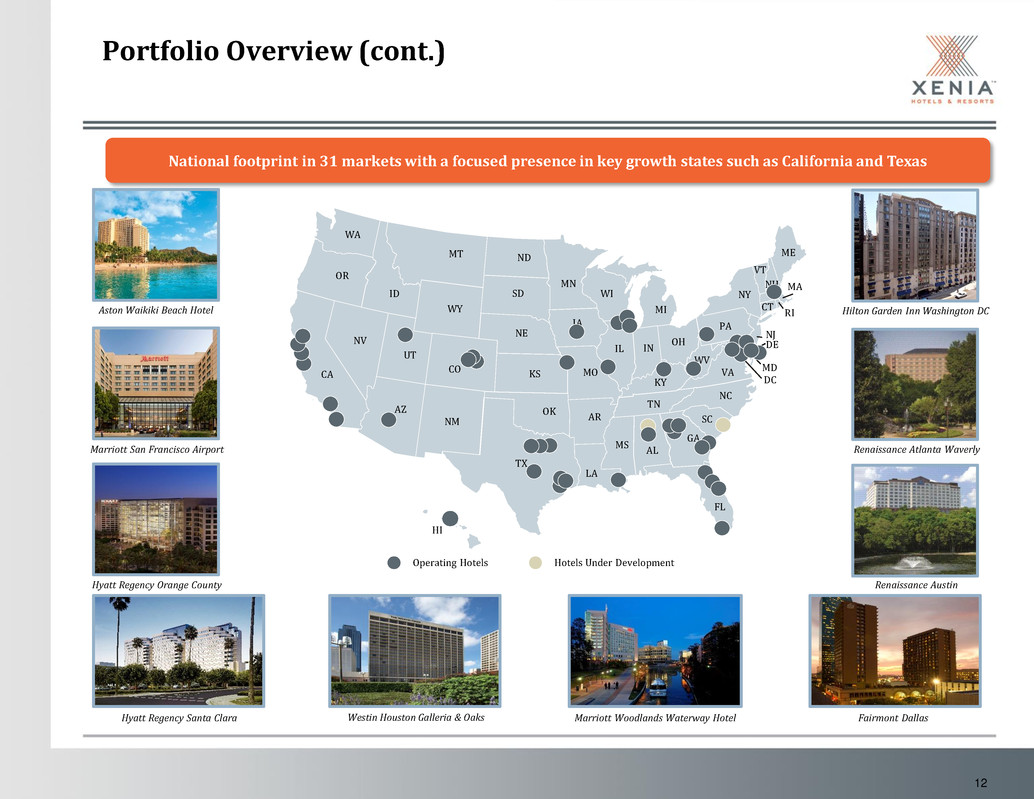
12 Portfolio Overview (cont.) HI FL NM DE MD TX OK KS NE SD NDMT WY CO UT ID AZ NV WA CA OR KY ME NY PA VT NH RI CT WV INIL NC TN SC AL MS AR LA MO IA MN WI NJ GA DC VA OH MI MA Hotels Under DevelopmentOperating Hotels National footprint in 31 markets with a focused presence in key growth states such as California and Texas Marriott Woodlands Waterway HotelWestin Houston Galleria & Oaks Marriott San Francisco Airport Hilton Garden Inn Washington DCAston Waikiki Beach Hotel Fairmont DallasHyatt Regency Santa Clara Renaissance Atlanta Waverly Renaissance AustinHyatt Regency Orange County
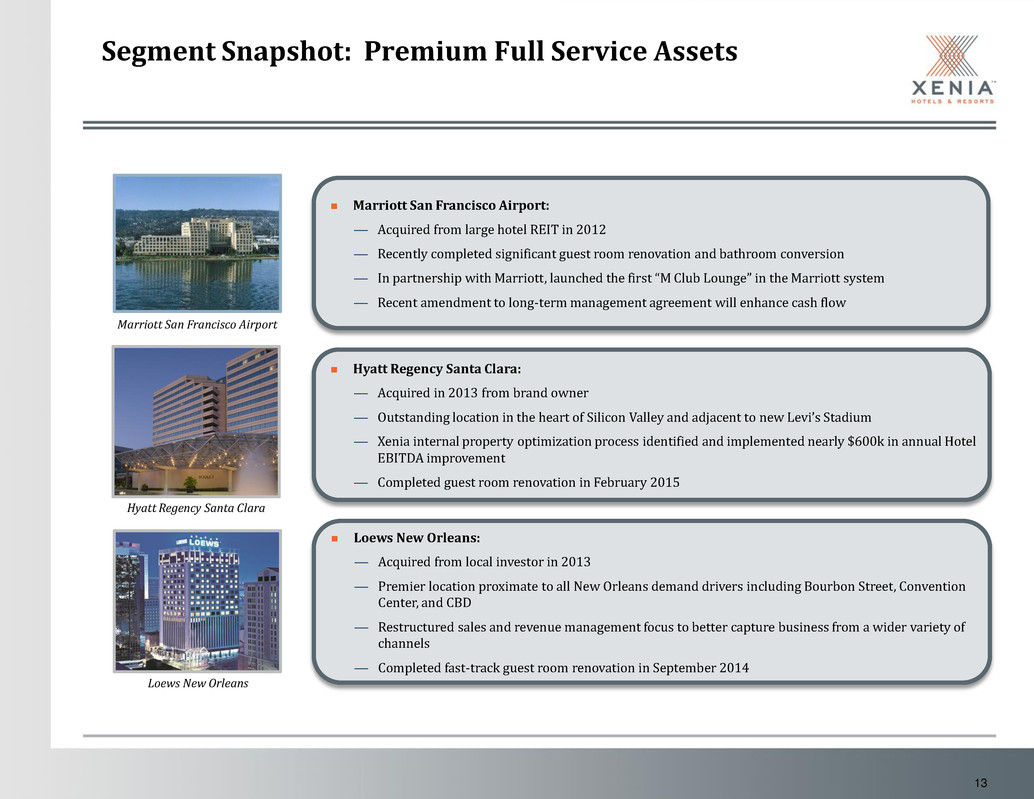
13 Segment Snapshot: Premium Full Service Assets Marriott San Francisco Airport: — Acquired from large hotel REIT in 2012 — Recently completed significant guest room renovation and bathroom conversion — In partnership with Marriott, launched the first “M Club Lounge” in the Marriott system — Recent amendment to long-term management agreement will enhance cash flow Marriott San Francisco Airport Hyatt Regency Santa Clara: — Acquired in 2013 from brand owner — Outstanding location in the heart of Silicon Valley and adjacent to new Levi’s Stadium — Xenia internal property optimization process identified and implemented nearly $600k in annual Hotel EBITDA improvement — Completed guest room renovation in February 2015 Loews New Orleans: — Acquired from local investor in 2013 — Premier location proximate to all New Orleans demand drivers including Bourbon Street, Convention Center, and CBD — Restructured sales and revenue management focus to better capture business from a wider variety of channels — Completed fast-track guest room renovation in September 2014 Hyatt Regency Santa Clara Loews New Orleans
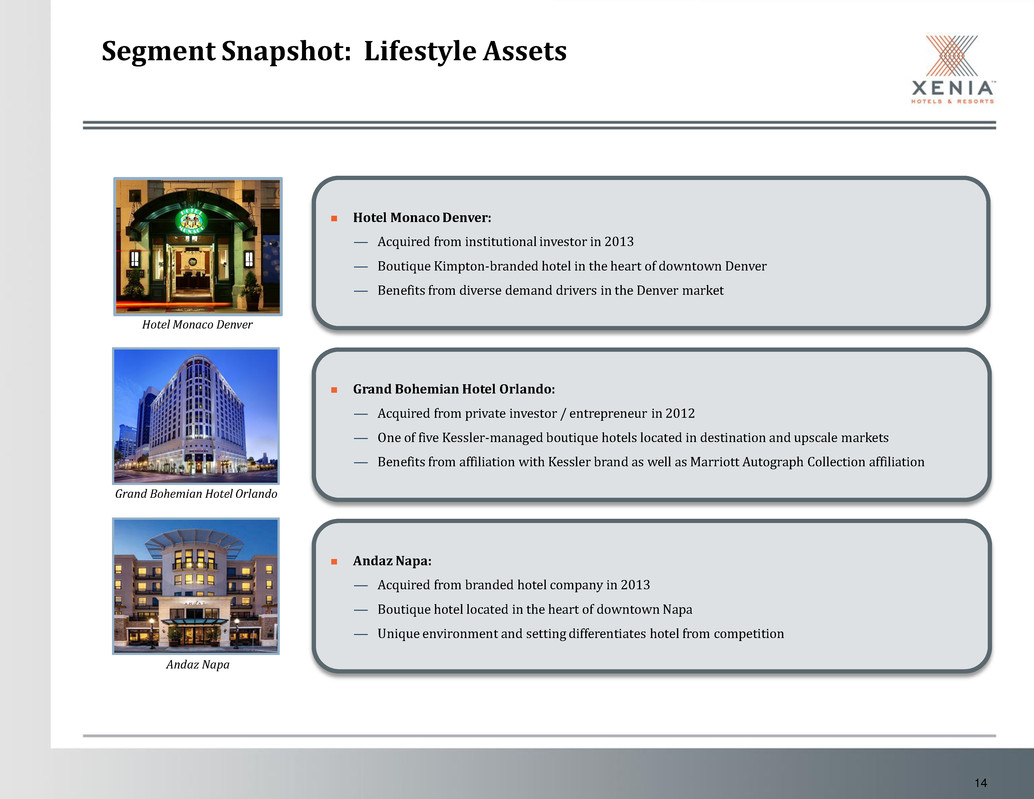
14 Segment Snapshot: Lifestyle Assets Hotel Monaco Denver: — Acquired from institutional investor in 2013 — Boutique Kimpton-branded hotel in the heart of downtown Denver — Benefits from diverse demand drivers in the Denver market Hotel Monaco Denver Grand Bohemian Hotel Orlando: — Acquired from private investor / entrepreneur in 2012 — One of five Kessler-managed boutique hotels located in destination and upscale markets — Benefits from affiliation with Kessler brand as well as Marriott Autograph Collection affiliation Andaz Napa: — Acquired from branded hotel company in 2013 — Boutique hotel located in the heart of downtown Napa — Unique environment and setting differentiates hotel from competition Grand Bohemian Hotel Orlando Andaz Napa
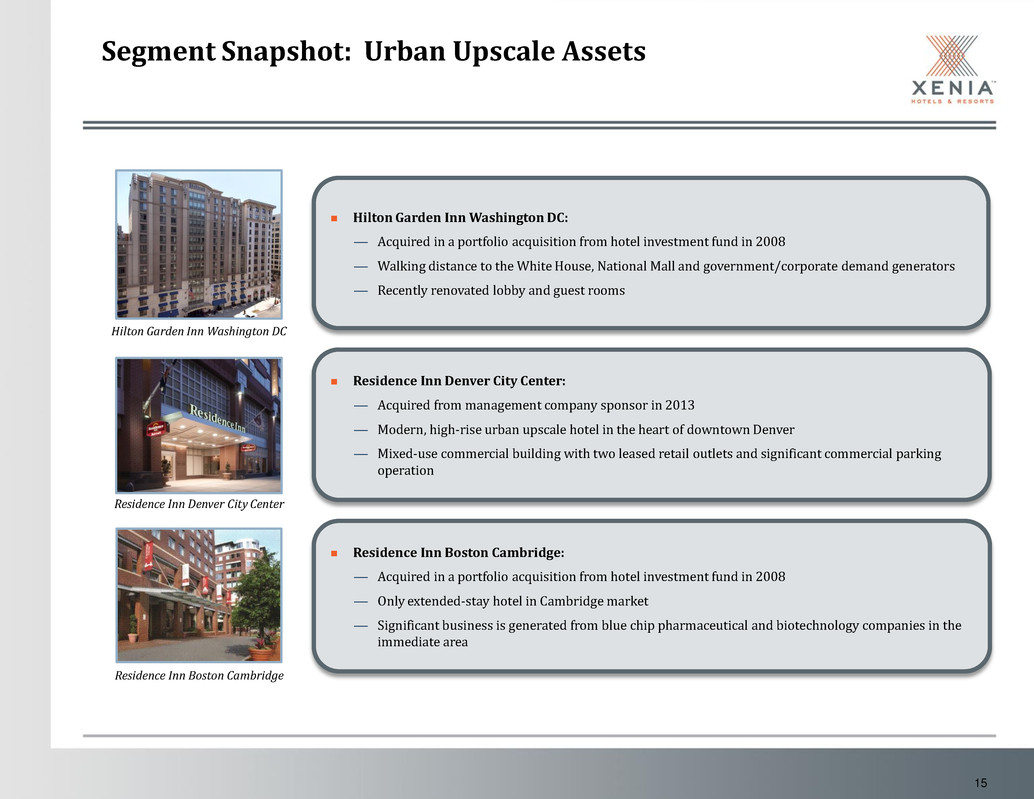
15 Segment Snapshot: Urban Upscale Assets Hilton Garden Inn Washington DC: — Acquired in a portfolio acquisition from hotel investment fund in 2008 — Walking distance to the White House, National Mall and government/corporate demand generators — Recently renovated lobby and guest rooms Hilton Garden Inn Washington DC Residence Inn Denver City Center: — Acquired from management company sponsor in 2013 — Modern, high-rise urban upscale hotel in the heart of downtown Denver — Mixed-use commercial building with two leased retail outlets and significant commercial parking operation Residence Inn Boston Cambridge: — Acquired in a portfolio acquisition from hotel investment fund in 2008 — Only extended-stay hotel in Cambridge market — Significant business is generated from blue chip pharmaceutical and biotechnology companies in the immediate area Residence Inn Denver City Center Residence Inn Boston Cambridge
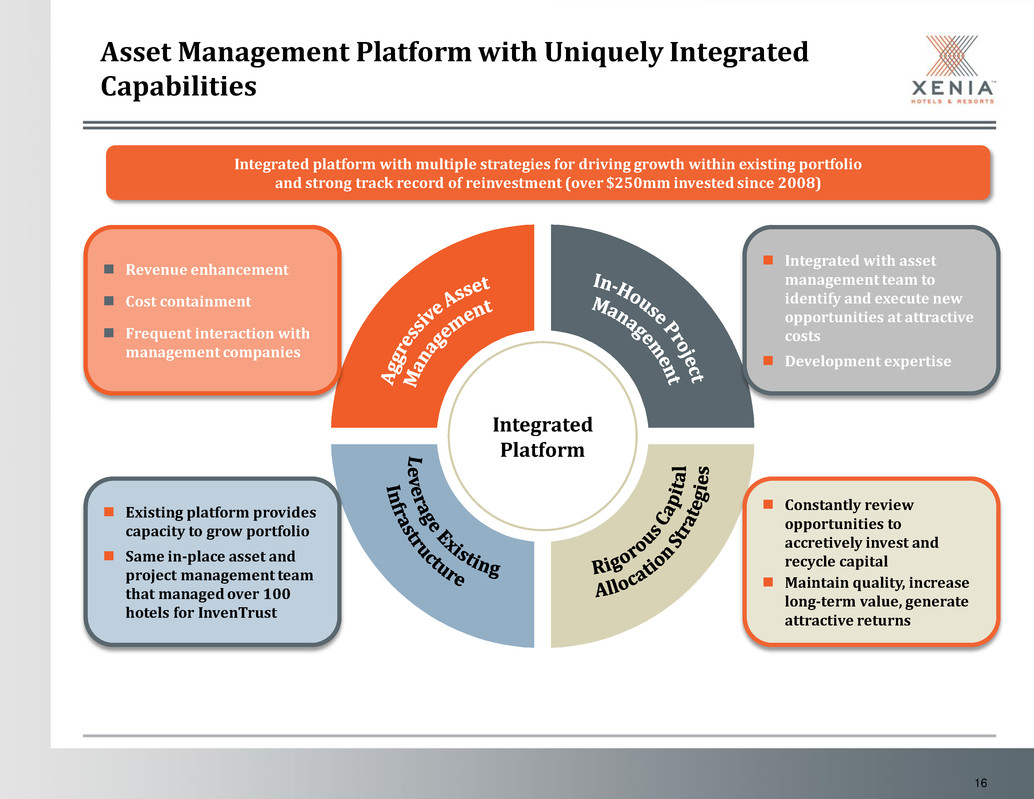
16 Asset Management Platform with Uniquely Integrated Capabilities Integrated Platform Revenue enhancement Cost containment Frequent interaction with management companies Integrated with asset management team to identify and execute new opportunities at attractive costs Development expertise Constantly review opportunities to accretively invest and recycle capital Maintain quality, increase long-term value, generate attractive returns Existing platform provides capacity to grow portfolio Same in-place asset and project management team that managed over 100 hotels for InvenTrust Integrated platform with multiple strategies for driving growth within existing portfolio and strong track record of reinvestment (over $250mm invested since 2008)
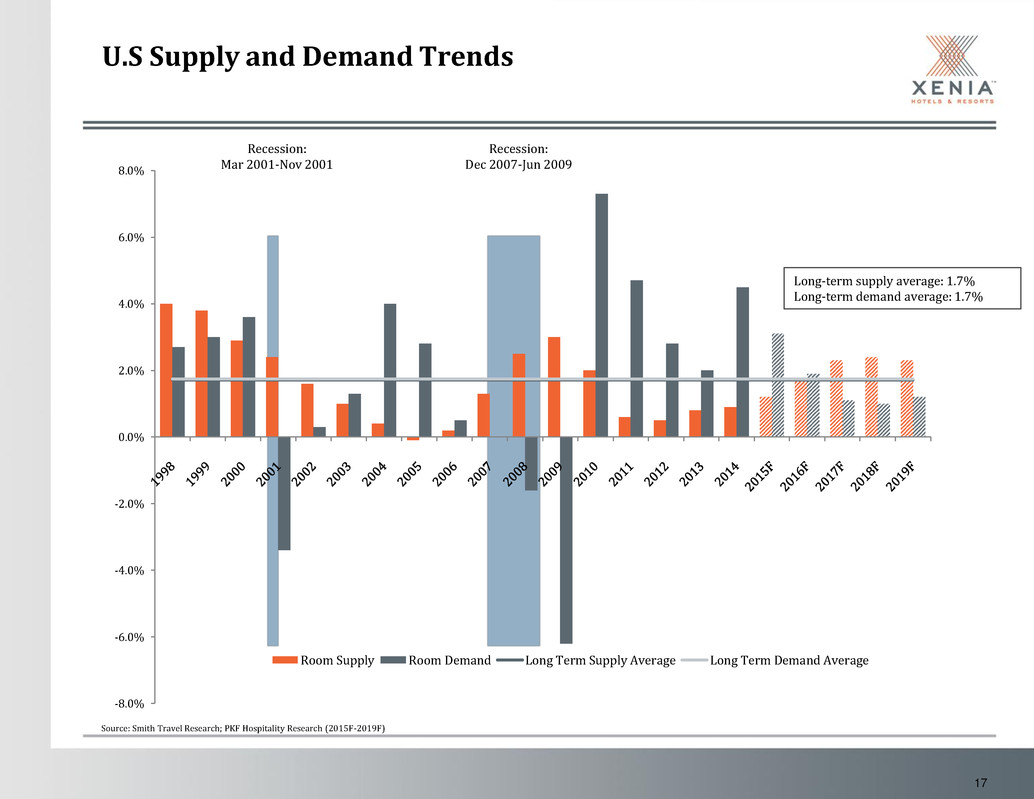
17 Source: Smith Travel Research; PKF Hospitality Research (2015F-2019F) Long-term supply average: 1.7% Long-term demand average: 1.7% Recession: Mar 2001-Nov 2001 Recession: Dec 2007-Jun 2009 -8.0% -6.0% -4.0% -2.0% 0.0% 2.0% 4.0% 6.0% 8.0% Room Supply Room Demand Long Term Supply Average Long Term Demand Average U.S Supply and Demand Trends
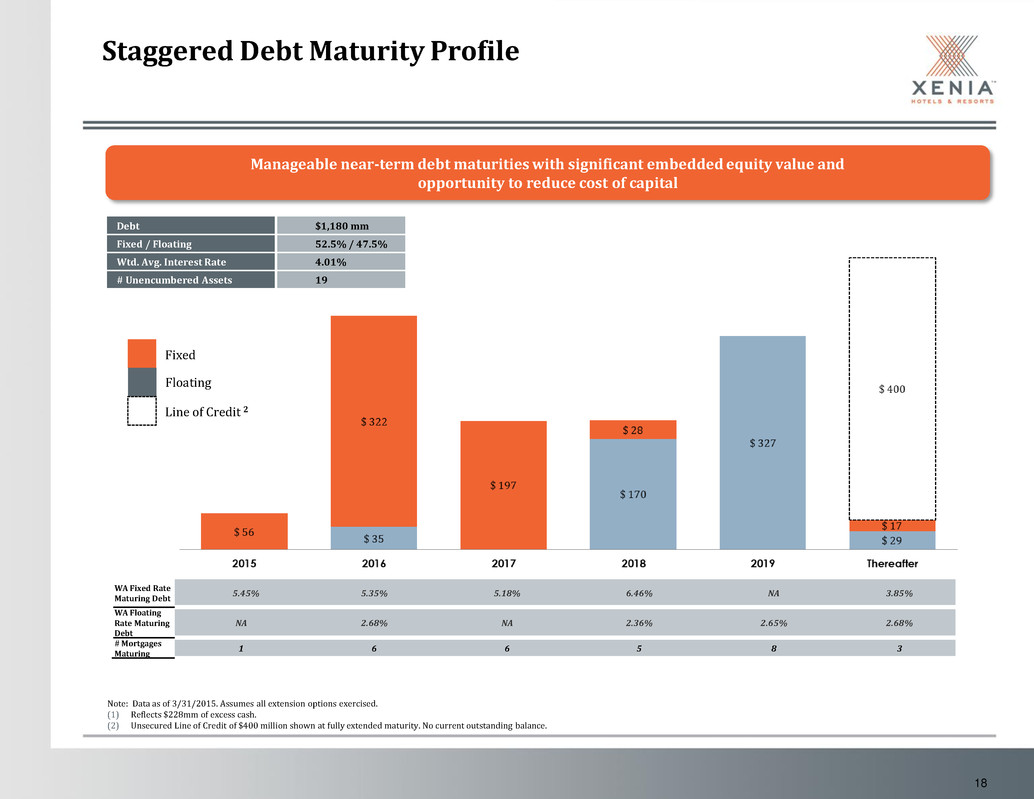
18 Staggered Debt Maturity Profile Manageable near-term debt maturities with significant embedded equity value and opportunity to reduce cost of capital Debt $1,180 mm Fixed / Floating 52.5% / 47.5% Wtd. Avg. Interest Rate 4.01% # Unencumbered Assets 19 Fixed Floating WA Fixed Rate Maturing Debt 5.45% 5.35% 5.18% 6.46% NA 3.85% WA Floating Rate Maturing Debt NA 2.68% NA 2.36% 2.65% 2.68% # Mortgages Maturing 1 6 6 5 8 3 Line of Credit 2 Note: Data as of 3/31/2015. Assumes all extension options exercised. (1) Reflects $228mm of excess cash. (2) Unsecured Line of Credit of $400 million shown at fully extended maturity. No current outstanding balance.
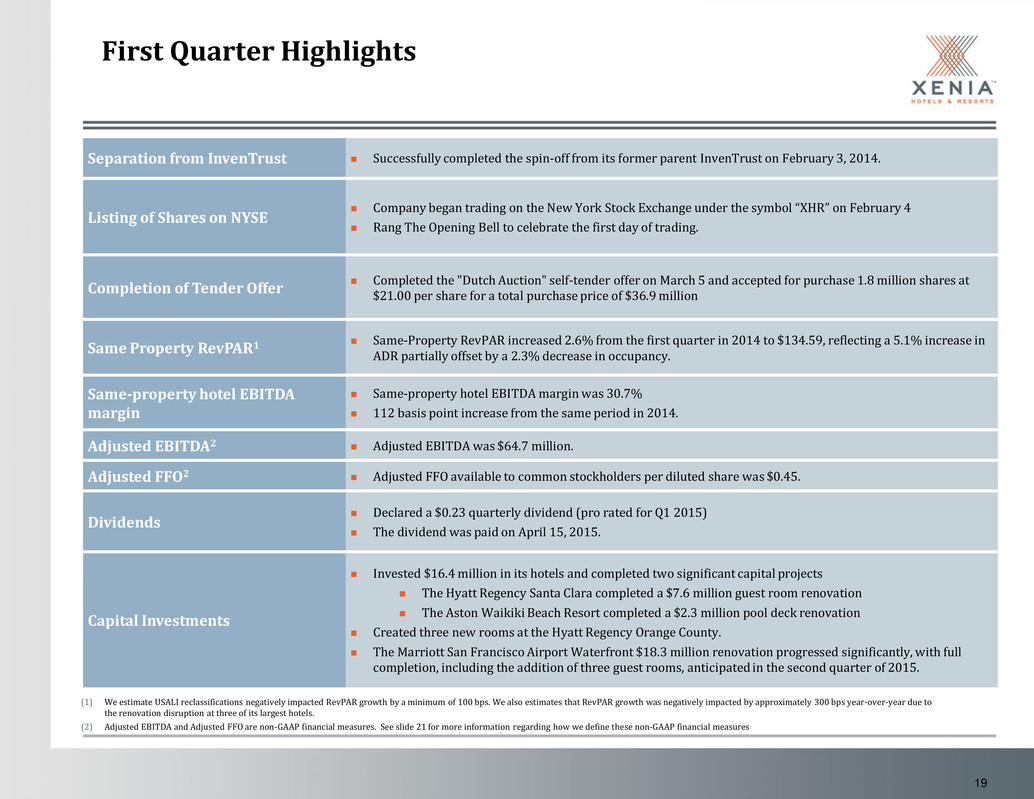
19 First Quarter Highlights Separation from InvenTrust Successfully completed the spin-off from its former parent InvenTrust on February 3, 2014. Listing of Shares on NYSE Company began trading on the New York Stock Exchange under the symbol “XHR” on February 4 Rang The Opening Bell to celebrate the first day of trading. Completion of Tender Offer Completed the "Dutch Auction" self-tender offer on March 5 and accepted for purchase 1.8 million shares at $21.00 per share for a total purchase price of $36.9 million Same Property RevPAR1 Same-Property RevPAR increased 2.6% from the first quarter in 2014 to $134.59, reflecting a 5.1% increase in ADR partially offset by a 2.3% decrease in occupancy. Same-property hotel EBITDA margin Same-property hotel EBITDA margin was 30.7% 112 basis point increase from the same period in 2014. Adjusted EBITDA2 Adjusted EBITDA was $64.7 million. Adjusted FFO2 Adjusted FFO available to common stockholders per diluted share was $0.45. Dividends Declared a $0.23 quarterly dividend (pro rated for Q1 2015) The dividend was paid on April 15, 2015. Capital Investments Invested $16.4 million in its hotels and completed two significant capital projects The Hyatt Regency Santa Clara completed a $7.6 million guest room renovation The Aston Waikiki Beach Resort completed a $2.3 million pool deck renovation Created three new rooms at the Hyatt Regency Orange County. The Marriott San Francisco Airport Waterfront $18.3 million renovation progressed significantly, with full completion, including the addition of three guest rooms, anticipated in the second quarter of 2015. (1) We estimate USALI reclassifications negatively impacted RevPAR growth by a minimum of 100 bps. We also estimates that RevPAR growth was negatively impacted by approximately 300 bps year-over-year due to the renovation disruption at three of its largest hotels. (2) Adjusted EBITDA and Adjusted FFO are non-GAAP financial measures. See slide 21 for more information regarding how we define these non-GAAP financial measures
20 Non-GAAP Financial Measures We consider the following non-GAAP financial measures useful to investors as key supplemental measures of our operating performance: EBITDA, Adjusted EBITDA, FFO and Adjusted FFO. These non-GAAP financial measures should be considered along with, but not as alternatives to, net income or loss, operating profit, cash from operations, or any other operating performance measure as prescribed per GAAP. EBITDA and Adjusted EBITDA EBITDA is a commonly used measure of performance in many industries and is defined as net income or loss (calculated in accordance with GAAP) excluding interest expense, provision for income taxes (including income taxes applicable to sale of assets) and depreciation and amortization. We consider EBITDA useful to an investor regarding our results of operations, in evaluating and facilitating comparisons of our operating performance between periods and between REITs by removing the impact of our capital structure (primarily interest expense) and asset base (primarily depreciation and amortization) from our operating results, even though EBITDA does not represent an amount that accrues directly to common stockholders. In addition, EBITDA is used as one measure in determining the value of hotel acquisitions and dispositions and along with FFO and Adjusted FFO, it is used by management in the annual budget process for compensation programs. We further adjust EBITDA for certain additional items such as hotel property acquisitions and pursuit costs, amortization of share-based compensation, equity investment adjustments, the cumulative effect of changes in accounting principles, impairment of real estate assets, operating results from properties sold and other costs we believe do not represent recurring operations and are not indicative of the performance of our underlying hotel property entities. We believe Adjusted EBITDA provides investors with another financial measure in evaluating and facilitating comparison of operating performance between periods and between REITs that report similar measures. FFO and Adjusted FFO We calculate FFO in accordance with standards established by the National Association of Real Estate Investment Trusts (NAREIT), which defines FFO as net income or loss (calculated in accordance with GAAP), excluding real estate-related depreciation, amortization and impairments, gains (losses) from sales of real estate, the cumulative effect of changes in accounting principles, similar adjustments for unconsolidated partnerships and joint ventures, and items classified by GAAP as extraordinary. Historical cost accounting for real estate assets implicitly assumes that the value of real estate assets diminishes predictably over time. Since real estate values instead have historically risen or fallen with market conditions, most industry investors consider presentations of operating results for real estate companies that use historical cost accounting to be insufficient by themselves. We believe that the presentation of FFO provides useful supplemental information to investors regarding our operating performance by excluding the effect of real estate depreciation and amortization, gains (losses) from sales for real estate, impairments of real estate assets, extraordinary items and the portion of these items related to unconsolidated entities, all of which are based on historical cost accounting and which may be of lesser significance in evaluating current performance. We believe that the presentation of FFO can facilitate comparisons of operating performance between periods and between REITs, even though FFO does not represent an amount that accrues directly to common stockholders. Our calculation of FFO may not be comparable to measures calculated by other companies who do not use the NAREIT definition of FFO or do not calculate FFO per diluted share in accordance with NAREIT guidance. Additionally, FFO may not be helpful when comparing us to non-REITs. We further adjust FFO for certain additional items that are not in NAREIT’s definition of FFO such as hotel property acquisition and pursuit costs, amortization of debt origination costs and share-based compensation, operating results from properties that are sold and other expenses we believe do not represent recurring operations. We believe that Adjusted FFO provides investors with useful supplemental information that may facilitate comparisons of ongoing operating performance between periods and between REITs that make similar adjustments to FFO and is beneficial to investors’ complete understanding of our operating performance. FFO, EBITDA and Adjusted EBITDA do not represent cash generated from operating activities under GAAP and should not be considered as alternatives to net income or loss, operating profit, cash flows from operations or any other operating performance measure prescribed by GAAP. Although we present and use FFO, EBITDA and Adjusted EBITDA because we believe they are useful to investors in evaluating and facilitating comparisons of our operating performance between periods and between REITs that report similar measures, the use of these non-GAAP measures has certain limitations as analytical tools. These non-GAAP financial measures are not measures of liquidity, nor are they indicative of funds available to fund our cash needs, including our ability to fund capital expenditures, contractual commitments, working capital, service debt or make cash distributions. These measures do not reflect cash expenditures for long-term assets and other items that we have incurred and will incur. These non-GAAP financial measures may include funds that may not be available for management’s discretionary use due to functional requirements to conserve funds for capital expenditures, property acquisitions, and other commitments and uncertainties. These non- GAAP financial measures as presented may not be comparable to non-GAAP financial measures as calculated by other real estate companies. Therefore, these measures should not be considered in isolation or as an alternative to GAAP measures. For a reconciliation of net income (loss) to EBITDA and Adjusted EBITDA for historical periods presented and our calculation of Hotel EBITDA, please refer to our website www.xeniareit.com
