Attached files
| file | filename |
|---|---|
| 8-K - CURRENT REPORT - US ECOLOGY, INC. | usecology_8k.htm |
Exhibit 99.1

1 May 2015 Investor Presentation
2 SAFE HARBOR During the course of this presentation the Company will be making forward - looking statements (as such term is defined in the Private Securities Litigation Reform Act of 1995 ) that are based on our current expectations, beliefs and assumptions about the industry and markets in which US Ecology, Inc . and its subsidiaries operate . Such statements may include, but are not limited to, statements about the Company's ability to integrate its acquisition of EQ — The Environmental Quality Company (EQ), expected synergies from the transaction, projections of the financial results of the combined company and other statements that are not historical facts . Such statements involve known and unknown risks, uncertainties and other factors that could cause the actual results of the Company to differ materially from the results expressed or implied by such statements, including general economic and business conditions, conditions affecting the industries served by US Ecology, EQ and their respective subsidiaries, conditions affecting our customers and suppliers, competitor responses to our products and services, the overall market acceptance of such products and services, the integration and performance of acquisitions (including the acquisition of EQ) and other factors disclosed in the Company's periodic reports filed with the Securities and Exchange Commission . For information on other factors that could cause actual results to differ materially from expectations, please refer to US Ecology, Inc . 's December 31 , 2014 Annual Report on Form 10 - K and other reports filed with the Securities and Exchange Commission . Many of the factors that will determine the Company's future results are beyond the ability of management to control or predict . Readers should not place undue reliance on forward - looking statements, which reflect management's views only as of the date such statements are made . The Company undertakes no obligation to revise or update any forward - looking statements, or to make any other forward - looking statements, whether as a result of new information, future events or otherwise . Important assumptions and other important factors that could cause actual results to differ materially from those set forth in the forward - looking information include a loss of a major customer or contract, compliance with and changes to applicable laws, rules, or regulations, access to cost effective transportation services, access to insurance, surety bonds and other financial assurances, loss of key personnel, lawsuits, labor disputes, adverse economic conditions, government funding or competitive pressures, incidents or adverse weather conditions that could limit or suspend specific operations, implementation of new technologies, market conditions, average selling prices for recycled materials, our ability to replace business from recently completed large projects, our ability to perform under required contracts, our ability to permit and contract for timely construction of new or expanded disposal cells, our willingness or ability to pay dividends and our ability to effectively close, integrate and realize anticipated synergies from future acquisitions, which can be impacted by the failure of the acquired company to achieve anticipated revenues, earnings or cash flows, assumption of liabilities that exceed our estimates, potential compliance issues, diversion of management's attention or other resources from our existing business, risks associated with entering product / service areas in which we have limited experience, increases in working capital investment, unexpected capital expenditures, potential losses of key employees and customers of the acquired company and future write - offs of intangible and other assets, including goodwill, if the acquired operations fail to generate sufficient cash flows .
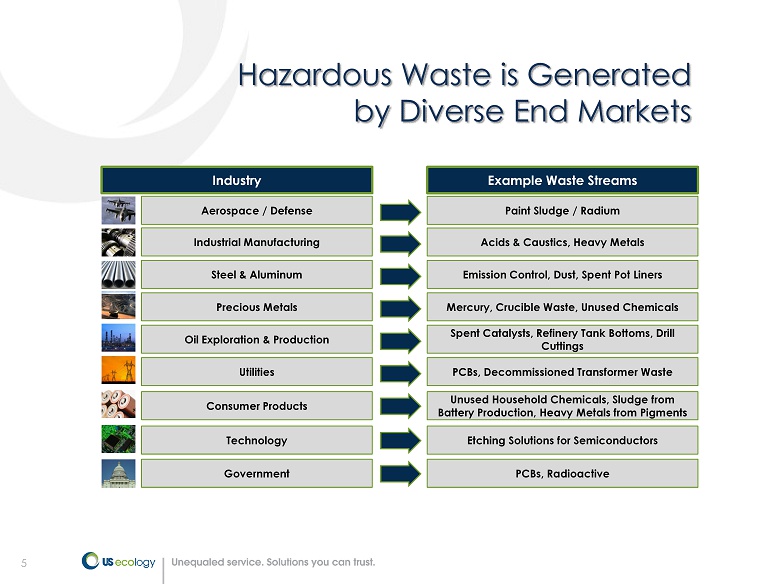
5 Hazardous Waste is Generated by Diverse End Markets Aerospace / Defense Paint Sludge / Radium Industry Example Waste Streams Industrial Manufacturing Steel & Aluminum Precious Metals Oil Exploration & Production Utilities Acids & Caustics, Heavy Metals Emission Control, Dust, Spent Pot Liners Mercury, Crucible Waste, Unused Chemicals Spent Catalysts, Refinery Tank Bottoms, Drill Cuttings Unused Household Chemicals, Sludge from Battery Production, Heavy Metals from Pigments Consumer Products PCBs, Decommissioned Transformer Waste Etching Solutions for Semiconductors Technology PCBs, Radioactive Government
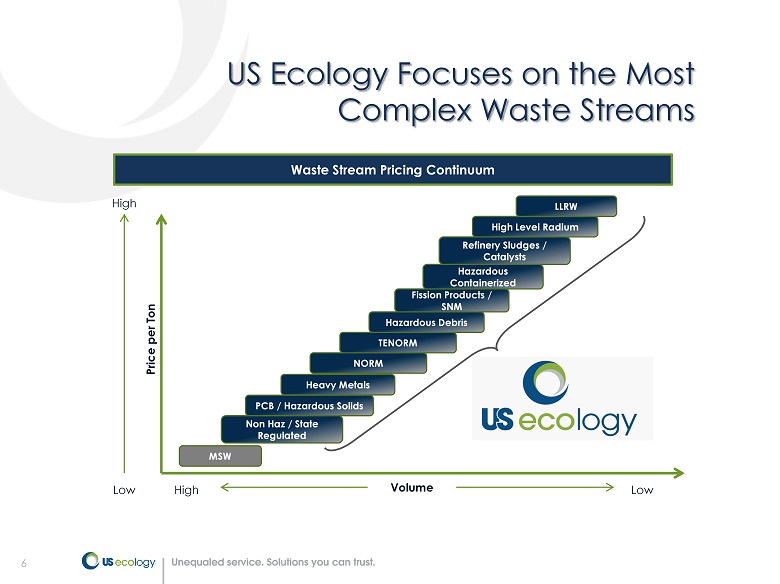
6 US Ecology Focuses on the Most Complex Waste Streams Waste Stream Pricing Continuum Price per Ton MSW LLRW Refinery Sludges / Catalysts Hazardous Containerized Fission Products / SNM Hazardous Debris NORM PCB / Hazardous Solids High Low Volume Low High Non Haz / State Regulated TENORM Heavy Metals High Level Radium 6
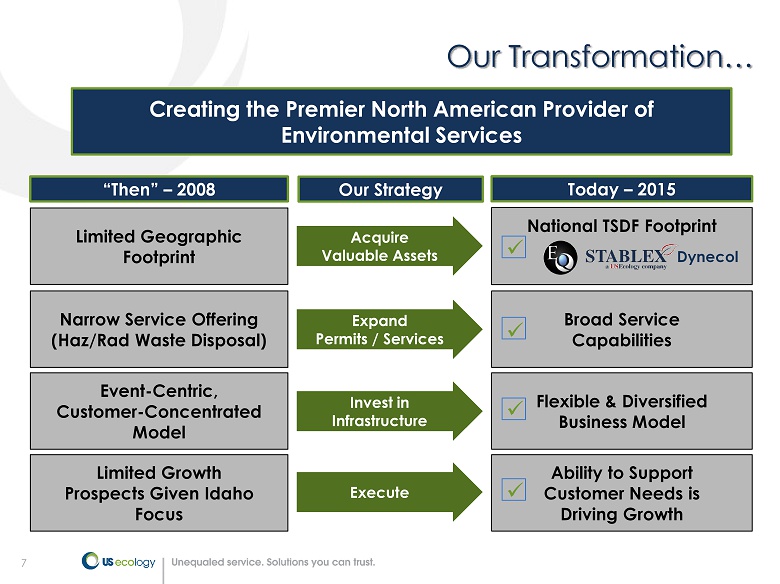
7 Our Transformation… Limited Geographic Footprint Acquire Valuable Assets Narrow Service Offering (Haz/Rad Waste Disposal) Event - Centric, Customer - Concentrated Model Limited Growth Prospects Given Idaho Focus National TSDF Footprint Broad Service Capabilities Flexible & Diversified Business Model Ability to Support Customer Needs is Driving Growth Expand Permits / Services Invest in Infrastructure Execute x x x x Dynecol Creating the Premier North American Provider of Environmental Services Our Strategy “Then” – 2008 Today – 2015
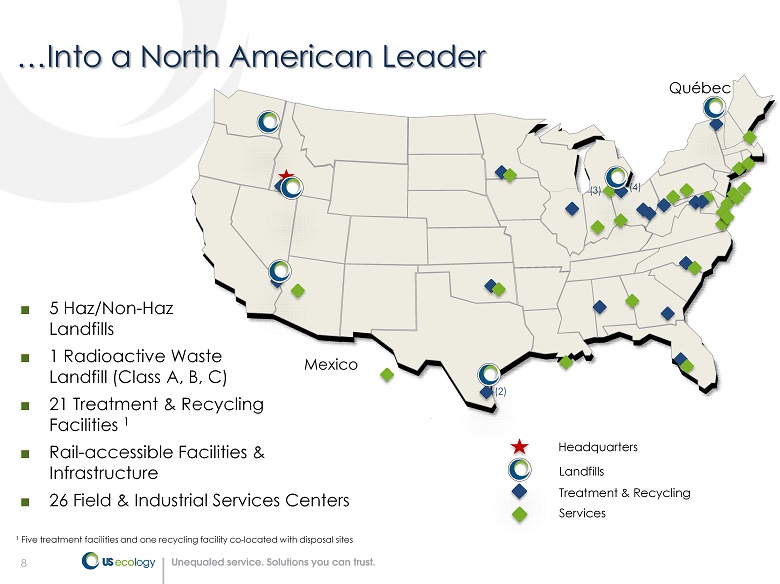
8 …Into a North American Leader ■ 5 Haz/Non - Haz Landfills ■ 1 Radioactive Waste Landfill ( Class A, B, C) ■ 21 Treatment & Recycling Facilities 1 ■ Rail - accessible Facilities & Infrastructure ■ 26 Field & Industrial Services Centers 1 Five treatment facilities and one recycling facility co - located with disposal sites (4) Mexico Québec (3) ( 2 ) Landfills Treatment & Recycling Services Headquarters
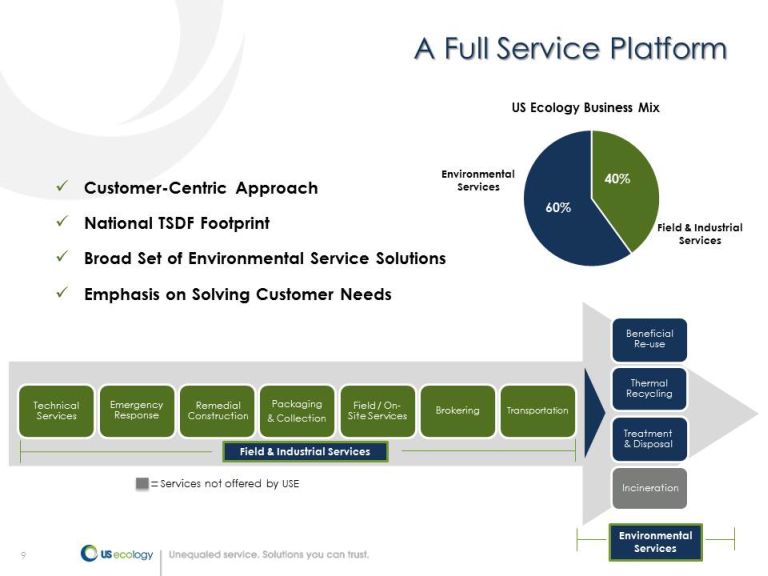
9 A Full Service Platform Technical Services Emergency Response Remedial Construction Packaging & Collection Brokering Transportation Beneficial Re - use Thermal Recycling Incineration Treatment & Disposal Field / On - Site Services x Customer - Centric Approach x National TSDF Footprint x Broad Set of Environmental Service Solutions x Emphasis on Solving Customer Needs Field & Industrial Services Environmental Services [VALUE] % [VALUE] % Field & Industrial Services Environmental Services US Ecology Business Mix Services not offered by USE
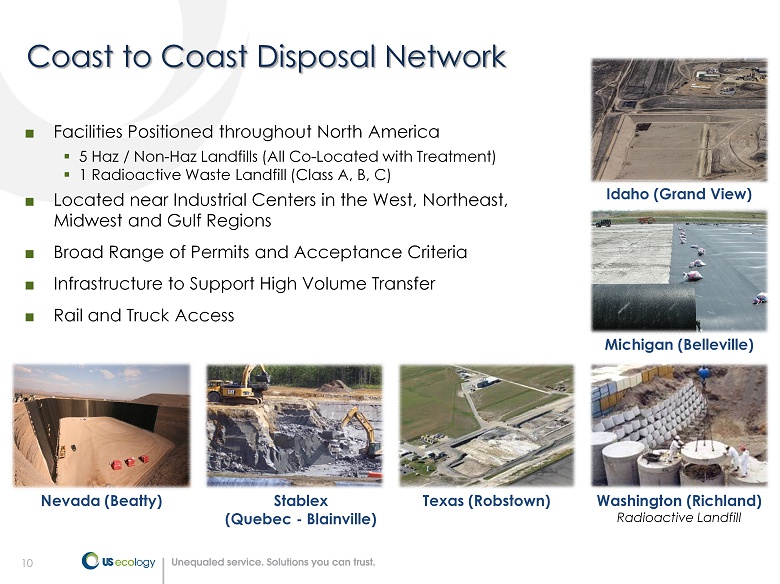
10 Coast to Coast Disposal Network ■ Facilities Positioned throughout North America ▪ 5 Haz / Non - Haz Landfills (All Co - Located with Treatment ) ▪ 1 Radioactive Waste Landfill (Class A, B, C) ■ Located near Industrial Centers in the West, Northeast, Midwest and Gulf Regions ■ Broad Range of Permits and Acceptance Criteria ■ Infrastructure to Support High Volume Transfer ■ Rail and Truck Access Idaho (Grand View) Washington (Richland) Radioactive Landfill Michigan (Belleville) Nevada (Beatty) Texas (Robstown) Stablex (Quebec - Blainville)
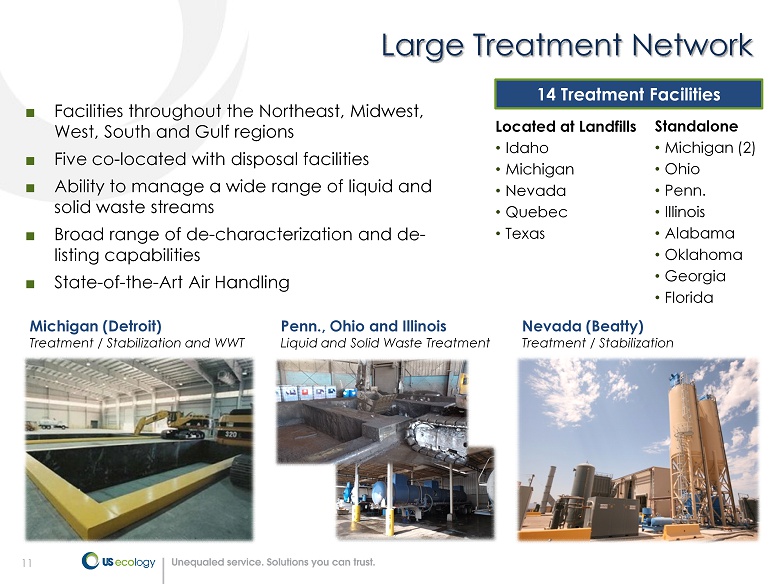
11 Large Treatment Network ■ F acilities throughout the Northeast, Midwest, West, South and Gulf regions ■ Five co - located with disposal facilities ■ Ability to manage a wide range of liquid and solid waste streams ■ Broad range of de - characterization and de - listing capabilities ■ State - of - the - Art Air Handling 14 Treatment Facilities Located at Landfills • Idaho • Michigan • Nevada • Quebec • Texas Standalone • Michigan (2) • Ohio • Penn. • Illinois • Alabama • Oklahoma • Georgia • Florida Michigan (Detroit) Treatment / Stabilization and WWT Penn., Ohio and Illinois Liquid and Solid Waste Treatment Nevada (Beatty) Treatment / Stabilization
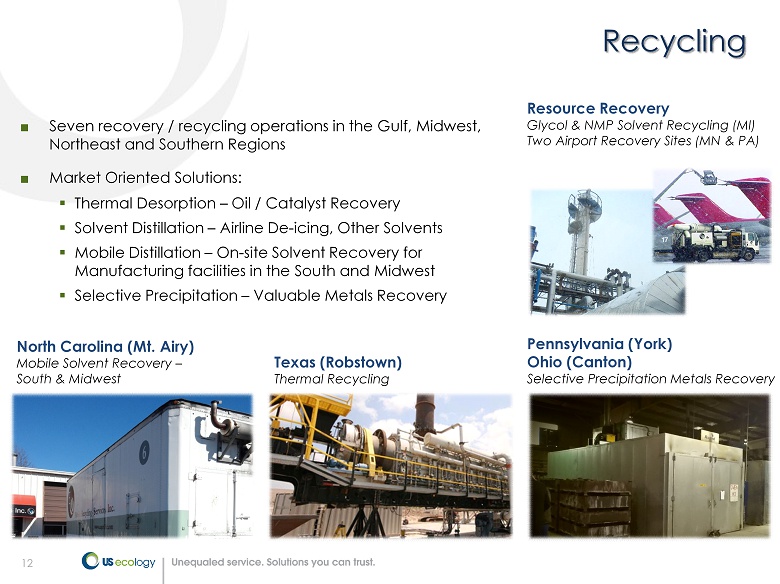
12 Recycling ■ Seven recovery / recycling operations in the Gulf, Midwest, Northeast and Southern Regions ■ Market Oriented Solutions: ▪ Thermal Desorption – Oil / Catalyst Recovery ▪ Solvent Distillation – Airline De - icing, Other Solvents ▪ Mobile Distillation – On - site Solvent Recovery for Manufacturing facilities in the South and Midwest ▪ Selective Precipitation – Valuable Metals Recovery Resource Recovery Glycol & NMP Solvent Recycling (MI) Two Airport Recovery Sites (MN & PA) Texas (Robstown) Thermal Recycling North Carolina (Mt. Airy) Mobile Solvent Recovery – South & Midwest Pennsylvania (York) Ohio (Canton) Selective Precipitation Metals Recovery
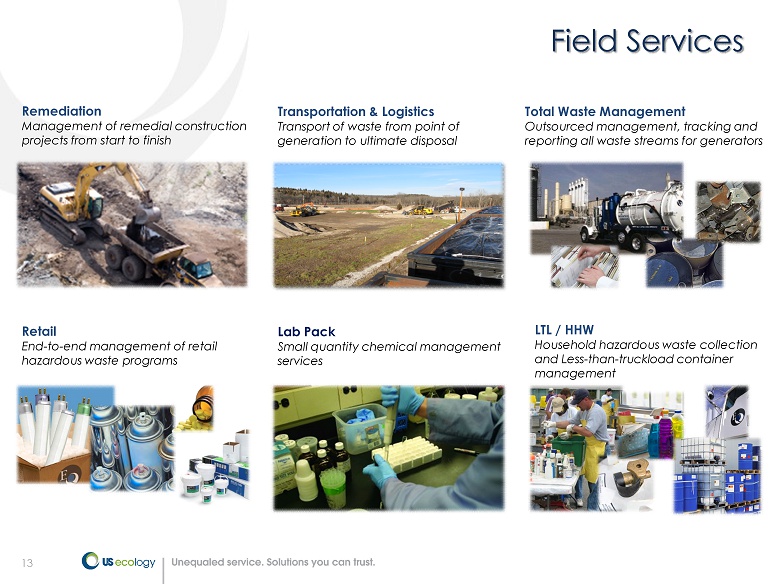
13 Field Services Remediation Management of remedial construction projects from start to finish Retail End - to - end management of retail hazardous waste programs Transportation & Logistics Transport of waste from point of generation to ultimate disposal Lab Pack Small quantity chemical management services Total Waste Management Outsourced management, tracking and reporting all waste streams for generators LTL / HHW Household hazardous waste collection and Less - than - truckload container management
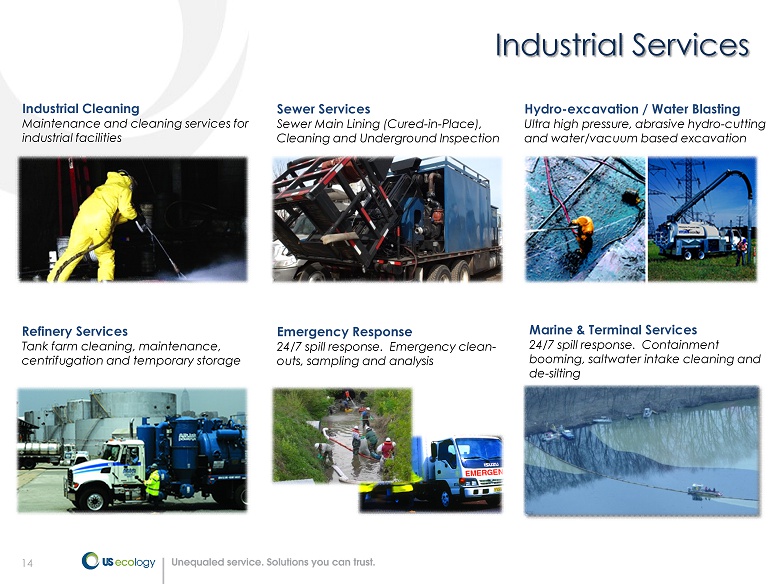
14 Industrial Services Industrial Cleaning Maintenance and cleaning services for industrial facilities Refinery Services Tank farm cleaning, maintenance, centrifugation and temporary storage Sewer Services Sewer Main Lining (Cured - in - Place), Cleaning and Underground Inspection Emergency Response 24/7 spill response. Emergency clean - outs, sampling and analysis Hydro - excavation / Water Blasting Ultra high pressure, abrasive hydro - cutting and water/vacuum based excavation Marine & Terminal Services 24/7 spill response. Containment booming, saltwater intake cleaning and de - silting

16 Financial Overview
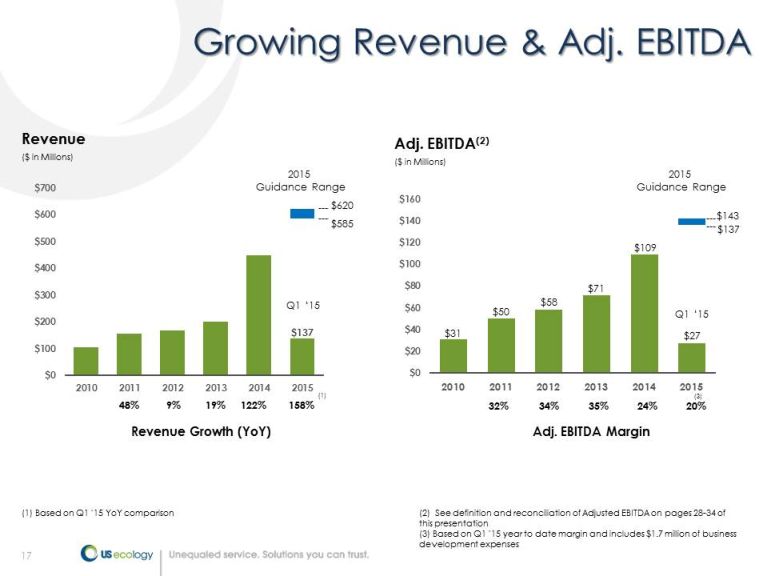
17 ($ in Millions) Revenue Growth (YoY) $105 $155 $169 $201 $447 [VALUE] $0 $100 $200 $300 $400 $500 $600 $700 2010 2011 2012 2013 2014 2015 Revenue Q1 ‘15 2015 Guidance Range $585 $620 48% 9% 19% 122% 158% (1) (1) Based on Q1 ‘15 YoY comparison Growing Revenue & Adj. EBITDA (2) See definition and reconciliation of Adjusted EBITDA on pages 28 - 34 of this presentation (3) Based on Q1 ’15 year to date margin and includes $1.7 million of business development expenses $31 $50 $58 $71 $109 $27 $0 $20 $40 $60 $80 $100 $120 $140 $160 2010 2011 2012 2013 2014 2015 ($ in Millions) Adj. EBITDA (2) 32% 35% 24% 20% Adj. EBITDA Margin (3) 34% $137 $143 2015 Guidance Range Q1 ‘15
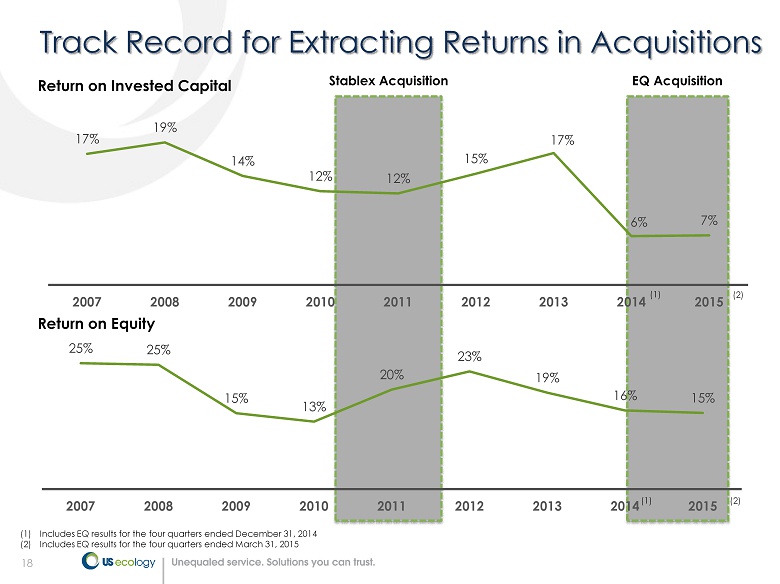
18 Track Record for Extracting Returns in Acquisitions Return on Invested Capital Return on Equity 25% 25% 15% 13% 20% 23% 19% 16% 15% 2007 2008 2009 2010 2011 2012 2013 2014 2015 Stablex Acquisition EQ Acquisition (1) Includes EQ results for the four quarters ended December 31, 2014 (2) Includes EQ results for the four quarters ended March 31, 2015 (1) 17% 19% 14% 12% 12% 15% 17% 6% 7% 2007 2008 2009 2010 2011 2012 2013 2014 2015 (2) (1) (2)
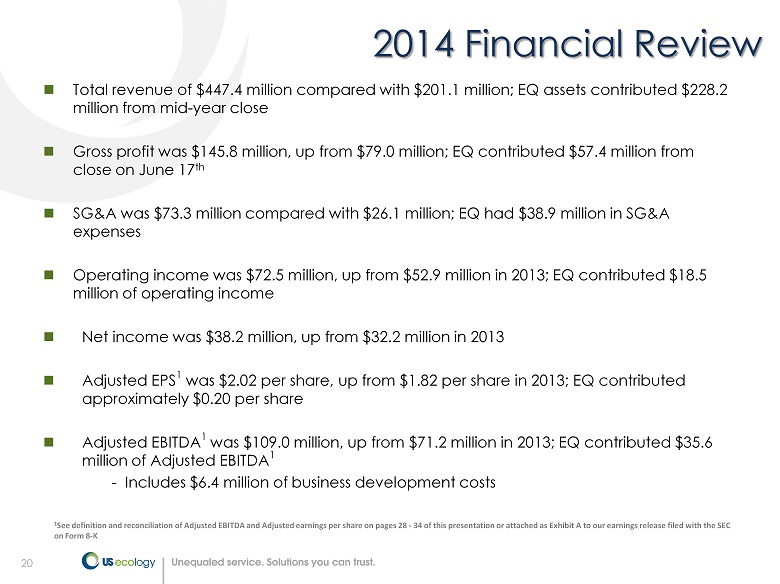
contributed $35.6 million of Adjusted EBITDA 1 - Includes $6.4 million of business development costs
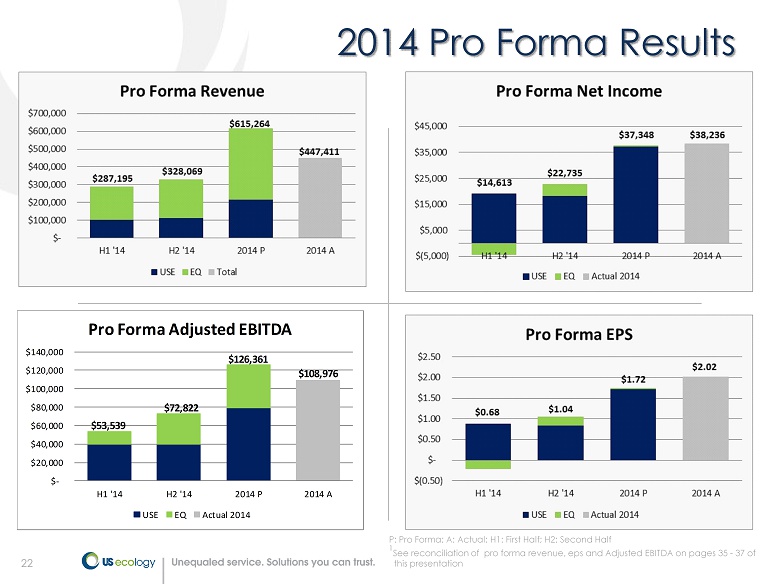
22 2014 Pro Forma Results P: Pro Forma; A: Actual; H1: First Half; H2: Second Half 1 See reconciliation of pro forma revenue, eps and Adjusted EBITDA on pages 35 - 37 of this presentation $- $20,000 $40,000 $60,000 $80,000 $100,000 $120,000 $140,000 H1 '14 H2 '14 2014 P 2014 A Pro Forma Adjusted EBITDA USE EQ Actual 2014 $53,539 $72,822 $126,361 $108,976
costs
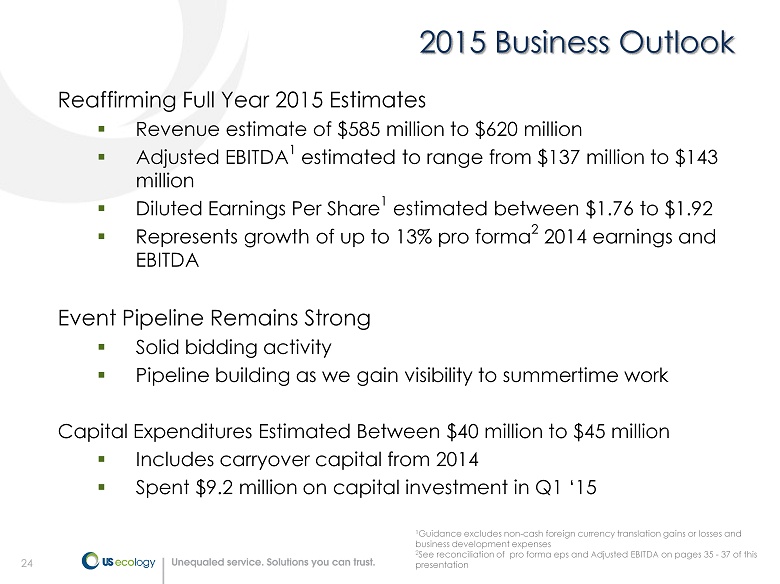
24 Reaffirming Full Year 2015 Estimates ▪ Revenue estimate of $585 million to $620 million ▪ Adjusted EBITDA 1 estimated to range from $137 million to $143 million ▪ Diluted Earnings Per Share 1 estimated between $1.76 to $1.92 ▪ Represents growth of up to 13% pro forma 2 2014 earnings and EBITDA Event Pipeline Remains Strong ▪ Solid bidding activity ▪ Pipeline building as we gain visibility to summertime work Capital Expenditures Estimated Between $40 million to $45 million ▪ Includes carryover capital from 2014 ▪ Sp ent $9.2 million on capital investment in Q1 ‘15 24 2015 Business Outlook 1 Guidance excludes non - cash foreign currency translation gains or losses and business development expenses 2 See reconciliation of pro forma eps and Adjusted EBITDA on pages 35 - 37 of this presentation
26 Appendix
28 US Ecology reports adjusted EBITDA, adjusted earnings per diluted share, pro forma Adjusted EBITDA, pro forma earnings per diluted per share and pro forma revenue results, which are non - GAAP financial measures, as a complement to results provided in accordance with generally accepted accounting principles in the United States (GAAP) and believes that such information provides analysts, stockholders, and other users information to better understand the Company’s operating performance . Because adjusted EBITDA, adjusted earnings per diluted share, pro forma Adjusted EBITDA , pro forma earnings per diluted per share and pro forma revenue are not measurements determined in accordance with GAAP and are thus susceptible to varying calculations they may not be comparable to similar measures used by other companies . Items excluded from adjusted EBITDA, adjusted earnings per diluted share, pro forma Adjusted EBITDA , pro forma earnings per diluted per share and pro forma revenue are significant components in understanding and assessing financial performance . Adjusted EBITDA, adjusted earnings per diluted share, pro forma Adjusted EBITDA , pro forma earnings per diluted per share and pro forma revenue should not be considered in isolation or as an alternative to, or substitute for, revenue, net income, cash flows generated by operations, investing or financing activities, or other financial statement data presented in the consolidated financial statements as indicators of financial performance or liquidity . Adjusted EBITDA , adjusted earnings per diluted share, pro forma Adjusted EBITDA , pro forma earnings per diluted per share and pro forma revenue have limitations as analytical tools and should not be considered in isolation or a substitute for analyzing our results as reported under GAAP . 28 Adjusted and Pro Forma EBITDA, EPS & Revenue
29 Adjusted EBITDA The Company defines adjusted EBITDA as net income before interest expense, interest income, income tax expense, depreciation, amortization, stock based compensation, accretion of closure and post - closure liabilities, foreign currency gain/loss and other income/expense, which are not considered part of usual business operations . Adjusted Earnings Per Diluted Share The Company defines adjusted earnings per diluted share as net income plus the after tax impact of non - cash, non - operational foreign currency gains or losses (“Foreign Currency Gain/Loss”) plus the after tax impact of business development costs divided by the number of diluted shares used in the earnings per share calculation . The Foreign Currency Gain/Loss excluded from the earnings per diluted share calculation are related to intercompany loans between our Canadian subsidiary and the U . S . parent which have been established as part of our tax and treasury management strategy . These intercompany loans are payable in Canadian dollars (“CAD”) requiring us to revalue the outstanding loan balance through our consolidated income statement based on the CAD/United States currency movements from period to period . We believe excluding the currency movements for these intercompany financial instruments provides meaningful information to investors regarding the operational and financial performance of the Company . Definitions of Adjusted EBITDA and EPS
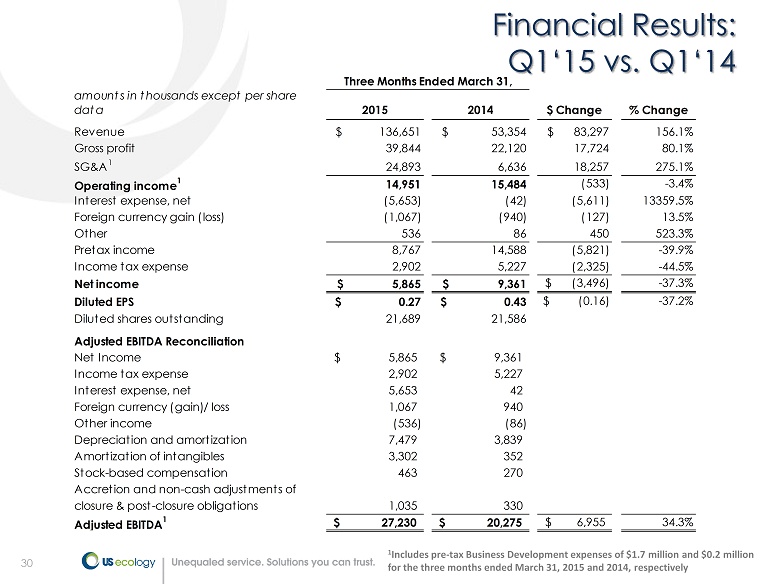
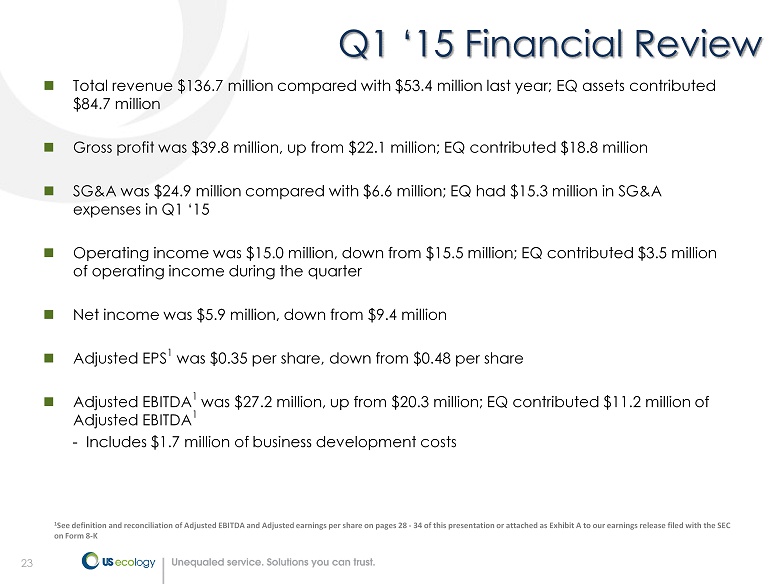
30 30 Financial Results: Q1‘15 vs. Q1‘14 amounts in thousands except per share data 2015 2014 $ Change % Change Revenue $ 136,651 $ 53,354 $ 83,297 156.1% Gross profit 39,844 22,120 17,724 80.1% SG&A 1 24,893 6,636 18,257 275.1% Operating income 1 14,951 15,484 (533) -3.4% Interest expense, net (5,653) (42) (5,611) 13359.5% Foreign currency gain (loss) (1,067) (940) (127) 13.5% Other 536 86 450 523.3% Pretax income 8,767 14,588 (5,821) -39.9% Income tax expense 2,902 5,227 (2,325) -44.5% Net income $ 5,865 $ 9,361 $ (3,496) -37.3% Diluted EPS $ 0.27 $ 0.43 $ (0.16) -37.2% Diluted shares outstanding 21,689 21,586 Adjusted EBITDA Reconciliation Net Income 5,865$ 9,361$ Income tax expense 2,902 5,227 Interest expense, net 5,653 42 Foreign currency (gain)/ loss 1,067 940 Other income (536) (86) Depreciation and amortization 7,479 3,839 Amortization of intangibles 3,302 352 Stock-based compensation 463 270 Accretion and non-cash adjustments of closure & post-closure obligations 1,035 330 Adjusted EBITDA 1 27,230$ 20,275$ 6,955$ 34.3% Three Months Ended March 31, 1 Includes pre - tax Business Development expenses of $1.7 million and $0.2 million for the three months ended March 31, 2015 and 2014, respectively
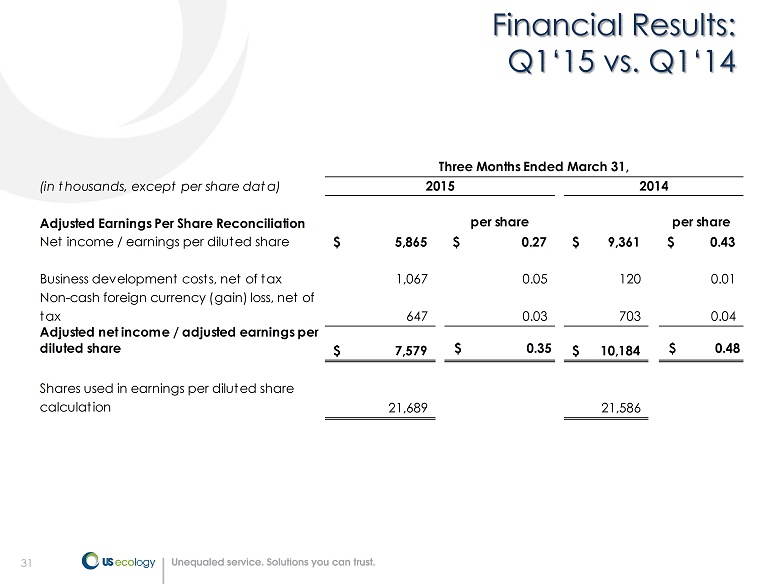
31 31 Financial Results: Q1‘15 vs. Q1‘14 (in thousands, except per share data) Adjusted Earnings Per Share Reconciliation per share per share Net income / earnings per diluted share 5,865$ 0.27$ 9,361$ 0.43$ Business development costs, net of tax 1,067 0.05 120 0.01 Non-cash foreign currency (gain) loss, net of tax 647 0.03 703 0.04 Adjusted net income / adjusted earnings per diluted share 7,579$ $ 0.35 10,184$ $ 0.48 Shares used in earnings per diluted share calculation 21,689 21,586 Three Months Ended March 31, 2015 2014
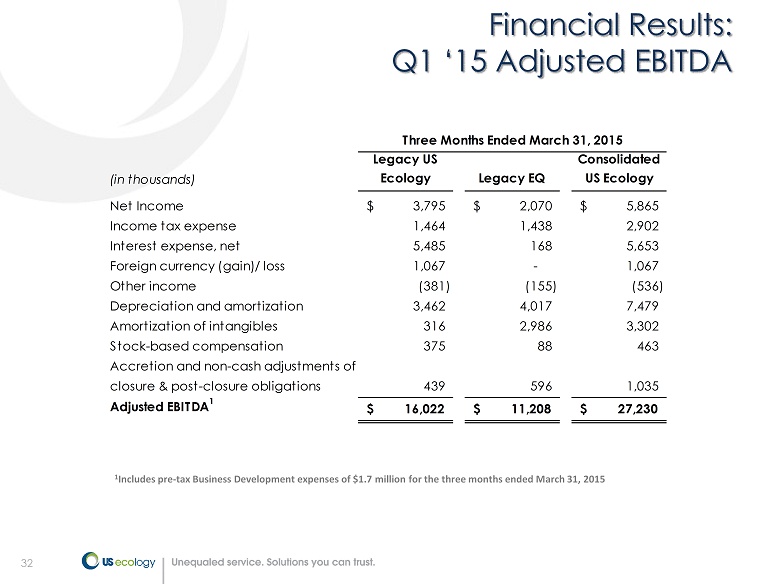
32 32 Financial Results: Q1 ‘15 Adjusted EBITDA (in thousands) Legacy US Ecology Legacy EQ Consolidated US Ecology Net Income 3,795$ 2,070$ 5,865$ Income tax expense 1,464 1,438 2,902 Interest expense, net 5,485 168 5,653 Foreign currency (gain)/ loss 1,067 - 1,067 Other income (381) (155) (536) Depreciation and amortization 3,462 4,017 7,479 Amortization of intangibles 316 2,986 3,302 Stock-based compensation 375 88 463 Accretion and non-cash adjustments of closure & post-closure obligations 439 596 1,035 Adjusted EBITDA 1 16,022$ 11,208$ 27,230$ Three Months Ended March 31, 2015 1 Includes pre - tax Business Development expenses of $1.7 million for the three months ended March 31, 2015
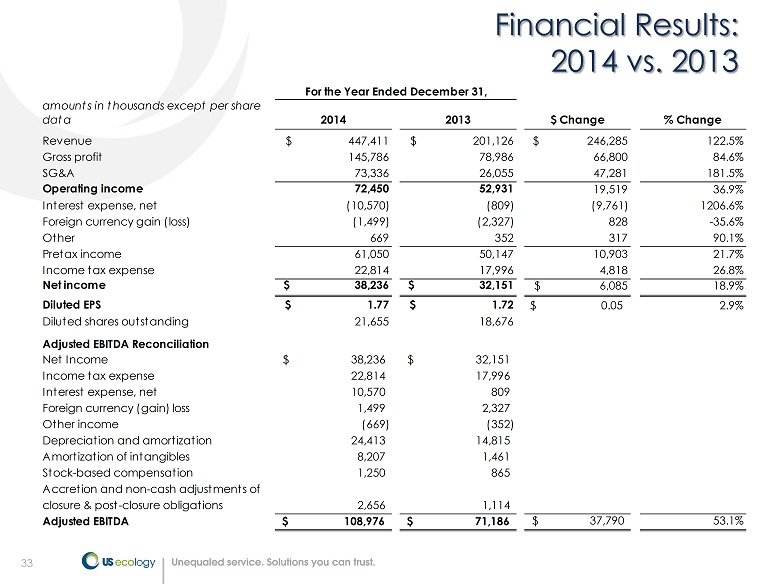
33 Financial Results: 2014 vs. 2013 amounts in thousands except per share data 2014 2013 $ Change % Change Revenue $ 447,411 $ 201,126 $ 246,285 122.5% Gross profit 145,786 78,986 66,800 84.6% SG&A 73,336 26,055 47,281 181.5% Operating income 72,450 52,931 19,519 36.9% Interest expense, net (10,570) (809) (9,761) 1206.6% Foreign currency gain (loss) (1,499) (2,327) 828 -35.6% Other 669 352 317 90.1% Pretax income 61,050 50,147 10,903 21.7% Income tax expense 22,814 17,996 4,818 26.8% Net income $ 38,236 $ 32,151 $ 6,085 18.9% Diluted EPS $ 1.77 $ 1.72 $ 0.05 2.9% Diluted shares outstanding 21,655 18,676 Adjusted EBITDA Reconciliation Net Income 38,236$ 32,151$ Income tax expense 22,814 17,996 Interest expense, net 10,570 809 Foreign currency (gain) loss 1,499 2,327 Other income (669) (352) Depreciation and amortization 24,413 14,815 Amortization of intangibles 8,207 1,461 Stock-based compensation 1,250 865 Accretion and non-cash adjustments of closure & post-closure obligations 2,656 1,114 Adjusted EBITDA 108,976$ 71,186$ 37,790$ 53.1% For the Year Ended December 31,
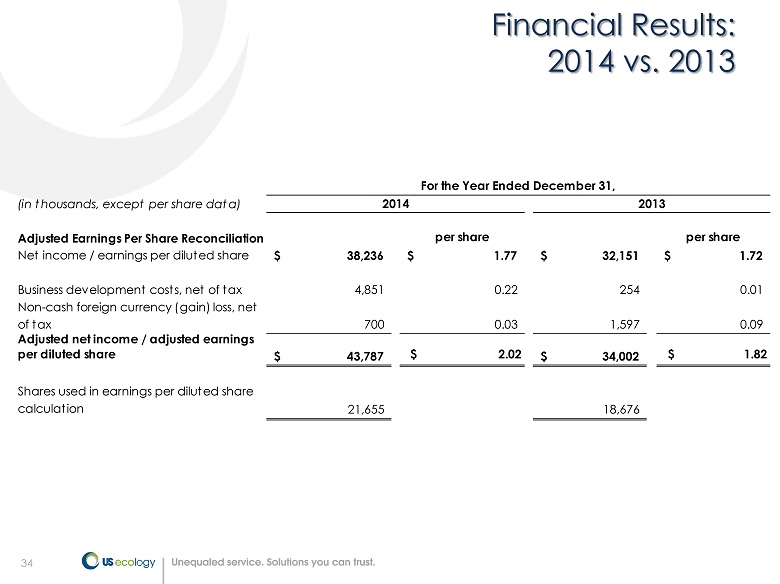
34 Financial Results: 2014 vs. 2013 (in thousands, except per share data) Adjusted Earnings Per Share Reconciliation per share per share Net income / earnings per diluted share 38,236$ 1.77$ 32,151$ 1.72$ Business development costs, net of tax 4,851 0.22 254 0.01 Non-cash foreign currency (gain) loss, net of tax 700 0.03 1,597 0.09 Adjusted net income / adjusted earnings per diluted share 43,787$ $ 2.02 34,002$ $ 1.82 Shares used in earnings per diluted share calculation 21,655 18,676 For the Year Ended December 31, 2014 2013
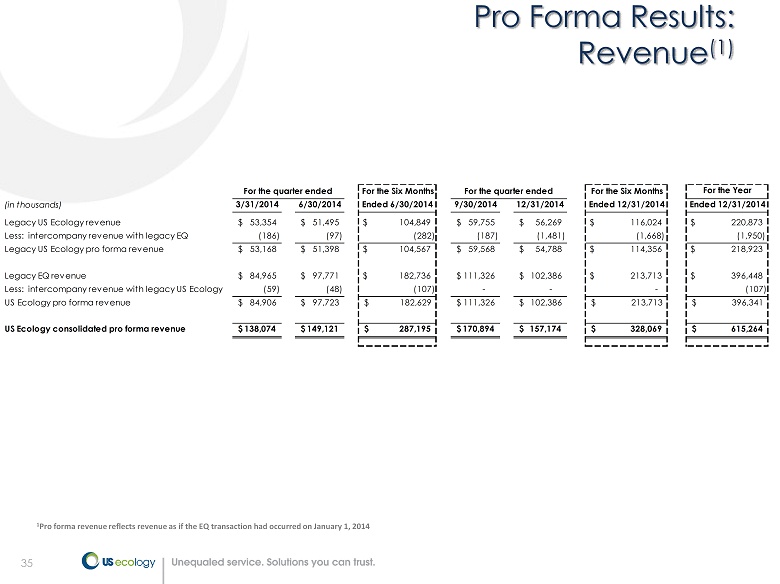
35 Pro Forma Results: Revenue (1) 1 Pro forma revenue reflects revenue as if the EQ transaction had occurred on January 1, 2014 For the Six Months For the Six Months For the Year (in thousands) 3/31/2014 6/30/2014 Ended 6/30/2014 9/30/2014 12/31/2014 Ended 12/31/2014 Ended 12/31/2014 Legacy US Ecology revenue 53,354$ 51,495$ $ 104,849 59,755$ 56,269$ $ 116,024 $ 220,873 Less: intercompany revenue with legacy EQ (186) (97) (282) (187) (1,481) (1,668) (1,950) Legacy US Ecology pro forma revenue 53,168$ 51,398$ $ 104,567 59,568$ 54,788$ $ 114,356 $ 218,923 Legacy EQ revenue 84,965$ 97,771$ $ 182,736 111,326$ 102,386$ $ 213,713 $ 396,448 Less: intercompany revenue with legacy US Ecology (59) (48) (107) - - - (107) US Ecology pro forma revenue 84,906$ 97,723$ 182,629$ 111,326$ 102,386$ 213,713$ 396,341$ US Ecology consolidated pro forma revenue 138,074$ 149,121$ 287,195$ 170,894$ 157,174$ 328,069$ 615,264$ For the quarter ended For the quarter ended
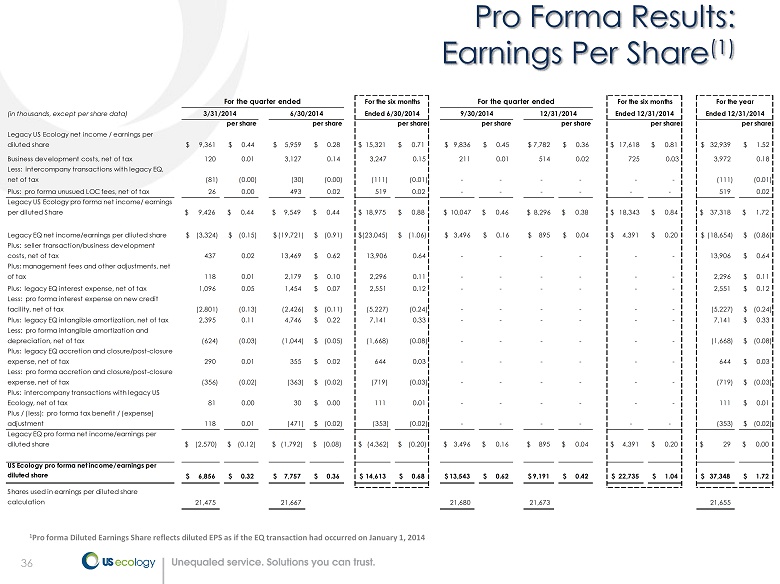
36 Pro Forma Results: Earnings Per Share (1) (in thousands, except per share data) per share per share per share per share per share per share per share Legacy US Ecology net income / earnings per diluted share 9,361$ 0.44$ 5,959$ 0.28$ $ 15,321 $ 0.71 9,836$ 0.45$ 7,782$ 0.36$ $ 17,618 $ 0.81 32,939$ 1.52$ ` Business development costs, net of tax 120 0.01 3,127 0.14 3,247 0.15 211 0.01 514 0.02 725 0.03 3,972 0.18 Less: intercompany transactions with legacy EQ, net of tax (81) (0.00) (30) (0.00) (111) (0.01) - - - - - - (111) (0.01) Plus: pro forma unusued LOC fees, net of tax 26 0.00 493 0.02 519 0.02 - - - - - - 519 0.02 Legacy US Ecology pro forma net income/ earnings per diluted Share $ 9,426 $ 0.44 $ 9,549 $ 0.44 $ 18,975 $ 0.88 $ 10,047 $ 0.46 $ 8,296 $ 0.38 $ 18,343 $ 0.84 $ 37,318 $ 1.72 Legacy EQ net income/earnings per dliuted share (3,324)$ (0.15)$ (19,721)$ (0.91)$ $(23,045) $ (1.06) 3,496$ 0.16$ 895$ 0.04$ $ 4,391 $ 0.20 (18,654)$ (0.86)$ Plus: seller transaction/business development costs, net of tax 437 0.02 13,469 0.62$ 13,906 0.64 - - - - - - 13,906 0.64$ Plus: management fees and other adjustments, net of tax 118 0.01 2,179 0.10$ 2,296 0.11 - - - - - - 2,296 0.11$ Plus: legacy EQ interest expense, net of tax 1,096 0.05 1,454 0.07$ 2,551 0.12 - - - - - - 2,551 0.12$ Less: pro forma interest expense on new credit facility, net of tax (2,801) (0.13) (2,426) (0.11)$ (5,227) (0.24) - - - - - - (5,227) (0.24)$ Plus: legacy EQ intangible amortization, net of tax 2,395 0.11 4,746 0.22$ 7,141 0.33 - - - - - - 7,141 0.33$ Less: pro forma intangible amortization and depreciation, net of tax (624) (0.03) (1,044) (0.05)$ (1,668) (0.08) - - - - - - (1,668) (0.08)$ Plus: legacy EQ accretion and closure/post-closure expense, net of tax 290 0.01 355 0.02$ 644 0.03 - - - - - - 644 0.03$ Less: pro forma accretion and closure/post-closure expense, net of tax (356) (0.02) (363) (0.02)$ (719) (0.03) - - - - - - (719) (0.03)$ Plus: intercompany transactions with legacy US Ecology, net of tax 81 0.00 30 0.00$ 111 0.01 - - - - - - 111 0.01$ Plus / (less): pro forma tax benefit / (expense) adjustment 118 0.01 (471) (0.02)$ (353) (0.02) - - - - - - (353) (0.02)$ Legacy EQ pro forma net income/earnings per diluted share $ (2,570) $ (0.12) $ (1,792) $ (0.08) $ (4,362) $ (0.20) $ 3,496 $ 0.16 $ 895 $ 0.04 $ 4,391 $ 0.20 $ 29 $ 0.00 US Ecology pro forma net income/earnings per diluted share 6,856$ 0.32$ 7,757$ 0.36$ 14,613$ 0.68$ 13,543$ 0.62$ 9,191$ 0.42$ 22,735$ 1.04$ 37,348$ 1.72$ Shares used in earnings per diluted share calculation 21,475 21,667 21,680 21,673 21,655 For the six months Ended 6/30/2014 For the quarter ended For the quarter ended For the year 3/31/2014 6/30/2014 9/30/2014 12/31/2014 Ended 12/31/2014 For the six months Ended 12/31/2014 1 Pro forma Diluted Earnings Share reflects diluted EPS as if the EQ transaction had occurred on January 1, 2014
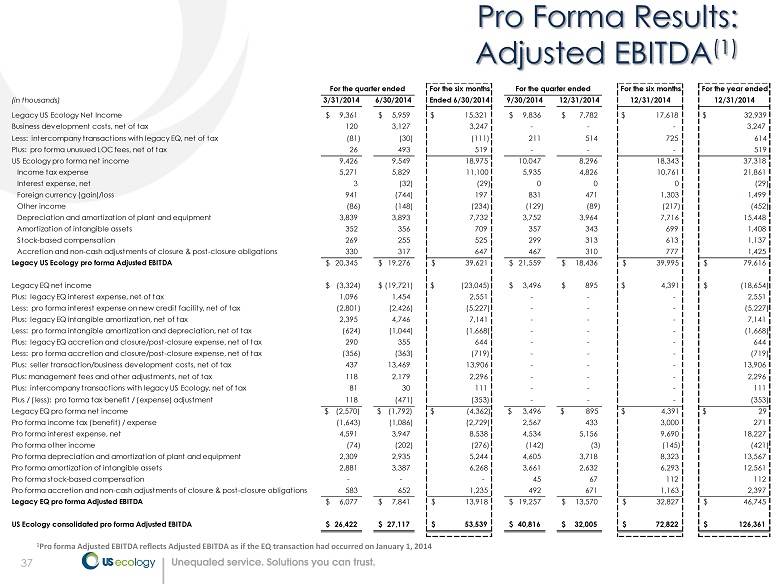
expense, net of tax (356) (363) (719) - - - (719) Plus: seller transaction/business development costs, net of tax 437 13,469 13,906 - - - 13,906 Plus: management fees and other adjustments, net of tax 118 2,179 2,296 - - - 2,296 Plus: intercompany transactions with legacy US Ecology, net of tax 81 30 111 - - - 111 Plus / (less): pro forma tax benefit / (expense) adjustment 118 (471) (353) - - - (353) Legacy EQ pro forma net income $ (2,570) $ (1,792) $ (4,362) $ 3,496 $ 895 $ 4,391 $ 29 Pro forma income tax (benefit) / expense (1,643) (1,086) (2,729) 2,567 433 3,000 271 Pro forma interest expense, net 4,591 3,947 8,538 4,534 5,156 9,690 18,227 Pro forma other income (74) (202) (276) (142) (3) (145) (421) Pro forma depreciation and amortization of plant and equipment 2,309 2,935 5,244 4,605 3,718 8,323 13,567 Pro forma amortization of intangible assets 2,881 3,387 6,268 3,661 2,632 6,293 12,561 Pro forma stock-based compensation - - - 45 67 112