Attached files
| file | filename |
|---|---|
| EX-5.1 - EX-5.1 - VWR Corp | d927796dex51.htm |
| EX-23.1 - EX-23.1 - VWR Corp | d927796dex231.htm |
Table of Contents
As filed with the Securities and Exchange Commission on May 21, 2015
No. 333-
UNITED STATES
SECURITIES AND EXCHANGE COMMISSION
Washington, D.C. 20549
FORM S-1
REGISTRATION STATEMENT
UNDER
THE SECURITIES ACT OF 1933
VWR Corporation
(Exact name of registrant as specified in its charter)
| Delaware | 5040 | 26-0237871 | ||
| (State or other jurisdiction of incorporation or organization) |
(Primary Standard Industrial Classification Code Number) |
(I.R.S. Employer Identification Number) |
Radnor Corporate Center
Building One, Suite 200
100 Matsonford Road
Radnor, Pennsylvania 19087
(610) 386-1700
(Address, including zip code, and telephone number, including area code, of registrant’s principal executive offices)
George Van Kula
Senior Vice President, Human Resources, General Counsel and Secretary
Radnor Corporate Center
Building One, Suite 200
100 Matsonford Road
Radnor, Pennsylvania 19087
(610) 386-1700
(Name, address, including zip code and telephone number, including area code, of agent for service)
Copies of all communications, including communications sent to agent for service, should be sent to:
| Dennis M. Myers, P.C. | Jonathan A. Schaffzin William J. Miller | |
| Kirkland & Ellis LLP | Cahill Gordon & Reindel LLP | |
| 300 North LaSalle | 80 Pine Street | |
| Chicago, Illinois 60654 | New York, New York 10005 | |
| (312) 862-2000 | (212) 701-3000 |
Approximate date of commencement of proposed sale to the public: As soon as practicable after this Registration Statement becomes effective.
If any of the securities being registered on this Form are to be offered on a delayed or continuous basis pursuant to Rule 415 under the Securities Act, check the following box. ¨
If this Form is filed to register additional securities for an offering pursuant to Rule 462(b) under the Securities Act, check the following box and list the Securities Act registration statement number of the earlier effective registration statement for the same offering. ¨
If this Form is a post-effective amendment filed pursuant to Rule 462(c) under the Securities Act, check the following box and list the Securities Act registration statement number of the earlier effective registration statement for the same offering. ¨
If this Form is a post-effective amendment filed pursuant to Rule 462(d) under the Securities Act, check the following box and list the Securities Act registration statement number of the earlier effective registration statement for the same offering. ¨
Indicate by check mark whether the registrant is a large accelerated filer, an accelerated filer, a non-accelerated filer, or a smaller reporting company. See the definitions of “large accelerated filer,” “accelerated filer” and “smaller reporting company” in Rule 12b-2 of the Exchange Act (Check one):
| Large accelerated filer | ¨ | Accelerated filer | ¨ | |||
| Non-accelerated filer | x (Do not check if a smaller reporting company) | Smaller reporting company | ¨ |
CALCULATION OF REGISTRATION FEE
|
| ||||||||
| Title of Each Class of Securities to be Registered |
Amount to be Registered (1) |
Proposed Maximum Offering Price Per Share (2) |
Proposed Maximum Offering Price (2) |
Amount of Registration Fee (2) | ||||
| Common Stock, $0.01 par value per share |
18,400,000 | $27.93 | $513,912,000 | $59,716.57 | ||||
|
| ||||||||
|
| ||||||||
| (1) | Includes the offering price of the shares of common stock that may be sold if the underwriters exercise their option to purchase additional shares. |
| (2) | Estimated solely for the purpose of computing the registration fee pursuant to Rule 457(a) under the Securities Act of 1933, as amended. In accordance with Rule 457(c) of the Securities Act of 1933, as amended, the price shown is the average of the high and low selling prices of the Common Stock on May 19, 2015, as reported by The Nasdaq Stock Market. |
The registrant hereby amends this Registration Statement on such date or dates as may be necessary to delay its effective date until the registrant shall file a further amendment which specifically states that this Registration Statement shall thereafter become effective in accordance with Section 8(a) of the Securities Act of 1933 or until this Registration Statement shall become effective on such date as the Commission, acting pursuant to said Section 8(a), may determine.
Table of Contents
The information in this prospectus is not complete and may be changed. We may not sell these securities until the registration statement filed with the Securities and Exchange Commission is effective. The prospectus is not an offer to sell these securities nor a solicitation of an offer to buy these securities in any jurisdiction where the offer and sale is not permitted.
Subject to Completion
Preliminary prospectus dated May 21, 2015
P R O S P E C T U S
16,000,000 Shares
VWR Corporation

Common Stock
The selling stockholder is offering 16,000,000 shares of our common stock. We will not receive any proceeds from the sale of shares by the selling stockholder.
Our common stock is listed on The NASDAQ Global Select Market under the symbol “VWR.” On May 20, 2015, the last sale of our common stock as reported on NASDAQ was $27.68 per share.
Investing in our common stock involves risks that are described in the “Risk Factors” section beginning on page 17 of this prospectus.
| Per Share |
Total | |||||||
| Public offering price |
$ | $ | ||||||
| Underwriting discounts |
$ | $ | ||||||
| Proceeds, before expenses, to the selling stockholder |
$ | $ | ||||||
The selling stockholder identified in this prospectus has granted the underwriters an option to purchase, on the same terms and conditions as set forth above, up to an additional 2,400,000 shares within 30 days from the date of this prospectus. We will not receive any of the proceeds from the sale of shares by the selling stockholder if the underwriters exercise their option to purchase additional shares.
Neither the Securities and Exchange Commission (the “SEC”) nor any state securities commission has approved or disapproved of these securities or determined if this prospectus is truthful or complete. Any representation to the contrary is a criminal offense.
The underwriters expect to deliver the shares on or about , 2015.
| BofA Merrill Lynch |
Goldman, Sachs & Co. |
J.P. Morgan |
The date of this prospectus is , 2015.
Table of Contents

Table of Contents
| Page | ||||
| ii | ||||
| iii | ||||
| 1 | ||||
| 12 | ||||
| 17 | ||||
| 35 | ||||
| 37 | ||||
| 37 | ||||
| 38 | ||||
| 39 | ||||
| UNAUDITED PRO FORMA CONDENSED CONSOLIDATED FINANCIAL STATEMENTS |
41 | |||
| 46 | ||||
| MANAGEMENT’S DISCUSSION AND ANALYSIS OF FINANCIAL CONDITION AND RESULTS OF OPERATIONS |
49 | |||
| 84 | ||||
| 105 | ||||
| 114 | ||||
| 116 | ||||
| 120 | ||||
| 125 | ||||
| 130 | ||||
| CERTAIN U.S. FEDERAL INCOME AND ESTATE TAX CONSIDERATIONS FOR NON-U.S. HOLDERS |
132 | |||
| 136 | ||||
| 143 | ||||
| 143 | ||||
| 143 | ||||
| 144 | ||||
We have not and the underwriters have not authorized anyone to provide you with any information other than that contained in this prospectus or in any free writing prospectus prepared by or on behalf of us or to which we have referred you. This prospectus is an offer to sell only the shares offered hereby, but only under circumstances and in jurisdictions where such offers and sales are permitted. The information in this prospectus or any free writing prospectus is accurate only as of its date, regardless of its time of delivery or the time of any sale of shares of our common stock. Our business, financial condition, results of operations and prospects may have changed since that date.
Table of Contents
MARKET, RANKING AND OTHER INDUSTRY DATA
This prospectus includes industry data, forecasts and information that we have prepared based, in part, upon data, forecasts and information obtained from independent industry publications and surveys and other information available to us. The data included in this prospectus regarding our market share position in the laboratory products market is based on our 2014 net sales as compared to other participants in such market. Our belief that we have the #1 market share position in Europe and the #2 market share position in North America in the approximately $39 billion global laboratory products market is based primarily upon our experience within this market, its competitive landscape and our internal estimates as to the sales generated by our principal competitors from the sale of laboratory products, services and solutions. We have made certain adjustments to the financial information publicly reported by these principal competitors to exclude sales generated from the sale of certain other medical products to the European and North American markets. Similarly, our belief that we have the broadest Pan-European platform is based on a comparison of the number of countries that we serve versus our principal competitor as estimated by us based on customer feedback. The industry publications we reference herein include Frost & Sullivan’s 2014 Annual Report: Forecast and Analysis of the Global Market for Laboratory Products (published October 2014) and R&D Magazine’s 2014 Global R&D Funding Forecast (published December 2013). References in this prospectus to the approximately $39 billion global laboratory products market are based upon the global sales of laboratory products in 2013, as calculated by Frost & Sullivan. References in this prospectus to the size of the laboratory services market and the laboratory chemicals market are based upon the global 2013 sales into such markets as calculated by Frost & Sullivan in a report commissioned by us titled Market Size of Global and U.S. Laboratory Services Market and Laboratory Chemicals Market Clarification (commissioned July 2014). References in this prospectus to the size of the bioprocess chemicals and consumables market are based upon the global 2013 sales into such market as calculated by Frost & Sullivan in a report commissioned by us titled US and Global Validation of the Bioprocess Chemicals and Consumables Market (commissioned August 2014). References in this prospectus to the estimated $1.6 trillion global investment in research and development in 2014, including spending in such industries as life science (approximately $200 billion), energy (approximately $20 billion) and chemistry and advanced materials (approximately $45 billion), are based upon estimates provided by R&D Magazine.
Some data is also based on our good faith estimates, which are derived from management’s knowledge of the industry and independent sources. Industry publications, surveys and forecasts generally state that the information contained therein has been obtained from sources believed to be reliable, but there can be no assurance as to the accuracy or completeness of included information. We have not independently verified any of the data from third-party sources nor have we ascertained the underlying economic assumptions relied upon therein. Statements as to our market position are based on market data currently available to us. While we are not aware of any misstatements regarding the industry data presented herein, our estimates involve risks and uncertainties and are subject to change based on various factors, including those discussed under the heading “Risk Factors” in this prospectus. Similarly, we believe our internal research is reliable, even though such research has not been verified by any independent sources.
ii
Table of Contents
We have included both financial measures compiled in accordance with generally accepted accounting principles in the United States (“GAAP”) and certain non-GAAP financial measures in this registration statement, of which this prospectus forms a part, including Adjusted EBITDA, Adjusted Net Income, Adjusted EPS, Net Debt and Free Cash Flow (the “Non-GAAP Measures”) and certain ratios derived therefrom. These Non-GAAP Measures, as presented in this prospectus, are supplemental measures of our financial performance that are not required by, or presented in accordance with, GAAP. These Non-GAAP Measures are not measures of our financial performance under GAAP and should not be considered as alternatives to net sales, net income or loss, earnings per share or total indebtedness or any other performance measure derived in accordance with GAAP or as an alternative to cash flow from operating activities as a measure of liquidity.
We calculate Adjusted Net Income by excluding the following pre-tax items from net income: (i) amortization of acquired intangible assets; (ii) net foreign currency remeasurement gain or loss from financing activities; (iii) charges for restructuring and other cost-reduction initiatives; (iv) impairment charges; (v) gain or loss from business disposals; (vi) loss on extinguishment of debt; (vii) charges associated with executive departures; and (viii) other costs or credits that are either isolated or cannot be expected to recur with any regularity or predictability. From this amount, we then add or subtract an assumed incremental income tax impact on the above noted pre-tax adjustments using estimated tax rates.
We calculate Adjusted EBITDA by excluding the following items from Adjusted Net Income: (i) interest expense, net of interest income; (ii) depreciation expense; (iii) share-based compensation expense; and (iv) income tax provision applicable to Adjusted Net Income.
We calculate Adjusted EPS by dividing our Adjusted Net Income by our weighted average shares outstanding on a diluted basis as adjusted for an amount of shares that would have been reported under GAAP had our initial public offering and the recapitalization occurred at the beginning of the earliest period presented.
Beginning in the first quarter of 2015, we changed our calculations of Adjusted Net Income and Adjusted EPS so that they include share-based compensation expense. Adjusted EBITDA continues to exclude share-based compensation expense. Historical Adjusted Net Income and Adjusted EPS for the years ended December 31, 2014, 2013 and 2012 have been restated herein to reflect the new method of calculation.
Net Debt is our total debt and capital lease obligations less our cash equivalents and compensating cash balance.
Free Cash Flow is our net cash provided by or used in operating activities less capital expenditures.
We believe the presentation of these Non-GAAP Measures enhances an investor’s understanding of our financial performance as it provides investors with a useful tool for assessing the comparability between periods of our ability to generate cash from operations sufficient to pay taxes, to service debt and to undertake capital expenditures. We consider these Non-GAAP Measures to be key indicators of our operating performance and use them for planning purposes and in measuring our performance relative to that of our competitors. We believe that Non-GAAP Measures are useful financial metrics to assess our operating performance from period to period by excluding certain items that we believe are not representative of our core business. You are encouraged to evaluate each adjustment and the reasons we consider it appropriate for supplemental analysis.
Our Non-GAAP Measures have limitations as analytical tools, and you should not consider them in isolation, or as a substitute for analysis of our results as reported under GAAP. Some of these limitations are:
| • | the Non-GAAP Measures do not reflect changes in, or cash requirements for, our working capital needs; |
| • | Adjusted EBITDA does not reflect our interest expense, or the cash requirements necessary to service interest or principal payments, on our debt and capital lease obligations; |
iii
Table of Contents
| • | Adjusted EBITDA does not reflect our tax expense or the cash requirements to pay our taxes; |
| • | although depreciation and amortization are non-cash in nature, the assets being depreciated and amortized will often have to be replaced in the future, and Adjusted EBITDA and, with respect to acquired intangible assets, Adjusted Net Income do not reflect any cash requirements for such replacements; |
| • | the Non-GAAP Measures do not reflect historical cash expenditures or future requirements for capital expenditures or contractual commitments; and |
| • | the Non-GAAP Measures include adjustments that represented a cash expense or that represented a non-cash charge that may relate to a future cash expense, and some of these expenses are of a type that we expect to incur in the future, although we cannot predict the amount of any such future charges. |
Because of these limitations, these Non-GAAP Measures should not be considered as a replacement for net income or loss or as measures of discretionary cash available to us to service our indebtedness or invest in our business. We compensate for these limitations by relying primarily on our GAAP results and using Non-GAAP Measures only for supplemental purposes.
For the definition of and additional information about our Adjusted EBITDA and Adjusted Net Income, a description of how Adjusted EBITDA and Adjusted Net Income are calculated, and a reconciliation of Adjusted EBITDA and Adjusted Net Income to the most directly comparable GAAP measure, see footnote (5) to “Prospectus Summary—Summary Historical Consolidated Financial Data” in this prospectus.
For the definition of and additional information about our Adjusted EPS, Net Debt and Free Cash Flow, a description of how such measures are calculated, and a reconciliation of such measures to the most directly comparable GAAP measure, see “Management’s Discussion and Analysis of Financial Condition and Results of Operations” in this prospectus.
iv
Table of Contents
The following summary highlights selected information about this offering and our business. It does not contain all of the information that may be important to you. You should read this entire prospectus, including the information described under the heading “Risk Factors” and the consolidated financial statements and related notes incorporated by reference in this prospectus, before deciding to invest in our stock. Some of the statements in this prospectus constitute forward-looking statements. See “Cautionary Factors Regarding Forward-Looking Statements.” Please see “Market, Ranking and Other Industry Data” for important information as to how we determined our competitive position and other industry data set forth in this prospectus.
Except as otherwise stated or required by the context, references in this prospectus to: (i) the “Company,” “VWR,” “we,” “us” and “our” refer to VWR Corporation and its consolidated subsidiaries; (ii) “VWR Funding” refers to our direct wholly-owned subsidiary, VWR Funding, Inc.; (iii) “Sponsors” collectively refers to the general partners of our largest equity investors, Madison Dearborn Partners, LLC (“Madison Dearborn Partners”) and Avista Capital Partners, L.P. (“Avista”); and (iv) our recent acquisitions are identified by reference to the defined terms as set forth in Note 5 to our annual consolidated financial statements incorporated by reference in this prospectus.
Our Company
We are a leading, independent provider of laboratory products, services and solutions to the global life science, general research and applied markets. We have significant market share positions in Europe and North America. We also have operations in Asia-Pacific and other key emerging markets to support our multinational customers across the globe. We serve a critical role in connecting customer sites with core laboratory product suppliers across multiple industries and geographies. We offer one of the broadest portfolios of branded and private label laboratory products. We also offer a full range of value-added services, including custom manufacturing, to meet our customers’ needs. These services represent a growing but currently small portion of our overall net sales. We offer a wide selection of unique products and have developed an extensive global infrastructure including thousands of sales and service-focused professionals. We deliver value to our customers by improving the costs, efficiency and effectiveness of their research laboratories and production operations. We deliver value to our suppliers by providing them with cost-effective channel access to a global and diverse customer base.
Our portfolio includes chemicals, reagents, consumables, durable products and scientific equipment and instruments with a range of complexity and sophistication. We offer most of the leading branded products to the customer segments we serve. Our private label products enhance our branded product offerings by providing additional choice at varying price points to our customers. We complement our branded and private label product portfolio with value-added service offerings marketed under the “VWRCATALYST” brand, including sourcing and procurement, logistics, chemical and equipment tracking and sample management. We have recently expanded our service offerings to include more complex scientific research support services, such as DNA extraction, bioreactor servicing and compound management. In addition, we offer custom manufacturing solutions, including buffers, reagents and other chemicals used in biopharmaceutical and industrial applications and production processes. We believe these growing value-added service offerings integrate us within our customers’ critical operational processes and further differentiate our value proposition from that of our competitors. We believe our range of offerings and capabilities enhances our ability to expand our addressable market and gain market share leading to incremental net sales and profits.
Over our 163-year history, we have built longstanding and extensive customer relationships. We provided solutions to approximately 120,000 customers in 2014, including over 230 Fortune 500 companies, approximately 5,000 leading academic institutions and thousands of smaller businesses in multiple industries. Our broad and diverse customer base includes pharmaceutical, biotechnology, agricultural, chemical, environmental, food and beverage, healthcare, microelectronic and petrochemical companies, as well as
Table of Contents
educational and governmental institutions. Our global infrastructure and extensive inventory enable us to serve our customers in and across multiple geographies, and our local presence enables us to provide them with tailored expertise and support. We have developed global strategic relationships with our largest customers through which we centrally manage and actively collaborate with them, help optimize the efficiency of their research, production and procurement activities and support them with dedicated on-site professionals and technicians. Because we source substantially all of our products from third-parties, we are independent and able to provide our customers with access to an unbiased and broad selection of products.
We also have longstanding and extensive supplier relationships and serve as the largest, independent channel in the laboratory products market for many of our suppliers. Our supplier base is comprised of approximately 4,500 core laboratory product suppliers located across the globe. In 2014, our five largest suppliers were Corning, Eppendorf, GE Healthcare, Merck KGaA and Thermo Fisher Scientific. We strive to maintain strong relationships with our suppliers, and most of our larger suppliers have been with us for more than 20 years. We are also an important market channel for thousands of specialized manufacturers of complex and sophisticated scientific tools. Our suppliers rely upon our global network to reach a diverse customer base and to minimize the need for in-house distribution capabilities, thereby enabling them to allocate more resources to their core competencies. Our strategy within our manufacturing operations is generally to avoid competing with our suppliers’ product offerings. We believe that this independence is valued by our suppliers.
Our global infrastructure consists of over 160 facilities located in 34 countries, which enable us to deliver a broad array of products to our customers generally within 24 to 48 hours. We also have approximately 3,100 sales and sales support professionals operating locally and managing comprehensive industry-specific marketing programs, emphasizing tailored catalogs, websites and direct mailings in multiple languages. Our two low-cost offshore captive service centers employ an additional 800 associates who provide commercial and administrative support services to us, our customers and suppliers. We have made significant investments in our infrastructure, including approximately $70 million recently to expand and upgrade distribution facilities and implement a common enterprise resource planning and global website platform. During 2014, on average we processed approximately 17,000 customer orders per day, with an average order size of approximately $700. Over half of our customer orders came from our e-commerce platforms, including many from customers that have an e-commerce integration with us. We believe our global infrastructure and our longstanding customer and supplier relationships provide us with a sustainable competitive advantage given the significant time and costs required to develop and maintain them. We expect to continue to benefit from our global infrastructure and capabilities as we execute on our growth strategies.
Our growth strategies include expanding our global strategic relationships, developing complementary new products and services, expanding our customer and supplier base, implementing our best practices across our operations, broadening our offerings to underserved customer segments and executing our targeted acquisition strategy. We generated net sales of $1,029.6 million, Adjusted EBITDA of $106.8 million, Adjusted Net Income of $43.8 million and net income of $71.5 million for the three months ended March 31, 2015. We generated net sales of $4,375.3 million, Adjusted EBITDA of $449.4 million, Adjusted Net Income of $158.3 million and net income of $152.6 million for the year ended December 31, 2014. Since 2006, the year prior to our acquisition by the Sponsors, we have been able to increase net sales and Adjusted EBITDA at compound annual growth rates of 3.8% and 8.5%, respectively, we have improved our gross margin from 27.1% to 28.4% and we have improved our Adjusted EBITDA margin from 7.2% to 10.3% through 2014. See “Summary Historical Consolidated Financial Data” for the definitions of Adjusted EBITDA and Adjusted Net Income, the reason for their inclusion and a reconciliation from net income to Adjusted Net Income and Adjusted EBITDA.
2
Table of Contents
Industry Overview
We operate primarily in the global life science, general research and applied markets, which include customers in the Biopharma sector, as well as industries such as agriculture, chemical, environmental, food and beverage, healthcare, microelectronic and petrochemical. Our product offering to these customers has primarily consisted of laboratory products, which we estimate generated approximately $39 billion of global sales in 2013 based on Frost & Sullivan estimates, and continues to be our largest single market. According to Frost & Sullivan, the global laboratory products market is projected to continue to expand by 2% annually through 2015. We recently began offering additional complex value-added services in the laboratory services market, which Frost & Sullivan estimated in a study commissioned by us to be approximately $4 billion in 2013 and growing in the high single to low teen digits. We have also expanded our internal bioprocess chemicals and consumables manufacturing business, which provides products and chemicals used in the production of biopharmaceuticals, diagnostics and other products, both through organic efforts and through targeted acquisitions. In a study commissioned by us, Frost & Sullivan estimated the bioprocess chemicals and consumables market to be approximately $6 billion in 2013 and growing at approximately 10% to 12% annually. Further, we are expanding our offering of products and services in sectors such as certain production and industrial segments. As a result of the addition of these new services and customer categories, we believe we have expanded our total addressable market.
The following table presents the primary applications of our products, services and solutions for the customers in each industry we serve:
| Industry Sectors |
Applications | |
| Biopharma |
Discovery, development and production of therapeutics, including compliance with Food and Drug Administration requirements for quality testing, documentation and supply chain security | |
| Agriculture |
Research related to plants, animals and fungi aimed at increasing quality, yields and resistance to environmental conditions | |
| Chemical |
Chemical research and development, analytical testing and production of chemicals | |
| Environmental |
Testing of water and other materials to ensure adherence to regulatory requirements or specifications | |
| Food and Beverage |
Testing of ingredients and final food and beverage products to ensure public health and safety | |
| Healthcare |
Testing of specimens by medical or clinical laboratories to gain information about the health of a patient | |
| Microelectronic |
Production of semiconductor products and applications in controlled environments | |
| Petrochemical |
Testing of raw materials, intermediates and final products to ensure adherence to specifications | |
The global laboratory products market is highly fragmented. We estimate that its two largest participants, us and the laboratory product distribution and service business of Thermo Fisher Scientific, accounted for approximately 28% of this market’s aggregate sales in 2014. Most other participants are either regional and specialty distributors or manufacturers that sell directly to their customers. Due to the large number of laboratory product suppliers and distributors, customers have historically been required to maintain a complex procurement infrastructure in order to source their desired products. Customers are increasingly seeking to reduce the total cost of procurement by eliminating complexity and improving the effectiveness of their supply chain by utilizing a full service platform such as VWR.
3
Table of Contents
In addition to requiring laboratory products, participants in the global life science, general research and applied market industries also utilize a range of value-added services. These services historically comprised stockroom and other operational services performed at customer locations. We believe that these customers are beginning to look to outsource components of their scientific and more complex activities to focus on their core high science research activities rather than performing routine scientific processes.
We also serve the production operations of customers who are engaged in the manufacture of biotechnology products, clinical and molecular diagnostic products and semiconductors. Manufacturers of biotechnology products and clinical and molecular diagnostic products require a range of chemicals to optimize and ensure consistent quality of their production products. Manufacturers of semiconductors require products and services to ensure that their manufacturing environments are sterile.
Laboratory Products and Services
The laboratory products market traditionally encompasses chemicals and reagents, consumables and instruments and equipment. Chemicals and reagents used in the laboratory products market are essential to the daily operating activities of laboratories and are typically used in a variety of research and laboratory applications, including the routine laboratory activities, quality control testing and more sophisticated operations, including nucleic acid isolation and purification, protein extraction and fractionation, cell culture and related assays. Laboratory consumables include plasticware, glassware and other general laboratory supplies, such as pipettes, tubing, gloves, gowns and other products utilized in the daily operations of a laboratory. Instrument and equipment products include general laboratory equipment, instrumentation and furniture and includes products such as centrifuges, fume hoods, workstations, ovens, microscopes, lab furniture, refrigerators, freezer and other lab equipment and instruments.
The laboratory services market comprises basic operational services designed to improve laboratory efficiency and scientific services of varying degrees of complexity. Examples of operational services include autoclaving, product tracking and other services. In addition, we also provide services to manufacturers of aerospace, microelectronics and medical devices. Value-added services are utilized within three segments: scientific services, laboratory management and research services.
Industry Trends
We believe there are several key trends impacting our customers, suppliers, and our customer segments that will drive increased demand for our products and services:
| • | Continued globalization of our largest customers. As our largest customers across all industry sectors grow and expand their research operations geographically, we believe they will further turn to suppliers that have the scale and global reach to address their needs across all geographies. Additionally, many of our multinational customers are centralizing and standardizing core research procurement and other processes and are consolidating the number of suppliers of products and related services with whom they do business. |
| • | Positive research and development trends in life science. Based on R&D Magazine, we estimate that global investment in research and development will be approximately $1.6 trillion in 2014 and that spending across life science in 2013 was approximately $200 billion, of which 85% came from Biopharma. Life science spending grew at a compound annual growth rate of approximately 3% since 2011 and this spending is expected to continue to grow at a similar rate in 2014. Within the Biopharma industry, we serve large Biopharma companies as well as early-stage biotechnology companies, contract research organizations and academic institutions, which have been growing at a higher rate than the larger pharmaceutical companies as a whole and we expect this trend to continue. We believe these early-stage biotechnology companies and institutions are generally more reliant upon solution providers like us due to their limited resources in procurement and focus on core research operations. |
4
Table of Contents
| • | Increase in research and development in applied markets. The estimated $1.6 trillion of global research and development spending in 2014 includes spending in various applied markets such as energy of approximately $20 billion and chemistry and advanced materials of approximately $45 billion. According to R&D Magazine, forecasted 2014 growth rates within those industries are expected to be approximately 5%. We provide laboratory products and services to companies across these industries in the geographies we serve with our global network. We believe we are well positioned to address the needs of these customers based on our infrastructure, broad product portfolio and ability to provide value-added services. |
| • | Heightened regulation and public scrutiny in applied markets. The industries we serve are increasingly subject to heightened regulation and public scrutiny in the United States and globally in a number of areas, including clinical operations, post-marketing drug safety reporting, environmental impact and quality control activities around manufacturing operations. For example, recent highly publicized food quality outbreaks have intensified scrutiny on food safety and the REACH legislation in Europe, which became effective on June 1, 2007, requires manufacturers and end-users of certain chemicals to adopt additional safety, testing and reporting measures. We believe the increased scrutiny both by regulatory agencies and the public are driving an increase in demand for laboratory testing products and services in these industries. |
| • | Recent increase in biotechnology research activity. Demand for laboratory products and services has been positively impacted by recent increases in early-stage biotechnology funding driven by new scientific breakthroughs and their commercial promise such as development of targeted therapeutics and applications for genomics. Our biotechnology customers often lack the laboratory operations of large, multinational corporations, and our expertise in this area helps them to complement their resources and manage complexity. Spending in research by these companies and institutions has provided an increase in demand for the full breadth of laboratory products and services. |
| • | Current government and education budgets. The improving budgetary situations in North America and Europe create a positive funding environment for research and educational spending across our government and academic customer bases. For example, the federal budget approved by the U.S. Congress in January 2014 included a 3.5% increase in funding for the National Institutes of Health. Additionally, the European Parliament approved in November 2014 the Horizon 2020 research funding initiative, which allocated €80 billion of spending through 2020 to research areas including basic science, researcher mobility, large infrastructure projects and emerging industrial technologies. As budgetary conditions in these geographies continue to improve, we would expect our government and education customer bases to increase spending on science education, basic science and more complex research activities. |
Our Competitive Strengths
We believe we are well positioned to capitalize on key trends occurring in the life science, general research and applied markets as a result of the following competitive strengths:
Global scale and leading positions in attractive markets. We have the #1 market position in Europe and the #2 market position in North America in the approximately $39 billion global laboratory products market. We have the broadest Pan-European platform, which enables us to reach customers throughout Europe with industry-leading efficiency and service levels. We are able to serve our customers on a worldwide basis utilizing our global infrastructure, which includes over 4.5 million square feet of distribution and manufacturing space strategically located in approximately 50 cities worldwide. We operate primarily in North America and Europe, as well as select emerging markets that are most critical to our customers, including Asia-Pacific, Eastern Europe and Central and South America. We believe our global infrastructure provides us with a competitive advantage in offering a comprehensive laboratory solution to our customers as they continue to expand globally and consolidate supplier relationships.
5
Table of Contents
Unparalleled customer access. During 2014, we shipped products to approximately 290,000 unique customer sites globally, and believe we are the only company in the laboratory products market reaching customers located in over 160 countries. We offer our suppliers access to our broad and diverse customer base, which includes Biopharma, agriculture, chemical, environmental, food and beverage, healthcare, microelectronic and petrochemical companies, as well as educational and governmental institutions. We are the primary supplier of laboratory products to many Fortune 500 and leading European companies, including a majority of the world’s 20 largest pharmaceutical companies as well as leading academic institutions. By utilizing our global infrastructure, both large multinational and specialized smaller suppliers have immediate worldwide access to thousands of potential end users of their products.
Depth of product and service offering. We provide our customers with access to an industry-leading portfolio of over three million unique products at various price levels and offer them numerous value-added services. We offer a broad and unbiased selection of branded, private label and internally manufactured products, allowing for a “best-of-breed” procurement strategy. For example, we are able to provide the full suite of products necessary to perform a wide range of scientific workflows, in areas such as genomics, proteomics, cell biology and microbiology. We continue to expand our VWRCATALYST branded suite of value-added services, including research support, laboratory services and operational services. In most cases, we integrate these services with our product solutions to enable us to offer a comprehensive laboratory solution to our global strategic customers.
Tailored marketing strategies. We have developed customer segment-focused marketing strategies that enable our customers to efficiently identify and access their relevant product needs in multiple languages. For example, we have developed a wide variety of customer segment catalogs and specialized capabilities on our websites resulting in a personalized purchasing experience for customers. Our websites utilize enhanced search analytics and feature personalized search tools, customer specific web solutions as well as enhanced data on over 2.1 million products, all of which allow us to optimize the online purchasing experience.
Large and focused direct selling organization. We have a large and experienced team of approximately 3,100 sales and sales support professionals providing multi-brand solutions worldwide. Our sales force includes approximately 280 specialists serving areas such as life science, chromatography, production chemicals and furniture and is relied upon by multiple suppliers as the primary commercial organization responsible for promotion of their products. Our two low-cost offshore captive service centers employ an additional 800 associates who provide commercial and administrative support services to us and our customers and suppliers. Our sales associates develop dedicated relationships by frequently meeting with existing and new customers, providing advice on the broad spectrum of our products and creating solutions for our customers’ complex product and service needs. The deep industry knowledge of our dedicated sales, sales support and marketing resources within each of our customer segments allows us to understand our customers’ needs and provide them with value-added solutions.
Strong track record of identifying and successfully integrating acquisitions. Since June 30, 2007, we have invested over $600 million to acquire and successfully integrate 38 businesses, which have strengthened our existing market positions, expanded our geographic presence and broadened our product offerings. For example, in February 2011, we acquired AMRESCO, which strengthened our portfolio of biochemicals, diagnostics, chemicals and reagents, and in June 2012, we acquired basan GmbH, which expanded our presence and clean room product portfolio in Europe and Asia. Most recently, we acquired Hichrom Limited, a leading manufacturer and distributor of high performance liquid chromatography columns and consumables, in May 2015. We also have a proven capability of completing acquisitions in emerging markets. As a result of recent investments in our information technology and distribution infrastructure, we have the capability to rapidly integrate additional acquisitions as we continue to consolidate the fragmented global laboratory products industry. We are typically able to improve the growth and the profitability of acquired businesses by providing them with access to our
6
Table of Contents
global platform and integrating them into our enterprise resource planning and web systems, streamlining various back-office functions and consolidating facilities when appropriate.
Attractive financial profile. Our business is characterized by stable and recurring revenues, the ability to achieve operating leverage and strong cash flow generation. Most of our products are consumable in nature and are generally sold on a recurring basis. In 2014, consumable products and value-added services accounted for approximately 80% of our net sales. We believe our business benefits from operating leverage due to the capacity and efficiency of our infrastructure, which allows us to achieve margin improvement with an increasing revenue base. As a result, while our net sales have grown at a compound annual growth rate of 4.7% from 2010 to 2014, our Adjusted EBITDA has grown at a compound annual growth rate of 5.8% over the same period. Our business generates strong cash flow, which we expect to further improve as a result of the completion of a major infrastructure improvement program commenced in 2012, our low ongoing capital expenditure requirements and reduced interest expense.
Experienced management team with proven track record. Our six-member senior executive team has an average of 18 years of industry experience and an average of ten years of service with us. This team along with over 200 senior managers, who have collectively invested approximately $26 million in our business, has a proven track record of delivering stable revenue growth, executing on investment plans and achieving margin expansion. We believe that the interests of our senior management team and other key employees are aligned with those of our shareholders as a result of their broad-based equity ownership and incentive arrangements.
Our Growth Strategies
We believe we are well positioned to expand our leadership in the laboratory products market and increase our sales to the global life science, general research and applied markets. Our growth strategies allowed us to achieve 3.6% year-over-year growth in net sales from comparable operations in the three months ended March 31, 2015, with recent acquisitions contributing an additional 2.1% in year-over-year growth. In the Americas segment, comprised of North, Central and South America, our net sales from comparable operations increased 5.1% while recent acquisitions contributed an additional 2.7% in year-over-year growth. In the EMEA-APAC segment, comprised of Europe, the Middle East, Africa and Asia-Pacific, our net sales from comparable operations increased 1.9% and recent acquisitions added 1.4% to the year-over-year growth. The key components of our strategy include:
Expand our global strategic relationships. We intend to expand our relationships with our global strategic customers by becoming their primary source of laboratory solutions and providing them with value-added services across all of their operations and locations. For example, we have recently expanded our service offerings to include more complex scientific research support services, such as DNA extraction, bioreactor servicing and compound management. We plan to continue to develop additional complex scientific research support services, as technological advancements enable historically challenging and proprietary processes to become available for outsourcing. We believe these services and expanded relationships are becoming increasingly important for our customers and provide us with an incremental revenue opportunity.
Continue to develop new products and services. We intend to continue augmenting our portfolio to provide customers with additional solutions and further expand our addressable markets. Key elements of this strategy include:
| • | Increase sales of higher margin private label products. We intend to further expand our private label portfolio and focus our sales and marketing efforts to offer our customers private label alternatives when appropriate. Private label products provide our customers with a value-focused alternative to branded products and generally allow us to earn higher margins. |
| • | Expand VWRCATALYST services. We have expanded upon our traditional services to offer other innovative, flexible and customized solutions to our global strategic customers, including research |
7
Table of Contents
| support, laboratory services and operations services marketed under the VWRCATALYST brand. We intend to continue to expand the scope of the services that we can provide to our customers and increase the adoption of these services by new and existing customers. |
| • | Expand chemical manufacturing capabilities. We are focused on enhancing our capabilities as a manufacturer of high quality biochemicals, chemicals and reagents that generally do not compete with the offering of our existing supplier base. Our chemicals and reagents typically have higher margins than other products in our portfolio and provide us with additional opportunity to expand into growing customer segments. |
Continue to expand our customer and supplier base. We intend to continue to expand our customer and supplier base by:
| • | aggressively targeting new customers through our experienced and global sales and sales support teams; |
| • | collaborating with our customers as they continue to add new sites as a result of acquisitions and other global expansion; |
| • | accelerating the adoption of our solutions by end-users currently utilizing a direct procurement model; and |
| • | capitalizing on our global reach to attract new suppliers to utilize VWR as their primary distribution channel. |
Globalization of best practices. We intend to continue to improve our operations by implementing best practices across our global platform. For example, we recently implemented our European sales strategy of aligning our sales team with our customer segments in our North American operations. This sales strategy has been effective in Europe because it enables us to better understand the unique industry drivers affecting our customers and tailor our product and service offerings to meet their distinct needs. Furthermore, we recently deployed in North America “all you need” catalogs for customers in the cell culture, chemical analysis, food analysis, proteomics, chemical, safety, hygiene and industrial supply industries. We have historically provided these types of catalogs to our European customers, which catalogs have proven to be an effective means in generating incremental revenue. In addition, we have recently extended our North American web platform to our European operations.
Broaden our offering to underserved customer segments. We believe that we are well positioned to leverage our leading independent platform, global distribution network and sales and service organization to continue to broaden our offering to specific underserved customer segments, such as the broader healthcare market and niche markets, such as mining and dairy. In addition, we intend to expand the use of our self-manufactured chemicals by selling these products to new and existing customers.
Continue to execute targeted acquisition strategy. Given the highly fragmented nature of our industry, we expect to continue to benefit from a robust pipeline of acquisition opportunities. We are currently evaluating multiple acquisition opportunities in North America and Europe where we seek to expand into new and growing product segments and broaden our manufactured products capabilities, while avoiding conflicts with our existing suppliers. We will also consider acquisition opportunities to support our strategic global customers in emerging markets.
8
Table of Contents
Corporate Information
The origins of our business date to 1852. We became a leader in the global laboratory products market in 2001 when our then-existing owner, Merck KGaA, combined our operations with those of its European scientific supplies distribution business under a common parent known as “VWR International Corporation.” On June 29, 2007, we were acquired by Varietal Distribution Holdings, LLC (“VWR Holdings”), a holding company owned by private equity funds managed by our Sponsors and certain members of our management who purchased equity pursuant to an equity incentive plan established at the time of the acquisition (the “VWR Acquisition”). On October 2, 2014, we listed our common stock on The NASDAQ Global Select Market under the symbol “VWR” in connection with our initial public offering (the “IPO”).
Our corporate headquarters are located at Radnor Corporate Center, Building One, Suite 200, 100 Matsonford Road, Radnor, Pennsylvania 19087. Our telephone number is (610) 386-1700, and our website address is www.vwr.com. The information on our website, however, does not constitute a part of, and is not incorporated into, this prospectus.
Summary Risk Factors
Our business is subject to a number of risks. These risks include, but are not limited to, the following:
| • | unfavorable political, economic, capital and credit market conditions in the regions where we operate; |
| • | changes in our customers’ research and development and other scientific endeavors; |
| • | changes to the life science industry; |
| • | increased competition from other companies in our industry and our ability to increase our market shares in the geographical regions where we operate; |
| • | currency risks with respect to our international operations and certain outstanding foreign-denominated debt; |
| • | our ability to maintain relationships with our customers and suppliers; |
| • | our substantial indebtedness of $2,063.3 million as of March 31, 2015, could have a material adverse effect on our financial condition and prevent us from fulfilling our debt and contractual obligations; |
| • | Madison Dearborn Partners has the ability to control significant corporate activities and their interests may not coincide with yours and conflicts of interest may arise because some of our directors are principals of our Sponsors; and |
| • | the issuer in this offering is a holding company and relies on dividends, distributions and other payments, advances and transfers of funds from its subsidiaries to meet its obligations. |
If these or any of the other risks described in the section entitled “Risk Factors” were to occur, the market price of our common stock could decline and you may lose all or part of your investment. See “Risk Factors” beginning on page 17 of this prospectus for important information regarding us and your investment.
Recent Transactions
Initial Public Offering
On October 7, 2014, we completed our IPO by issuing 25.5 million common shares at a price of $21.00 per share. After deducting underwriting discounts, commissions and other offering costs, the IPO resulted in net proceeds of $501.9 million.
9
Table of Contents
On November 5, 2014, the underwriters of the IPO purchased an additional 3.8 million shares of common stock at the public offering price of $21.00 per share under an option granted to them in connection with the IPO (the “Additional Sale”). After deducting underwriting discounts and commissions, the Additional Sale resulted in net proceeds of $75.9 million.
In anticipation of and in connection with the IPO and the Additional Sale, we entered into the following transactions (collectively, the “IPO Transactions”) that had a significant impact on our financial position and results of operations:
| • | On July 31, 2014, we completed an internal recapitalization (the “Recapitalization”), pursuant to which: (i) all then outstanding equity, consisting of 0.1 million shares of common stock (1,000 shares on a pre-split basis) and 0.4 million shares of redeemable convertible preferred stock were exchanged for 102.0 million shares (1.0 million shares on a pre-split basis) of newly-issued common stock; and (ii) 204.0 million shares (2.0 million shares on a pre-split basis) of common stock were authorized for issuance. |
| • | On October 1, 2014, we paid a $25.0 million dividend to VWR Holdings (the “Holdings Dividend”), who held all of our then outstanding common stock. |
| • | On October 7, 2014, we: (i) terminated a management services agreement with affiliates of the Sponsors; (ii) executed an income tax receivable agreement (the “ITRA”) with VWR Holdings; (iii) filed an amended and restated certificate of incorporation and amended and restated bylaws; (iv) awarded options to purchase an aggregate of approximately 3.5 million shares of our common stock to certain of our employees and directors (the “IPO Grants”) under the new VWR Corporation 2014 Equity Incentive Plan (the “2014 Equity Incentive Plan”); (v) adopted the VWR Corporation Employee Stock Purchase Plan (the “VWR ESPP”); and (vi) received the net proceeds from the sale of common shares in the IPO. For additional information about the management services agreement and the ITRA, see “Certain Relationships and Related Transactions.” |
| • | On October 7, 2014 and November 5, 2014, we received the net proceeds from the sales of common shares in the IPO and the Additional Sale, respectively. We used the proceeds to redeem all of our 10.75% unsecured senior subordinated notes due 2017 (the “Subordinated Notes”) and fully repay all outstanding borrowings under our multi-currency revolving loan facility and accounts receivable facility (the “A/R Facility”). |
Euro Notes Offering
Subsequent to December 31, 2014, we entered into the following refinancing transactions (collectively, the “Euro Notes Transactions”) that had a significant impact on our financial position and results of operations:
| • | Between January 1, 2015 and March 13, 2015, VWR Funding borrowed €88.5 million and $25.0 million under its multi-currency revolving loan facility along with $61.2 million under its A/R Facility to repay $150.0 million of its U.S. dollar-denominated term loans and for general corporate purposes. |
| • | On March 25, 2015, VWR Funding issued €503.8 million aggregate principal amount of 4.625% Senior Notes due 2022 (the “Euro Notes”). VWR Funding used the net proceeds from the issuance and sale of the Euro Notes to (i) repay $281.5 million of its U.S. dollar-denominated term loans and (ii) fully repay the outstanding balances under the A/R Facility and the multi-currency revolving loan facility (without termination of commitments thereunder). For additional information about the Euro Notes, see “Description of Certain Indebtedness—Euro Notes.” |
We refer to the IPO Transactions and the Euro Notes Transactions collectively as the “Transactions.”
10
Table of Contents
The Offering
| Issuer |
VWR Corporation. |
| Common stock offered by the selling stockholder |
16,000,000 shares, excluding the shares pursuant to the option granted to the underwriters described below. |
| Common stock to be outstanding immediately after this offering |
131,358,700 shares. |
| Option to purchase additional shares |
The underwriters have a 30-day option to purchase up to 2,400,000 additional shares from the selling stockholder at the public offering price less underwriting discounts and commissions. |
| Use of proceeds |
We will not receive any of the proceeds from the sale of shares in this offering. See “Use of Proceeds” and “Principal and Selling Stockholders.” |
| Dividend policy |
We do not plan to pay a regular dividend on our common stock. The declaration and payment of all future dividends, if any, will be at the discretion of our board of directors (the “Board”) and will depend upon our financial condition, earnings, contractual conditions, including restrictions imposed by our senior secured credit facility (the “Senior Credit Facility”), the indenture governing our 7.25% senior notes due 2017 (the “2017 Senior Notes”), the indenture governing our Euro Notes or applicable laws and other factors that the Board may deem relevant. |
| NASDAQ Symbol |
“VWR.” |
| Risk factors |
For a discussion of risks relating to our business, our indebtedness and ownership of our common stock, see “Risk Factors” beginning on page 17 of this prospectus. |
Unless otherwise indicated, all information in this prospectus relating to the number of shares of our common stock to be outstanding immediately prior to and after this offering is based on the number of shares outstanding as of May 12, 2015 and excludes:
| • | 3.5 million shares of common stock issuable upon the vesting and exercise of options outstanding as of May 12, 2015, at a weighted average exercise price of approximately $21.01 per share; |
| • | an aggregate of 8.0 million shares of common stock reserved for issuance under the 2014 Equity Incentive Plan, not including shares underlying outstanding stock options; and |
| • | 2.0 million shares of common stock reserved for issuance under the VWR ESPP. |
Unless expressly indicated or the context otherwise requires, all information in this prospectus assumes:
| • | no exercise of the underwriters’ option to purchase up to 2,400,000 additional shares of common stock from the selling stockholder; and |
| • | no exercise of options outstanding as of May 12, 2015. |
11
Table of Contents
SUMMARY HISTORICAL CONSOLIDATED FINANCIAL DATA
The following tables set forth our summary historical consolidated financial data as of and for the periods indicated below. We have derived the summary historical consolidated financial data as of December 31, 2014 and 2013 and for the years ended December 31, 2014, 2013 and 2012 from our annual consolidated financial statements and related notes incorporated by reference in this prospectus.
The summary historical consolidated financial data as of March 31, 2015 and for the three months ended March 31, 2015 and 2014 have been derived from our unaudited interim condensed consolidated financial statements and related notes incorporated by reference in this prospectus, which have been prepared on a basis consistent with our annual consolidated financial statements. We have derived the summary historical consolidated financial data as of March 31, 2014 from our unaudited interim condensed consolidated financial statements and related notes, which are not included in this prospectus. In the opinion of management, such unaudited financial data reflect all adjustments, consisting only of normal and recurring adjustments, necessary for fair presentation of the results for those periods. The results of operations for the three months ended March 31, 2015 are not necessarily indicative of the results to be expected for the full year or any future period.
This information is only a summary and should be read in conjunction with “Use of Proceeds,” “Capitalization,” “Unaudited Pro Forma Condensed Consolidated Financial Statements,” “Selected Historical Consolidated Financial Data,” “Management’s Discussion and Analysis of Financial Condition and Results of Operations” and our consolidated financial statements and related notes, incorporated by reference in this prospectus.
| Year Ended December 31, | Three Months Ended March 31, |
|||||||||||||||||||
| 2014 | 2013 | 2012 | 2015 | 2014 | ||||||||||||||||
| (Unaudited) | (Unaudited) | |||||||||||||||||||
| (in millions) |
||||||||||||||||||||
| Statement of Operations Data: |
||||||||||||||||||||
| Net sales |
$ | 4,375.3 | $ | 4,187.8 | $ | 4,129.4 | $ | 1,029.6 | $ | 1,056.6 | ||||||||||
| Cost of goods sold |
3,131.9 | 2,991.5 | 2,962.0 | 738.4 | 744.0 | |||||||||||||||
|
|
|
|
|
|
|
|
|
|
|
|||||||||||
| Gross profit |
1,243.4 | 1,196.3 | 1,167.4 | 291.2 | 312.6 | |||||||||||||||
| Selling general and administrative expenses |
925.5 | 942.3 | 915.4 | 217.4 | 235.6 | |||||||||||||||
|
|
|
|
|
|
|
|
|
|
|
|||||||||||
| Operating income |
317.9 | 254.0 | 252.0 | 73.8 | 77.0 | |||||||||||||||
| Interest expense, net |
(166.3 | ) | (190.7 | ) | (199.5 | ) | (27.2 | ) | (45.8 | ) | ||||||||||
| Other income (expense), net (1) |
90.9 | (38.8 | ) | (15.1 | ) | 70.3 | (3.1 | |||||||||||||
| Loss on extinguishment of debt (2) |
(5.1 | ) | (2.0 | ) | (25.5 | ) | (1.8 | ) | — | |||||||||||
|
|
|
|
|
|
|
|
|
|
|
|||||||||||
| Income before income taxes |
237.4 | 22.5 | 11.9 | 115.1 | 28.1 | |||||||||||||||
| Income tax provision |
(84.8 | ) | (8.4 | ) | (8.1 | ) | (43.6 | ) | (10.7 | ) | ||||||||||
|
|
|
|
|
|
|
|
|
|
|
|||||||||||
| Net income |
152.6 | 14.1 | 3.8 | 71.5 | 17.4 | |||||||||||||||
| Accretion of dividends on redeemable convertible preferred stock (3) |
(29.4 | ) | (47.9 | ) | (45.5 | ) | — | (12.4 | ) | |||||||||||
|
|
|
|
|
|
|
|
|
|
|
|||||||||||
| Net income (loss) applicable to common stockholders |
$ | 123.2 | $ | (33.8 | ) | $ | (41.7 | ) | $ | 71.5 | $ | 5.0 | ||||||||
|
|
|
|
|
|
|
|
|
|
|
|||||||||||
12
Table of Contents
| Year Ended December 31, | Three Months Ended March 31, |
|||||||||||||||||||
| 2014 | 2013 | 2012 | 2015 | 2014 | ||||||||||||||||
| (Unaudited) | (Unaudited) | |||||||||||||||||||
| (in millions, except per share data) | ||||||||||||||||||||
| Per Share Data: |
||||||||||||||||||||
| Earnings (loss) per share: |
||||||||||||||||||||
| Basic |
$ | 2.50 | $ | (338.00 | ) | $ | (417.00 | ) | $ | 0.54 | $ | 50.00 | ||||||||
| Diluted |
2.49 | (338.00 | ) | (417.00 | ) | 0.54 | 50.00 | |||||||||||||
| Weighted-average shares outstanding (4): |
||||||||||||||||||||
| Basic |
49.3 | 0.1 | 0.1 | 131.4 | 0.1 | |||||||||||||||
| Diluted |
49.5 | 0.1 | 0.1 | 131.9 | 0.1 | |||||||||||||||
| Other Financial Data: |
||||||||||||||||||||
| Adjusted EBITDA (5) |
$ | 449.4 | $ | 418.5 | $ | 401.5 | $ | 106.8 | $ | 111.7 | ||||||||||
| Adjusted EBITDA as a percentage of net sales (5) |
10.3 | % | 10.0 | % | 9.7 | % | 10.4 | % | 10.6 | % | ||||||||||
| Adjusted Net Income (5) |
$ | 158.3 | $ | 123.2 | $ | 101.6 | $ | 43.8 | $ | 36.4 | ||||||||||
| Net cash provided by (used in): |
||||||||||||||||||||
| Operating activities |
191.1 | 200.9 | 34.7 | (9.9 | ) | 15.2 | ||||||||||||||
| Investing activities |
(123.0 | ) | (89.5 | ) | (160.9 | ) | (24.9 | ) | (21.4 | ) | ||||||||||
| Financing activities |
(71.8 | ) | (117.9 | ) | 98.3 | 23.8 | 0.9 | |||||||||||||
| Depreciation and amortization |
129.3 | 130.0 | 125.9 | 30.5 | 34.6 | |||||||||||||||
| Cash paid for income taxes, net |
39.3 | 37.3 | 45.7 | 7.3 | 5.7 | |||||||||||||||
| Acquisitions of businesses, net of cash acquired |
102.9 | 44.4 | 113.3 | 15.6 | 14.8 | |||||||||||||||
| Capital expenditures |
33.6 | 45.3 | 51.8 | 9.5 | 6.6 | |||||||||||||||
| Gross profit as a percentage of net sales |
28.4 | % | 28.6 | % | 28.3 | % | 28.3 | % | 29.6 | % | ||||||||||
| December 31, | March 31, | |||||||||||||||||||
| 2014 | 2013 | 2012 | 2015 | 2014 | ||||||||||||||||
| (Unaudited) | (Unaudited) | |||||||||||||||||||
| (in millions) | ||||||||||||||||||||
| Balance Sheet Data: |
||||||||||||||||||||
| Cash and cash equivalents |
$ | 118.0 | $ | 135.6 | $ | 139.8 | $ | 98.5 | $ | 130.2 | ||||||||||
| Total assets |
4,988.8 | 5,209.0 | 5,402.0 | 4,773.6 | 5,224.9 | |||||||||||||||
| Debt and capital lease obligations (6) |
2,111.9 | 2,854.4 | 3,148.6 | 2,063.3 | 2,860.2 | |||||||||||||||
| Total redeemable equity (3) |
51.4 | 670.6 | 627.9 | 57.1 | 681.8 | |||||||||||||||
| Total stockholder’s equity (3)(7) |
1,339.7 | 425.8 | 406.1 | 1,241.4 | 419.9 | |||||||||||||||
| (1) | During all of the periods presented, we had a significant amount of euro-denominated debt recorded on our U.S. dollar-denominated balance sheet. Our operating results are exposed to foreign currency risk with respect to a portion of this indebtedness. Specifically, during times of a weakening U.S. dollar, the relative value of this debt would increase, which would require us to record foreign exchange losses. As of March 31, 2015 we had €1,065.6 million ($1,144.4 million on a U.S. dollar equivalent basis) of euro-denominated debt recorded on our U.S. dollar-denominated balance sheet, which constitutes approximately 56% of our total outstanding debt. |
| As of March 31, 2015, approximately one half of our euro-denominated debt is designated as a hedge to help protect a portion of our net investment in euro-denominated foreign operations from the impact of changes in the euro to U.S. dollar exchange rate. As a result of the hedge designation, the net foreign currency remeasurement gain or loss on this debt, which otherwise would be recognized in earnings, is equally offset in other comprehensive income by the net unrealized gain or loss from the translation of the hedged portion of our net investment in euro-denominated foreign operations. |
13
Table of Contents
| (2) | In the fourth quarter of 2014, we completed our IPO and used the net proceeds of $577.8 million to redeem all of the Subordinated Notes and to repay borrowings under our credit facilities. This repayment of debt caused us to recognize a loss on extinguishment of debt, representing the write-off of unamortized deferred financing costs on the Subordinated Notes, to eliminate interest expense and to reduce our exposure to foreign currency remeasurement gains or losses in future periods. |
During the year ended December 31, 2013, we recognized a loss on extinguishment of debt of $2.0 million representing the write-off of unamortized deferred financing costs associated with term loans that were not extended following an amendment of our Senior Credit Facility.
During the year ended December 31, 2012, we recognized a loss on extinguishment of debt of $25.5 million in connection with the refinancing of our 10.25% senior notes due 2015. Such loss included $18.7 million in tender and redemption premiums paid, $6.6 million for the write-off of unamortized deferred financing costs and $0.2 million of third-party fees and fees paid to lenders.
During the three months ended March 31, 2015, we recognized a loss on extinguishment of debt of $1.8 million representing the write-off of unamortized deferred financing costs associated with term loans that were repaid using a portion of the net proceeds from the issuance of the Euro Notes.
| (3) | In anticipation of our IPO, we recapitalized our equity by (i) exchanging all of our redeemable convertible preferred stock for newly issued common shares on July 31, 2014, and (ii) completing a 102-for-1 stock split on October 7, 2014. Following the recapitalization, the accretion of accrued but unpaid dividends on the redeemable convertible preferred stock ceased, and all accrued but unpaid dividends and unreturned capital on the redeemable convertible preferred stock became available to common stockholders. |
| (4) | For all periods presented, earnings or loss per share has been adjusted for the 102-for-1 stock split that occurred on October 7, 2014. The conversion of all shares of common stock and redeemable convertible preferred stock into newly-issued shares of common stock on July 31, 2014, and the issuance of shares in the IPO and the Additional Sale, was considered period activity when calculating earnings or loss per share, which affects the comparability of the per share data among periods. |
| (5) | Adjusted Net Income and Adjusted EBITDA are non-GAAP financial measures. We calculate Adjusted Net Income by excluding the following pre-tax items from net income: (i) amortization of acquired intangible assets; (ii) net foreign currency remeasurement gain or loss from financing activities; (iii) charges for restructuring and other cost-reduction initiatives; (iv) impairment charges; (v) gain or loss from business disposals; (vi) loss on extinguishment of debt; (vii) charges associated with executive departures; and (viii) other costs or credits that are either isolated or cannot be expected to recur with any regularity or predictability. From this amount, we then add or subtract an assumed incremental income tax impact on the above noted pre-tax adjustments using estimated tax rates. |
We calculate Adjusted EBITDA by excluding the following items from Adjusted Net Income: (i) interest expense, net of interest income; (ii) depreciation expense; (iii) share-based compensation expense; and (iv) income tax provision applicable to Adjusted Net Income.
Each of Adjusted Net Income and Adjusted EBITDA has limitations as an analytical tool, and you should not consider either in isolation or as a substitute for analysis of our results as reported under GAAP. Generally, a non-GAAP financial measure is a numerical measure of a company’s performance, financial position or cash flows that either excludes or includes amounts that are not normally included or excluded in the most directly comparable measure calculated and presented in accordance with GAAP. We believe that each of Adjusted Net Income and Adjusted EBITDA provides investors with additional information with respect to our operations, our cash flows and our ability to meet our future debt service, capital expenditures and working capital requirements. See “Non-GAAP Financial Measures.”
14
Table of Contents
The following table reconciles net income to Adjusted Net Income and Adjusted EBITDA:
| Year Ended December 31, | Three Months Ended March 31, |
|||||||||||||||||||
| 2014 | 2013 | 2012 | 2015 | 2014 | ||||||||||||||||
| (in millions) | ||||||||||||||||||||
| Net income |
$ | 152.6 | $ | 14.1 | $ | 3.8 | $ | 71.5 | $ | 17.4 | ||||||||||
| Pre-tax adjustments: |
||||||||||||||||||||
| Amortization of acquired intangible assets |
88.9 | 91.7 | 89.9 | 20.8 | 25.1 | |||||||||||||||
| Net foreign currency remeasurement (gain) loss from financing activities (a) |
(90.9 | ) | 38.0 | 16.0 | (70.3 | ) | 3.0 | |||||||||||||
| Charges for restructuring and other cost reduction initiatives (b) |
— | 32.5 | 16.9 | — | — | |||||||||||||||
| Impairment charges (c) |
11.3 | — | — | — | — | |||||||||||||||
| Gain on disposition of business (c) |
(11.1 | ) | — | — | — | — | ||||||||||||||
| Loss on extinguishment of debt (d) |
5.1 | 2.0 | 25.5 | 1.8 | — | |||||||||||||||
| Charges associated with executive departures (e) |
— | 2.2 | 6.2 | — | — | |||||||||||||||
| Legacy facility exit charges (b) |
— | — | — | 1.4 | — | |||||||||||||||
| Other (f) |
— | — | (1.3 | ) | — | — | ||||||||||||||
| Income tax provision (benefit) applicable to pre-tax adjustments (g) |
2.4 | (57.3 | ) | (55.4) | 18.6 | (9.1 | ) | |||||||||||||
|
|
|
|
|
|
|
|
|
|
|
|||||||||||
| Adjusted Net Income |
158.3 | 123.2 | 101.6 | 43.8 | 36.4 | |||||||||||||||
| Interest expense, net of interest income |
166.3 | 190.7 | 199.5 | 27.2 | 45.8 | |||||||||||||||
| Depreciation expense |
40.4 | 38.3 | 36.0 | 9.7 | 9.5 | |||||||||||||||
| Share-based compensation expense (h) |
2.0 | 0.6 | 0.9 | 1.1 | 0.2 | |||||||||||||||
| Income tax provision applicable to Adjusted Net Income |
82.4 | 65.7 | 63.5 | 25.0 | 19.8 | |||||||||||||||
|
|
|
|
|
|
|
|
|
|
|
|||||||||||
| Adjusted EBITDA |
$ | 449.4 | $ | 418.5 | $ | 401.5 | $ | 106.8 | $ | 111.7 | ||||||||||
|
|
|
|
|
|
|
|
|
|
|
|||||||||||
| (a) | See footnote (1) above. |
| (b) | For the year ended December 31, 2013, the charges relate to a global restructuring program designed to enhance our interaction with customers and suppliers, to improve the efficiency of our operations and to reduce operating expenses and also include a $2.8 million impairment of an amortizable intangible asset. For the year ended December 31, 2012, the charges relate to other cost reduction initiatives. During the three months ended March 31, 2015, the charges relate to residual facility exit costs associated with a legacy restructuring program. |
| (c) | In July 2014, we received allegations and identified inappropriate business practices at a recently-acquired business. We determined that the circumstances surrounding these allegations represented indicators of impairment at June 30, 2014. We concluded that the entire carrying value of acquired goodwill was not recoverable and recognized a pre-tax impairment charge of $11.3 million. In August 2014, following our recognition of the above noted impairment, we entered into an agreement with the former shareholders of the business to rescind the purchase agreement. Subsequently, we received a full refund of the purchase price. As a result, we recognized a gain on disposition of $11.1 million. See footnote (b) above for a discussion of an impairment charge recognized in the year ended December 31, 2013 in connection with a global restructuring program. |
| (d) | See footnote (2) above. |
| (e) | These charges relate to severance benefits associated with executive departures. In 2012, such charges include severance benefits for our former President and Chief Executive Officer. |
| (f) | For the year ended December 31, 2012, represents gain from changes in the estimated fair value of contingent consideration related to acquisitions, partially offset by fees paid to lenders and third parties in connection with an amendment to our Senior Credit Facility. |
15
Table of Contents
| (g) | Relates to the incremental net tax benefit or provision associated with the reconciling items between net income or loss and Adjusted Net Income. In deriving the aggregate tax effect of the reconciling items, we utilized weighted average statutory income tax rates between 20% and 39%, depending upon the applicable jurisdiction(s). |
| (h) | See Note 14 to our annual consolidated financial statements incorporated by reference in this prospectus. |
| (6) | In the fourth quarter of 2014, we completed our IPO, including the Additional Sale. We received aggregate net proceeds of $577.8 million, which we used to redeem all of our Subordinated Notes and to repay borrowings under our credit facilities. For additional information, see “Management’s Discussion and Analysis of Financial Condition and Results of Operations.” |
| (7) | On October 1, 2014, we paid a dividend of $25.0 million to VWR Holdings, who held all of our then outstanding common stock. |
16
Table of Contents
An investment in our common stock involves a high degree of risk. You should carefully consider each of the following risks as well as the other information included in this prospectus, including “Management’s Discussion and Analysis of Financial Condition and Results of Operations” and our consolidated financial statements and related notes incorporated by reference in this prospectus, before investing in our common stock. Any of the following risks could materially and adversely affect our business, financial condition or results of operations. In such a case, the trading price of the common stock could decline and you may lose all or part of your investment.
Risks Related to Our Business
Our business is affected by general economic conditions in the United States, Europe and the other regions in which we operate, and unfavorable global economic conditions or instability in the capital and credit markets could adversely impact our business.
With operations in many parts of the world, the global economy has a significant impact on our business. Unfavorable economic conditions in the United States, Europe and other regions in which we operate, and volatility in the global capital and credit markets, could materially and adversely affect our business, financial condition and results of operations. In particular, a deterioration of global economic conditions, or a prolonged period of market instability, could present the following additional risks and uncertainties for our business:
| • | a reduction in revenues from and/or less favorable pricing or terms with new and existing customers; |
| • | the inability to expand our customer base in existing or new markets; |
| • | difficulties in collecting trade accounts receivable; |
| • | an increase in product prices from our suppliers that we are not able to pass through to our customers; |
| • | an acceleration of payment terms with our suppliers and/or the imposition of more restrictive credit terms and other contractual requirements; |
| • | an increased risk of excess and obsolete inventory; |
| • | a reduction in research and development spending by our customers, especially those in the Biopharma sector; |
| • | the inability to access additional capital or refinance existing indebtedness; |
| • | a limited availability to enter into new derivative financial instruments; and |
| • | the need to record impairment charges against our goodwill, other intangible and/or other long-lived assets. |
Our business, financial condition and results of operations may be harmed if our customers discontinue, outsource or spend less on research and development and other scientific endeavors or discontinue or lessen their relationship with us.
Our customers are engaged in research, development and production in the Biopharma, agricultural, chemical, environmental, food and beverage, healthcare, microelectronic and petrochemical industries as well as in the education and government sectors. The amount of customer spending on research, development and production has a large impact on our sales and profitability. Our customers determine the amounts that they will spend on the basis of, among other things, general economic conditions, their financial condition and liquidity, spending priorities and their need to develop new products, which, in turn, is dependent upon a number of factors, including their competitors’ research, development and production initiatives.
17
Table of Contents
In addition, consolidation in the industries in which our customers operate may have an impact on such spending as customers integrate acquired operations, including research and development departments and their budgets. Our customers finance their research and development spending from private and public sources. Government funding of scientific research and education has varied for several reasons, including general economic conditions, growth in population, political priorities, changes in the number of students and other demographic changes.
A deterioration in general economic conditions or a return to a period of economic contraction could result in reductions, or further reductions as the case may be, in spending by our customers across all customer segments that we serve, including the Biopharma industry as our largest customer segment. In addition, certain of our customers who depend on U.S. federal funding to finance their scientific research may be adversely impacted by U.S. federal spending cuts required by the “sequestration” mechanism in the Budget Control Act of 2011 and the Bipartisan Budget Act of 2013. Sequestration, which went into effect in March 2013, mandates $1.2 trillion of spending reductions split between domestic and defense spending over a ten-year period. A reduction in spending by our customers could have a material adverse effect on our business, financial condition and results of operations.
The substantial majority of our 50 largest customer relationships are governed by three- to five-year contracts that typically include pricing and volume incentives intended to position us as the primary provider of laboratory products and services. These contracts typically do not contain minimum purchase requirements or provide us with an exclusive supplier relationship during the term of such contract. In many cases, our customers will undertake a competitive process at the expiration of these contracts and have on occasion not selected us to continue as their provider of laboratory products and services. The loss of one or more of our large customers, a material reduction in their purchase of products or services from us, extended disruptions or interruptions in their operations or material changes in the terms based on which we sell to them, could have a material adverse effect on our business, financial condition and results of operations.
The life science industry has and will continue to experience significant changes that could adversely affect our business.
Many of our customers in the life science industry have experienced significant changes in the last several years and are expected to continue to experience significant changes, including reductions in governmental payments for pharmaceutical products, expirations of significant patents, lower funding for research and development and adverse changes in legislation or regulations regarding the delivery or pricing of general healthcare services or mandated benefits. In response to these and other changes, some of our life science customers have implemented or may in the future implement actions in an effort to control and reduce costs, including:
| • | development of large and sophisticated group purchasing organizations that reduces spending on laboratory products; |
| • | consolidation of pharmaceutical companies resulting in a rationalization of research expenditures; |
| • | purchasing the products that we supply directly from manufacturers; |
| • | closing of domestic facilities and the establishment of facilities at low-cost offshore locations; and |
| • | significant reductions in and/or outsourcing of research, development and production activities, including outsourcing to low-cost offshore locations. |
The ability of our life science customers to develop new products to replace revenue decreases attributable to expirations of significant patents, along with the impact of other past or potential future changes in the general healthcare industry may result in our customers significantly reducing their purchases of products and services from us or the prices they are willing to pay for those products or services. In addition, we will need to adapt our business to maintain existing customer relationships and develop new customer relationships as our customers consolidate or outsource certain activities domestically or to low-cost offshore locations.
18
Table of Contents
We compete in a highly competitive market. Failure to compete successfully could have a material adverse effect on our business, financial condition and results of operations.
We compete in the global laboratory products market, primarily with Thermo Fisher Scientific, which has a portion of its business dedicated to the distribution of laboratory products and services. We also compete with many smaller regional, local and specialty distributors, as well as with manufacturers of all sizes selling directly to their customers. Competitive factors include price, service and delivery, breadth of product line, customer support, e-business capabilities, service offerings and the ability to meet the special requirements of customers.
A few of our competitors have greater financial and other resources than we do. Most of our products are available from several sources, and some of our customers have relationships with several distributors. Our agreements with customers generally provide that the customer can terminate the agreement or reduce the scope of products or services provided pursuant to the agreement with little or no notice. Lack of product availability, stemming from either our inability to acquire products or interruptions in the supply of products from manufacturers, could have a material adverse effect on our ability to compete. Our competitors could also obtain exclusive rights to distribute some products, thereby foreclosing our ability to distribute these products. Vertically integrated distributors may also have an advantage with respect to the total delivered product cost of certain of their captive products. Additionally, manufacturers could increase their efforts to sell directly to consumers and effectively bypass distributors like us. Consolidation in the global laboratory products market could result in existing competitors increasing their market share, which could have a material adverse effect on our business, financial condition and results of operations. The entry of new participants in the industry could also have a material adverse effect on our ability to compete.
We are subject to currency risks with respect to our international operations and certain outstanding foreign-denominated debt.
While we report our consolidated financial results in U.S. dollars, we derive a significant portion of our sales and incur costs in foreign currencies (principally the euro, the British pound sterling, the Canadian dollar and the Swiss franc) from our operations outside the United States. For example, in 2014 approximately one-half of our net sales came from our operations outside the United States. Fluctuations in the relative values of currencies occur from time to time and could adversely affect our operating results. Specifically, during times of a strengthening U.S. dollar, our reported international sales and earnings will be reduced because the local currency will translate into fewer U.S. dollars. This could also make it more difficult to pay amounts due on our debt, the majority of which is denominated in U.S. dollars.
As of March 31, 2015, we had €1,065.6 million ($1,144.4 million on a U.S. dollar equivalent basis) of euro-denominated debt recorded on our U.S. dollar-denominated balance sheet, which constitutes approximately 56% of our total outstanding debt. Our operating results are exposed to foreign currency risk with respect to a portion of this indebtedness. Specifically, during times of a weakening U.S. dollar, the relative value of certain of this debt would increase, which would require us to record foreign exchange losses. For example, during the three months ended March 31, 2015 and 2014 and the years ended December 31, 2014, 2013 and 2012, we recognized a net foreign currency remeasurement gain (loss) of $70.3 million, $(3.1) million, $90.9 million, $(38.8) million and $(14.4) million, respectively. As of March 31, 2015, approximately one half of our euro-denominated debt is designated as a hedge to help protect a portion of our net investment in euro-denominated foreign operations from the impact of changes in the euro to U.S. dollar exchange rate. As a result of the hedge designation, the net foreign currency remeasurement gain or loss on this debt, which otherwise would be recognized in earnings, is equally offset in other comprehensive income by the net unrealized gain or loss from the translation of the hedged portion of our net investment in euro-denominated foreign operations.
19
Table of Contents
Our business, financial condition and results of operations depend upon maintaining our relationships with suppliers.
We offer products from a wide range of suppliers. While there is generally more than one source of supply for most of the categories of products that we sell, we currently do not manufacture the majority of our products and are dependent on these suppliers for access to those products. Our most significant supplier is Merck KGaA and its affiliates, which supplied products to us that accounted for approximately 9% of our net sales in 2014. In April 2014, we began operating under new, non-exclusive chemical distribution agreements with Merck KGaA that extend through December 2018. These new agreements cover a portion of our overall sales of products from Merck KGaA in Europe. The economics of these agreements include less favorable pricing terms than our previous agreement. The new agreements began negatively impacting our gross margin in April 2014.
Our ability to sustain our gross margins has been, and will continue to be, dependent in part upon our ability to obtain favorable terms from our suppliers. These terms may change from time to time, and such changes could adversely affect our gross margins over time. In addition, our results of operations and cash flows could be adversely impacted by the acceleration of payment terms to our suppliers and/or the imposition of more restrictive credit terms and other contractual requirements.
Some of our competitors are increasing their manufacturing operations both internally and through acquisitions of manufacturers, including manufacturers that supply products to us. In addition, we manufacture certain products that may compete directly with products we source from our suppliers. To date, we have not experienced an adverse impact on our ability to continue to source products from manufacturers that have been vertically integrated or otherwise compete with us, although there is no assurance that we will not experience such an impact in the future.
The loss of one or more of our large suppliers, including as a result of consolidation, a material reduction in their supply of products or provision of services to us, extended disruptions or interruptions in their operations or material changes in the terms we obtain from them, could have a material adverse effect on our business, financial condition and results of operations.
Our future operating results may fluctuate significantly and our current operating results may not be a good indication of our future performance. Fluctuations in our quarterly financial results could affect our stock price in the future.
Our net sales and operating results have historically varied from period-to-period, and we expect that they will continue to do so as a result of a number of factors, many of which are outside of our control. If our quarterly financial results or our predictions of future financial results fail to meet the expectations of securities analysts and investors, our stock price could be negatively affected. Any volatility in our quarterly financial results may make it more difficult for us to raise capital in the future or pursue acquisitions that involve issuances of our stock. Our operating results for prior periods may not be effective predictors of future performance.
A significant part of our growth strategy is to engage in acquisitions, which will subject us to a variety of risks that could harm our business.
As part of our business strategy, we intend to continue to review and complete selective acquisition opportunities focusing initially in North America and Europe and, over the longer term, in other select geographies. There can be no assurances that we will be able to complete suitable acquisitions for a variety of reasons, including the identification of and competition for acquisition targets, the need for regulatory approvals, the inability of the parties to agree to the structure or purchase price of the transaction and our inability to finance the transaction on commercially acceptable terms. In addition, any completed acquisition will subject us to a variety of other risks:
| • | we may need to allocate substantial operational, financial and management resources in integrating new businesses, technologies and products, and management may encounter difficulties in integrating the operations, personnel or systems of the acquired businesses; |
20
Table of Contents
| • | acquisitions may have a material adverse effect on our business relationships with existing or future suppliers, in particular, to the extent we consummate acquisitions that vertically integrate portions of our business; |
| • | we may assume substantial actual or contingent liabilities, known and unknown; |
| • | acquisitions may not meet our expectations of future financial performance; |
| • | we may experience delays or reductions in realizing expected synergies; |
| • | we may incur substantial unanticipated costs or encounter other problems associated with acquired businesses or devote time and capital investigating a potential acquisition and not complete the transaction; |
| • | we may be unable to achieve our intended objectives for the transaction; and |
| • | we may not be able to retain the key personnel, customers and suppliers of the acquired business. |
In addition, we may be unable to maintain uniform standards, controls, procedures and policies as we attempt to integrate the acquired businesses, and this may lead to operational inefficiencies. These factors related to our acquisition strategy, among others, could have a material adverse effect on our business, financial condition and results of operations.
The international scope of our operations may adversely affect our business.
We are continuing to expand our sourcing, commercial operations and administrative activities internationally. In 2014, we derived approximately one-half of our net sales from operations outside the United States. Our ability to manage our business and conduct our operations internationally require considerable management attention and resources and is subject to the challenges of supporting a rapidly growing business in an environment of multiple languages, cultures, customs, legal and regulatory systems, alternative dispute systems and commercial markets. Expansion has required and will continue to require us to invest significant funds and other resources. Accordingly, we face certain risks, including:
| • | restrictions on foreign ownership of subsidiaries; |
| • | tariffs and other trade barriers and restrictions; |
| • | operating in jurisdictions that do not protect intellectual property rights to the same extent as the United States; |
| • | differing laws or administrative practices; |
| • | recruiting and retaining talented and capable employees in foreign countries and maintaining our corporate culture across all geographies; |
| • | business practices that are inconsistent with local or U.S. law, such as the United States Foreign Corrupt Practices Act of 1977, as amended (the “FCPA”), or other applicable anti-bribery regulations; |
| • | violating sanctions established by the Office of Foreign Assets Control of the U.S. Department of the Treasury, with respect to threats to the national security, foreign policy or the economy of the United States; |
| • | political risks; |
| • | disruptions in the efficiency and effectiveness of, and difficulty in overseeing and managing, operations, supply chain and certain important administrative functions, including those that have been or in the future may be transferred to our shared services operations; |
| • | restrictions imposed by foreign governments on international cash transfers; |
| • | fluctuations in foreign currency exchange rates; and |
| • | potentially adverse tax consequences of operating in multiple international jurisdictions. |
21
Table of Contents
In addition, an adverse change in laws or administrative practices in countries within which we operate could have a material adverse effect on us. Our operations outside the United States also may present additional risk with respect to compliance with government regulations and licensing requirements. If we are unable to manage the complexity of our global operations successfully, our business, financial condition and operating results could be adversely affected.
In recent years, we incurred, and we may in the future incur, impairment charges related to our goodwill and other intangible assets, which could negatively impact our results of operations.
We carry significant amounts of goodwill and other intangible assets, including indefinite-lived intangible assets, on our balance sheet as a result of the VWR Acquisition and acquisitions subsequent to the VWR Acquisition. Our intangible assets with finite useful lives primarily relate to customer and supplier relationships and are amortized over their respective estimated useful lives on a straight-line basis. Our indefinite-lived intangible assets relate to our trademarks and tradenames.
Goodwill and other intangible assets with indefinite useful lives are not amortized and are tested annually for impairment, and they must also be tested for impairment between the annual tests if an event or change in circumstance occurs that would more likely than not reduce the fair value of the asset below its carrying amount. Other amortizable intangible assets are reviewed for impairment whenever an indication of potential impairment exists.
Future changes in our estimates or judgments could reduce our fair value measurements, which could in turn result in an impairment charge:
| • | Our expected net sales, cash flow performance or market conditions could be adversely affected due to, among other things, negative macroeconomic or industry-specific factors. For example, in 2011 and 2010, we recognized impairment charges of $3.3 million and $48.1 million, respectively, resulting primarily from factors specific to the science education industry, while in 2008, we recognized impairment charges of $392.1 million related primarily to macroeconomic factors. We could also experience adverse changes in market factors such as discount rates, valuation multiples derived from comparable publicly-traded companies, a decline in the trading price of our common stock or control premiums derived from market transactions. |
| • | During 2014, we recognized an $11.3 million impairment of goodwill related to a recent acquisition, which was associated with acquisition-specific factors. |
See “Management’s Discussion and Analysis of Financial Condition and Results of Operations—Critical Accounting Policies and Estimates—Testing Goodwill and Other Intangible Assets for Impairment” for more information.
As of March 31, 2015, goodwill and other intangible assets represented approximately $3.3 billion or 69% of our total assets. We may recognize additional impairment charges in the future should our operating results, market conditions or fair value assumptions decline due to, among other things, ongoing or worsening economic instability and volatility or other macroeconomic or industry-specific pressures, including but not limited to rising interest rates.
We are subject to laws and regulations governing government contracts, and failure to address these laws and regulations or comply with government contracts could harm our business by leading to a reduction in sales to these customers.
We sell products to government entities and, as a result, we are subject to various statutes and regulations that apply to companies doing business with the government. The laws governing government contracts differ from the laws governing private contracts and government contracts may contain pricing terms and conditions that are not applicable to private contracts. We are also subject to investigation for compliance with the regulations governing government contracts. A failure to comply with these regulations could result in suspension of these contracts, criminal, civil and administrative penalties or debarment.
22
Table of Contents
If we do not comply with existing government regulations or if we or our suppliers become subject to more onerous government regulations, we could be adversely affected.
Some of the products we offer and our operations are subject to a number of complex and stringent laws and regulations governing the production, handling, transportation, storage, import, export and distribution of chemicals, drugs and other similar products, including the operating and security standards of the United States Drug Enforcement Administration, the Alcohol and Tobacco Tax and Trade Bureau, the Food and Drug Administration, the Bureau of Industry and Security and various state boards of pharmacy as well as comparable state and foreign agencies. In addition, our operational activities must comply with the rules and regulations of the Department of Transportation, the Federal Aviation Administration and similar foreign agencies. We are also required to abide by the anti-corruption and anti-bribery laws of all countries in which we operate, including the FCPA. While we believe we are in compliance in all material respects with such laws and regulations, any non-compliance could result in substantial fines, penalties or assessments or otherwise restrict our ability to provide competitive products and solutions and thereby have an adverse impact on our financial condition. We cannot assure you that existing laws and regulations will not be revised or that new, more restrictive laws will not be adopted or become applicable to us or the products that we manufacture and distribute.
If our suppliers become subject to more stringent laws, they may seek to recover any or all increased costs of compliance from us by increasing prices, and we may not be able to recover all such increased prices from our customers. Accordingly, we cannot assure you that our business and financial condition will not be materially and adversely affected by future changes in applicable laws and regulations applicable to our suppliers.
If any of our operations are found not to comply with applicable antitrust or competition laws, our business may suffer.
Our operations are subject to applicable antitrust and competition laws in the countries in which we conduct our business, in particular in the United States and in the European Union. These laws prohibit, among other things, anticompetitive agreements and practices. If any of our commercial agreements are found to violate or infringe upon such laws, we may be subject to civil and other penalties and/or third-party claims for damages. Further, agreements that infringe upon these laws may be void and unenforceable, in whole or in part, or require modification in order to be lawful and enforceable. If we are unable to enforce any of our commercial agreements, whether at all or in material part, our business could be adversely affected.
We are subject to environmental, health and safety laws and regulations, and costs to comply with such laws and regulations, or any liability or obligation imposed under such laws or regulations, could negatively impact our business, financial condition and results of operations.
We are subject to a broad range of foreign, federal, state and local environmental, health and safety laws and regulations, including those pertaining to air emissions, water discharges, the manufacturing, handling, disposal and transport of solid and hazardous materials and wastes, the investigation and remediation of contamination and otherwise relating to health and safety and the protection of the environment and natural resources. As our global operations have involved and continue to involve the manufacturing, handling, transport and distribution of materials that are, or could be classified as toxic or hazardous, there is a risk of contamination and environmental damage inherent in our operations and the products we manufacture, handle, transport and distribute. Our environmental, health and safety liabilities and obligations may result in significant capital expenditures and other costs, which could negatively impact our business, financial condition and results of operations. We may be fined or penalized by regulators for failing to comply with environmental, health and safety laws and regulations. In addition, contamination resulting from our current or past operations may trigger investigation or remediation obligations, which may have a material adverse effect on our business, financial condition and results of operations.
Based on current information, we believe that any costs we may incur relating to environmental, health and safety matters will not be material. We cannot be certain, however, that identification of presently unidentified environmental, health and safety conditions, new regulations, more vigorous enforcement by regulatory
23
Table of Contents
authorities or other unanticipated events will not arise in the future and give rise to additional environmental liabilities, business interruptions, compliance costs or penalties which could have a material adverse effect on our business, financial condition and results of operations. In addition, environmental, health and safety laws and regulations are constantly evolving and it is not possible to predict accurately the effect they, or any new regulations or legislation may have in future periods.
We are subject to product liability and other claims in the ordinary course of business.
Our business involves risk of product liability, patent infringement and other claims in the ordinary course of business arising from the products that we source from various manufacturers or produce ourselves, as well as from the services we provide. Our exposure to such claims may increase as we seek to increase the geographic scope of our sourcing activities and sales of private label products and to the extent that we expand our manufacturing operations. We maintain insurance policies, including product liability insurance, and in many cases the manufacturers of the products we distribute have indemnified us against such claims. We cannot assure you that our insurance coverage or indemnification agreements with manufacturers will be available in all pending or any future cases brought against us. Furthermore, our ability to recover under any insurance or indemnification arrangements is subject to the financial viability of our insurers, our manufacturers and our manufacturers’ insurers, as well as legal enforcement under the local laws governing the arrangements. In particular, as we seek to expand our sourcing from manufacturers in the Asia-Pacific region and other developing locations, we expect that we will increase our exposure to potential defaults under the related indemnification arrangements. Insurance coverage in general or coverage for certain types of liabilities, such as product liability or patent infringement in these developing markets may not be readily available for purchase or cost-effective for us to purchase. Furthermore, insurance for liability relating to asbestos, lead and silica exposure is not available, and we do not maintain insurance for product recalls. Accordingly, we could be subject to uninsured and unindemnified future liabilities, and an unfavorable result in a case for which adequate insurance or indemnification is not available could result in a material adverse effect on our business, financial condition and results of operations.
We are also involved in various disputes, litigation and regulatory matters incidental to our business, including employment matters, commercial disputes, government contract compliance matters, disputes regarding environmental clean-up costs, and other matters arising out of the normal conduct of our business. We intend to vigorously defend ourselves in such matters. From time to time, we are named as a defendant in cases as a result of our distribution of laboratory supplies, including litigation resulting from the alleged prior distribution of products containing asbestos by certain of our predecessors or acquired companies. While the impact of these disputes or litigation has historically been immaterial, and we believe the range of reasonably possible loss from current matters continues to be immaterial, there can be no assurance that the impact of the pending and any future claims will not be material to our business, financial condition or results of operations in the future.
If we are unable to hire, train and retain key personnel, our business, financial condition and results of operations could be adversely affected.
Our success depends in large part upon our continuing ability to identify, hire, retain and motivate skilled professionals. We face intense competition for these professionals from our competitors, customers, suppliers and other companies within the industries in which we compete and the geographical regions in which we operate. Any failure on our part to hire, train and retain a sufficient number of qualified professionals could have a significant adverse impact on our business.
We depend heavily on the services of our senior management. We believe that our future success will depend upon the continued services of our senior management. Our business may be harmed by the loss of one or more members of our senior management. We currently do not maintain key-man life insurance with respect to our executive officers.
24
Table of Contents
We rely upon our distribution centers and third parties to ship products to our customers, and significant interruptions in the operations of our distribution centers or the operations of such third parties could harm our business, financial condition and results of operations.
Our infrastructure primarily consists of strategically located distribution centers and various smaller regional service centers where we receive products from manufacturers, manage inventory and fill and ship customer orders. We also ship a significant amount of our orders through various independent package delivery providers. Prompt shipment of our products is important to our business. Any significant disruptions to the operations of our distribution centers or such third parties for any reason, including labor relations issues, power interruptions, severe weather, fire or other circumstances beyond the control of us or such third parties, could cause our operating expenses to increase or seriously harm our ability to fulfill our customers’ orders or deliver products on a timely basis, or both. In addition, an increase in prices by our third-party carriers, due to increases in fuel prices or otherwise, could adversely impact our financial condition and results of operations if we are unable to find alternative providers or make adjustments to our selling prices.
Problems with or failure of our information services and their connectivity to our customers, suppliers and/or certain service providers could significantly disrupt our operations, which could reduce our customer or supplier base and could harm our business, financial condition and results of operations.
Our businesses rely on sophisticated information systems to obtain, rapidly process, analyze and manage data to facilitate the purchase and distribution of millions of inventory items from numerous distribution centers; to receive, process and ship orders on a timely basis; to account for other product and service transactions with customers; to manage the accurate billing and collections for thousands of customers; and to process payments to suppliers. Our business and results of operations may be adversely affected if these systems are interrupted or damaged by unforeseen events or if they fail for any extended period of time, including due to the actions of third parties. To reduce our risks against unforeseen events, we continually deploy, test and refine disaster recovery and business continuity preparedness plans.
Information security risks have generally increased in recent years because of the proliferation of new technologies and the increased sophistication and activities of perpetrators of cyber-attacks. A failure in or breach of our operational or information security systems, or those of our third-party service providers, as a result of cyber-attacks or information security breaches could disrupt our business and/or our supply chain, result in the improper disclosure or misuse of confidential or proprietary information, damage our reputation and/or increase our costs. As a result, cyber security and the continued development and enhancement of the controls and processes designed to protect our systems, computers, software, data and networks from attack, damage or unauthorized access remain a high priority for us. Although we believe that we have robust information security procedures and other safeguards in place, as cyber threats continue to evolve, we may be required to expend additional resources to continue to enhance our information security measures and/or to investigate and remediate any information security vulnerabilities.
In addition, we accept payment by credit card and similar payment instruments for a material portion of our sales, and our ability to accept, process and settle credit card transactions is subject to rules and regulations issued and/or amended from time to time by payment card companies, such as American Express, VISA, MasterCard and Discover. These rules and regulations, which vary based on annual transaction volume and transaction experience, require us to safeguard customer information, including applying the minimum security standards for the manner in which we capture, store, process and transmit such information. Our failure to comply with such changing rules and standards can subject us to fines, restrictions or expulsion from these card acceptance programs, which could have a material adverse effect on our business, financial condition and results of operations.
We have recently completed the implementation of an enterprise resource planning system in our U.S. laboratory products business and we plan to continue to make technology and infrastructure investments, including with respect to our enterprise resource planning and e-commerce capabilities. Our technology
25
Table of Contents
initiatives are designed to enhance the security, confidentiality, integrity and availability of data and systems, to ensure our operations continue to provide a high quality service to our customers and to provide important information to our management. We are continually assessing the risks and costs associated with potential problems and interruptions that could reduce the efficiency and effectiveness of our operations in the near term, looking for opportunities to transfer or share these risks with specialized information systems security providers and insuring against these risks where appropriate. Despite these efforts, the cost and potential problems and interruptions associated with the implementation of our technology initiatives could disrupt or reduce our productivity, including our ability to process orders, ship products, provide services and customer support, send invoices and track payments, fulfill contractual obligations or otherwise operate our business, as well as disrupt or impair our ability to provide important information to our management and investors.
We have not registered and in some cases do not own the existing applications and registrations for our material trademarks or service marks in every country in which we do business.
We serve our customers globally through our operations in 34 countries and use a number of registered and unregistered trademarks and service marks for our products and services, substantially all of which are owned by us. Although we have registered our material trademarks in the United States and the primary European countries in which we conduct business, we have not registered and in some cases do not own the existing applications and registrations for our material trademarks or service marks in all countries in which we conduct business. Our efforts to protect our intellectual property rights in certain countries, especially those in Asia-Pacific, may only provide us with limited protection. In addition, in some countries, we may be blocked from registering or otherwise protecting certain of our marks by others who have already registered identical or similar marks for similar goods or services, and in those cases, we run the risk of being sued for infringement or being unable to effectively establish brand identity.
The failure to own and have enforceable rights in the trademarks and service marks used in our business could have a material adverse effect on our business, financial condition and results of operations.
Unanticipated increases to our income tax liabilities could adversely impact our results of operations.
As a global corporation, our business is subject to a wide variety of U.S. federal, state and non-U.S. laws, regulations and policies. There can be no assurance that laws, regulations and policies will not be changed in ways that will impact our income tax provision or our income tax assets and liabilities. We are also subject to income tax audits in the United States and numerous foreign jurisdictions. Judgment is required in determining our global provision for income taxes and other tax liabilities. Although we believe that our tax estimates are reasonable, we cannot assure you that the final determination of tax audits or tax disputes will not be different from what is reflected in our historical income tax provisions and accruals. Tax authorities in the various jurisdictions in which we have a presence and conduct business may disagree with our tax positions and assess additional taxes.
In addition, our effective tax rate in the future could be adversely affected by changes to our operating structure, changes in the mix of earnings in countries with differing statutory tax rates, changes in the valuation of deferred tax assets and liabilities, changes in tax laws, and the discovery of new information in the course of our tax return preparation process. The carrying value of deferred tax assets, which are predominantly in the United States, is dependent on our ability to generate future taxable income in the United States. Increases in our income tax liabilities or risks related to the realization of our deferred tax assets as a result of any of the foregoing could adversely affect our financial position or results of operations.
As a U.S. company doing business in international markets through subsidiaries, we are subject to intercompany pricing rules in the jurisdictions where we operate. Tax rates vary from country to country and if regulators determine that our profits in one jurisdiction should be increased, we might not be able to fully offset the adjustment in the other jurisdictions; which would increase our effective tax rate. Additionally, the
26
Table of Contents
Organization for Economic Cooperation and Development, or OECD, has issued certain proposed guidelines regarding base erosion and profit shifting. As these guidelines are formally adopted by the OECD, individual taxing jurisdictions may also adopt some form of these guidelines as well. In such case, we may need to change our approach to intercompany transfer pricing in order to maintain compliance under the new rules. Our effective tax rate may increase or decrease depending on the current location of global operations at the time of the change.
Risks Related to Our Indebtedness
Our substantial indebtedness could have a material adverse effect on our financial condition and prevent us from fulfilling our debt or contractual obligations.
We have a substantial amount of debt, which requires us to make significant interest and principal payments. At March 31, 2015, we had outstanding indebtedness of $2,063.3 million, including our Senior Credit Facility, 2017 Senior Notes, Euro Notes and our A/R Facility. Our high level of debt could have important consequences to us including the following:
| • | making it more difficult for us to satisfy our debt or contractual obligations; |
| • | exposing us to the risk of increased interest rates as certain of our borrowings, including borrowings under our Senior Credit Facility and our A/R Facility, are at variable rates of interest; |
| • | requiring us to dedicate a substantial portion of our cash flow from operations to debt service payments, which would reduce the funds available for working capital, capital expenditures, investments, acquisitions and other general corporate purposes; |
| • | limiting our flexibility in planning for, or reacting to, changes in our business, future business opportunities and the industry in which we operate; |
| • | placing us at a competitive disadvantage compared to any of our less leveraged competitors; |
| • | increasing our vulnerability to a downturn in our business and both general and industry-specific adverse economic conditions; and |
| • | limiting our ability to obtain additional financing at a favorable cost of borrowing, or if at all, to fund future working capital, capital expenditures, investments, acquisitions or other general corporate requirements. |
Despite current indebtedness levels and restrictive covenants, we may incur additional indebtedness in the future, which would intensify our leverage risks.
Although the terms of the credit agreement governing the Senior Credit Facility and the indentures governing the 2017 Senior Notes and Euro Notes restrict us and our restricted subsidiaries from incurring additional indebtedness, these restrictions are subject to significant exceptions and qualifications, including with respect to our ability to incur additional senior secured debt. The risks that we and our subsidiaries face as a result of our leverage could intensify to the extent that we incur a significant amount of additional indebtedness.
27
Table of Contents
Our debt agreements contain restrictions on our ability to operate our business and to pursue our business strategies, and our failure to comply with, cure breaches of, or obtain waivers for covenants could result in an acceleration of the due date of our indebtedness.
The credit agreement governing our Senior Credit Facility and the indentures governing the 2017 Senior Notes and Euro Notes contain, and agreements governing future debt issuances may contain, covenants that restrict our ability to finance future operations or capital needs, to respond to changing business and economic conditions or to engage in other transactions or business activities that may be important to our growth strategy or otherwise important to us. The credit agreement and the indentures restrict, among other things, our ability and the ability of our subsidiaries to:
| • | incur or create additional indebtedness; |
| • | pay dividends or make distributions in respect of our capital stock or to make certain other restricted payments; |
| • | purchase or redeem stock; |
| • | make investments; |
| • | create liens; |
| • | sell assets and subsidiary stock; |
| • | enter into transactions with affiliates; |
| • | enter into agreements that restrict dividends and liens; |
| • | change our lines of business or our fiscal year; and |
| • | enter into mergers, consolidations and sales of substantially all assets. |
Additionally, our Senior Credit Facility contains a financial maintenance covenant for the benefit of our revolving commitment lenders. Specifically, we are required to maintain a Senior Secured Net Leverage Ratio (as defined therein) of not more than 5.50:1.00. The financial maintenance covenant is only applicable if revolving loans or swing loans are outstanding or if outstanding letters of credit (other than cash collateralized letters of credit) are in excess of $20.0 million. We cannot assure you that we will be able to maintain compliance with the covenants related to our debt in the future and, if we fail to do so, that we will be able to obtain waivers from the lenders or noteholders and/or amend the covenants. In particular, if our financial condition or operating results deteriorate, our relations with our lenders and noteholders may be materially and adversely affected, which could impact our ability to obtain waivers if necessary.
Any breach of the covenants in the credit agreement or the indentures could result in a default of the obligations under such debt and cause a default under other debt. If there were an event of default under the credit agreement related to our Senior Credit Facility that was not cured or waived, the lenders under our Senior Credit Facility could cause all amounts outstanding with respect to the borrowings under the Senior Credit Facility to be due and payable immediately. Our assets and cash flow may not be sufficient to fully repay borrowings under our Senior Credit Facility and our obligations under the 2017 Senior Notes and Euro Notes if accelerated upon an event of default. If, as or when required, we are unable to repay, refinance or restructure our indebtedness under, or amend the covenants contained in, our Senior Credit Facility, the lenders under our Senior Credit Facility could institute foreclosure proceedings against the assets securing borrowings under the Senior Credit Facility. Any such acceleration may also constitute a termination event under our A/R Facility, which could result in the amount outstanding under that facility becoming due and payable.
We may not be able to generate sufficient cash flows or access sufficient additional capital to meet our debt obligations or to fund our other liquidity needs.
Our business may not generate sufficient cash flow from operations, or future borrowings under our Senior Credit Facility, our A/R Facility or from other sources may not be available to us in an amount sufficient to enable us to make required interest payments on our indebtedness or to fund our other liquidity needs, including
28
Table of Contents
capital expenditure requirements, investments, acquisitions and other transactions that are important to the execution of our business strategy. Additionally, the revolving loan portion of our Senior Credit Facility is scheduled to mature in 2016, and significant portions of our other long-term debt are scheduled to mature in 2017, and we will need to refinance or satisfy this debt as it matures. We may not be able to refinance our maturing debt on favorable terms, or at all, based on general economic or market conditions, our historical or projected growth or other factors, including those beyond our control. If our cash flow from operations or other liquidity sources are not sufficient to make required interest payments or we are not able to refinance maturing debt on favorable terms, we may have to take actions such as selling assets, seeking additional equity or debt capital on commercially unreasonable terms or reducing or delaying important business transactions. Our Senior Credit Facility and the indentures governing our 2017 Senior Notes and Euro Notes restrict our ability to sell assets and use the proceeds from such sales for purposes other than debt payment obligations.
Risks Related to Ownership of our Common Stock
Our common stock price may be volatile or may decline regardless of our operating performance, and holders of our common stock could lose a significant portion of their investment.
The market price for our common stock is likely to continue to be volatile. Our stockholders may not be able to resell their shares of common stock at or above the price at which they purchased their shares, due to fluctuations in the market price of our common stock, which may be caused by a number of factors, many of which we cannot control, including those described under “—Risks Related to Our Business” and “—Risks Related to Our Indebtedness” and the following:
| • | changes in financial estimates by any securities analysts who follow our common stock, our failure to meet these estimates or failure of securities analysts to initiate or maintain coverage of our common stock; |
| • | downgrades by any securities analysts who follow our common stock; |
| • | future sales of our common stock by our officers, directors and significant stockholders, including VWR Holdings, which is controlled by Madison Dearborn Partners; |
| • | market conditions or trends in our industry or the economy as a whole; |
| • | investors’ perceptions of our prospects; |
| • | announcements by us or our competitors of significant contracts, acquisitions, joint ventures or capital commitments; |
| • | changes in key personnel; and |
| • | our limited public float in light of the Sponsors’ beneficial ownership of a majority of our common stock, which may result in the trading of relatively small quantities of shares by our stockholders having a disproportionate positive or negative influence on the market price of our common stock. |
In addition, the stock markets have experienced extreme price and volume fluctuations that have affected and continue to affect the market prices of equity securities of many companies, including companies in our industry. In the past, stockholders have instituted securities class action litigation following periods of market volatility. If we were involved in securities litigation, we could incur substantial costs, and our resources and the attention of management could be diverted from our business.
29
Table of Contents
Madison Dearborn Partners has the ability to control significant corporate activities, and their interests may not coincide with yours.
At May 12, 2015, Madison Dearborn Partners beneficially owned, through its control of VWR Holdings, approximately 77.6% of our common stock. As a result of its beneficial ownership, Madison Dearborn Partners, so long as it continues to beneficially own a majority of our outstanding common stock, will have the ability to control the outcome of matters submitted to a vote of stockholders and, through the Board, the ability to control decision-making with respect to our business direction and policies. Matters over which Madison Dearborn Partners, directly or indirectly, exercise control include:
| • | the election of the Board and the appointment and removal of our officers; |
| • | mergers and other business combination transactions, including proposed transactions that would result in our stockholders receiving a premium price for their shares; |
| • | other acquisitions or dispositions of businesses or assets; |
| • | incurrence of indebtedness and the issuance of equity securities; |
| • | repurchase of stock and payment of dividends; and |
| • | the issuance of shares to management under our equity incentive plans. |
Even if Madison Dearborn Partners’ beneficial ownership of our shares falls below a majority, it may continue to be able to strongly influence or effectively control our decisions. Under our amended and restated certificate of incorporation, Madison Dearborn Partners and its affiliates will not have any obligation to present to us, and Madison Dearborn Partners and its affiliates may separately pursue corporate opportunities of which they become aware, even if those opportunities are ones that we would have pursued if granted the opportunity.
In addition, in connection with the IPO, we entered into a Director Nomination Agreement with VWR Holdings that provides VWR Holdings the right to designate nominees for election to our board of directors for so long as VWR Holdings beneficially owns 10% or more of the total number of shares of our common stock then outstanding. The Director Nomination Agreement provides that Madison Dearborn Partners may cause VWR Holdings to assign such right to Madison Dearborn Partners or to a Madison Dearborn Partners’ affiliate so long as Madison Dearborn Partners and its affiliates are the beneficial owners of 50% or more of VWR Holdings’ voting equity interests.
We are a “controlled company” and, as a result, we qualify for, and intend to rely on, exemptions from certain corporate governance requirements. You do not have the same protections afforded to stockholders of companies that are subject to such requirements.
Madison Dearborn Partners through its control of VWR Holdings beneficially owns, and will continue to own after this offering, a majority of our common stock. As a result, we are a “controlled company” within the meaning of the corporate governance standards under NASDAQ. Under the rules of NASDAQ, a company of which more than 50% of the outstanding voting power is held by an individual, group or another company is a “controlled company” and may elect not to comply with certain stock exchange corporate governance requirements, including the requirement that (i) a majority of the Board consist of “independent directors,” as defined under the rules of NASDAQ, (ii) the Nominating and Governance Committee is composed entirely of independent directors or (iii) the Compensation Committee is composed entirely of independent directors.
The NASDAQ independence standards are intended to ensure that directors who meet the independence standards are free of any conflicting interest that could influence their actions as directors. Accordingly, you do not have the same protections afforded to stockholders of companies that are subject to all of the stock exchange corporate governance requirements.
30
Table of Contents
Conflicts of interest may arise because some of our directors are principals of our largest stockholders.
Each of Messrs. Alexos and Sullivan, who are officers of Madison Dearborn Partners, and Mr. Kraemer, who is associated with Madison Dearborn Partners, serve on the Board. VWR Holdings, which is controlled by Madison Dearborn Partners, continues to hold a majority of our outstanding common stock. Madison Dearborn Partners and the entities respectively controlled by them may hold equity interests in entities that directly or indirectly compete with us, and companies in which they currently invest may begin competing with us. As a result of these relationships, when conflicts between the interests of Madison Dearborn Partners, on the one hand, and of other stockholders, on the other hand, arise, these directors may not be disinterested. Although our directors and officers have a duty of loyalty to us under Delaware law and our amended and restated certificate of incorporation, transactions that we enter into in which a director or officer has a conflict of interest are generally permissible so long as (i) the material facts relating to the director’s or officer’s relationship or interest as to the transaction are disclosed to the Board and a majority of our disinterested directors approves the transaction, (ii) the material facts relating to the director’s or officer’s relationship or interest as to the transaction are disclosed to our stockholders and a majority of our disinterested stockholders approve the transaction or (iii) the transaction is otherwise fair to us. Our amended and restated certificate of incorporation provides that any principal, officer, member, manager and/or employee of Madison Dearborn Partners or any entity that controls, is controlled by or under common control with Madison Dearborn Partners (other than us or any company that is controlled by us) or a Madison Dearborn Partners-managed investment fund is not required to offer any transaction opportunity of which they become aware to us and could take any such opportunity for themselves or offer it to other companies in which they have an investment, unless such opportunity is offered to them solely in their capacities as our directors.
Future sales of our common stock, or the perception in the public markets that these sales may occur, may depress our stock price.
Sales of substantial amounts of our common stock in the public market, or the perception that these sales could occur, could adversely affect the price of our common stock and could impair our ability to raise capital through the sale of additional shares. On May 12, 2015, 131,358,700 shares of common stock were outstanding. The shares of common stock sold in our IPO are, and any shares sold in this offering will be, freely tradable without restriction under the Securities Act of 1933, as amended (the “Securities Act”), except that any shares of our common stock that may be acquired by our directors, executive officers and other affiliates, as that term is defined in the Securities Act, may be sold only in compliance with certain volume limitations and other restrictions of Rule 144 of the Securities Act.
The remaining 86,001,000 shares, representing 65.5% of our total outstanding shares of common stock (or 83,601,000 shares, representing 63.6% of our total outstanding shares if the underwriters exercise their option to purchase additional shares in full), will continue to be “restricted securities” within the meaning of Rule 144 and subject to certain restrictions on resale. Restricted securities may be sold in the public market only if they are registered under the Securities Act or are sold pursuant to an exemption from registration such as Rule 144 or Rule 701 under the Securities Act.
In the future, we may also issue our securities in connection with investments or acquisitions. The number of shares of our common stock issued in connection with an investment or acquisition could constitute a material portion of our then-outstanding shares of our common stock.
Anti-takeover provisions in our charter documents and as provided under Delaware law might discourage or delay acquisition attempts for us that you might consider favorable.
Our charter documents contain provisions that may make the acquisition of the Company more difficult without the approval of the Board. These provisions:
| • | authorize the issuance of undesignated preferred stock, the terms of which may be established and the shares of which may be issued without stockholder approval, and which may include super voting, special approval, dividend, or other rights or preferences superior to the rights of the holders of common stock; |
31
Table of Contents
| • | establish a classified board of directors so that not all members of the Board are elected at one time; |
| • | generally prohibit stockholder action by written consent, requiring all stockholder actions be taken at a meeting of our stockholders, except that any action required or permitted to be taken by our stockholders may be effected by written consent until such time as Madison Dearborn Partners ceases to beneficially own 50% or more of our common stock; |
| • | provide that special meetings of the stockholders can only be called by (i) the chairman or vice chairman of the Board, (ii) our chief executive officer, (iii) a majority of the Board through a special resolution or (iv) the holders of at least 10% of our common stock until such time as Madison Dearborn Partners ceases to beneficially own 50% or more of our common stock, effected by consent in writing by such stockholders; |
| • | establish advance notice requirements for nominations for elections to the Board or for proposing matters that can be acted upon by stockholders at stockholder meetings; and |
| • | provide that the Board is expressly authorized to make, alter or repeal our amended and restated by-laws. |
These anti-takeover provisions and other provisions under Delaware law could discourage, delay or prevent a transaction involving a change in control of the Company, even if doing so would benefit our stockholders. These provisions could also discourage proxy contests and make it more difficult for you and other stockholders to elect directors of your choosing and to cause us to take other corporate actions you desire.
Our amended and restated certificate of incorporation designates the Court of Chancery of the State of Delaware as the sole and exclusive forum for certain types of actions and proceedings that may be initiated by our stockholders, which could limit our stockholders’ ability to obtain a favorable judicial forum for disputes with us or our directors, officers or employees.
Our amended and restated certificate of incorporation requires, to the fullest extent permitted by law, that (i) any derivative action or proceeding brought on our behalf, (ii) any action asserting a claim of breach of a fiduciary duty owed by any of our directors, officers or other employees to us or our stockholders, (iii) any action asserting a claim against us arising pursuant to any provision of the General Corporation Law of the State of Delaware (the “DGCL”), our certificate of incorporation or our by-laws or (iv) any other action asserting a claim against us that is governed by the internal affairs doctrine may, in each case, be brought only in the Court of Chancery in the State of Delaware and if brought outside of Delaware, the stockholder bringing the suit will be deemed to have consented to service of process on such stockholder’s counsel. Any person or entity purchasing or otherwise acquiring any interest in shares of our capital stock shall be deemed to have notice of and to have consented to the provisions of our amended and restated certificate of incorporation described above. This choice of forum provision may limit a stockholder’s ability to bring a claim in a judicial forum that it finds favorable for disputes with us or our directors, officers or other employees, which may discourage such lawsuits against us and our directors, officers and employees. Alternatively, if a court were to find these provisions of our amended and restated certificate of incorporation inapplicable to, or unenforceable in respect of, one or more of the specified types of actions or proceedings, we may incur additional costs associated with resolving such matters in other jurisdictions, which could adversely affect our business and financial condition.
Because we do not intend to pay cash dividends in the foreseeable future, you may not receive any return on investment unless you are able to sell your common stock for a price greater than your purchase price.
We do not anticipate that we will pay any cash dividends on shares of our common stock for the foreseeable future. Any determination to pay dividends in the future will be at the discretion of the Board and will depend upon results of operations, financial condition, contractual restrictions, including those under the Senior Credit Facility and the indentures governing the 2017 Senior Notes and Euro Notes, any potential indebtedness we may incur, restrictions imposed by applicable law, tax considerations and other factors the Board deems relevant. Accordingly, if we do not pay dividends in the future, realization of a gain on your investment will depend on the appreciation of the price of our common stock, which may never occur.
32
Table of Contents
We are required to pay our existing owners for certain tax benefits to the extent realized by us (or deemed realized by us in the case of a change of control, certain divestitures or certain other events), which amounts are expected to be material and, in some instances, may exceed and/or be payable in advance of the tax benefits actually realized by us.
We have entered into the ITRA with our existing stockholder, VWR Holdings. The ITRA provides for the payment by us to VWR Holdings of 85% of the amount of cash savings, if any, in U.S. federal, state and local income tax that we along with our domestic subsidiaries actually realize as a result of the utilization of our pre-IPO net operating loss carryforwards.
These payment obligations are our obligations and not obligations of any of our subsidiaries. The actual utilization of net operating losses as well as the timing of any payments under the ITRA will vary depending upon a number of factors, including the amount, character and timing of our and our domestic subsidiaries’ taxable income in the future. We expect that the payments we will be required to make under the ITRA will be material.
We made our first payment under the ITRA of $9.8 million during the three months ended March 31, 2015. At March 31, 2015, we reported a liability of $163.1 million due to VWR Holdings related to the ITRA. Any future changes in the realizability of our net operating loss carryforwards that were generated prior to our IPO will impact the amount that will ultimately be paid to VWR Holdings, if any. We believe that any changes in the obligation under the ITRA will be recorded in other income or expense. We expect to repay the obligation within the carryforward period of the tax attributes without expiration.
In addition, the ITRA provides that upon certain mergers, stock and asset sales, other forms of business combinations or other changes of control, the ITRA will terminate and we will be required to make a payment equal to the present value (at a discount rate of LIBOR plus 1.00%) of anticipated future payments under the ITRA. Such payment would be based on certain assumptions, including those relating to our and our domestic subsidiaries’ future taxable income, and may therefore significantly exceed the actual tax benefits we ultimately realize from our net operating losses. We will have a similar obligation to make a present value accelerated payment based on certain assumptions if we dispose of certain subsidiaries or if we breach any of our material obligations under the ITRA, each of which also may result in a payment significantly in excess of the actual tax benefits we ultimately realize from our net operating losses. In these situations, our obligations under the ITRA could have a substantial negative impact on our liquidity and could have the effect of delaying, deferring or preventing certain mergers, asset sales, other forms of business combinations or other changes of control. Additionally, under the terms of the ITRA, VWR Holdings may be permitted to assign its rights under the agreement without our consent, in which case we may be required to deal with an unrelated counterparty under the agreement.
VWR Holdings will not reimburse us for any payments previously made under the ITRA if such benefits are subsequently disallowed (although future payments would be adjusted to the extent possible to reflect the result of such disallowance). As a result, in certain circumstances, payments could be made under the ITRA in excess of our cash tax savings. To the extent that we are unable to make timely payments under the ITRA for any reason, such payments will be deferred and will accrue interest at a rate of LIBOR plus 3.00% per annum until paid. We have agreed under the ITRA not to incur, and not to permit any of our domestic subsidiaries to incur, any new restrictions that would limit our ability to make payments under such agreement or the ability of our domestic subsidiaries to make payments to us for that purpose. This restriction could make it more difficult or costly for us to refinance our outstanding indebtedness, the majority of which will mature during 2016 and 2017. See “Management’s Discussion and Analysis of Financial Condition and Results of Operations” and “Certain Relationships and Related Transactions” for more information on the ITRA.
33
Table of Contents
We are a holding company and rely on dividends, distributions and other payments, advances and transfers of funds from our subsidiaries to meet our obligations.
We are a holding company that does not conduct any business operations of our own. As a result, we are largely dependent upon cash dividends and distributions and other transfers from our subsidiaries to meet our obligations. The agreements governing the indebtedness of our subsidiaries impose restrictions on our subsidiaries’ ability to pay dividends or other distributions to us. Additionally, deterioration of the earnings from, or other available assets of, our subsidiaries for any reason could also limit or impair their ability to pay dividends or other distributions to us.
34
Table of Contents
CAUTIONARY FACTORS REGARDING FORWARD-LOOKING STATEMENTS
This prospectus as well as the documents incorporated by reference herein or therein, contain forward-looking statements within the meaning of Section 27A of the Securities Act and Section 21E of the Securities Exchange Act of 1934, as amended (the “Exchange Act”). All statements other than statements of historical fact included in this prospectus are forward-looking statements. Forward-looking statements discuss our current expectations and projections relating to our financial condition, results of operations, plans, objectives, future performance and business. These statements may be preceded by, followed by or include the words “aim,” “anticipate,” believe,” “estimate,” “expect,” “forecast,” “intend,” “outlook,” “plan,” “potential,” “project,” “projection,” “seek,” “may,” “could,” “would,” “will,” “should,” “can,” “can have,” “likely,” the negatives thereof and other words and terms of similar meaning.
Forward-looking statements are inherently subject to risks, uncertainties and assumptions; they are not guarantees of performance. You should not place undue reliance on these statements. We have based these forward-looking statements on our current expectations and projections about future events. Although we believe that our assumptions made in connection with the forward-looking statements are reasonable, we cannot assure you that the assumptions and expectations will prove to be correct.
You should understand that the following important factors, in addition to those discussed herein under the caption “Risk Factors,” could affect our future results and could cause those results or other outcomes to differ materially from those expressed or implied in our forward-looking statements:
| • | unfavorable political, economic, capital and credit market conditions in the regions where we operate; |
| • | changes in our customers’ research and development and other scientific endeavors; |
| • | changes to the life science industry adversely affecting our business; |
| • | increased competition from other companies in our industry and our ability to increase our market shares in the geographical regions where we operate; |
| • | our ability to maintain relationships with our customers and suppliers; |
| • | our ability to consummate and integrate recent and future acquisitions; |
| • | the international scope of our operations; |
| • | the need to record impairment charges against our goodwill, other intangible and/or other long-lived assets; |
| • | existing and increased government regulations to which we and our suppliers are subject; |
| • | our ability to comply with applicable antitrust or competition laws; |
| • | increased costs to comply with environmental, health and safety laws and regulations; |
| • | product liability and other claims in the ordinary course of business; |
| • | our ability to hire, train and retain executive officers and other key personnel; |
| • | significant interruptions in the operations of our distribution centers or the operations of our suppliers; |
| • | failure of our information services and its connectivity to our customers, suppliers and/or certain service providers; |
| • | our failure to register and in some cases own the existing applications and registrations for our material trademarks or service marks in certain countries where we do business; |
| • | foreign currency exchange rate fluctuations; and |
| • | unanticipated increases to our income tax liabilities. |
35
Table of Contents
All forward-looking statements attributable to us or persons acting on our behalf are expressly qualified in their entirety by the foregoing cautionary statements. In addition, all forward-looking statements speak only as of the date of this prospectus. We undertake no obligations to update or revise publicly any forward-looking statements, whether as a result of new information, future events or otherwise other than as required under the federal securities laws.
36
Table of Contents
We will not receive any of the proceeds from the sale of shares by the selling stockholder in this offering. See “Principal and Selling Stockholders.”
MARKET PRICE OF OUR COMMON STOCK
Our common stock began trading on the NASDAQ Global Select Market under the symbol “VWR” on October 2, 2014. Prior to that, there was no public market for our common stock. The table below sets forth, for the periods indicated, the high and low sale prices per share of our common stock since October 2, 2014.
| Period |
High | Low | ||||||
| Fourth Quarter 2014 |
$ | 27.14 | $ | 20.60 | ||||
| First Quarter 2015 |
26.86 | 23.18 | ||||||
| Second Quarter 2015 (April 1, 2015 through May 20, 2015) |
28.83 | 25.16 | ||||||
The last reported trading price of our common stock on May 20, 2015 was $27.68 per share. As of May 21, 2015, we had two holders of record of our common stock. This number excludes owners for whom common stock may be held in “street” name.
37
Table of Contents
We have not historically paid dividends on our common stock. In connection with our IPO, on October 1, 2014, we paid the Holdings Dividend of $25.0 million to enable VWR Holdings to satisfy limited management equity repurchase and administrative obligations and to make a distribution to its members. Following the payment of the Holdings Dividend, we have not paid any dividends on our common stock and we do not plan to pay a regular dividend on our common stock. The declaration and payment of all future dividends, if any, will be at the discretion of the Board and will depend upon our financial condition, earnings, contractual conditions, including restrictions imposed by our Senior Credit Facility and the indentures governing our 2017 Senior Notes and Euro Notes or applicable laws and other factors that the Board may deem relevant.
See “Management’s Discussion and Analysis of Financial Condition and Results of Operations—Liquidity and Capital Resources—Debt and Capital Lease Obligations” for a description of the restrictions in our Senior Credit Facility and the indentures governing our 2017 Senior Notes and Euro Notes on the ability of VWR Funding, as our wholly owned direct subsidiary, to declare dividends or otherwise make distributions to us for the purpose of enabling us to pay dividends on our common stock.
38
Table of Contents
The following table sets forth our consolidated cash and cash equivalents and consolidated capitalization as of March 31, 2015.
You should read the following table in conjunction with “Unaudited Pro Forma Condensed Consolidated Financial Statements,” “Selected Historical Consolidated Financial Data,” “Management’s Discussion and Analysis of Financial Condition and Results of Operations,” “Description of Certain Indebtedness,” “Description of Capital Stock” and our consolidated financial statements and related notes incorporated by reference in this prospectus.
| As of March 31, 2015 |
||||
| (in millions, except share data) | ||||
| Cash and cash equivalents |
$ | 98.5 | ||
|
|
|
|||
| Debt: |
||||
| Senior Credit Facility (1): |
||||
| Euro-denominated term loans (2) |
$ | 607.4 | ||
| U.S. dollar-denominated term loans (3) |
149.9 | |||
| Multi-currency revolving loan facility |
2.0 | |||
| A/R Facility (3)(4) |
— | |||
| 2017 Senior Notes |
750.0 | |||
| Euro Notes (5) |
537.0 | |||
| Capital lease obligations |
14.2 | |||
| Other debt (6) |
2.8 | |||
|
|
|
|||
| Total debt |
$ | 2,063.3 | ||
| Redeemable equity, at redemption value (7) |
57.1 | |||
| Stockholder equity: |
||||
| Preferred stock, $0.01 par value; 50,000,000 shares authorized, no shares issued and outstanding |
$ | — | ||
| Common stock, $0.01 par value; 750,000,000 shares authorized, 131,358,700 shares issued and outstanding |
1.3 | |||
| Additional paid-in capital |
1,711.7 | |||
| Accumulated deficit |
(76.5 | ) | ||
| Accumulated other comprehensive loss |
(395.1 | ) | ||
|
|
|
|||
| Total stockholder equity |
1,241.4 | |||
|
|
|
|||
| Total capitalization |
$ | 3,361.8 | ||
|
|
|
|||
| (1) | The Senior Credit Facility is with a syndicate of lenders and provides for borrowings consisting of (i) term loans denominated in euros and U.S. dollars and (ii) a multi-currency revolving loan facility, providing for an equivalent in U.S. dollars of up to $241.3 million in multi-currency revolving loans (inclusive of swingline loans of up to $25.0 million and letters of credit of up to $70.0 million). At March 31, 2015, we had $234.3 million of available borrowing capacity under our multi-currency revolving loan facility. |
| (2) | We converted the euro-denominated term loans of the Senior Credit Facility into U.S. dollars as of March 31, 2015 using an exchange rate of $1.07 = €1.00. |
| (3) | On April 30, 2015, we used availability under our A/R Facility to borrow $125.0 million, which we used to repay U.S. dollar-denominated term loans under our Senior Credit Facility. |
| (4) | The A/R Facility provides for funding in an aggregate principal amount not to exceed $175.0 million, depending on our eligible trade accounts receivable, and will terminate on May 18, 2018. As of March 31, |
39
Table of Contents
| 2015, we had (i) no amounts outstanding under the A/R Facility, (ii) $11.3 million of undrawn letters of credit outstanding, and (iii) $145.3 million of available borrowing capacity under the A/R Facility. |
| (5) | On March 25, 2015, VWR Funding issued €503.8 million aggregate principal amount of Euro Notes at an original issue price of 99.25%. The Euro Notes were offered at an original issue discount of €3.8 million. We converted the carrying value of the Euro Notes of €500.0 million into U.S. dollars as of March 31, 2015 using an exchange rate of $1.07 = €1.00. |
| (6) | Other debt primarily represents international lines of credit drawn from local banks. |
| (7) | Represents ownership interests in VWR Holdings held by certain members of management that are redeemable pursuant to management agreements between VWR Holdings and the unit holders. Accordingly, we have presented these redeemable equity units as a mezzanine item in our consolidated balance sheet. Following a recapitalization on July 31, 2014, we expect that VWR Holdings will settle repurchases or puts directly with cash on hand resulting from our payment of the Holdings Dividend. |
40
Table of Contents
UNAUDITED PRO FORMA CONDENSED CONSOLIDATED FINANCIAL STATEMENTS
The following unaudited pro forma condensed consolidated statement of operations for the three months ended March 31, 2015 already reflects the IPO Transactions and has been prepared by applying pro forma adjustments resulting from the Euro Notes Transactions to our unaudited interim consolidated statement of operations for the same period incorporated by reference in this prospectus.
The following unaudited pro forma condensed consolidated statement of operations for the year ended December 31, 2014 has been prepared by applying pro forma adjustments resulting from the Transactions to our annual consolidated statement of operations for the same period incorporated by reference in this prospectus.
The IPO Transactions consist of the following:
| • | the completion of the Recapitalization, including, (i) the exchange of our redeemable convertible preferred stock and common stock into 1,000,000 newly-issued shares of common stock completed on July 31, 2014 and (ii) a 102-for-1 stock split of all of our outstanding shares of common stock completed on October 7, 2014; |
| • | the payment of the Holdings Dividend; |
| • | the termination of the Management Services Agreement, net of an expected increase in Board fees; |
| • | the execution of the ITRA; |
| • | the IPO Grants; and |
| • | the issuance of 25.5 million shares of common stock in the IPO, 3.8 million shares of common stock through the Additional Sale and the application of the net proceeds therefrom to redeem all of the Subordinated Notes and fully repay all outstanding borrowings under the multi-currency revolving loan facility and A/R Facility. |
The Euro Notes Transactions consist of the following:
| • | the borrowing of (i) $61.2 million under the A/R Facility and (ii) €88.5 million and $25.0 million under the multi-currency revolving loan facility, and the application of such proceeds to repay $150.0 million of U.S. dollar-denominated term loans and for general corporate purposes; |
| • | the issuance of €503.8 million aggregate principal amount of Euro Notes at an original issue price of 99.25% and the application of the net proceeds therefrom to (i) repay $281.5 million of U.S. dollar-denominated term loans and (ii) fully repay the outstanding balances under the A/R Facility and the multi-currency revolving loan facility (without termination of commitments thereunder); and |
| • | the designation of the Euro Notes as a hedge to help protect a portion of our net investment in euro-denominated foreign operations from the impact of changes in the euro to U.S. dollar exchange rate. |
The unaudited pro forma condensed consolidated statements of operations give effect to the Transactions as if they had occurred on January 1, 2014. The unaudited pro forma condensed consolidated statements of operations do not include certain non-recurring costs and expenses that we incurred in connection with the Transactions as such charges will not have an ongoing impact on our financial results, including the write-off of $3.3 million and $1.2 million in unamortized deferred financing costs, net of income taxes, that was recognized in connection with the redemption of the Subordinated Notes with the aggregate net proceeds from IPO and Additional Sale and the repayment of a portion of U.S. dollar-denominated term loans with proceeds from the Euro Notes Transactions, respectively. The unaudited pro forma condensed consolidated statements of operations do not give effect to any of the acquisitions we have completed during such periods as such acquisitions, either individually or in the aggregate, are not significant or otherwise material to an understanding of our historical results of operations. For more information regarding our recent acquisitions, see Note 5 to our annual consolidated financial statements which is incorporated by reference in this prospectus.
41
Table of Contents
The unaudited pro forma condensed consolidated statements of operations should not be considered indicative of actual results that would have been achieved had the Transactions actually occurred on January 1, 2014 and do not purport to indicate condensed consolidated results of operations for any future period.
The unaudited pro forma condensed consolidated financial statements and related notes should be read in conjunction with the information contained in “Use of Proceeds,” “Capitalization,” “Selected Historical Consolidated Financial Data,” “Management’s Discussion and Analysis of Financial Condition and Results of Operations” and the consolidated financial statements and related notes incorporated by reference in this prospectus.
42
Table of Contents
VWR CORPORATION AND SUBSIDIARIES
UNAUDITED PRO FORMA CONDENSED CONSOLIDATED STATEMENTS
OF OPERATIONS
Three Months Ended March 31, 2015
| Historical | Pro Forma Adjustments |
Pro Forma | ||||||||||
| (in millions, except per share data) | ||||||||||||
| Net sales |
$ | 1,029.6 | $ | — | $ | 1,029.6 | ||||||
| Cost of goods sold |
738.4 | — | 738.4 | |||||||||
|
|
|
|
|
|
|
|||||||
| Gross profit |
291.2 | — | 291.2 | |||||||||
| Selling, general and administrative expenses |
217.4 | — | 217.4 | |||||||||
|
|
|
|
|
|
|
|||||||
| Operating income |
73.8 | — | 73.8 | |||||||||
| Interest expense, net |
(27.2 | ) | (A) (1.2 | ) | (28.4 | ) | ||||||
| Other income (expense), net |
70.3 | — | 70.3 | |||||||||
| Loss on extinguishment of debt |
(1.8 | ) | (B) 1.8 | — | ||||||||
|
|
|
|
|
|
|
|||||||
| Income before income taxes |
115.1 | 0.6 | 115.7 | |||||||||
| Income tax provision |
(43.6 | ) | (C) (0.2 | ) | (43.8) | |||||||
|
|
|
|
|
|
|
|||||||
| Net income |
$ | 71.5 | $ | 0.4 | $ | 71.9 | ||||||
|
|
|
|
|
|
|
|||||||
| Earnings per share: |
||||||||||||
| Basic |
$ | 0.54 | $ | 0.01 | $ | 0.55 | ||||||
| Diluted |
$ | 0.54 | $ | 0.01 | $ | 0.55 | ||||||
| Weighted-average shares outstanding: |
||||||||||||
| Basic |
131.4 | — | 131.4 | |||||||||
| Diluted |
131.9 | — | 131.9 | |||||||||
See notes to unaudited pro forma condensed consolidated statements of operations.
43
Table of Contents
VWR CORPORATION AND SUBSIDIARIES
UNAUDITED PRO FORMA CONDENSED CONSOLIDATED STATEMENTS
OF OPERATIONS
Year Ended December 31, 2014
| Historical | Pro Forma Adjustments |
Pro Forma | ||||||||||
| (in millions, except per share data) | ||||||||||||
| Net sales |
$ | 4,375.3 | $ | — | $ | 4,375.3 | ||||||
| Cost of goods sold |
3,131.9 | — | 3,131.9 | |||||||||
|
|
|
|
|
|
|
|||||||
| Gross profit |
1,243.4 | — | 1,243.4 | |||||||||
| Selling, general and administrative expenses |
925.5 | (D) 2.2 | 927.7 | |||||||||
|
|
|
|
|
|
|
|||||||
| Operating income |
317.9 | (2.2 | ) | 315.7 | ||||||||
| Interest expense, net |
(166.3 | ) | (A) 36.7 | (129.6 | ) | |||||||
| Other income (expense), net |
90.9 | (E) (14.6 | ) | 76.3 | ||||||||
| Loss on extinguishment of debt |
(5.1 | ) | (B) 5.1 | — | ||||||||
|
|
|
|
|
|
|
|||||||
| Income before income taxes |
237.4 | 25.0 | 262.4 | |||||||||
| Income tax provision |
(84.8 | ) | (C) (8.9 | ) | (93.7 | ) | ||||||
|
|
|
|
|
|
|
|||||||
| Net income |
152.6 | 16.1 | 168.7 | |||||||||
| Accretion of dividends on redeemable convertible preferred stock |
(29.4 | ) | (F) 29.4 | — | ||||||||
|
|
|
|
|
|
|
|||||||
| Net income applicable to common stockholders |
$ | 123.2 | $ | 45.5 | $ | 168.7 | ||||||
|
|
|
|
|
|
|
|||||||
| Earnings per share: |
||||||||||||
| Basic |
$ | 2.50 | $ | (1.22 | ) | $ | 1.28 | |||||
| Diluted |
$ | 2.49 | $ | (1.21 | ) | $ | 1.28 | |||||
| Weighted-average shares outstanding: |
||||||||||||
| Basic |
49.3 | (F) 82.1 | 131.4 | |||||||||
| Diluted |
49.5 | (F) 82.3 | 131.8 | |||||||||
See notes to unaudited pro forma condensed consolidated statements of operations.
44
Table of Contents
VWR CORPORATION AND SUBSIDIARIES
NOTES TO UNAUDITED PRO FORMA CONDENSED CONSOLIDATED STATEMENTS
OF OPERATIONS
| A. | Reflects adjustments to interest expense, net of interest income, as follows (in millions): |
| Three Months Ended March 31, 2015 |
Year Ended December 31, 2014 |
|||||||
| Historical interest expense, net of interest income |
$ | 27.2 | $ | 166.3 | ||||
| Elimination of historical interest expense of Subordinated Notes redeemed with IPO and Additional Sale proceeds |
— | (47.2 | ) | |||||
| Increase to interest expense from borrowings under multi-currency revolving loan facility for payment of Holdings Dividend |
— | 0.8 | ||||||
| Elimination of historical interest expense of U.S. dollar denominated term loans repaid with Euro Notes Transactions |
(4.1 | ) | (19.6 | ) | ||||
| Increase to interest expense from issuance of Euro Notes |
6.8 | 31.8 | ||||||
| Elimination of historical interest expense of credit facilities repaid in Transactions |
(1.5 | ) | (2.5 | ) | ||||
|
|
|
|
|
|||||
| Pro forma interest expense, net of interest income |
$ | 28.4 | $ | 129.6 | ||||
|
|
|
|
|
|||||
| B. | The unaudited pro forma condensed consolidated statements of operations do not include certain non-recurring costs and expenses that we incurred in connection with the Transactions as such charges will not have an ongoing impact on our financial results, including the write-off of unamortized deferred financing costs that was recognized in connection with the redemption of the Subordinated Notes with the net proceeds from the IPO and Additional Sale and the repayment of a portion of the U.S. dollar-denominated term loans with proceeds from the Euro Notes Transactions. |
| C. | Represents the income tax effect resulting from the Transactions using the effective income tax rates of 35.7% and 37.9% for the three months ended March 31, 2015 and for the year ended December 31, 2014, respectively. |
| D. | Reflects: (i) share-based compensation expense of $3.5 million related to the IPO Grants, (ii) the elimination of the management fee of $1.5 million that we historically paid to our Sponsors and (iii) a $0.2 million increase in Board fees. The grant date fair value of the IPO Grants was calculated using a Black-Scholes-Merton closed-form type option pricing model reflecting assumptions specific to employee and director awards. See “Prospectus Summary—Recent Transactions” for more information on the IPO Grants. Awards granted to employees were valued using the following inputs: an expected term of 5.0 years, 33% volatility and a risk free rate of 1.77%. Awards granted to directors were valued using the following inputs: an expected term of 4.3 years, 33% volatility and a risk free rate of 1.68%. The aggregate grant date fair value of the IPO Grants was estimated to be $23.2 million prior to any assumption for forfeitures, which is being recognized as compensation expense over a weighted average vesting period of 4.9 years. |
In connection with the IPO, the parties terminated the Management Services Agreement, and certain directors affiliated with our Sponsors became entitled to receive annual compensation for Board services. See “Certain Relationships and Related Transactions—Certain Related Persons Transactions—Management Services Agreement.”
| E. | Reflects the elimination of the historical foreign currency remeasurement gain of $14.6 million relating to the €126.9 million in euro-denominated Subordinated Notes redeemed using the aggregate net proceeds from the IPO and the Additional Sale. |
| F. | Reflects: (i) the issuance of 1,000,000 shares of common stock on July 31, 2014 in exchange for all of our previously outstanding redeemable convertible preferred stock and common stock in connection with the Recapitalization; (ii) the issuance of shares of common stock from the 102-for-1 stock split; and (iii) the issuance of 25.5 million and 3.8 million shares of common stock in connection with the IPO and the Additional Sale, respectively. Weighted average shares outstanding, diluted, also reflects the dilutive affect of the IPO Grants. |
45
Table of Contents
SELECTED HISTORICAL CONSOLIDATED FINANCIAL DATA
The following tables set forth our selected historical consolidated financial data as of and for the periods indicated below. We have derived the selected historical consolidated financial data as of December 31, 2014 and 2013 and for the years ended December 31, 2014, 2013 and 2012 from our annual consolidated financial statements and related notes incorporated by reference in this prospectus. We have derived the selected historical consolidated financial data as of December 31, 2012 and for the year ended December 31, 2011 from our audited consolidated financial statements and related notes, which are not included in this prospectus. We have derived the selected historical consolidated financial data as of December 31, 2011 and 2010, and for the year ended December 31, 2010 from our unaudited consolidated financial statements and related notes, which are not included in this prospectus. The annual consolidated financial statements of VWR Funding, our direct wholly-owned subsidiary, have been audited for these periods and are substantially identical to our unaudited consolidated financial statements for such periods, except with respect to redeemable equity and stockholder equity accounts and related disclosures.
The selected historical consolidated financial data as of March 31, 2015 and for the three months ended March 31, 2015 and 2014 have been derived from our unaudited interim condensed consolidated financial statements and related notes incorporated by reference in this prospectus, which have been prepared on a basis consistent with our annual consolidated financial statements. We have derived the selected historical consolidated financial data as of March 31, 2014 from our unaudited interim condensed consolidated financial statements and related notes, which are not included in this prospectus. In the opinion of management, such unaudited financial data reflect all adjustments, consisting only of normal and recurring adjustments, necessary for fair presentation of the results for those periods. The results of operations for the three months ended March 31, 2015 are not necessarily indicative of the results to be expected for the year ending December 31, 2015 or any future period.
The information in the following table is only a summary and should be read in conjunction with “Management’s Discussion and Analysis of Financial Condition and Results of Operations” and our consolidated financial statements and related notes incorporated by reference in this prospectus.
| Year Ended December 31, | Three Months Ended March 31, |
|||||||||||||||||||||||||||
| 2014 | 2013 | 2012 | 2011 | 2010 | 2015 | 2014 | ||||||||||||||||||||||
| (Unaudited) | (Unaudited) | (Unaudited) | ||||||||||||||||||||||||||
| (in millions) |
||||||||||||||||||||||||||||
| Statement of Operations Data: |
||||||||||||||||||||||||||||
| Net sales |
$ | 4,375.3 | $ | 4,187.8 | $ | 4,129.4 | $ | 4,161.1 | $ | 3,638.7 | $ | 1,029.6 | $ | 1,056.6 | ||||||||||||||
| Cost of goods sold |
3,131.9 | 2,991.5 | 2,962.0 | 2,981.6 | 2,599.8 | 738.4 | 744.0 | |||||||||||||||||||||
|
|
|
|
|
|
|
|
|
|
|
|
|
|
|
|||||||||||||||
| Gross profit |
1,243.4 | 1,196.3 | 1,167.4 | 1,179.5 | 1,038.9 | 291.2 | 312.6 | |||||||||||||||||||||
| Selling general and administrative expenses |
925.5 | 942.3 | 915.4 | 913.6 | 853.5 | 217.4 | 235.6 | |||||||||||||||||||||
|
|
|
|
|
|
|
|
|
|
|
|
|
|
|
|||||||||||||||
| Operating income |
317.9 | 254.0 | 252.0 | 265.9 | 185.4 | 73.8 | 77.0 | |||||||||||||||||||||
| Interest expense, net |
(166.3 | ) | (190.7 | ) | (199.5 | ) | (199.6 | ) | (202.7 | ) | (27.2 | ) | (45.8 | ) | ||||||||||||||
| Other income (expense), net (1) |
90.9 | (38.8 | ) | (15.1 | ) | 21.8 | 66.8 | 70.3 | (3.1 | ) | ||||||||||||||||||
| Loss on extinguishment of debt (2) |
(5.1 | ) | (2.0 | ) | (25.5 | ) | — | — | (1.8 | ) | — | |||||||||||||||||
|
|
|
|
|
|
|
|
|
|
|
|
|
|
|
|||||||||||||||
| Income before income taxes |
237.4 | 22.5 | 11.9 | 88.1 | 49.5 | 115.1 | 28.1 | |||||||||||||||||||||
| Income tax provision |
(84.8 | ) | (8.4 | ) | (8.1 | ) | (30.4 | ) | (28.0 | ) | (43.6 | ) | (10.7 | ) | ||||||||||||||
|
|
|
|
|
|
|
|
|
|
|
|
|
|
|
|||||||||||||||
| Net income |
152.6 | 14.1 | 3.8 | 57.7 | 21.5 | 71.5 | 17.4 | |||||||||||||||||||||
| Accretion of dividends on redeemable convertible preferred stock (3) |
(29.4 | ) | (47.9 | ) | (45.5 | ) | (42.4 | ) | (39.0 | ) | — | (12.4 | ) | |||||||||||||||
|
|
|
|
|
|
|
|
|
|
|
|
|
|
|
|||||||||||||||
| Net income (loss) applicable to common stockholders |
$ | 123.2 | $ | (33.8 | ) | $ | (41.7 | ) | $ | 15.3 | $ | (17.5 | ) | $ | 71.5 | $ | 5.0 | |||||||||||
|
|
|
|
|
|
|
|
|
|
|
|
|
|
|
|||||||||||||||
46
Table of Contents
| Year Ended December 31, | Three Months Ended March 31, |
|||||||||||||||||||||||||||
| 2014 | 2013 | 2012 | 2011 | 2010 | 2015 | 2014 | ||||||||||||||||||||||
| (Unaudited) | (Unaudited) | (Unaudited) | ||||||||||||||||||||||||||
| (in millions, except per share data) |
||||||||||||||||||||||||||||
| Per Share Data: |
||||||||||||||||||||||||||||
| Earnings (loss) per share: |
||||||||||||||||||||||||||||
| Basic |
$ | 2.50 | $ | (338.00 | ) | $ | (417.00 | ) | $ | 153.00 | $ | (175.00 | ) | $ | 0.54 | $ | 50.00 | |||||||||||
| Diluted |
$ | 2.49 | $ | (338.00 | ) | $ | (417.00 | ) | $ | 153.00 | $ | (175.00 | ) | $ | 0.54 | $ | 50.00 | |||||||||||
| Weighted-average shares outstanding (4): |
||||||||||||||||||||||||||||
| Basic |
49.3 | 0.1 | 0.1 | 0.1 | 0.1 | 131.4 | 0.1 | |||||||||||||||||||||
| Diluted |
49.5 | 0.1 | 0.1 | 0.1 | 0.1 | 131.9 | 0.1 | |||||||||||||||||||||
| Other Financial Data: |
||||||||||||||||||||||||||||
| Net cash provided by (used in): |
||||||||||||||||||||||||||||
| Operating activities |
$ | 191.1 | $ | 200.9 | $ | 34.7 | $ | 139.3 | $ | 122.3 | $ | (9.9 | ) | $ | 15.2 | |||||||||||||
| Investing activities |
(123.0 | ) | (89.5 | ) | (160.9 | ) | (209.2 | ) | (74.4 | ) | (24.9 | ) | (21.4 | ) | ||||||||||||||
| Financing activities |
(71.8 | ) | (117.9 | ) | 98.3 | 90.3 | (22.3 | ) | 23.8 | 0.9 | ||||||||||||||||||
| Depreciation and amortization |
129.3 | 130.0 | 125.9 | 120.9 | 116.5 | 30.5 | 34.6 | |||||||||||||||||||||
| Cash paid for income taxes, net |
39.3 | 37.3 | 45.7 | 26.8 | 24.1 | 7.3 | 5.7 | |||||||||||||||||||||
| Acquisition of businesses, net of cash acquired |
102.9 | 44.4 | 113.3 | 168.5 | 32.8 | 15.6 | 14.8 | |||||||||||||||||||||
| Capital expenditures |
33.6 | 45.3 | 51.8 | 42.5 | 41.6 | 9.5 | 6.6 | |||||||||||||||||||||
| Gross profit as a percentage of net sales |
28.4 | % | 28.6 | % | 28.3 | % | 28.3 | % | 28.6 | % | 28.3 | % | 29.6 | % | ||||||||||||||
| December 31, | March 31, | |||||||||||||||||||||||||||
| 2014 | 2013 | 2012 | 2011 | 2010 | 2015 | 2014 | ||||||||||||||||||||||
| (Unaudited) | (Unaudited) | (Unaudited) | (Unaudited) | |||||||||||||||||||||||||
| (in millions) | ||||||||||||||||||||||||||||
| Balance Sheet Data: |
||||||||||||||||||||||||||||
| Cash and cash equivalents |
$ | 118.0 | $ | 135.6 | $ | 139.8 | $ | 164.6 | $ | 142.1 | $ | 98.5 | $ | 130.2 | ||||||||||||||
| Total assets |
4,988.8 | 5,209.0 | 5,402.0 | 5,189.7 | 5,001.4 | 4,773.6 | 5,224.9 | |||||||||||||||||||||
| Debt and capital lease obligations (5) |
2,111.9 | 2,854.4 | 3,148.6 | 2,908.7 | 2,757.7 | 2,063.3 | 2,860.2 | |||||||||||||||||||||
| Total redeemable equity (3) |
51.4 | 670.6 | 627.9 | 610.6 | 562.8 | 57.1 | 681.8 | |||||||||||||||||||||
| Total stockholder equity (3)(6) |
1,339.7 | 425.8 | 406.1 | 404.1 | 452.4 | 1,241.4 | 419.9 | |||||||||||||||||||||
| (1) | During all of the periods presented, we had a significant amount of euro-denominated debt recorded on our U.S. dollar-denominated balance sheet. Our operating results are exposed to foreign currency risk with respect to a portion of this indebtedness. Specifically, during times of a weakening U.S. dollar, the relative value of this debt would increase, which would require us to record foreign exchange losses. As of March 31, 2015, we had €1,065.6 million ($1,144.4 million on a U.S. dollar equivalent basis) of euro-denominated debt recorded on our U.S. dollar-denominated balance sheet, which constitutes approximately 56% of our total outstanding debt. |
As of March 31, 2015, approximately one half of our euro-denominated debt is designated as a hedge to help protect a portion of our net investment in euro-denominated foreign operations from the impact of changes in the euro to U.S. dollar exchange rate. As a result of the hedge designation, the net foreign currency remeasurement gain or loss on this debt, which otherwise would be recognized in earnings, is equally offset in other comprehensive income by the net unrealized gain or loss from the translation of the hedged portion of our net investment in euro-denominated foreign operations.
| (2) | In the fourth quarter of 2014, we completed our IPO and used the net proceeds of $577.8 million to redeem all of the Subordinated Notes and to repay borrowings under our credit facilities. This repayment of debt caused us to recognize a loss on extinguishment of debt of $5.1 million, representing the write-off of unamortized deferred financing costs on the Subordinated Notes, to eliminate interest expense and to reduce our exposure to foreign currency remeasurement gains or losses in future periods. |
47
Table of Contents
During the year ended December 31, 2013, we recognized a loss on extinguishment of debt of $2.0 million representing the write-off of unamortized deferred financing costs associated with term loans that were not extended following an amendment of our Senior Credit Facility.
During the year ended December 31, 2012, we recognized a loss on extinguishment of debt of $25.5 million in connection with the refinancing of our 10.25% senior notes due 2015. Such loss included $18.7 million in tender and redemption premiums paid, $6.6 million for the write-off of unamortized deferred financing costs and $0.2 million of third-party fees and fees paid to lenders.
During the three months ended March 31, 2015, we recognized a loss on extinguishment of debt of $1.8 million representing the write-off of unamortized deferred financing costs associated with term loans that were repaid using a portion of the net proceeds from the issuance of the Euro Notes.
| (3) | In anticipation of our IPO, we recapitalized our equity by (i) exchanging all of our redeemable convertible preferred stock for newly issued common shares on July 31, 2014 and (ii) completing a 102-for-1 stock split on October 7, 2014. Following the recapitalization, the accretion of dividends on redeemable convertible preferred stock ceased, and all accrued but unpaid dividends and unreturned capital on the redeemable convertible preferred stock became available to common stockholders. |
| (4) | For all periods presented, earnings or loss per share has been adjusted for the 102-for-1 stock split that occurred on October 7, 2014. The conversion of all shares of common stock and redeemable convertible preferred stock into newly-issued shares of common stock on July 31, 2014, and the issuance of shares in the IPO and the Additional Sale, was considered period activity when calculating earnings or loss per share, which affects the comparability of the per share data among periods. |
| (5) | In the fourth quarter of 2014, we completed our IPO, including the Additional Sale. We received aggregate net proceeds of $577.8 million, which we used to redeem all of our Subordinated Notes and to repay borrowings under our credit facilities. For additional information, see “Management’s Discussion and Analysis of Financial Condition and Results of Operations.” |
| (6) | On October 1, 2014, we paid a dividend of $25.0 million to VWR Holdings, who held all of our then outstanding common stock. |
48
Table of Contents
MANAGEMENT’S DISCUSSION AND ANALYSIS OF FINANCIAL CONDITION AND RESULTS OF OPERATIONS
The following discussion and analysis of our financial condition and results of operations should be read in conjunction with our annual consolidated financial statements and related notes incorporated by reference in this prospectus. This discussion and analysis contains forward-looking statements, which are subject to risks and uncertainties. Actual results may differ materially from those forward-looking statements. Refer to the sections entitled “Risk Factors” and “Cautionary Factors Regarding Forward-Looking Statements” for additional information.
Overview
We are a leading, independent provider of laboratory products, services and solutions to the global life science, general research and applied markets. We have significant market share positions in Europe and North America. We also have operations in Asia-Pacific and other key emerging markets to support our multinational customers across the globe. We serve a critical role in connecting customer sites with core laboratory product suppliers across multiple industries and geographies. We offer one of the broadest portfolios of branded and private label laboratory products. We also offer a full range of value-added services, including custom manufacturing, to meet our customers’ product needs. These services represent a growing but currently small portion of our overall net sales. We offer a wide selection of unique products and have developed an extensive global infrastructure including thousands of sales and service-focused professionals. We deliver value to our customers by improving the costs, efficiency and effectiveness of their research laboratories and production operations. We deliver value to our suppliers by providing them with cost-effective channel access to a global and diverse customer base.
Our growth strategies include expanding our global strategic relationships, developing complementary new products and services, expanding our customer and supplier base, implementing best practices across our operations, broadening our offerings to underserved customer segments and executing our targeted acquisition strategy. We generated net sales of $1,029.6 million, Adjusted EBITDA of $106.8 million, Adjusted Net Income of $43.8 million and net income of $71.5 million for the three months ended March 31, 2015. We generated net sales of $4,375.3 million, Adjusted EBITDA of $449.4 million, Adjusted Net Income of $158.3 million and net income of $152.6 million for the year ended December 31, 2014. Since 2006, the year prior to our acquisition by the Sponsors, we have been able to increase net sales and Adjusted EBITDA at compound annual growth rates of 3.8% and 8.5%, respectively, we have improved our gross margin from 27.1% to 28.4% and we have improved our Adjusted EBITDA margin from 7.2% to 10.3% through 2014. See “Summary Historical Consolidated Financial Data” for the definitions of Adjusted EBITDA and Adjusted Net Income, the reason for their inclusion and a reconciliation from net income to Adjusted Net Income and Adjusted EBITDA.
We report financial results on the basis of two reportable segments organized by geographic region: (1) North, Central and South America (collectively, the “Americas”); and (2) Europe, Middle East, Africa and Asia-Pacific (collectively, “EMEA-APAC”). Both the Americas and EMEA-APAC segments provide laboratory products, services and solutions to customers in the life science, general research and applied markets, including the Biopharma, agricultural, chemical, environmental, food and beverage, healthcare, microelectronic and petrochemical industries, as well as governmental agencies, universities, primary education and research institutes and environmental organizations.
Initial Public Offering
On October 7, 2014, we completed our IPO by issuing 25.5 million common shares at a price of $21.00 per share. After deducting underwriting discounts, commissions and other offering costs, the IPO resulted in net proceeds of $501.9 million.
49
Table of Contents
On November 5, 2014, the underwriters of the IPO completed the Additional Sale by purchasing an additional 3.8 million shares of common stock at the public offering price of $21.00 per share under an option granted to them in connection with the IPO. After deducting underwriting discounts and commissions, the Additional Sale resulted in net proceeds of $75.9 million.
In anticipation of and in connection with the IPO and the Additional Sale, we entered into the following IPO Transactions, which had a significant impact on our financial position and results of operations:
| • | On July 31, 2014, we completed an internal recapitalization, pursuant to which: (i) all then outstanding equity, consisting of 0.1 million shares of common stock (1,000 shares on a pre-split basis) and 0.4 million shares of redeemable convertible preferred stock, were exchanged for 102.0 million shares (1.0 million shares on a pre-split basis) of newly-issued common stock; and (ii) 204.0 million shares (2.0 million shares on a pre-split basis) of common stock were authorized for issuance. |
| • | On October 1, 2014, we paid a $25.0 million dividend to VWR Holdings, who held all of our then outstanding common stock. |
| • | On October 7, 2014, we: (i) terminated a management services agreement with affiliates of the Sponsors; (ii) executed the ITRA with VWR Holdings; (iii) filed an amended and restated certificate of incorporation and amended and restated bylaws; (iv) awarded options to purchase shares of our common stock to certain of our employees and directors under the 2014 Equity Incentive Plan; (v) adopted the VWR ESPP; and (vi) received the net proceeds from the sale of common shares in the IPO. For additional information, see Notes 13, 14 and 21 to the annual consolidated financial statements incorporated by reference in this prospectus. |
| • | On October 7, 2014 and November 5, 2014, we received the net proceeds from the sales of common shares in the IPO and the Additional Sale, respectively. We used the proceeds to redeem all of the Subordinated Notes and a portion of the borrowings under our credit facilities. |
Our consolidated balance sheets at March 31, 2015 and December 31, 2014 and our condensed consolidated statement of operations for the three months ended March 31, 2015 reflect all of the IPO Transactions. We have provided an unaudited pro forma consolidated statement of operations for the year ended December 31, 2014 to present the effect the IPO Transactions would have had on our results of operations had they occurred on January 1, 2014. See Note 25 to our annual consolidated financial statements incorporated by reference in this prospectus.
As a result of the IPO, our results for the three months ended March 31, 2015 reflect significant reductions in cash interest expense, net of taxes, which were partially offset by a cash payment to VWR Holdings pursuant to the ITRA. Those results also reflected less exposure from the remeasurement of foreign-denominated debt to changes in foreign currency rates because a significant amount of euro-denominated debt was redeemed using the net proceeds of the IPO and the Additional Sale. We expect these trends will continue to impact our results in future periods.
Trends and Key Factors Affecting our Performance and Financial Condition
We believe the following trends and key factors have affected our recent operating results and are likely to continue to affect our performance and financial condition.
Foreign Currency
Our operations span the globe. Approximately one half of our net sales originate in currencies other than the U.S. dollar — principally the euro, as well as the British pound sterling, the Canadian dollar and the Swiss franc. As a result, changes in foreign currency exchange rates impact our reported results. Our results from comparable operations exclude the effect of foreign currency translation. See “—Key Indicators of Performance and Financial Condition” for additional information.
50
Table of Contents
We have a significant amount of foreign-denominated debt on our U.S. dollar-denominated balance sheet. The translation of that debt is reported in other income (expense), net each period, except for the Euro Notes, which qualify as a hedge of our net investment in foreign operations. Such gains or losses are unrealized until repayment of the debt and relate to the weakening or strengthening, respectively, of the euro against the U.S. dollar. This exposure was partially mitigated by the redemption of our euro-denominated Subordinated Notes as previously discussed.
Recently, the U.S. dollar has strengthened against most foreign currencies. For example, since its month-end high in April 2014 of $1.39 = €1.00, the spot euro exchange rate declined to $1.07 = €1.00 at March 31, 2015. Year-over-year, the average euro exchange rate was $1.37 = €1.00 for the first quarter of 2014 compared to $1.13 = €1.00 for the first quarter of 2015. Further strengthening of the U.S. dollar would impact us for the remainder of 2015 as follows:
| • | It would have a negative impact on the reported results of our foreign-denominated operations proportional to the decline in the applicable foreign currency exchange rates. Of our total net sales for the year ended December 31, 2014, approximately one-half were foreign-denominated. |
| • | It would have a negative impact on the reported value of our foreign-denominated net assets proportional to the decline in the applicable foreign currency exchange rates. Of our total assets for the year ended December 31, 2014, approximately one-half were foreign-denominated. |
In order to partially offset our exposure to these recent changes, in the first quarter of 2015 we designated our Euro Notes as a hedge of our net investment in euro-denominated foreign operations.
We are not able to predict the impact that changes in currency exchange rates will have on our operating results, but their impact could be significant. For additional information about the effect of foreign currency exchange rates on our results of operations, see “—Quantitative and Qualitative Disclosures about Market Risk.”
Issuance of Euro Notes
On March 25, 2015, we completed the private sale of €503.8 million of Euro Notes. The notes were offered at an original issue discount of €3.8 million. We also paid debt issuance costs of $4.5 million during the three months ended March 31, 2015 and accrued an additional $1.1 million at March 31, 2015. The original issue discount and the debt issuance costs were deferred and are being recognized as interest expense through the maturity of the debt.
We designated the Euro Notes as a hedge to help protect a portion of our net investment in euro-denominated foreign operations from the impact of changes in the euro to U.S. dollar exchange rate. As a result of the hedge designation, the net foreign currency remeasurement gain or loss on the Euro Notes, which otherwise would be recognized in earnings, is equally offset in other comprehensive income by the net unrealized gain or loss from the translation of the hedged portion of our net investment in euro-denominated foreign operations.
Acquisitions
Since the VWR Acquisition, we have completed 38 business acquisitions. These acquisitions have broadened our product offerings, strengthened our existing market positions and expanded our geographic presence. As part of our business strategy, we expect to pursue additional acquisition opportunities.
We are typically able to improve the profitability of acquired businesses by integrating them into our enterprise resource planning and web systems, streamlining various back-office functions and consolidating facilities when appropriate. In most cases, these measures generate cost savings that exceed any near-term disruptions that such businesses may experience. We also analyze their operations to identify any new suppliers, customers, products and other capabilities that we can leverage across operations on a local, regional and global basis. It generally takes us between 12 and 18 months to realize the benefits of this strategy.
51
Table of Contents
We include the operating results of acquired companies in our consolidated results of operations from their respective dates of acquisition. As a result, the number, timing and relative size of our acquisitions that we complete in any period impacts the comparability of our period-to-period operating results. Our results from comparable operations exclude the effect of recent acquisitions to the extent they were not present in the comparable prior period. See “—Key Indicators of Performance and Financial Condition” for additional information.
For additional information regarding our recent acquisitions, see Note 5 to our annual consolidated financial statements incorporated by reference in this prospectus.
Mix of Products Sold
We offer one of the broadest portfolios of branded and private label laboratory products in our industry and a full range of value-added services, including custom manufacturing. We typically realize differing gross margins on these products and services, with greater gross margin coming from the sale of private label products as well as chemicals and reagents that we manufacture. Private label products, which enhance customer choice with lower cost alternatives, represented 19% of our 2014 product sales. We intend to further expand our private label product offering through focused sales and marketing efforts to offer our customers both branded and private label products. We also offer custom manufactured chemicals, including buffers, reagents and other chemicals used in biopharmaceutical and industrial applications and production process. We are focused on enhancing our capabilities as a manufacturer of high quality biochemicals, chemicals and reagents that generally do not conflict with the offering of our existing supplier base. The mix of products sold by us in any given period will impact our gross margin.
Recent Initiatives in our Americas Segment
Excluding the effect of foreign currency and acquisitions, our Americas segment experienced an increase in comparable net sales in 2014. Prior to this, our Americas segment had experienced declines in comparable net sales for recent historical periods. Net sales in our Americas segment were $2,430.1 million, $2,352.7 million and $2,400.9 million for the years ended December 31, 2014, 2013 and 2012, respectively. We believe that the future operating results of our Americas segment will be positively impacted by the recent strategic initiatives we have implemented as discussed below.
The Americas segment recently completed a series of initiatives to significantly upgrade its information technology infrastructure, optimize its U.S. distribution network and modify its marketing strategy. We implemented a new enterprise resource planning system and an e-commerce platform to better support our new marketing initiatives, growing infrastructure and integration of acquired companies. We opened a new 500,000 square foot warehouse facility in central California, strategically located to reduce shipping costs and improve delivery time to our customers throughout the western United States. We also shifted our North American regional go-to-market (“GTM”) strategy to a customer segment-specific approach, which we believe allows us to better address the unique needs of our customers.
All these initiatives were completed during 2012 and 2013, required a capital investment of approximately $70 million, resulted in charges for restructuring and other cost reduction initiatives and caused some disruption to our business over that period. Our operating results in the Americas segment in 2014 and in the first quarter of 2015 were positively impacted by these initiatives, including improved U.S. sales performance and customer satisfaction and lower support costs for infrastructure. We believe that the impact of these initiatives will continue to affect our operating results in future periods.
European Systems, Infrastructure and Strategy
Our European operations benefit from a highly integrated and robust enterprise resource planning system, efficient distribution infrastructure and customer segment-specific GTM strategy. For example, our European
52
Table of Contents
business has operated on a common, highly integrated enterprise resource planning system for more than 12 years, enabling a stable and efficient distribution model, and a customer segment-specific GTM strategy, including advanced and tailored marketing materials, which was implemented over the past several years. Our enterprise resource planning system has also enabled us to rapidly integrate the operations of newly acquired companies. In July 2014, we launched our new, feature-rich e-commerce platform in EMEA-APAC, which we first introduced in the United States in April 2012.
We believe our Pan-European platform and acquisition strategy have increased our customer penetration and product offerings, which have collectively resulted in strong revenue growth and improved margins. Our strengthened market leadership position in Europe gives us the opportunity to continue to achieve strong financial results.
Relationship with Merck KGaA
We benefit from our longstanding and strong relationship with Merck KGaA and its affiliates. Our business operated as a division of Merck KGaA from 1999 until we were acquired by a private equity firm in 2004. In connection with that disposition, Merck KGaA agreed to enter into a long-term, exclusive supply agreement with us primarily covering Western Europe, which had an initial five-year term that was subsequently extended for an additional five-year period. In April 2014, we began operating under new, non-exclusive supply agreements that extend through December 2018. These new agreements govern a portion of our overall sales of products from Merck KGaA in Europe and provide us with preferred, non-exclusive access to Merck KGaA’s branded products across multiple jurisdictions. The new agreements include less favorable pricing terms to us than our previous agreement, which began negatively impacting our comparable gross margin in April 2014 and which offset other improvements to gross margin during 2014. We expect that the year-over-year impact of these changes will substantially cease beginning in the second quarter of 2015.
Capital Structure
As a result of the VWR Acquisition, we carry significant amounts of goodwill, other intangible assets and debt on our balance sheet. This has caused us to report significant amounts of amortization and interest expense and to pay significant amounts of cash for interest. We have also recognized impairment charges on our goodwill and other intangible assets. A large portion of our goodwill, other intangible assets and debt are denominated in currencies other than the U.S. dollar, which causes us to report significant currency translation adjustments. We have also taken a number of actions to address pending maturity dates on our indebtedness and to take advantage of strong debt markets, which has caused us to record losses on extinguishment of debt while lowering interest expense and cash paid for interest prospectively.
We continually monitor the capital markets for financing opportunities. The majority of our long-term debt obligations will mature during 2016 and 2017. We intend to reduce our net leverage in advance of these maturities as we seek to refinance or otherwise satisfy these debt obligations. In May, 2015, we amended our A/R Facility to extend its maturity and to secure a more favorable rate of interest. Should interest rates remain at or near current levels, we anticipate refinancing and extending other portions of our outstanding debt.
Restructuring and Other Cost Reduction Initiatives
During September 2013, we initiated a global restructuring program designed to enhance interaction with our customers and suppliers, improve the efficiency of our operations and reduce operating expenses. In connection with these actions, we recognized restructuring charges of $32.5 million during the year ended December 31, 2013 and expect to realize approximately $38 million of savings from this program when fully implemented, the substantial majority of which we realized during 2014.
From time to time, we have undertaken other cost reduction initiatives including severance and facility closure costs. Expenses associated with such actions were $16.9 million for the year ended December 31, 2012.
53
Table of Contents
For additional information, see Note 15 to our annual consolidated financial statements incorporated by reference in this prospectus.
Seasonality and Inflation
Neither seasonality nor inflation have had a significant impact on our historical results of operations or financial condition. Although the prices we pay for our products may increase, we believe we will continue to be able to pass through the majority of these increases to our customers. However, our earnings and cash flows could be adversely affected if we are unable to pass through future cost increases arising from inflation.
Due to VWR Holdings — Income Tax Receivable Agreement
On October 7, 2014, we entered into an ITRA with VWR Holdings. The ITRA provides for the payment of 85% of the amount of cash savings, if any, in U.S. federal, state and local income tax realized as a result of utilizing net operating losses that were generated in periods prior to the IPO. As noted previously, our Sponsors own a controlling interest in VWR Holdings.
We made our first payment under the ITRA of $9.8 million during the three months ended March 31, 2015. At March 31, 2015, we reported a liability of $163.1 million due to VWR Holdings related to the ITRA. The value of the ITRA liability is based upon the expected future value of our net operating loss carryforwards. Changes to the value of the ITRA liability will be presented as other income (expense), net in the consolidated statement of operations. As a result, any changes that might occur to the valuation allowance with respect to our domestic deferred tax assets, which would be included in income tax expense or benefit, would be substantially offset by opposite changes in the value of the ITRA liability. Therefore, our net income exposure from changes in valuation allowance has been substantially reduced as a result of the ITRA.
The timing of payments under the ITRA correspond to the beginning of the year in which the net operating loss carryforwards will be claimed on our tax return.
Key Indicators of Performance and Financial Condition
To evaluate our performance, we monitor a number of key indicators of our performance and financial condition, some of which are non-GAAP financial measurements. The key indicators that we monitor are as follows:
| • | Net sales and operating income, which we discuss on both a consolidated and reportable segment basis in the section entitled “—Results of Operations;” |
| • | Gross margin and net income or loss, which we discuss on a consolidated basis in the section entitled “—Results of Operations;” |
| • | Adjusted EBITDA, which we also discuss as a percentage of net sales (“Adjusted EBITDA margin”), Adjusted Net Income and Adjusted EPS. Adjusted EBITDA, Adjusted EBITDA margin, Adjusted Net Income and Adjusted EPS are non-GAAP financial measurements and key performance indicators used by our investors, creditors and management to measure and evaluate our operating performance. A reconciliation of these indicators from net income or loss, the most directly comparable GAAP-based financial measurement, and our discussion and analysis of changes therein are included at the end of the section entitled “—Results of Operations” under the subheading “Adjusted EBITDA, Adjusted EBITDA Margin, Adjusted Net Income and Adjusted EPS;” Beginning in the first quarter of 2015, we changed our calculations of Adjusted Net Income and Adjusted EPS so that they include share-based compensation expense. Adjusted EBITDA and Adjusted EBITDA margin continue to exclude share-based compensation expense. |
54
Table of Contents
| • | Net Debt and Net Leverage, which are non-GAAP financial measurements and key performance indicators used by our creditors, investors and management to monitor our financial condition and our continuing ability to service debt. Our calculation of Net Debt reduces our total debt and capital lease obligations by the amount of cash and cash equivalents on hand as well as by our compensating cash balance. Net Leverage is calculated by dividing our Net Debt by our Adjusted EBITDA for the latest twelve-month period. A reconciliation of Net Debt from total debt and capital lease obligations, the most directly comparable GAAP-based financial measurement, and the calculation of Net Leverage are included in the section entitled “—Liquidity and Capital Resources” under the subheading “Net Debt and Net Leverage;” and |
| • | Cash flows, particularly cash flows from operating activities and Free Cash Flow. Free Cash Flow is a non-GAAP financial measurement and a key performance indicator used by our investors, creditors and management to measure and evaluate our ability to generate cash. A reconciliation of Free Cash Flow to cash flows from operating activities, the most directly comparable GAAP-based financial measurement, and our discussion and analysis of changes therein are included at the end of the section entitled “—Historical Cash Flows—Three Months Ended March 31, 2015,” “—Historical Cash Flows—Three Months Ended March 31, 2014,” and “—Historical Cash Flows—Years Ended December 31, 2014, 2013 and 2012.” |
Non-GAAP Financial Measurements
As appropriate, we supplement our results of operations determined in accordance with GAAP with certain non-GAAP financial measurements that we believe are useful to investors, creditors and others in assessing our performance. These measurements should not be considered in isolation or as a substitute for reported GAAP results because they may include or exclude certain items as compared to similar GAAP-based measurements, and such measurements may not be comparable to similarly-titled measurements reported by other companies. Rather, these measurements should be considered as an additional way of viewing aspects of our operations that provide a more complete understanding of our business. We strongly encourage readers to review our consolidated financial statements incorporated by reference herein and in publicly filed reports in their entirety and not rely solely on any one, single financial measurement.
Comparable Operations
Another way in which we evaluate our performance is to exclude certain non-comparable items when reviewing the changes in our reported results. When we discuss our results in this way, we refer to them as comparable operations. We believe that removing non-comparable items from our reported results provides a useful means for readers to understand and evaluate our operating performance. Our results from comparable operations exclude the following items:
| • | Changes in foreign currency exchange rates — Our presentation of results from comparable operations excludes the impact of changes in foreign currency exchange rates. We calculate the impact of such changes by comparing our current period results derived using current period average exchange rates to our current period results recalculated using average foreign exchange rates in effect during the comparable prior period(s). |
| • | Recent acquisitions — Our presentation of results from comparable operations excludes the contribution from recent acquisitions to the extent such contributions were not present in the comparable period. |
Results of Operations
This discussion and analysis includes a summary of our historical results of operations below, followed by detailed comparisons of our results for (i) the three months ended March 31, 2015 and 2014, (ii) the years ended December 31, 2014 and 2013 and (iii) the years ended December 31, 2013 and 2012. We have derived this data from our consolidated financial statements incorporated by reference in this prospectus.
55
Table of Contents
The following tables present a summary of our results of operations (dollars in millions, except per share data):
| Three Months Ended March 31, |
Change | |||||||||||||||
| 2015 | 2014 | Amount | % | |||||||||||||
| Net sales |
$ | 1,029.6 | $ | 1,056.6 | $ | (27.0 | ) | (2.6 | )% | |||||||
| Gross margin |
28.3 | % | 29.6 | % | (130 | ) | basis points | |||||||||
| Operating income |
$ | 73.8 | $ | 77.0 | $ | (3.2 | ) | (4.2 | )% | |||||||
| Net income |
71.5 | 17.4 | 54.1 | * | * | |||||||||||
| Adjusted EBITDA* |
106.8 | 111.7 | (4.9 | ) | (4.4 | )% | ||||||||||
| Adjusted EBITDA margin* |
10.4 | % | 10.6 | % | (20 | ) | basis points | |||||||||
| Adjusted Net Income* |
$ | 43.8 | $ | 36.4 | $ | 7.4 | 20.3 | % | ||||||||
| Adjusted EPS* |
0.33 | 0.28 | 0.05 | 17.9 | % | |||||||||||
| Year Ended December 31, | Change — 2014 vs. 2013 | Change — 2013 vs. 2012 | ||||||||||||||||||||||||||
| 2014 | 2013 | 2012 | Amount | % | Amount | % | ||||||||||||||||||||||
| Net sales |
$ | 4,375.3 | $ | 4,187.8 | $ | 4,129.4 | $ | 187.5 | 4.5 | % | $ | 58.4 | 1.4 | % | ||||||||||||||
| Gross margin |
28.4 | % | 28.6 | % | 28.3 | % | (20 | ) | basis points | 30 | basis points | |||||||||||||||||
| Operating income |
$ | 317.9 | $ | 254.0 | $ | 252.0 | $ | 63.9 | 25.2 | % | $ | 2.0 | 0.8 | % | ||||||||||||||
| Net income |
152.6 | 14.1 | 3.8 | 138.5 | * | * | 10.3 | * | * | |||||||||||||||||||
| Adjusted EBITDA* |
449.4 | 418.5 | 401.5 | 30.9 | 7.4 | % | 17.0 | 4.2 | % | |||||||||||||||||||
| Adjusted EBITDA margin* |
10.3 | % | 10.0 | % | 9.7 | % | 30 | basis points | 30 | basis points | ||||||||||||||||||
| Adjusted Net Income* |
$ | 158.3 | $ | 123.2 | $ | 101.6 | $ | 35.1 | 28.5 | % | $ | 21.6 | 21.3 | % | ||||||||||||||
| Adjusted EPS* |
1.20 | 0.94 | 0.77 | 0.26 | 27.7 | % | 0.17 | 22.1 | % | |||||||||||||||||||
| * | Denotes non-GAAP financial measurements. See “—Key Indicators of Performance and Financial Condition” above for more information, including where to find reconciliations to the most directly comparable GAAP-based financial measurements. |
| ** | Not meaningful. |
Comparison of Three Months Ended March 31, 2015 and 2014
The following summarizes our first quarter 2015 results of operations as compared to prior period:
| • | Continued strengthening of the U.S. dollar negatively impacted our results. Excluding the effects of currency and recent acquisitions, our comparable net sales, comparable operating income and comparable Adjusted EBITDA each increased. |
| • | Growth in our comparable net sales was driven by improved performance in the Americas, which continues to benefit from ongoing strength in Biopharma and education. We also believe that the management changes, investments in infrastructure and a shift to a more customer-focused strategy that we put in place are continuing to drive positive results. EMEA-APAC also had comparable net sales growth, but that growth was tempered by the timing of Easter and elevated levels of back-ordered products. Absent these factors, we believe our EMEA-APAC segment would have experienced stronger growth. |
| • | Comparable operating income and comparable Adjusted EBITDA increased but were impacted by lower gross margin. Changes to our supply agreements with Merck KGaA in April 2014 negatively impacted our year-over-year gross margin and Adjusted EBITDA margin comparisons. Beginning in April 2015, we are operating under the same supply agreements with Merck KGaA as in the prior period. |
| • | Adjusted Net Income improved compared to the prior year, and we delivered double digit Adjusted EPS growth, each reflecting interest savings from our higher equity capitalization post-IPO. We expect |
56
Table of Contents
| additional improvements to our interest expense as we continue to refinance our debt. In March 2015, we took advantage of a favorable interest rate environment in Europe to issue the Euro Notes, and in May 2015, we refinanced our A/R Facility to extend its maturity and to secure a more favorable rate of interest. Should interest rates remain at or near current levels, we anticipate refinancing and extending other portions of our outstanding debt. |
| • | Net income benefited from the remeasurement of euro-denominated debt associated with our Senior Credit Facility, which decreased significantly with the recent strengthening of the U.S. dollar. |
Net Sales
The following table presents net sales and net sales changes by reportable segment (dollars in millions):
| Three Months Ended March 31, |
Components of Reported Change | |||||||||||||||||||||||||||||||
| Reported Change | Comparable Operations | |||||||||||||||||||||||||||||||
| 2015 | 2014 | Amount | % | Currency | Acquisitions | Amount | % | |||||||||||||||||||||||||
| Americas |
$ | 605.3 | $ | 568.4 | $ | 36.9 | 6.5 | % | $ | (7.6 | ) | $ | 15.6 | $ | 28.9 | 5.1 | % | |||||||||||||||
| EMEA-APAC |
424.3 | 488.2 | (63.9 | ) | (13.1 | )% | (80.1 | ) | 6.7 | 9.5 | 1.9 | % | ||||||||||||||||||||
|
|
|
|
|
|
|
|
|
|
|
|
|
|||||||||||||||||||||
| Total |
$ | 1,029.6 | $ | 1,056.6 | $ | (27.0 | ) | (2.6 | )% | $ | (87.7 | ) | $ | 22.3 | $ | 38.4 | 3.6 | % | ||||||||||||||
|
|
|
|
|
|
|
|
|
|
|
|
|
|||||||||||||||||||||
Net sales from comparable operations for the three months ended March 31, 2015 increased $38.4 million or 3.6% compared to the prior period. Growth in our comparable net sales was driven by improved performance in the Americas, which continues to benefit from ongoing strength in Biopharma and education. Comparable net sales in EMEA-APAC also grew, but that growth was tempered by the timing of Easter and elevated levels of back-ordered products.
Net sales from comparable operations in our Americas segment for the three months ended March 31, 2015 increased $28.9 million or 5.1% compared to the prior period. Net sales to Biopharma and industrial customers as a group increased by mid to high single-digit rates, while net sales to educational and governmental customers increased by low to mid single-digit rates. Net sales of consumables and durable products and equipment both increased by mid single-digit rates. Net sales of branded products increased by mid to high single-digit rates, while net sales of private label products and services increased by mid single-digit rates.
Net sales from comparable operations in our EMEA-APAC segment for the three months ended March 31, 2015 increased $9.5 million or 1.9% compared to the prior period. Net sales to Biopharma and industrial customers as a group increased by low to mid single-digit rates, while net sales to educational and governmental customers were essentially flat. Net sales of consumables and durable products and equipment both increased by low single-digit rates. Net sales of branded products increased by low single-digit rates, while net sales of private label products and services increased by mid single-digit rates.
Gross Profit
The following table presents gross profit, gross profit changes and gross profit as a percentage of net sales (dollars in millions):
| Three Months Ended March 31, |
Components of Reported Change | |||||||||||||||||||||||||||||||
| Reported Change | Comparable Operations | |||||||||||||||||||||||||||||||
| 2015 | 2014 | Amount | % | Currency | Acquisitions | Amount | % | |||||||||||||||||||||||||
| Gross profit |
$ | 291.2 | $ | 312.6 | $ | (21.4 | ) | (6.8 | )% | $ | (27.6 | ) | $ | 8.4 | $ | (2.2 | ) | (0.7 | )% | |||||||||||||
| Gross margin |
28.3 | % | 29.6 | % | (130 | ) | basis points | (130 | ) | basis points | ||||||||||||||||||||||
57
Table of Contents
Gross profit from comparable operations for the three months ended March 31, 2015 decreased $2.2 million or 0.7% compared to the prior period. The decrease in gross profit was caused by a decline in gross margin, which was partially offset by our comparable net sales growth.
Gross margin from comparable operations for the three months ended March 31, 2015 decreased 130 basis points compared to the prior period. Changes to our agreements with Merck KGaA in April 2014 reduced our gross margin compared to the prior period. To a lesser extent, gross margin was also impacted by unfavorable product sales mix and cross-currency purchases.
SG&A Expenses
The following table presents SG&A expenses, changes in SG&A expenses and SG&A expenses as a percentage of net sales (dollars in millions):
| Three Months Ended March 31, |
Components of Reported Change | |||||||||||||||||||||||||||||||
| Reported Change | Comparable Operations | |||||||||||||||||||||||||||||||
| 2015 | 2014 | Amount | % | Currency | Acquisitions | Amount | % | |||||||||||||||||||||||||
| SG&A expenses |
$ | 217.4 | $ | 235.6 | $ | (18.2 | ) | (7.7 | )% | $ | (20.3 | ) | $ | 6.1 | $ | (4.0 | ) | (1.7 | )% | |||||||||||||
| SG&A expenses as a percentage of net sales |
21.1 | % | 22.3 | % | (120 | ) | basis points | (110 | ) | basis points | ||||||||||||||||||||||
SG&A expenses from comparable operations for the three months ended March 31, 2015 decreased $4.0 million or 1.7% compared to the prior period. The decrease was driven by lower personnel costs in the 2015 period, partially offset by $1.4 million of legacy facility exit charges in the 2015 period, a $0.9 million increase in share-based compensation expense and the transactional impact of cross-currency purchases due to the strengthening of the U.S. dollar.
Operating Income
The following table presents operating income and operating income changes by reportable segment (dollars in millions):
| Three Months Ended March 31, |
Components of Reported Change | |||||||||||||||||||||||||||||||
| Reported Change | Comparable Operations | |||||||||||||||||||||||||||||||
| 2015 | 2014 | Amount | % | Currency | Acquisitions | Amount | % | |||||||||||||||||||||||||
| Americas |
$ | 35.7 | $ | 29.6 | $ | 6.1 | 20.6 | % | $ | — | $ | 2.0 | $ | 4.1 | 13.9 | % | ||||||||||||||||
| EMEA-APAC |
38.1 | 47.4 | (9.3 | ) | (19.6 | )% | (7.3 | ) | 0.3 | (2.3 | ) | (4.9 | )% | |||||||||||||||||||
|
|
|
|
|
|
|
|
|
|
|
|
|
|||||||||||||||||||||
| Total |
$ | 73.8 | $ | 77.0 | $ | (3.2 | ) | (4.2 | )% | $ | (7.3 | ) | $ | 2.3 | $ | 1.8 | 2.3 | % | ||||||||||||||
|
|
|
|
|
|
|
|
|
|
|
|
|
|||||||||||||||||||||
Operating income from comparable operations for the three months ended March 31, 2015 increased $1.8 million or 2.3% compared to the prior period. The increase resulted from improvements in comparable net sales and reduced personnel costs, partially offset by the change in our agreements with Merck KGaA.
Operating income from comparable operations in our Americas segment for the three months ended March 31, 2015 increased $4.1 million or 13.9% compared to the prior period. The increase resulted primarily from an improvement in comparable net sales and lower personnel costs.
Operating income from comparable operations in our EMEA-APAC segment for the three months ended March 31, 2015 decreased $2.3 million or 4.9% compared to the prior period. The decrease resulted primarily from the changes in our agreements with Merck KGaA, partially offset by an improvement in comparable net sales.
58
Table of Contents
Interest Expense, Net of Interest Income
Interest expense, net of interest income, for the three months ended March 31, 2015 and 2014 was $27.2 million and $45.8 million, respectively, a decrease of $18.6 million or 40.6%. Net interest expense decreased primarily as a result of the fourth quarter 2014 repayment of our Subordinated Notes using the net proceeds from our IPO.
Other Income (Expense), Net
Other income (expense), net, for the three months ended March 31, 2015 and 2014 was $70.3 million and $(3.1) million, respectively. Other income (expense), net, represents the net foreign currency remeasurement gain or loss on our foreign-denominated debt, which fluctuates with changes in currency exchange rates, particularly with respect to the euro.
Loss on Extinguishment of Debt
In connection with the repayment of a portion of our term loans in the first quarter of 2015, using a portion of the net proceeds from the issuance of Euro Notes, we recognized a loss on extinguishment of debt of $1.8 million representing the write-off of unamortized deferred financing costs.
Income Taxes
For the three months ended March 31, 2015 and 2014, we recognized income tax provisions of $43.6 million and $10.7 million, respectively. Our income tax provision for the three months ended March 31, 2015 includes a non-recurring deferred charge of $1.4 million related to an intercompany asset transfer. There have been no other significant changes to the relationship between pre-tax income and our income tax provision since the year ended December 31, 2014. For more information about the components of our income tax provisions and reconciliations of our income tax provisions to income taxes calculated at the U.S. federal statutory rate, see Note 19 to our annual consolidated financial statements incorporated by reference in this prospectus.
Adjusted EBITDA, Adjusted EBITDA Margin, Adjusted Net Income and Adjusted EPS
Adjusted EBITDA, Adjusted EBITDA margin, Adjusted Net Income and Adjusted EPS are non-GAAP financial measurements used by our investors, creditors and management to measure and evaluate our operating performance. We strongly encourage readers to review our results of operations in their entirety and not to rely solely on any one, single financial measure. See “—Key Indicators of Performance and Financial Condition.”
The following table presents these measures and changes therein (dollars in millions, except per share amounts):
| Three Months Ended March 31, |
Components of Reported Change | |||||||||||||||||||||||||||||||
| Reported Change | Comparable Operations | |||||||||||||||||||||||||||||||
| 2015 | 2014 | Amount | % | Currency | Acquisitions | Amount | % | |||||||||||||||||||||||||
| Adjusted EBITDA |
$ | 106.8 | $ | 111.7 | $ | (4.9 | ) | (4.4 | )% | $ | (9.7 | ) | $ | 3.4 | $ | 1.4 | 1.3 | % | ||||||||||||||
| Adjusted EBITDA margin |
10.4 | % | 10.6 | % | (20 | ) | basis points | (30 | ) | basis points | ||||||||||||||||||||||
| Adjusted Net Income |
$ | 43.8 | $ | 36.4 | $ | 7.4 | 20.3 | % | ||||||||||||||||||||||||
| Adjusted EPS |
0.33 | 0.28 | 0.05 | 17.9 | % | |||||||||||||||||||||||||||
Adjusted EBITDA from comparable operations for the three months ended March 31, 2015 increased $1.4 million or 1.3% compared to the prior period. The increase was primarily due to the increase in comparable operating income discussed previously. Adjusted EBITDA margin from comparable operations decreased 30 basis points, which was driven by the change in our agreements with Merck KGaA.
59
Table of Contents
Adjusted Net Income for the three months ended March 31, 2015 increased $7.4 million or 20.3% compared to the prior period. Adjusted EPS for the three months ended March 31, 2015 increased $0.05 or 17.9% compared to the prior period. These increases were primarily caused by the decrease to net interest expense previously discussed, net of income taxes.
The following table presents the reconciliations of Adjusted Net Income, Adjusted EBITDA and Adjusted EPS from net income or loss (in millions, except per share data):
| Three Months Ended March 31, |
||||||||
| 2015 | 2014 | |||||||
| Net income |
$ | 71.5 | $ | 17.4 | ||||
| Pre-tax adjustments: |
||||||||
| Amortization of acquired intangible assets |
20.8 | 25.1 | ||||||
| Net foreign currency remeasurement (gain) loss from financing activities |
(70.3 | ) | 3.0 | |||||
| Loss on extinguishment of debt |
1.8 | — | ||||||
| Legacy facility exit charges |
1.4 | — | ||||||
| Income tax provision (benefit) applicable to pre-tax adjustments |
18.6 | (9.1 | ) | |||||
|
|
|
|
|
|||||
| Adjusted Net Income |
43.8 | 36.4 | ||||||
| Interest expense, net of interest income |
27.2 | 45.8 | ||||||
| Depreciation expense |
9.7 | 9.5 | ||||||
| Share-based compensation expense |
1.1 | 0.2 | ||||||
| Income tax provision applicable to Adjusted Net Income |
25.0 | 19.8 | ||||||
|
|
|
|
|
|||||
| Adjusted EBITDA |
$ | 106.8 | $ | 111.7 | ||||
|
|
|
|
|
|||||
| Adjusted EPS |
$ | 0.33 | $ | 0.28 | ||||
|
|
|
|
|
|||||
| Weighted average shares outstanding, diluted |
131.9 | 0.1 | ||||||
| Normalization for recent share activity* |
— | 131.3 | ||||||
|
|
|
|
|
|||||
| Adjusted weighted average shares outstanding, diluted |
131.9 | 131.4 | ||||||
|
|
|
|
|
|||||
| * | This adjustment states adjusted weighted average shares outstanding, diluted, at the amounts that would have been reported under GAAP had our initial public offering and the recapitalization occurred on January 1, 2014. |
Comparison of Years Ended December 31, 2014 and 2013
The following summarizes our results of operations for the year ended December 31, 2014:
| • | We achieved record operating results during 2014, including net sales of $4.4 billion, operating income of $317.9 million, Adjusted EBITDA of $449.4 million and Adjusted Net Income of $158.3 million. |
| • | Net sales improved in 2014, reflecting a turnaround in our Americas segment and continued strong performance in our EMEA-APAC segment. Comparable net sales growth accelerated in the Americas; volume grew from recent investments in infrastructure and management and a strategic shift to a more targeted, customer-centric sales approach, and pricing was higher on our suite of products and services. Comparable net sales growth in our EMEA-APAC continued to exceed our estimates of market growth in those regions. |
| • | We were more profitable in 2014, achieving record Adjusted EBITDA margin of 10.3%. Excluding restructuring charges, we improved comparable SG&A expenses as a percentage of net sales, reflecting cost reductions in 2014 from a restructuring program, partially offset by the changes to our agreements with Merck KGaA in Europe, which negatively impacted our margins. |
60
Table of Contents
| • | Net income, Adjusted Net Income and Adjusted EPS benefited from reductions in our interest expense following the redemption of our Subordinated Notes and amendments to our credit facilities. During 2014, interest on the Subordinated Notes was $47.2 million, the absence of which will favorably impact our 2015 results. |
| • | Business acquisitions continued to improve our operating results. |
| • | Generally, changes in foreign currency exchange rates slightly lowered our operating results in 2014. Recently, spot rates for many foreign currencies, particularly the euro, have weakened considerably compared to the U.S. dollar. This will reduce our reported results in 2015 unless these currencies strengthen against the U.S. dollar later in the year. |
| • | Net income continued to experience significant changes due to the remeasurement of euro-denominated debt on our U.S. dollar-denominated balance sheet, which was significant and varied from year to year. Although we redeemed a significant portion of our euro-denominated debt, we expect continued volatility in future periods. We lowered interest expense in 2014 as discussed above, but we also incurred losses on the extinguishment of debt, which varied from year to year. |
Net Sales
The following table presents net sales and net sales changes by reportable segment (dollars in millions):
| Components of Reported Change | ||||||||||||||||||||||||||||||||
| Year Ended December 31, | Reported Change | Comparable Operations | ||||||||||||||||||||||||||||||
| 2014 | 2013 | Amount | % | Currency | Acquisitions | Amount | % | |||||||||||||||||||||||||
| Americas |
$ | 2,430.1 | $ | 2,352.7 | $ | 77.4 | 3.3 | % | $ | (18.7 | ) | $ | 47.0 | $ | 49.1 | 2.1 | % | |||||||||||||||
| EMEA-APAC |
1,945.2 | 1,835.1 | 110.1 | 6.0 | % | 0.1 | 27.5 | 82.5 | 4.5 | % | ||||||||||||||||||||||
|
|
|
|
|
|
|
|
|
|
|
|
|
|||||||||||||||||||||
| Total |
$ | 4,375.3 | $ | 4,187.8 | $ | 187.5 | 4.5 | % | $ | (18.6 | ) | $ | 74.5 | $ | 131.6 | 3.1 | % | |||||||||||||||
|
|
|
|
|
|
|
|
|
|
|
|
|
|||||||||||||||||||||
Net sales from comparable operations for the year ended December 31, 2014 increased $131.6 million or 3.1% compared to the prior year. The increase was primarily attributable to higher sales volume and pricing.
Net sales from comparable operations in our Americas segment for the year ended December 31, 2014 increased $49.1 million or 2.1% compared to the prior year. Volume increased as a result of recent initiatives that were put in place to improve Americas segment performance. These initiatives include investments in infrastructure and management and a strategic shift to a more targeted, customer-centric sales approach. Pricing also improved the year-over-year result. Comparable net sales declined on a year over year basis in the first quarter of fiscal 2014, were slightly positive in the second quarter and accelerated to our strongest growth in the fourth quarter of 2014. Net sales to Biopharma and industrial customers as a group increased by low to mid single-digit rates compared to prior year, with the fourth quarter showing mid to high single-digit growth. Net sales to educational and governmental customers decreased by low to mid single-digit rates compared to prior year but improved during the year, with the fourth quarter showing low to mid single-digit growth. Net sales of consumables increased by low to mid single-digit rates, while net sales of durable goods and equipment were flat.
Net sales from comparable operations in our EMEA-APAC segment for the year ended December 31, 2014 increased $82.5 million or 4.5% compared to the prior year. The increase in net sales was driven by consistently higher sales volume throughout the year, which exceeded our estimates of 2% to 2.5% market growth in those regions. Net sales improved across all primary product groups and customer segments by mid to high single-digit rates. Net sales were particularly strong for private label consumables and durable goods and equipment, which grew by low double-digit rates, and private label chemicals, which grew by high single-digit rates.
61
Table of Contents
Gross Profit
The following table presents gross profit, gross margin and changes therein (dollars in millions):
| Components of Reported Change | ||||||||||||||||||||||||||||||||
| Year Ended December 31, | Reported Change | Comparable Operations | ||||||||||||||||||||||||||||||
| 2014 | 2013 | Amount | % | Currency | Acquisitions | Amount | % | |||||||||||||||||||||||||
| Gross profit |
$ | 1,243.4 | $ | 1,196.3 | $ | 47.1 | 3.9 | % | $ | (4.5 | ) | $ | 25.7 | $ | 25.9 | 2.2 | % | |||||||||||||||
| Gross margin |
28.4 | % | 28.6 | % | (20 | ) | basis points | |||||||||||||||||||||||||
Gross profit from comparable operations for the year ended December 31, 2014 increased $25.9 million or 2.2% compared to the prior year. The increase was caused by comparable net sales growth, partially offset by lower gross margin.
Gross margin for the year ended December 31, 2014 decreased 20 basis points to 28.4% compared to the prior year. Changes to our agreements with Merck KGaA negatively impacted our gross margins, particularly in the EMEA-APAC segment, as discussed previously in “—Trends and Key Factors Affecting our Performance and Financial Condition.” We expect that the year-over-year impact of these changes will substantially cease beginning in the second quarter of 2015. These changes were substantially offset by higher pricing and, to a lesser extent, a more favorable product and customer sales mix in the Americas.
SG&A Expenses
The following table presents SG&A expenses, SG&A expenses as a percentage of net sales and changes therein (dollars in millions):
| Components of Reported Change | ||||||||||||||||||||||||||||||||
| Year Ended December 31, | Reported Change | Comparable Operations | ||||||||||||||||||||||||||||||
| 2014 | 2013 | Amount | % | Currency | Acquisitions | Amount | % | |||||||||||||||||||||||||
| SG&A expenses |
$ | 925.5 | $ | 942.3 | $ | (16.8 | ) | (1.8 | )% | $ | (5.8 | ) | $ | 19.8 | $ | (30.8 | ) | (3.3 | )% | |||||||||||||
| SG&A expenses as a percentage of net sales |
21.2 | % | 22.5 | % | (130 | ) | basis points | |||||||||||||||||||||||||
SG&A expenses from comparable operations for the year ended December 31, 2014 decreased $30.8 million or 3.3% compared to the prior year. During 2013, we incurred $31.7 million of charges related to our global restructuring program and $2.2 million of charges related to executive departures that were not present in 2014. Absent these items, SG&A expenses from comparable operations were flat, but decreased as a percentage of net sales. Increased employee compensation provisions in 2014, including the expense related to new stock option awards, were substantially offset by lower overall personnel costs in 2014, including savings from our 2013 global restructuring program. We also recognized a gain on the partial settlement of our U.S. Retirement Plan obligations, and we terminated the management services agreement with our Sponsors in the fourth quarter of 2014. For more information about our restructuring programs, our stock options, the partial settlement of our U.S. Retirement Plan and the termination of the management services agreement, see Notes 15, 14, 16 and 21, respectively, to our annual consolidated financial statements incorporated by reference in this prospectus.
62
Table of Contents
Operating Income
The following table presents operating income and operating income changes by reportable segment (dollars in millions):
| Components of Reported Change | ||||||||||||||||||||||||||||||||
| Year Ended December 31, | Reported Change | Comparable Operations | ||||||||||||||||||||||||||||||
| 2014 | 2013 | Amount | % | Currency | Acquisitions | Amount | % | |||||||||||||||||||||||||
| Americas |
$ | 141.0 | $ | 115.8 | $ | 25.2 | 21.8 | % | $ | 1.1 | $ | 3.4 | $ | 20.7 | 17.9 | % | ||||||||||||||||
| EMEA-APAC |
176.9 | 138.2 | 38.7 | 28.0 | % | 0.2 | 2.5 | 36.0 | 26.0 | % | ||||||||||||||||||||||
|
|
|
|
|
|
|
|
|
|
|
|
|
|||||||||||||||||||||
| Total |
$ | 317.9 | $ | 254.0 | $ | 63.9 | 25.2 | % | $ | 1.3 | $ | 5.9 | $ | 56.7 | 22.3 | % | ||||||||||||||||
|
|
|
|
|
|
|
|
|
|
|
|
|
|||||||||||||||||||||
Operating income from comparable operations for the year ended December 31, 2014 increased $56.7 million or 22.3% compared to the prior year. Absent the 2013 charges for restructuring and executive departures discussed previously, operating income from comparable operations increased primarily due to comparable improvements in gross profit.
Operating income from comparable operations in our Americas segment for the year ended December 31, 2014 increased $20.7 million or 17.9% compared to the prior year. During 2013, we recognized $7.6 million of restructuring charges and $2.2 million of charges related to executive departures that were not present in 2014. The remaining increase in comparable operating income was caused by higher net sales volume and pricing and the changes in SG&A expenses described previously.
Operating income from comparable operations in our EMEA-APAC segment for the year ended December 31, 2014 increased $36.0 million or 26.0% compared to the prior year. During 2013, we recognized $24.1 million of restructuring charges that were not present in 2014. The remaining increase in operating income was primarily due to higher net sales volume and lower overall personnel costs resulting from our 2013 global restructuring program, partially offset by increased employee compensation provisions, including the expense related to new stock option awards.
Interest Expense, Net of Interest Income
Interest expense, net of interest income, for the years ended December 31, 2014 and 2013 was $166.3 million and $190.7 million, respectively, a decrease of $24.4 million or 12.8%. Net interest expense decreased as a result of lower rates of interest on our term loans, which we refinanced in January 2014, the redemption of our Subordinated Notes in the fourth quarter of 2014 using the net proceeds from the IPO and the Additional Sale and lower average borrowings under our multi-currency revolving loan facility.
During 2014, interest on the Subordinated Notes was $47.2 million, the absence of which will favorably impact interest expense in 2015.
Other Income (Expense), Net
Other income (expense), net, for the years ended December 31, 2014 and 2013 was $90.9 million and $(38.8) million, respectively. Other income (expense), net, represents the net foreign currency remeasurement gain or loss on our foreign-denominated debt, which fluctuates with changes in currency exchange rates, particularly with respect to the euro.
Loss on Extinguishment of Debt
We recognized a loss on extinguishment of debt of $5.1 million for the year ended December 31, 2014, representing the write-off of unamortized deferred financing costs following the redemption of our Subordinated Notes in the fourth quarter of 2014. We recognized a loss on extinguishment of debt of $2.0 million for the year ended December 31, 2013, representing the write-off of unamortized deferred financing costs following an amendment of our Senior Credit Facility on January 31, 2013.
63
Table of Contents
Income Taxes
We recognized income tax provisions of $84.8 million and $8.4 million for the years ended December 31, 2014 and 2013, respectively. For more information about the components of our income tax provisions, and a reconciliation of our income tax provisions to income taxes calculated at the U.S. federal statutory rate, see Note 19 to our annual consolidated financial statements incorporated by reference in this prospectus.
Adjusted EBITDA, Adjusted EBITDA Margin, Adjusted Net Income and Adjusted EPS
Adjusted EBITDA, Adjusted EBITDA margin, Adjusted Net Income and Adjusted EPS are non-GAAP financial measurements used by our investors, creditors and management to measure and evaluate our operating performance. We strongly encourage readers to review our results of operations in their entirety and not to rely solely on any one, single financial measure. See “—Key Indicators of Performance and Financial Condition.”
The following table presents these measures and changes therein (dollars in millions, except per share amounts):
| Components of Reported Change | ||||||||||||||||||||||||||||||||
| Year Ended December 31, | Reported Change | Comparable Operations | ||||||||||||||||||||||||||||||
| 2014 | 2013 | Amount | % | Currency | Acquisitions | Amount | % | |||||||||||||||||||||||||
| Adjusted EBITDA |
$ | 449.4 | $ | 418.5 | $ | 30.9 | 7.4 | % | $ | (1.3 | ) | $ | 8.3 | $ | 23.9 | 5.7 | % | |||||||||||||||
| Adjusted EBITDA margin |
10.3 | % | 10.0 | % | 30 | basis points | ||||||||||||||||||||||||||
| Adjusted Net Income |
$ | 158.3 | $ | 123.2 | $ | 35.1 | 28.5 | % | ||||||||||||||||||||||||
| Adjusted EPS |
1.20 | 0.94 | 0.26 | 27.7 | % | |||||||||||||||||||||||||||
Adjusted EBITDA from comparable operations for the year ended December 31, 2014 increased $23.9 million or 5.7% compared to the prior year. The increase was caused by the comparable improvement in operating income of $56.7 million discussed previously, reduced by $32.5 million for restructuring charges that were present in 2013 and absent in 2014, as such charges are excluded from Adjusted EBITDA.
Adjusted EBITDA margin increased 30 basis points to 10.3% due to lower SG&A expenses as a percentage of net sales, primarily the result of cost savings in 2014 stemming from the 2013 restructuring program. This improvement was partially offset by the changes to our agreements with Merck KGaA in Europe, which negatively impacted our margins.
Adjusted Net Income for the year ended December 31, 2014 increased $35.1 million or 28.5% compared to the prior year. The increase was caused by the same factors that caused our Adjusted EBITDA to increase and also includes the $24.4 million decrease in net interest expense previously discussed, both net of income taxes.
Adjusted EPS for the year ended December 31, 2014 increased $0.26 or 27.7% as a result of the increase to Adjusted Net Income.
64
Table of Contents
The following table presents the reconciliations of Adjusted Net Income, Adjusted EBITDA and Adjusted EPS from net income or loss (in millions, except per share amounts):
| Year Ended December 31, | ||||||||
| 2014 | 2013 | |||||||
| Net income |
$ | 152.6 | $ | 14.1 | ||||
| Pre-tax adjustments: |
||||||||
| Amortization of acquired intangible assets |
88.9 | 91.7 | ||||||
| Net foreign currency remeasurement (gain) loss from financing activities |
(90.9 | ) | 38.0 | |||||
| Charges for restructuring and other cost reduction initiatives |
— | 32.5 | ||||||
| Impairment charges |
11.3 | — | ||||||
| Gain on disposition of business |
(11.1 | ) | — | |||||
| Loss on extinguishment of debt |
5.1 | 2.0 | ||||||
| Charges associated with executive departures |
— | 2.2 | ||||||
| Income tax provision (benefit) applicable to pre-tax adjustments |
2.4 | (57.3 | ) | |||||
|
|
|
|
|
|||||
| Adjusted Net Income |
158.3 | 123.2 | ||||||
| Interest expense, net of interest income |
166.3 | 190.7 | ||||||
| Depreciation expense |
40.4 | 38.3 | ||||||
| Share-based compensation expense |
2.0 | 0.6 | ||||||
| Income tax provision applicable to Adjusted Net Income |
82.4 | 65.7 | ||||||
|
|
|
|
|
|||||
| Adjusted EBITDA |
$ | 449.4 | $ | 418.5 | ||||
|
|
|
|
|
|||||
| Adjusted EPS |
$ | 1.20 | $ | 0.94 | ||||
|
|
|
|
|
|||||
| Weighted average shares outstanding, diluted |
49.5 | 0.1 | ||||||
| Normalization for recent share activity* |
82.0 | 131.3 | ||||||
|
|
|
|
|
|||||
| Adjusted weighted average shares outstanding, diluted |
131.5 | 131.4 | ||||||
|
|
|
|
|
|||||
| * | This adjustment states adjusted weighted average shares outstanding, diluted, at the amounts that would have been reported under GAAP had our initial public offering and the recapitalization occurred on January 1, 2013. |
Comparison of Years Ended December 31, 2013 and 2012
Net Sales
The following table presents net sales and net sales changes by reportable segment (dollars in millions):
| Components of Reported Change | ||||||||||||||||||||||||||||||||
| Year Ended December 31, | Reported Change | Comparable Operations | ||||||||||||||||||||||||||||||
| 2013 | 2012 | Amount | % | Currency | Acquisitions | Amount | % | |||||||||||||||||||||||||
| Americas |
$ | 2,352.7 | $ | 2,400.9 | $ | (48.2 | ) | (2.0 | )% | $ | (6.8 | ) | $ | 27.4 | $ | (68.8 | ) | (2.9 | )% | |||||||||||||
| EMEA-APAC |
1,835.1 | 1,728.5 | 106.6 | 6.2 | % | 40.0 | 61.0 | 5.6 | 0.3 | % | ||||||||||||||||||||||
|
|
|
|
|
|
|
|
|
|
|
|
|
|||||||||||||||||||||
| Total |
$ | 4,187.8 | $ | 4,129.4 | $ | 58.4 | 1.4 | % | $ | 33.2 | $ | 88.4 | $ | (63.2 | ) | (1.5 | )% | |||||||||||||||
|
|
|
|
|
|
|
|
|
|
|
|
|
|||||||||||||||||||||
Net sales from comparable operations for the year ended December 31, 2013 decreased $63.2 million or 1.5% compared to the prior year. The decrease was primarily due to a reduction in sales volume in our Americas segment.
65
Table of Contents
Net sales from comparable operations in our Americas segment for the year ended December 31, 2013 decreased $68.8 million or 2.9% compared to the prior year. Net sales of durable goods and equipment increased slightly, while net sales of consumable products decreased by low single-digit rates. Net sales across all primary customer channels were flat or decreased by low single-digit rates.
Net sales from comparable operations in our EMEA-APAC segment for the year ended December 31, 2013 increased $5.6 million or 0.3% compared to the prior year. Net sales of consumable products increased by low single-digit rates, while net sales of durable goods and equipment decreased by low single-digit rates. Net sales to Biopharma, industrial and other customers increased by low single-digit rates. Net sales to education customers and governmental entities were generally flat.
Gross Profit
The following table presents gross profit, gross margin and changes therein (dollars in millions):
| Components of Reported Change | ||||||||||||||||||||||||||||||||
| Year Ended December 31, | Reported Change | Comparable Operations | ||||||||||||||||||||||||||||||
| 2013 | 2012 | Amount | % | Currency | Acquisitions | Amount | % | |||||||||||||||||||||||||
| Gross profit |
$ | 1,196.3 | $ | 1,167.4 | $ | 28.9 | 2.5 | % | $ | 11.5 | $ | 28.0 | $ | (10.6 | ) | (0.9 | )% | |||||||||||||||
| Gross margin |
28.6 | % | 28.3 | % | 30 | basis points | ||||||||||||||||||||||||||
Gross profit from comparable operations for the year ended December 31, 2013 decreased $10.6 million or 0.9% compared to the prior year. The impact of lower sales volumes in the Americas was partially offset by a favorable sales mix and higher sales volume in EMEA-APAC.
Gross margin for the year ended December 31, 2013 was 28.6%, a 30 basis point increase compared to the prior year. Gross margin performance in 2013 was positively influenced by a more favorable product and customer sales mix in our EMEA-APAC segment, partially offset by an unfavorable product sales mix in our Americas segment and, more globally, an increasingly competitive pricing environment. In 2012, our consolidated gross margin was negatively impacted by unfavorable product costs associated with lower rebates earned from suppliers as compared to 2013.
SG&A Expenses
The following table presents SG&A expenses, SG&A expenses as a percentage of net sales and changes therein (dollars in millions):
| Components of Reported Change | ||||||||||||||||||||||||||||||||
| Year Ended December 31, | Reported Change | Comparable Operations | ||||||||||||||||||||||||||||||
| 2013 | 2012 | Amount | % | Currency | Acquisitions | Amount | % | |||||||||||||||||||||||||
| SG&A expenses |
$ | 942.3 | $ | 915.4 | $ | 26.9 | 2.9 | % | $ | 9.2 | $ | 23.5 | $ | (5.8 | ) | (0.6 | )% | |||||||||||||||
| SG&A expenses as a percentage of net sales |
22.5 | % | 22.2 | % | 30 | basis points | ||||||||||||||||||||||||||
SG&A expenses from comparable operations for the year ended December 31, 2013 decreased $5.8 million or 0.6% compared to the prior year. The decrease was primarily attributable to lower overall personnel costs and a decrease of $4.0 million in severance charges associated with executive departures, partially offset by increases of $14.8 million in restructuring charges and $6.6 million related to our performance-based cash incentive compensation program.
66
Table of Contents
SG&A expenses for 2013 included $31.7 million for charges associated with our 2013 global restructuring program, of which $7.6 million was for Americas and $24.1 million was for EMEA-APAC (including $3.2 million in non-cash charges recognized in our Asia-Pacific operations). SG&A expenses for 2012 included $16.9 million for charges associated with implementing cost reduction initiatives, of which $5.4 million was for Americas (including $4.0 million related to lease and pension costs associated with the closure of a regional distribution center in Brisbane, California) and $11.5 million was for EMEA-APAC (primarily severance and personnel costs).
Operating Income
The following table presents operating income and operating income changes by reportable segment (dollars in millions):
| Components of Reported Change | ||||||||||||||||||||||||||||||||
| Year Ended December 31, | Reported Change | Comparable Operations | ||||||||||||||||||||||||||||||
| 2013 | 2012 | Amount | % | Currency | Acquisitions | Amount | % | |||||||||||||||||||||||||
| Americas |
$ | 115.8 | $ | 123.2 | $ | (7.4 | ) | (6.0 | )% | $ | 0.2 | $ | — | $ | (7.6 | ) | (6.2 | )% | ||||||||||||||
| EMEA-APAC |
138.2 | 128.8 | 9.4 | 7.3 | % | 2.1 | 4.5 | 2.8 | 2.2 | % | ||||||||||||||||||||||
|
|
|
|
|
|
|
|
|
|
|
|
|
|||||||||||||||||||||
| Total |
$ | 254.0 | $ | 252.0 | $ | 2.0 | 0.8 | % | $ | 2.3 | $ | 4.5 | $ | (4.8 | ) | (1.9 | )% | |||||||||||||||
|
|
|
|
|
|
|
|
|
|
|
|
|
|||||||||||||||||||||
Operating income from comparable operations for the year ended December 31, 2013 decreased $4.8 million or 1.9% compared to the prior year. The decrease was due to lower comparable gross profit of $10.6 million, partially offset by a decrease in comparable SG&A expense of $5.8 million.
Operating income from comparable operations in the Americas segment for the year ended December 31, 2013 decreased $7.6 million or 6.2% compared to the prior year. The decrease was due to a decrease in gross profit, primarily attributable to lower sales volume, partially offset by a decrease in SG&A expenses, largely attributable to the implementation of cost reduction initiatives.
Operating income from comparable operations in our EMEA-APAC segment for the year ended December 31, 2013 increased $2.8 million or 2.2% compared to the prior period. The increase was due to an increase in gross profit, attributable to higher sales volume and a favorable sales mix, partially offset by an increase in SG&A expenses, largely attributable to increased charges for restructuring and incentive compensation.
Interest Expense, Net of Interest Income
Interest expense, net of interest income, for the years ended December 31, 2013 and 2012 was $190.7 million and $199.5 million, respectively, a decrease of $8.8 million or 4.4%. The decrease was primarily attributable to the maturity of our interest rate swap arrangements in 2012, a reduction in amortization of deferred debt issuance costs and net savings associated with the recent refinancings of our Senior Credit Facility and our 2017 Senior Notes, partially offset by increased interest associated with higher average aggregate borrowings under our A/R Facility and our multi-currency revolving loan facility in 2013.
Other Income (Expense), Net
Other income (expense), net, for the years ended December 31, 2013 and 2012 was $(38.8) million and $(15.1) million, respectively, and consisted primarily of the net foreign currency remeasurement gain or loss on our foreign-denominated debt, which fluctuates with changes in currency exchange rates, particularly with respect to the euro. Other income (expense), net for the year ended December 31, 2012 also includes $0.7 million of third-party fees and fees paid to lenders associated with an amendment to our Senior Credit Facility.
67
Table of Contents
Loss on Extinguishment of Debt
We recognized a loss on extinguishment of debt of $2.0 million for the year ended December 31, 2013, representing the write-off of unamortized deferred financing costs following an amendment of our Senior Credit Facility on January 31, 2013. In connection with the issuance of the 2017 Senior Notes in 2012 to refinance our previously issued senior notes, we recognized a loss on extinguishment of debt of $25.5 million. The loss included $18.7 million in tender and redemption premiums paid, $6.6 million for the write-off of unamortized deferred financing costs and $0.2 million of third-party fees and fees paid to lenders.
Income Taxes
We recognized income tax provisions of $8.4 million and $8.1 million for the years ended December 31, 2013 and 2012, respectively. For more information about the components of our income tax provisions, and a reconciliation of our income tax provisions to income taxes calculated at the U.S. federal statutory rate, see Note 19 to our annual consolidated financial statements incorporated by reference in this prospectus.
Adjusted EBITDA, Adjusted EBITDA Margin, Adjusted Net Income and Adjusted EPS
Adjusted EBITDA, Adjusted EBITDA margin, Adjusted Net Income and Adjusted EPS are non-GAAP financial measurements used by our investors, creditors and management to measure and evaluate our operating performance. We strongly encourage readers to review our results of operations in their entirety and not to rely solely on any one, single financial measure. See “—Key Indicators of Performance and Financial Condition.”
The following table presents these measures and changes therein (dollars in millions, except per share amounts):
| Components of Reported Change | ||||||||||||||||||||||||||||||||
| Year Ended December 31, | Reported Change | Comparable Operations | ||||||||||||||||||||||||||||||
| 2013 | 2012 | Amount | % | Currency | Acquisitions | Amount | % | |||||||||||||||||||||||||
| Adjusted EBITDA |
$ | 418.5 | $ | 401.5 | $ | 17.0 | 4.2 | % | $ | 3.3 | $ | 7.2 | $ | 6.5 | 1.6 | % | ||||||||||||||||
| Adjusted EBITDA margin |
10.0 | % | 9.7 | % | 30 | basis points | ||||||||||||||||||||||||||
| Adjusted Net Income |
$ | 123.2 | $ | 101.6 | $ | 21.6 | 21.3 | % | ||||||||||||||||||||||||
| Adjusted EPS |
0.94 | 0.77 | 0.17 | 22.1 | % | |||||||||||||||||||||||||||
Adjusted EBITDA from comparable operations for the year ended December 31, 2013 increased $6.5 million or 1.6% compared to the prior year. Adjusted EBITDA margin increased 30 basis points. The increase was primarily due to reductions in SG&A expenses when excluding the impact of charges for restructuring and other cost reduction initiatives, executive departures and certain others items which are excluded from the calculation of Adjusted EBITDA.
Adjusted Net Income for the year ended December 31, 2013 increased $21.6 million or 21.3% compared to the prior period. The increase in Adjusted Net Income was primarily due to the increase in Adjusted EBITDA and the $8.8 million reduction in net interest expense discussed previously, both net of income taxes.
Adjusted EPS for the year ended December 31, 2013 increased $0.17 or 22.1% as a result of the increase to Adjusted Net Income discussed previously.
68
Table of Contents
The following table presents the reconciliations of Adjusted Net Income, Adjusted EBITDA and Adjusted EPS from net income or loss (in millions, except per share amounts):
| Year Ended December 31, | ||||||||
| 2013 | 2012 | |||||||
| Net income |
$ | 14.1 | $ | 3.8 | ||||
| Pre-tax adjustments: |
||||||||
| Amortization of acquired intangible assets |
91.7 | 89.9 | ||||||
| Net foreign currency remeasurement loss from financing activities |
38.0 | 16.0 | ||||||
| Charges for restructuring and other cost reduction initiatives |
32.5 | 16.9 | ||||||
| Loss on extinguishment of debt |
2.0 | 25.5 | ||||||
| Charges associated with executive departures |
2.2 | 6.2 | ||||||
| Other |
— | (1.3 | ) | |||||
| Income tax benefit applicable to pre-tax adjustments |
(57.3 | ) | (55.4 | ) | ||||
|
|
|
|
|
|||||
| Adjusted Net Income |
123.2 | 101.6 | ||||||
| Interest expense, net of interest income |
190.7 | 199.5 | ||||||
| Depreciation expense |
38.3 | 36.0 | ||||||
| Share-based compensation expense |
0.6 | 0.9 | ||||||
| Income tax provision applicable to Adjusted Net Income |
65.7 | 63.5 | ||||||
|
|
|
|
|
|||||
| Adjusted EBITDA |
$ | 418.5 | $ | 401.5 | ||||
|
|
|
|
|
|||||
| Adjusted EPS |
$ | 0.94 | $ | 0.77 | ||||
|
|
|
|
|
|||||
| Weighted average shares outstanding, diluted |
0.1 | 0.1 | ||||||
| Normalization for recent share activity* |
131.3 | 131.3 | ||||||
|
|
|
|
|
|||||
| Adjusted weighted average shares outstanding, diluted |
131.4 | 131.4 | ||||||
|
|
|
|
|
|||||
| * | This adjustment states adjusted weighted average shares outstanding, diluted, at the amounts that would have been reported under GAAP had our initial public offering and the recapitalization occurred on January 1, 2012. |
Liquidity and Capital Resources
We fund our business primarily from operating cash flows and liquidity from cash on hand and our credit facilities. At March 31, 2015, we had $98.5 million of cash and cash equivalents on hand, and we had aggregate unused availability of $379.6 million under our credit facilities. Most of our cash on hand resides outside of the United States; we do not intend to repatriate our foreign cash and cash equivalents.
We use cash to satisfy our contractual obligations and to fund other non-contractual business needs. Our most significant contractual obligations are scheduled principal and interest payments under our debt and capital lease obligations. We also have obligations to make payments under non-cancelable operating leases, to pay VWR Holdings under the ITRA and to fund pension obligations. In addition to contractual obligations, we use cash to fund business acquisitions, purchase capital and pay taxes. Changes in working capital may be a source or a use of cash depending on our operations during the period.
In May 2015, we refinanced our A/R Facility to extend its maturity and to secure a more favorable rate of interest. Should interest rates remain at or near current levels, we anticipate refinancing and extending other portions of our outstanding debt.
69
Table of Contents
On March 25, 2015, we completed the private sale of €503.8 million of Euro Notes. We used the net proceeds from the issuance of the notes to repay outstanding borrowings under our multi-currency revolving loan facility and our A/R Facility and a portion of our U.S. dollar-denominated term loans. We also paid financing fees of $4.5 million during the three months ended March 31, 2015 and accrued an additional $1.1 million as of March 31, 2015.
We designated our euro-denominated Euro Notes as a hedge to help protect a portion of our net investment in euro-denominated foreign operations from the impact of changes in the euro to U.S. dollar exchange rate. As a result of the hedge designation, the net foreign currency remeasurement gain or loss on the Euro Notes, which otherwise would be recognized in earnings, is equally offset in other comprehensive income or loss by the net unrealized gain or loss from the translation of the hedged portion of our net investment in euro-denominated foreign operations.
As discussed previously, we completed our IPO on October 7, 2014 and the Additional Sale on November 5, 2014, receiving aggregate proceeds of $582.6 million, net of underwriting discounts. We used these proceeds to redeem all of our outstanding Subordinated Notes and to repay a portion of the borrowings under our credit facilities. We also entered into a number of other transactions that caused us or may cause us in the future to make significant cash payments. See “—Initial Public Offering” above.
Based on the terms and conditions of our debt obligations and our current operations and expectations for future growth, we believe that cash generated from operations, together with available borrowings under our credit facilities will be adequate to meet our current and expected operating, capital investment, acquisition financing and debt service obligations prior to maturity for the foreseeable future, although no assurance can be given in this regard.
Liquidity
As of March 31, 2015, we had $98.5 million of cash and cash equivalents on hand. We had aggregate unused availability of $379.6 million under our multi-currency revolving loan facility and our A/R Facility, calculated as follows:
| Multi-currency revolving loan facility |
A/R Facility | Total | ||||||||||
| Maximum potential availability |
$ | 241.3 | $ | 175.0 | $ | 416.3 | ||||||
| Borrowing base adjustment |
— | (18.4 | ) | (18.4 | ) | |||||||
| Undrawn letters of credit outstanding |
(5.0 | ) | (11.3 | ) | (16.3 | ) | ||||||
| Outstanding borrowings |
(2.0 | ) | — | (2.0 | ) | |||||||
|
|
|
|
|
|
|
|||||||
| Unused availability |
$ | 234.3 | $ | 145.3 | $ | 379.6 | ||||||
|
|
|
|
|
|
|
|||||||
Borrowings under these facilities bear interest at variable rates and are a significant source of our liquidity. The average aggregate borrowings outstanding under these facilities during the three months ended March 31, 2015 was $194.3 million. Periodically, our liquidity needs, including our funding of acquisition activities, cause the aggregate amount of outstanding borrowings under these facilities to fluctuate. Accordingly, the amount of credit available to us can increase or decrease based on changes in our operating cash flows, debt service requirements, working capital needs and acquisition and investment activities. Availability of funding under the A/R Facility also depends upon maintaining a sufficient borrowing base, which is comprised of eligible trade accounts receivable.
On April 30, 2015, we used availability under our A/R Facility to repay $125.0 million of U.S. dollar-denominated term loans.
Subject to our continued compliance with our covenants, we may request additional tranches of term loans or increases in the amount of commitments under the Senior Credit Facility. The actual extension of any such
70
Table of Contents
incremental term loans or increases in commitments would be subject to us and our lenders reaching agreement on applicable terms and conditions, which may depend on market conditions at the time of any request. We may add incremental term loan facilities and revolving loan commitments in an aggregate amount not to exceed the lesser of (i) $300.0 million or (ii) the maximum amount at such time that could be incurred without causing VWR Funding to exceed a certain leverage ratio, in each case subject to certain other restrictions.
Foreign exchange ceilings imposed by local governments, regulatory requirements applicable to certain of our subsidiaries and the sometimes lengthy approval processes which foreign governments require for international cash transfers may restrict our internal cash movements. We expect to reinvest a significant portion of our cash and earnings outside of the United States because we anticipate that a significant portion of our opportunities for future growth will be abroad. Thus, we have not provided U.S. federal income, state income or foreign withholding taxes on our non-U.S. subsidiaries’ undistributed earnings that have been indefinitely invested abroad. As of December 31, 2014, $107.8 million of our $118.0 million of cash and cash equivalents was held by our foreign subsidiaries. If these foreign cash and cash equivalents were repatriated to the United States, we may be required to pay income taxes on the amounts repatriated. We do not intend to repatriate our foreign cash and cash equivalents.
Net Debt and Net Leverage
Net Debt and Net Leverage are non-GAAP financial measurements used by our investors, creditors and management to measure and evaluate our financial condition and our continuing ability to service debt. We strongly encourage readers to review our results of operations in their entirety and not to rely solely on any one, single financial measure. See “—Key Indicators of Performance and Financial Condition.”
The following table reconciles Net Debt from total debt and capital lease obligations and presents the calculation of Net Leverage (dollars in millions):
| December 31, | March 31, | |||||||||||||||||||
| 2014 | 2013 | 2012 | 2015 | 2014 | ||||||||||||||||
| Debt and capital lease obligations |
$ | 2,111.9 | $ | 2,854.4 | $ | 3,148.6 | $ | 2,063.3 | $ | 2,860.2 | ||||||||||
| Less: |
||||||||||||||||||||
| Cash and cash equivalents |
118.0 | 135.6 | 139.8 | 98.5 | 130.2 | |||||||||||||||
| Compensating cash balance |
2.5 | 25.9 | 246.9 | 0.2 | 16.5 | |||||||||||||||
|
|
|
|
|
|
|
|
|
|
|
|||||||||||
| Net Debt |
1,991.4 | 2,692.9 | 2,761.9 | 1,964.6 | 2,713.5 | |||||||||||||||
| LTM Adjusted EBITDA |
449.4 | 418.5 | 401.5 | 444.5 | 434.0 | |||||||||||||||
| Net Leverage |
4.4x | 6.4x | 6.9x | 4.4x | 6.3x | |||||||||||||||
The decrease in Net Leverage at March 31, 2015 and December 31, 2014 compared to prior periods was primarily attributable to the redemption of the Subordinated Notes, the weakening of the euro compared to the U.S. dollar and increases to LTM Adjusted EBITDA.
71
Table of Contents
The following table presents the reconciliation of LTM Adjusted EBITDA from net income or loss (in millions):
| Twelve Months Ended March 31, |
||||||||
| 2015 | 2014 | |||||||
| Net income |
$ | 206.7 | $ | 9.4 | ||||
| Interest expense, net of interest income |
147.7 | 188.9 | ||||||
| Income tax provision |
117.7 | 4.3 | ||||||
| Depreciation and amortization |
125.2 | 132.8 | ||||||
| Share-based compensation expense |
2.9 | 0.6 | ||||||
| Net foreign currency remeasurement (gain) loss from financing activities |
(164.2 | ) | 64.7 | |||||
| Loss on extinguishment of debt |
6.9 | — | ||||||
| Charges associated with restructurings and other cost reduction initiatives |
— | 32.5 | ||||||
| Legacy facility exit charges |
1.4 | — | ||||||
| Other |
0.2 | 0.8 | ||||||
|
|
|
|
|
|||||
| LTM Adjusted EBITDA |
$ | 444.5 | $ | 434.0 | ||||
|
|
|
|
|
|||||
Reconciliations of LTM Adjusted EBITDA for the years ended December 31, 2014, 2013 and 2012 may be found in the sections entitled “—Results of Operations” under the subheadings “Adjusted EBITDA, Adjusted EBITDA Margin, Adjusted Net Income and Adjusted EPS.”
Debt and Capital Lease Obligations
Our discussion of debt and capital lease obligations supplements the disclosures provided in Note 9 to our annual consolidated financial statements incorporated by reference in this prospectus.
We carry a significant amount of the indebtedness that resulted from the 2007 merger. We had $2,063.3 million of outstanding indebtedness at March 31, 2015. The majority of our debt obligations will mature during 2016 and 2017. We intend to continue to reduce our Net Leverage in advance of these maturities as we seek to refinance or otherwise satisfy these debt obligations.
We believe that our steadily improving credit profile and stable capital markets provide an opportunity for us to refinance near-term maturities at lower credit spreads. We expect to continue to actively evaluate opportunities to extend maturities, lower interest rates and improve our borrowing terms and conditions while considering the cost to issue new securities and retire existing debt.
Our debt agreements contain a number of affirmative and negative covenants which we consider to be customary and usual. The Senior Credit Facility includes a financial maintenance covenant requiring us to maintain a Senior Secured Net Leverage Ratio (as defined in the Senior Credit Facility) of not more than 5.50:1.00. The financial maintenance covenant is only applicable if revolving loans or swing loans are outstanding or if outstanding letters of credit (other than cash collateralized letters of credit) are in excess of $20.0 million. The A/R Facility includes a consolidated interest expense test if our available liquidity is less than $115.0 million.
VWR Funding, as the borrower under the Senior Credit Facility and the issuer of the 2017 Senior Notes and Euro Notes, is currently limited under the terms of such agreements in its ability to declare any cash dividends on, or making any payment on account of, its capital stock, or making any other distribution in respect thereof (collectively, a “restricted payment”), including for the purpose of enabling us to pay dividends on our capital stock. Under the Senior Credit Facility, VWR Funding can make lifetime restricted payments to us up to (i) $25.0 million and (ii) an additional amount equal to $75.0 million plus its cumulative excess cash flow and
72
Table of Contents
any amounts it has received from sales of equity or capital contributions that are not used for other restricted payments, provided that there is no default under the Senior Credit Facility and that VWR Funding meets certain leverage ratios after giving effect to any such restricted payment. Similarly, VWR Funding can make lifetime restricted payments to us under the indenture governing the 2017 Senior Notes up to (i) $25.0 million and (ii) an additional amount equal to 50% of its consolidated net income since October 1, 2012 and any amounts it has received from sales of equity or capital contributions since the issue date of such 2017 Senior Notes that are not used for other restricted payments, provided that there is no default under the indenture and that VWR Funding meets a fixed charge coverage ratio after giving effect to any such restricted payment. VWR Funding can make lifetime restricted payments to us under the indenture governing the Euro Notes up to (i) $35.0 million and (ii) an additional amount equal to 50% of its consolidated net income since January 1, 2015, plus any amounts it has received from sales of equity or capital contributions since the issue date of such Euro Notes that are not used for other restricted payments plus $100.0 million, provided that there is no default under the indenture and that VWR Funding meets a fixed charge coverage ratio after giving effect to any such restricted payment.
At March 31, 2015, we were in compliance with all of our covenants. For additional information regarding the terms of our indebtedness, see “Description of Certain Indebtedness.”
Contractual Obligations
The following table presents our contractual obligations at December 31, 2014 (in millions):
| Payments Due by Period | ||||||||||||||||||||
| Total | Less Than 1 Year | 1-3 Years | 3-5 Years | More Than 5 Years | ||||||||||||||||
| Debt and capital lease obligations, principal (1): |
||||||||||||||||||||
| A/R Facility |
$ | 73.0 | $ | — | $ | 73.0 | $ | — | $ | — | ||||||||||
| Senior Credit Facility: |
||||||||||||||||||||
| Euro-denominated term loans |
686.7 | 7.2 | 679.5 | — | — | |||||||||||||||
| U.S. dollar-denominated term loans |
581.4 | 6.0 | 575.4 | — | — | |||||||||||||||
| 2017 Senior Notes |
750.0 | — | 750.0 | — | — | |||||||||||||||
| Capital lease obligations |
15.9 | 4.2 | 8.3 | 3.4 | — | |||||||||||||||
| Other debt |
4.9 | 4.9 | — | — | — | |||||||||||||||
| Debt and capital lease obligations, interest (1) |
264.8 | 115.7 | 149.1 | — | — | |||||||||||||||
| Operating leases |
144.1 | 30.1 | 46.1 | 33.2 | 34.7 | |||||||||||||||
| Underfunded pension obligations (2) |
98.0 | 1.9 | 4.5 | 4.9 | 86.7 | |||||||||||||||
| Due to VWR Holdings—ITRA (3) |
172.9 | 9.8 | 75.0 | 88.1 | — | |||||||||||||||
|
|
|
|
|
|
|
|
|
|
|
|||||||||||
| Total |
$ | 2,791.7 | $ | 179.8 | $ | 2,360.9 | $ | 129.6 | $ | 121.4 | ||||||||||
|
|
|
|
|
|
|
|
|
|
|
|||||||||||
| (1) | To calculate payments due for principal and interest, we assumed that variable interest rates, foreign currency exchange rates and outstanding borrowings under credit facilities were unchanged from December 31, 2014 through maturity. |
| (2) | The amounts in the table reflect estimated cash payments to be made by us over the next five years and thereafter with respect to certain underfunded pension obligations, which are attributable to our non-U.S. benefit plans. These pension obligations are included in other liabilities on our balance sheet as of December 31, 2014. |
| (3) | In March 2015, $9.8 million will be paid to VWR Holdings under the ITRA. The timing and estimated amount of all other payments under the ITRA is not certain. For purposes of inclusion in the table above, we have estimated the timing of payments under the ITRA based on our expectations of when we might realize the benefits of our net operating loss carryforwards, if ever. However, our estimates may not be accurate, and such payments could occur either sooner or later than is depicted in the table. For more information about the ITRA, see Note 21 to our annual consolidated financial statements incorporated by reference in this prospectus. |
73
Table of Contents
Noncurrent deferred income tax liabilities were $462.2 million at December 31, 2014. Deferred tax liabilities are calculated based on cumulative temporary differences between the financial reporting and tax bases of assets and liabilities using enacted tax rates. This amount is not included in the table above because this presentation would not be meaningful. These liabilities do not have a direct connection with the amount of cash taxes to be paid in any future periods and do not relate to liquidity needs. In addition, we have excluded uncertain tax liabilities from the above table due to the uncertainty of the period of payment. We have uncertain tax liabilities of $61.7 million, exclusive of interest and penalties, at December 31, 2014. In addition, we do not provide for deferred income tax liabilities or foreign withholding taxes on $738.2 million of cumulative undistributed earnings of our foreign subsidiaries as of December 31, 2014, as we consider these earnings to be permanently reinvested. We believe that cash flows generated by our domestic operations and availability under our credit facilities will be sufficient to allow us to satisfy our domestic liquidity requirements, including mandatory principal and interest payments.
The employment agreements with our executive officers include severance provisions. Payments under such provisions would be contingent upon termination of the executive officer in accordance with the specified terms. The aggregate potential payments under these employment agreements is approximately $10.5 million as of December 31, 2014. For additional details, see Note 11 to the annual consolidated financial statements incorporated by reference in this prospectus.
Other Uses of Cash
Business Acquisitions
Since the VWR Acquisition, we have completed 38 business acquisitions. We funded these acquisitions through a combination of cash and cash equivalents on hand and incremental borrowings under our credit facilities. Acquisitions of businesses, net of cash acquired and the subsequent disposition of an acquired business in 2014, used cash of $15.6 million, $14.8 million, $89.9 million, $44.4 million and $113.3 million for the three months ended March 31, 2015 and 2014 and the years ended December 31, 2014, 2013 and 2012, respectively.
Capital Expenditures
Most of our capital expenditures are discretionary and for the purpose of maintaining and improving our facilities, infrastructure and information technology. Capital expenditures were $9.5 million, $6.6 million, $33.6 million, $45.3 million and $51.8 million for the three months ended March 31, 2015 and 2014 and the years ended December 31, 2014, 2013 and 2012, respectively.
We plan to continue making investments in our business to support our strategy of continued growth. We anticipate approximately $45 million of capital expenditures for the year ended December 31, 2015.
Working Capital
Working capital impacts our liquidity and capital resources because changes in working capital directly impact our operating cash flows, and our trade accounts receivable balance affects the amount of credit available to us under our A/R Facility. Working capital amounts can vary from period to period based on the short-term needs of our business. Additional information about changes in working capital balances are provided in the sections entitled “—Historical Cash Flows—Three Months Ended March 31, 2015,” “—Historical Cash Flows—Three Months Ended March 31, 2014,” and “—Historical Cash Flows—Years Ended December 31, 2014, 2013 and 2012.”
Historical Cash Flows — Three Months Ended March 31, 2015
Operating Activities
Net cash used in operating activities for the three months ended March 31, 2015 was $9.9 million, which consisted of working capital changes that used net cash of $80.5 million and other operating activities that provided net cash of $70.6 million.
74
Table of Contents
Net cash used for working capital changes consisted of the following:
| • | Changes in trade accounts receivable used cash of $38.1 million, caused by growth in net sales that outpaced collections. |
| • | Changes in other assets and liabilities used cash of $26.3 million of cash, caused by the timing of annual incentive compensation payments and semi-annual interest payments on our 2017 Senior Notes, partially offset by the receipt of annual supplier rebates. |
| • | Changes in accounts payable used cash of $14.7 million. Our cash disbursement routines follow a standardized process for payment, and we may experience fluctuations in cash flows associated with accounts payable from period to period. |
Net cash provided by other operating activities was primarily attributable to our Adjusted EBITDA of $106.8 million, partially offset by cash paid for interest of $38.2 million and cash paid for income taxes of $7.3 million.
Investing Activities
Net cash used in investing activities for the three months ended March 31, 2015 was $24.9 million. We paid net cash of $15.6 million to acquire a business, and capital expenditures were $9.5 million.
Financing Activities
Net cash provided by financing activities for the three months ended March 31, 2015 was $23.8 million. On a net basis, we borrowed $36.2 million representing net usage of our credit facilities, which we subsequently repaid using a portion of the net proceeds from the Euro Notes. We also paid $4.5 million of debt issuance costs related to the Euro Notes and made our first scheduled payment of $9.8 million to VWR Holdings under the ITRA.
Free Cash Flow
Free Cash Flow for the three months ended March 31, 2015 was negative $19.4 million, reflecting the net cash used in operating activities and the capital expenditures described above.
The following table presents the reconciliation of Free Cash Flow from net cash used in operating activities (in millions):
| Three Months Ended March 31, 2015 |
||||
| Net cash used in operating activities |
$ | (9.9 | ) | |
| Less: capital expenditures |
(9.5 | ) | ||
|
|
|
|||
| Free Cash Flow |
$ | (19.4 | ) | |
|
|
|
|||
Historical Cash Flows — Three Months Ended March 31, 2014
Operating Activities
Net cash provided by operating activities for the three months ended March 31, 2014 was $15.2 million, which consisted of working capital changes that used net cash of $36.0 million and other operating activities that provided net cash of $51.2 million.
Net cash used for working capital changes consisted of the following:
| • | Changes in trade accounts receivable used cash of $48.8 million, caused by growth in net sales that outpaced collections. |
| • | Changes in other assets and liabilities used cash of $11.4 million, caused by the timing of semi-annual interest payments on our 2017 Senior Notes and from payments relating to our 2013 global restructuring program, partially offset by the receipt of annual supplier rebates. |
75
Table of Contents
| • | Changes in accounts payable provided cash of $20.0 million. Our cash disbursement routines follow a standardized process for payment, and we may experience fluctuations in cash flows associated with accounts payable from period to period. |
Net cash provided by other operating activities was primarily attributable to our Adjusted EBITDA of $111.7 million, partially offset by cash paid for interest of $56.5 million and cash paid for income taxes of $5.7 million.
Investing Activities
Net cash used in investing activities for the three months ended March 31, 2014 was $21.4 million. We paid net cash of $14.8 million to acquire a business, and capital expenditures were $6.6 million.
Financing Activities
Net cash provided by financing activities for the three months ended March 31, 2014 was $0.9 million. Net borrowings under our debt facilities were substantially offset by repurchases of redeemable equity, net changes in cash overdrafts and payment of debt issuance costs.
Free Cash Flow
Free Cash Flow for the three months ended March 31, 2014 was $8.6 million, reflecting the net cash provided by operating activities and the capital expenditures described above.
The following table presents the reconciliation of Free Cash Flow from net cash provided by operating activities (in millions):
| Three Months Ended March 31, 2014 |
||||
| Net cash used in operating activities |
$ | 15.2 | ||
| Less: capital expenditures |
(6.6 | ) | ||
|
|
|
|||
| Free Cash Flow |
$ | 8.6 | ||
|
|
|
|||
Historical Cash Flows —Years Ended December 31, 2014, 2013 and 2012
The following table presents a summary of cash flows provided by (used in) operating, investing and financing activities and Free Cash Flow (in millions):
| Year Ended December 31, | Change | |||||||||||||||||||
| 2014 | 2013 | 2012 | 2014 vs. 2013 | 2013 vs. 2012 | ||||||||||||||||
| Working capital changes, net |
$ | (47.1 | ) | $ | 30.7 | $ | (114.1 | ) | $ | (77.8 | ) | $ | 144.8 | |||||||
| Other operating activities |
238.2 | 170.2 | 148.8 | 68.0 | 21.4 | |||||||||||||||
|
|
|
|
|
|
|
|
|
|
|
|||||||||||
| Cash flows from operating activities |
191.1 | 200.9 | 34.7 | (9.8 | ) | 166.2 | ||||||||||||||
| Cash flows from investing activities |
(123.0 | ) | (89.5 | ) | (160.9 | ) | (33.5 | ) | 71.4 | |||||||||||
| Cash flows from financing activities |
(71.8 | ) | (117.9 | ) | 98.3 | 46.1 | (216.2 | ) | ||||||||||||
| Free Cash Flow |
157.5 | 155.6 | (17.1 | ) | 1.9 | 172.7 | ||||||||||||||
Operating Activities
Cash flows from operating activities for the years ended December 31, 2014 and 2013 decreased $9.8 million and increased $166.2 million, respectively, compared to prior years. For those same periods, cash flows from working capital changes, net, decreased $77.8 million and increased $144.8 million, respectively; cash flows from other operating activities increased $68.0 million and increased $21.4 million, respectively.
76
Table of Contents
The net decrease in cash flows from working capital changes from 2013 to 2014 was as follows:
| • | Cash flows from changes in trade accounts receivable decreased by $56.0 million. The decrease was attributable to our sales growth in the 2014 period, which exceeded the rate of growth in the 2013 period, and a high rate of collections in the 2013 period on a trade accounts receivable backlog following a systems implementation in the Americas in 2012. |
| • | Cash flows from changes in inventories decreased by $13.1 million, driven by increasing stock of private label products and chemicals and global initiatives to improve customer services levels. |
| • | Cash flows from changes in accounts payable decreased $8.7 million. The decrease was attributable to comparatively lower cash payments made in the 2013 period. Our cash disbursement routines follow a standardized process for payment, and we may experience fluctuations in cash flows associated with accounts payable from period to period. |
| • | Cash flows from changes in other assets and liabilities were flat in the aggregate. In 2014, higher employee compensation and other accruals were substantially offset by increased rebates paid to customers, each as compared to 2013. |
The net increase in cash flows from working capital changes from 2012 to 2013 was as follows:
| • | Cash flows from changes in trade accounts receivable increased by $40.2 million. Cash flows in 2013 were attributable to lower sales volume and from comparatively favorable collection efforts, partially offset by an increasing demand for extended payment terms by our customers. Cash flows in 2012 were negatively impacted by delayed customer collections caused by an enterprise resource planning system implementation in the United States. |
| • | Cash flows from changes in inventories decreased $24.3 million, which primarily attributable to an expansion of inventories in the United States and in Europe at the end of 2013. |
| • | Cash flows from changes in accounts payable increased by $68.2 million, driven in part by the timing of inventory purchases in the fourth quarter of 2013. |
| • | Cash flows from changes in other assets and liabilities increased by $60.7 million, reflecting a relatively higher use of cash in 2012 from reductions in accrued bonuses, interest, income taxes and derivative liabilities. |
The net increase in cash flows from other operating activities was primarily attributable to our growth in Adjusted EBITDA, which increased $30.9 million and $17.0 million for the years ended December 31, 2014 and 2013, respectively, compared to prior years. Additionally, in 2014 and 2013 there were reductions in cash interest paid compared to prior years.
We paid cash interest of $158.9 million, $186.5 million and $207.9 million during the years ended December 31, 2014, 2013 and 2012, respectively. Cash paid for interest was lower by $27.6 million in 2014 compared to 2013 due to (i) lower interest paid on the Subordinated Notes of $15.7 million following their redemption early in the fourth quarter of 2014; (ii) lower rates of interest on our terms loans under the Senior Credit Facility following an amendment in January 2014; and (iii) lower average borrowings on other debt. Cash paid for interest was lower by $21.4 million in 2013 compared to 2012 due to (i) savings associated with the refinancing of our Senior Credit Facility and 2017 Senior Notes; (ii) the maturity of our interest rate swap arrangements in 2012; and (iii) other decreases caused by timing differences; partially offset by (iv) increased aggregate cash interest under our multi-currency revolving loan facility. Cash interest paid in 2013 included $4.5 million related to interest on our Subordinated Notes from the fourth quarter of 2012. Cash interest paid in 2012 included $13.7 million related to interest on our prior senior notes paid upon refinancing, such interest would otherwise have been payable in 2013.
77
Table of Contents
Investing Activities
Net cash used in investing activities for the year ended December 31, 2014 increased $33.5 million compared to 2013. We used cash of $89.9 million for acquisitions of businesses, net of a business disposal, an increase of $45.5 million compared to 2013. Partially offsetting this, capital expenditures decreased by $11.7 million, which was primarily the result of a one-time investment in our Bruchal, Germany distribution facility during the 2013 period that was absent in the 2014 period.
Net cash used in investing activities for the year ended December 31, 2013 decreased $71.4 million compared to 2012. The decrease in cash used was primarily due to the funding of business acquisitions. Additionally, capital expenditures were relatively higher in 2012, compared to 2013, reflecting incremental investments in facilities, infrastructure and information technology.
Financing Activities
Net cash used in financing activities for the year ended December 31, 2014 decreased $46.1 million compared to 2013. In 2014, we used the net proceeds from our IPO and the Additional Sale and an additional $29.0 million to make net repayments of debt, compared to net repayments of debt of $110.2 million in 2013. This decrease in cash used was partially offset by additional cash used to pay a $25.0 million dividend to VWR Holdings and to repurchase $8.9 million of redeemable convertible preferred stock during 2014.
Cash flows from financing activities for the year ended December 31, 2013 decreased $216.2 million compared to 2012. Cash used in 2013 was primarily attributable to net payments under our multi-currency revolving loan facility and repurchases of equity units. Positive operating cash flows in 2013 allowed us to reduce our debt. Net cash provided by financing activities in 2012 was primarily attributable to net proceeds from our multi-currency revolving loan facility and our A/R Facility, partially offset by cash paid for costs incurred to amend our Senior Credit Facility and issue our 2017 Senior Notes and for repurchases of equity units.
Free Cash Flow
Free Cash flow is a non-GAAP financial measurement used by our investors, creditors and management to measure and evaluate our ability to generate cash. We strongly encourage readers to review our results of operations in their entirety and not to rely solely on any one, single financial measure. See “—Key Indicators of Performance and Financial Condition.”
Free Cash Flow for the year ended December 31, 2014 was flat compared to 2013, reflecting a slight decrease in operating cash flows offset by a slight decrease in capital expenditures. Free Cash Flow for the year ended December 31, 2013 increased $172.7 million, reflecting an increase in operating cash flows, as discussed above.
The following table presents the reconciliation of Free Cash Flow from net cash provided by operating activities (in millions):
| Year Ended December 31, | ||||||||||||
| 2014 | 2013 | 2012 | ||||||||||
| Net cash provided by operating activities |
$ | 191.1 | $ | 200.9 | $ | 34.7 | ||||||
| Less: capital expenditures |
(33.6 | ) | (45.3 | ) | (51.8 | ) | ||||||
|
|
|
|
|
|
|
|||||||
| Free Cash Flow |
$ | 157.5 | $ | 155.6 | $ | (17.1 | ) | |||||
|
|
|
|
|
|
|
|||||||
Critical Accounting Policies and Estimates
The preparation of consolidated financial statements in conformity with GAAP requires us to make estimates and assumptions that affect the reported amounts of assets and liabilities and disclosure of contingent assets and liabilities at the date of the consolidated financial statements and the reported amounts of net sales,
78
Table of Contents
expenses, income and loss during the reporting period. Those estimates and assumptions are based on our best estimates and judgment. We evaluate our estimates and assumptions on an ongoing basis using historical experience and known facts and circumstances, including the current economic environment. Unfavorable global economic conditions, when present, increase the uncertainty inherent in such estimates and assumptions. We adjust our estimates and assumptions when we believe the facts and circumstances warrant an adjustment. As future events and their effects cannot be determined with precision, actual results could differ significantly from those estimates.
The policies and estimates discussed below are considered by management to be critical to an understanding of our consolidated financial statements because their application places the most significant demands on management’s judgment, with financial reporting results relying on estimation about the effect of matters that are inherently uncertain. Specific risks for these critical accounting policies are described in the following paragraphs. For all of these policies, management cautions that future events rarely develop exactly as forecast, and such estimates routinely require adjustment. We have reviewed these critical accounting policies and estimates and related disclosures with our Audit Committee.
Our discussion of critical accounting policies and estimates is intended to supplement, not duplicate, our summary of significant accounting policies so that readers will have greater insight into the uncertainties involved in applying our critical accounting policies and estimates. For a summary of our significant accounting policies, see Note 2 to our annual consolidated financial statements incorporated by reference in this prospectus.
Testing Goodwill and Other Intangible Assets for Impairment
As a result of a merger in 2007, and to a lesser extent our subsequent acquisition of businesses, we carry significant amounts of goodwill and other intangible assets on our consolidated balance sheets. At December 31, 2014, the combined carrying value of goodwill and other intangible assets, net of accumulated amortization and accumulated impairment charges, was $3,448.5 million, representing 69% of our total assets. We believe that the testing of goodwill and other intangible assets for impairment represents a critical accounting policy because of the significant judgments and estimates that we must make to estimate the fair value of our reporting units and other intangible assets, especially in determining the assumptions used in those estimates such as projected future earnings, applicable discount rates, the selection of peer earnings multiples and the relative weighting of different value indicators.
The following table presents information about impairment testing we performed during the year ended December 31, 2014 (in millions):
| Testing Date | Reason | Carrying Value | Excess (Shortfall) of Fair Value over Carrying Value |
|||||||||
| Goodwill of reporting units: |
||||||||||||
| US Lab |
October 1, 2014 | Required annual assessment |
$ | 1,717.2 | $ | 453.8 | ||||||
| Emerging Businesses |
October 1, 2014 | Required annual assessment |
461.7 | 62.3 | ||||||||
| EMEA-APAC |
October 1, 2014 | Required annual assessment |
1,480.3 | 1,176.7 | ||||||||
| Indefinite-lived intangible assets: |
||||||||||||
| VWR tradename |
October 1, 2014 | Required annual assessment |
649.5 | 189.3 | ||||||||
| Other |
October 1, 2014 | Required annual assessment |
15.4 | 4.4 | ||||||||
| Goodwill of a business subsequently disposed |
June 30, 2014 | Impairment indicator |
11.3 | (11.3 | ) | |||||||
79
Table of Contents
On October 1 of each year, we perform annual impairment testing of our goodwill and indefinite-lived intangible assets. The impairment testing requires us to estimate the fair value of our reporting units and our indefinite-lived intangible assets, which require significant judgment from management. The most significant fair value measurements are as follows:
| • | The fair value of goodwill depends upon estimating the fair value of a reporting unit. We estimate the fair value of each reporting unit using both the income approach (a discounted cash flow technique) and the market approach (a market multiple technique and a market reference technique). These valuation methods required management to make various assumptions, including, but not limited to, assumptions related to future profitability, cash flows, discount rates, weighing of techniques as well as valuation multiples derived from comparable publicly traded companies that are applied to operating performance of the reporting unit. |
| • | The fair value of indefinite-lived intangible assets is determined using an income approach (a discounted cash flow technique), which incorporates an estimated royalty rate and discount rate, among other estimates, applicable to trademarks and tradenames. |
Our estimates are based upon historical trends, management’s knowledge and experience and overall economic factors, including projections of future earnings potential. Developing future discounted cash flows in applying the income approach requires us to evaluate our intermediate to longer-term strategies, including, but not limited to, estimates about net sales growth, our acquisition strategies, operating margins, capital requirements, inflation and working capital management. The development of appropriate rates to discount the estimated future cash flows requires the selection of risk premiums, which can materially impact the present value of future cash flows. Selection of an appropriate peer group under the market approach involves judgment, and an alternative selection of guideline companies could yield materially different market multiples. Weighing the different value indications involves judgment about the usefulness and comparability to the reporting unit.
As discussed further in “—Results of Operations” above, we experienced growth across our business in 2014 and experienced a number of favorable trends in our business, which generally caused us to increase the projected cash flows of our reporting units and generally resulted in increases to the fair value of our goodwill and indefinite-lived intangible assets compared to prior periods. However, future changes in our estimates or judgments could reduce our fair value measurements, which could in turn result in an impairment charge. For example, our expected net sales, cash flow growth or market conditions could be adversely affected due to, among other things, negative macroeconomic or industry-specific factors. For example, in 2011 and 2010, we recognized impairment charges of $3.3 million and $48.1 million resulting primarily from factors specific to the science education industry, while in 2008, we recognized impairment charges of $392.1 million related primarily to macroeconomic factors. We could also experience adverse changes in market factors such as discount rates, valuation multiples derived from comparable publicly-traded companies, a decline in the trading price of our common stock or control premiums derived from market transactions.
On June 30, 2014, we tested the goodwill of a recently-acquired business for impairment following our identification of inappropriate business practices. We concluded that the entire carrying value of acquired goodwill was not recoverable and recognized an impairment charge of $11.3 million. Subsequently, we received a full refund of the purchase price, recorded a gain of $11.1 million and disposed of the business. See Notes 6 and 10 to our annual consolidated financial statements incorporated by reference in this prospectus for additional background information and information about the valuation methods and assumptions used. Of the 38 acquisitions we have completed since the VWR Acquisition, this was the only time we identified such an impairment matter.
Estimating Valuation Allowances on Deferred Tax Assets
We are required to estimate the degree to which tax assets and loss carryforwards will result in a future income tax benefit, based on our expectations of future profitability by tax jurisdiction. We provide a valuation allowance for deferred tax assets, consisting primarily of net operating loss carryforwards, that we believe will
80
Table of Contents
more likely than not go unused. If it becomes more likely than not that a deferred tax asset will be realized, we reverse the related valuation allowance and recognize an income tax benefit for the amount of the reversal. At December 31, 2014, our valuation allowance on deferred tax assets was $110.0 million, almost all of which was applicable to our foreign operations.
On October 7, 2014, we entered into an ITRA with VWR Holdings that provides for the payment of 85% of the amount of cash savings, if any, in U.S. federal, state and local income tax realized as a result of the utilizing net operating losses that were generated in periods prior to the IPO. Changes to the value of the ITRA liability will be presented as other income (expense), net in the consolidated statement of operations. As a result, should we determine that valuation allowances are necessary for our domestic deferred tax assets, changes in which would be included in income tax expense or benefit, would be substantially offset by opposite changes in the value of the ITRA liability. Therefore, our net income exposure from changes in valuation allowances has been substantially reduced as a result of the ITRA.
We must make assumptions, judgments and estimates to estimate the amount of valuation allowance to be recorded against our deferred tax assets, which take into account current tax laws and estimates of the amount of future taxable income, if any. Changes to any of the assumptions, judgments and estimates could cause our actual income tax obligations to differ from our estimates.
Accounting for Uncertain Tax Positions and Other Tax Uncertainties
In the ordinary course of business, there is inherent uncertainty in quantifying our income tax positions. We assess income tax positions for all years subject to examination based upon our evaluation of the facts, circumstances and information available at the reporting date. For those tax positions where it is more likely than not that a tax benefit will be sustained, we have recorded the largest amount of tax benefit with a greater than 50% likelihood of being realized upon ultimate settlement with a taxing authority assumed to have full knowledge of all relevant information. For those income tax positions where it is not more likely than not that a tax benefit will be sustained, no tax benefit has been recognized in the financial statements. Our reserve for uncertain tax positions was $61.7 million at December 31, 2014, exclusive of penalties and interest. Where applicable, associated interest expense has also been recognized as a component of the provision for income taxes.
We operate in numerous countries under many legal forms and, as a result, we are subject to the jurisdiction of numerous domestic and non-U.S. tax authorities, as well as to tax agreements and treaties among these governments. Determination of taxable income in any jurisdiction requires the interpretation of the related tax laws and regulations and the use of estimates and assumptions regarding significant future events, such as the amount, timing and character of deductions and the sources and character of income and tax credits. Changes in tax laws, regulations, agreements and treaties, currency exchange restrictions or our level of operations or profitability in each taxing jurisdiction could have an impact upon the amount of current and deferred tax balances and hence our net income.
We file tax returns in each tax jurisdiction that requires us to do so. Should tax return positions not be sustained upon audit, we could be required to record an income tax provision. Should previously unrecognized tax benefits ultimately be sustained, we could be required to record an income tax benefit.
Accounting for Defined Benefit Plans
We have defined benefit pension plans covering a significant number of domestic and international employees. Accounting for these plans requires the use of a number of assumptions, including estimates on the expected long-term rate of return on assets, discount rates and the average rate of increase in employee compensation. In order to make informed assumptions, management consults with actuaries and reviews public market data and general economic information. We periodically assess these assumptions based on market conditions, and if those conditions change, our pension cost and pension obligation may be adjusted accordingly. See Note 16 to our annual consolidated financial statements incorporated by reference in this prospectus for more information about our defined benefit plans.
81
Table of Contents
In accordance with GAAP, changes to the assumptions used in measuring defined benefit plans are generally accumulated and amortized over future periods, and therefore affect expense ratably over a number of future periods. A 100 basis point increase or decrease in the discount rate assumption or the expected return on plan assets would not have a material impact on our consolidated financial statements.
Loss Contingencies related to Product Liability
We are subject to product liability and other claims in the ordinary course of business and, from time to time, we are named as a defendant in cases that arise as a result of our distribution of laboratory and production supplies. While the impact on us of this litigation has typically been immaterial, there can be no assurance that the impact of the pending and any future claims will not be material to our business, financial condition and results of operations in the future. Our estimates of potential liability are based on several factors, including our historical experience in similar cases, legal venue and the merits of each individual case. See Note 11 to our annual consolidated financial statements incorporated by reference in this prospectus for more information about loss contingencies.
Other Accounting Policies and Estimates
In addition to the critical accounting policies and estimates noted above, we are required to make estimates and assumptions in certain other accounting areas including: (i) our reserve against trade accounts receivable, which represents our estimate of the amounts that will not be collected from customers and for estimated sales returns and allowances; (ii) estimating the net realizable value of our inventories, which if less than the cost of inventories would require us to establish an inventory obsolescence reserve; and (iii) estimating the value of price incentives due from our suppliers and due to our customers, which may depend upon achieving future targets in areas such as sales growth or purchasing volume. Although these policies and estimates could potentially have a material impact on our consolidated results of operations, we are not currently aware of any reasonably likely changes to our estimates and assumptions that would have a material effect on our consolidated financial statements.
New Accounting Standards
For information about new accounting standards, see Note 2 to our unaudited interim condensed consolidated financial statements incorporated by reference in this prospectus.
Off-Balance Sheet Arrangements
We are not involved in any off-balance sheet arrangements that have or are reasonably likely to have a material current or future effect on our financial condition, revenues or expenses, results of operations, liquidity, capital expenditures or capital resources.
Quantitative and Qualitative Disclosures about Market Risk
Interest Rate Risk
Our Senior Credit Facility and our A/R Facility contain variable interest rates which expose us to fluctuating rates of interest. As of December 31, 2014, a 100 basis point change in the variable rates for the Senior Credit Facility and the A/R Facility would, on an annualized basis, impact interest expense by $13.4 million on a pre-tax basis. For additional information about the terms of our credit facilities, see Note 9 to our annual consolidated financial statements incorporated by reference in this prospectus.
Foreign Currency Exchange Rate Risk
While we report our consolidated financial results in U.S. dollars, we have significant operations outside the United States. As a result, we derive a significant portion of our sales and incur a significant portion of our costs in foreign currencies, principally the euro, the British pound sterling, the Canadian dollar and the Swiss franc.
82
Table of Contents
Fluctuations in the relative values of currencies occur from time to time and could favorably or unfavorably affect our operating results. Specifically, during times of a strengthening U.S. dollar, our reported international sales and earnings will be reduced because the local currency will translate into fewer U.S. dollars. A 10% change in average foreign currency exchange rates relative to the U.S. dollar would have impacted our reported operating income for the year ended December 31, 2014, by $11.9 million on a pre-tax basis. Net sales and costs tend to be incurred in the same currency, and therefore, reduce local currency risks.
Where we deem it prudent, we have engaged in hedging programs, using primarily foreign currency forward contracts, aimed at limiting the impact of foreign currency exchange rate fluctuations on cash flows and earnings. These activities have not been material to our consolidated financial statements. For additional information, see Note 10 to our annual consolidated financial statements incorporated by reference in this prospectus.
We have a significant amount of foreign-denominated debt on our U.S. dollar-denominated balance sheet. A 10% change in foreign currency exchange rates associated with foreign denominated debt outstanding at December 31, 2014 would have impacted our reported exchange gains or losses for the year ended December 31, 2014 by $55.1 million on a pre-tax basis.
On March 25, 2015, we issued €503.8 million of euro-denominated Euro Notes. We designated those notes as a hedge to help protect a portion of our net investment in euro-denominated foreign operations from the impact of changes in the euro to U.S. dollar exchange rate. As a result of the hedge designation, the net foreign currency remeasurement gain or loss on the Euro Notes, which otherwise would be recognized in earnings, is equally offset in other comprehensive income by the net unrealized gain or loss from the translation of the hedged portion of our net investment in euro-denominated foreign operations.
83
Table of Contents
Our Company
We are a leading, independent provider of laboratory products, services and solutions to the global life science, general research and applied markets. We have significant market share positions in Europe and North America. We also have operations in Asia-Pacific and other key emerging markets to support our multinational customers across the globe. We serve a critical role in connecting customer sites with core laboratory product suppliers across multiple industries and geographies. We offer one of the broadest portfolios of branded and private label laboratory products. We also offer a full range of value-added services, including custom manufacturing, to meet our customers’ needs. These services represent a growing but currently small portion of our overall net sales. We offer a wide selection of unique products and have developed an extensive global infrastructure including thousands of sales and service-focused professionals. We deliver value to our customers by improving the costs, efficiency and effectiveness of their research laboratories and production operations. We deliver value to our suppliers by providing them with cost-effective channel access to a global and diverse customer base.
Our portfolio includes chemicals, reagents, consumables, durable products and scientific equipment and instruments with a range of complexity and sophistication. We offer most of the leading branded products to the customer segments we serve. Our private label products enhance our branded product offerings by providing additional choice at varying price points to our customers. We complement our branded and private label product portfolio with value-added service offerings marketed under the “VWRCATALYST” brand, including sourcing and procurement, logistics, chemical and equipment tracking and sample management. We have recently expanded our service offerings to include more complex scientific research support services, such as DNA extraction, bioreactor servicing and compound management. In addition, we offer custom manufacturing solutions, including buffers, reagents and other chemicals used in biopharmaceutical and industrial applications and production processes. We believe these growing value-added service offerings integrate us within our customers’ critical operational processes and further differentiate our value proposition from that of our competitors. We believe our range of offerings and capabilities enhances our ability to expand our addressable market and gain market share leading to incremental net sales and profits.
Over our 163-year history, we have built longstanding and extensive customer relationships. We provided solutions to approximately 120,000 customers in 2014, including over 230 Fortune 500 companies, approximately 5,000 leading academic institutions and thousands of smaller businesses in multiple industries. Our broad and diverse customer base includes pharmaceutical, biotechnology, agricultural, chemical, environmental, food and beverage, healthcare, microelectronic and petrochemical companies, as well as educational and governmental institutions. Our global infrastructure and extensive inventory enable us to serve our customers in and across multiple geographies, and our local presence enables us to provide them with tailored expertise and support. We have developed global strategic relationships with our largest customers through which we centrally manage and actively collaborate with them, help optimize the efficiency of their research, production and procurement activities and support them with dedicated on-site professionals and technicians. Because we source substantially all of our products from third-parties, we are independent and able to provide our customers with access to an unbiased and broad selection of products.
We also have longstanding and extensive supplier relationships and serve as the largest, independent channel in the laboratory products market for many of our suppliers. Our supplier base is comprised of approximately 4,500 core laboratory product suppliers located across the globe. In 2014, our five largest suppliers were Corning, Eppendorf, GE Healthcare, Merck KGaA and Thermo Fisher Scientific. We strive to maintain strong relationships with our suppliers, and most of our larger suppliers have been with us for more than 20 years. We are also an important market channel for thousands of specialized manufacturers of complex and sophisticated scientific tools. Our suppliers rely upon our global network to reach a diverse customer base and to minimize the need for in-house distribution capabilities, thereby enabling them to allocate more resources to their core competencies. Our strategy within our manufacturing operations is generally to avoid competing with our suppliers’ product offerings. We believe that this independence is valued by our suppliers.
84
Table of Contents
Our global infrastructure consists of over 160 facilities located in 34 countries, which enable us to deliver a broad array of products to our customers generally within 24 to 48 hours. We also have approximately 3,100 sales and sales support professionals operating locally and managing comprehensive industry-specific marketing programs, emphasizing tailored catalogs, websites and direct mailings in multiple languages. Our two low-cost offshore captive service centers employ an additional 800 associates who provide commercial and administrative support services to us, our customers and suppliers. We have made significant investments in our infrastructure, including approximately $70 million recently to expand and upgrade distribution facilities and implement a common enterprise resource planning and global website platform. During 2014, on average we processed approximately 17,000 customer orders per day, with an average order size of approximately $700. Over half of our customer orders came from our e-commerce platforms, including many from customers that have an e-commerce integration with us. We believe our global infrastructure and our longstanding customer and supplier relationships provide us with a sustainable competitive advantage given the significant time and costs required to develop and maintain them. We expect to continue to benefit from our global infrastructure and capabilities as we execute on our growth strategies.
Our growth strategies include expanding our global strategic relationships, developing complementary new products and services, expanding our customer and supplier base, implementing our best practices across our operations, broadening our offerings to underserved customer segments and executing our targeted acquisition strategy. We generated net sales of $1,029.6 million, Adjusted EBITDA of $106.8 million, Adjusted Net Income of $43.8 million and net income of $71.5 million for the three months ended March 31, 2015. We generated net sales of $4,375.3 million, Adjusted EBITDA of $449.4 million, Adjusted Net Income of $158.3 million and net income of $152.6 million for the year ended December 31, 2014. Since 2006, the year prior to our acquisition by the Sponsors, we have been able to increase net sales and Adjusted EBITDA at compound annual growth rates of 3.8% and 8.5%, respectively, we have improved our gross margin from 27.1% to 28.4% and we have improved our Adjusted EBITDA margin from 7.2% to 10.3% through 2014. See “Summary Historical Consolidated Financial Data” for the definitions of Adjusted EBITDA and Adjusted Net Income, the reason for their inclusion and a reconciliation from net income to Adjusted Net Income and Adjusted EBITDA.
Industry Overview
We operate primarily in the global life science, general research and applied markets, which include customers in the Biopharma sector, as well as industries such as agriculture, chemical, environmental, food and beverage, healthcare, microelectronic and petrochemical. Our product offering to these customers has primarily consisted of laboratory products, which we estimate generated approximately $39 billion of global sales in 2013 based on Frost & Sullivan estimates, and continues to be our largest single market. According to Frost & Sullivan, the global laboratory products market is projected to continue to expand by 2% annually through 2015. We recently began offering additional complex value-added services in the laboratory services market, which Frost & Sullivan estimated in a study commissioned by us to be approximately $4 billion in 2013 and growing in the high single to low teen digits. We have also expanded our internal bioprocess chemicals and consumables manufacturing business, which provides products and chemicals used in the production of biopharmaceuticals, diagnostics and other products, both through organic efforts and through targeted acquisitions. In a study commissioned by us, Frost & Sullivan estimated the bioprocess chemicals and consumables market to be approximately $6 billion in 2013 and growing at approximately 10% to 12% annually. Further, we are expanding our offering of products and services in sectors such as certain production and industrial segments. As a result of the addition of these new services and customer categories, we believe we have expanded our total addressable market.
85
Table of Contents
The following table presents the primary applications of our products, services and solutions for the customers in each industry we serve:
| Industry Sectors |
Applications | |
| Biopharma |
Discovery, development and production of therapeutics, including compliance with Food and Drug Administration requirements for quality testing, documentation and supply chain security | |
| Agriculture |
Research related to plants, animals and fungi aimed at increasing quality, yields and resistance to environmental conditions | |
| Chemical |
Chemical research and development, analytical testing and production of chemicals | |
| Environmental |
Testing of water and other materials to ensure adherence to regulatory requirements or specifications | |
| Food and Beverage | Testing of ingredients and final food and beverage products to ensure public health and safety | |
| Healthcare |
Testing of specimens by medical or clinical laboratories to gain information about the health of a patient | |
| Microelectronic |
Production of semiconductor products and applications in controlled environments | |
| Petrochemical |
Testing of raw materials, intermediates and final products to ensure adherence to specifications |
The global laboratory products market is highly fragmented. We estimate that its two largest participants, us and the laboratory product distribution and service business of Thermo Fisher Scientific, accounted for approximately 28% of this market’s aggregate sales in 2014. Most other participants are either regional and specialty distributors or manufacturers that sell directly to their customers. Due to the large number of laboratory product suppliers and distributors, customers have historically been required to maintain a complex procurement infrastructure in order to source their desired products. Customers are increasingly seeking to reduce the total cost of procurement by eliminating complexity and improving the effectiveness of their supply chain by utilizing a full service platform such as VWR.
In addition to requiring laboratory products, participants in the global life science, general research and applied market industries also utilize a range of value-added services. These services historically comprised stockroom and other operational services performed at customer locations. We believe that these customers are beginning to look to outsource components of their scientific and more complex activities to focus on their core high science research activities rather than performing routine scientific processes.
We also serve the production operations of customers who are engaged in the manufacture of biotechnology products, clinical and molecular diagnostic products and semiconductors. Manufacturers of biotechnology products and clinical and molecular diagnostic products require a range of chemicals to optimize and ensure consistent quality of their production products. Manufacturers of semiconductors require products and services to ensure that their manufacturing environments are sterile.
Laboratory Products and Services
The laboratory products market traditionally encompasses chemicals and reagents, consumables and instruments and equipment. Chemicals and reagents used in the laboratory products market are essential to the daily operating activities of laboratories and are typically used in a variety of research and laboratory applications, including the routine laboratory activities, quality control testing and more sophisticated operations, including nucleic acid isolation and purification, protein extraction and fractionation, cell culture and related assays. Laboratory consumables include plasticware, glassware and other general laboratory supplies, such as pipettes, tubing, gloves, gowns and other products utilized in the daily operations of a laboratory. Instrument and
86
Table of Contents
equipment products include general laboratory equipment, instrumentation and furniture and includes products such as centrifuges, fume hoods, workstations, ovens, microscopes, lab furniture, refrigerators, freezer and other lab equipment and instruments.
The laboratory services market comprises basic operational services designed to improve laboratory efficiency and scientific services of varying degrees of complexity. Examples of operational services include autoclaving, product tracking and other services. In addition, we also provide services to manufacturers of aerospace, microelectronics and medical devices. Value-added services are utilized within three segments: scientific services, laboratory management and research services.
Industry Trends
We believe there are several key trends impacting our customers, suppliers, and our customer segments that will drive increased demand for our products and services:
| • | Continued globalization of our largest customers. As our largest customers across all industry sectors grow and expand their research operations geographically, we believe they will further turn to suppliers that have the scale and global reach to address their needs across all geographies. Additionally, many of our multinational customers are centralizing and standardizing core research procurement and other processes and are consolidating the number of suppliers of products and related services with whom they do business. |
| • | Positive research and development trends in life science. Based on R&D Magazine, we estimate that global investment in research and development will be approximately $1.6 trillion in 2014 and that spending across life science in 2013 was approximately $200 billion, of which 85% came from Biopharma. Life science spending grew at a compound annual growth rate of approximately 3% since 2011 and this spending is expected to continue to grow at a similar rate in 2014. Within the Biopharma industry, we serve large Biopharma companies as well as early-stage biotechnology companies, contract research organizations and academic institutions, which have been growing at a higher rate than the larger pharmaceutical companies as a whole and we expect this trend to continue. We believe these early-stage biotechnology companies and institutions are generally more reliant upon solution providers like us due to their limited resources in procurement and focus on core research operations. |
| • | Increase in research and development in applied markets. The estimated $1.6 trillion of global research and development spending in 2014 includes spending in various applied markets such as energy of approximately $20 billion and chemistry and advanced materials of approximately $45 billion. According to R&D Magazine, forecasted 2014 growth rates within those industries are expected to be approximately 5%. We provide laboratory products and services to companies across these industries in the geographies we serve with our global network. We believe we are well positioned to address the needs of these customers based on our infrastructure, broad product portfolio and ability to provide value-added services. |
| • | Heightened regulation and public scrutiny in applied markets. The industries we serve are increasingly subject to heightened regulation and public scrutiny in the United States and globally in a number of areas, including clinical operations, post-marketing drug safety reporting, environmental impact and quality control activities around manufacturing operations. For example, recent highly publicized food quality outbreaks have intensified scrutiny on food safety and the REACH legislation in Europe, which became effective on June 1, 2007, requires manufacturers and end-users of certain chemicals to adopt additional safety, testing and reporting measures. We believe the increased scrutiny both by regulatory agencies and the public are driving an increase in demand for laboratory testing products and services in these industries. |
| • | Recent increase in biotechnology research activity. Demand for laboratory products and services has been positively impacted by recent increases in early-stage biotechnology funding driven by new scientific breakthroughs and their commercial promise such as development of targeted therapeutics |
87
Table of Contents
| and applications for genomics. Our biotechnology customers often lack the laboratory operations of large, multinational corporations, and our expertise in this area helps them to complement their resources and manage complexity. Spending in research by these companies and institutions has provided an increase in demand for the full breadth of laboratory products and services. |
| • | Current government and education budgets. The improving budgetary situations in North America and Europe create a positive funding environment for research and educational spending across our government and academic customer bases. For example, the federal budget approved by the U.S. Congress in January 2014 included a 3.5% increase in funding for the National Institutes of Health. Additionally, the European Parliament approved in November 2014 the Horizon 2020 research funding initiative, which allocated €80 billion of spending through 2020 to research areas including basic science, researcher mobility, large infrastructure projects and emerging industrial technologies. As budgetary conditions in these geographies continue to improve, we would expect our government and education customer bases to increase spending on science education, basic science and more complex research activities. |
Our Competitive Strengths
We believe we are well positioned to capitalize on key trends occurring in the life science, general research and applied markets as a result of the following competitive strengths:
Global scale and leading positions in attractive markets. We have the #1 market position in Europe and the #2 market position in North America in the approximately $39 billion global laboratory products market. We have the broadest Pan-European platform, which enables us to reach customers throughout Europe with industry-leading efficiency and service levels. We are able to serve our customers on a worldwide basis utilizing our global infrastructure, which includes over 4.5 million square feet of distribution and manufacturing space strategically located in approximately 50 cities worldwide. We operate primarily in North America and Europe, as well as select emerging markets that are most critical to our customers, including Asia-Pacific, Eastern Europe and Central and South America. We believe our global infrastructure provides us with a competitive advantage in offering a comprehensive laboratory solution to our customers as they continue to expand globally and consolidate supplier relationships.
Unparalleled customer access. During 2014, we shipped products to approximately 290,000 unique customer sites globally, and believe we are the only company in the laboratory products market reaching customers located in over 160 countries. We offer our suppliers access to our broad and diverse customer base, which includes Biopharma, agriculture, chemical, environmental, food and beverage, healthcare, microelectronic and petrochemical companies, as well as educational and governmental institutions. We are the primary supplier of laboratory products to many Fortune 500 and leading European companies, including a majority of the world’s 20 largest pharmaceutical companies as well as leading academic institutions. By utilizing our global infrastructure, both large multinational and specialized smaller suppliers have immediate worldwide access to thousands of potential end users of their products.
Depth of product and service offering. We provide our customers with access to an industry-leading portfolio of over three million unique products at various price levels and offer them numerous value-added services. We offer a broad and unbiased selection of branded, private label and internally manufactured products, allowing for a “best-of-breed” procurement strategy. For example, we are able to provide the full suite of products necessary to perform a wide range of scientific workflows, in areas such as genomics, proteomics, cell biology and microbiology. We continue to expand our VWRCATALYST branded suite of value-added services, including research support, laboratory services and operational services. In most cases, we integrate these services with our product solutions to enable us to offer a comprehensive laboratory solution to our global strategic customers.
Tailored marketing strategies. We have developed customer segment-focused marketing strategies that enable our customers to efficiently identify and access their relevant product needs in multiple languages. For
88
Table of Contents
example, we have developed a wide variety of customer segment catalogs and specialized capabilities on our websites resulting in a personalized purchasing experience for customers. Our websites utilize enhanced search analytics and feature personalized search tools, customer specific web solutions as well as enhanced data on over 2.1 million products, all of which allow us to optimize the online purchasing experience.
Large and focused direct selling organization. We have a large and experienced team of approximately 3,100 sales and sales support professionals providing multi-brand solutions worldwide. Our sales force includes approximately 280 specialists serving areas such as life science, chromatography, production chemicals and furniture and is relied upon by multiple suppliers as the primary commercial organization responsible for promotion of their products. Our two low-cost offshore captive service centers employ an additional 800 associates who provide commercial and administrative support services to us and our customers and suppliers. Our sales associates develop dedicated relationships by frequently meeting with existing and new customers, providing advice on the broad spectrum of our products and creating solutions for our customers’ complex product and service needs. The deep industry knowledge of our dedicated sales, sales support and marketing resources within each of our customer segments allows us to understand our customers’ needs and provide them with value-added solutions.
Strong track record of identifying and successfully integrating acquisitions. Since June 30, 2007, we have invested over $600 million to acquire and successfully integrate 38 businesses, which have strengthened our existing market positions, expanded our geographic presence and broadened our product offerings. For example, in February 2011, we acquired AMRESCO, which strengthened our portfolio of biochemicals, diagnostics, chemicals and reagents, and in June 2012, we acquired basan GmbH, which expanded our presence and clean room product portfolio in Europe and Asia. Most recently, we acquired Hichrom Limited, a leading manufacturer and distributor of high performance liquid chromatography columns and consumables, in May 2015. We also have a proven capability of completing acquisitions in emerging markets. As a result of recent investments in our information technology and distribution infrastructure, we have the capability to rapidly integrate additional acquisitions as we continue to consolidate the fragmented global laboratory products industry. We are typically able to improve the growth and the profitability of acquired businesses by providing them with access to our global platform and integrating them into our enterprise resource planning and web systems, streamlining various back-office functions and consolidating facilities when appropriate.
Attractive financial profile. Our business is characterized by stable and recurring revenues, the ability to achieve operating leverage and strong cash flow generation. Most of our products are consumable in nature and are generally sold on a recurring basis. In 2014, consumable products and value-added services accounted for approximately 80% of our net sales. We believe our business benefits from operating leverage due to the capacity and efficiency of our infrastructure, which allows us to achieve margin improvement with an increasing revenue base. As a result, while our net sales have grown at a compound annual growth rate of 4.7% from 2010 to 2014, our Adjusted EBITDA has grown at a compound annual growth rate of 5.8% over the same period. Our business generates strong cash flow, which we expect to further improve as a result of the completion of a major infrastructure improvement program commenced in 2012, our low ongoing capital expenditure requirements and reduced interest expense.
Experienced management team with proven track record. Our six-member senior executive team has an average of 18 years of industry experience and an average of ten years of service with us. This team along with over 200 senior managers, who have collectively invested approximately $26 million in our business, has a proven track record of delivering stable revenue growth, executing on investment plans and achieving margin expansion. We believe that the interests of our senior management team and other key employees are aligned with those of our shareholders as a result of their broad-based equity ownership and incentive arrangements.
89
Table of Contents
Our Growth Strategies
We believe we are well positioned to expand our leadership in the laboratory products market and increase our sales to the global life science, general research and applied markets. Our growth strategies allowed us to achieve 3.6% year-over-year growth in net sales from comparable operations in the three months ended March 31, 2015, with recent acquisitions contributing an additional 2.1% in year-over-year growth. In the Americas segment, our net sales from comparable operations increased 5.1% while recent acquisitions contributed an additional 2.7% in year-over-year growth. In the EMEA-APAC segment, our net sales from comparable operations increased 1.9% and recent acquisitions added 1.4% to the year-over-year growth. The key components of our strategy include:
Expand our global strategic relationships. We intend to expand our relationships with our global strategic customers by becoming their primary source of laboratory solutions and providing them with value-added services across all of their operations and locations. For example, we have recently expanded our service offerings to include more complex scientific research support services, such as DNA extraction, bioreactor servicing and compound management. We plan to continue to develop additional complex scientific research support services, as technological advancements enable historically challenging and proprietary processes to become available for outsourcing. We believe these services and expanded relationships are becoming increasingly important for our customers and provide us with an incremental revenue opportunity.
Continue to develop new products and services. We intend to continue augmenting our portfolio to provide customers with additional solutions and further expand our addressable markets. Key elements of this strategy include:
| • | Increase sales of higher margin private label products. We intend to further expand our private label portfolio and focus our sales and marketing efforts to offer our customers private label alternatives when appropriate. Private label products provide our customers with a value-focused alternative to branded products and generally allow us to earn higher margins. |
| • | Expand VWRCATALYST services. We have expanded upon our traditional services to offer other innovative, flexible and customized solutions to our global strategic customers, including research support, laboratory services and operations services marketed under the VWRCATALYST brand. We intend to continue to expand the scope of the services that we can provide to our customers and increase the adoption of these services by new and existing customers. |
| • | Expand chemical manufacturing capabilities. We are focused on enhancing our capabilities as a manufacturer of high quality biochemicals, chemicals and reagents that generally do not compete with the offering of our existing supplier base. Our chemicals and reagents typically have higher margins than other products in our portfolio and provide us with additional opportunity to expand into growing customer segments. |
Continue to expand our customer and supplier base. We intend to continue to expand our customer and supplier base by:
| • | aggressively targeting new customers through our experienced and global sales and sales support teams; |
| • | collaborating with our customers as they continue to add new sites as a result of acquisitions and other global expansion; |
| • | accelerating the adoption of our solutions by end-users currently utilizing a direct procurement model; and |
| • | capitalizing on our global reach to attract new suppliers to utilize VWR as their primary distribution channel. |
90
Table of Contents
Globalization of best practices. We intend to continue to improve our operations by implementing best practices across our global platform. For example, we recently implemented our European sales strategy of aligning our sales team with our customer segments in our North American operations. This sales strategy has been effective in Europe because it enables us to better understand the unique industry drivers affecting our customers and tailor our product and service offerings to meet their distinct needs. Furthermore, we recently deployed in North America “all you need” catalogs for customers in the cell culture, chemical analysis, food analysis, proteomics, chemical, safety, hygiene and industrial supply industries. We have historically provided these types of catalogs to our European customers, which catalogs have proven to be an effective means in generating incremental revenue. In addition, we have recently extended our North American web platform to our European operations.
Broaden our offering to underserved customer segments. We believe that we are well positioned to leverage our leading independent platform, global distribution network and sales and service organization to continue to broaden our offering to specific underserved customer segments, such as the broader healthcare market and niche markets, such as mining and dairy. In addition, we intend to expand the use of our self-manufactured chemicals by selling these products to new and existing customers.
Continue to execute targeted acquisition strategy. Given the highly fragmented nature of our industry, we expect to continue to benefit from a robust pipeline of acquisition opportunities. We are currently evaluating multiple acquisition opportunities in North America and Europe where we seek to expand into new and growing product segments and broaden our manufactured products capabilities, while avoiding conflicts with our existing suppliers. We will also consider acquisition opportunities to support our strategic global customers in emerging markets.
Our Business Segments
We report financial results on the basis of two reportable segments organized by geographic region: Americas and EMEA-APAC. Our Americas segment is comprised of operations located principally in the United States and Canada as well as in Puerto Rico, Mexico and select countries in Central and South America, including Costa Rica, Brazil, Argentina and Chile, and includes 62 facilities located in 8 countries. The EMEA-APAC segment is comprised of our operations located principally in Europe as well as in certain Asia-Pacific countries, and includes 105 facilities located in 26 countries.
The following table presents the percentage of net sales from each of our reportable segments:
| Year Ended December 31, | ||||||||||||
| Segment |
2014 | 2013 | 2012 | |||||||||
| Americas |
56 | % | 56 | % | 58 | % | ||||||
| EMEA-APAC |
44 | % | 44 | % | 42 | % | ||||||
|
|
|
|
|
|
|
|||||||
| Total |
100 | % | 100 | % | 100 | % | ||||||
|
|
|
|
|
|
|
|||||||
Both of our segments provide laboratory products, services and solutions to customers in the life science, general research and applied markets, including the Biopharma, agricultural, chemical, environmental, food and beverage, healthcare, microelectronic and petrochemical industries, as well as governmental agencies, universities, primary education and research institutes and environmental organizations. We also offer a similar portfolio of laboratory products and other supplies in both of our segments.
91
Table of Contents
We use operational data and management assumptions to estimate our product and customer mix as a percentage of consolidated net sales. The following charts present estimated net sales by product and customer group as a percentage of total net sales for the year ended December 31, 2014:
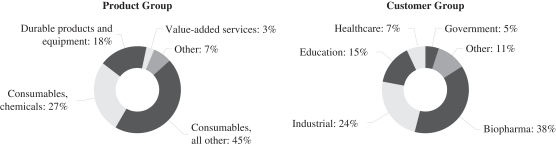
For more information about our reportable segments, see Note 23 to our annual consolidated financial statements incorporated by reference in this prospectus.
Americas Segment
Our Americas segment operates primarily in the United States and Canada as well as in Puerto Rico, Mexico and select countries in Central and South America, including Costa Rica, Brazil and Chile. Our infrastructure in the United States and Canada is comprised primarily of large, regional distribution centers that carry a comprehensive stock of inventory that allows us to optimize delivery times to customers in each region. In the United States and Canada, we have six central distribution centers, four regional distribution centers and one dedicated customer care center. Outside of the United States and Canada, our Americas segment operates one regional distribution center and six local distribution centers, each primarily serving the country in which they are located. We also have 16 manufacturing facilities located in the Americas. As of December 31, 2014, approximately 45% of our sales and sales support professionals were based in the Americas.
Our Americas segment recently completed a series of efforts to significantly upgrade its information technology infrastructure, optimized its distribution network within the United States and adopted a new sales and marketing strategy. All these initiatives were completed during 2012 and 2013, ultimately requiring approximately $70 million of capital investment, and caused some disruption to our business over that period.
Beginning in 2010, we began implementing a new enterprise resource planning (“ERP”) system to better support our customer segment-specific marketing and growing infrastructure. Our legacy North American systems were outdated, non-integrated and expensive to maintain and were not adequate to support the needs of our customers. We used our proven European legacy ERP system as the model for our development efforts. In parallel, we also developed a new, feature-rich e-commerce platform that we launched alongside our new ERP system within the United States in April 2012.
Commencing in 2011, we began construction of a new 500,000 square foot warehouse facility in central California to replace a leased facility that was located near San Francisco and did not have adequate capacity to support our operations throughout the Western region of the United States. This new warehouse, which became fully operational during the fourth quarter of 2012, is more centrally located in order to reduce our shipping costs and improve delivery time to customers throughout the Western region. This facility also enables efficient importation, storage and distribution of globally sourced private label products.
In January 2012, we shifted our North American regional GTM strategy to a customer segment-specific approach. This initiative involved a reallocation of certain accounts and restructuring of our sales coverage model in the field. During the second half of 2013, we further refined our sales force coverage to promote more direct
92
Table of Contents
customer contact and field coverage. We believe our current GTM strategy in North America has improved our focus and allows us to more proactively and effectively address the unique needs of our customers, consistent with the successful GTM strategy of our EMEA-APAC segment.
We have supplemented our recent capital investments in the Americas segment with a targeted acquisition strategy focused on establishing chemical manufacturing operations and expanding our portfolio of products and services. Specifically, we significantly enhanced our biochemical, buffer and reagent product offerings through the acquisitions of AMRESCO, United Biochemicals’ and National Biochemicals’ specialty chemical manufacturing and supply operations. We also expanded our portfolio of specialty products used in the precious metal mining industry through our acquisition of Anachemia, a manufacturer and distributor of laboratory products and materials used by industrial customers. Through the acquisitions of TEK and Metro Servicios we have expanded our clean room products and service offerings to industrial customers in the United States and Costa Rica. Through our acquisitions of bioprocessing single-use system integrators, Integra Companies, Inc., and STI Components, Inc., we have expanded our portfolio of product offerings to the life science and biopharmaceutical industries. We also expanded our portfolio of products sold to education customers through the acquisition of BioExpress. In addition, we established a presence in South America as a result of our acquisitions of the Sovereign Group, which operates in Brazil and Argentina.
Our recent operating results in the Americas segment, including improving U.S. sales performance and customer satisfaction and lower support costs for infrastructure, were positively impacted by these completed initiatives. In addition, we have improved our ability to rapidly integrate acquisitions as a result of the newly implemented ERP system in the Americas segment.
EMEA-APAC Segment
We are the largest provider of laboratory products, services and solutions in Europe, with the broadest Pan-European platform that has facilities in 20 European countries. Our European platform is complemented by our presence in China, India, Singapore, Malaysia, Australia and New Zealand. Our EMEA-APAC operations are served by central distribution centers in Germany, France and Belgium, with daily deliveries to smaller distribution centers throughout the regions we serve. In addition, we have manufacturing centers in France and Belgium, which provide chemical blending and down-packing services to support our EMEA-APAC distribution business. As of December 31, 2014, approximately 55% of our sales and sales support professionals were based in EMEA-APAC. Sales outside of Europe accounted for approximately 4% of total EMEA-APAC sales for the year ended December 31, 2014.
Our European operations benefit from a highly integrated and robust ERP system, efficient distribution infrastructure and customer segment-specific GTM strategy. For example, our European business has operated on a common, highly integrated ERP system for more than 12 years, enabling a reliable and efficient distribution model, and a customer segment-specific GTM strategy, including advanced and tailored marketing materials, which was implemented over the past several years. Our ERP system has also enabled us to rapidly integrate the operations of newly acquired companies. In July 2014, we launched our new, feature-rich e-commerce platform in EMEA-APAC, which we first introduced in the United States in April 2012.
We conduct our operations in Asia-Pacific primarily through facilities strategically located in Australia, New Zealand, Singapore, Malaysia, China and India. These operations are supported by 11 local distribution centers, including our 70,000 square foot distribution facility located in Singapore, and approximately 275 VWR professionals. Through our acquisition of basan GmbH in June 2012, we acquired manufacturing operations in Malaysia focused on the production of clean room garments.
We believe our laboratory products and service capabilities throughout Asia-Pacific are important for us to be able to meet the needs of our global customers. We are focused on increasing our sales of value-added
93
Table of Contents
services as these customers seek to ensure regulatory compliance and efficiency in their operations. In addition, we believe that our capabilities in this region will enable us to expand our supplier base by adding new product manufacturers located in this region that will gain access to our worldwide customer base.
We have made numerous “tuck-in” acquisitions over the last several years to strengthen our market position in select countries, as well as introduce new product lines and expand in certain regions to meet our expanding customer base. For example, we acquired PBI in Italy, Omnilabo in The Netherlands, Omnilab and LabConsult in Switzerland and Jencons and Lab 3 in the United Kingdom. Typically within 12 to 18 months we fully integrate these acquired companies’ distribution, ERP, and administrative functions into our existing European infrastructure while maintaining local sales and sales support staff. We expanded geographically in Asia-Pacific and Eastern Europe with several acquisitions such as LabPartner, based in Shanghai, China, and Labart in Poland. In addition, we expanded our product portfolio in this segment through selective acquisitions, such as basan, a distributor of products and services to clean room customers located throughout EMEA-APAC, Labonord, a distributor of cytology and histology products in Europe, and Hichrom, a manufacturer and distributor of chromatography columns and related products. These acquisitions enhance our ability to serve our large multinational customers.
We believe our Pan-European platform and acquisition strategy have increased our customer penetration and product offerings, which have collectively resulted in strong revenue growth and improved margins. Our strengthened market leadership position in Europe gives us the opportunity to continue to achieve strong financial results.
Products and Services
Our solutions provide value to our customers by offering one of the broadest portfolios of branded and private label laboratory products and value-added services, including custom manufacturing.
Branded and Private Label Laboratory Products
We provide value to our customers by offering one of the broadest portfolios of branded and private label laboratory products in our industry, including custom manufacturing. Our portfolio of branded products gives our customers access to some of the most recognized brands in the world. We enhance our customers’ choice by offering a lower cost, private label alternative to branded products. Private label laboratory products represented approximately 19% of our 2014 net sales. During 2014, we processed approximately 17,000 customer orders per day with an average order size of approximately $700. We distinguish between product types within our branded and private label laboratory products as consumable or durable.
Consumables
Many of our products, including chemicals, laboratory and production supplies and science education products, are consumable in nature. These products are basic and essential supplies required by research and quality control laboratories and are generally used on a recurring basis. In addition to our extensive selection of branded products, we offer a robust suite of private label offerings. Further, we offer custom manufactured chemicals, including buffers, reagents and other chemicals used in Biopharma and industrial applications and production process. Consumable products represented approximately 72% of our 2014 net sales.
94
Table of Contents
The table below summarizes key product lines of consumable products.
| Applications |
Representative Brands | |||||
| General laboratory supplies |
Utilized in the daily operations of labs spanning research and development, testing and measurement across multiple industries | • Corning (Gosselin, Pyrex) • Eppendorf • Thermo Fisher Scientific (Nalgene, Nunc) • VWR Private Label (glassware, metal, plasticware) |
• Pall Life Science • Greiner • Duran Group • Kimble Chase • GE Healthcare (Whatman) • Sartorius Filtration | |||
| Chemicals |
Chemical research and development, analytical testing, pharmaceutical production applications, microelectronic production and microbiological testing | • Merck Millipore • Honeywell (chemicals) • Avantor • Alfa Aeasar • Applichem • Lonza • Corning (Mediatech, Becton-Dickinson) |
• VWR brands: • AMRESCO • BDH • United Biochemicals • Private label reagents, solvents and salts • Custom manufactured private label | |||
| Production supplies |
Safety related products and products used in controlled environments, for example cleanrooms and the semiconductor industry | • Kimberly-Clark • Ansell • ITW Texwipe • Labcon • Contec • DuPont • Semperit |
• Nitritex • Uvex • 3M • Entegris • VWR Private Label (gloves, garments, shoe covers, goggles) | |||
| Life science supplies |
Biological research and development, quality assurance/quality control testing and Biopharma production applications, genomics, proteomics and cell cultures | • GE Healthcare (Life Science) • Qiagen (Quanta Biosciences, 5Prime) • Corning (Costar, Axygen, Cellgro) • Becton-Dickinson • Promega |
• Merck Millipore (Bioscience) • Lonza • Abnova • Rockland • Analytic Jena (UVP) • VWR Private label (tissue cultures, bioreagents) | |||
| Healthcare products |
Biological research and development, histology, pathology and sample preparation | • Corning (Cellgro) • Becton-Dickinson • Eppendorf • Danaher (Beckman Coulter, Leica) • Hettich |
• Thermo Fisher Scientific (Menzel) • Merck Millipore • Zeiss • VWR Private label (sample preparation) | |||
| Science Education |
Various educational- related products serving academic institutions, universities and Biopharma research centers | • Wards Natural Science • Sargent Welch • Vernier |
• Boreal • Ohaus | |||
95
Table of Contents
Durable Products and Equipment
We also offer durable products and scientific instruments with varying levels of complexity and sophistication. These products represented approximately 18% of our 2014 net sales. Key product lines include:
| Illustrative Products |
Representative Brands | |||||
| Equipment |
• Freezers • Centrifuges • Scales • Furnaces • Ovens • Incubators |
• Thermo Fisher Scientific (Revco, Kendro, Labsystems, Barnstedt) • Mettler Toledo • Danaher (Beckman, Leica) |
• Panasonic • Sartorius • Merck Millipore • VWR (private label) • Eppendorf | |||
| Instrumentation |
• Photometers • Microscopes • Chromatographers • Oxygen meters • Mass spectrometers |
• Hitachi • Thermo Fisher Scientific (Heraeus, Spectronic) • PerkinElmer • Danaher (Hach Lange) |
• Xylem (WTW, Schott Instr.) • Merck Millipore • Fungilab • VWR (private label) | |||
| Furniture |
• Desks • Chairs • Cabinets • Benches • Fume hoods |
• Kewaunee • Labconco • Dueperthal • Asecos • Koetterman • Waldner |
• Telstar (Cleanair) • Thermo Fisher Scientific • Airlab • Interstuhl • Bimos • Metro | |||
96
Table of Contents
Value-Added Services
We complement our branded and private label product portfolio with a number of customized value-added services, which we collectively have branded “VWRCATALYST.” In addition to our traditional service offerings such as procurement, logistics, chemical and equipment tracking and glassware autoclaving, we have expanded our service offerings to include more complex scientific research support services, such as DNA extraction, bioreactor servicing and compound management. This enables us to support a higher level of science on behalf of our customers, enabling them to focus on core areas of research.
| Description |
Service Solutions | |||
| Research Support |
• Onsite high level research and related services targeting workflow efficiency • Focus on quality • Enabled by VWR scientists including PhD level |
• DNA extraction • Bio reactor servicing • Cell bank management • Media and buffer preparation • Compound management • Aliquoting | ||
| Laboratory Services |
• Onsite services to ensure high quality execution of laboratory maintenance processes • Focus on execution • Enabled by VWR professionals |
• Lean lab design services • Equipment calibration • Chemical tracking • Housekeeping/waste management • Autoclaving • Glass wash • Garment management | ||
| Operations Services |
• Facility management related solutions • Focus on costs • Enabled by VWR professionals |
• Incubator and BioHub management • Sourcing and procurement • Order management • Logistics and inventory management • Point of use management | ||
History
The origins of our business date to 1852 in Sacramento, California when we initially sold glassware and laboratory supplies for mining markets. We first became a publicly-owned company in 1986 after a spin-off from Univar Corporation, and later we were acquired by Merck KGaA in 1999. In 2001, we expanded internationally into Europe to become a leader in the global laboratory products market when Merck KGaA combined our operations with those of its European scientific supplies distribution business under the name “VWR International Corporation.” In 2004, we were divested by Merck KGaA and acquired by a newly formed entity controlled by Clayton, Dubilier & Rice, Inc., a private equity firm, in a leveraged transaction.
On June 29, 2007, we were acquired by VWR Holdings, which is owned by private equity funds managed by our Sponsors and certain members of our management team. Under the stewardship of Madison Dearborn Partners, we have undertaken several initiatives, including: (i) enhancing our technological infrastructure through the implementation of an integrated enterprise resource planning system in North America and a global web infrastructure; (ii) upgrading our distribution network with the construction of a new facility in central California; (iii) augmenting the effectiveness of our North American sales force by shifting our marketing strategy to a customer segment-specific approach consistent with that of our EMEA-APAC segment; and (iv) implementing a targeted acquisition strategy that has resulted in our purchase and integration of 38 businesses.
97
Table of Contents
Recent Acquisitions
Since June 30, 2007, we have invested over $600 million to acquire and successfully integrate 38 businesses, which have broadened our product offerings, strengthened our existing market positions and expanded our geographic presence. The following table presents our acquisitions and their principal impact or purpose:
| New Product Areas |
Enhanced Market Positions | Geographic Expansion | ||||||||
| Product Category |
Acquisitions |
Country | Acquisitions | Region | Acquisitions | |||||
| Biochemicals and reagents |
• AMRESCO • UBI • NBC |
Denmark | • Bie & Berntsen • OneMed Lab |
Asia Central America |
• LabPartner • Metro Servicios | |||||
| Finland | ||||||||||
| Precious metal mining and lab analytic products |
• Anachemia • Hunter Refractories • KLEN • Iunge |
Italy Poland
Switzerland |
• PBI • Alfalab
• Omnilab • LabConsult |
South America Eastern Europe |
• Sovereign • Labart • Prolab • Spektrum • Vitrum | |||||
| • Sigma Pty |
The Netherlands | • Omnilabo | Oceania | • EBOS | ||||||
| Clean room products and laundry services |
• basan • TEK |
United Kingdom | • Jencons • Lab 3 • Basan UK |
|||||||
| Safety products |
• Trenka |
United States | • BioExpress • x-treme Geek |
|||||||
| Cytology and histology products |
• Labonord • Klinipath |
|||||||||
| Life science products |
• PeqLab • Seradigm |
|||||||||
| Single Use Fluid Handling |
• STI • Integra |
|||||||||
| Chromatography products |
• Hichrom |
|||||||||
For more information regarding our recent acquisitions, see Note 5 to our annual consolidated financial statements incorporated by reference in this prospectus.
Customers
We maintain a diverse and stable customer base. We provided solutions to approximately 120,000 customers in 2014, including over 230 Fortune 500 companies, approximately 5,000 leading academic institutions and thousands of smaller businesses in multiple industries. We centrally manage and actively collaborate with our largest global customers and provide them with value-added services, optimize the efficiency of their research, production and procurement activities and support them with dedicated on-site professionals and technicians. In addition, we manage relationships with our regional customers on a local basis, with a focus on their particular customer segment-specific needs. We estimate that we shipped products to approximately 290,000 unique customer sites in 2014.
98
Table of Contents
The following table below presents our percentage of net sales by customer segment for the year ended December 31, 2014:
| Year Ended December 31, 2014 |
||||
| Biopharma |
38 | % | ||
| Industrial |
24 | |||
| Education |
15 | |||
| Healthcare |
7 | |||
| Government |
5 | |||
| Other |
11 | |||
|
|
|
|||
| Total |
100 | % | ||
|
|
|
|||
We seek to be an important provider of laboratory products and services to our customer base. The substantial majority of our 50 largest customer relationships are governed by three- to five-year contracts that typically include pricing and volume incentives intended to position us as the primary provider of laboratory products and services.
We are a significant provider of laboratory products, chemicals, safety equipment and life science supplies to a majority of the world’s 20 largest pharmaceutical companies. In 2014, our top 20 customers accounted for approximately 20% of our net sales, with no single customer representing more than 4% of our net sales. As of December 31, 2014, our top ten customers have had relationships with us averaging more than 12 years.
Suppliers
We distribute branded and private label products sourced from approximately 4,500 core laboratory product suppliers located across the globe. This includes a majority of the leading developers and manufacturers of laboratory chemicals and reagents, glassware, plastics, instruments and other laboratory equipment, protective clothing and laboratory furniture, who sell through distributors. We believe we are an important product and solution provider for many of these manufacturers. Our suppliers rely upon our customer relationships, infrastructure, e-commerce capabilities and sales force to access the global market in a cost-effective manner. We believe our suppliers value the channel we provide, as we manufacture a limited number of products that compete with our suppliers’ portfolios.
We strive to maintain strong relationships with our largest suppliers, most of which have utilized our infrastructure for more than 20 years. Our top five suppliers in 2014 were Corning, Eppendorf, GE Healthcare, Merck KGaA and Thermo Fisher Scientific. Our largest supplier, Merck KGaA, supplied products to us that accounted for approximately 9% of our net sales in 2014. We benefit from our longstanding and strong relationship with Merck KGaA and its affiliates. Our business operated as a division of Merck KGaA from 1999 until we were acquired in the CD&R Acquisition in 2004. In connection with such disposition, Merck KGaA agreed to enter into a long-term, exclusive supply agreement with us primarily covering Western Europe, which had an initial five-year term that was subsequently extended for an additional five-year period. In April 2014, we began operating under new, non-exclusive supply agreements that extend through December 2018.
Our supplier relationships are based on contracts that vary in terms of geographic scope, duration, product and service type, with some relationships including exclusivity provisions. Depending on our relationships and agreements, our services to suppliers may include distribution, sales and marketing support as well as servicing of instruments and equipment. For example, we are the exclusive source and servicing provider for chromatography instruments manufactured by Hitachi High Technologies in Europe and the exclusive distributor of life science filtration products for Pall Corporation in North America and Europe. We also recently entered into a long-term distribution agreement with Thermo Fisher Scientific, a significant supplier to us even though it competes with us in the laboratory products market through its channel organization (Fisher Scientific).
99
Table of Contents
We manufacture a portion of our private label products, primarily lab and production chemicals, including buffers, reagents and other chemicals used in biopharmaceutical and industrial applications, and source the remainder from third-parties, including our established branded suppliers. We utilize a disciplined process to ensure the high quality of our private label products. Private label products provide our customers with a value-focused alternative to branded products and generally provide us higher margins.
We also collaborate with our suppliers on multiple sustainability programs addressing issues such as recycling and reduction of carbon footprint.
Although we do not believe that we are substantially dependent on any supplier or any group of suppliers, our operations could be adversely affected in the near term if we were to lose any of our significant suppliers or otherwise suffer a material reduction in their supply of products to us. See “Risk Factors—Risks Related to our Business—Our business, financial condition and results of operations depend upon maintaining our relationships with suppliers.”
Sales and Marketing
We reach customers through a well-trained global sales force, comprehensive websites and targeted catalogs. Our sales force is comprised of approximately 3,100 sales and sales support professionals, including approximately 280 sales specialists in areas such as life science, chromatography, production, chemicals and furniture, selected for their in-depth industry and product knowledge. Our sales professionals include native speakers for each of the countries in which we operate, allowing them to have high impact interactions with our customers across the globe.
Our e-commerce platform plays a vital role in how we conduct business with our customers. Over half of the orders that we process originate from our e-commerce platform, including our websites which feature our full product offering on a multi-language platform. Our websites utilize enhanced search analytics and feature personalized search tools, customer specific web solutions as well as enhanced data on over 2.1 million products, all of which allow us to optimize the online purchasing experience for our customers. Our customers make use of the rich functionality that our websites have to offer, many of which better integrate our customers’ processes with our own. The flexibility and scalability of our websites allow us to integrate acquisitions, drive geographical expansion and serve segmented market needs with relative ease.
We also provide printed literature including flyers, brochures, magazines and catalogs. Our general catalogs, which present the most comprehensive view of our product portfolio, are printed in over 20 languages and distributed worldwide. Our general catalogs are supplemented by specialty catalogs, as well as brochures, geared toward specific industries, applications and product lines. For example, we have developed “all you need” catalogs for industries such as brewing, dairy, life science and genomics. In addition, we produce several serial publications that engage our customers with informative articles and a focused product offering, timed to release during prime purchasing seasons.
Distribution Network, Facilities and Infrastructure
Our global infrastructure consists of over 160 facilities, which enables us to deliver a broad array of products to our customers generally within 24 to 48 hours. We have the broadest Pan-European platform, which enables us to reach customers throughout Europe with industry-leading efficiency and service levels. We operate a distribution network of over 4.5 million square feet of distribution space, consisting of strategically located distribution centers, various smaller regional service centers, and “just-in-time” facilities and customer contract centers for customer-specific requirements. Below is a summary of these facilities:
| • | our distribution centers receive products from manufacturers, manage inventory and fill and ship customer orders; |
100
Table of Contents
| • | our regional service centers are located near selected customer locations and are designed to supply a limited number of products to those customers that require a high level of service; |
| • | we also operate “just-in-time” facilities at or near customer sites to meet customer needs promptly; |
| • | customer contact centers have the responsibility for order entry and customer service; and |
| • | our two captive service centers employ more than 800 associates who provide commercial and administrative support services to us and our customers and suppliers. |
We also contract with third parties to ship products directly to our customers.
We maintain our corporate headquarters in Radnor, Pennsylvania for executive, financial, legal, information systems, marketing and other administrative activities. Our European executive, financial, legal, information systems, marketing and other administrative activities are in Darmstadt, Germany and Haasrode, Belgium.
The following table sets forth information with respect to our principal distribution and other office facilities as of March 31, 2015:
| Location |
Owned/Leased |
Size (sq. ft.) |
Type of Facility | |||
| Americas: |
||||||
| Batavia, Illinois |
Owned | 360,000 | Distribution | |||
| Bridgeport, New Jersey |
Owned | 369,475 | Distribution | |||
| Denver, Colorado |
Leased | 130,091 | Distribution | |||
| Franklin, Massachusetts |
Leased | 55,486 | Distribution | |||
| Lachine, Quebec, Canada |
Owned | 52,000 | Distribution, manufacturing and offices | |||
| Manati, Puerto Rico |
Owned | 130,450 | Distribution | |||
| Mexico City, Mexico |
Leased | 63,948 | Distribution | |||
| Mississauga, Ontario, Canada |
Leased | 110,194 | Distribution | |||
| Radnor, Pennsylvania |
Leased | 149,858 | Offices | |||
| Rochester, New York |
Owned | 339,600 | Distribution, assembly and offices | |||
| Solon, Ohio |
Leased | 175,815 | Distribution, manufacturing and offices | |||
| Sugar Land, Texas |
Leased | 62,280 | Distribution | |||
| Suwanee, Georgia |
Leased | 168,925 | Distribution | |||
| Tualatin, Oregon |
Leased | 56,400 | Distribution | |||
| Visalia, California |
Owned | 500,000 | Distribution | |||
| Wangara, Australia |
Leased | 63,261 | Distribution, manufacturing and offices | |||
| EMEA-APAC: |
||||||
| Briare, France |
Owned/Leased | 358,675 | Distribution, repackaging and mixing | |||
| Bruchsal, Germany |
Owned | 218,906 | Distribution | |||
| Damstadt, Germany |
Leased | 58,007 | Offices | |||
| Debrecen, Hungary |
Leased | 67,188 | Distribution, repackaging and mixing | |||
| Dublin, Ireland |
Leased | 77,067 | Distribution | |||
| Haasrode, Belgium |
Owned | 201,447 | Offices, distribution, repackaging and mixing | |||
| Karlskoga, Sweden |
Leased | 129,167 | Distribution | |||
| Kelsterbach, Germany |
Leased | 59,642 | Distribution | |||
| Llinars del Valles, Spain |
Leased | 72,955 | Distribution | |||
| Lutterworth, United Kingdom |
Leased | 183,205 | Distribution | |||
| Shanghai, China |
Leased | 31,000 | Distribution and offices | |||
| Singapore |
Leased | 74,034 | Distribution |
101
Table of Contents
We also lease various regional distribution centers and service facilities globally that support our sales and warehouse functions. Our facility located in Batavia, Illinois is subject to a mortgage lien under the Senior Credit Facility.
Technology
We have a highly automated ERP system that promotes standardization and simplicity. Our global web infrastructure provides seamless integration with our customers. Furthermore, our technology platforms support rapid development and deployment of enhancements so that we may quickly adapt to meet the technology needs of our customers and seamlessly integrate new acquisitions. We have recently made significant investments in our IT platform to implement a common ERP and e-commerce platform to enhance the customer experience. In 2014, over half of our orders were derived from e-commerce. We have more than 175,000 integrated e-commerce connections with our customers using www.vwr.com as their purchasing platform.
Our IT operating strategy is to act globally when possible and locally where necessary to strategically facilitate our business objectives and to develop a stable, growth oriented infrastructure and global informational system platform. Our IT infrastructure has evolved into a cohesive group of core global computing platforms. This development has reduced costs while improving our overall quality and delivering more value.
Our enhanced global technology infrastructure has allowed us to increase the value of our platform. Some of our recent initiatives include, virtual stock room management tools, allowing customers to manage and optimize on-site inventory, lot control and batch management, providing our production customers with a systematic view of batch managed and lot dependent products and enhanced business analytics. In 2013, we created an e-commerce center of excellence combining our technical web development team with our marketing services business team focused on improved e-commerce platform and commercialization.
Competition
We operate in a highly competitive environment with a diverse and fragmented base of competitors, many of whom focus on specific regions and market segments. Competitive factors in the customer segments we serve include service and delivery, breadth of product line, price, customer support, e-commerce capabilities and the ability to meet the special and local needs of our customers.
In our Americas segment within our laboratory products business, we compete primarily with Thermo Fisher Scientific and Sigma-Aldrich. The majority of our other competitors include laboratory equipment manufacturers, which sell direct to their customers, and smaller distributors that focus on specific geographies and product categories. With respect to our value-added services business, we compete with local service providers and life science companies, which offer laboratory management services to their clients, such as Thermo Fisher Scientific, PerkinElmer and Agilent Technologies and other service outsourcing companies.
In our EMEA-APAC segment within our laboratory products business, we have the broadest Pan-European platform, which provides us with an important competitive advantage. We principally compete with Thermo Fisher Scientific for certain global customers, Sigma-Aldrich in chemicals and reagents, and certain regional competitors, including Geyer and Omnilab in Germany and Dutscher in France and Switzerland in specific product categories. With respect to our valued-added services business, we predominantly compete with small businesses operating on a regional basis.
We believe our competitive strengths position us well in our customer segments and in the geographies we serve. We rely on our scale, market position, customer access, depth of product and value-added service offerings, marketing strategies and sales force, acquisition strategy, financial profile and management team to deliver superior solutions to our customers and provide extensive market channel access to our suppliers.
102
Table of Contents
Employees
As of December 31, 2014, we had approximately 8,800 employees, including approximately 3,900 in North America, 3,600 in Europe, 1,100 in Asia-Pacific (including over 800 employees in our shared service centers) and 200 in Central and South America. Of these employees, approximately 3,100 employees (or approximately 35% of our global workforce) are in customer facing roles. As of December 31, 2014, approximately 5% of our employees in North America were represented by unions, and virtually all of our employees in Europe are represented by workers’ councils and/or unions. We believe our relations with our employees are good.
Trademarks and Tradenames
We believe the VWR tradename is well recognized in the global laboratory products market and by scientists and is therefore a valuable asset to us. We use a number of different registered and unregistered trademarks and service marks for our products and services, substantially all of which are owned by us. However, we have not registered all of our trademarks or service marks in each country in which we do business. Generally, registered trademarks have perpetual lives, provided that they are renewed on a timely basis and continue to be used properly as trademarks, subject only to the rights of third parties to seek cancellation of the marks.
Our business is not dependent to a material degree on patents, copyrights or trade secrets although we consider our catalogs, websites and proprietary software integral to our operations. Although we believe we have adequate policies and procedures in place to protect our intellectual property, we have not sought patent protection for our processes nor have we registered the copyrights in any of our catalogs, websites or proprietary software. Other than licenses to commercially available third-party software, we have no licenses to intellectual property that are significant to our business.
Government Regulation
Some of the products we offer and our operations are subject to a number of complex and stringent laws and regulations governing the production, storage, handling, transportation, import, export and distribution of chemicals, drugs and other similar products, including the operating and security standards of the United States Drug Enforcement Administration, the Alcohol and Tobacco Tax and Trade Bureau, the Food and Drug Administration, the Bureau of Industry and Security and various state boards of pharmacy as well as comparable state and foreign agencies. In addition, our operational activities must comply with the rules and regulations of the Department of Transportation, the Federal Aviation Administration and similar foreign agencies. We are also required to abide by the anti-corruption and anti-bribery laws of all countries in which we operate, including the FCPA. While we believe we are in compliance in all material respects with such laws and regulations, any non-compliance could result in substantial fines, penalties or assessments or otherwise restrict our ability to provide competitive distribution services and thereby have an adverse impact on our financial condition.
Environmental, Health and Safety Matters
We are subject to a broad range of foreign, federal, state and local environmental, health and safety laws and regulations, including those pertaining to air emissions, water discharges, the manufacturing, handling, disposal and transport of solid and hazardous materials and wastes, the investigation and remediation of contamination and otherwise relating to health and safety and the protection of the environment and natural resources. As our global operations have involved and continue to involve the manufacturing, handling, transport and distribution of materials that are, or could be, classified as toxic or hazardous, there is a risk of contamination and environmental damage inherent in our operations and the products we manufacture, handle, transport and distribute. Our environmental, health and safety liabilities and obligations may result in significant capital expenditures and other costs, which could negatively impact our business, financial condition and results of operations. We may be fined or penalized by regulators for failing to comply with environmental, health and
103
Table of Contents
safety laws and regulations. In addition, contamination resulting from our current or past operations may trigger investigation or remediation obligations, which may have a material adverse effect on our business, financial condition and results of operations.
Based on current information, we believe that any costs we may incur relating to environmental, health and safety matters will not be material. We cannot be certain, however, that identification of presently unidentified environmental, health and safety conditions, new regulations, more vigorous enforcement by regulatory authorities or other unanticipated events will not arise in the future and give rise to additional environmental liabilities, business interruptions, compliance costs or penalties which could have a material adverse effect on our business, financial condition and results of operations. In addition, environmental laws and regulations are constantly evolving and it is not possible to predict accurately the effect they, or any new regulations or legislation, may have in future periods.
Insurance
We maintain commercial insurance programs with third parties in the areas of executive risk, commercial property, business interruption and casualty (including product liability). We also self-insure certain risks inherent in our business which, taken together with the deductible levels and exclusions contained within our third-party programs, results in our recording of accruals for incurred claims. Our ultimate exposure may be mitigated by amounts we expect to recover from third parties associated with such claims.
Legal Proceedings
For information regarding legal proceedings and matters, see Note 11 to our annual consolidated financial statements incorporated by reference in this prospectus.
104
Table of Contents
Directors and Executive Officers
The following chart sets forth certain information regarding our directors and executive officers as of May 21, 2015:
| Name |
Age | Position | ||||
| Manuel Brocke-Benz |
57 | Director, President and Chief Executive Officer | ||||
| Gregory L. Cowan |
61 | Senior Vice President and Chief Financial Officer | ||||
| Mark T. McLoughlin |
59 | Senior Vice President and President, Americas Lab and Distribution Services | ||||
| Peter Schuele |
57 | Senior Vice President and President, EMEA-APAC Lab and Distribution Services | ||||
| George Van Kula |
51 | Senior Vice President, Human Resources, General Counsel and Secretary | ||||
| Theodore C. Pulkownik |
57 | Senior Vice President, Strategy and Corporate Development | ||||
| Gerard J. Christian |
46 | Senior Vice President and Chief Information Officer | ||||
| Stephan W. Labonté |
55 | Senior Vice President, Marketing | ||||
| Ulf Kepper |
49 | Senior Vice President, VWR Services | ||||
| Douglas J. Pitts |
56 | Vice President and Corporate Controller | ||||
| Harry M. Jansen Kraemer, Jr. |
60 | Chairman of the Board | ||||
| Nicholas W. Alexos |
51 | Director | ||||
| Robert L. Barchi |
68 | Director | ||||
| Edward A. Blechschmidt |
62 | Director | ||||
| Thompson Dean |
57 | Director | ||||
| Robert P. DeCresce |
65 | Director | ||||
| Pamela Forbes Lieberman |
61 | Director | ||||
| Carlos del Salto |
72 | Director | ||||
| Timothy P. Sullivan |
57 | Director | ||||
| Robert J. Zollars |
58 | Director | ||||
Manuel Brocke-Benz was named our President and Chief Executive Officer on January 3, 2013. From July 25, 2012 to January 3, 2013, Mr. Brocke-Benz served as our interim Chief Executive Officer, while also serving as the Senior Vice President and Managing Director of Europe, Lab and Distribution Services, a position he held since January 2006. Mr. Brocke-Benz was elected to the Board in September 2012 and currently is the Chair of the Finance Committee. Mr. Brocke-Benz initially joined the Company in 1987. Mr. Brocke-Benz earned a law degree from Albert-Ludwigs University in Freiburg, Germany. Mr. Brocke-Benz’s leadership role and more than 20 years of service with us in a variety of senior-level positions, together with his extensive knowledge of our business, strategy and industry on an international basis and his training as a lawyer make him a valuable member of the Board.
Gregory L. Cowan is our Senior Vice President and Chief Financial Officer, a position he has held since June 2009. In his current role, Mr. Cowan is responsible for our financial operations on a global basis and for overseeing our Investor Relations activities. Prior to assuming his current position, Mr. Cowan served as our Vice President and Corporate Controller since December 2004. Since joining us, Mr. Cowan has overseen compliance efforts, the development of global policies and procedures, as well as internal and external reporting processes. He has also been directly involved in various strategic projects involving commercial activities and changes to systems and infrastructure. In the past five years, Mr. Cowan also served as a Director of Emtec, Inc. Mr. Cowan earned a B.A. in accounting from Rutgers University.
Mark T. McLoughlin is our Senior Vice President and President, Americas Lab and Distribution Services, a position he has held since November 2014. In his current role, Mr. McLoughlin leads all sales, marketing,
105
Table of Contents
services and operations for our business in the United States, Canada, Mexico and Puerto Rico. Prior to assuming his current position, Mr. McLoughlin served as our Senior Vice President and President, U.S. Lab and Distribution Services from July 2012 to November 2012 and as Senior Vice President of Category Management and Senior Vice President of Emerging Businesses after joining the Company in September 2008. Mr. McLoughlin is currently a member of the Board of Directors at Cytomedix, Inc. and serves on the Board of Advisors for the Center for Services Leadership, W.P. Carey School of Business at Arizona State University. Mr. McLoughlin earned a B.A. in psychology from the University of Arizona.
Peter Schuele is our Senior Vice President and President, EMEA-APAC Lab and Distribution Services. Mr. Schuele has served as our Senior Vice President, Europe Lab and Distribution Services since June 2013, and in January 2014, was given additional responsibility for our Asia-Pacific business. In his current role, Mr. Schuele is responsible for our sales, marketing, services and operations for the European and Asia-Pacific business. Prior to joining us in 2013, Mr. Schuele served as the vice president supply chain for Europe, the Middle East and Africa for Sigma-Aldrich Corporation. Mr. Schuele earned an M.B.A. from Heilbronn University in Heilbronn, Germany.
George Van Kula is our Senior Vice President, Human Resources, General Counsel and Secretary. Mr. Van Kula has served as Senior Vice President, General Counsel and Secretary since May 2006, and in March 2013, Mr. Van Kula was given additional responsibility for our Human Resources organization. Mr. Van Kula earned a J.D. from the University of Michigan Law School and a B.A. from the University of Notre Dame.
Theodore C. Pulkownik is our Senior Vice President, Strategy and Corporate Development, a position he has held since July 2004. Mr. Pulkownik’s responsibilities include global mergers and acquisitions, corporate-center led initiatives and strategy and several of our businesses in the Americas, including Central and South America, global mining, North America Export and our serum business. Mr. Pulkownik earned a B.A. in business administration from the University of Wisconsin and an M.B.A. from the University of Michigan.
Gerard J. Christian is our Senior Vice President and Chief Information Officer, a position he has held since August 2012. In this role, Mr. Christian is responsible for our global information services, including the management of business unit and corporate shared application services, business continuity, infrastructure and operations, and information security and risk management. From January 2011 until August 2012, Mr. Christian served as Vice President of Shared Services as well as Vice President, Pricing and Contract Administration and from March 2007 until December 2010, as Vice President and Country Manager for VWR Ireland. Mr. Christian earned a B.S. in accounting from Canisius College and an M.B.A. from the University of Buffalo, with a concentration in finance.
Stephan W. Labonté is our Senior Vice President, Marketing, a position he has held since October 2012. In his current role, Mr. Labonté is responsible for our supplier relationships, marketing and category management functions on a global basis and the customer segment teams in Europe. Mr. Labonté joined us in 1995. Prior to his current role, Mr. Labonté served as Senior Vice President of EU Marketing from February 2009 to September 2012. Mr. Labonté earned an M.S. in biology from Johann Goethe University in Frankfurt, Germany.
Ulf Kepper is our Senior Vice President for VWR Services, a position he has held since June 2014. In his current role, Mr. Kepper is responsible for our global service offerings under the VWRCATALYST brand including onsite services to support our customer’s operations. Prior to this role, Mr. Kepper served as Vice President for Global Marketing Services responsible for product data management, marketing communications and e-business. Mr. Kepper earned degrees in computer science and economics from the University of Darmstadt in Darmstadt, Germany.
Douglas J. Pitts is our Vice President and Corporate Controller, a position he has held since July 2013. In his current role, Mr. Pitts is responsible for our internal and external reporting, as well as managing our system of
106
Table of Contents
internal controls. Prior to this role, Mr. Pitts served as Vice President, Internal Audit from 2011 to June 2013 and Vice President and Assistant Corporate Controller from 2007 to 2010. Mr. Pitts earned a B.S. from the University of Illinois. Mr. Pitts is also a Certified Public Accountant.
Harry M. Jansen Kraemer, Jr. has served as our Chairman of the Board since July 2012 and has served on the Board since June 2007. He currently is a member of the Nominating and Governance Committee. Mr. Kraemer is an Executive Partner of Madison Dearborn Partners, LLC, a private equity investment firm based in Chicago, Illinois. Prior to joining Madison Dearborn Partners in 2005, he was the chairman and chief executive officer of Baxter International Inc., a global healthcare company, until April 2004. Mr. Kraemer had been a director of Baxter International since 1995, chairman of the board since 2000, president since 1997 and chief executive officer since 1999. Mr. Kraemer now serves as clinical professor of management and strategy at the J.L. Kellogg School of Management at Northwestern University. Mr. Kraemer currently serves on the Boards of Directors of Leidos Holdings, Inc. (formerly SAIC, Inc.), where he is the chairman of the Audit Committee, Catamaran Corp., Sage Products, LLC, Sirona Dental Systems, Inc. and Ikaria, Inc.; on the Board of Trustees of Northwestern University and Lawrence University; on the Dean’s Advisory Board of the J.L. Kellogg School of Management; and on the board of trustees of The Conference Board. Mr. Kraemer earned a B.A. in mathematics and economics from Lawrence University and an M.B.A. from Northwestern University’s J.L. Kellogg School of Management. Mr. Kraemer’s prior long-term, senior level experience at a major global healthcare company, including serving as chairman and chief executive officer, and his expertise in financial accounting, international business transactions and strategy, along with his independence, make him a valuable member of the Board.
Nicholas W. Alexos has served on our Board since June 2007 and currently is the Chair of the Audit Committee, as well as a member of the Finance Committee. Mr. Alexos is a Managing Director of Madison Dearborn Partners, LLC, a private equity investment firm based in Chicago, Illinois. Prior to co-founding Madison Dearborn Partners in 1992, he was with First Chicago Venture Capital for four years. Prior to that position, Mr. Alexos was with The First National Bank of Chicago. He concentrates on investments in the healthcare sector and currently also serves on the Boards of Directors of Ikaria, Inc. and Sage Products, LLC. In addition, Mr. Alexos serves on the Board of Trustees of the Lake Forest Country Day School, Children’s Inner City Educational Fund and the Council on Chicago Booth. In the past five years, Mr. Alexos also served as a Director of Sirona Dental Systems, Inc. Mr. Alexos earned a B.A. in business administration from Loyola University and an M.B.A. from the University of Chicago. Mr. Alexos’ senior management experience as a Managing Director of Madison Dearborn Partners, board and advisory experience with other companies in the healthcare industry and his extensive experience in the areas of finance, financial accounting (including qualification as an audit committee financial expert), international business transactions and mergers and acquisitions, along with his independence, make him a valuable member of the Board.
Robert L. Barchi, M.D., Ph.D., served on the Board from May 2006 until we were acquired in June 2007 by affiliates of Madison Dearborn Partners, LLC. He rejoined the Board in September 2007 and currently is a member of the Compensation Committee. Dr. Barchi has been President of Rutgers, The State University of New Jersey, since 2012. Dr. Barchi served as President of Thomas Jefferson University from 2004 to 2008. Prior to that, he was Provost of the University of Pennsylvania, having served in various capacities at that institution for more than 30 years. He was Chair of the University of Pennsylvania’s Department of Neurology and founding Chair of its Department of Neuroscience. Dr. Barchi also served as the Director of the Mahoney Institute of Neurological Sciences for more than 12 years. In addition to his clinical and administrative responsibilities, he has been published extensively in the field of ion channel research, and has been elected to membership in the Institute of Medicine of the National Academy of Sciences. Dr. Barchi is a member of the Board of Covance, Inc. He earned a B.S. and an M.S. from Georgetown University, as well as a Ph.D. and an M.D. from the University of Pennsylvania. Dr. Barchi’s senior leadership experience within the healthcare industry, as both the President of a major healthcare organization and as a Board member of a drug development services company, along with his independence, make him a valuable member of the Board.
107
Table of Contents
Edward A. Blechschmidt has served on our Board since September 2007. Mr. Blechschmidt is a retired corporate executive, having served in a variety of executive roles. He was chief executive officer of Novelis Corp. from 2006 until its sale to the Aditya Birla Group in 2007. Mr. Blechschmidt was chairman, chief executive officer and president of Gentiva Health Services, Inc., a leading provider of specialty pharmaceutical and home health care services, from 2000 to 2002. From 1999 to 2000, Mr. Blechschmidt served as chief executive officer and a director of Olsten Corporation, the conglomerate from which Gentiva Health Services was split off and taken public. He served as president of Olsten Corporation from 1998 to 1999. Mr. Blechschmidt also served as president and chief executive officer of Siemens Nixdorf America and Siemens Pyramid Technologies from 1996 to 1998. Prior to Siemens, he spent more than 20 years with Unisys Corporation, including serving as its chief financial officer. Mr. Blechschmidt serves as a member of the board of directors of Lionbridge Technologies, Inc. and Diamond Foods. In addition, he served on the board of directors of Healthsouth Corp. from 2004 to 2012 and Columbia Laboratories from 2004 to 2014. He earned a B.S. in business administration from Arizona State University and is a National Association of Corporate Directors (NACD) Board Leadership Fellow. Mr. Blechschmidt’s senior leadership experience, including as chief executive officer and chief financial officer, current and past experience as a board member at other companies, and his experience in finance, strategy and financial accounting (including qualification as an audit committee financial expert), along with his independence, make him a valuable member of the Board.
Thompson Dean has served on the Board since September 2007 and currently is a member of the Compensation Committee. Mr. Dean is a Co-Managing Partner and Co-Chief Executive Officer of Avista Capital Partners, L.P., a private equity firm based in New York. Prior to co-founding Avista Capital Partners in 2005, Mr. Dean led DLJ Merchant Banking Partners, for ten years. Mr. Dean has served as Co-Managing Partner of DLJMB since 1995 and was Chairman of the Investment Committees of DLJMB I, DLJMB II, DLJMB III and DLJ Growth Capital Partners through December 2007. Mr. Dean received a B.A. from the University of Virginia in 1979, where he was an Echols Scholar and an M.B.A. with high distinction from Harvard Business School in 1984, where he was a Baker Scholar. Mr. Dean currently serves on the Boards of Acino, ConvaTec, IWCO Direct Holdings, Sidewinder Drilling and Zest Anchors. Mr. Dean formerly served as the chairman of the board of Nycomed, Arcade, DeCrane Aircraft, Mueller and Von Hoffmann. He also formerly served on the boards of American Ref-Fuel, Argyle Television, BioPartners, Charles River Labs, Evergreen Media, Merrill, Safilo and Visant, among others. Mr. Dean is a trustee of Choate Rosemary Hall and The Eaglebrook School. He is Former chairman of the Special Projects Committee of Memorial Sloan Kettering Hospital and served as a member of the College Foundation Board of the University of Virginia. In addition, he serves on various committees of the Boys Club of New York, the Lenox Hill Neighborhood Association and the Museum of the City of New York. Mr. Dean’s executive level management experience at Avista, board and advisory experience with other companies in and outside of the healthcare industry, and his extensive experience in the areas of finance, strategy, international business transactions and mergers and acquisitions, along with his independence, make him a valuable member of the Board.
Robert P. DeCresce, M.D., has served on the Board since September 2007 and currently is a member of the Compensation Committee. Dr. DeCresce is the Harriet B. Borland Professor and Chair of the Department of Pathology at Rush Medical College in Chicago, Illinois. He also currently serves as Associate Vice President for Ancillary Services, is a member of the Board of Trustees and serves as a member of the Executive Committee of the Board of Trustees at Rush University Medical Center. Prior to joining Rush Medical in 1991, he served at Michael Reese Hospital and MetPath Laboratories, also in Chicago, Illinois. In the past five years, Dr. DeCresce served on the Board of PathLab, Inc. In addition, he has served as a consultant to a number of in-vitro diagnostic companies over the past 20 years. He earned a B.S. from Boston College, as well as an M.D., M.P.H., and an M.B.A. from Columbia University. Dr. DeCresce’s senior leadership experience at a medical college and past board member and current consulting experience to companies within the healthcare industry, along with his independence, make him a valuable member of the Board.
108
Table of Contents
Pamela Forbes Lieberman has served on the Board since January 2009 and currently is a member of the Audit Committee. Ms. Forbes Lieberman has served in a variety of executive roles. From March 2006 to August 2006, she served as interim Chief Operating Officer of Entertainment Resource, Inc., which was a distribution business in the entertainment industry. Ms. Forbes Lieberman served as president, chief executive officer and a Board member of TruServ Corporation (now known as True Value Company), a member-owned hardware cooperative, from November 2001 to November 2004, as TruServ’s chief operating officer and chief financial officer from July 2001 through November 2001, and as TruServ’s chief financial officer from March 2001 through July 2001. Prior to March 2001, she held chief financial officer positions at ShopTalk Inc., The Martin-Brower Company, L.L.C. and Fel-Pro Inc., as well as financial leadership positions at Kraft Foods, Inc. and Bunzl Building Supply Inc. Ms. Forbes Lieberman currently serves on the Board of Directors of A.M. Castle & Co., where she is chair of the Audit Committee, Standard Motor Products, Inc., where she is a member of the Audit Committee, the Compensation and Management Development Committee and the Nominating and Corporate Governance Committee and is co-chair of the Strategy Committee, Tempel Steel, and Kreher Steel Company; and the advisory board of privately-held HAVI Group, LP. In addition, Ms. Forbes Lieberman serves on the Board of Trustees at Rush University Medical Center. Ms. Forbes Lieberman earned an M.B.A. from Northwestern University J.L. Kellogg School of Management and a B.S. in accounting from the University of Illinois, Champaign. Ms. Forbes Lieberman, a Certified Public Accountant began her career at PricewaterhouseCoopers LLP. Ms. Forbes Lieberman’s senior leadership experience at several distribution and manufacturing companies, including as chief executive officer, chief financial officer and board member, her expertise in finance and financial accounting (including qualification as an audit committee financial expert), as well as her expertise in culture and communications, along with her independence, make her a valuable member of the Board.
Carlos del Salto has served on the Board since September 2007 and currently is a member of the Audit Committee. Mr. del Salto retired from Baxter Healthcare Corporation in March 2006, where he was the Senior Vice President responsible for Baxter’s Intercontinental and Asia-Pacific operations. He had been with Baxter Healthcare Corporation since 1973 and held numerous positions, including president of Baxter Healthcare Corporation’s Global Renal business, president of Baxter Latin America/Switzerland/Austria and general manager of Mexico. Mr. del Salto serves on the Advisory Board of Directors of Andean Health and Development. In addition, he is founder and president of the Natividad de los Andes Foundation in Ecuador. He earned a B.A. in accounting from Juan de Velasco College in Ecuador and an M.B.A., with a concentration in finance, from Roosevelt University in Chicago, Illinois. Mr. del Salto’s prior senior level experience at a major global healthcare company, including in capacities leading Central and South American and Asia-Pacific operations, his expertise in financial accounting (including qualification as an audit committee financial expert) and strategy in international markets, along with his independence, make him a valuable member of the Board.
Timothy P. Sullivan has served on the Board since June 2007 and currently is the Chair of the Compensation Committee and Nominating and Governance Committee, as well as a member of the Finance Committee. Mr. Sullivan is a Managing Director of Madison Dearborn Partners, LLC, a private equity investment firm based in Chicago, Illinois. Prior to co-founding Madison Dearborn Partners in 1992, Mr. Sullivan was with First Chicago Venture Capital for four years after having served in the U.S. Navy. Mr. Sullivan concentrates on investments in the healthcare sector and currently also serves on the Board of Directors of Ikaria, Inc., Sage Products, LLC and Sirona Dental Systems, Inc. In addition, he is on the Board of Trustees of Northwestern University, Northwestern Memorial Hospital, the United States Naval Academy Foundation, Loyola Academy and Northlight Theatre. He also serves on the investment committee of the Archdiocese of Chicago and the Cristo Rey Jesuit High School. Mr. Sullivan earned a B.S. from the United States Naval Academy, an M.S. from the University of Southern California and an M.B.A. from the Stanford University Graduate School of Business. Mr. Sullivan’s senior management experience as a Managing Director of Madison Dearborn Partners, board and advisory experience with other companies in the healthcare industry, and his extensive experience in the areas of finance, strategy, international business transactions and mergers and acquisitions, along with his independence, make him a valuable member of the Board.
109
Table of Contents
Robert J. Zollars served on the Board from May 2006 until we were acquired in June 2007 by affiliates of Madison Dearborn Partners, LLC. He rejoined the Board in September 2007 and currently is a member of the Compensation Committee and the Nominating and Governance Committee. Mr. Zollars served as the executive chairman of Vocera Communications, Inc., a wireless communications systems company, from June 2013 until June 2014. Mr. Zollars also served as the Chairman and Chief Executive Officer of Vocera Communications from June 2007 until June 2013. Prior to Vocera Communications, he served as the president and chief executive officer and a Director of Wound Care Solutions, LLC, a private equity backed business serving the chronic wound care segment of healthcare, from June 2006 through April 2007. From June 1999 until March 2006, Mr. Zollars was the chairman and CEO of Neoforma, Inc., a healthcare technology company, focusing on supply chain. Prior to joining Neoforma, he was the executive vice president and group president of Cardinal Health, Inc., where he was responsible for five subsidiaries. From 1992 until 1996, Mr. Zollars was the president of the Hospital Supply and Scientific Product distribution businesses at Baxter International Inc. Mr. Zollars currently serves as Chairman of the Boards of Directors of Vocera Communications and Diamond Foods, Inc. and as a Director at Five9, Inc. In the past five years, Mr. Zollars served on the Boards of Silk Road Technology Inc. and InterAct911 Corporation. He earned a B.S. from Arizona State University and an M.B.A. from John F. Kennedy University. Mr. Zollars’ experience as a chief executive officer, extensive senior management experience in various positions within the healthcare industry, and board member experience at other companies, along with his independence, make him a valuable member of the Board.
Family Relationships
There are no family relationships between any of our executive officers and directors.
Controlled Company
We are a “controlled company” under the NASDAQ listing rules because more than 50% of our outstanding voting power is held by VWR Holdings. See “Principal and Selling Stockholders.” As a result, we may rely upon the “controlled company” exception to the board of directors and committee independence requirements under such stock exchange. Pursuant to this exception, we are exempt from the rules that would otherwise require that our board of directors consist of a majority of independent directors and that its compensation committee and nominating and governance committee be composed entirely of independent directors. The “controlled company” exception does not modify the independence requirements for the audit committee, and we intend to comply with the requirements of Rule 10A-3 of the Exchange Act and Section 3 of the Sarbanes-Oxley Act and the corporate governance standards of NASDAQ, which require that our audit committee consist exclusively of independent directors within one year of our IPO.
While relying on the “controlled company” exception, the Board assesses at least annually the independence of directors and determines which members are independent. Our board of directors has affirmatively determined that each of Ms. Forbes Lieberman and Messrs. Kraemer, Alexos, Barchi, Blechschmidt, Dean, DeCresce, del Salto, Sullivan, and Zollars meets the definition of “independent director” under applicable SEC and NASDAQ listing rules.
Composition of the Board
Our business and affairs are managed under the direction of the Board, which we refer to as the Board. Currently, the Board is composed of 11 directors, none of whom, with the exception of Mr. Brocke-Benz, is an executive officer of the Company. Vacancies on the Board can be filled by resolution of the Board. The Board is divided into three classes, each serving staggered, three-year terms:
| • | Our Class I directors are Nicholas W. Alexos, Robert P. DeCresce and Carlos del Salto, and their terms expire at the 2018 annual meeting of stockholders; |
110
Table of Contents
| • | Our Class II directors are Timothy P. Sullivan, Edward A. Blechschmidt, Thompson Dean and Robert L. Barchi, and their terms expire at the 2016 annual meeting of stockholders; and |
| • | Our Class III directors are Harry M. Jansen Kraemer, Jr., Manuel Brocke-Benz, Pamela Forbes Lieberman and Robert J. Zollars, and their terms expire at the 2017 annual meeting of stockholders. |
As a result, only one class of directors will be elected at each annual meeting of stockholders, with the other classes continuing for the remainder of their respective terms.
Board Committees
There are four standing committees of the Board. The Board has adopted written charters for each committee, which are available on our website at investor.vwr.com under “Corporate Governance—Charters.” The information on our website is not part of or incorporated into this prospectus.
Each of the Audit, Compensation, and Nominating and Governance Committees consists solely of directors who have been determined by the Board of Directors to be independent in accordance with SEC regulations, NASDAQ listing rules and the Company’s director independence standards (including the heightened independence standards for members of the Audit and Compensation Committees), except for Mr. Alexos, who does not meet the heightened independence standards for service on the Audit Committee because he is a director of VWR Holdings, our largest stockholder. Given the transition period allowances for companies meeting the “controlled company” exemption, Mr. Alexos may continue to serve on our Audit Committee until October 1, 2015.
Audit Committee
The Audit Committee is responsible for, among other matters:
| • | appointing, compensating, retaining, overseeing and terminating our independent registered public accounting firm; |
| • | reviewing our independent registered public accounting firm independence from management; |
| • | reviewing with our independent registered public accounting firm the scope of their audit; |
| • | approving all audit and permissible non-audit services to be performed by our independent registered public accounting firm; |
| • | overseeing the financial reporting process and discussing with management and our independent registered public accounting firm the interim and annual consolidated financial statements that we file with the SEC; |
| • | reviewing and monitoring our accounting principles, accounting policies, financial reporting processes and controls and compliance with applicable legal and regulatory requirements; |
| • | establishing procedures for the confidential anonymous submission of concerns regarding questionable accounting, financial reporting, internal controls or auditing matters; and |
| • | maintaining our compliance with legal and regulatory requirements and our Code of Ethics and Conduct (the “Code of Conduct”). |
Each member of the Audit Committee is financially literate, and the Board of Directors has determined that each member qualifies as an “audit committee financial expert” under applicable SEC rules. No committee member currently sits on more than two other public company’s audit committees.
111
Table of Contents
Compensation Committee
Our Compensation Committee is responsible for, among other matters:
| • | reviewing and recommending to our Board of Directors the compensation of our chief executive officer; |
| • | reviewing and approving the compensation of other executive officers; |
| • | reviewing and approving equity compensation, employment agreements and other similar arrangements between us and our executive officers; |
| • | reviewing the performance of our chief executive officer; |
| • | reviewing and approving our stock plans and other incentive compensation plans; and |
| • | reviewing trends in management compensation. |
For more information on the responsibilities and activities of the committee, including its processes for determining executive compensation, see the “Executive Compensation—Compensation Discussion and Analysis” section of our Definitive Proxy Statement on Schedule 14A for the 2015 annual meeting of stockholders, which is incorporated by reference herein.
Nominating and Governance Committee
Our Nominating and Governance Committee is responsible for, among other matters:
| • | identifying individuals qualified to become members of the Board and considering stockholder nominations for membership to the Board, consistent with criteria approved by the Board; |
| • | overseeing the organization of the Board to discharge the Board’s duties and responsibilities properly and efficiently; |
| • | identifying best practices and recommending corporate governance principles; |
| • | developing and recommending to the Board a set of corporate governance guidelines and principles applicable to us; |
| • | reviewing our Code of Conduct and our insider trading policy; |
| • | reviewing and approving related party transactions; and |
| • | reviewing and approving the compensation of our directors. |
Finance Committee
Our Finance Committee is responsible for, among other matters:
| • | reviewing our long-term business direction and goals and the strategy for maintaining that direction and achieving those goals; |
| • | reviewing with management and recommending to the Board overall financial plans, including capital expenditures, acquisitions and divestitures, securities issuances and incurrences of debt; and |
| • | approving certain financial commitments and acquisitions and divestitures by us up to specified levels. |
112
Table of Contents
Compensation Committee Interlocks and Insider Participation
Messrs. Sullivan (Chairman), Barchi, Dean, DeCresce and Zollars are the members of our Compensation Committee, and none of them is or has been our officer or employee. Mr. Sullivan is a Managing Director of Madison Dearborn Partners, which controls the Company. For a description of the transactions between us and Madison Dearborn Partners, see “Certain Relationships and Related Transactions.” Apart from this relationship, no member of the Compensation Committee has any relationship that would be required to be reported under Item 404 of Regulation S-K. No member of the Compensation Committee serves or served during the most recent fiscal year as a member of the board of directors or compensation committee of a company that has one or more executive officers serving as a member of the Board or Compensation Committee.
Risk Oversight
The Board, as a whole and through the Audit Committee, oversees risk management, which is designed to identify, evaluate and respond to our high priority risks and opportunities. This risk management approach facilitates constructive dialog at the senior management and Board level to proactively realize opportunities and manage risks. Our Audit Committee is primarily responsible for overseeing our risk management processes on behalf of the full Board. Our management, including our executive officers, is primarily responsible for managing the risks associated with the operation and business of our company and provides regular updates to the Audit Committee and annual updates to the full board on the risk management program and reports on the identified high priority risks and opportunities. Our Compensation Committee considers the extent to which the executive compensation program may create risk for the Company. See the “Executive Compensation—Compensation Discussion and Analysis—Compensation Philosophy and Objectives” of our Definitive Proxy Statement on Schedule 14A for the 2015 annual meeting of stockholders, which is incorporated by reference herein. In addition, our Nominating and Governance Committee considers risks related to succession planning for the Board of Directors and oversees the appropriate allocation of responsibility for risk oversight among the committees of the Board.
Code of Ethics and Conduct
We have adopted our Code of Conduct that applies to all of our employees, including our Chief Executive Officer, Chief Financial Officer, Corporate Controller, Chief Accounting Officer and all professionals in finance and finance-related departments. We have also adopted a code of ethics for senior financial officers that applies to our Chief Executive Officer, Chief Financial Officer, Chief Accounting Officer and all persons performing similar functions. This Code of Conduct and the code of ethics for senior financial officials is available on our corporate website at investor.vwr.com. If we make any substantive amendments to the Code of Conduct or the code of ethics for our senior financial officials, or grant any waiver from any provision of such code of ethics for our senior financial officials, we will disclose the nature of such amendment or waiver on our website or in a Current Report on Form 8-K. The information on our website is not part of or incorporated into this prospectus.
113
Table of Contents
PRINCIPAL AND SELLING STOCKHOLDERS
The following table sets forth information regarding the beneficial ownership of our common stock as of May 12, 2015 and the anticipated beneficial ownership percentages immediately following this offering for:
| • | our selling stockholder, which is the only person who is the beneficial owner of more than 5% of outstanding shares of our common stock; |
| • | each of our directors and our named executive officers; and |
| • | our directors and executive officers as a group. |
Each stockholder’s percentage ownership is based on 131,358,700 shares of our common stock outstanding as of May 12, 2015. The selling stockholder has granted the underwriters an option to purchase up to 2,400,000 additional shares of our common stock and the table below assumes no exercise of that option.
Beneficial ownership for the purposes of the following table is determined in accordance with the rules and regulations of the SEC. These rules generally provide that a person is the beneficial owner of securities if such person has or shares the power to vote or direct the voting thereof, or to dispose or direct the disposition thereof or has the right to acquire such powers within 60 days. Common stock subject to options that are currently exercisable within a specified date are deemed to be beneficially owned by the person holding the options. These shares, however, are not deemed outstanding for the purposes of computing the percentage ownership of any other person. Percentage of beneficial ownership is based on shares of common stock to be outstanding after the completion of this offering, assuming no exercise of the option to purchase additional shares from us. Except as disclosed in the footnotes to this table and subject to applicable community property laws, we believe that each stockholder identified in the table possesses sole voting and investment power over all shares of common stock shown as beneficially owned by the stockholder. We have not included in the following table the number of shares of common stock that certain of our executive officers and directors may be deemed to indirectly own as a result of being investors of VWR Holdings because none of such officers or directors exercise indirect voting or investment power with respect to our common stock.
| Percentage of Shares Beneficially Owned Assuming No Option Exercise (5) |
||||||||||||||||
| Name of Beneficial Owner |
Shares Beneficially Owned |
Shares Offered Hereby |
Prior to this Offering |
After this Offering |
||||||||||||
| 5% Stockholders: |
||||||||||||||||
| VWR Holdings (1) |
102,000,000 | 16,000,000 | 77.6 | % | 65.5 | % | ||||||||||
| Named Executive Officers and Directors: |
||||||||||||||||
| Manuel Brocke-Benz (2)(3) |
1,000 | — | * | * | ||||||||||||
| Gregory L. Cowan (2) |
— | — | — | — | ||||||||||||
| Peter Schuele (2) |
— | — | — | — | ||||||||||||
| Mark McLoughlin (2) |
— | — | — | — | ||||||||||||
| George Van Kula (2) |
— | — | — | — | ||||||||||||
| Harry M. Jansen Kraemer, Jr. (2)(4) |
5,654 | — | * | * | ||||||||||||
| Nicholas W. Alexos (1)(4) |
102,005,654 | 16,000,000 | 77.7 | 65.5 | ||||||||||||
| Robert L. Barchi (2)(4) |
5,654 | — | * | * | ||||||||||||
| Edward A. Blechschmidt (2)(4) |
5,654 | — | * | * | ||||||||||||
| Thompson Dean (4) |
5,654 | — | * | * | ||||||||||||
| Robert P. DeCresce (2)(4) |
5,654 | — | * | * | ||||||||||||
| Pamela Forbes Lieberman (2)(4) |
5,654 | — | * | * | ||||||||||||
| Carlos del Salto (2)(4) |
5,654 | — | * | * | ||||||||||||
| Timothy P. Sullivan (1)(4) |
102,005,654 | 16,000,000 | 77.7 | 65.5 | ||||||||||||
| Robert J. Zollars (2)(4) |
5,654 | — | * | * | ||||||||||||
| All Executive Officers and Directors as a Group (20 Persons) |
102,057,540 | 16,000,000 | 77.7 | % | 65.5 | % | ||||||||||
114
Table of Contents
| * | Indicates beneficial ownership of less than 1% of the outstanding shares. |
| (1) | Voting and dispositive power with respect to the common stock held by VWR Holdings is exercised by its board of directors, which is comprised of Messrs. Alexos and Sullivan. Madison Dearborn Capital Partners V-A, L.P. (“MDP V-A”), Madison Dearborn Capital Partners V-C, L.P. (“MDP V-C”), Madison Dearborn Capital Partners V Executive-A, L.P. (“MDP Executive”), MDCP Co-Investors (Varietal), L.P. (“Varietal-1”) and MDCP Co-Investors (Varietal-2), L.P. (“Varietal-2” and together with MDP V-A, MDP V-C, MDP Executive and Varietal-1, the “MDP Funds”) are the controlling equityholders of VWR Holdings. Madison Dearborn Partners V-A&C, L.P. (“MDP A&C”) is the general partner of each of the MDP Funds. Messrs. Paul J. Finnegan and Samuel M. Mencoff are the sole members of a limited partner committee of MDP A&C that have the power, acting by majority vote, to vote or dispose of the units directly held by the MDP Funds. Madison Dearborn Partners, LLC (“MDP”) is the general partner of MDP A&C and has the ability to direct the investment decisions of MDP A&C, including the power to direct the decisions of MDP A&C regarding the vote or disposition of securities directly held by VWR Holdings. Messrs. Alexos, Sullivan, Finnegan and Mencoff each hereby disclaims any beneficial ownership of any shares directly held by the MDP Funds. The address for MDP, MDP A&C, the MDP Funds and Messrs. Alexos, Sullivan, Finnegan and Mencoff is c/o Madison Dearborn Partners, LLC, Three First National Plaza, Suite 4600, 70 West Madison Street, Chicago, Illinois 60602. |
| (2) | Messrs. Brocke-Benz, Cowan, Schuele, McLoughlin, Van Kula, Kraemer, Barchi, Blechschmidt, DeCresce, del Salto and Zollars and Ms. Forbes Lieberman are investors in VWR Holdings. None of the foregoing persons has direct or indirect voting or dispositive power with respect to the shares of the Company’s common stock held of record by VWR Holdings. |
| (3) | Consists of 1,000 shares held by Mr. Brocke-Benz’s son and daughter which are deemed to be beneficially owned by Mr. Brocke-Benz. |
| (4) | Common stock and the percent of class listed as being beneficially owned by our non-management directors include outstanding options to purchase common stock, which are exercisable within 60 days of May 12, 2015. |
| (5) | Assuming the underwriters exercise their option to purchase 2,400,000 additional shares from the selling stockholder, VWR Holdings will own approximately 63.6% of the total shares of common stock issued and outstanding. |
115
Table of Contents
CERTAIN RELATIONSHIPS AND RELATED TRANSACTIONS
Set forth below are certain transactions and relationships between us and our directors, executive officers and equityholders that have occurred during the last three years.
Transactions with Related Persons
Our Nominating and Governance Committee is responsible for the review, approval and ratification of “related person transactions” between us and any related person pursuant to a written Related Person Transaction Policy adopted by our board of directors. “Related person transactions” include any transaction by the Company with a company or other entity that employs a “related person,” or in which a “related person” has a material ownership or financial interest. Under SEC rules, a related person is an officer, director, nominee for director or beneficial holder of more than of 5% of any class of our voting securities since the beginning of the last fiscal year or an immediate family member of any of the foregoing. In the course of its review and approval or ratification of a related-person transaction, the Nominating and Governance Committee will consider:
| • | the nature of the related person’s interest in the transaction; |
| • | the material terms of the transaction, including the amount involved and type of transaction; |
| • | the importance of the transaction to the related person and to our Company; |
| • | whether the transaction would impair the judgment of a director or executive officer to act in our best interest and the best interest of our stockholders; and |
| • | any other matters the Nominating and Governance Committee deems appropriate. |
Any member of the Nominating and Governance Committee who is a related person with respect to a transaction under review will not be able to participate in the deliberations or vote on the approval or ratification of the transaction. However, such a director may be counted in determining the presence of a quorum at a meeting of the committee that considers the transaction.
Certain Related Persons Transactions
Management Services Agreement
Prior to the completion of our IPO, we were party to a management services agreement with affiliates of Madison Dearborn Partners, LLC (“Madison Dearborn”) and Avista Capital Partners, L.P. (“Avista” and, together with Madison Dearborn, the “Sponsors”) (the “Management Services Agreement”) pursuant to which they provided us with management and consulting services and financial and other advisory services. Pursuant to the Management Services Agreement, the Sponsors earned an annual management fee of $2.0 million and reimbursement of out-of-pocket expenses incurred in connection with the provision of management and consulting services and financial and other advisory services, as well as board level services. In addition, the Sponsors also were entitled to receive a placement fee of 2.5% of any equity financing that they provided to us prior to a public offering of our common stock. The Management Services Agreement included customary indemnification provisions in favor of the affiliates of the Sponsors. For each of the years ended December 31, 2014, 2013 and 2012, the fees we paid under the Management Services Agreement were $1.5 million, $2.0 million and $2.0 million, respectively.
In connection with our IPO, the parties terminated the Management Services Agreement. Following the termination of the Management Services Agreement, the Sponsors have continued to provide mutually agreeable management support services to the Company without payment of any additional consideration. As a result of the termination, we expect to pay additional fees to our Board of $0.3 million annually.
116
Table of Contents
Income Tax Receivable Agreement
In connection with our IPO, we entered into the ITRA which provides VWR Holdings with the right to receive payment from us of 85% of the amount of cash savings, if any, in U.S. federal, state and local income tax that we and our subsidiaries actually realize (or are deemed to realize in the case of a change of control, certain subsidiary dispositions or certain other events, as discussed below) as a result of the utilization of our and our subsidiaries’ net operating losses attributable to periods prior to the IPO.
VWR Holdings will not reimburse us for any payments previously made if such tax benefits are subsequently disallowed (although future payments would be adjusted to the extent possible to reflect the result of such disallowances). As a result, in such circumstances we could make payments under the ITRA that are greater than our actual cash/tax savings.
While the actual amount and timing of any payments under the ITRA will vary depending upon a number of factors, including the amount and timing of the taxable income we and our subsidiaries generate in the future, and our and our subsidiaries’ use of net operating loss carryforwards, we expect that during the term of the ITRA the payments that we may make could be material.
If we undergo a change of control, the ITRA will terminate and we will be required to make a payment equal to the present value (at a discount rate of LIBOR plus 1.00%) of anticipated future payments under the ITRA, which payment would be based on certain assumptions, including those relating to our and our subsidiaries’ future taxable income, and may therefore significantly exceed the actual tax benefits we ultimately realize from our net operating losses and those of our subsidiaries. Additionally, if we sell or otherwise dispose of any of our subsidiaries in a transaction that is not a change of control, we will be required to make a payment equal to the present value of future payments under the ITRA attributable to the tax benefits of such subsidiary that is sold or disposed of, applying the assumptions described above, which may also result in a payment significantly in excess of the actual tax benefits we ultimately realize from our net operating losses and those of our subsidiaries.
The ITRA provides that in the event that we breach any of our material obligations under it, whether as a result of our failure to make any payment when due (subject to a specified cure period), failure to honor any other material obligation under it or by operation of law as a result of the rejection of it in a case commenced under the United States Bankruptcy Code or otherwise, then all our payment and other obligations under the ITRA will be accelerated and will become due and payable applying the same assumptions described above. Such payments could significantly exceed our actual cash tax savings that have been or will be realized.
Because we are a holding company with no operations of our own, our ability to make payments under the ITRA is dependent on the ability of our subsidiaries to make distributions to us. The agreements governing the indebtedness of our subsidiaries impose restrictions on the ability of our subsidiaries to make distributions to us, which could affect our ability to make payments under the ITRA. To the extent that we are unable to make payments under the ITRA for any reason, such payments will be deferred and will accrue interest at a rate of LIBOR plus 3.00% per annum until paid. The ability of VWR Funding to make distributions to us to fund any required payments under the ITRA is limited under the terms of the Senior Credit Facility and indenture governing the 2017 Senior Notes and the Euro Notes. We will agree under the ITRA not to incur, and not to permit any of our subsidiaries to incur, any new restrictions that would limit our ability to make payments under such agreement or the ability of our subsidiaries to make payments to us for that purpose. This restriction could make it more difficult or costly for us to refinance our outstanding indebtedness, the majority of which will mature during 2016 and 2017.
We made our first payment under the ITRA of $9.8 million during the three months ended March 31, 2015. As of March 31, 2015, we reported a liability of $163.1 million to VWR Holdings relating to the ITRA. The value of the liability assumes no material changes in the relevant tax law, and that we and our subsidiaries earn sufficient taxable income to realize the full tax benefits subject to the ITRA.
117
Table of Contents
Nomination of our Directors
In connection with our IPO, we entered into a Director Nomination Agreement with VWR Holdings that provides VWR Holdings the right to designate nominees for election to our board of directors for so long as VWR Holdings beneficially owns 10% or more of the total number of shares of our common stock then outstanding. Madison Dearborn Partners may cause VWR Holdings to assign its designation rights under the Director Nomination Agreement to Madison Dearborn Partners or to a Madison Dearborn Partners affiliate so long as Madison Dearborn Partners and its affiliates are the beneficial owners of 50% or more of VWR Holdings’ voting equity interests.
The number of nominees that VWR Holdings is entitled to designate under this agreement will bear the same proportion to the total number of members of our board of directors as the number of shares of common stock beneficially owned by VWR Holdings bears to the total number of shares of common stock outstanding, rounded up to the nearest whole number. In addition, VWR Holdings shall be entitled to designate the replacement for any of its board designees whose board service terminates prior to the end of the director’s term regardless of VWR Holdings’ beneficial ownership at such time. VWR Holdings shall also have the right to have its designees participate on committees of our board of directors proportionate to its stock ownership, subject to compliance with applicable law and stock exchange rules. This agreement will terminate at such time as VWR Holdings owns less than 10% of our outstanding common stock.
Registration Rights Agreement
In connection with our IPO, we entered into a registration rights agreement with VWR Holdings. VWR Holdings is entitled to request that the company register its shares on a long-form or short-form registration statement on one or more occasions in the future, which registrations may be “shelf registrations.” VWR Holdings is also entitled to participate in certain registered offerings by the company, subject to the restrictions in the registration rights agreement. The company will pay VWR Holdings’ expenses in connection with VWR Holdings’ exercise of these rights. The registration rights described in this paragraph apply to (i) shares of our common stock held by VWR Holdings as of the closing of the IPO, (ii) any of our capital stock (or that of our subsidiaries) issued or issuable with respect to the common stock described in clause (i) with respect to any dividend, distribution, recapitalization, reorganization, or certain other corporate transactions, and (iii) any of our common stock held by Madison Dearborn Partners and its affiliates (“Registrable Securities”). These registration rights are also for the benefit of any subsequent holder of Registrable Securities; provided that any particular securities will cease to be Registrable Securities when they have been sold in a registered public offering, sold in compliance with Rule 144 of the Securities Act or repurchased by us or our subsidiaries. In addition, with the consent of the company and holders of a majority of Registrable Securities, any Registrable Securities held by a person other than Madison Dearborn Partners, Avista and their respective affiliates will cease to be Registrable Securities if they can be sold without limitation under Rule 144 of the Securities Act.
Miscellaneous
We sell certain products to Rutgers University, The State University of New Jersey, for which Dr. Barchi became the President in September 2012. In 2014, 2013 and the period from September 2012 through December 2012, we had less than $3.1 million, $2.5 million and $0.6 million, respectively, of net sales to Rutgers University.
We sell certain products to Sage Products, LLC, which is a portfolio company of affiliated funds of Madison Dearborn Partners. In 2014, 2013 and 2012 we had less than $0.3 million, $0.2 million and $0.4 million, respectively, of net sales to Sage Products, LLC.
118
Table of Contents
We purchase certain products from Acino Pharma, which is a portfolio company of affiliated funds of Avista. In 2014, we had less than $0.5 million of purchases from Acino.
We sell certain products to Lantheus Medical Imaging and AngioDynamics, which are portfolio companies of affiliated funds of Avista. In 2014, 2013 and 2012, we had less than $0.7 million, $0.6 million and $0.6 million, respectively, of net sales to Lantheus. In 2014 and 2013, we had less than $0.3 million and $0.2 million, respectively, of net sales to AngioDynamics.
We purchase certain products from CDW Corporation (“CDW”), which is a portfolio company of affiliated funds of Madison Dearborn Partners. In 2014, 2013 and 2012, we had less than $0.1 million, $0.2 million and $0.3 million, respectively, of purchases from CDW.
119
Table of Contents
DESCRIPTION OF CERTAIN INDEBTEDNESS
Senior Credit Facility
Overview
The Senior Credit Facility is with a syndicate of lenders and provides for borrowings consisting of (1) term loans denominated in euros in an aggregate principal amount outstanding as of March 31, 2015 of €565.6 million ($607.4 million on a U.S. dollar equivalent basis as of March 31, 2015), (2) term loans denominated in U.S. dollars in an aggregate principal amount outstanding as of March 31, 2015 of $149.9 million and (3) a multi-currency revolving loan facility, providing for an equivalent in U.S. dollars of up to $241.3 million in multi-currency revolving loans (inclusive of swingline loans of up to $25.0 million and letters of credit of up to $70.0 million). VWR Funding, our direct-wholly owned subsidiary, is the borrower under the Senior Credit Facility, which is also guaranteed by VWR Corporation and certain of our restricted subsidiaries.
As of March 31, 2015, there were $2.0 million of borrowings outstanding under the multi-currency revolving loan facility, with $234.3 million of available borrowing capacity. Available borrowing capacity was calculated as the maximum borrowing capacity of $241.3 million, less undrawn letters of credit outstanding of $5.0 million and outstanding borrowings of $2.0 million. On April 30, 2015, we used availability under our A/R Facility to borrow $125.0 million, which we used to repay U.S. dollar-denominated term loans.
Maturity; Prepayments
The multi-currency revolving loan facility will mature and lending commitments thereunder will terminate on April 3, 2016. The term loans will mature on April 3, 2017. Subject to any mandatory or optional prepayments, the term loans are required to be paid on a quarterly basis in an amount equal to 0.25% of their respective original principal amounts drawn, with the final payment due at maturity.
Security; Guarantees
The obligations under the Senior Credit Facility are guaranteed by VWR Corporation and each of our wholly owned U.S. subsidiaries other than our U.S. foreign subsidiary holding companies (collectively, the “Subsidiary Guarantors”). In addition, the Senior Credit Facility and the guarantees thereunder are secured by (1) security interests in and pledges of or liens on substantially all of the tangible and intangible assets of VWR Corporation, VWR Funding and the Subsidiary Guarantors and (2) pledges of 100% of the capital stock of each of the Subsidiary Guarantors and 65% of the capital stock of each of its U.S. foreign subsidiary holding companies.
Interest
As of March 31, 2015, the weighted average interest rates on the euro-denominated and U.S. dollar-denominated term loans were 3.49% and 3.43%, respectively. As of March 31, 2015, the weighted average interest rates include margins of 3.50% and 3.25% on euro-denominated and U.S. dollar-denominated term loans, respectively.
At our election, the interest rate on all term loans denominated in U.S. dollars will be based on either (1) the then applicable British Bankers Association London Interbank Offered Rate (commonly known as U.S. Libor) plus 3.25% per annum, or (2) the then applicable alternate base rate (defined as the greater of the U.S. Prime lending rate or the Federal Funds effective rate plus 0.5%) plus 2.25% per annum. The interest rate on all term loans denominated in euros will be based on the then applicable interest rate determined by the Banking Federation of the European Union (commonly known as the Euribor rate) plus 3.50% per annum. All loans denominated in currencies other than U.S. dollars and euros will generally be based on the then applicable London Interbank Offered Rate for each respective loan and currency of denomination plus a variable margin.
120
Table of Contents
Swingline loans will be denominated only in U.S. dollars and based on the alternate base rate plus a variable margin. The interest rate on borrowings under our multi-currency revolving credit agreement is based on either (i) LIBOR plus a margin of 2.25% to 3.75% per annum, depending on our leverage; or at our election, for loans denominated in U.S. dollars or Canadian dollars (ii) an alternate base rate plus a margin of 1.25% to 2.75% per annum, depending on our leverage, where the alternate base rate for U.S. dollar borrowings is as previously described and for Canadian dollar borrowings is the Canadian prime rate of borrowing. The interest rate on the multi-currency revolving loan facility is subject to reductions based on net leverage.
Fees
VWR Funding pays fees with respect to the Senior Credit Facility, including (1) a commitment fee equal to 0.25% to 0.375% per annum, depending on our leverage, on the unused portion of the multi-currency revolving loan facility (subject to reductions based on net leverage), (2) letter of credit participation fees, (3) a letter of credit fronting fee (equal to 0.125% on the outstanding undrawn letters of credit paid to the issuing bank) and (4) administrative fees.
Covenants
The Senior Credit Facility contains a number of customary affirmative and negative covenants, including a financial maintenance covenant under which we are required to maintain a Senior Secured Net Leverage Ratio (as defined therein) of not more than 5.50:1.00. The financial maintenance covenant is only applicable if amounts are outstanding under the multi-currency revolving loan facility (including the swingline facility) or if outstanding letters of credit (other than cash collateralized letters of credit) are in excess of $20.0 million. As of March 31, 2015, we were in compliance with the covenants under the Senior Credit Facility.
Subject to our continued compliance with our covenants, we may request additional tranches of term loans or increases in the amount of commitments under the Senior Credit Facility. The actual extension of any such incremental term loans or increases in commitments would be subject to us reaching agreement with our lenders on applicable terms and conditions, which may depend on market conditions at the time of any request. We may add incremental term loan facilities and revolving loan commitments in an aggregate amount not to exceed the lesser of (x) $300.0 million or (y) the maximum amount at such time that could be incurred without causing our Total Net Leverage Ratio (as defined therein) to exceed 9.50:1.00 on a pro forma basis as of the last day of the most recent determination period, in each case, subject to certain other restrictions.
7.25% Senior Notes due 2017
VWR Funding issued $750.0 million aggregate principal amount of the 2017 Senior Notes on September 4, 2012.
Ranking
The 2017 Senior Notes were issued pursuant to an indenture, dated September 4, 2012, by and among the Subsidiary Guarantors, the trustee and VWR Funding. The 2017 Senior Notes, and related guarantees, are unsecured obligations and are subordinate to all of VWR Funding’s and the Subsidiary Guarantors’ obligations under all secured indebtedness, including any borrowings under the Senior Credit Facility to the extent of the value of the assets securing such obligations, and are structurally subordinated to all obligations of each of our subsidiaries that is not a guarantor of the 2017 Senior Notes. The 2017 Senior Notes, and related guarantees, rank equally with all of VWR Funding’s existing and future unsecured debt and ranks senior to all of VWR Funding’s existing and future subordinated indebtedness.
Interest and Maturity
The 2017 Senior Notes will mature on September 15, 2017. Interest on the 2017 Senior Notes is payable twice a year on March 15 and September 15. Payments commenced on March 15, 2013 at a rate of 7.25% per annum.
121
Table of Contents
Guarantees
The obligations under the 2017 Senior Notes are guaranteed, jointly and severally and fully and unconditionally, on a senior basis by each of the Subsidiary Guarantors. The Subsidiary Guarantors’ obligations under the guarantees of the 2017 Senior Notes are not secured by any of VWR Corporation’s assets, VWR Funding’s assets or the Subsidiary Guarantors’ assets.
Redemption
VWR Funding may redeem all or a part of the 2017 Senior Notes at 102.719% and 100% of the principal amount beginning on September 15, 2015 and 2016, respectively, plus any accrued and unpaid interest to the date of redemption.
If VWR Funding experiences specific kinds of changes in control, it is required to offer to repurchase the 2017 Senior Notes at 101% of the principal amount, plus any accrued and unpaid interest to the repurchase date.
Covenants
The indenture governing the 2017 Senior Notes contains a number of customary affirmative and negative covenants that, among other things, limit VWR Funding’s ability and that of its restricted subsidiaries to make restricted payments, pay dividends, incur or create additional indebtedness, issue preferred stock, make certain dispositions outside the ordinary course of business, execute certain affiliate transactions, create liens on our assets and those of its restricted subsidiaries, and materially change its lines of business. As of March 31, 2015, we were in compliance with the covenants under the indenture.
Events of Default
The indenture provides for events of default (subject in certain cases to customary grace and cure periods) which include, among others, nonpayment of principal or interest when due, breach of covenants or other agreements in the indenture, defaults in payment of certain other indebtedness, certain events of bankruptcy or insolvency and when the guarantees of significant subsidiaries cease to be in full force and effect. Generally, if an event of default occurs, the trustee or the holders of at least 25% in principal amount of the then outstanding 2017 Senior Notes may declare the principal of and accrued but unpaid interest on all of the 2017 Senior Notes to be due and payable immediately.
Euro Notes
Overview
VWR Funding issued €503.8 million aggregate principal amount of Euro Notes on March 25, 2015. VWR Funding used the net proceeds from the issuance and sale of the Euro Notes to repay outstanding borrowings under its multi-currency revolving loan facility and A/R Facility and a portion of its U.S. dollar-denominated term loans. The Euro Notes were not registered under the Securities Act, and may not be offered or sold in the United States absent an applicable exemption from registration requirements.
The Euro Notes were issued pursuant to an indenture, dated as of March 25, 2015, among VWR Funding, the subsidiary guarantors named therein, Law Debenture Trust Company of New York, as trustee, Deutsche Bank AG, London Branch, as paying agent and Deutsche Bank Luxembourg S.A., as registrar and transfer agent. The Euro Notes were offered at an original issue price of 99.25%.
Interest and Maturity
The Euro Notes bear interest at a rate of 4.625% and mature on April 15, 2022. Interest is payable on the Notes on April 15 and October 15 of each year, commencing October 15, 2015.
122
Table of Contents
Ranking, Guarantees and Security
VWR Funding’s obligations under the Euro Notes are guaranteed on a senior unsecured basis by each of its domestic restricted subsidiaries that incurs or guarantees its Senior Credit Facility and certain other indebtedness. The Euro Notes are VWR Funding’s senior unsecured obligations, will rank equally with all of its existing and future senior unsecured debt and will be senior to all of its existing and future subordinated debt.
Redemption
VWR Funding may redeem the Euro Notes, in whole or in part, at any time prior to April 15, 2018 at a redemption price equal to 100% of the principal amount thereof, plus accrued and unpaid interest, if any, to the redemption date, plus the “make-whole” premium set forth in the indenture. VWR Funding may redeem the Euro Notes, in whole or in part, at 102.3125%, 101.1563% and 100.0000% of the principal amount beginning on April 15, 2018, 2019 and 2020, respectively, plus accrued and unpaid interest, if any, to the redemption date. In addition, at any time prior to April 15, 2018, on one or more occasions, VWR Funding may redeem up to 35% of the aggregate principal amount of the Euro Notes with the net proceeds of one or more equity offerings, as described in the indenture, at a redemption price equal to 104.625% of the principal amount thereof, plus accrued and unpaid interest, if any, to the redemption date. If VWR Funding experiences certain change of control events, holders of the Euro Notes may require it to repurchase all or part of their Euro Notes at 101% of the principal amount thereof, plus accrued and unpaid interest, if any, to the repurchase date.
Covenants
The indenture governing the Euro Notes contains restrictive covenants that limit the ability of VWR Funding and its restricted subsidiaries to, among other things: incur additional debt or issue preferred stock; create liens; create restrictions on VWR Funding’s subsidiaries’ ability to make payments to VWR Funding; pay dividends and make other distributions in respect of VWR Funding’s and its restricted subsidiaries’ capital stock; make certain investments or certain other restricted payments; guarantee indebtedness; designate unrestricted subsidiaries; sell certain kinds of assets; enter into certain types of transactions with affiliates; and effect mergers or consolidations. As of March 31, 2015, we were in compliance with the covenants under the Euro Notes.
Certain of these covenants will be terminated if the Euro Notes are assigned an investment grade rating by Standard & Poor’s Rating Services and Moody’s Investors Service, Inc. and no default has occurred and is continuing.
Events of Default
The indenture provides for events of default (subject in certain cases to customary grace and cure periods) which include, among others, nonpayment of principal or interest when due, breach of covenants or other agreements in the Indenture, defaults in payment of certain other indebtedness, certain events of bankruptcy or insolvency and when the guarantees of significant subsidiaries cease to be in full force and effect. Generally, if an event of default occurs, the trustee or the holders of at least 25% in principal amount of the then outstanding Euro Notes may declare the principal of and accrued but unpaid interest on all of the Euro Notes to be due and payable immediately.
A/R Facility
The A/R Facility provides for funding in an aggregate principal amount not to exceed $175.0 million and will terminate on May 18, 2018. The A/R Facility is collateralized by the trade accounts receivable of VWR International, LLC and certain of our domestic wholly owned subsidiaries, which are available to satisfy claims of the creditors under the A/R Facility and not available to satisfy the claims of other creditors.
123
Table of Contents
As of March 31, 2015, we had no outstanding borrowings, $11.3 million of undrawn letters of credit outstanding and $145.3 million of additional borrowing capacity under the A/R Facility. Borrowing capacity under the A/R Facility depends primarily upon maintaining sufficient trade accounts receivable. As of March 31, 2015, the interest rate applicable to borrowings outstanding under the A/R Facility was 1.68%. On May 18, 2015, we entered into an amendment to the A/R Facility which decreased the interest rate on borrowings to one-month U.S. Libor plus a spread of 1.15% per annum.
The A/R Facility includes representations and covenants that we consider usual and customary for arrangements of this type and includes a consolidated interest expense test if our available liquidity is less than $115.0 million. In addition, borrowings under the A/R Facility are subject to termination upon the occurrence of certain events that we also consider usual and customary. As of March 31, 2015, we were in compliance with the covenants under the A/R Facility. On April 30, 2015, we used availability under our A/R Facility to borrow $125.0 million, which we used to repay U.S. dollar-denominated term loans.
Compensating Cash Balance
Our foreign subsidiaries obtain their liquidity from our notional and physical global cash pooling arrangements or from formal or informal lines of credit offered by local banks. Our compensating cash balance represents bank overdraft positions of subsidiaries participating in our notional global cash pooling arrangement with a third-party bank. Due to the nature of these overdrafts, all amounts have been classified within current portion of debt at each period end. As of March 31, 2015, our compensating cash balance was $0.2 million.
The borrowings drawn by our foreign subsidiaries from local banks are limited in the aggregate by certain covenants contained within the Senior Credit Facility and the indentures governing the 2017 Senior Notes and Euro Notes. The borrowings available to our foreign subsidiaries under our notional cash pooling arrangement are limited in the aggregate by the amount of compensating cash balances supporting the notional cash pooling arrangement.
Capital Lease Obligations
We typically use capital leases to finance equipment used in our operations, including office equipment, and our leased facilities located in Singapore and Spain. As of March 31, 2015, our capital lease obligations were $14.2 million.
124
Table of Contents
The following is a summary of our capital stock and the provisions of our amended and restated certificate of incorporation and our amended and restated by-laws and certain provisions of Delaware law. This summary is qualified in its entirety by the provisions of our amended and restated certificate of incorporation and amended and restated by-laws, copies of which have been filed with the SEC as exhibits to the registration statement of which this prospectus is a part. References in this section to the “Company,” “we,” “us” and “our” refer to VWR Corporation and not to any of its subsidiaries.
Authorized Capitalization
Our authorized capital stock consists of 750,000,000 shares of common stock, par value $0.01 per share, and 50,000,000 shares of undesignated preferred stock, par value $0.01 per share.
As of May 12, 2015, we had 131,358,700 shares of common stock outstanding and no shares of preferred stock outstanding.
Common Stock
Voting Rights
Each share of common stock entitles the holder to one vote with respect to each matter presented to our stockholders on which the holders of common stock are entitled to vote. Our common stock votes as a single class on all matters relating to the election and removal of directors on the Board and as provided by law. Holders of our common stock do not have cumulative voting rights. Except in respect of matters relating to the election and removal of directors on the Board and as otherwise provided in our amended and restated certificate of incorporation or required by law, all matters to be voted on by our stockholders must be approved by a majority of the shares present in person or by proxy at the meeting and entitled to vote on the subject matter. In the case of election of directors, all matters to be voted on by our stockholders must be approved by a plurality of the votes entitled to be cast by all shares of common stock.
Dividend Rights
The holders of our outstanding shares of common stock are entitled to receive dividends, if any, as may be declared from time to time by the Board out of legally available funds. See “Dividend Policy.” Because we are a holding company, our ability to pay dividends on our common stock is limited by restrictions on the ability of our subsidiaries to pay dividends or make distributions to us, including restrictions under the terms of the agreements governing our indebtedness.
Liquidation Rights
In the event of any voluntary or involuntary liquidation, dissolution or winding up of our affairs, holders of our common stock would be entitled to share ratably in our assets that are legally available for distribution to stockholders after payment of our debts and other liabilities. If we have any preferred stock outstanding at such time, holders of the preferred stock may be entitled to distribution and/or liquidation preferences. In either such case, we must pay the applicable distribution to the holders of our preferred stock before we may pay distributions to the holders of our common stock.
Other Rights
Our stockholders have no preemptive, conversion or other rights to subscribe for additional shares. All outstanding shares are validly issued, fully paid and nonassessable. The rights, preferences and privileges of the holders of our common stock are subject to and may be adversely affected by the rights of the holders of shares of any series of our preferred stock that we may designate and issue in the future.
125
Table of Contents
Listing
Our common stock is listed on NASDAQ Global Select Market under the symbol “VWR.”
Transfer Agent and Registrar
The transfer agent and registrar for our common stock is American Stock Transfer & Trust Company, LLC.
Preferred Stock
Our amended and restated certificate of incorporation authorizes the Board to provide for the issuance of shares of preferred stock in one or more series and to fix the preferences, powers and relative, participating, optional or other special rights and qualifications, limitations or restrictions thereof, including the dividend rate, conversion rights, voting rights, redemption rights and liquidation preference and to fix the number of shares to be included in any such series without any further vote or action by our stockholders. Any preferred stock so issued may rank senior to our common stock with respect to the payment of dividends or amounts upon liquidation, dissolution or winding up, or both. The issuance of preferred stock may have the effect of delaying, deferring or preventing a change in control of our company without further action by the stockholders and may adversely affect the voting and other rights of the holders of common stock. The issuance of preferred stock with voting and conversion rights may adversely affect the voting power of the holders of common stock, including the loss of voting control to others. At present, we have no plans to issue any preferred stock.
Board Composition
Following the completion of this offering, we will remain a “controlled company” under the rules of NASDAQ because more than 50% of its outstanding voting power will be held by VWR Holdings. See “Principal and Selling Stockholders.” We are relying upon the “controlled company” exception to the board of directors and committee independence requirements of NASDAQ. Pursuant to this exception, we are exempt from the rules that would otherwise require that our board of directors consist of a majority of independent directors and that our compensation committee and governance and nominating committee be composed entirely of independent directors. The “controlled company” exception does not modify the independence requirements for the audit committee, and we intend to comply with the requirements of Rule 10A-3 of the Exchange Act and Section 3 of the Sarbanes-Oxley Act and the corporate governance standards of NASDAQ, which require that our audit committee consist exclusively of independent directors within one year of our IPO.
The Board is divided into three classes, as nearly equal in number as possible, with each director serving a three-year term and one class being elected at each year’s annual meeting of stockholders.
| • | Our Class I directors are Nicholas W. Alexos, Robert P. DeCresce and Carlos del Salto, and their terms expire at the 2018 annual meeting of stockholders; |
| • | Our Class II directors are Timothy P. Sullivan, Edward A. Blechschmidt, Thompson Dean and Robert L. Barchi, and their terms expire at the 2016 annual meeting of stockholders; and |
| • | Our Class III directors are Harry M. Jansen Kraemer, Jr., Manuel Brocke-Benz, Pamela Forbes Lieberman and Robert J. Zollars, and their terms expire at the 2017 annual meeting of stockholders. |
At each annual meeting of our stockholders, successors to the class of directors whose term expires at such meeting will be elected to serve for three-year terms or until their respective successors are elected and qualified.
In connection with the IPO, we entered into a Director Nomination Agreement with VWR Holdings that provides VWR Holdings the right to designate nominees for election to our board of directors for so long as VWR Holdings beneficially owns 10% or more of the total number of shares of our common stock then outstanding. Madison Dearborn Partners may cause VWR Holdings to assign its designation rights under the Director Nomination Agreement to Madison Dearborn Partners or to a Madison Dearborn Partners’ affiliate so long as Madison Dearborn Partners and its affiliates are the beneficial owners of 50% or more of VWR Holdings’ voting equity interests.
126
Table of Contents
The number of nominees that VWR Holdings is entitled to designate under this agreement will bear the same proportion to the total number of members of our board of directors as the number of shares of common stock beneficially owned by VWR Holdings bears to the total number of shares of common stock outstanding, rounded up to the nearest whole number. In addition, VWR Holdings shall be entitled to designate the replacement for any of its board designees whose board service terminates prior to the end of the director’s term regardless of VWR Holdings’ beneficial ownership at such time. VWR Holdings also has the right to have its designees participate on committees of our board of directors proportionate to its stock ownership, subject to compliance with applicable law and stock exchange rules. This agreement will terminate at such time as VWR Holdings owns less than 10% of our outstanding common stock.
Corporate Opportunity
Each of Messrs. Alexos and Sullivan, who are officers of Madison Dearborn Partners, and Mr. Kraemer, who is associated with Madison Dearborn Partners, serve on the Board. Madison Dearborn Partners is the ultimate principal equityholder of VWR Holdings, our majority stockholder. Madison Dearborn Partners and entities controlled by them may hold equity interests in entities that directly or indirectly compete with us, and companies in which they currently invest may begin competing with us. As a result of these relationships, when conflicts between the interests of Madison Dearborn Partners, on the one hand, and of other stockholders, on the other hand, arise, these directors may not be disinterested. Although our directors and officers have a duty of loyalty to us under Delaware law and our amended and restated certificate of incorporation, transactions that we enter into in which a director or officer has a conflict of interest are generally permissible so long as (1) the material facts relating to the director’s or officer’s relationship or interest as to the transaction are disclosed to the Board and a majority of our disinterested directors approves the transaction, (2) the material facts relating to the director’s or officer’s relationship or interest as to the transaction are disclosed to our stockholders and a majority of our disinterested stockholders approves the transaction or (3) the transaction is otherwise fair to us. Our amended and restated certificate of incorporation provides that Madison Dearborn Partners and its representatives will not be required to offer any transaction opportunity of which they become aware to us and could take any such opportunity for themselves or offer it to other companies in which they have an investment, unless such opportunity is offered to them solely in their capacities as our directors. We do not anticipate that this provision has any adverse impact on our ability to continue to identify and execute upon future acquisition opportunities, as Madison Dearborn Partners does not typically pursue acquisition targets similar to those that we would consider.
Anti-takeover Effects of Delaware Law and Our Certificate of Incorporation and By-laws
Our amended and restated certificate of incorporation and by-laws also contain provisions that may delay, defer or discourage another party from acquiring control of us. We expect that these provisions, which are summarized below, will discourage coercive takeover practices or inadequate takeover bids. These provisions are also designed to encourage persons seeking to acquire control of us to first negotiate with the Board, which we believe may result in an improvement of the terms of any such acquisition in favor of our stockholders. However, they also give the Board the power to discourage acquisitions that some stockholders may favor.
Undesignated Preferred Stock
The ability to authorize undesignated preferred stock will make it possible for the Board to issue preferred stock with super voting, special approval, dividend or other rights or preferences on a discriminatory basis that could impede the success of any attempt to acquire us. These and other provisions may have the effect of deferring, delaying or discouraging hostile takeovers, or changes in control or management of our company.
Classified Board of Directors
Our amended and restated certificate of incorporation provides that the Board be divided into three classes, with each class serving three-year staggered terms. In addition, under the DGCL, directors serving on a classified
127
Table of Contents
board of directors may only be removed from the board of directors with cause and by an affirmative vote of the majority of our common stock. These provisions may have the effect of deferring, delaying or discouraging hostile takeovers, or changes in control or management of the Company.
Special Meetings of Stockholders
Our amended and restated certificate of incorporation provides that special meetings of the stockholders may only be called by (i) the chairman or vice chairman of the Board, (ii) our chief executive officer, (iii) a majority of the Board through a special resolution or (iv) the holders of at least 10% of our common stock until such time as Madison Dearborn Partners ceases to beneficially own 50% or more of our common stock, effected by consent in writing by such stockholders.
Requirements for Nominations and Proposals at Stockholder Meetings
Our amended and restated by-laws prohibit the conduct of any business at a special meeting other than as specified in the notice for such meeting. Our amended and restated by-laws also provide that nominations of persons for election to the Board may be made at a special meeting of stockholders at which directors are to be elected pursuant to the notice of meeting (1) by or at the direction of the Board or (2) provided that the Board has determined that directors shall be elected at such meeting, by any stockholder who (i) is a stockholder of record both at the time the notice is delivered and on the record date for the determination of stockholders entitled to vote at the special meeting, (ii) is entitled to vote at the meeting and upon such election and (iii) complies with the notice procedures set forth in our amended and restated by-laws. These provisions may have the effect of deferring, delaying or discouraging hostile takeovers, or changes in control or management of our company.
Stockholder Action by Written Consent
Pursuant to Section 228 of the DGCL, any action required to be taken at any annual or special meeting of the stockholders may be taken without a meeting, without prior notice and without a vote if a consent or consents in writing, setting forth the action so taken, is signed by the holders of outstanding stock having not less than the minimum number of votes that would be necessary to authorize or take such action at a meeting at which all shares of our stock entitled to vote thereon were present and voted, unless our company’s amended and restated certificate of incorporation provides otherwise. Our amended and restated certificate of incorporation provides that any action required or permitted to be taken by our stockholders may be effected by consent in writing by such stockholders, until such time as Madison Dearborn Partners ceases to beneficially own 50% or more of our common stock.
Business Combinations with Interested Stockholders
We have elected in our amended and restated certificate of incorporation not to be subject to Section 203 of the DGCL, an anti-takeover law. In general, Section 203 prohibits a publicly held Delaware corporation from engaging in a business combination, such as a merger, with a person or group owning 15% or more of the corporation’s voting stock for a period of three years following the date the person became an interested stockholder, unless (with certain exceptions) the business combination or the transaction in which the person became an interested stockholder is approved in a prescribed manner. Accordingly, we will not be subject to any anti-takeover effects of Section 203. However, our amended and restated certificate of incorporation contains provisions that have the same effect as Section 203, except that they provide that both Madison Dearborn Partners and any persons to whom Madison Dearborn Partners sells their common stock will be deemed to have been approved by the Board and thereby not subject to the restrictions set forth in our amended and restated certificate of incorporation that have the same effect as Section 203.
Exclusive Jurisdiction of Certain Actions
Our amended and restated certificate of incorporation requires, to the fullest extent permitted by law, that derivative actions brought in the name of the company, actions against directors, officers, employees or agent for breach of fiduciary duty and other similar actions may be brought only in the Court of Chancery in the State of
128
Table of Contents
Delaware and if brought outside of Delaware, the stockholder bringing the suit will be deemed to have consented to service of process on such stockholder’s counsel. Although we believe this provision benefits our company by providing increased consistency in the application of Delaware law in the types of lawsuits to which it applies, the provision may have the effect of discouraging lawsuits against our directors and officers. See “Risk Factors—Risks Related to Ownership of our Common Stock—Our amended and restated certificate of incorporation designates the Court of Chancery of the State of Delaware as the sole and exclusive forum for certain types of actions and proceedings that may be initiated by our stockholders, which could limit our stockholders’ ability to obtain a favorable judicial forum for disputes with us or our directors, officers or employees.”
Requirements for Amendments to our Amended and Restated Certificate of Incorporation and Amended and Restated By-laws
Our amended and restated certificate of incorporation provides that our amended and restated by-laws may be adopted, amended, altered or repealed by the vote of at least a majority of holders of all of our outstanding capital stock entitled to vote generally in the election of directors until such time as Madison Dearborn Partners ceases to beneficially own 50% or more of our common stock. After the date on which Madison Dearborn Partners ceases to beneficially own 50% or more of our common stock, our amended and restated by-laws may be adopted, amended, altered or repealed by (i) the vote of a majority of directors then in office or (ii) the vote of 66 2⁄3% of holders of all of our outstanding capital stock entitled to vote generally in the election of directors.
Our amended and restated certificate of incorporation provides that the provisions of our certificate of incorporation relating to the size and composition of our board of directors, limitation on liabilities of directors, stockholder action by written consent, the ability of stockholders to call special meetings, business combinations with interested persons, amendment of our bylaws or certificate of incorporation and the Court of Chancery as the exclusive forum for certain disputes, may only be amended, altered, changed or repealed by the affirmative vote of the holders of at least a majority of the voting power of all of our outstanding shares of capital stock entitled to vote generally in the election of directors until such time as Madison Dearborn Partners ceases to beneficially own 50% or more of our common stock and, after such date, such provisions may only be amended, altered, changed or repealed by the affirmative vote of the holders of at least 66 2⁄3% of the voting power of all of our outstanding shares of capital stock entitled to vote generally in the election of directors. Our amended and restated certificate of incorporation will also provide that the provision of our certificate of incorporation that deals with corporate opportunity may only be amended, altered or repealed by a vote of 80% of the voting power of all of our shares of common stock then outstanding.
129
Table of Contents
SHARES ELIGIBLE FOR FUTURE SALE
Future sales of substantial amounts of our common stock in the public market, or the perception that such sales may occur, could adversely affect the prevailing market price of our common stock. No prediction can be made as to the effect, if any, future sales of shares, or the availability of shares for future sales, will have on the market price of our common stock prevailing from time to time. The sale of substantial amounts of our common stock in the public market, or the perception that such sales could occur, could harm the prevailing market price of our common stock.
Sale of Restricted Shares
Upon completion of this offering, we will have 131,358,700 shares of common stock outstanding. Following this offering, 45,357,700 shares of common stock, plus any shares sold upon exercise of the underwriters’ option to purchase additional shares, will be freely tradable without restriction under the Securities Act, except for any such shares which may be acquired by an “affiliate” of ours, as that term is defined in Rule 144 promulgated under the Securities Act (“Rule 144”), which shares will be subject to the volume limitations and other restrictions of Rule 144 described below. The remaining 86,001,000 shares of common stock, or 83,601,000 shares if the underwriters exercise their option to purchase additional shares in full, will be “restricted securities,” as that term is defined in Rule 144, and may be resold only after registration under the Securities Act or pursuant to an exemption from such registration, including, among others, the exemptions provided by Rule 144 and Rule 701 under the Securities Act, which rules are summarized below. These restricted shares of common stock will be available for sale in the public market (after the expiration of the lock-up agreements described below) only if registered or if they qualify for an exemption from registration under Rule 144 or Rule 701 under the Securities Act, as described below.
Rule 144
In general, under Rule 144 of the Securities Act as currently in effect, once we have been subject to public company reporting requirements for at least 90 days, a person who is not deemed to have been one of our affiliates for purposes of the Securities Act at any time during 90 days preceding a sale and who has beneficially owned the shares proposed to be sold for at least six months, including the holding period of any prior owner other than our affiliates, is entitled to sell such shares without complying with the manner of sale, volume limitation or notice provisions of Rule 144, subject to compliance with the public information requirements of Rule 144. If such a person has beneficially owned the shares proposed to be sold for at least one year, including the holding period of any prior owner other than our affiliates, then such person is entitled to sell such shares without complying with any of the requirements of Rule 144.
In general, under Rule 144, as currently in effect, our affiliates or persons selling shares on behalf of our affiliates are entitled to sell within any three-month period beginning 90 days after the date of this prospectus, a number of shares that does not exceed the greater of:
| • | 1% of the number of shares of common stock then outstanding; or |
| • | the average weekly trading volume of the common stock during the four calendar weeks preceding the filing of a notice on Form 144 with respect to such sale. |
Rule 144 also provides that a person who is not deemed to have been an affiliate of ours at any time during the three months preceding a sale and who has for at least six months beneficially owned shares of our common stock that are restricted securities, will be entitled to freely sell such shares of our common stock subject only to the availability of current public information regarding us. A person who is not deemed to have been an affiliate of ours at any time during the three months preceding a sale and who has beneficially owned for at least one year shares of our common stock that are restricted securities, will be entitled to freely sell such shares of our common stock under Rule 144 without regard to the current public information requirements of Rule 144.
130
Table of Contents
Rule 701
Rule 701 generally allows a stockholder who purchased shares of our common stock pursuant to a written compensatory plan or contract and who is not deemed to have been an affiliate of our company during the immediately preceding 90 days to sell these shares in reliance upon Rule 144, but without being required to comply with the public information, holding period, volume limitation or notice provisions of Rule 144. Rule 701 also permits affiliates of our company to sell their Rule 701 shares under Rule 144 without complying with the holding period requirements of Rule 144.
Stock Plans
We have registered on Form S-8 under the Securities Act all of the shares of our common stock reserved for issuance under the 2014 Equity Incentive Plan and VWR ESPP we adopted in connection with the IPO. Shares registered under these registration statements are available for sale in the open market, subject to the Rule 144 limitations applicable to affiliates.
Lock-Up Agreements
In connection with this offering, we, our non-executive directors and the selling stockholder, will enter into 90-day lock-up agreements with the underwriters of this offering under which we and such other parties may not, for a period of 90 days after the date of this prospectus, directly or indirectly sell, dispose of or hedge any shares of common stock or any securities convertible into or exchangeable or exercisable for shares of common stock without the prior written consent of any two of three of the representatives on behalf of the underwriters subject to certain limited exceptions.
Registration Rights
VWR Holdings is entitled to various rights with respect to the registration of shares under the Securities Act. See “Certain Relationships and Related Transactions—Certain Related Persons Transactions—Registration Rights Agreement.” Except for shares purchased by affiliates, registration of their shares under the Securities Act would result in these shares becoming freely tradable without restriction under the Securities Act immediately upon sale, subject to the expiration of the lock-up period described under “Underwriting” in this prospectus, and to the extent such shares have been released from any repurchase option that we may hold.
131
Table of Contents
CERTAIN U.S. FEDERAL INCOME AND ESTATE TAX CONSIDERATIONS FOR NON-U.S. HOLDERS
The following is a summary of certain U.S. federal income and estate tax consequences of the purchase, ownership and disposition of our common stock to a “non-U.S. holder” (as defined below) that purchases shares of our common stock in this offering. This summary applies only to a non-U.S. holder that holds our common stock as a capital asset (generally, property held for investment), within the meaning of Section 1221 of the U.S. Internal Revenue Code of 1986, as amended (the “Code”).
For purposes of this summary, except as modified for estate tax purposes (as discussed below), a “non-U.S. holder” means a beneficial owner of our common stock that, for U.S. federal income tax purposes, is an individual, corporation, estate or trust other than:
| • | an individual who is a citizen or resident of the United States, as defined for U.S. federal income tax purposes; |
| • | a corporation or other entity treated as a corporation for U.S. federal income tax purposes created or organized under the laws of the United States, any state thereof or the District of Columbia; |
| • | an estate whose income is subject to U.S. federal income tax regardless of its source; or |
| • | a trust if it (1) is subject to the primary supervision of a court within the United States and one or more United States persons have the authority to control all substantial decisions of the trust or (2) has a valid election in place to be treated as a U.S. person for U.S. federal income tax purposes. |
In the case of a holder that is classified as a partnership for U.S. federal income tax purposes, the tax treatment of a partner in such partnership generally will depend upon the status of the partner and the activities of the partner and the partnership. If you are a partner in a partnership considering an investment in our common stock, you should consult your own tax advisor.
This summary is based upon the provisions of the Code, the Treasury regulations promulgated thereunder and administrative and judicial interpretations thereof, all as of the date hereof. Those authorities may be changed or subject to different interpretations, perhaps retroactively, so as to result in U.S. federal income tax consequences different from those summarized below. We cannot assure you that a change in law, possibly with retroactive application, will not alter significantly the tax considerations that we describe in this summary. We have not sought and do not plan to seek any ruling from the U.S. Internal Revenue Service (the “IRS”), with respect to statements made and the conclusions reached in the following summary, and there can be no assurance that the IRS or a court will agree with our statements and conclusions.
This summary does not address all aspects of U.S. federal income and estate taxes that may be relevant to non-U.S. holders in light of their personal circumstances, and does not deal with U.S. federal taxes other than the U.S. federal income and estate tax (such as U.S. federal gift tax laws or the Medicare tax on certain investment income) or with U.S., state, local or non-U.S. tax considerations. Special rules, not discussed here, may apply to certain non-U.S. holders, including:
| • | former citizens or residents of the U.S.; |
| • | brokers, dealers or traders in securities, commodities or currencies; |
| • | persons who hold our common stock as a position in a “straddle,” “conversion transaction,” synthetic security or other integrated transaction or risk reduction transaction; |
| • | controlled foreign corporations, passive foreign investment companies, or corporations that accumulate earnings to avoid U.S. federal income tax; |
| • | tax-exempt entities; |
132
Table of Contents
| • | persons subject to the alternative minimum tax; |
| • | persons who acquired shares of our common stock in connection with the performance of services; |
| • | banks, insurance companies, or other financial institutions; and |
| • | pass-through entities for U.S. federal income tax purposes and investors in such entities. |
Such non-U.S. holders considering an investment in our common stock should consult their own tax advisors to determine the U.S. federal, state, local and non-U.S. tax consequences that may be relevant to them.
This discussion is for general information only and is not intended to constitute a complete description of all U.S. federal income and estate tax consequences for non-U.S. holders relating to the purchase, ownership and disposition of shares of our common stock. If you are considering the purchase of our common stock, you should consult your own tax advisor concerning the particular U.S. federal income and estate tax consequences to you of the purchase, ownership and disposition of our common stock, as well as the consequences to you arising under U.S. tax laws other than the federal income and estate tax law or under the laws of any other taxing jurisdiction.
Dividends
As discussed under the section entitled “Dividend Policy” above, we do not currently anticipate paying dividends. In the event that we do make a distribution of cash or property (other than certain stock distributions) with respect to our common stock (or certain redemptions that are treated as distributions with respect to common stock), any such distributions will be treated as a dividend for U.S. federal income tax purposes to the extent paid from our current or accumulated earnings and profits (as determined under U.S. federal income tax principles). Dividends paid to you generally will be subject to U.S. federal withholding tax at a 30% rate or such lower rate as may be specified by an applicable income tax treaty. However, dividends that are effectively connected with the conduct of a trade or business by you within the U.S. are not subject to the withholding tax, but instead are subject to U.S. federal income tax on a net income basis at applicable graduated individual or corporate rates in generally the same manner as if you were a U.S. person, unless an applicable income tax treaty provides otherwise. Certain certification and disclosure requirements, including delivery of a properly executed IRS Form W-8ECI (or other applicable IRS Form W-8), must be satisfied for effectively connected income to be exempt from withholding. A foreign corporation may be subject to an additional “branch profits tax” at a 30% rate (or such lower rate as may be specified by an applicable income tax treaty) on its effectively connected earnings and profits, subject to adjustments.
If the amount of a distribution paid on our common stock exceeds our current and accumulated earnings and profits, such excess will be allocated ratably among each share of common stock with respect to which the distribution is paid and treated first as a tax-free return of capital to the extent of your adjusted tax basis in each such share, and thereafter as capital gain from a sale or other taxable disposition of such share of common stock that is taxed to you as described below under the heading “Gain on Disposition of Common Stock.” Your adjusted tax basis in a share is generally your purchase price of such share, reduced by the amount of any such prior tax-free returns of capital (but not below zero).
If you wish to claim the benefit of an applicable treaty rate to avoid or reduce U.S. federal withholding tax on dividends, then you must (a) provide the applicable withholding agent with a properly completed IRS Form W-8BEN, in the case of an individual, or W-8BEN-E, in the case of an entity (or other applicable form) and certify under penalties of perjury that you are not a U.S. person and are eligible for treaty benefits, or (b) if our common stock is held through certain foreign intermediaries (including partnerships), satisfy the relevant certification requirements of applicable U.S. Treasury regulations. Special certification and other requirements apply to certain non-U.S. holders that act as intermediaries (including partnerships).
If you are eligible for a reduced rate of U.S. federal income tax pursuant to an income tax treaty, then you may obtain a refund or credit of any excess amounts withheld by timely filing an appropriate claim with the IRS.
133
Table of Contents
Gain on Disposition of Common Stock
Subject to the discussions below of backup withholding and FATCA, you generally will not be subject to U.S. federal income tax with respect to any gain realized on the sale or other taxable disposition of our common stock (other than certain redemptions treated as distributions with respect to our common stock), unless:
| • | the gain is effectively connected with a trade or business you conduct in the U.S.; |
| • | if you are an individual, you are present in the U.S. for 183 days or more in the taxable year of the sale or other taxable disposition and certain other conditions are met; or |
| • | we are or have been a “U.S. real property holding corporation” for U.S. federal income tax purposes at any time during the shorter of the five-year period ending on the date of the disposition or the period that you held shares of our common stock (the “specified testing period”), and certain other conditions are met. |
If you are a person described in the first bullet point above, you will be subject to tax on the net gain derived from the disposition under regular graduated U.S. federal income tax rates on a net income basis in generally the same manner as a U.S. person, unless an applicable income tax treaty provides otherwise. In addition, a non-U.S. holder that is a corporation may be subject to a branch profits tax equal to 30% of its effectively connected earnings and profits (or if an income tax treaty applies, at such lower rate as may be specified by an applicable income tax treaty, subject to adjustments). If you are an individual described in the second bullet point above, you will be subject to a flat 30% tax on the gain derived from the sale, which may be offset by U.S. source capital losses, even though you are not considered a resident of the United States under the Code. With respect to the third bullet point above, we believe that we are not, and we do not anticipate becoming, a “U.S. real property holding corporation” for U.S. federal income tax purposes; however, no assurance can be given in this regard. Even if we are or were to become a U.S. real property holding corporation, so long as our common stock continues to be traded on an established securities market, a non-U.S. holder generally would not be subject to U.S. federal income tax on any gain in respect of our common stock as long as such non-U.S. holder actually or constructively owned no more than 5% of our common stock during the specified testing period. If we are or were to become a U.S. real property holding corporation and you actually or constructively owned more than 5% of our common stock at any time during the specified testing period (or our common stock ceased to be traded on an established securities market), you would be subject to tax on the net gain derived from the sale under regular graduated U.S. federal income tax rates in generally the same manner as a U.S. person (unless an applicable income tax treaty provides otherwise).
Federal Estate Tax
Shares of common stock held (or deemed to be held) at the time of death by an individual non-U.S. holder who is neither a citizen nor resident of the United States (as specifically defined for U.S. estate tax purposes) will be included in such holder’s gross estate for U.S. federal estate tax purposes, unless an applicable estate tax treaty provides otherwise.
Information Reporting and Backup Withholding
We must report annually to the IRS and to you the amount of any dividends paid to you and the amount of tax, if any, withheld with respect to such dividends. The IRS may make this information available to the tax authorities in the country in which you are resident under the provisions of an applicable income tax treaty.
In addition, you may be subject to backup withholding (currently at a rate of 28%) with respect to dividends paid on, shares of our common stock, unless, generally, you certify under penalties of perjury (usually on IRS Form W-8BEN, in the case of an individual, or W-8BEN-E, in the case of an entity) that you are not a U.S. person or you otherwise establish an exemption. Information reporting and, depending on the circumstances, backup withholding will apply to the proceeds of a sale or other disposition of shares of our common stock within the United States or conducted through certain U.S.-related financial intermediaries, unless you certify under penalty of perjury that you are a non-U.S. holder or you otherwise establish an exemption.
134
Table of Contents
Backup withholding is not an additional tax. Any amounts withheld under the backup withholding rules may be allowed as a refund or a credit against your U.S. federal income tax liability, provided the required information is timely furnished by you to the IRS.
Additional Withholding Taxes Applicable to Common Stock Held By or Through Foreign Entities
In addition to the withholding discussed above, legislation enacted in 2010 (“FATCA”) generally imposes a withholding tax of 30 percent on dividend income from our common stock and, after December 31, 2016, the gross proceeds of a disposition of our common stock paid to a “foreign financial institution” (broadly defined for this purpose (and including where such entity is acting as an intermediary), and generally including a non-U.S. investment vehicle), unless such institution enters into an agreement with the U.S. government to collect and provide to the U.S. tax authorities substantial information regarding U.S. account holders of such institution (which would include certain equity and debt holders of such institution, as well as certain account holders that are foreign entities with U.S. owners). Different rules and exceptions may apply in the case of foreign financial institutions resident in jurisdictions that have entered into intergovernmental agreements with the United States to implement FATCA. Absent any applicable exception, this legislation also generally will impose a withholding tax of 30 percent on dividend income from our common stock and, after December 31, 2016, the gross proceeds of a disposition of our common stock paid to a foreign entity that is not a foreign financial institution (including where such entity is acting as an intermediary) unless such entity provides the withholding agent with a certification identifying the substantial U.S. owners of the entity, which generally includes any U.S. person who directly or indirectly own more than ten percent of the entity. Under certain circumstances, a non-U.S. holder of our common stock might be eligible for refunds or credits of such taxes, and a non-U.S. holder might be required to file a U.S. federal income tax return to claim such refunds or credits. Investors are encouraged to consult with their own tax advisors regarding the implications of this legislation on their investment in our common stock.
THE SUMMARY OF CERTAIN U.S. FEDERAL INCOME AND ESTATE TAX CONSEQUENCES ABOVE IS INCLUDED FOR GENERAL INFORMATION PURPOSES ONLY. POTENTIAL PURCHASERS OF OUR COMMON STOCK ARE URGED TO CONSULT THEIR OWN TAX ADVISORS TO DETERMINE THE U.S. FEDERAL, STATE, LOCAL AND NON-U.S. TAX CONSIDERATIONS OF PURCHASING, OWNING AND DISPOSING OF OUR COMMON STOCK.
135
Table of Contents
Merrill Lynch, Pierce, Fenner & Smith Incorporated, Goldman, Sachs & Co. and J.P. Morgan Securities LLC are acting as representatives of each of the underwriters named below. Subject to the terms and conditions set forth in an underwriting agreement among us, the selling stockholder and the underwriters, the selling stockholder has agreed to sell to the underwriters, and each of the underwriters has agreed, severally and not jointly, to purchase from the selling stockholder, the number of shares of common stock set forth opposite its name below.
| Underwriter |
Number of Shares |
|||
| Merrill Lynch, Pierce, Fenner &
Smith |
||||
| Goldman, Sachs & Co. |
||||
| J.P. Morgan Securities LLC |
||||
|
|
|
|||
| Total |
16,000,000 | |||
|
|
|
|||
Subject to the terms and conditions set forth in the underwriting agreement, the underwriters have agreed, severally and not jointly, to purchase all of the shares sold under the underwriting agreement if any of these shares are purchased. If an underwriter defaults, the underwriting agreement provides that the purchase commitments of the nondefaulting underwriters may be increased or the underwriting agreement may be terminated.
We and the selling stockholder have agreed to indemnify the underwriters against certain liabilities, including liabilities under the Securities Act, or to contribute to payments the underwriters as may be required to make in respect of those liabilities.
The underwriters are offering the shares, subject to prior sale, when, as and if issued to and accepted by them, subject to approval of legal matters by their counsel, including the validity of the shares, and other conditions contained in the underwriting agreement, such as the receipt by the underwriters of officer’s certificates and legal opinions. The underwriters reserve the right to withdraw, cancel or modify offers to the public and to reject orders in whole or in part.
Commissions and Discounts
The representatives have advised us and the selling stockholder that the underwriters propose initially to offer the shares to the public at the public offering price set forth on the cover of this prospectus and to dealers at that price less a concession not in excess of $ per share. After the initial offering, the public offering price, concession or any other term of the offering may be changed. Sales of shares made outside of the United States may be made by affiliates of the underwriters.
The following table shows the public offering price, underwriting discount and proceeds before expenses to the selling stockholder. The information assumes either no exercise or full exercise by the underwriters of their option to purchase additional shares from the selling stockholder.
| Per Share | Total Without Option |
Total With Option |
||||||||||
| Public offering price |
$ | $ | $ | |||||||||
| Underwriting discount |
||||||||||||
| Proceeds, before expenses, to the selling stockholder |
||||||||||||
136
Table of Contents
The expenses of this offering, not including the underwriting discount, are estimated at $ million and are payable by us. We have agreed with the underwriters to pay all expenses and application fees (including the legal fees of counsel for the underwriters) incurred and invoiced in connection with any filing with, and clearance of this offering by, the Financial Industry Regulatory Authority, Inc. in an aggregate amount not to exceed $25,000.
Option to Purchase Additional Shares
The selling stockholder has granted an option to the underwriters, exercisable for 30 days after the date of this prospectus, to purchase up to 2,400,000 additional shares at the public offering price, less the underwriting discount. If the underwriters exercise this option, each will be obligated, subject to conditions contained in the underwriting agreement, to purchase a number of additional shares proportionate to that underwriter’s initial amount reflected in the above table.
No Sales of Similar Securities
We, our directors and executive officers and the selling stockholder, have agreed not to sell or transfer any common stock or securities convertible into, exchangeable for, exercisable for, or repayable with common stock, for 90 days after the date of this prospectus without first obtaining the written consent of any two of the three representatives. Specifically, we and these other persons have agreed, with certain limited exceptions, not to directly or indirectly:
| • | offer, pledge, sell or contract to sell any common stock; |
| • | sell any option or contract to purchase any common stock; |
| • | purchase any option or contract to sell any common stock; |
| • | grant any option, right or warrant for the sale of any common stock; |
| • | lend or otherwise dispose of or transfer any common stock; |
| • | request or demand that we file a registration statement related to the common stock; or |
| • | enter into any swap or other agreement that transfers, in whole or in part, the economic consequence of ownership of any common stock whether any such swap or transaction is to be settled by delivery of shares or other securities, in cash or otherwise. |
This lock-up provision applies to common stock and to securities convertible into or exchangeable or exercisable for or repayable with common stock. It also applies to common stock owned now or acquired later by the person executing the agreement or for which the person executing the agreement later acquires the power of disposition. In the event that either (x) during the last 17 days of the lock-up period referred to above, we issue an earnings release or material news or a material event relating to us occurs or (y) prior to the expiration of the lock-up period, we announce that we will release earnings results or become aware that material news or a material event will occur during the 16-day period beginning on the last day of the lock-up period, the restrictions described above shall continue to apply until the expiration of the 18-day period beginning on the issuance of the earnings release or the occurrence of the material news or material event.
Stock Exchange Listing
Our common stock is listed on NASDAQ under the symbol “VWR.”
The underwriters do not expect to sell more than 5% of the shares in the aggregate to accounts over which they exercise discretionary authority.
137
Table of Contents
Price Stabilization and Short Positions
Until the distribution of the shares is completed, SEC rules may limit underwriters and selling group members from bidding for and purchasing our common stock. However, the representatives may engage in transactions that stabilize the price of the common stock, such as bids or purchases to peg, fix or maintain that price.
In connection with this offering, the underwriters may purchase and sell our common stock in the open market. These transactions may include short sales, purchases on the open market to cover positions created by short sales and stabilizing transactions. Short sales involve the sale by the underwriters of a greater number of shares than they are required to purchase in the offering. “Covered” short sales are sales made in an amount not greater than the underwriters’ option to purchase additional shares described above. The underwriters may close out any covered short position by either exercising their option to purchase additional shares or purchasing shares in the open market. In determining the source of shares to close out the covered short position, the underwriters will consider, among other things, the price of shares available for purchase in the open market as compared to the price at which they may purchase shares through the option granted to them. “Naked” short sales are sales in excess of such option. The underwriters must close out any naked short position by purchasing shares in the open market. A naked short position is more likely to be created if the underwriters are concerned that there may be downward pressure on the price of our common stock in the open market after pricing that could adversely affect investors who purchase in this offering. Stabilizing transactions consist of various bids for or purchases of shares of common stock made by the underwriters in the open market prior to the completion of this offering.
Similar to other purchase transactions, the underwriters’ purchases to cover the syndicate short sales may have the effect of raising or maintaining the market price of our common stock or preventing or retarding a decline in the market price of our common stock. As a result, the price of our common stock may be higher than the price that might otherwise exist in the open market. The underwriters may conduct these transactions on NASDAQ, in the over-the-counter market or otherwise.
Neither we nor the selling stockholder, nor any of the underwriters make any representation or prediction as to the direction or magnitude of any effect that the transactions described above may have on the price of our common stock. In addition, neither we nor the selling stockholder nor any of the underwriters make any representation that the representatives will engage in these transactions or that these transactions, once commenced, will not be discontinued without notice.
Passive Market Making
In connection with this offering, underwriters and selling group members may engage in passive market making transactions in the common stock on the Nasdaq Global Select Market in accordance with Rule 103 of Regulation M under the Exchange Act during a period before the commencement of offers or sales of common stock and extending through the completion of distribution. A passive market maker must display its bid at a price not in excess of the highest independent bid of that security. However, if all independent bids are lowered below the passive market maker’s bid, that bid must then be lowered when specified purchase limits are exceeded. Passive market making may cause the price of our common stock to be higher than the price that otherwise would exist in the open market in the absence of those transactions. The underwriters and dealers are not required to engage in passive market making and may end passive market making activities at any time.
Electronic Distribution
In connection with this offering, certain of the underwriters or securities dealers may distribute prospectuses by electronic means, such as e-mail.
138
Table of Contents
Other Relationships
The underwriters and their respective affiliates are full service financial institutions engaged in various activities, which may include securities trading, commercial and investment banking, financial advisory, investment management, investment research, principal investment, hedging, financing and brokerage activities.
Certain of the underwriters and their affiliates have provided in the past to us and our affiliates and may provide from time to time in the future certain commercial banking, financial advisory, investment banking and other services for us and such affiliates in the ordinary course of their business, for which they have received and may continue to receive customary fees and commissions. From time to time, certain of the underwriters and their affiliates may effect transactions for their own account or the account of customers, and hold on behalf of themselves or their customers, long or short positions in our debt or equity securities or loans, and may do so in the future. Specifically, Merrill Lynch, Pierce, Fenner & Smith Incorporated, Goldman, Sachs & Co. and J.P. Morgan Securities LLC or their respective affiliates acted as joint lead arrangers, an affiliate of Merrill Lynch, Pierce, Fenner & Smith Incorporated serves as administrative agent and collateral agent, affiliates of J.P. Morgan Securities LLC and Deutsche Bank Securities Inc. serve as co-documentation agents and an affiliate of Goldman, Sachs & Co. serves as syndication agent under our Senior Credit Facility. In addition, certain of the underwriters or their respective affiliates serve as lenders under our Senior Credit Facility. See “Description of Certain Indebtedness—Senior Credit Facility.” In addition, certain of the underwriters acted as initial purchasers of the 2017 Senior Notes and the Euro Notes, for which they received customary discounts and commissions. See “Description of Certain Indebtedness.” As of May 20, 2015, affiliates of Goldman, Sachs & Co. own approximately 3.4% of our total outstanding common stock through their ownership interests in VWR Holdings.
In the ordinary course of their various business activities, the underwriters and their respective affiliates may make or hold a broad array of investments and actively trade debt and equity securities (or related derivative securities) and financial instruments (including bank loans) for their own account and for the accounts of their customers, and such investment and securities activities may involve securities and/or instruments of the issuer. The underwriters and their respective affiliates may also make investment recommendations and/or publish or express independent research views in respect of such securities or instruments and may, at any time, hold, or recommend to clients that they acquire long and/or short positions in such securities and instruments.
Sales Outside of the United States
Other than in the United States, no action has been taken by us or the underwriters that would permit a public offering of the securities offered by this prospectus in any jurisdiction where action for that purpose is required. The securities offered by this prospectus may not be offered or sold, directly or indirectly, nor may this prospectus or any other offering material or advertisements in connection with the offer and sale of any such securities be distributed or published in any jurisdiction, except under circumstances that will result in compliance with the applicable rules and regulations of that jurisdiction. Persons into whose possession this prospectus comes are advised to inform themselves about and to observe any restrictions relating to this offering and the distribution of this prospectus. This prospectus does not constitute an offer to sell or a solicitation of an offer to buy any securities offered by this prospectus in any jurisdiction in which such an offer or a solicitation is unlawful.
Notice to Prospective Investors in the European Economic Area
In relation to each Member State of the European Economic Area (each, a “Relevant Member State”), no offer of shares may be made to the public in that Relevant Member State other than:
| A. | to any legal entity which is a qualified investor as defined in the Prospectus Directive; |
139
Table of Contents
| B. | to fewer than 150, natural or legal persons (other than qualified investors as defined in the Prospectus Directive), as permitted under the Prospectus Directive, subject to obtaining the prior consent of the representatives; or |
| C. | in any other circumstances falling within Article 3(2) of the Prospectus Directive, |
provided that no such offer of shares shall require the Company or the representatives to publish a prospectus pursuant to Article 3 of the Prospectus Directive or supplement a prospectus pursuant to Article 16 of the Prospectus Directive.
Each person in a Relevant Member State who initially acquires any shares or to whom any offer is made will be deemed to have represented, acknowledged and agreed that it is a “qualified investor” within the meaning of the law in that Relevant Member State implementing Article 2(1)(e) of the Prospectus Directive. In the case of any shares being offered to a financial intermediary as that term is used in Article 3(2) of the Prospectus Directive, each such financial intermediary will be deemed to have represented, acknowledged and agreed that the shares acquired by it in the offer have not been acquired on a non-discretionary basis on behalf of, nor have they been acquired with a view to their offer or resale to, persons in circumstances which may give rise to an offer of any shares to the public other than their offer or resale in a Relevant Member State to qualified investors as so defined or in circumstances in which the prior consent of the representatives has been obtained to each such proposed offer or resale.
The Company, the representatives and their affiliates will rely upon the truth and accuracy of the foregoing representations, acknowledgements and agreements.
This prospectus has been prepared on the basis that any offer of shares in any Relevant Member State will be made pursuant to an exemption under the Prospectus Directive from the requirement to publish a prospectus for offers of shares. Accordingly any person making or intending to make an offer in that Relevant Member State of shares which are the subject of the offering contemplated in this prospectus may only do so in circumstances in which no obligation arises for the Company or any of the underwriters to publish a prospectus pursuant to Article 3 of the Prospectus Directive in relation to such offer. Neither the Company nor the underwriters have authorized, nor do they authorize, the making of any offer of shares in circumstances in which an obligation arises for the Company or the underwriters to publish a prospectus for such offer.
For the purpose of the above provisions, the expression “an offer to the public” in relation to any shares in any Relevant Member State means the communication in any form and by any means of sufficient information on the terms of the offer and the shares to be offered so as to enable an investor to decide to purchase or subscribe the shares, as the same may be varied in the Relevant Member State by any measure implementing the Prospectus Directive in the Relevant Member State and the expression “Prospectus Directive” means Directive 2003/71/EC (as amended, including by Directive 2010/73/EU) and includes any relevant implementing measure in the Relevant Member State.
Notice to Prospective Investors in the United Kingdom
In addition, in the United Kingdom, this document is being distributed only to, and is directed only at, and any offer subsequently made may only be directed at persons who are “qualified investors” (as defined in the Prospectus Directive) (i) who have professional experience in matters relating to investments falling within Article 19 (5) of the Financial Services and Markets Act 2000 (Financial Promotion) Order 2005, as amended (the “Order”) and/or (ii) who are high net worth companies (or persons to whom it may otherwise be lawfully communicated) falling within Article 49(2)(a) to (d) of the Order (all such persons together being referred to as “relevant persons”). This document must not be acted on or relied on in the United Kingdom by persons who are not relevant persons. In the United Kingdom, any investment or investment activity to which this document relates is only available to, and will be engaged in with, relevant persons.
140
Table of Contents
Notice to Prospective Investors in Switzerland
The shares may not be publicly offered in Switzerland and will not be listed on the SIX Swiss Exchange (“SIX”) or on any other stock exchange or regulated trading facility in Switzerland. This document has been prepared without regard to the disclosure standards for issuance prospectuses under art. 652a or art. 1156 of the Swiss Code of Obligations or the disclosure standards for listing prospectuses under art. 27 ff. of the SIX Listing Rules or the listing rules of any other stock exchange or regulated trading facility in Switzerland. Neither this document nor any other offering or marketing material relating to the shares or the offering may be publicly distributed or otherwise made publicly available in Switzerland.
Neither this document nor any other offering or marketing material relating to this offering, the Company, the shares have been or will be filed with or approved by any Swiss regulatory authority. In particular, this document will not be filed with, and the offer of shares will not be supervised by, the Swiss Financial Market Supervisory Authority FINMA (“FINMA”), and the offer of shares has not been and will not be authorized under the Swiss Federal Act on Collective Investment Schemes (“CISA”). The investor protection afforded to acquirers of interests in collective investment schemes under the CISA does not extend to acquirers of shares.
Notice to Prospective Investors in the Dubai International Financial Centre
This prospectus relates to an Exempt Offer in accordance with the Offered Securities Rules of the Dubai Financial Services Authority (“DFSA”). This prospectus is intended for distribution only to persons of a type specified in the Offered Securities Rules of the DFSA. It must not be delivered to, or relied on by, any other person. The DFSA has no responsibility for reviewing or verifying any documents in connection with Exempt Offers. The DFSA has not approved this prospectus nor taken steps to verify the information set forth herein and has no responsibility for the prospectus. The shares to which this prospectus relates may be illiquid and/or subject to restrictions on their resale. Prospective purchasers of the shares offered should conduct their own due diligence on the shares. If you do not understand the contents of this prospectus you should consult an authorized financial advisor.
Notice to Prospective Investors in Australia
No placement document, prospectus, product disclosure statement or other disclosure document has been lodged with the Australian Securities and Investments Commission, in relation to this offering. This prospectus does not constitute a prospectus, product disclosure statement or other disclosure document under the Corporations Act 2001 (the “Corporations Act”), and does not purport to include the information required for a prospectus, product disclosure statement or other disclosure document under the Corporations Act.
Any offer in Australia of the shares may only be made to persons (the “Exempt Investors”) who are “sophisticated investors” (within the meaning of section 708(8) of the Corporations Act), “professional investors” (within the meaning of section 708(11) of the Corporations Act) or otherwise pursuant to one or more exemptions contained in section 708 of the Corporations Act so that it is lawful to offer the shares without disclosure to investors under Chapter 6D of the Corporations Act.
The shares applied for by Exempt Investors in Australia must not be offered for sale in Australia in the period of 12 months after the date of allotment under the offering, except in circumstances where disclosure to investors under Chapter 6D of the Corporations Act would not be required pursuant to an exemption under section 708 of the Corporations Act or otherwise or where the offer is pursuant to a disclosure document which complies with Chapter 6D of the Corporations Act. Any person acquiring shares must observe such Australian on-sale restrictions.
This prospectus contains general information only and does not take account of the investment objectives, financial situation or particular needs of any particular person. It does not contain any securities
141
Table of Contents
recommendations or financial product advice. Before making an investment decision, investors need to consider whether the information in this prospectus is appropriate to their needs, objectives and circumstances, and, if necessary, seek expert advice on those matters.
Notice to Prospective Investors in Hong Kong
The shares have not been offered or sold and will not be offered or sold in Hong Kong, by means of any document, other than (a) to “professional investors” as defined in the Securities and Futures Ordinance (Cap. 571) of Hong Kong and any rules made under that Ordinance; or (b) in other circumstances which do not result in the document being a “prospectus” as defined in the Companies Ordinance (Cap. 32) of Hong Kong or which do not constitute an offer to the public within the meaning of that Ordinance. No advertisement, invitation or document relating to the shares has been or may be issued or has been or may be in the possession of any person for the purposes of issue, whether in Hong Kong or elsewhere, which is directed at, or the contents of which are likely to be accessed or read by, the public of Hong Kong (except if permitted to do so under the securities laws of Hong Kong) other than with respect to the shares which are or are intended to be disposed of only to persons outside Hong Kong or only to “professional investors” as defined in the Securities and Futures Ordinance and any rules made under that Ordinance.
Notice to Prospective Investors in Japan
The securities have not been and will not be registered under the Financial Instruments and Exchange Law of Japan (Law No. 25 of 1948, as amended) and, accordingly, will not be offered or sold, directly or indirectly, in Japan, or for the benefit of any Japanese Person or to others for re-offering or resale, directly or indirectly, in Japan or to any Japanese Person, except in compliance with all applicable laws, regulations and ministerial guidelines promulgated by relevant Japanese governmental or regulatory authorities in effect at the relevant time. For the purposes of this paragraph, “Japanese Person” shall mean any person resident in Japan, including any corporation or other entity organized under the laws of Japan.
Notice to Prospective Investors in Singapore
This prospectus has not been registered as a prospectus with the Monetary Authority of Singapore. Accordingly, this prospectus and any other document or material in connection with the offer or sale, or invitation for subscription or purchase, of the shares may not be circulated or distributed, nor may the shares be offered or sold, or be made the subject of an invitation for subscription or purchase, whether directly or indirectly, to persons in Singapore other than (i) to an institutional investor under Section 274 of the Securities and Futures Act, Chapter 289 of Singapore (the “SFA”), (ii) to a relevant person pursuant to Section 275(1), or any person pursuant to Section 275(1A), and in accordance with the conditions specified in Section 275, of the SFA, or (iii) otherwise pursuant to, and in accordance with the conditions of, any other applicable provision of the SFA.
Where the shares are subscribed or purchased under Section 275 of the SFA by a relevant person which is: (a) a corporation (which is not an accredited investor (as defined in Section 4A of the SFA)) the sole business of which is to hold investments and the entire share capital of which is owned by one or more individuals, each of whom is an accredited investor; or (b) a trust (where the trustee is not an accredited investor) whose sole purpose is to hold investments and each beneficiary of the trust is an individual who is an accredited investor, securities (as defined in Section 239(1) of the SFA) of that corporation or the beneficiaries’ rights and interest (howsoever described) in that trust shall not be transferred within six months after that corporation or that trust has acquired the shares pursuant to an offer made under Section 275 of the SFA except: (a) to an institutional investor or to a relevant person defined in Section 275(2) of the SFA, or to any person arising from an offer referred to in Section 275(1A) or Section 276(4)(i)(B) of the SFA; (b) where no consideration is or will be given for the transfer; (c) where the transfer is by operation of law; (d) as specified in Section 276(7) of the SFA; or (e) as specified in Regulation 32 of the Securities and Futures (Offers of Investments) (Shares and Debentures) Regulations 2005 of Singapore.
142
Table of Contents
The validity of the common stock offered hereby will be passed upon for us by Kirkland & Ellis LLP (a partnership that includes professional corporations), Chicago, Illinois. The underwriters have been represented by Cahill Gordon & Reindel LLP, New York, New York. Kirkland & Ellis LLP has from time to time represented and may continue to represent, Madison Dearborn Partners and some of its affiliates in connection with various legal matters. Certain partners of Kirkland & Ellis LLP are members of a limited partnership that is an investor in one or more investment funds affiliated with Madison Dearborn Partners.
The consolidated financial statements of VWR Corporation and its subsidiaries as of December 31, 2014 and 2013, and for each of the years in the three-year period ended December 31, 2014, have been incorporated by reference herein in reliance upon the report of KPMG LLP, independent registered public accounting firm, incorporated by reference herein, and upon the authority of said firm as experts in accounting and auditing.
WHERE YOU CAN FIND MORE INFORMATION
We have filed a Registration Statement on Form S-1 with the SEC with respect to our common stock being distributed as contemplated by this prospectus. This prospectus is a part of and does not contain all of the information set forth in, the Registration Statement and the exhibits and schedules to the Registration Statement. For further information with respect to the Company and our common stock, please refer to the Registration Statement, including its exhibits and schedules. Statements made in this prospectus relating to any contract or other document are not necessarily complete and you should refer to the exhibits attached to the Registration Statement for copies of the actual contract or document. You may read and copy all materials that we file with the SEC, including the Registration Statement and its exhibits and schedules, at the SEC’s public reference room, located at 100 F Street, N.E., Washington, D.C. 20549, as well as on the Internet website maintained by the SEC at www.sec.gov. Please call the SEC at 1-800-SEC-0330 for more information on the public reference room. Information contained on any website referenced in this prospectus does not and will not constitute a part of this prospectus or the Registration Statement on Form S-1 of which this prospectus is a part.
In addition, we file periodic reports and other information with the SEC.
You may request a copy of any of our filings with the SEC at no cost, by writing us at the following address or telephoning us at the following number:
VWR Corporation
Radnor Corporate Center
Building One, Suite 200
100 Matsonford Road
Radnor, Pennsylvania 19087
(610) 386-1700
You should rely only on the information contained in this prospectus or to which we have referred you. We have not authorized any person to provide you with different information or to make any representation not contained in this prospectus.
143
Table of Contents
INCORPORATION OF CERTAIN INFORMATION BY REFERENCE
We are incorporating by reference into this registration statement certain documents that we file with the SEC, which means that we are disclosing important information to you by referring you to those documents. We incorporate by reference into this registration statement the documents listed below (other than any portions thereof, which under the Exchange Act and applicable SEC rules, are not deemed “filed” under the Exchange Act), which we have filed with the SEC:
| • | our Annual Report on Form 10-K, filed with the SEC on March 4, 2015; |
| • | our Quarterly Report on Form 10-Q, filed with the SEC on May 14, 2015; |
| • | the portions of our Definitive Proxy Statement on Schedule 14A for the 2015 annual meeting of the stockholders incorporated by reference in the Annual Report on Form 10-K for the fiscal year ended December 31, 2014 (including, without limitation, the information under the caption entitled “Executive Compensation” contained on pages 30 to 48 thereof); and |
| • | our Current Reports on Form 8-K, filed with the SEC on March 25, 2015, May 13, 2015 and May 19, 2015. |
We will provide, without charge, upon written or oral request, a copy of any or all of the documents that are incorporated by reference into this registration statement, excluding any exhibits to those documents unless the exhibit is specifically incorporated by reference as an exhibit in this registration statement.
You should direct requests for documents to:
VWR Corporation
Radnor Corporate Center
Building One, Suite 200
100 Matsonford Road
Radnor, Pennsylvania 19087
(610) 386-1700
144
Table of Contents
16,000,000 Shares
Common Stock
PROSPECTUS
BofA Merrill Lynch
Goldman, Sachs & Co.
J.P. Morgan
, 2015
Table of Contents
PART II
INFORMATION NOT REQUIRED IN PROSPECTUS
Item 13. Other Expenses of Issuance and Distribution
The following table sets forth all costs and expenses, other than the underwriting discounts and commissions payable by us, in connection with the offer and sale of the securities being registered. All amounts shown are estimates except for the SEC registration fee.
| Amount | ||||
| SEC registration fee |
$ | 59,717 | ||
| FINRA filing fee |
77,587 | |||
| Exchange listing fee |
* | |||
| Legal fees and expenses |
* | |||
| Accounting fees and expenses |
* | |||
| Printing expenses |
* | |||
| Miscellaneous expenses |
* | |||
|
|
|
|||
| Total |
$ | * | ||
|
|
|
|||
| * | To be provided by amendment. |
Item 14. Indemnification of Officers and Directors
Section 102(b)(7) of the DGCL allows a corporation to provide in its certificate of incorporation that a director of the corporation will not be personally liable to the corporation or its stockholders for monetary damages for breach of fiduciary duty as a director, except where the director breached the duty of loyalty, failed to act in good faith, engaged in intentional misconduct or knowingly violated a law, authorized the payment of a dividend or approved a stock repurchase in violation of Delaware corporate law or obtained an improper personal benefit. Our amended and restated certificate of incorporation provides for this limitation of liability.
Section 145 of the DGCL (“Section 145”), provides that a Delaware corporation may indemnify any person who was, is or is threatened to be made, party to any threatened, pending or completed action, suit or proceeding, whether civil, criminal, administrative or investigative (other than an action by or in the right of such corporation), by reason of the fact that such person is or was an officer, director, employee or agent of such corporation or is or was serving at the request of such corporation as a director, officer, employee or agent of another corporation or enterprise. The indemnity may include expenses (including attorneys’ fees), judgments, fines and amounts paid in settlement actually and reasonably incurred by such person in connection with such action, suit or proceeding, provided such person acted in good faith and in a manner he reasonably believed to be in or not opposed to the corporation’s best interests and, with respect to any criminal action or proceeding, had no reasonable cause to believe that his or her conduct was illegal. Where an officer or director is successful on the merits or otherwise in the defense of any action referred to above, the corporation must indemnify him against the expenses which such officer or director has actually and reasonably incurred.
Section 145 further authorizes a corporation to purchase and maintain insurance on behalf of any person who is or was a director, officer, employee or agent of the corporation or is or was serving at the request of the corporation as a director, officer, employee or agent of another corporation or enterprise, against any liability asserted against him and incurred by him in any such capacity, or arising out of his or her status as such, whether or not the corporation would otherwise have the power to indemnify him under Section 145.
Our amended and restated certificate of incorporation provides that we must indemnify our directors and officers to the fullest extent authorized by the DGCL and must also pay expenses incurred in defending any such proceeding in advance of its final disposition upon delivery of an undertaking, by or on behalf of an indemnified
II-1
Table of Contents
person, to repay all amounts so advanced if it should be determined ultimately that such person is not entitled to be indemnified under this section or otherwise.
We have entered into indemnification agreements with each of our current directors and officers. These agreements require us to indemnify these individuals to the fullest extent permitted under Delaware law against liabilities that may arise by reason of their service to us, and to advance expenses incurred as a result of any proceeding against them as to which they could be indemnified.
The indemnification rights set forth above shall not be exclusive of any other right which an indemnified person may have or hereafter acquire under any statute, provision of our amended and restated certificate of incorporation, our amended and restated by-laws, agreement, vote of stockholders or disinterested directors or otherwise.
We maintain standard policies of insurance that provide coverage (1) to our directors and officers against loss rising from claims made by reason of breach of duty or other wrongful act and (2) to us with respect to indemnification payments that we may make to such directors and officers.
The proposed form of underwriting agreement to be filed as Exhibit 1.1 to this Registration Statement provides for indemnification to our directors and officers by the underwriters against certain liabilities.
Item 15. Recent Sales of Unregistered Securities
None.
Item 16. Exhibits and Financial Statement Schedules
| (a) | The list of exhibits is set forth under “Exhibit Index” at the end of this registration statement and is incorporated herein by reference. |
| (b) | All schedules have been omitted because the information required to be set forth in the schedules is either not applicable or is shown in the financial statements or notes thereto. |
Item 17. Undertakings
Insofar as indemnification for liabilities arising under the Securities Act may be permitted to directors, officers and controlling persons of the registrant pursuant to the foregoing provisions, or otherwise, the registrant has been advised that in the opinion of the Securities and Exchange Commission, such indemnification is against public policy as expressed in the Securities Act, and is, therefore, unenforceable. In the event that a claim for indemnification against such liabilities (other than the payment by the registrant of expenses incurred or paid by a director, officer or controlling person of the registrant in the successful defense of any action, suit or proceeding) is asserted by such director, officer or controlling person in connection with the securities being registered, the registrant will, unless in the opinion of its counsel the matter has been settled by controlling precedent, submit to a court of appropriate jurisdiction the question of whether such indemnification is against public policy as expressed in the Securities Act and will be governed by the final adjudication of such issue.
The undersigned registrant hereby undertakes that:
(i) for purposes of determining any liability under the Securities Act, the information omitted from the form of prospectus filed as part of this registration statement in reliance upon Rule 430A and contained in a form of prospectus filed by the registrant pursuant to Rule 424(b)(1) or (4) or 497(h) under the Securities Act shall be deemed to be part of this registration statement as of the time it was declared effective; and
(ii) for the purpose of determining any liability under the Securities Act, each post-effective amendment that contains a form of prospectus shall be deemed to be a new registration statement relating to the securities offered therein, and the offering of such securities at that time shall be deemed to be the initial bona fide offering thereof.
II-2
Table of Contents
SIGNATURES
Pursuant to the requirements of the Securities Act of 1933, the registrant has duly caused this Registration Statement on Form S-1 to be signed on its behalf by the undersigned, thereunto duly authorized, in the Township of Radnor, State of Pennsylvania, on May 21, 2015.
| VWR Corporation | ||
| /s/ Manuel Brocke-Benz | ||
| Name: Manuel Brocke-Benz | ||
| Title: Director, President and Chief Executive Officer | ||
POWER OF ATTORNEY
Each person whose signature appears below constitutes and appoints Messrs. Gregory L. Cowen, George Van Kula, Scott K. Baker and James M. Kalinovich and each of them singly, his true and lawful attorneys-in-fact and agents, with full power of substitution and resubstitution, for him and in his name, place and stead, in any and all capacities, to sign any and all amendments (including post-effective amendments) to this registration statement and any and all additional registration statements pursuant to Rule 462(b) of the Securities Act and to file the same, with all exhibits thereto and all other documents in connection therewith, with the Securities and Exchange Commission, granting unto each said attorney-in-fact and agents full power and authority to do and perform each and every act in person, hereby ratifying and confirming all that said attorneys-in-fact and agents or either of them or their or his substitute or substitutes may lawfully do or cause to be done by virtue hereof.
Pursuant to the requirements of the Securities Act of 1933, this registration statement has been signed by the following persons in the capacities indicated on May 21, 2015.
| /s/ Manuel Brocke-Benz Manuel Brocke-Benz |
Director, President and Chief Executive Officer (principal executive officer) | |
| /s/ Gregory L. Cowan Gregory L. Cowan |
Senior Vice President, Chief Financial Officer (principal financial officer) | |
| /s/ Douglas J. Pitts Douglas J. Pitts |
Vice President and Corporate Controller (principal accounting officer) | |
| /s/ Harry M. Jansen Kraemer, Jr. Harry M. Jansen Kraemer, Jr. |
Chairman of the Board | |
| /s/ Nicholas W. Alexos Nicholas W. Alexos |
Director | |
| /s/ Robert L. Barchi Robert L. Barchi |
Director | |
| /s/ Edward A. Blechschmidt Edward A. Blechschmidt |
Director | |
II-3
Table of Contents
| /s/ Thompson Dean Thompson Dean |
Director | |
| /s/ Robert P. DeCresce Robert P. DeCresce |
Director | |
| /s/ Pamela Forbes Lieberman Pamela Forbes Lieberman |
Director | |
| /s/ Carlos del Salto Carlos del Salto |
Director | |
| /s/ Timothy P. Sullivan Timothy P. Sullivan |
Director | |
| /s/ Robert J. Zollars Robert J. Zollars |
Director | |
II-4
Table of Contents
EXHIBIT INDEX
| Location of Exhibit(2) | ||||||||||
| Exhibit |
Exhibit Description(1) |
Form | Exhibit No. |
Filing Date | Filer | |||||
| 1.1 | Form of Underwriting Agreement | * | ||||||||
| 2.2 | First Amendment to said Merger Agreement, dated May 7, 2007 | 10-Q | 10.1(b) | 8/14/2007 | VWRF | |||||
| 2.3 | Second Amendment to said Merger Agreement, dated May 7, 2007 | 10-Q | 10.1(c) | 8/14/2007 | VWRF | |||||
| 3.1 | Amended and Restated Certificate of Incorporation of VWR Corporation | 8-K | 3.1 | 10/7/2014 | VWRC | |||||
| 3.2 | Amended and Restated Bylaws | 8-K | 3.2 | 10/7/2014 | VWRC | |||||
| 4.1 | Indenture, dated as of September 4, 2012, among VWR Funding, Inc., the guarantors named therein and Law Debenture Trust Company of New York, as Trustee, relating to 7.25% Senior Notes due 2017 | 8-K | 4.1 | 9/5/2012 | VWRF | |||||
| 4.2 | Form of 7.25% Senior Notes due 2017 | 8-K | 4.2 | 9/5/2012 | VWRF | |||||
| 4.3 | Exchange and Registration Rights Agreement, dated as of September 4, 2012, among VWR Funding, Inc., the Guarantors from time to time parties thereto, and the Purchasers named therein | 8-K | 4.3 | 9/5/2012 | VWRF | |||||
| 4.4 | Form of stock certificate | S-1/A | 4.6 | 9/17/2014 | VWRC | |||||
| 4.5 | Indenture, dated as of March 25, 2015, among VWR Funding, Inc., the guarantors party thereto, Law Debenture Trust Company of New York, as trustee, Deutsche Bank AG, London Branch, as paying agent and Deutsche Bank Luxembourg S.A., as registrar and transfer agent. | 8-K | 4.1 | 3/25/2015 | VWRC | |||||
| 5.1 | Opinion of Kirkland & Ellis LLP | ** | ||||||||
| 10.1+ | Varietal Distribution Holdings, LLC 2007 Securities Purchase Plan | 10-Q | 10.3(a) | 4/5/2012 | VWRF | |||||
| 10.2+ | Varietal Distribution Holdings, LLC 2007 Securities Purchase Plan, as amended | 8-K | 10.1 | 4/4/2012 | VWRF | |||||
| 10.3+ | Varietal Distribution Holdings, LLC 2007 Securities Purchase Plan, as amended | 8-K | 10.1 | 1/2/2013 | VWRF | |||||
| 10.4+ | Varietal Distribution Holdings, LLC 2007 Securities Purchase Plan, as amended | 8-K | 10.1 | 12/17/2013 | VWRF | |||||
| 10.5+ | Varietal Distribution Holdings, LLC 2007 Securities Purchase Plan, as amended | 10-K | 10.2(e) | 3/3/2014 | VWRF | |||||
| 10.6+ | Limited Liability Company Agreement, dated June 29, 2007, among Varietal Distribution Holdings, LLC and the unitholders named therein from time to time | 10-Q | 10.3(b) | 8/14/2007 | VWRF | |||||
| 10.7+ | Securityholders Agreement, dated June 29, 2007, among Varietal Distribution Holdings, LLC and the other parties named therein from time to time | 10-Q | 10.3(c) | 8/14/2007 | VWRF | |||||
II-5
Table of Contents
| Location of Exhibit(2) | ||||||||||
| Exhibit |
Exhibit Description(1) |
Form | Exhibit No. |
Filing Date | Filer | |||||
| 10.8+ | Form of Management Unit Purchase Agreement | 10-Q | 10.3(d) | 8/14/2007 | VWRF | |||||
| 10.9+ | Form of Incentive Unit Grant Agreement | 8-K | 10.2 | 4/5/2012 | VWRF | |||||
| 10.10+ | Form of Time-Based Incentive Unit Grant Agreement | 8-K | 10.2 | 1/2/2013 | VWRF | |||||
| 10.11+ | Form of Incentive Program Unit Grant Agreement | 8-K | 10.1 | 4/4/2013 | VWRF | |||||
| 10.12+ | Form of Class A Common Management Unit Purchase Agreement | 8-K | 10.3 | 12/17/2013 | VWRF | |||||
| 10.13+ | Employment Letter, dated April 3, 2013, between Varietal Management Services GmbH and Manuel Brocke-Benz | 8-K | 10.2 | 4/4/2013 | VWRF | |||||
| 10.14+ | Management Unit Purchase Agreement, dated March 29, 2013, between Varietal Distribution Holdings, LLC and Manuel Brocke-Benz | 8-K | 10.3 | 4/4/2013 | VWRF | |||||
| 10.15+ | Amended and Restated Employment Letter, dated December 20, 2010, between VWR Management Services, LLC and Gregory L. Cowan | 10-K | 10.5 | 2/25/2011 | VWRF | |||||
| 10.16+ | Amended and Restated Employment Letter, dated December 20, 2010, between VWR Management Services, LLC and George Van Kula | 10-K | 10.8 | 2/25/2011 | VWRF | |||||
| 10.17+ | Employment Agreement, dated February 18, 2013, between VWR International Management GmbH & Co. KG and Peter Schuele | 10-K | 10.7 | 3/3/2014 | VWRF | |||||
| 10.18+ | Employment Letter, dated July 24, 2012 between VWR Management Services, LLC and Mark T. McLoughlin | 10-K | 10.8 | 3/3/2014 | VWRF | |||||
| 10.19 | Credit Agreement, dated as of June 29, 2007, among VWR Funding, Inc., the Foreign Subsidiary Borrowers from time to time parties thereto, the Lenders from time to time parties thereto, Bank of America, N.A., as Administrative Agent and Collateral Agent, and the Arrangers and other Agents named therein | 10-Q | 4.5(a) | 8/14/2007 | VWRF | |||||
| 10.20 | Amendment No.1, dated as of June 4, 2012, to the Credit Agreement dated as of June 29, 2007 among VWR Funding, Inc., VWR Investors, Inc., each of the Foreign Subsidiary Borrowers from time to time party thereto, each of the Subsidiary Guarantors, each of the Lenders party thereto, and Bank of America, N.A., as Administrative Agent and Collateral Agent | 8-K | 10.1 | 6/5/2012 | VWRF | |||||
| 10.21 | Incremental Amendment, dated as of January 31, 2013, to the Credit Agreement dated as of June 29, 2007, as amended as of June 4, 2012 (as further amended, supplemented or otherwise modified from time to time) among VWR Funding Inc., VWR Investors, Inc., each of the Foreign Subsidiary Borrowers from time to time party thereto, each of the Subsidiary Guarantors, each of the Lenders party thereto, and Bank of America, N.A., as Administrative Agent and Collateral Agent | 8-K | 10.1 | 2/1/2013 | VWRF | |||||
II-6
Table of Contents
| Location of Exhibit(2) | ||||||||||
| Exhibit |
Exhibit Description(1) |
Form | Exhibit No. |
Filing Date | Filer | |||||
| 10.22 | Amendment No. 2 dated as of January 29, 2014 to the Credit Agreement dated as of June 29, 2007, as amended as of June 4, 2012 and as of January 31, 2013 (as further amended, supplemented or otherwise modified from time to time), among VWR Funding Inc., VWR Investors, Inc., each of the Foreign Subsidiary Borrowers from time to time party thereto, each of the Subsidiary Guarantors, each of the Lenders party thereto, and Bank of America, N.A., as Administrative Agent and Collateral Agent | 8-K | 10.1 | 2/4/2014 | VWRF | |||||
| 10.23 | Guarantee and Collateral Agreement, dated as of June 29, 2007, among VWR Investors, Inc., VWR Funding, Inc., the Subsidiaries from time to time parties thereto, and Bank of America, N.A., as Collateral Agent | 10-K | 4.2(b) | 3/2/2012 | VWRF | |||||
| 10.24 | Amendment No. 1 dated as of June 4, 2012, to the Guarantee and Collateral Agreement, dated as of June 29, 2007, among VWR Funding, Inc., VWR Investors, Inc., each of the Subsidiary Guarantors from time to time a party to the Guarantee and Collateral Agreement, and Bank of America, N.A., as Collateral Agent | 8-K | 10.2 | 6/5/2012 | VWRF | |||||
| 10.25+ | VWR International Nonqualified Deferred Compensation Plan, effective May 1, 2007 (“DC Plan”) | 10-Q | 10.1 | 5/14/2007 | VWRF | |||||
| 10.26+ | Amendment to DC Plan | 10-K | 10.9(b) | 3/12/2008 | VWRF | |||||
| 10.27+ | VWR International Nonqualified Deferred Compensation Plan Trust Agreement, dated as of, May 1, 2007 (“Trust Agreement”), between VWR International, Inc. and Wells Fargo, N.A. | 10-Q | 10.2 | 5/14/2007 | VWRF | |||||
| 10.28+ | Amendment to Trust Agreement | 10-K | 10.1(b) | 3/12/2008 | VWRF | |||||
| 10.29+ | VWR International Amended and Restated Retirement Plan (“Retirement Plan”) | 10-K | 10.11 | 3/2/2012 | VWRF | |||||
| 10.30+ | Amendment No. 1 to Retirement Plan | 10-K | 10.12(b) | 3/3/2014 | VWRF | |||||
| 10.31+ | Amendment No. 2 to Retirement Plan | 10-Q | 10.2 | 5/14/2014 | VWRF | |||||
| 10.32+ | Amendment No. 3 to Retirement Plan | 10-Q | 10.3 | 5/14/2014 | VWRF | |||||
| 10.33+ | Amendment No. 4 to Retirement Plan | 10-Q | 10.4 | 5/14/2014 | VWRF | |||||
| 10.34+ | Amendment No. 5 to Retirement Plan | 10-Q | 10.5 | 5/14/2014 | VWRF | |||||
| 10.35+ | VWR International, LLC Amended and Restated Supplemental Benefits Plan | 10-K | 10.12 | 3/30/2009 | VWRF | |||||
| 10.36+ | Board Compensation Policy | 10-K | 10.36 | 3/4/2015 | VWRC | |||||
II-7
Table of Contents
| Location of Exhibit(2) | ||||||||||
| Exhibit |
Exhibit Description(1) |
Form | Exhibit No. |
Filing Date | Filer | |||||
| 10.37 | Receivables Purchase Agreement, dated November 4, 2011, among VWR Receivables Funding, LLC, VWR International, LLC, the various conduit purchasers from time to time party thereto, the various related committed purchasers from time to time party thereto, the various purchaser agents from time to time party thereto, the various LC participants from time to time party thereto and PNC Bank, National Association, as Administrator and LC Bank | 10-Q | 10.2 | 11/9/2011 | VWRF | |||||
| 10.38 | Amendment No. 1 to Receivables Purchase Agreement, dated December 10, 2012, among VWR Receivables Funding, LLC, VWR International, LLC, PNC Bank, National Association, as Administrator, Purchaser Agent for the Market Street Purchaser Group and Related Committed Purchaser and Market Street Funding LLC, as Conduit Purchaser | 10-K | 10.16(b) | 3/5/2013 | VWRF | |||||
| 10.39 | Amendment No. 2 to Receivables Purchase Agreement, dated April 17, 2013, among VWR Receivables Funding, LLC, VWR International, LLC, PNC Bank, National Association, as Administrator, Purchase Agent for Market Street Purchaser Group, and Related Committed Purchaser and Market Street Funding, LLC, as Conduit Purchaser | 10-Q | 10.4 | 5/15/2013 | VWRF | |||||
| 10.40 | Amendment No. 3 to Receivables Purchase Agreement, dated June 4, 2013, among VWR Receivables Funding, LLC, VWR International, LLC, PNC Bank, National Association, as Administrator, Purchase Agent for Market Street Purchaser Group, and Related Committed Purchaser and Market Street Funding, LLC, as Conduit Purchaser | 10-Q | 10.1 | 8/9/2013 | VWRF | |||||
| 10.41 | Amendment No. 4 to Receivables Purchase Agreement, dated as of November 7, 2013, among VWR Receivables Funding, LLC, VWR International, LLC and PNC Bank, National Association, as Administrator, Related Committed Purchaser and Purchaser Agent for the Market Street Purchaser Group | 10-Q | 10.1 | 11/8/2013 | VWRF | |||||
| 10.42 | Amendment No. 5 to Receivables Purchase Agreement, dated May 18, 2015, among VWR Receivables Funding, LLC, VWR International, LLC, PNC Bank, National Association, as Administrator, LC Bank, Related Commitment Purchaser and Purchaser Agent for the PNC Purchaser Group | 8-K | 10.1 | 5/19/2015 | VWRC | |||||
| 10.43 | Purchase and Sale Agreement, dated November 4, 2011, between the various entities listed on Schedule I thereto as Originators and VWR Receivables Funding, LLC | 10-Q | 10.3 | 11/9/2011 | VWRF | |||||
| 10.44 | Amendment No. 1 to Purchase and Sale Agreement between the various entities listed on Schedule I thereto as Originators and VWR Receivables Funding, LLC |
8-K | 10.4 | 5/19/2015 | VWRC | |||||
II-8
Table of Contents
| Location of Exhibit(2) | ||||||||||
| Exhibit |
Exhibit Description(1) |
Form | Exhibit No. |
Filing Date | Filer | |||||
| 10.45+ | VWR Corporation 2014 Equity Incentive Plan | S-1/A | 10.46 | 9/17/2014 | VWRC | |||||
| 10.46+ | Form of Restricted Stock Agreement pursuant to the VWR Corporation 2014 Equity Incentive Plan | S-1/A | 10.47 | 9/17/2014 | VWRC | |||||
| 10.47+ | Form of Restricted Stock Unit Agreement pursuant to the VWR Corporation 2014 Equity Incentive Plan | S-1/A | 10.48 | 9/17/2014 | VWRC | |||||
| 10.48+ | Form of Stock Appreciation Rights Agreement pursuant to the VWR Corporation 2014 Equity Incentive Plan | S-1/A | 10.49 | 9/17/2014 | VWRC | |||||
| 10.49+ | Form of Incentive Stock Option Agreement pursuant to the VWR Corporation 2014 Equity Incentive Plan | S-1/A | 10.50 | 9/17/2014 | VWRC | |||||
| 10.50+ | Form of Nonqualified Stock Option Agreement pursuant to the VWR Corporation 2014 Equity Incentive Plan | S-1/A | 10.51 | 9/17/2014 | VWRC | |||||
| 10.51 | Form of Indemnification Agreement (between VWR Corporation and its directors and officers) | S-1/A | 10.52 | 9/17/2014 | VWRC | |||||
| 10.52 | Director Nomination Agreement by and between VWR Corporation and Varietal Distribution Holdings, LLC | 8-K | 10.2 | 10/7/2014 | VWRC | |||||
| 10.53 | Registration Rights Agreement by and between VWR Corporation and Varietal Distribution Holdings, LLC | 8-K | 10.1 | 10/7/2014 | VWRC | |||||
| 10.54 | Income Tax Receivable Agreement by and between VWR Corporation and Varietal Distribution Holdings, LLC | 8-K | 10.3 | 10/7/2014 | VWRC | |||||
| 10.55+ | VWR Corporation Employee Stock Purchase Plan (“VWR ESPP”) | 10-K | 10.53 | 3/4/2015 | VWRC | |||||
| 10.56+ | Amendment No. 1 to VWR ESPP | 10-K | 10.54 | 3/4/2015 | VWRC | |||||
| 10.57+ | Amendment No. 2 to VWR ESPP | S-8 | 4.2 | 4/20/2015 | VWRC | |||||
| 10.58+ | Appendix 1 to the VWR ESPP | 10-Q | 10.2 | 5/14/2015 | VWRC | |||||
| 10.59+ | Appendix 2 to the VWR ESPP | 10-Q | 10.3 | 5/14/2015 | VWRC | |||||
| 10.60+ | Form of Nonqualified Stock Option Agreement pursuant to the VWR Corporation 2014 Incentive Compensation Plan for grants made at pricing of the IPO | S-1/A | 10.57 | 9/17/2014 | VWRC | |||||
| 10.61 | Termination Agreement to the Amended and Restated Management Services Agreement among VWR Funding, Inc., Madison Dearborn Partners V-B, L.P. and Avista Capital Holdings, L.P. | 10-K | 10.56 | 3/4/2015 | VWRC | |||||
| 21.1 | List of subsidiaries of VWR Corporation | 10-K | 21.1 | 3/4/2015 | VWRC | |||||
| 23.1 | Consent of KPMG | ** | ||||||||
| 23.2 | Consent of Kirkland & Ellis LLP (included in Exhibit 5.1) | ** | ||||||||
| 24 | Power of Attorney (see signature pages) | ** | ||||||||
| (1) | VWR Investors, Inc. changed its name to VWR Corporation on June 19, 2014. As a result, all references to VWR Investors, Inc. in the agreements or documents listed above are to VWR Corporation. |
| (2) | Exhibits denoted by the filer “VWRC” are incorporated by reference herein from the prior filing of such document with the SEC by VWR Corporation (Commission File No. 001-36673). Exhibits denoted by the filer “VWRF” are incorporated by reference herein from the prior filing of such document with the SEC by our wholly owned subsidiary, VWR Funding, Inc. (Commission File No. 333-124100). Exhibits denoted by the following marks are: |
| * | To be filed by amendment. |
| ** | Filed herewith. |
| + | Indicates exhibits that constitute management contracts or compensatory plans or arrangements. |
II-9