Attached files
| file | filename |
|---|---|
| 8-K - 8-K - CVB FINANCIAL CORP | d929556d8k.htm |
Exhibit 99.1
40th Annual Shareholders
Meeting May 20th 2015
Safe Harbor
Certain matters set forth herein (including the exhibits hereto) constitute forward-looking statements within the meaning of the Private Securities Litigation Reform Act of
1995, including forward-looking statements relating to the Company’s current business plans and expectations regarding the Company’s future financial position and operating results. These forward-looking statements are subject to risks and uncertainties that could cause actual results, performance and/or achievements to differ materially from those projected. These risks and uncertainties include, but are not limited to, local, regional, national and international economic and market conditions and events and the impact they may have on us and our customers; our ability to attract deposits and other sources of funding or liquidity; supply and demand for real property inventory and periodic deterioration in values of California real estate, both residential and commercial; a prolonged slowdown or decline in construction or sales activity; changes in the financial performance and/or condition of our borrowers or certain key vendors or counterparties; changes in the level of nonperforming assets and any accompanying reserves and/or charge-offs; the cost or effect of acquisitions we may make; the effect of changes in laws, regulations and relevant judicial decisions (including laws, regulations and judicial decisions concerning financial reforms, taxes, bank capital levels, securities and securities trading and hedging, employment, executive compensation, insurance, vendor management and information security) with which we and our subsidiaries must or believe we should comply; changes in estimates of future reserve requirements and minimum capital requirements based upon the periodic review thereof under relevant regulatory and accounting requirements, including changes in the Basel Committee framework establishing capital standards for credit, operations and market risk; inflation, interest rate, securities market and monetary fluctuations; changes in government interest rates or monetary policies; changes in the amount and availability of deposit insurance; cyber-security threats, including loss of system functionality or theft or loss of Company or customer data or money; political instability; acts of war or terrorism, or natural disasters, such as earthquakes, or the effects of pandemic diseases; the timely development and acceptance of new banking products and services and the perceived overall value of these products and services by customers and potential customers; the Company’s relationships with and reliance upon vendors with respect to the operation of certain of the Company key internal and external systems and applications; changes in consumer spending, borrowing and savings preferences or habits; technological changes and the expanding use of technology in banking (including the adoption of mobile banking applications); the ability to retain and increase market share, retain and grow customers and control expenses; changes in the competitive environment among financial and bank holding companies, banks and other financial service providers; continued volatility in the credit and equity markets and its effect on the general economy or local or regional business conditions; fluctuations in the price of the Company’s stock; the effect of changes in accounting policies and practices, as may be adopted from time-to-time by the regulatory agencies, as well as by the Public Company Accounting Oversight Board, the Financial Accounting Standards Board and other accounting standard-setters; changes in our organization, management, compensation and benefit plans, and our ability to retain or expand our management team and/or our board of directors; the costs and effects of legal, compliance and regulatory changes and developments, including the resolution of legal proceedings or regulatory or other governmental inquiries or investigations and the results of regulatory examinations or reviews; our success at managing the risks involved in the foregoing items and all other factors set forth in the Company’s public reports including its Annual Report on Form 10-K for the year ended December 31, 2014, and particularly the discussion of risk factors within that document. The Company does not undertake, and specifically disclaims any obligation, to update any forward-looking statements to reflect occurrences or unanticipated events or circumstances after the date of such statements except as required by law.
cbbank.com
2
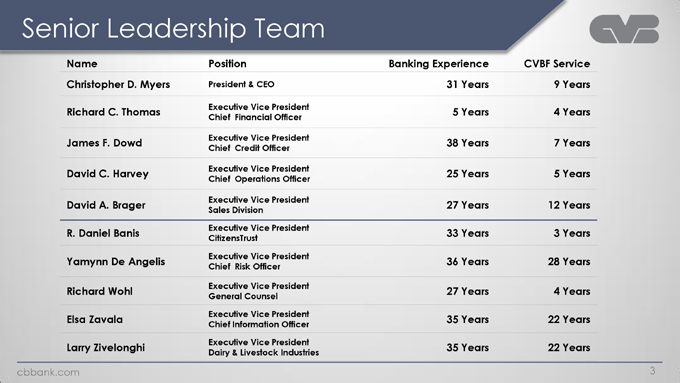
Senior Leadership Team
Name Position Banking Experience CVBF Service
Christopher D. Myers President & CEO 31 Years 9 Years
Richard C. Thomas Executive Vice President 5 Years 4 Years
Chief Financial Officer
James F. Dowd Executive Vice President 38 Years 7 Years
Chief Credit Officer
David C. Harvey Executive Vice President 25 Years 5 Years
Chief Operations Officer
David A. Brager Executive Vice President 27 Years 12 Years
Sales Division
R. Daniel Banis Executive Vice President 33 Years 3 Years
CitizensTrust
Yamynn De Angelis Executive Vice President 36 Years 28 Years
Chief Risk Officer
Richard Wohl Executive Vice President 27 Years 4 Years
General Counsel
Elsa Zavala Executive Vice President 35 Years 22 Years
Chief Information Officer
Larry Zivelonghi Executive Vice President 35 Years 22 Years
Dairy & Livestock Industries
cbbank.com
3
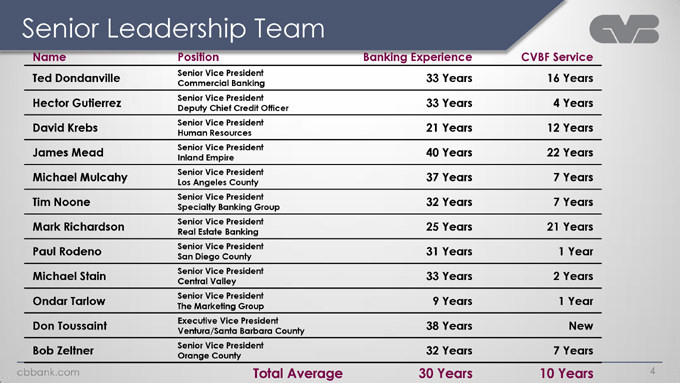
Senior Leadership Team
Name Position Banking Experience CVBF Service
Ted Dondanville Senior Vice President 33 Years 16 Years
Commercial Banking
Hector Gutierrez Senior Vice President 33 Years 4 Years
Deputy Chief Credit Officer
David Krebs Senior Vice President 21 Years 12 Years
Human Resources
James Mead Senior Vice President 40 Years 22 Years
Inland Empire
Michael Mulcahy Senior Vice President 37 Years 7 Years
Los Angeles County
Tim Noone Senior Vice President 32 Years 7 Years
Specialty Banking Group
Mark Richardson Senior Vice President 25 Years 21 Years
Real Estate Banking
Paul Rodeno Senior Vice President 31 Years 1 Yearea
San Diego County
Michael Stain Senior Vice President 33 Years 2 Years
Central Valley
Ondar Tarlow Senior Vice President 9 Years 1 Year
The Marketing Group
Don Toussaint Executive Vice President 38 Years New
Ventura/Santa Barbara County
Bob Zeltner Senior Vice President 32 Years 7 Years
Orange County
Total Average 30 Years 10 Years
cbbank.com
4
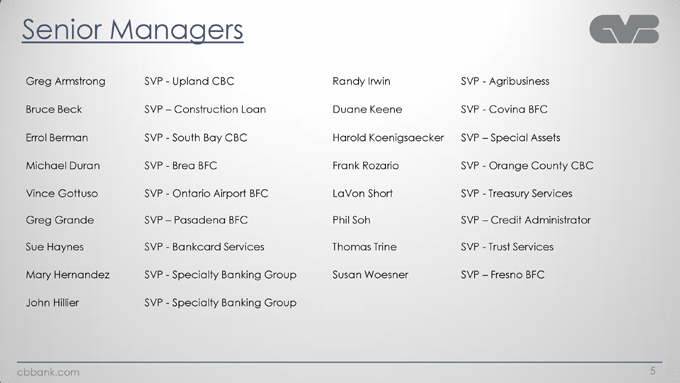
Senior Managers
Greg Armstrong SVP—Upland CBC Randy Irwin SVP—Agribusiness Bruce Beck SVP – Construction Loan Duane Keene SVP—Covina BFC Errol Berman SVP—South Bay CBC Harold Koenigsaecker SVP – Special Assets Michael Duran SVP—Brea BFC Frank Rozario SVP—Orange County CBC Vince Gottuso SVP—Ontario Airport BFC LaVon Short SVP—Treasury Services Greg Grande SVP – Pasadena BFC Phil Soh SVP – Credit Administrator Sue Haynes SVP—Bankcard Services Thomas Trine SVP—Trust Services Mary Hernandez SVP—Specialty Banking Group Susan Woesner SVP – Fresno BFC
John Hillier SVP—Specialty Banking Group
cbbank.com
5

cbbank.com
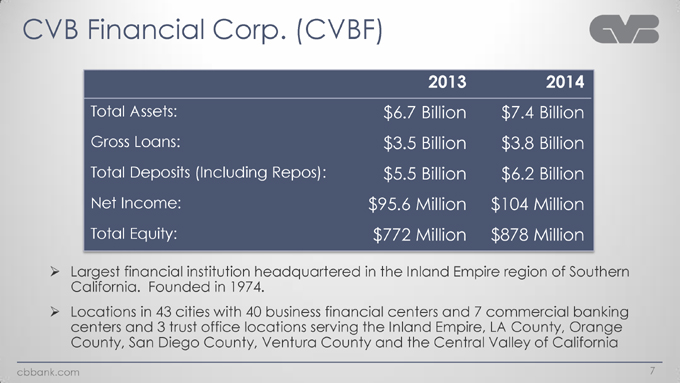
CVB Financial Corp. (CVBF)
2013 2014
Total Assets: $6.7 Billion $7.4 Billion
Gross Loans: $3.5 Billion $3.8 Billion
Total Deposits (Including Repos): $5.5 Billion $6.2 Billion
Net Income: $95.6 Million $104 Million
Total Equity: $772 Million $878 Million
Largest financial institution headquartered in the Inland Empire region of Southern California. Founded in 1974.
Locations in 43 cities with 40 business financial centers and 7 commercial banking centers and 3 trust office locations serving the Inland Empire, LA County, Orange County, San Diego County, Ventura County and the Central Valley of California
cbbank.com
7
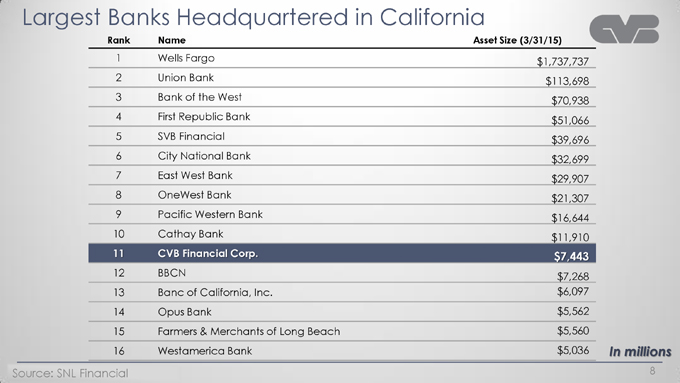
Largest Banks Headquartered in California
Rank Name Asset Size (3/31/15)
1 Wells Fargo $1,737,737
2 Union Bank $113,698
3 Bank of the West $70,938
4 First Republic Bank $51,066
5 SVB Financial $39,696
6 City National Bank $32,699
7 East West Bank $29,907
8 OneWest Bank $21,307
9 Pacific Western Bank $16,644
10 Cathay Bank $11,910
11 CVB Financial Corp. $7,443
12 BBCN $7,268
13 Banc of California, Inc. $6,097
14 Opus Bank $5,562
15 Farmers & Merchants of Long Beach $5,560
16 Westamerica Bank $5,036 In millions
Source: cbbank .SNL com Financial
8
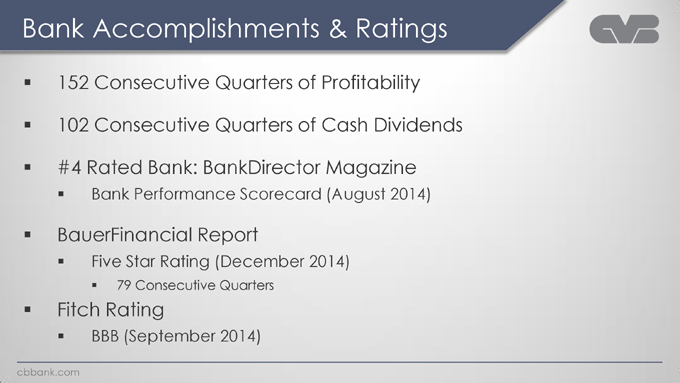
Bank Accomplishments & Ratings
152 Consecutive Quarters of Profitability 102 Consecutive Quarters of Cash Dividends #4 Rated Bank: BankDirector Magazine
Bank Performance Scorecard (August 2014)
BauerFinancial Report
Five Star Rating (December 2014)
79 Consecutive Quarters
Fitch Rating
BBB (September 2014)
cbbank.com
Our Markets
cbbank.com
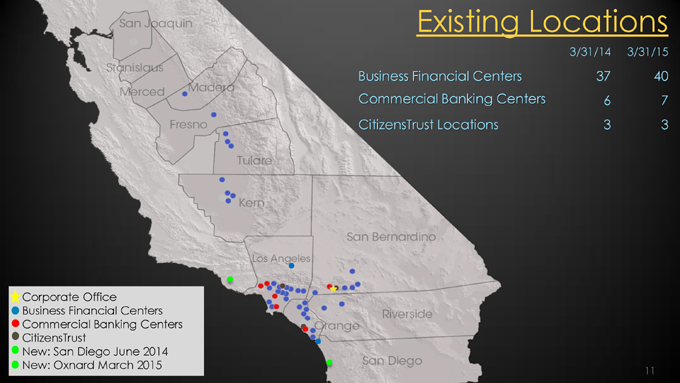
Existing Locations
3/31/14 3/31/15
Business Financial Centers 37 40 Commercial Banking Centers 6 7 CitizensTrust Locations 3 3
Corporate Office
Business Financial Centers Commercial Banking Centers CitizensTrust New: San Diego June 2014 New: Oxnard March 2015
11
What’s New
cbbank.com
American Security Bank
May 15, 2014
cbbank.com
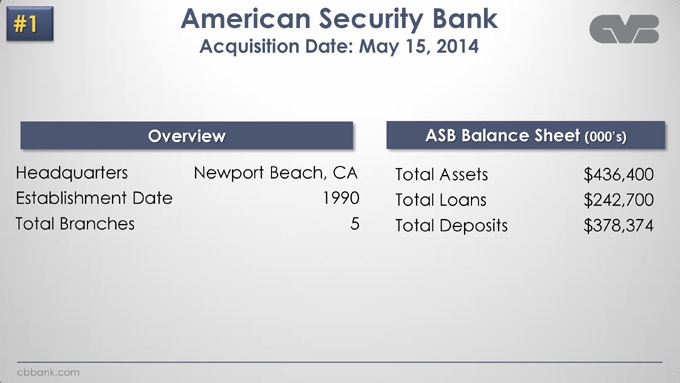
#1 American Security Bank
Acquisition Date: May 15, 2014
Overview ASB Balance Sheet (000’s)
Headquarters Newport Beach, CA Total Assets $436,400 Establishment Date 1990 Total Loans $242,700 Total Branches 5 Total Deposits $378,374
cbbank.com
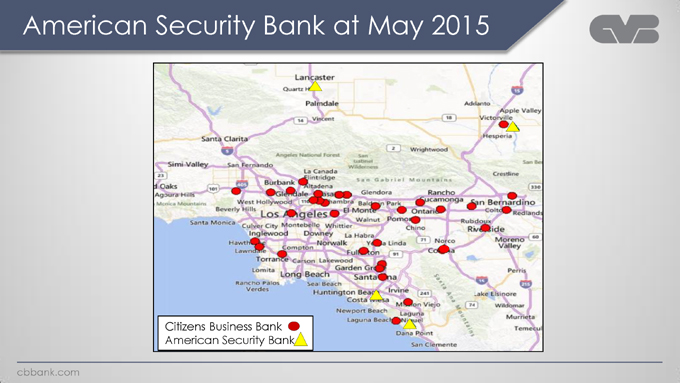
American Security Bank at May 2015
Citizens Business Bank American Security Bank
cbbank.com
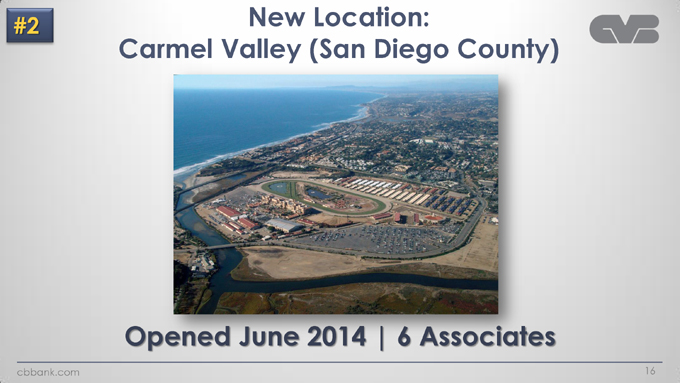
#2 New Location:
Carmel Valley (San Diego County)
Opened June 2014 | 6 Associates
cbbank.com
16
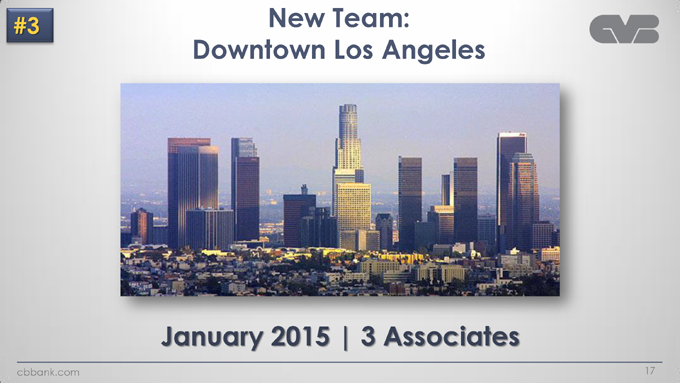
#3 New Team: Downtown Los Angeles
January 2015 | 3 Associates
cbbank.com
17
#4 Federal Home Loan Bank Debt
$200 Million repaid on February 23, 2015
Maturity: November 2016
Interest Rate: 4.52%
Prepayment Penalty: $13.9 Million
Projected quarterly savings = $2.125 Million
cbbank.com
18
#5 New Location: Oxnard (Ventura County)
Opened March 2015 | 6 Associates
cbbank.com
19
#6 Cash Dividend Increase
On March 18, 2015, the
Board of Directors elected to increased the cash dividend from $.10 per share to $.12 per share
cbbank.com
20
Financial Results
cbbank.com
21
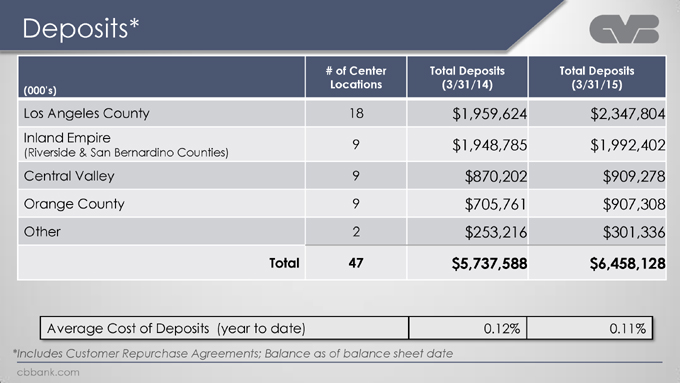
Deposits*
# of Center Total Deposits Total Deposits Locations (3/31/14) (3/31/15) (000’s)
Los Angeles County 18 $1,959,624 $2,347,804
Inland Empire
9 $1,948,785 $1,992,402
(Riverside & San Bernardino Counties)
Central Valley 9 $870,202 $909,278 Orange County 9 $705,761 $907,308 Other 2 $253,216 $301,336
Total 47 $5,737,588 $6,458,128
Average Cost of Deposits (year to date) 0.12% 0.11%
*Includes Customer Repurchase Agreements; Balance as of balance sheet date cbbank.com
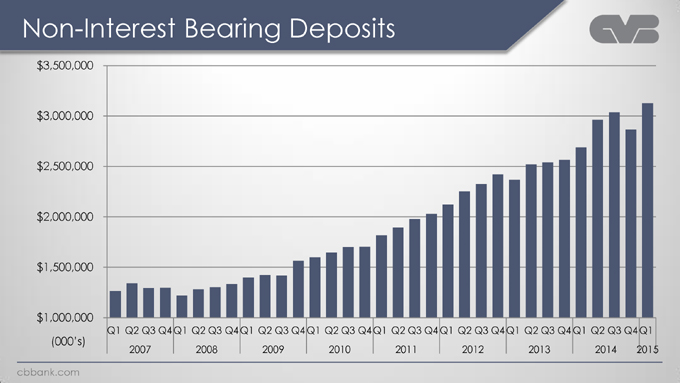
Non-Interest Bearing Deposits
$3,500,000 $3,000,000 $2,500,000 $2,000,000 $1,500,000
$1,000,000
(000’s) Q1 Q2 Q3 Q4Q1 Q2 Q3 Q4Q1 Q2 Q3 Q4Q1 Q2 Q3 Q4Q1 Q2 Q3 Q4Q1 Q2 Q3 Q4Q1 Q2 Q3 Q4Q1 Q2 Q3 Q4Q1 2007 2008 2009 2010 2011 2012 2013 2014 2015 cbbank.com
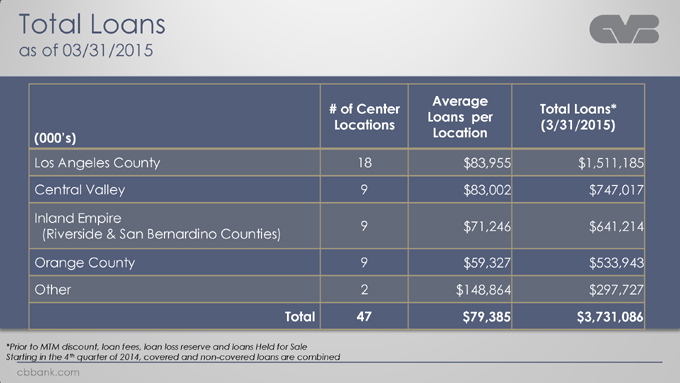
Total Loans
as of 03/31/2015
Average
# of Center Total Loans* Loans per Locations (3/31/2015) (000’s) Location
Los Angeles County 18 $83,955 $1,511,185
Central Valley 9 $83,002 $747,017
Inland Empire
9 $71,246 $641,214 (Riverside & San Bernardino Counties) Orange County 9 $59,327 $533,943 Other 2 $148,864 $297,727
Total 47 $79,385 $3,731,086
*Prior to MTM discount, loan fees, loan loss reserve and loans Held for Sale Starting in the 4th quarter of 2014, covered and non-covered loans are combined cbbank.com
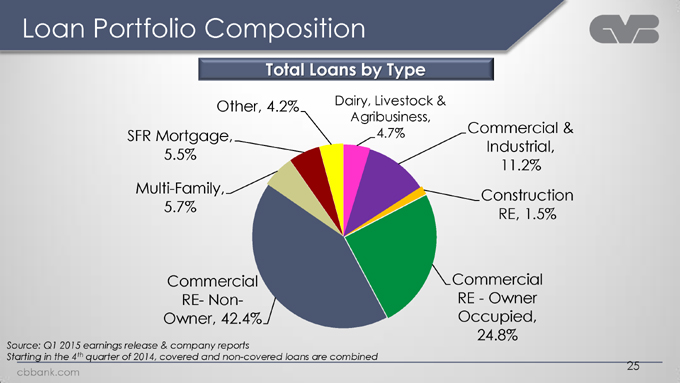
Loan Portfolio Composition
Total Loans by Type
Other, 4.2% Dairy, Livestock & Agribusiness,
4.7% Commercial &
SFR Mortgage,
Industrial,
5.5%
11.2% Multi-Family, Construction
5.7% RE, 1.5%
Commercial Commercial RE- Non- RE—Owner
Owner, 42.4% Occupied,
24.8%
Source: Q1 2015 earnings release & company reports
Starting in the 4th quarter of 2014, covered and non-covered loans are combined cbbank.com
25
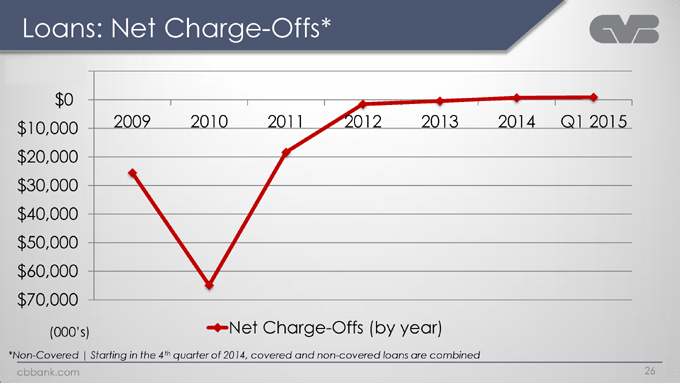
Loans: Net Charge-Offs*
$10,000 $0
$10,000 2009 2010 2011 2012 2013 2014 Q1 2015 $20,000 $30,000 $40,000 $50,000 $60,000 $70,000 (000’s) Net Charge-Offs (by year)
*Non-Covered | Starting in the 4th quarter of 2014, covered and non-covered loans are combined cbbank.com
26
CitizensTrust
cbbank.com
27
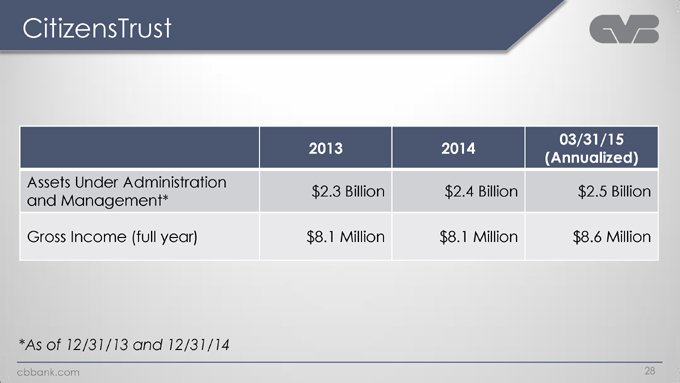
CitizensTrust
03/31/15 2013 2014 (Annualized)
Assets Under Administration
$2.3 Billion $2.4 Billion $2.5 Billion and Management*
Gross Income (full year) $8.1 Million $8.1 Million $8.6 Million
*As of 12/31/13 and 12/31/14
cbbank.com 28

Profits
cbbank.com
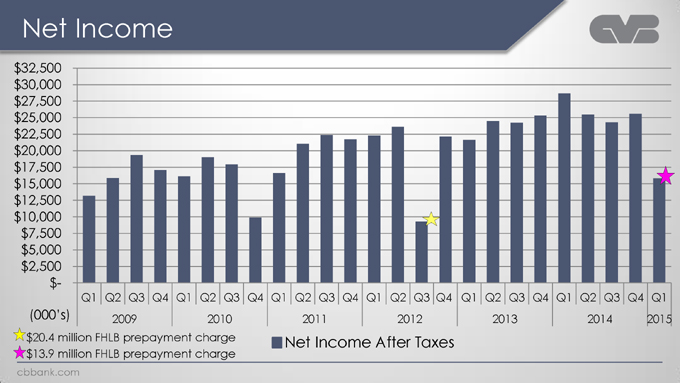
Net Income
$32,500 $30,000 $27,500 $25,000 $22,500 $20,000 $17,500 $15,000 $12,500 $10,000 $7,500 $5,000 $2,500 $-
Q1 Q2 Q3 Q4 Q1 Q2 Q3 Q4 Q1 Q2 Q3 Q4 Q1 Q2 Q3 Q4 Q1 Q2 Q3 Q4 Q1 Q2 Q3 Q4 Q1 (000’s) 2009 2010 2011 2012 2013 2014 2015
$20.4 million FHLB prepayment charge Net Income After Taxes
$13.9 million FHLB prepayment charge
cbbank.com
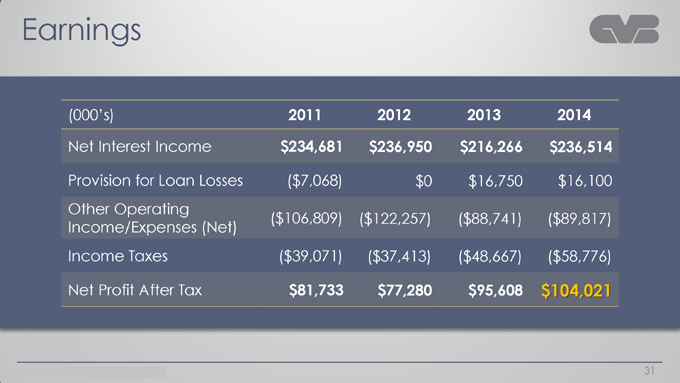
Earnings
(000’s) 2011 2012 2013 2014 Net Interest Income $234,681 $236,950 $216,266 $236,514
Provision for Loan Losses ($7,068) $0 $16,750 $16,100 Other Operating
($106,809) ($122,257) ($88,741) ($89,817) Income/Expenses (Net) Income Taxes ($39,071) ($37,413) ($48,667) ($58,776)
Net Profit After Tax $81,733 $77,280 $95,608 $104,021
cbbank.com 31
2015
Interest Rate Challenges Ahead
cbbank.com 32
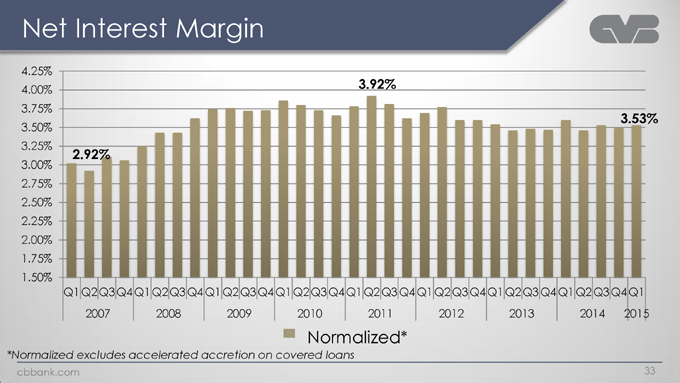
Net Interest Margin
4.25% 3.92%
4.00%
3.75%
3.53%
3.50%
3.25%
2.92%
3.00%
2.75%
2.50%
2.25%
2.00%
1.75%
1.50%
Q1Q2Q3Q4Q1Q2Q3Q4Q1Q2Q3Q4Q1Q2Q3Q4Q1Q2Q3Q4Q1Q2Q3Q4Q1Q2Q3Q4Q1Q2Q3Q4Q1
2007 2008 2009 2010 2011 2012 2013 2014 2015
Normalized*
*Normalized excludes accelerated accretion on covered loans
cbbank.com
33
Securities & Investments
cbbank.com
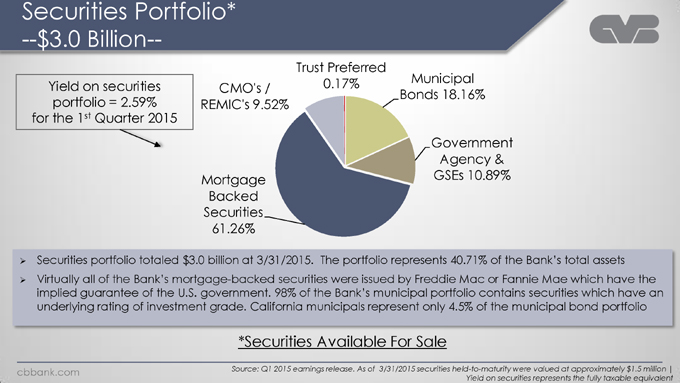
Securities Portfolio*
—$3.0 Billion—
Trust Preferred
0.17% Municipal Yield on securities CMO’s / Bonds 18.16% portfolio = 2.59% REMIC’s 9.52% for the 1st Quarter 2015 Government Agency & Mortgage GSEs 10.89% Backed Securities
61.26%
Securities portfolio totaled $3.0 billion at 3/31/2015. The portfolio represents 40.71% of the Bank’s total assets Virtually all of the Bank’s mortgage-backed securities were issued by Freddie Mac or Fannie Mae which have the implied guarantee of the U.S. government. 98% of the Bank’s municipal portfolio contains securities which have an underlying rating of investment grade. California municipals represent only 4.5% of the municipal bond portfolio
*Securities Available For Sale
cbbank.com Source: Q1 2015 earnings release. As of 3/31/2015 securities held-to-maturity were valued at approximately $1.5 million | Yield on securities represents the fully taxable equivalent
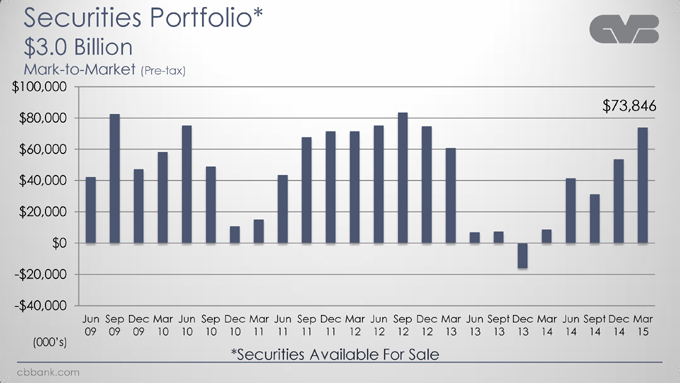
Securities Portfolio*
$3.0 Billion
Mark-to-Market (Pre-tax) $100,000
$73,846
$80,000 $60,000 $40,000 $20,000 $0
-$20,000
-$40,000
Jun Sep Dec Mar Jun Sep Dec Mar Jun Sep Dec Mar Jun Sep Dec Mar Jun Sept Dec Mar Jun Sept Dec Mar
09 09 09 10 10 10 10 11 11 11 11 12 12 12 12 13 13 13 13 14 14 14 14 15 (000’s)
*Securities Available For Sale
cbbank.com
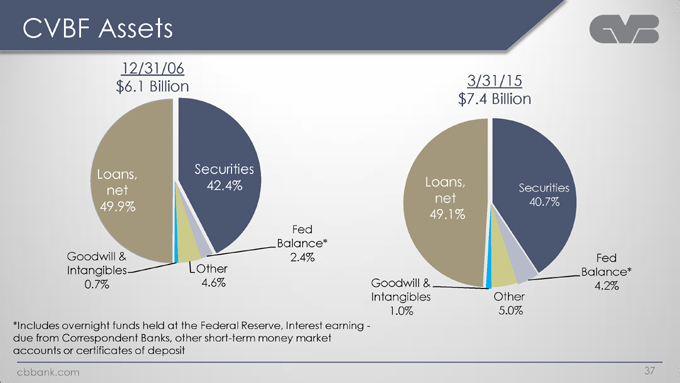
CVBF Assets
12/31/06
$6.1 Billion 3/31/15
$7.4 Billion
Loans, Securities
42.4% Loans, Securities net net 40.7%
49.9%
49.1% Fed Balance*
Goodwill & 2.4% Fed Intangibles Other Balance*
0.7% 4.6% Goodwill & 4.2% Intangibles Other
1.0% 5.0% *Includes overnight funds held at the Federal Reserve, Interest earning -due from Correspondent Banks, other short-term money market accounts or certificates of deposit cbbank.com 37
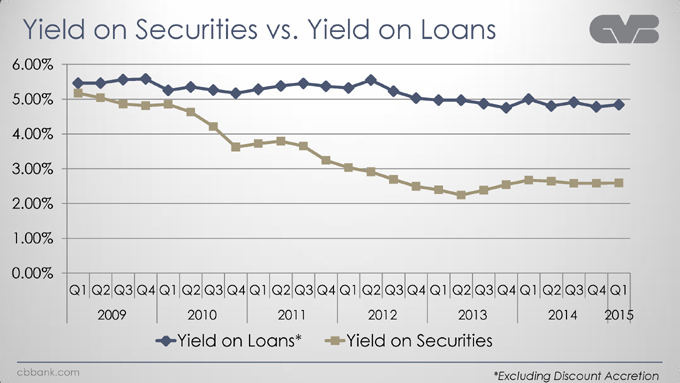
Yield on Securities vs. Yield on Loans
6.00%
5.00%
4.00%
3.00%
2.00%
1.00%
0.00%
Q1 Q2 Q3 Q4 Q1 Q2 Q3 Q4 Q1 Q2 Q3 Q4 Q1 Q2 Q3 Q4 Q1 Q2 Q3 Q4 Q1 Q2 Q3 Q4 Q1 2009 2010 2011 2012 2013 2014 2015
Yield on Loans* Yield on Securities
cbbank.com *Excluding Discount Accretion
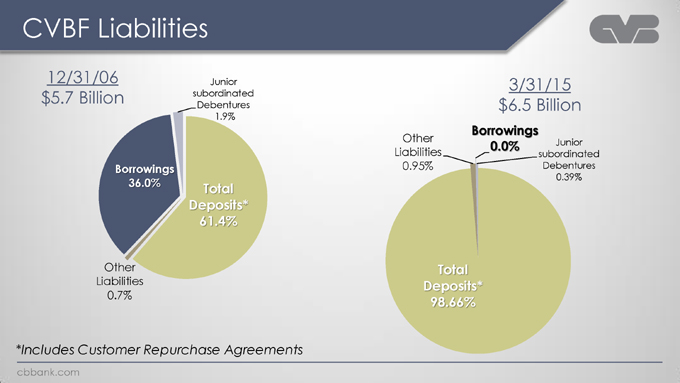
CVBF Liabilities
12/31/06 Junior 3/31/15
$5.7 Billion subordinated
Debentures $6.5 Billion
1.9%
Borrowings
Other Junior Liabilities 0.0% subordinated
Borrowings 0.95% Debentures
36.0% Total 0.39% Deposits*
61.4%
Other Total Liabilities Deposits*
0.7% 98.66%
*Includes Customer Repurchase Agreements
cbbank.com
Capital
cbbank.com
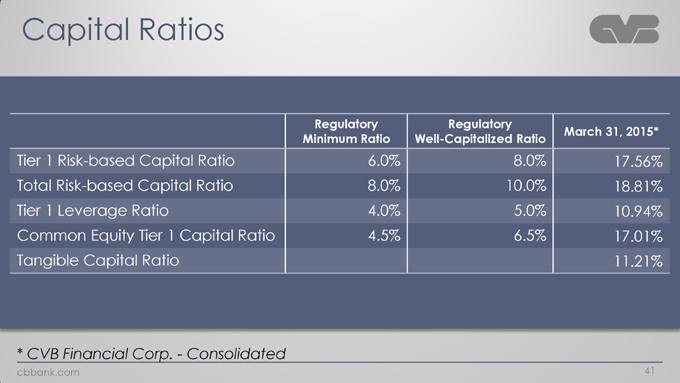
Capital Ratios
Regulatory Regulatory
March 31, 2015* Minimum Ratio Well-Capitalized Ratio
Tier 1 Risk-based Capital Ratio 6.0% 8.0% 17.56% Total Risk-based Capital Ratio 8.0% 10.0% 18.81% Tier 1 Leverage Ratio 4.0% 5.0% 10.94% Common Equity Tier 1 Capital Ratio 4.5% 6.5% 17.01% Tangible Capital Ratio 11.21%
* CVB Financial Corp.—Consolidated
cbbank.com 41
May 2015
-Shareholder Update-
cbbank.com 42
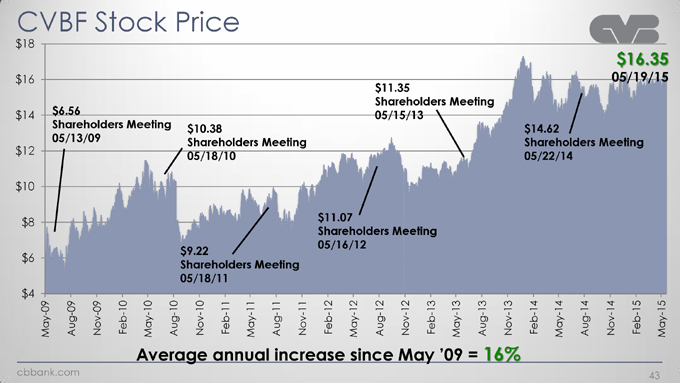
CVBF Stock Price
$ $ $ $ $
4 $ 6 $ 8 $ 10 12 14 16 18
May-09
$ 6 Aug-09 56 .
Nov-09 (05/13/09)Shareholders
Feb-10
May-10 Meeting
Aug-10
$ 9 $
Average Nov-10 22 . 10.
Feb-11 38
annual (Ma)(y)-11 (05/18/11)Shareholders (05/18/10)Shareholders
Aug-11
Nov-11 Meeting Meeting
$ Feb-12 11
increase .
May-12 07
since (Au)(g)-12 (05/16/12)Shareholders $ 11.
Nov-12 35
May Feb-13 Meeting (05/15/13)Shareholders
’09 May-13
= Aug-13 Meeting
16% (No)(v)-13
Feb-14 14 $.
May-14 62
Aug-14 (05/22/14)Shareholders
Nov-14
$ Feb-15 16.
May-15 (Meeting)05/19/15 35
cbbank.com
43
—2015 & Beyond—
Our Growth Strategy
cbbank.com
Our Vision
Citizens Business Bank will strive to become the premier financial services company operating throughout the state of California, servicing the comprehensive financial needs of successful small to medium sized businesses and their owners.
cbbank.com 45
Target Customer
The best privately-held and/or family-owned businesses throughout California
Annual revenues of $1-200 million
Top 25% in their respective industry
Full relationship banking
Build 20-year relationships
cbbank.com 46
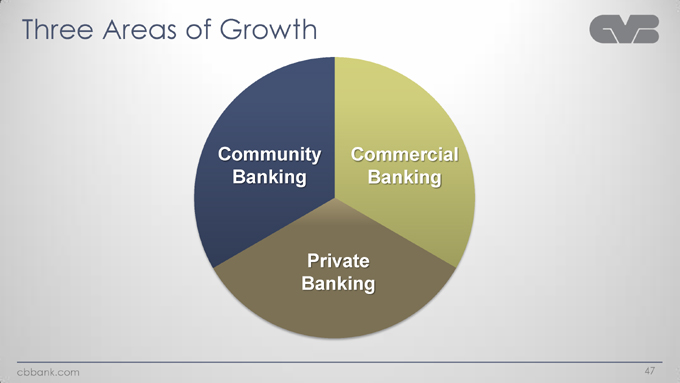
Three Areas of Growth
Community Commercial Banking Banking
Private Banking
cbbank.com 47
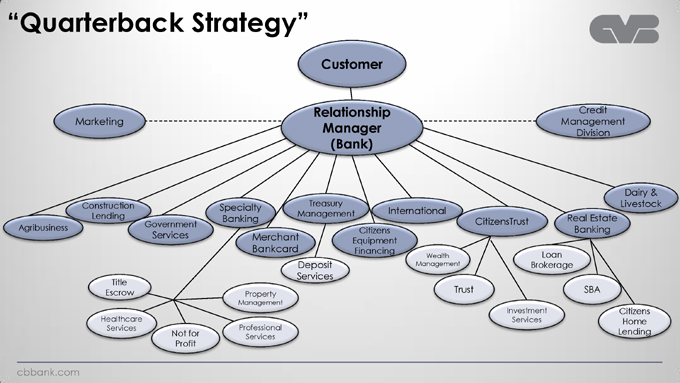
“Quarterback Strategy”
Customer
Relationship Credit
Marketing Manager Management Division
(Bank)
Dairy & Construction Specialty Treasury Livestock Management International Lending Banking Real Estate Government CitizensTrust Agribusiness Citizens Banking Services Merchant Equipment Bankcard Financing Wealth Loan Deposit Management Brokerage
Services Title
Escrow Trust SBA
Property Management
Investment Citizens Healthcare Services Home Services Professional Lending Not for Services Profit
cbbank.com
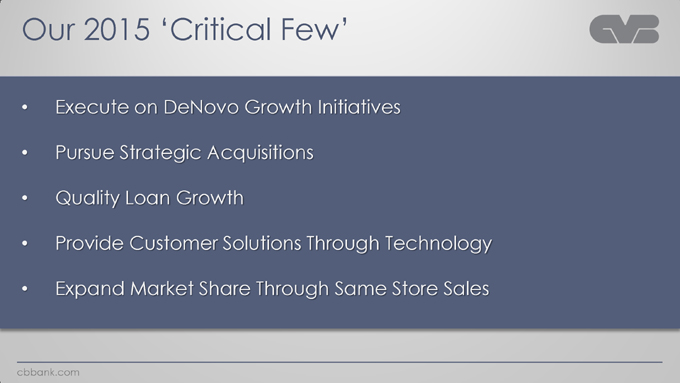
Our 2015 ‘Critical Few’
Execute on DeNovo Growth Initiatives
Pursue Strategic Acquisitions
Quality Loan Growth
Provide Customer Solutions Through Technology
Expand Market Share Through Same Store Sales
cbbank.com
Copy of presentation at www.cbbank.com
cbbank.com