Attached files
| file | filename |
|---|---|
| 8-K - NEW JERSEY RESOURCES CORP | c81330_8k.htm |
| EX-99.1 - NEW JERSEY RESOURCES CORP | c81330_ex99-1.htm |

FISCAL 2015 SECOND QUARTER UPDATE May 7, 2015

Regarding Forward - Looking Statements 1 Certain statements contained in this presentation are forward - looking statements within the meaning of the Private Securities Litigation Reform Act of 1995 . New Jersey Resources (NJR or the Company) cautions readers that the assumptions forming the basis for forward - looking statements include many factors that are beyond NJR’s ability to control or estimate precisely, such as estimates of future market conditions and the behavior of other market participants . Words such as “anticipates,” “estimates,” “expects,” “projects,” “may,” “will,” “intends,” “plans,” “believes,” “should” and similar expressions may identify forward - looking information and such forward - looking statements are made based upon management’s current expectations and beliefs as of this date concerning future developments and their potential effect upon NJR . There can be no assurance that future developments will be in accordance with management’s expectations or that the effect of future developments on NJR will be those anticipated by management . Forward - looking information in this presentation includes, but is not limited to, certain statements regarding NJR's NFE guidance for fiscal 2015 , forecasted contribution of business segments to fiscal 2015 NFE and to NFE beyond fiscal 2015 , forecasted dividend growth, future NJNG customer growth, future capital expenditures and infrastructure investments, the long - term outlook for NJRCEV, diversification of NJRCEV’s strategy, NJRCEV’s future solar and wind projects, and the PennEast Pipeline project . The factors that could cause actual results to differ materially from NJR’s expectations include, but are not limited to, weather and economic conditions ; demographic changes in the NJNG service territory and their effect on NJNG's customer growth ; volatility of natural gas and other commodity prices and their impact on NJNG customer usage, NJNG's Basic Gas Supply Service (BGSS) incentive programs, NJRES' operations and on the Company's risk management efforts ; changes in rating agency requirements and/or credit ratings and their effect on availability and cost of capital to the Company ; the impact of volatility in the credit markets ; the ability to comply with debt covenants ; the impact to the asset values and resulting higher costs and funding obligations of NJR's pension and post employment benefit plans as a result of downturns in the financial markets, a lower discount rate, revised actuarial assumptions, and impacts associated with the Patient Protection and Affordable Care Act ; accounting effects and other risks associated with hedging activities and use of derivatives contracts ; commercial and wholesale credit risks, including the availability of creditworthy customers and counterparties and liquidity in the wholesale energy trading market ; regulatory approval of NJNG’s planned infrastructure programs ; the ability to obtain governmental and regulatory approvals, land - use rights, electric grid interconnection (in the case of distributed power projects) and/or financing for the construction, development and operation of NJR’s energy investments and NJNG’s infrastructure projects in a timely manner ; risks associated with the management of the Company's joint ventures and partnerships ; risks associated with our investments in distributed power projects, including the availability of regulatory and tax incentives, the availability of viable projects and NJR's eligibility for ITCs and PTCs, the future market for SRECs (including the pace of solar project development in New Jersey), and operational risks related to projects in service ; timing of qualifying for ITCs and PTCs due to delays or failures to complete planned solar and wind energy projects and the resulting effect on our effective tax rate and earnings ; the level and rate at which NJNG's costs and expenses are incurred and the extent to which they are allowed to be recovered from customers through the regulatory process ; the possible expiration of the BGSS incentive programs ; access to adequate supplies of natural gas and dependence on third - party storage and transportation facilities for natural gas supply ; operating risks incidental to handling, storing, transporting and providing customers with natural gas ; risks related to our employee workforce ; the regulatory and pricing policies of federal and state regulatory agencies ; the costs of compliance with present and future environmental laws, including potential climate change - related legislation ; risks related to changes in accounting standards ; the disallowance of recovery of environmental - related expenditures and other regulatory changes ; environmental - related and other litigation and other uncertainties ; risks related to cyber - attack or failure of information technology systems ; and the impact of natural disasters, terrorist activities, and other extreme events on our operations and customers, including any impacts to utility gross margin, and restoration costs . The aforementioned factors are detailed in the “Risk Factors” sections of our Annual Report on Form 10 - K filed on November 25 , 2014 , as filed with the Securities and Exchange Commission (SEC), which is available on the SEC’s website at sec . gov . Information included in this presentation is representative as of today only and while NJR periodically reassesses material trends and uncertainties affecting NJR's results of operations and financial condition in connection with its preparation of management's discussion and analysis of results of operations and financial condition contained in its Quarterly and Annual Reports filed with the SEC, NJR does not, by including this statement, assume any obligation to review or revise any particular forward - looking statement referenced herein in light of future events .
Disclaimer Regarding Non - GAAP Financial Measures 2 This presentation includes the non - GAAP measures net financial earnings (NFE), and utility gross margin . As indicators of the Company’s operating performance, these measures should not be considered alternatives to, or more meaningful than, GAAP measures, such as cash flow, net income, operating income or earnings per share . NFE (loss) excludes unrealized gains or losses on derivative instruments related to the company’s unregulated subsidiaries and certain realized gains and losses on derivative instruments related to natural gas that has been placed into storage at NJRES . Volatility associated with the change in value of these financial and physical commodity contracts is reported in the income statement in the current period . In order to manage its business, NJR views its results without the impacts of the unrealized gains and losses, and certain realized gains and losses, caused by changes in value of these financial instruments and physical commodity contracts prior to the completion of the planned transaction because it shows changes in value currently as opposed to when the planned transaction ultimately is settled . An annual estimated effective tax rate is calculated for NFE purposes and any necessary quarterly tax adjustment is applied to NJRCEV, as such adjustment is related to tax credits generated by NJRCEV . NJNG’s utility gross margin represents the results of revenues less natural gas costs, sales and other taxes and regulatory rider expenses, which are key components of the company’s operations that move in relation to each other . Natural gas costs, sales and other taxes and regulatory rider expenses are passed through to customers and, therefore, have no effect on gross margin . Management uses NFE, and utility gross margin as supplemental measures to other GAAP results to provide a more complete understanding of the Company’s performance . Management believes these non - GAAP measures are more reflective of the Company’s business model, provide transparency to investors and enable period - to - period comparability of financial performance . For a full discussion of our non - GAAP financial measures, please see NJR’s most recent Form 10 - K, Item 7 . This information has been provided pursuant to the requirements of SEC Regulation G .
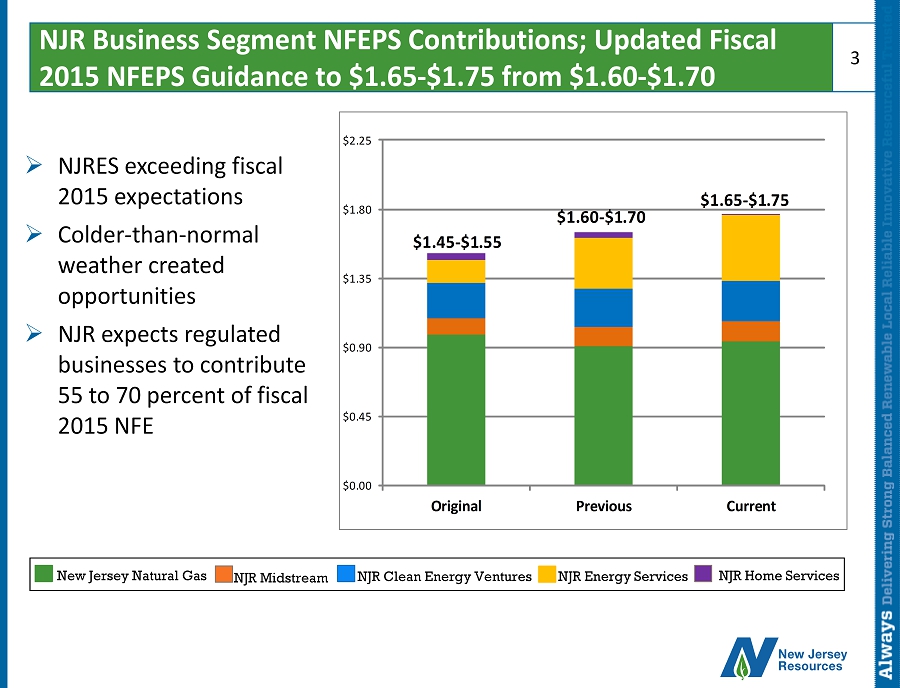
NJR Business Segment NFEPS Contributions; Updated Fiscal 2015 NFEPS Guidance to $1.65 - $1.75 from $1.60 - $1.70 3 New Jersey Natural Gas NJR Clean Energy Ventures NJR Energy Services NJR Midstream NJR Home Services » NJRES exceeding fiscal 2015 expectations » Colder - than - normal weather created opportunities » NJR expects regulated businesses to contribute 55 to 70 percent of fiscal 2015 NFE $1.45 - $1.55 $1.60 - $1.70 $1.65 - $1.75 $0.00 $0.45 $0.90 $1.35 $1.80 $2.25 Original Previous Current
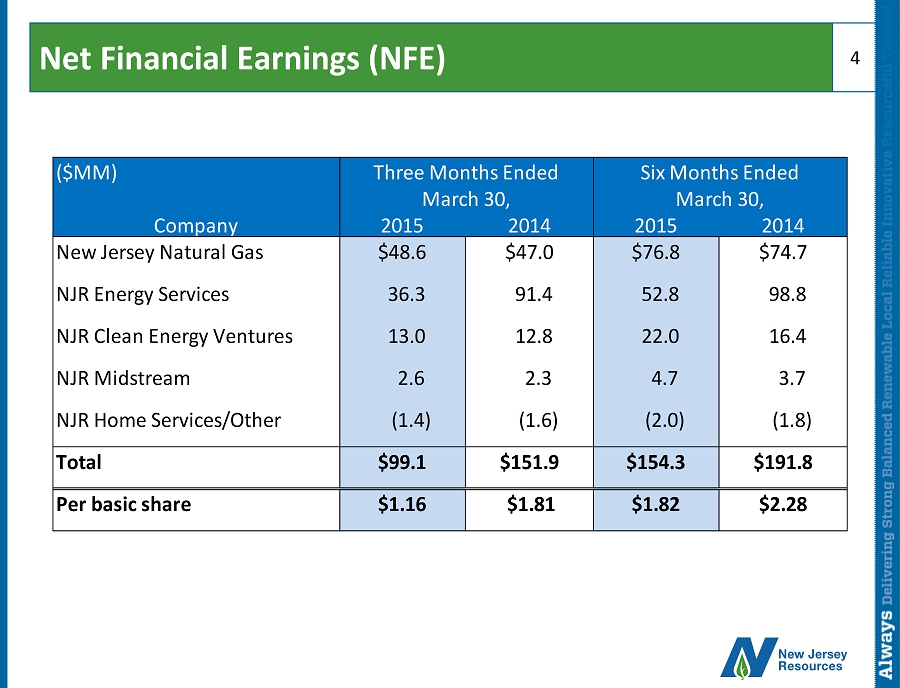
Net Financial Earnings (NFE) 4 ($MM) Company 2015 2014 2015 2014 New Jersey Natural Gas $48.6 $47.0 $76.8 $74.7 NJR Energy Services 36.3 91.4 52.8 98.8 NJR Clean Energy Ventures 13.0 12.8 22.0 16.4 NJR Midstream 2.6 2.3 4.7 3.7 NJR Home Services/Other (1.4) (1.6) (2.0) (1.8) Total $99.1 $151.9 $154.3 $191.8 Per basic share $1.16 $1.81 $1.82 $2.28 Three Months Ended March 30, Six Months Ended March 30,
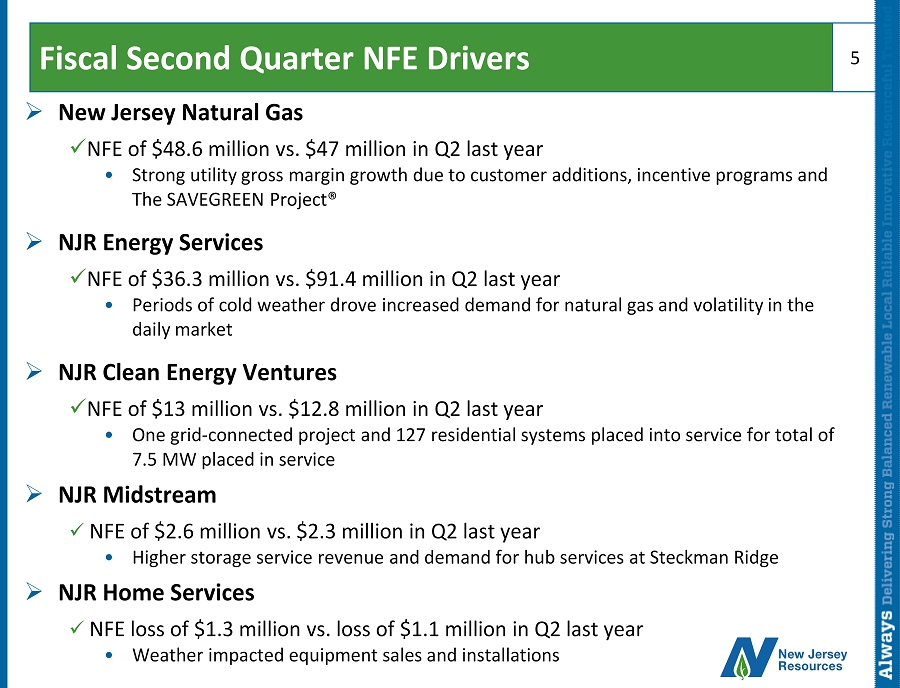
Fiscal Second Quarter NFE Drivers » New Jersey Natural Gas x NFE of $48.6 million vs. $47 million in Q2 last year • Strong utility gross margin growth due to customer additions, incentive programs and The SAVEGREEN Project® » NJR Energy Services x NFE of $36.3 million vs. $91.4 million in Q2 last year • Periods of cold weather drove increased demand for natural gas and volatility in the daily market » NJR Clean Energy Ventures x NFE of $13 million vs. $12.8 million in Q2 last year • One grid - connected project and 127 residential systems placed into service for total of 7.5 MW placed in service » NJR Midstream x NFE of $2.6 million vs. $2.3 million in Q2 last year • Higher storage service revenue and demand for hub services at Steckman Ridge » NJR Home Services x NFE loss of $1.3 million vs. loss of $1.1 million in Q2 last year • Weather impacted equipment sales and installations 5

NJNG Capital Investment – Mid Year Review 6 CAPITAL INVESTMENTS ($MM) 2015E YEAR TO DATE STATUS NJNG Customer Growth $33.9 $18.5 Added 4,079 customers in 1H15; on target to add 15,000-17,000 over the next two years Maintenance/Other 66.9 31.7 Capital spending on track to enhance system safety and reliability SAFE 41.2 11.8 179 miles of pipe replaced through March 2015 (65 percent of total) Superstorm Sandy 5.0 1.1 Spending to be completed by fiscal year end NGV Fueling Stations 4.2 2.4 First CNG station to be opened in 3Q fiscal 2015; two others to open by fiscal year end NJ RISE 7.0 0.2 Installation of excess flow valves and engineering work continues Liquefaction Project 11.9 6.4 Initiated site preparation and fabricating system components Southern Reliability 19.3 BPU petitions filed in April 2015 SAVEGREEN 30.4 13.3 BPU petition filed in December 2014 to continue program through June 2018 Total NJNG $219.8 $85.4
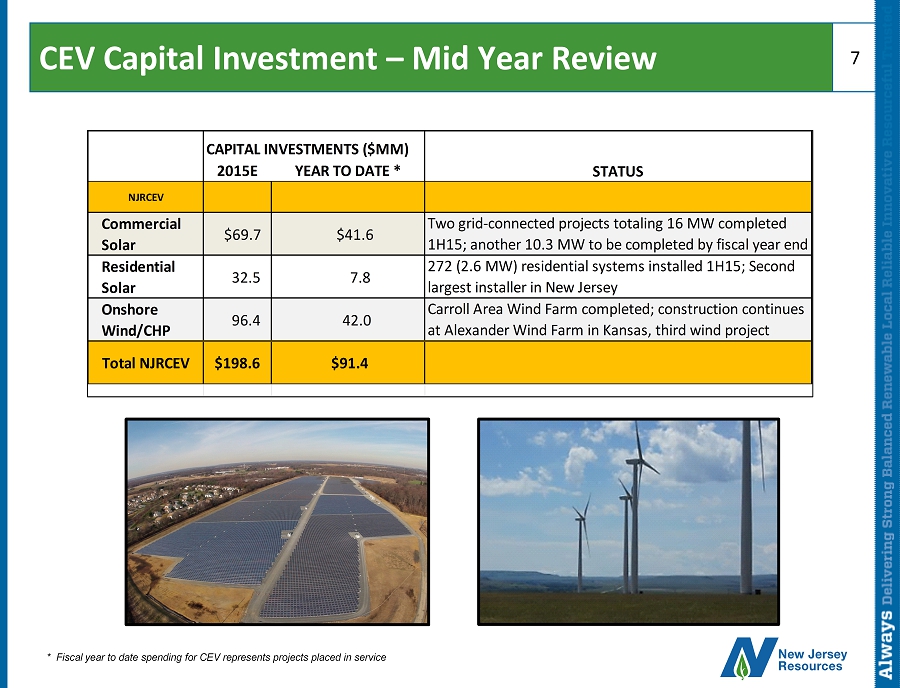
CEV Capital Investment – Mid Year Review 7 * Fiscal year to date spending for CEV represents projects placed in service CAPITAL INVESTMENTS ($MM) 2015E YEAR TO DATE * STATUS NJRCEV Commercial Solar $69.7 $41.6 Two grid-connected projects totaling 16 MW completed 1H15; another 10.3 MW to be completed by fiscal year end Residential Solar 32.5 7.8 272 (2.6 MW) residential systems installed 1H15; Second largest installer in New Jersey Onshore Wind/CHP 96.4 42.0 Carroll Area Wind Farm completed; construction continues at Alexander Wind Farm in Kansas, third wind project Total NJRCEV $198.6 $91.4

Our Growth and Earnings Strategy » Increased regulated infrastructure investments drive safe, reliable service and anchors our business portfolio x NJNG drives our long - term growth x PennEast Pipeline » Provide customers with cost - efficient renewable electricity, while reducing ITC reliance x Portfolio diversification x Improving SREC fundamentals » Provide physical and producer services to a variety of natural gas market participants 8 Our fiscal 2015 NFE guidance is now $1.65 - $1.75 Per Share Long - term average annual NFE growth goal remains 5 to 9 percent Average annual dividend growth of 6 to 8 percent annually
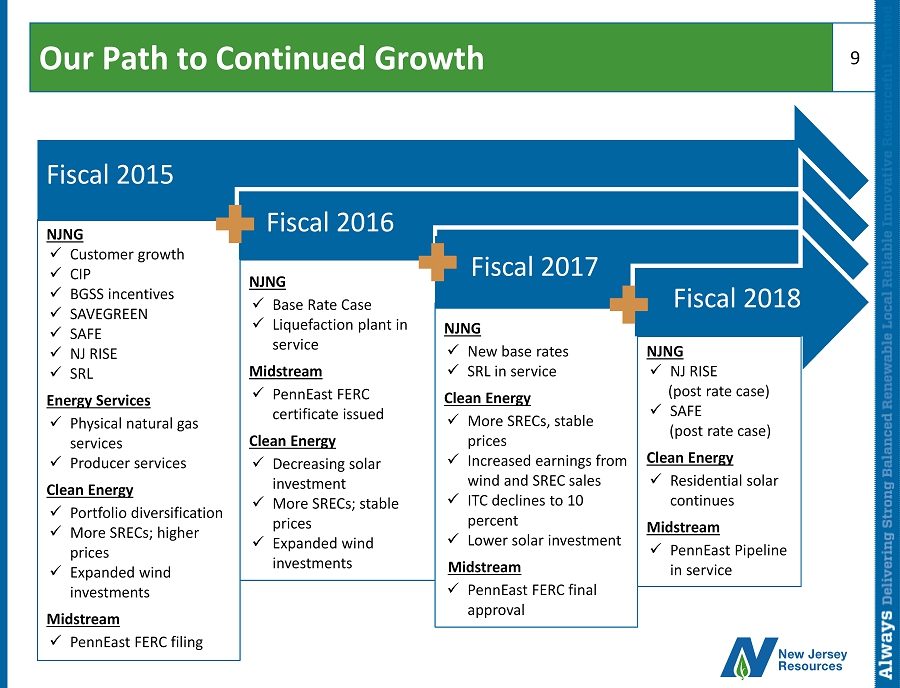
Our Path to Continued Growth 9 Fiscal 2015 NJNG x Customer growth x CIP x BGSS incentives x SAVEGREEN x SAFE x NJ RISE x SRL Energy Services x Physical natural gas services x Producer services Clean Energy x Portfolio diversification x More SRECs; higher prices x Expanded wind investments Midstream x PennEast FERC filing Fiscal 2016 NJNG x Base Rate Case x Liquefaction plant in service Midstream x PennEast FERC certificate issued Clean Energy x Decreasing solar investment x More SRECs; stable prices x Expanded wind investments Fiscal 2017 NJNG x New base rates x SRL in service Clean Energy x More SRECs, stable prices x Increased earnings from wind and SREC sales x ITC declines to 10 percent x Lower solar investment Midstream x PennEast FERC final approval Fiscal 2018 NJNG x NJ RISE (post rate case) x SAFE (post rate case) Clean Energy x Residential solar continues Midstream x PennEast Pipeline in service
FISCAL 2015 SECOND QUARTER UPDATE May 7, 2015

APPENDIX 11
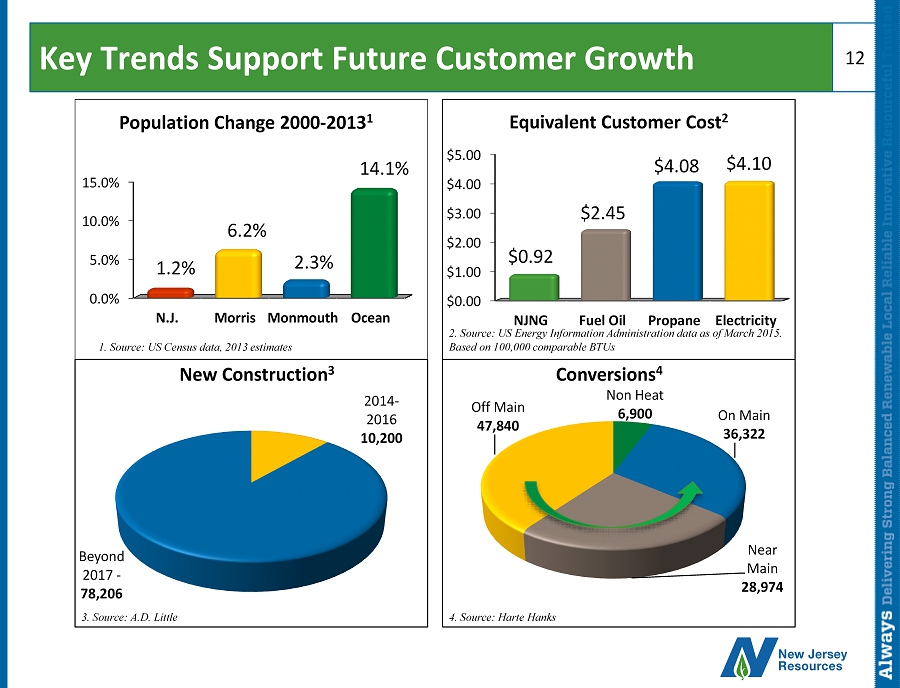
Key Trends Support Future Customer Growth 12 0.0% 5.0% 10.0% 15.0% N.J. Morris Monmouth Ocean 1.2% 6.2% 2.3% 14.1% Population Change 2000 - 2013 1 2014 - 2016 10,200 Beyond 2017 - 78,206 New Construction 3 3 . Source: A.D. Little $0.00 $1.00 $2.00 $3.00 $4.00 $5.00 NJNG Fuel Oil Propane Electricity $0.92 $2.45 $4.08 $4.10 Equivalent Customer Cost 2 Non Heat 6,900 On Main 36,322 Near Main 28,974 Off Main 47,840 Conversions 4 4. Source: Harte Hanks 2 . Source: US Energy Information Administration data as of March 2015. Based on 100,000 comparable BTUs 1. Source: US Census data, 2013 estimates
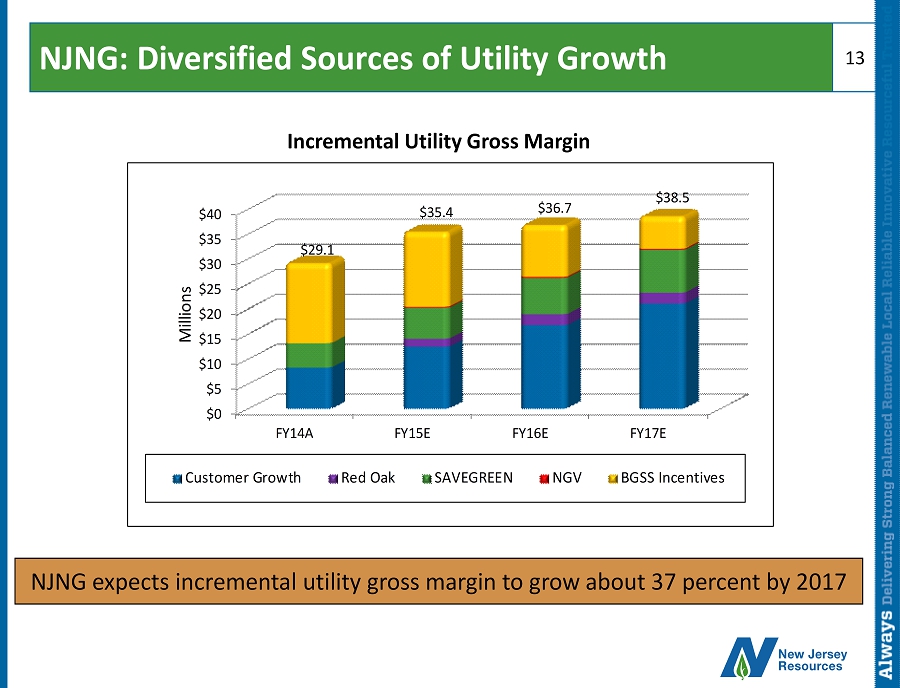
NJNG: Diversified Sources of Utility Growth 13 NJNG expects incremental utility gross margin to grow about 37 percent by 2017 Incremental Utility Gross Margin $0 $5 $10 $15 $20 $25 $30 $35 $40 FY14A FY15E FY16E FY17E $29.1 $35.4 $36.7 $38.5 Millions Customer Growth Red Oak SAVEGREEN NGV BGSS Incentives
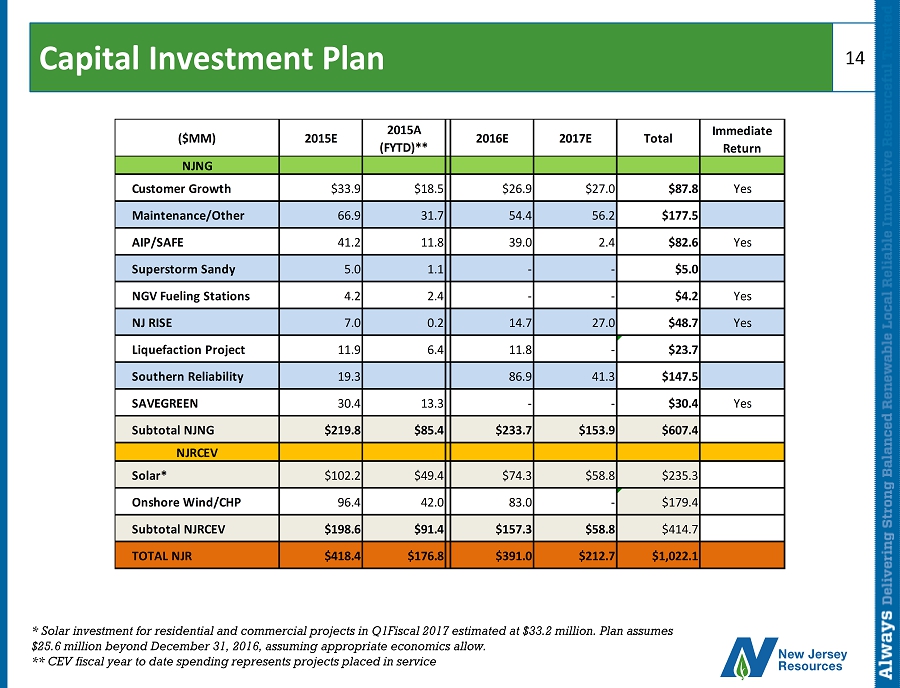
C apital Investment Plan 14 * Solar investment for residential and commercial projects in Q1Fiscal 2017 estimated at $33.2 million. Plan assumes $25.6 million beyond December 31, 2016, assuming appropriate economics allow. ** CEV fiscal year to date spending represents projects placed in service ($MM) 2015E 2015A (FYTD)** 2016E 2017E Total Immediate Return NJNG Customer Growth $33.9 $18.5 $26.9 $27.0 $87.8 Yes Maintenance/Other 66.9 31.7 54.4 56.2 $177.5 AIP/SAFE 41.2 11.8 39.0 2.4 $82.6 Yes Superstorm Sandy 5.0 1.1 - - $5.0 NGV Fueling Stations 4.2 2.4 - - $4.2 Yes NJ RISE 7.0 0.2 14.7 27.0 $48.7 Yes Liquefaction Project 11.9 6.4 11.8 - $23.7 Southern Reliability 19.3 86.9 41.3 $147.5 SAVEGREEN 30.4 13.3 - - $30.4 Yes Subtotal NJNG $219.8 $85.4 $233.7 $153.9 $607.4 NJRCEV Solar* $102.2 $49.4 $74.3 $58.8 $235.3 Onshore Wind/CHP 96.4 42.0 83.0 - $179.4 Subtotal NJRCEV $198.6 $91.4 $157.3 $58.8 $414.7 TOTAL NJR $418.4 $176.8 $391.0 $212.7 $1,022.1