Attached files
| file | filename |
|---|---|
| 8-K - FORM 8-K - Genpact LTD | d919276d8k.htm |
| EX-99.1 - EX-99.1 - Genpact LTD | d919276dex991.htm |
 April
30, 2015 Ticker (NYSE: G)
Genpact
Q1 2015 Earnings Presentation
Exhibit 99.2 |
 These
materials
contain
certain
statements
concerning
our
future
growth
prospects
and
forward-looking
statements,
as
defined
in the safe harbor provisions of the U.S. Private Securities Litigation Reform Act
of 1995. These statements are based on Genpact’s current expectations
and beliefs, as well as a number of assumptions concerning future events. These statements
involve a number of risks, uncertainties and other factors that could cause actual
results to differ materially from those in such forward-looking
statements. These risks and uncertainties include but are not limited to a slowdown in the economies and
sectors in which our clients operate, a slowdown in the BPO and IT Services
sectors, the risks and uncertainties arising from our past and future
acquisitions, our ability to convert bookings to revenues, our ability to manage growth, factors which may
impact our cost advantage, wage increases, our ability to attract and retain
skilled professionals, risks and uncertainties regarding fluctuations in our
earnings, dependence on tax legislation, general economic conditions affecting our industry as well
as other risks detailed in our reports filed with the U.S. Securities and Exchange
Commission (the “SEC”), including the Company's
Annual
Report
on
Form
10-K.
These
filings
are
available
at
www.sec.gov
or
on
the
investor
relations
section
of
our
website, www.genpact.com. Genpact may from time to time make additional written and
oral forward-looking statements, including statements contained in our
filings with the SEC. The Company undertakes no obligation to update any forward-
looking statements that may be made from time to time by or on behalf of the
Company. These materials also include measures defined by the SEC as
non-GAAP financial measures. Genpact believes that these non- GAAP
measures can provide useful supplemental information to investors regarding financial and business trends relating to its
financial condition and results of operations when read in conjunction with the
Company’s reported results. Reconciliations of these non-GAAP
measures from GAAP are available in this presentation and in our earnings release dated April 30, 2015.
Forward-Looking Statements
Non-GAAP Financial Measures
2
©
2015 Copyright Genpact. All Rights Reserved.
DESIGN • TRANSFORM • RUN
|
 Q1
2015 – Key Financial Highlights
Strong
results
driven
by
continued
solid
growth
in
Global
Client
revenues
Q1 ‘15 versus Q1 ‘14 performance:
Total Revenue:
+11%
Revenue from Global Clients:
+13%
GE Revenue:
+3%
Notes:
3
©
2015 Copyright Genpact. All Rights Reserved.
Finance & Accounting Services, Core Vertical Services, and Consulting and Risk
Services led growth
Adjusted income from operations is a non-GAAP measure. Q1 ‘15 GAAP income
from operations margin was 12.6%. 1.
DESIGN • TRANSFORM • RUN
Q1
2015
Adjusted
Income
from
Operations
margin
(1)
at
14.3%,
reflecting
planned strategic
investments made in 2014
Global
Client
growth
was
broad-based
across
many
of
our
target
verticals
–
CPG, Insurance,
Life Sciences, High Tech, and Banking |
 Q1
2015 – Good Start, In Line With Stated Full Year Expectations
Key events and accomplishments:
Our design and transformation services are resonating in the marketplace;
delivering more upfront, design and transform consulting engagements than
ever before We
are
actively
working
with
clients
to
deploy
our
Systems
of
Engagement
TM
(SOE)
technology;
combining
advanced
technologies
with
our
deep
domain
and
process
expertise
to
provide
differentiated
client
insights
and
business
impact
Our Analytics business is focused on re-imagining end-to-end processes
in the context of data and technology to bring transformative change to our
clients 4
©
2015 Copyright Genpact. All Rights Reserved.
Our differentiated solutions –
which combine process, technology and analytics with strong
domain
and
industry
expertise
–
are
driving
significant
value
for
our
clients
Continued
momentum
in
converting
and
winning
large
deals;
signed
two
large
transformational engagements, one each in the Life Sciences and CPG verticals
Gained significant momentum on our Know Your Customer (KYC) offering with Markit;
we will continue to invest in 2015 in this area with the expectation of
revenue and operating income contribution over subsequent years
DESIGN • TRANSFORM • RUN
|
 5
©
2015 Copyright Genpact. All Rights Reserved.
DESIGN • TRANSFORM • RUN
Healthy Pipeline
Our pipeline continues to be healthy across our key target industry verticals,
service lines and geographies
We are pleased with the capability investments we have made and continue to
make in advanced technologies and automation as well as consulting services
Momentum in our pipeline is driven by investment in our front-end teams
Year to date pipeline inflows are strong
Win rates continue to hold well |
 6
©
2015 Copyright Genpact. All Rights Reserved.
DESIGN • TRANSFORM • RUN
Q1 2015 Revenue Summary
Total growth on a constant currency basis was 13%; excluding Pharmalink, total
revenue growth was 9%, or 11% on a constant currency basis
Q1 2015 Global Clients
BPO revenues increased 19% and ITO revenues declined 4%
Global
Clients
GE
BPO
ITO
11.2%
YoY
Growth%
13.3%
3.1%
11.2%
(3.2%)
15.9%
YoY
Growth%
Q1 ‘14
Q1 ‘15
Q1 ‘14
Q1 ‘15
($ in millions)
($ in millions)
$528.2
$587.2
$587.2
$528.2
418.0
473.5
110.2
113.6
398.0
461.1
130.2
126.1 |
 7
©
2015 Copyright Genpact. All Rights Reserved.
DESIGN • TRANSFORM • RUN
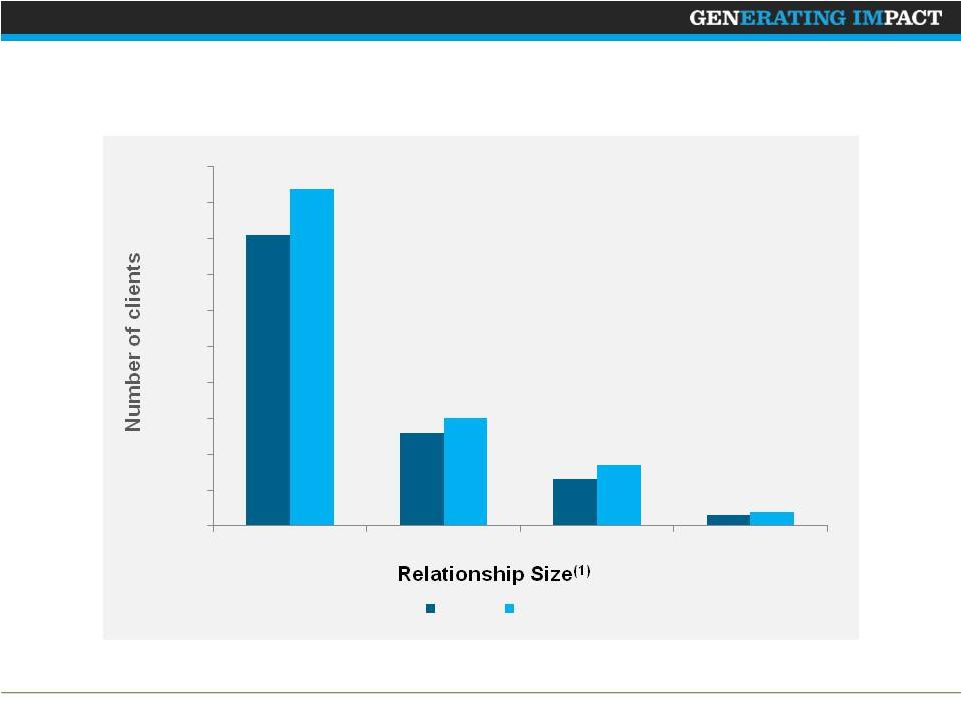
Continue to Expand Client Relationships
Notes:
81
26
13
3
94
30
17
4
0
10
20
30
40
50
60
70
80
90
100
> $5 MM
> $15 MM
>$25 MM
>$50 MM
Q1 14
Q1 15
Relationship size = Clients representing annual revenues based on last four rolling
quarters 1. |
 8
©
2015 Copyright Genpact. All Rights Reserved.
DESIGN • TRANSFORM • RUN
Q1 Results Reflect Investments in Client-Facing Teams
and Capabilities
Q1‘14
Q1’15
YoY
Revenue
528.2
587.2
11.2%
Cost of Revenue
324.3
357.5
10.2%
Gross Profit
203.9
229.7
12.6%
Gross Profit % of Revenue
38.6%
39.1%
50 bps
SG&A
122.5
148.7
21.4%
SG&A % of Revenue
23.2%
25.3%
210bps
Adjusted Income from Operations
(1)
86.4
83.9
-2.9%
Adjusted Income from Operations Margin
16.4%
14.3%
-210 bps
($ millions)
Notes:
Gross profit margin increase was driven by operating efficiencies and favorable
foreign exchange.
1.
Adjusted income from operations is a non-GAAP measure. Income from operations was $77.2 million in
Q1 ‘14 and $74.1 million in Q1’15. |
 9
©
2015 Copyright Genpact. All Rights Reserved.
DESIGN • TRANSFORM • RUN
EPS Year-over-Year Bridge
Q1 ‘14
Q1 ‘15
Adjusted Net Income ($ millions)
57.3
52.9
Diluted
Shares
Outstanding
(millions)
(2)
237.3
222.3
21
-1
Higher FX Re-
measurement
Loss
Q1 ‘14
GAAP
EPS
20
(Cents per share)
Net
Adjustments
(1)
24
3
Net
Adjustments
(1)
Q1 ‘14
Adjusted
EPS
Q1 ‘15
Adjusted
EPS
Q1 ‘15
GAAP
EPS
Lower
Adjusted
Income from
Operations
-4
Increase Decrease
Notes:
-
The above bridge reflects only significant variance items year over year and is
illustrative and subject to rounding. -
EPS = Diluted earnings per share
24
Higher
Financing
Costs
2
FY’14 Share
repurchases
-1
-1
1
Lower
Effective
Tax Rate
Adjustments primarily include amortization of acquired intangible assets, stock-based compensation
expenses and acquisition-related expenses.
1.
2.
Weighted average number of diluted shares outstanding; diluted shares outstanding includes the impact
of 0.6 million shares repurchased in Q1 2015. |
 10
©
2015 Copyright Genpact. All Rights Reserved.
DESIGN • TRANSFORM • RUN
Cash from Operations
Q1 2015 cash from operations up $10 million
Cash from operations is in line with our
expectations Q1 cash flows are typically lower due to the payment of
annual performance bonuses to employees Q1 ‘14
Q1 ‘15
Q1 ’14
Q1 ‘15
Days Sales Outstanding
Cash
and
Liquid
Assets
($
millions)
(1)
434
Notes:
1) Cash and Liquid Assets = Cash and cash equivalents and short-term
deposits ($ in millions)
14
24
87
81
567 |
 11
©
2015 Copyright Genpact. All Rights Reserved.
Full Year 2015 Outlook
DESIGN • TRANSFORM • RUN
FY 2015
Revenues ($B)
2.46 -
2.50
Adjusted Income from Operations -
Margin
~15.0%
Other Metrics
Cash Flow From Operations
2% -
5% > 2014
Effective Tax Rate
23% -
24%
Capital Expenditure (% of revenue)
~3.0% |
 12
©
2015 Copyright Genpact. All Rights Reserved.
DESIGN • TRANSFORM • RUN
Annexure 1: Reconciliation of Adjusted Income From
Operations –
Q1 2015
(USD, in thousands)
Quarter ended March 31,
2014
2015
Income from operations per GAAP
$
77,247
$
74,050
Add: Stock-based compensation
4,973
4,660
Add: Amortization of acquired intangible assets
4,491
6,112
Add: Acquisition related expenses
-
798
Add/Less: Other Income (Expense), net excluding net interest
(131)
458
Add/Less: Gain (Loss) on Equity-method investment activity, net
20
(2,223)
Less: Net income attributable to noncontrolling interest
(240)
-
Adjusted income from operations
$
86,360
$
83,855 |
 13
©
2015 Copyright Genpact. All Rights Reserved.
DESIGN • TRANSFORM • RUN
Annexure 2: Reconciliation of Adjusted Net Income –
Q1
2015
(USD, in thousands, except per share data)
Quarter ended March 31,
2014
2015
Net income attributable to Genpact Limited shareholders per GAAP
$
50,613
$
44,653
Add: Stock-based compensation
4,973
4,660
Add: Amortization of acquired intangible assets
4,491
6,112
Add: Acquisition related expenses
-
798
Less: Tax impact on stock-based compensation
(1,305)
(1,153)
Less: Tax impact on amortization of acquired intangibles
(1,476)
(1,910)
Less: Tax impact on acquisition related expenses
-
(229)
Adjusted net income
$
57,296
$
52,931
Adjusted diluted earnings per share
$
0.24
$
0.24 |
 Thank You |