Attached files
Table of Contents
UNITED STATES
SECURITIES AND EXCHANGE COMMISSION
Washington, D.C. 20549
Form 10-K
Annual Report Pursuant to Section 13 or 15(d)
of the Securities Exchange Act of 1934
| For the fiscal year ended: December 31, 2009 | Commission file number: 001-33626 |
GENPACT LIMITED
(Exact name of registrant as specified in its charter)
| Bermuda | 98-0533350 | |
| (State or other jurisdiction of incorporation or organization) | (I.R.S. Employer Identification No.) |
Canon’s Court
22 Victoria Street
Hamilton HM
Bermuda
(441) 295-2244
(Address, including zip code, and telephone number, including area code, of registrant’s principal executive office)
Securities registered pursuant to Section 12(b) of the Act:
| Title of Each Class |
Name of Exchange on Which Registered | |
| Common shares, par value $0.01 per share | New York Stock Exchange |
Securities registered pursuant to Section 12(g) of the Act: None
Indicate by check mark if the registrant is a well-known seasoned issuer, as defined in Rule 405 of the Securities Act. Yes ¨ No x
Indicate by check mark if the registrant is not required to file reports pursuant to Section 13 or 15(d) of the Act. Yes ¨ No x
Indicate by check mark whether the registrant (1) has filed all reports required to be filed by Section 13 or 15(d) of the Securities Exchange Act of 1934 during the preceding 12 months (or for such shorter period that the registrant was required to file such reports), and (2) has been subject to such filing requirements for the past 90 days. Yes x No ¨
Indicate by check mark whether the registrant has submitted electronically and posted on its corporate Web site, if any, every Interactive Data File required to be submitted and posted pursuant to Rule 405 of Regulation S-T (§232.405 of this chapter) during the preceding 12 months (or for such shorter period that the registrant was required to submit and post such files). Yes ¨ No ¨
Indicate by check mark if disclosure of delinquent filers pursuant to Item 405 of Regulation S-K is not contained herein, and will not be contained, to the best of registrant’s knowledge, in definitive proxy or information statements incorporated by reference in Part III of this Annual Report on Form 10-K or any amendment to this Annual Report on Form 10-K. x
Indicate by check mark whether the registrant is a large accelerated filer, an accelerated filer, a non-accelerated filer, or a smaller reporting company. See the definitions of “large accelerated filer,” “accelerated filer” and “smaller reporting company” in Rule 12b-2 of the Exchange Act. (Check one):
| Large accelerated filer x | Accelerated filer ¨ | Non-accelerated filer ¨ (Do not check if a smaller reporting company) |
Smaller reporting company ¨ |
Indicate by check mark whether the registrant is a shell company (as defined in Rule 12b-2 of the Act). Yes ¨ No x
As of June 30, 2009, the aggregate market value of the common stock of the registrant held by non-affiliates of the registrant, was $1,276,893,110, based on the closing price of the registrant’s common shares, par value of $0.01 per share, reported on the New York Stock Exchange on such date of $11.75 per share. Directors, executive officers and significant shareholders of Genpact Limited are considered affiliates for purposes of this calculation, but should not necessarily be deemed affiliates for any other purpose.
As of February 19, 2010, there were 217,881,172 common shares of the registrant outstanding.
Documents incorporated by reference:
The registrant intends to file a definitive proxy statement pursuant to Regulation 14A within 120 days of the end of the fiscal year ended December 31, 2009. Portions of the proxy statement are incorporated herein by reference to the following parts of this Annual Report on Form 10-K:
Part III, Item 10, Directors, Executive Officers and Corporate Governance;
Part III, Item 11, Executive Compensation;
Part III, Item 12, Security Ownership of Certain Beneficial Owners and Management and Related Stockholder Matters;
Part III, Item 13, Certain Relationships and Related Transactions, and Director Independence; and
Part III, Item 14, Principal Accountant Fees and Services.
Table of Contents
| Item No. |
Page No. | |||||
| 1. | 3 | |||||
| 1A. | 25 | |||||
| 1B. | 41 | |||||
| 2. | 41 | |||||
| 3. | 41 | |||||
| 4. | 41 | |||||
| 5. | 41 | |||||
| 6. | 42 | |||||
| 7. | Management’s Discussion and Analysis of Financial Condition and Results of Operations |
44 | ||||
| 7A. | 69 | |||||
| 8. | 69 | |||||
| 9. | Changes in and Disagreements with Accountants on Accounting and Financial Disclosure |
70 | ||||
| 9A. | 70 | |||||
| 9B. | 71 | |||||
| 10. | 71 | |||||
| 11. | 71 | |||||
| 12. | Security Ownership of Certain Beneficial Owners and Management and Related Stockholder Matters |
71 | ||||
| 13. | Certain Relationships and Related Transactions, and Director Independence |
71 | ||||
| 14. | 72 | |||||
| 15. | 72 | |||||
| F-1 | ||||||
| F-2 | ||||||
| F-3 | ||||||
| F-5 | ||||||
| Consolidated Statements of Equity and Comprehensive Income (loss) |
F-6 | |||||
| F-9 | ||||||
| F-10 | ||||||
| E-1 | ||||||
i
Table of Contents
Special Note Regarding Forward-Looking Statements
We have made statements in this Annual Report on Form 10-K (the “Annual Report”) in, among other sections, Item 1—“Business,” Item 1A—“Risk Factors,” and Item 7—“Management’s Discussion and Analysis of Financial Condition and Results of Operations” that are forward-looking statements. In some cases, you can identify these statements by forward-looking terms such as “expect,” “anticipate,” “intend,” “plan,” “believe,” “seek,” “estimate,” “could,” “may,” “shall,” “will,” “would” and variations of such words and similar expressions, or the negative of such words or similar expressions. These forward-looking statements, which are subject to risks, uncertainties and assumptions about us, may include projections of our future financial performance, which in some cases may be based on our growth strategies and anticipated trends in our business. These statements are only predictions based on our current expectations and projections about future events. There are important factors that could cause our actual results, level of activity, performance or achievements to differ materially from those expressed or implied by the forward-looking statements. In particular, you should consider the numerous risks outlined under Item 1A—“Risk Factors” in this Annual Report. These forward looking statements include, but are not limited to, statements relating to:
| • | our ability to retain existing clients and contracts; |
| • | our ability to win new clients and engagements; |
| • | the expected value of the statements of work under our master service agreements; |
| • | our beliefs about future trends in our market; |
| • | political or economic instability in countries where we have operations; |
| • | worldwide political, economic or business conditions; |
| • | political, economic or business conditions where our clients operate; |
| • | expected spending on business process services by clients; |
| • | foreign currency exchange rates; |
| • | our rate of employee attrition; |
| • | our effective tax rate; and |
| • | competition in our industry. |
Factors that may cause actual results to differ from expected results include, among others:
| • | our ability to grow our business and effectively manage growth and international operations while maintaining effective internal controls; |
| • | our relative dependence on GE; |
| • | our dependence on revenues derived from clients in the United States; |
| • | our ability to hire and retain enough qualified employees to support our operations; |
| • | our dependence on favorable tax legislation and tax policies that may be amended in a manner adverse to us or be unavailable to us in the future; |
| • | increases in wages in locations in which we have operations; |
| • | restrictions on visas for our employees traveling to North America and Europe; |
1
Table of Contents
| • | our ability to maintain pricing and asset utilization rates; |
| • | fluctuations in exchange rates between U.S. dollars, euros, U.K. pounds sterling, Chinese renminbi, Hungarian forint, Japanese yen, Indian rupees, Australian dollars, Philippines Peso, Guatemala quetzal, Moroccan dirham (DH), Polish zloty, Romanian leu and South African rand; |
| • | our ability to retain senior management; |
| • | the selling cycle for our client relationships; |
| • | our ability to attract and retain clients and our ability to develop and maintain client relationships based on attractive terms; |
| • | legislation in the United States or elsewhere that adversely affects the performance of business process services offshore; |
| • | increasing competition in our industry; |
| • | telecommunications or technology disruptions or breaches, or natural or other disasters; |
| • | our ability to protect our intellectual property and the intellectual property of others; |
| • | further deterioration in the global economic environment and its impact on our clients; |
| • | regulatory, legislative and judicial developments, including the withdrawal of governmental fiscal incentives; |
| • | the international nature of our business; |
| • | technological innovation; |
| • | our ability to derive revenues from new service offerings; |
| • | unionization of any of our employees; and |
| • | our ability to successfully consummate or integrate strategic acquisitions. |
Although we believe the expectations reflected in the forward-looking statements are reasonable, we cannot guarantee future results, level of activity, performance or achievements. Achievement of future results is subject to risks, uncertainties, and potentially inaccurate assumptions. Should known or unknown risks or uncertainties materialize, or should underlying assumptions prove inaccurate, actual results could differ materially from past results and those anticipated, estimated or projected. You should bear this in mind as you consider forward looking statements. We are under no obligation to update any of these forward-looking statements after the date of this filing to conform our prior statements to actual results or revised expectations. You are advised, however, to consult any further disclosures we make on related subjects in our Form 10-Q and Form 8-K reports to the SEC.
2
Table of Contents
Overview
We are a leader in managing business processes, offering a broad portfolio of enterprise and industry-specific services. We manage over 3,000 processes for more than 400 clients worldwide. Putting process in the forefront, we couple our deep process knowledge and insights with focused information technology capabilities, targeted analytics and pragmatic reengineering to deliver comprehensive solutions for clients. Lean and Six Sigma are an integral part of our culture and we view the management of business processes as a science. We have launched Smart Enterprise Processes (SEPSM), a groundbreaking, rigorously scientific methodology for managing business processes, which focuses on optimizing process effectiveness in addition to efficiency to deliver superior business outcomes. Services are seamlessly delivered from a global network of centers to meet a client’s business objectives, cultural and language needs and cost reduction goals.
We have a unique heritage. We built our business by meeting the demands of the leaders of the General Electric Company, or GE, to increase the productivity of their businesses. We began in 1997 as the India-based captive business process services operation for General Electric Capital Corporation, or GE Capital, GE’s financial services business. As the value of offshoring was demonstrated to the management of GE, it became a widespread practice at GE and our business grew in size and scope. We took on a wide range of complex and critical processes and we became a significant provider to many of GE’s businesses, including Consumer Finance (GE Money), Commercial Finance, Healthcare, Industrial, NBC Universal and GE’s corporate offices.
Our leadership team, our methods and our culture have been deeply influenced by our eight years as a captive operation of GE. Many elements of GE’s success—the rigorous use of metrics and analytics, the relentless focus on improvement, a strong emphasis on the client and innovative human resources practices—are the foundations of our business.
As of December 31, 2009 we have more than 38,600 employees with operations in thirteen countries. In 2009, we had net revenues of $1.12 billion, of which 59.7% was from clients other than GE, which we refer to as Global Clients.
Our registered office is located at Canon’s Court, 22 Victoria Street, Hamilton HM, Bermuda.
The Company
The 2004 Reorganization
Prior to December 30, 2004, our business was conducted through various entities and divisions of GE. On December 30, 2004, in a series of transactions we refer to as the “2004 Reorganization,” GE reorganized these operations by placing them all under Genpact Global Holdings SICAR S.à.r.l., or GGH, a newly formed company. GE’s affiliate, GE Capital International (Mauritius) also sold an indirect 60% interest in GGH to Genpact Investment Co. (Lux) SICAR S.à.r.l., or GICo, an entity owned in equal portions by General Atlantic LLC, or General Atlantic, and Oak Hill Capital Partners, or Oak Hill. Since the 2004 Reorganization, GE, through its affiliates, sold a portion of its equity in us pursuant to several separate transactions. As of December 31, 2009, GE, through its affiliates, owned 18.37% of our outstanding equity.
Following the 2004 Reorganization, we began operating as an independent company. We separated ourselves operationally from GE and began building the capabilities necessary to be successful as an independent company. Among other things, we expanded our management infrastructure and business development capabilities so that we could secure business from clients other than GE. We substantially expanded administrative functions for which we had previously relied primarily on GE, such as finance, legal, accounting and human resources. We created separate employee benefit and retirement plans, developed our own leadership training capability and enhanced our management information systems.
3
Table of Contents
The 2007 Reorganization and IPO
On March 29, 2007, we formed Genpact Limited in Bermuda to be the new holding company for our business. It was initially a wholly-owned subsidiary of GGH. On July 13, 2007, we effectuated a transaction that resulted in Genpact Limited owning 100% of the capital stock of GGH. This transaction together with other related transactions is referred to as the “2007 Reorganization.” This transaction occurred by the shareholders of GGH exchanging their common shares of GGH for common shares of Genpact Limited and the shareholders of Genpact Global (Lux) S.à.r.l., or GGL, exchanging their common and preferred shares of GGL for common shares of Genpact Limited. In addition, as part of the 2007 Reorganization, GGL, which owned approximately 63% of the outstanding equity of GGH, became a wholly owned subsidiary of Genpact Limited pursuant to a share exchange. GGL had no operations or assets other than its ownership interest in GGH, and had no liabilities other than obligations for accumulated dividends on preferred shares that were eliminated in the 2007 Reorganization and certain tax liabilities of $2.1 million that were paid on July 27, 2007. GE, through its affiliate GE Capital (International) Mauritius Holdings Ltd., and GICo reimbursed us for such tax liabilities in accordance with their agreement to indemnify us for such liabilities. As part of the 2007 Reorganization, GGH became a Bermuda company and changed its name to Genpact Global Holding (Bermuda) Limited and GGL also became a Bermuda company, in accordance with the laws of Bermuda and Luxembourg and its name was changed to Genpact Global (Bermuda) Limited. We use the terms “Genpact”, “Company”, “we” and “us” to refer to both GGH and its subsidiaries prior to July 13, 2007 and Genpact Limited and its subsidiaries after such date.
On August 1, 2007, we commenced an initial public offering of our common shares, pursuant to which we and certain of our existing shareholders each sold 17.65 million common shares at a price of $14 per share. The offering resulted in gross proceeds of $494.1 million and net proceeds to us and the selling shareholders of approximately $233.5 million each after deducting underwriting discounts and commissions. Additionally, we incurred offering-related expenses of approximately $9.0 million. On August 14, 2007, the underwriters exercised their option to purchase 5.29 million additional common shares from us at the initial offering price of $14 per share to cover over-allotments resulting in additional gross proceeds of $74.1 million and net proceeds of approximately $70.0 million to us, after deducting underwriting discounts and commissions.
Our Opportunity
Globalization of the world’s economy remains the most powerful economic trend of our lifetime. It is driven by expanding technology capabilities, the relaxation of local laws and regulations that previously impeded cross-border trade, more efficient global telecommunications, demographic factors and the recognition by business leaders that a highly skilled global workforce can be a competitive business advantage. These dynamics are creating an entirely new set of competitive challenges for companies around the world. While the global economic downturn that began at the end of 2008 adversely affected many industries, including our own, we believe that the long-term trends favoring globalization of services will continue.
Globalization has contributed to increased competition for companies around the world, particularly in the established economies of North America and Europe. These dynamics, together with the recent recessionary environment, have forced companies to focus on ways to improve productivity and manage costs more aggressively in order to maintain or enhance their competitive positions and increase shareholder value. As part of their response to the pressures of globalization, business leaders initially began offshoring business processes to captive businesses and outsourcing business processes to third parties, including by sending such processes offshore to workers in countries where wage levels were lower than in North America and Europe.
Outsourcing initially focused on realizing immediate cost savings and involved labor-intensive processes such as call center services and data entry. The frequency with which these processes were outsourced increased as companies recognized that offshore service providers could run these processes more efficiently by recruiting and training skilled labor in larger numbers and at lower cost than was available in a company’s home market.
The use of information technology has also been an important catalyst for the growth of outsourcing. Before outsourcing business processes, companies more frequently outsourced IT operations. As companies realized
4
Table of Contents
benefits from outsourcing IT services, they became more willing to outsource other types of processes. At the same time, growth in the use of IT contributed to greater efficiencies in business processes and other productivity enhancements. As a result, knowledge of IT platforms and technology became increasingly important to effective business process management.
Initially, India became the primary destination for offshore business process outsourcing, due to wage levels that are much lower than in the United States. In addition, India offers a large, growing and highly educated English-speaking workforce, a time zone that offers a 24-hour work cycle from a North American and European perspective and a business and regulatory environment that is increasingly conducive to interacting with North American and European companies. However, as demand and the range of services have grown, other destinations have become increasingly important.
This growth is a function of the increasing acceptance of the globalization of services and the constantly expanding notions of what can be outsourced and the benefits that can be achieved. The services that are being outsourced today are much broader, and involve much higher valued functionality than originally outsourced, and include engineering, design, software programming, accounting, healthcare services, legal services, financial analysis, consulting activities and other services, and cut across all industries.
Ongoing competitive pressures and the need for further productivity improvements have led companies to consider outsourcing more critical and complex business processes and to focus on continuously improving those processes, rather than simply trying to operate them at a lower cost. As a result, many companies have been forced to redefine their core competencies. For example, companies across many industries have outsourced their accounting and finance functions, which were once considered core corporate activities, to third party providers. Today, companies look to achieve a wider range of objectives from outsourcing as portrayed in the diagram below:

Each step along this continuum provides additional value to enterprises that outsource business processes. Delivering significant cost savings by transitioning business processes offshore allows companies to benefit from a labor cost arbitrage. Converting fixed costs into variable ones through outsourcing can provide additional capacity and ongoing business flexibility. Continuously improving business processes offers ongoing productivity benefits and margin expansion opportunities. Ultimately, companies seek business impact such as increased revenue, expanded margins, improved working capital management, increased customer satisfaction and enhancement in their competitive positions.
Today, the willingness to outsource a broader array of business processes, from the relatively simple to the more critical and complex, and the fact that many business processes can be enhanced through the application of IT, has created an opportunity for service providers that have broad and deep capabilities, as well as expertise in both process operation and IT platforms. Companies that are ready to embrace the outsourcing of complex business processes are seeking service providers with a broad range of capabilities with which they can establish a strategic relationship that will grow over time. Many senior, or C-level, executives today consider the following factors when looking to collaborate with a service provider:
| • | Process excellence. A service provider should have accumulated significant experience and insight through having transitioned, managed and improved processes across a number of different service lines and industries. |
| • | Global delivery. Many companies want a service provider with an extensive global delivery network, so that the provider can leverage a multi-lingual talent base to meet the client’s needs across multiple geographies and time zones. |
5
Table of Contents
| • | Analytical approach. A service provider should have the ability to apply advanced analytical methods to address its clients’ needs and to increase their productivity. |
| • | IT expertise. A service provider should have knowledge of, and experience with, IT platforms and applications and be able to apply that IT expertise to improve business processes and transitioning. |
| • | Domain expertise. A service provider should have institutional knowledge of relevant industries and functional processes. |
| • | Stable workforce. The outsourcing industry has high employee attrition, leading companies often to consider whether the provider can effectively recruit, train and retain employees, as this is critical to delivering consistent high quality services. |
| • | Scale. Large companies want a service provider that possesses a large employee base with strong middle and senior management as well as a technology and telecommunications infrastructure that can support large scale outsourcing engagements across multiple functions, business units and geographies. |
Our Solution
We manage a wide range of business processes that address the transactional, managerial, reporting and planning needs of our clients. We seek to build long-term client relationships with companies that wish to improve the ways in which they do business and where we can offer a full range of services. With our broad and deep capabilities and our global delivery platform, our goal is to deliver comprehensive solutions and continuous process improvement to clients around the world and across multiple industries.
Our Broad Expertise
Our services include finance and accounting, collections and customer services, back office support for banking, financial services and insurance companies, supply chain and procurement, analytics, enterprise application and IT infrastructure. Significant business impact can often best be achieved by redesigning and operating a combination of processes, as well as providing multiple services that combine elements of several of our service offerings. In offering our services, we draw on three core capabilities—process expertise, analytical ability and technology expertise—as well as the operational insight we have acquired from our experience managing thousands of processes in diverse industries.
| • | Process Expertise. We have extensive experience in operating a wide range of processes and have used this expertise to launch Smart Enterprise Processes (SEPSM). SEPSM is a unique, scientific, and highly granular approach to managing business processes. In addition to efficiency, it focuses on maximizing process effectiveness, which can deliver two to five times the end business outcomes, like cash flow and margins, when compared to processes that run at average or below. We also apply the principles of Six Sigma and Lean to eliminate defects and variation and reduce inefficiency and develop and track operational metrics to measure process performance as a means of monitoring service levels and enhancing productivity. |
| • | Analytical Capabilities. Our analytical capabilities are central to our improving business processes. They enable us to work with our clients and identify weaknesses in business processes and redesign and re-engineer them to create additional business value and provide the data analysis and insights for supporting decision support processes for clients. We also rigorously apply analytical methodologies, which we use to measure and enhance performance of our client services. We also apply these methodologies to measure and improve our own internal functions, including recruitment and retention of personnel. |
6
Table of Contents
| • | Technology Expertise. Our information technology expertise includes extensive knowledge of third-party hardware, network and computing infrastructure, and enterprise resource planning and other software applications. We also use technology to better manage the transition of processes, to automate and operate processes more efficiently and to replace or redesign processes so as to enhance productivity. Our ability to combine our business process and IT expertise along with our Six Sigma and Lean skills allow us, for example, to perform enterprise resource planning, or ERP, implementations on budget and on time, as well as to ensure our clients achieve the full potential of business intelligence platforms and web based software platforms. |
| • | Operational Insight. Our operational insight enables us to make the best use of our core capabilities. Operational insight starts with the ability to understand the business context of a process. We place great value on understanding not only the industry in which a client operates, but also the business culture and institutional parameters within which a process is operated. Operational insight is also the judgment to determine the best way to improve a process in light of the knowledge of best practices across different industries, as well as an appreciation of what solutions can be fully implemented in the context of the particular business environment. |
Our Strategic Client Model
We seek to create long-term relationships with our clients where they view us as an integral part of their organization and not just as a service provider. These relationships often begin with the outsourcing of discrete processes and, over time, expand to encompass multiple business processes across a broader set of functions and geographic areas. No matter how large or small the engagement, we strive to be a seamless extension of our client’s operations. To achieve this goal, we developed the Genpact Virtual CaptiveSM model for service delivery, and we may implement all or some of its features in any given client relationship, depending on the client’s needs. Under this approach, we provide a client with dedicated employees and management as well as dedicated infrastructure at our Delivery Centers to create a virtual extension of the client’s own team and environment. We train our people in the client’s culture so that they are familiar not only with the process but with the business environment in which it is being executed.
Our Global Delivery Platform
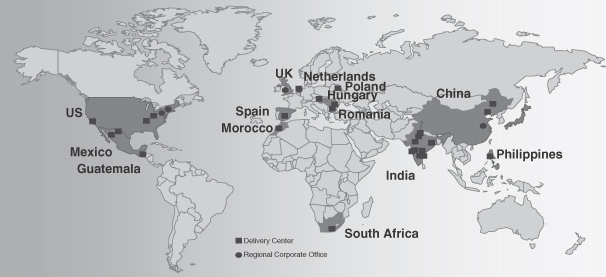
We have a global network of 39 Delivery Centers in thirteen countries. Our Delivery Centers are located in India, China, Guatemala, Hungary, Mexico, Morocco, the Philippines, Poland, the Netherlands, Romania, South Africa, Spain and the United States. Our presence in locations around the world provides us with multi-lingual capabilities, access to a larger talent pool, “near-shoring” capabilities to take advantage of time zones as well as the ability to provide services from the United States. With this network, we can manage complex processes in multiple geographic regions. We use different locations for different types of services depending on the specific client needs and the mix of skills and cost of employees available in each location. We have been a pioneer in our industry in opening centers in several cities in India as well as in some of the other countries in which we operate and becoming an employer of choice in those locations. We expect to continue to expand our global footprint in order to better serve our clients.
Our People and Culture
We have an experienced and cohesive leadership team. Many members of our leadership team developed their management skills working within GE and many of them were involved in the founding of our business. They have built our business based on the experience gained in helping GE meet a wide range of challenges. As a result, we are an institutional embodiment of much of the wisdom and experience GE developed in improving and managing its own business processes. We have created, and constantly reinforce, a culture that emphasizes teamwork, constant improvement of our processes and, most importantly, dedication to the client. A key determinant of our success, especially as we continue to increase the scale of our business, is our ability to attract, hire, train and retain employees in highly competitive labor markets. We manage this challenge through innovative human resources practices. These include broadening the employee pool by opening Delivery Centers
7
Table of Contents
in diverse locations, using innovative recruiting techniques to attract the best employees, emphasizing ongoing training, instilling a vibrant and distinctive culture and providing well-defined long term career paths. We also have programs modeled on GE management training programs to develop the next generation of leaders and managers of our business.
As of December 31, 2009, we had more than 38,600 employees including over 10,700 employees with Six Sigma green-belt training and 530 employees with Six Sigma black-belt training, as well as more than 23,500 Lean trained employees. This large number of employees with Six Sigma and Lean training helps infuse our organization with a disciplined, analytical approach to everything we do. In addition, more than 9,000 of our employees hold post-graduate degrees and more than 23,800 are university graduates. We monitor and manage our attrition rate very closely, and believe our attrition rate is one of the lowest in the industry. We attribute this to our reputation, our ability to attract high quality applicants, our emphasis on maintaining our culture and the breadth of exposure, experience and opportunity for advancement that we provide to our employees.
Our Strategy
The specific elements of our strategy include the following:
Expand Relationships with Existing Clients
We continuously strive to deepen and expand relationships with our existing clients, including GE, and as of December 31, 2009 had more than 400 clients. Many of these relationships are at an early stage and we believe they offer significant opportunities for growth. As we demonstrate the value that we can provide, often with a discrete process, we are frequently able to expand the scope of our work in a variety of ways.
Develop New Client Relationships
In addition to expanding our current client relationships, we seek to develop new long-term client relationships, especially with those clients where we have an opportunity to deliver a broad range of our capabilities and can have a meaningful impact on their businesses.
Continue To Promote Process Excellence
The ability to deliver continuous process improvement is an important part of the value that we offer to our clients. We have built a significant repository of process expertise across a wide range of processes such as finance and accounting, supply chain, collections; order-to-cash; industry specific processes for banking, financial service and insurance companies; analytics and client service, and our process expertise is complemented by our ability to implement services and work across multiple technology platforms in diverse industries.
Continue To Deepen Our Expertise and Global Capabilities
We will continue to expand our capabilities globally as well as across industries and service offerings. While we expect this will occur primarily through organic growth, we also plan to evaluate strategic partnerships, alliances and acquisitions to expand into new services offerings as well as into new industries. For example, we acquired an analytics business in 2010, a SAP services provider and a risk assurance company in 2007, a mortgage fulfillment services business in 2006 and an accounts receivable management business in 2005.
We believe we were also one of the first companies in our industry to establish a presence in several cities in India, such as Gurgaon, Jaipur and Kolkata, as well as in Dalian, China; Budapest, Hungary; and Bucharest, Romania, and to create a global service delivery capability. We intend to continue to expand our global delivery capabilities to ensure that we can meet the rapidly evolving needs of our clients, including processes requiring multi-jurisdictional and multi-lingual capabilities.
8
Table of Contents
Maintain Our Culture and Enhance Our Human Capital
Our ability to grow our business will depend on our ability to continue to attract, train and retain large numbers of talented individuals. We will continue to develop innovative recruiting techniques and to emphasize learning throughout the tenure of an employee’s career. We also believe that maintaining our vibrant and distinctive culture, in which we emphasize teamwork, continuous process improvement and dedication to the client, is critical to growing our business.
Our Services
We provide a wide range of services to our clients. We group our services into the following categories:
| • | finance and accounting; |
| • | collections and customer service; |
| • | banking, financial services and insurance; |
| • | supply chain and procurement; |
| • | analytics; |
| • | re-engineering; |
| • | enterprise application; |
| • | software tools and automation; and |
| • | IT infrastructure. |
The services we provide any particular client often draw on processes and platforms in several of these categories. We understand that senior management of our clients are focused on achieving business objectives, rather than on transferring particular processes or employing particular platforms. Therefore, we focus on understanding the business needs of our clients and the business context of existing processes in order to design appropriate and comprehensive solutions for our clients, which may involve processes and platforms that fall into several categories.
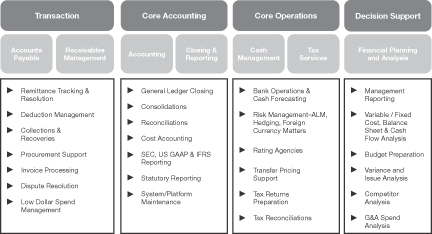
Finance and Accounting
We are one of the world’s premier providers of finance and accounting, or F&A, services. This is currently one of our largest service offerings. Our finance and accounting services include end-to-end transaction services, such as accounts payable processing and receivables management; core accounting services, including preparation of International Financial Reporting Standards, U.S. GAAP and SEC-compliant financial statements; core operations services, including cash management, preparation of tax returns as well as decision support services, which include cash flow analysis. Our services combine our process expertise with strong technology capabilities, including decision support tools such as Hyperion, SAS and Cognos, and platform support for ERP systems such as Oracle and SAP and new technology bundling such as OCR and invoice exchange.
9
Table of Contents
The chart below highlights our F&A service offerings:
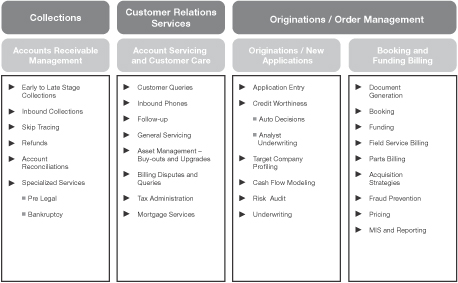
Collections and Customer Services
Our collections and customer services are provided primarily in the areas of consumer finance, commercial finance and mortgage services. Our collections services include a full range of accounts receivable management services, such as early to late stage collections, skip-tracing, refunds, account reconciliation and other specialized services. In our collections services, we act as an agent; we do not acquire debts for our own account. Our customer services include account servicing and customer care services such as handling customer queries, general servicing and dispute resolution. We provide voice and non-voice services. We also provide origination and order management services.
The chart below highlights some of our collections and customer service offerings:
10
Table of Contents
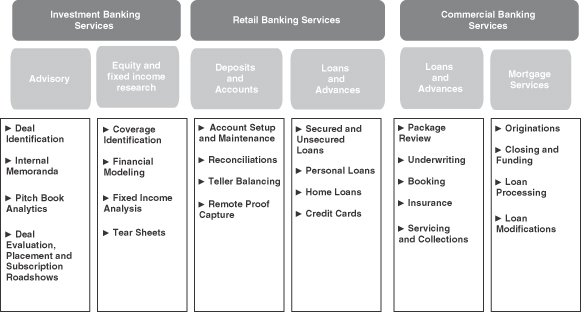
Banking, Financial and Insurance Services
We provide analytic, process and technology services to companies within the banking and financial services market designed to increase revenue, enhance customer satisfaction and reduce risk.
The chart below highlights some of our banking and financial services offerings:
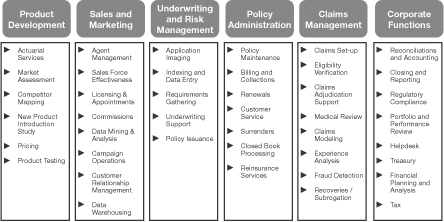
We provide what we refer to as a “virtual insurance company” for our clients in the insurance industry. We cover many phases of insurance business processes including product development, sales and marketing, policy administration and claims management. We use our analytics capabilities to help our clients devise new models for underwriting, risk management and actuarial analysis. We also handle corporate functions for insurance companies, including reporting and monitoring services for regulatory compliance, portfolio and performance review services and financial planning and tax services. We offer services across the following three key insurance market segments:
| • | life and annuities; |
| • | property and casualty; and |
| • | health. |
11
Table of Contents
The chart below highlights some of our insurance service offerings:
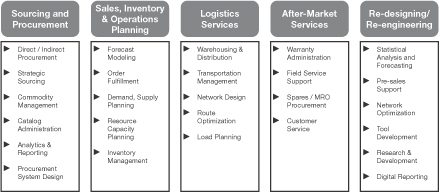
Supply Chain and Procurement
Our supply chain and procurement services include sourcing services, sales, inventory and operations planning services, logistics services and after market services. This often includes designing sourcing and procurement processes to control “maverick” buying, overhauling inventory planning systems to optimize inventory levels, designing and implementing logistics services that integrate disparate technology systems and provide dynamic digital “dashboard” reporting, or designing after-market service systems that ensure fulfillment of contractual obligations and enhance database integrity. We commonly utilize our technology expertise in delivering our services in this area particularly in automating order management processes and monitoring and optimizing supply chain logistics. We have competency in many of the custom platforms used by our clients (e.g., i2, Manugistics and Xelus) and are not tied to any one platform. This enables us to utilize and design the best processes for our clients based on available systems.
The chart below highlights some of our supply chain and procurement service offerings:
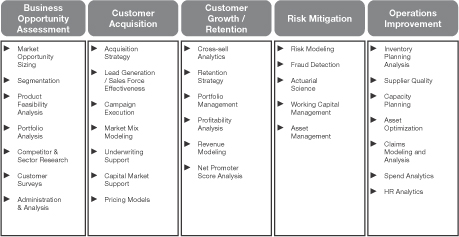
Analytics
In addition to incorporating analytics into our other service offerings, at Genpact analytics is its own service offering and we believe we are a leader in this area. Our clients frequently have data that can be used to assess business opportunities, mitigate risks, improve performance or otherwise help their businesses. However, they do not always recognize the potential in such data or do not have the capability to apply the rigorous analytical models that might reveal opportunities. Drawing on considerable domain expertise and sophisticated research
12
Table of Contents
science, we help clients make fact-based decisions for superior results. By quantitatively and qualitatively scrutinizing data we can deliver the insight necessary to assess a new business opportunity, mitigate market risks, or retain and build market share. In our view, almost any data, properly broken down and interpreted, can improve performance.
The chart below describes some of the most common applications of our analytics capabilities:
Re-engineering
Our re-engineering services help clients realize cost savings or increased revenues by improving processes that are underperforming or designing processes that are needed to meet growth objectives. Clients engage our re-engineering teams to provide an end-to-end view of their organization and help determine business process needs at a strategic level as well as at the execution level. Strategically, we help clients achieve a comprehensive assessment of how well their enterprise level processes such as source-to-pay, order-to-cash or record-to-repair, perform against industry benchmarks and best practices. At the execution level we institutionalize the recommendations by deploying resources to train the client team and drive sustainable best practices.
Enterprise Application Services
With our enterprise application services, we plan, design, build, test, implement, run and support software solutions for our clients. We leverage our functional and domain knowledge in industries such as banking & financial services, insurance, manufacturing, automotive and healthcare and use Six Sigma and Lean principles to reduce the cycle time of software implementations. This can include enterprise resource planning, or ERP, supply chain management, financial management and customer relationship management solutions as well as testing, database administration and architecture services. We also have significant expertise in Hyperion, SAS and Cognos, and platform support for ERP systems such as Oracle , SAP and Microsoft.
13
Table of Contents
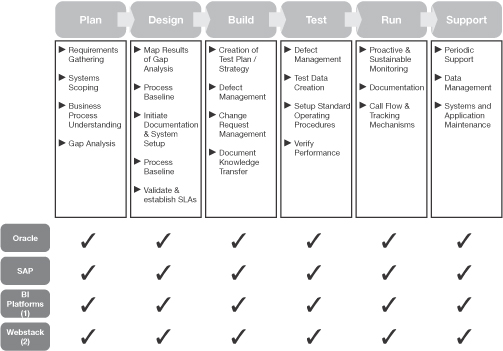
| (1) | Examples of these business intelligence platforms include Hyperion and Cognos. |
| (2) | Examples of these webstack software programs include Java and net. |
Software Tools and Automation
Our software tools and automation services consist of both transformational and efficiency enabling capabilities. We help clients maximize their existing, installed investments in key software platforms by providing the needed tools for incremental functionality and automation. We use best-of-breed software tools available in the market as well as our own software tools. Examples of Genpact’s software tools include GenProSM Invoice Exchange, which lowers invoice processing costs by eliminating the need for any manual intervention in data entry and contributes to increased cash flow by identifying un-captured discount opportunities. ProFlowSM AP is Genpact’s accounts payable workflow tool, which automates work allocation for increased productivity and ensures a standardized way of working on a process. And the GenPowerSM Cforia Credit Collection Chargeback Management software increases profitability by decreasing charge backs through recovery and avoidance. By combining our process domain expertise with leading ERP applications, wrappers and tools, we are able to create solutions for maximum business impact.
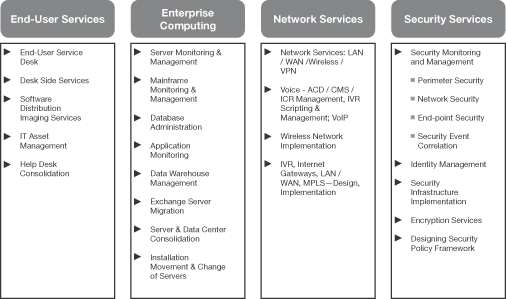
IT Infrastructure Services
Our IT infrastructure services consist of the onsite and remote management of IT functions of our clients. This includes management of a client’s data centers, networks services, network security, malware protection, identity management, encryption services, databases and end-user Help Desk support. Along with ITIL (ISO 20000), we use Six Sigma and Lean principles to address technology problems and to enable our clients to align their IT to business needs and at the same time reducing technology costs. We use secure, global state of the art Remote Operations Centre (ROC) and our IPs like Lean Desk to sustain our differentiation.
14
Table of Contents
The chart below highlights some of the IT infrastructure services we provide:
Smart Enterprise Processes (SEPSM)
SEPSM is a unique, scientific, and highly granular approach to managing business processes. In addition to efficiency, it focuses on maximizing process effectiveness, which can deliver two to five times the end business outcomes, like cash flow and margins, when compared to processes that run at average or below.
SEPSM is based on work done in the Genpact Process Innovation Lab, where we have leveraged our database of over 200 million transactions to map and analyze end-to-end processes at a granular level. This enables us to test the effectiveness of a client’s processes by measuring points of leakage and applying best-in-class benchmarks from within and across industries. The result is a client specific road map for maximizing process effectiveness. Benefits are delivered by combining Genpact’s deep domain knowledge of process, key insights and best practices with execution support including, focused IT applications and technology, targeted analytics, reengineering and global delivery services.
Unlike other approaches, SEPSM focuses on measuring business outcomes like cash flow and margins, which make visible the effectiveness of a process in driving business results. The approach also takes an end-to-end, enterprise-wide view, working beyond traditional organizational silos.
Six Sigma and Lean Methodologies
Our GE heritage taught us the importance of the principles of Six Sigma and Lean in refining business processes. Six Sigma is a method for improving quality by removing variation, defects and their causes in business process activities. Applying Six Sigma principles involves the application of a number of sub-methodologies, including DMAIC (define, measure, analyze, improve and control), which is a system for incremental improvement in existing processes, and DMADV (define, measure, analyze, design and verify), which is a system used to develop new processes at Six Sigma quality levels.
We have Six Sigma programs that train, test and grade employees in Six Sigma principles and award them Six Sigma qualifications. The rankings of Six Sigma qualifications from lowest to highest are green-belt, black-belt and master black-belt. As of December 31, 2009, we had more than 10,700 employees with Six Sigma green-belt training and 530 employees with Six Sigma black-belt training, as well as more than 23,500 Lean
15
Table of Contents
trained employees. Unlike many of our competitors who have a relatively small number of Six Sigma trained employees, we have a large number of Six Sigma green-belts and black-belts and therefore we can provide certain of our clients with dedicated Six Sigma trained personnel who can help the clients achieve continuous process improvement on a full-time basis.
Lean is a methodology for measuring and reducing waste or inefficiency in a process. Among other things, it is designed to measure and eliminate overproduction, over-processing and waiting, and to improve the flow of a process. Lean tools and methods are easy to learn and simple to implement and lend themselves to being implemented by associates on the production floor, thus making it valuable across the company.
We constantly measure the performance of each process we manage for our clients and we work with our clients to develop customized reporting systems so that they have real time access to key metrics. We also apply these principles to our own internal processes in order to deliver efficient operations for our clients. Our expertise in applying Six Sigma and Lean methodologies is one of the key factors that distinguishes us from our competitors.
Industries
We provide our services across a wide range of industries including banking and financial services, insurance, manufacturing, transportation and healthcare. We set forth below a table showing our net revenues in 2009 attributable to the various industry groups that we serve.
| Industry |
Year Ended December 31, 2009 (Net revenues in millions) | ||
| Banking, financial services and insurance |
$ | 488.1 | |
| Manufacturing and healthcare |
442.6 | ||
| Others |
189.4 | ||
| Total |
$ | 1,120.1 | |
Our Clients
Our clients include some of the best known companies in the world, many of which are leaders in their respective industries. GE has been our largest client and we benefit from a long-term contract whereby GE has committed to purchase stipulated minimum dollar amounts of services through 2016. Since our separation from GE, we have actively marketed our services to other companies and have succeeded in building a diversified client base. Many of these relationships are at an early stage and we believe they offer opportunities for growth.
GE accounted for approximately 40.3% of our revenues in fiscal 2009. We currently provide services to all of GE’s business units including GE Capital, GE Infrastructure Energy, GE Infrastructure Technology and NBC Universal as well as to GE’s corporate head office. The services we currently provide to GE are broad in their nature and are drawn from all of our service offerings. Although we have a single master services agreement, or MSA, with GE, we have approximately 2,200 statements of work, or SOWs, with GE. Currently, as a general matter, each GE business unit makes its own decisions as to whether to enter into a SOW with us and as to the terms of any such SOW. Therefore, although some decisions may be made centrally at GE, our revenues from GE are generally attributable to a number of different businesses each with its own leader responsible for decision-making regarding outsourcing.
We have over 400 Global Clients spread across a variety of industries and geographies. Our net revenues from Global Clients have increased rapidly in the last five years, from $42.2 million in 2005 to $668.7 million in 2009. Our net revenues from Global Clients as a percentage of total net revenues increased from 8.6% in 2005 to 59.7% in 2009. The 2009 net revenues from Global Clients include $23.7 million for businesses that were part of GE in 2008. See
16
Table of Contents
Item 7—“Management’s Discussion and Analysis of Financial Condition and Results of Operations—Classification of Certain Net Revenues.” The majority of our Global Clients are based in the United States, and we also have Global Clients in Europe, Asia and Australia.
Our contracts with our clients generally take the form of an MSA, which is a framework agreement that is then supplemented by SOWs. Our MSAs specify the general terms applicable to the services we will provide. For a discussion of the components of our MSAs and SOWs, see Item 7—Management’s Discussion and Analysis of Financial Condition and Results of Operations—Overview—Revenues.”
Our clients include AstraZeneca, Aon, BUPA, Cadbury Schweppes, GE, Genworth Financial, GlaxoSmithKline, Hertz, Hyatt, Information Resources, Inc., Kimberly-Clark, MassMutual Financial Group, National Australia Bank, Nissan, Symantec, SABMiller, United Biscuits, Walgreens and Wells Fargo.
Our People
Our people are critical to the success of our business. Our Chief Executive Officer and other members of our senior leadership team have been involved in our business since its commencement under GE.
As of December 31, 2009, we had more than 38,600 employees worldwide. As of that date, more than 7,000 of our employees held post-graduate degrees and more than 15,000 were university graduates. In addition, as of that date we had more than 10,700 employees with Six Sigma green-belt training and 530 employees with Six Sigma black-belt training, as well as more than 23,500 Lean trained employees.
Recruiting
Despite the recent global recession, we continue to face meaningful competition for skilled employees. We have developed a number of innovative methods to recruit sufficiently skilled employees while still controlling our entry-level salaries. In particular, we seek to widen the available talent pool by recruiting aggressively in places where there is less competition. We also hire people who do not have prior experience or training and use our extensive training capability to equip them with the skills they need to be effective. Some measures we use include the following:
| • | In 2008, we formed a joint venture with NIIT to create a training organization designed to address the increasing demand for skilled workers in the business process & technology services industry. As of February 2010, approximately 24,000 of our employees received training from the joint venture. |
| • | We have opened Delivery Centers in cities that are considered less developed. There is often less competition for available talent in less developed cities although we have found the pool of well trained applicants to be comparable to other metropolitan cities. |
| • | We work with universities in our Indian geographic locations in order to build an appropriate curriculum with the aim that graduates in those cities will have the skills they need to be effective employees and will be familiar with us. |
| • | We have 8 storefront premises that we use for recruiting. In 2009, approximately 11% of our new hires were recruited through our storefront locations. |
| • | We also actively encourage our existing employees to refer new candidates to us, and we provide existing employees with monetary bonuses when such referrals result in new hires. In 2009, approximately 28% of our new hires were referrals. |
Training
We believe in extensive and continuous training of our employees. We have the infrastructure to train approximately 1,200 people at any one time with over 250 trainers and we have more than 8,000 people enrolled in part-time professional degree programs provided by universities and other third parties. Our training programs
17
Table of Contents
are designed to transfer the industry specific knowledge and experience of our industry leaders to ensure we maintain our deep process expertise and domain expertise across all industries in which we work. Our training programs cover a vast number of topics, including specific service offerings, key technical and IT skills, our different clients’ workplace cultures and Six Sigma and Lean methodologies. We also have programs modeled on GE management training programs to develop the next generation of leaders and managers of our business, all of whom are needed to support the rapid growth we are experiencing.
A large part of our continuous training is designed to “up-skill” our employees. That is, we run training programs for employees on an ongoing basis so that they can acquire new skills and move on to higher responsibility or higher-value jobs.
Retention
In order to meet our growth and service commitments, we are constantly striving to attract and retain employees. There is significant turnover of employees in the business process outsourcing and information technology sectors generally, particularly in India where the majority of our employees are currently based. Competition for skilled employees in India is very high due to strong economic growth and an increased number of players in this space.
Our attrition rate for all employees who have been employed by us for one day or more was 23% in 2009. A number of our competitors calculate employee attrition rates for their Indian employees who have been employed for six months or more. On this basis our Indian employee attrition rate for 2009 would be approximately 20%, which we believe is relatively low for our industry based on statistics published by industry associations such as NASSCOM. We attribute this low attrition rate to a number of factors including our effective recruiting measures, extensive training and a strong culture of providing opportunities for growth and learning. Approximately 17% of our employees were promoted in 2009.
We also take aggressive action to monitor and minimize potential attrition. Using Six Sigma principles we have developed an early warning system that tracks employees and gives us an insight into which employees are most likely to resign. These employees are automatically highlighted to management who can take action such as relocating the employee or enrolling the employee in continuing education programs to reduce the possibility and impact of such a resignation.
As another measure designed to minimize attrition, we follow the practice of “right-skilling” our employees to the tasks assigned to them. This means that we match the level of services required to the experience and qualification of the employee concerned and we avoid having over-qualified people in any particular job. This allows us to give our highly qualified and experienced people higher-value jobs and, coupled with the practice of up-skilling, ensures better career paths for all our employees.
Sales and Marketing
We market our services to both existing and potential clients through our business development team. This team consists of approximately 115 people as of December 31, 2009 based in the United States, Europe, Australia and Asia. We spend time trying to expand the services we provide to our existing strategic clients as well as develop new clients.
We have dedicated global relationship managers for each of our strategic relationships. The relationship manager is supported by process improvement, quality, transition, finance, human resources and information technology teams to ensure the best possible solution is provided to our clients. We constantly measure our client satisfaction levels to ensure that we maintain high service levels for each client, using measures such as net promoter scores.
Our marketing efforts typically involve a lengthy selling cycle to secure a new client. Our efforts may begin in response to a perceived opportunity, a reference by an existing client, a request for proposal, an introduction
18
Table of Contents
by one of our directors or otherwise. In addition to our business development personnel, the sales effort involves people from the relevant service areas, people familiar with that prospective client’s industry, business leaders and Six Sigma resources. We may expend substantial time and capital in securing new business. See Item 7— “Management’s Discussion and Analysis of Financial Condition and Results of Operations—Overview—Revenues.”
As our relationship with a client grows, the time required to win an engagement for additional services often gradually declines. In addition, as we become more knowledgeable about a client’s business and processes, our ability to identify opportunities to create value for the client typically increases. In particular, productivity benefits and greater business impact can often be achieved by focusing on processes that are “upstream” or “downstream” from the processes we initially handle, or by applying our analytical and IT capabilities to re-engineer processes. In addition, clients often become more willing over time to turn over more complex and critical processes to us as we demonstrate our capabilities.
We also try to foster relationships between our senior leadership team and our clients’ senior management. These “C-level” relationships ensure that both parties are focused on establishing priorities, aligning objectives and driving client value from the top down. High-level executive relationships have been particularly constructive as a means of increasing business from our existing clients. It also provides us with a forum for addressing client concerns.
Our New Business Review Process
We follow a rigorous review process to evaluate all new business. This is to ensure that all new business fits with our pricing and service objectives. This process starts with the presentation of new business to our deal review committee which comprises members of our senior leadership team along with operations people and members of our finance department. This committee applies a set of well developed criteria to review the key terms of that new business. If, as a result of the review, the committee concludes that the new business is potentially attractive and a good use of our resources, then our business development team is authorized to pursue the opportunity. Prior to executing any contract in respect of new business, our deal review committee meets again to review the client relationship and to confirm that the terms of the new business continue to meet our criteria.
Delivery Centers
We commenced business in 1997 in Gurgaon, India. Since then we have established global delivery capabilities consisting of 39 Delivery Centers in thirteen countries (not including our employees who are onsite at our clients’ premises). We choose the location of our Delivery Centers based on a number of factors which include the available talent pool, infrastructure, government support and operating costs, as well as client demand. We were one of the first companies in our industry to move into some of our locations including Dalian, China; Budapest, Hungary; Bucharest, Romania; and Gurgaon, Jaipur and Kolkata in India. We aim to be continuously connected with our clients’ requirements so that we are ready to serve their needs. We constantly evaluate new locations, including new countries and new cities within countries in which we currently operate, for new Delivery Centers and offices.
The large number of different countries from which we service our clients differentiates us from a number of our competitors and enables us to take advantage of different languages and time-zones which, in turn, enhances our ability to service global clients. As of December 31, 2009, we provided services in more than 25 different languages. Some of our clients also contract with us for additional redundancy and back-up protections.
19
Table of Contents
The map below shows the location of our existing global Delivery Centers and our regional corporate offices. We have multiple locations in some cities.
We set forth below a table showing our net revenues in 2009 attributable to the main regions in which we have Delivery Centers. A portion of the net revenues we attribute to India consists of net revenues for services performed by Delivery Centers or at client premises outside of India by business units or personnel normally based in India. See note 27 to our consolidated financial statements for additional information regarding net revenues attributable to geographic regions.
| Year ended December 31, 2009 (Net revenues in millions) | |||
| Region |
|||
| India |
$ | 807.5 | |
| Asia, other than India |
115.1 | ||
| Americas |
80.1 | ||
| Europe |
117.4 | ||
| Total |
$ | 1,120.1 | |
NGEN Joint Venture
NGEN Media Services Private Limited, or NGEN, was founded in March 2006 as a 50:50 joint venture between us and NDTV Networks Plc., or NDTV, to provide outsourcing services to the global media industry, including video editing, digitization and graphics art work. NGEN brings together our operational excellence with NDTV’s domain expertise in the media industry. Pramod Bhasin, Genpact’s President and CEO, is a director of NGEN and Chairman of its board.
NIIT Joint Venture
In June 2008, we formed a joint venture called NIIT Uniqua, or NIITJV, with NIIT, one of the largest training institutes in Asia. NIITJV is a training organization designed to address the increasing demand for skilled workers in the business process and technology services industry. Genpact owns 25% of NIITJV.
20
Table of Contents
Intellectual Property
We develop intellectual property in the course of our business and our MSAs with our clients regulate the ownership of such intellectual property. We have applied for patents, trademarks and domain names. Some of our intellectual property rights relate to proprietary business process enhancements.
We generally use third-party software platforms and the software systems of our clients to provide our services. We normally enter into licensing agreements with our clients in relation to their software systems.
It is our practice to enter into an Employee Information & Proprietary Information Agreement with all of our new employees that:
| • | ensures that all new intellectual property developed in the course of our employees’ employment is assigned to us; |
| • | provides for that employee’s co-operation in intellectual property protection matters even if they no longer work for us; and |
| • | includes a confidentiality undertaking by that employee. |
Competition
We compete in a highly competitive and rapidly evolving global market. We have a number of competitors offering the same or similar services to us. Our competitors include:
| • | large multinational service providers, such as Accenture Ltd and International Business Machines Corporation; |
| • | companies that are primarily business process service providers operating from low-cost countries, most commonly India, such as WNS Holdings Limited and ExlService Holdings, Inc.; |
| • | companies that are primarily information technology service providers with some business process service capabilities, such as Infosys Technologies Limited, Tata Consultancy Services Limited and Wipro Limited; and |
| • | smaller, niche service providers that provide services in a specific geographic market, industry or service area. |
In addition, a client or potential client may choose not to outsource its business, including by setting up captive outsourcing operations or by performing formerly outsourced services for themselves.
Our revenues are derived primarily from Fortune Global 500 and Fortune 1000 companies. We believe that the principal competitive factors in our industry include:
| • | skills and capabilities of people; |
| • | ability to add value, including through continuous process improvement; |
| • | reputation and client references; |
| • | price; |
| • | technical and industry expertise; |
| • | scope of services; |
| • | quality of services and solutions; |
21
Table of Contents
| • | ability to sustain long-term client relationships; and |
| • | global reach and scale. |
Our clients typically retain us on a non-exclusive basis.
Regulation
We are subject to regulation in many jurisdictions around the world as a result of the complexity of our operations and services, including at the federal, state and local level, particularly in the countries where we have operations and where we deliver services. These countries include China, Guatemala, Hungary, India, Mexico, Morocco, the Netherlands, Poland, the Philippines, Romania, South Africa, Spain, the United States and the United Kingdom. We are also subject to regulation by regional bodies such as the European Union.
In addition, the terms of our service contracts typically require that we comply with applicable laws and regulations. In some contracts, we are required to comply even if such laws and regulations apply to our clients, but not to us. In other service contracts our clients undertake the responsibility to inform us about laws and regulations that may apply to us in jurisdictions in which they are located.
If we fail to comply with any applicable laws and regulations, we may be restricted in our ability to provide services, and may also be the subject of civil or criminal actions involving penalties, any of which could have a material adverse effect on our operations. Our clients generally have the right to terminate our contracts for cause in the event of regulatory failures, subject to notice periods. See Item 1A—“Risk Factors—Risks Related to our Business—Any failures to adhere to the regulations that govern our business could result in our being unable to effectively perform our services. Failure to adhere to regulations that govern our clients’ businesses could result in breaches of contract under our MSAs.”
In the United States, we are subject to laws and regulations arising out of our work for clients operating there, especially in the area of banking, financial services and insurance, such as the Financial Modernization Act (sometimes referred to as the Gramm-Leach-Bliley Act), the Fair Credit Reporting Act, the Fair and Accurate Credit Transactions Act, the Right to Financial Privacy Act, the USA Patriot Act, the Bank Service Company Act, the Home Owners Loan Act, the Electronic Funds Transfer Act, the Equal Credit Opportunity Act, the Real Estate Settlement Procedures Act and the Troubled Assets Relief Program as well as regulation by U.S. agencies such as the SEC, the Federal Reserve, the Federal Deposit Insurance Corporation, the National Credit Union Administration, the Commodity Futures Trading Commission, the Federal Financial Institutions Examination Council, the Office of the Comptroller of the Currency and the Office of Thrift Supervision. We are also subject to regulation under the Health Insurance Portability and Accountability Act, the Federal Trade Commission Act, the Family Educational Rights and Privacy Act, the Communications Act, the Electronic Communications Privacy Act and applicable regulations in the area of health and other personal information that we process as part of our services.
Because of our debt collections work in the United States, we are also regulated by laws such as the Truth in Lending Act, the Fair Credit Billing Act and the Fair Debt Collections Practices Act and underlying regulations. We are currently licensed to engage in debt collection activities in all States except Nevada, as well as New York City, Buffalo, New York and Washington D.C.
We are subject to laws in the United States, the United Kingdom and the EU that are intended to limit the impact of outsourcing on employees in those countries. See Item 1A—“Risk Factors—Risks Related to our Business—Future legislation in the United States and other jurisdictions could significantly impact the ability of our clients to utilize our services.”
We are also subject to laws and regulations on direct marketing, such as the Telemarketing Consumer Fraud and Abuse Prevention Act and the Telemarketing Sales Rule, the Telephone Consumer Protection Act and rules promulgated by the Federal Communications Commission, and the CAN-SPAM Act.
22
Table of Contents
We are subject to laws and regulations governing foreign trade, such as the Arms Export Control Act, as well as by government bodies such as the Commerce Department’s Bureau of Industry and Security, the State Department’s Directorate of Defense Trade Controls and the Treasury Department’s Office of Foreign Assets Control.
We benefit from tax relief provided by laws and regulations in India, the Philippines, Morocco, and Guatemala, which include tax holidays under the Indian Income Tax Act, 1961 that expire in stages by March 31, 2011 (available to units setup under the Software Technology Parks of India (“STPI”) Scheme). The Indian SEZ legislation introduced a new tax holiday in certain situations for operations established in designated “special economic zones”. The new tax benefits are available only for new business operations that are conducted at qualifying SEZ locations. During the last 3 years, we established new Delivery Centers in three cities in India that would be eligible for these benefits. We do not presently know what percentage of our operations or income in India in future years will be eligible for a tax holiday under the new law. See Item 7—“Management’s Discussion and Analysis of Financial Condition and Results of Operations—Overview—Income Taxes”. In addition to the tax holidays described above, certain benefits are also available to us under certain Indian state laws. These benefits include rebates and waivers in relation to payments for the transfer or registration of property (including for the purchase or lease of premises), waivers of conversion fees for land, exemption from state pollution control requirements, entry tax exemptions, labor law exemptions and commercial usage of electricity.
Our hedging activities and currency transfer are restricted by regulations in certain countries, including India, Romania and China.
Certain Bermuda Law Considerations
As a Bermuda company, we are also subject to regulation in Bermuda. Among other things, we must comply with the provisions of the Companies Act regulating the payment of dividends and making of distributions from contributed surplus.
We are classified as a non-resident of Bermuda for exchange control purposes by the Bermuda Monetary Authority. Pursuant to our non-resident status, we may engage in transactions in currencies other than Bermuda dollars. There are no restrictions on our ability to transfer funds, other than funds denominated in Bermuda dollars, in and out of Bermuda or to pay dividends to United States residents that are holders of our common shares.
Under Bermuda law, “exempted” companies are companies formed for the purpose of conducting business outside Bermuda from a principal place of business in Bermuda. As an exempted company, we may not, without a license or consent granted by the Minister of Finance, participate in certain business transactions, including transactions involving Bermuda landholding rights and the carrying on of business of any kind for which we are not licensed in Bermuda.
Available Information
We file current and periodic reports, proxy statements, and other information with the SEC, copies of which can be obtained from the SEC’s Public Reference Room at 100 F Street, NE., Washington, DC 20549. Information on the operation of the Public Reference Room can be obtained by calling the SEC at 1-800-SEC-0330.
The SEC maintains an Internet site that contains reports, proxy and information statements, and other information regarding issuers that file electronically with the SEC, at www.sec.gov. We make available free of charge on our website, www.genpact.com, our Annual Report on Form 10-K, Quarterly Reports on Form 10-Q, Current Reports on Form 8-K and amendments to those reports filed or furnished pursuant to Section 13(a) or
23
Table of Contents
15(d) of the Securities Exchange Act of 1934, as amended, as soon as reasonably practicable after we electronically file such material with, or furnish it to, the SEC. The contents of our website are not incorporated by reference into this Annual Report.
Executive Officers
The following table sets forth information concerning our executive officers as of February 19, 2010:
| Name |
Age | Position(s) | ||
| Pramod Bhasin |
58 | President, Chief Executive Officer and Director | ||
| Vivek N. Gour |
47 | Chief Financial Officer | ||
| N.V. Tyagarajan |
48 | Chief Operating Officer | ||
| Robert Pryor |
51 | Executive Vice President, Global Sales and Marketing | ||
| Mohit Bhatia |
45 | Senior Vice President and Business Leader | ||
| Patrick Cogny |
43 | Chief Executive Officer of Genpact Europe | ||
| Mitsuru Maekawa |
62 | Chief Executive Officer of Genpact Asia | ||
| Victor Guaglianone |
54 | Senior Vice President and General Counsel | ||
| Piyush Mehta |
41 | Senior Vice President, Human Resources | ||
| Walter A. Yosafat |
49 | Senior Vice President, Operations-Americas and Chief Information Officer |
Pramod Bhasin is our President and Chief Executive Officer. Mr. Bhasin founded our business in 1997 while employed by GE. Prior to 1997, he served in various positions at GE, including as Chief Financial Officer for GE Capital’s Corporate Finance Group.
Vivek N. Gour has served as our Chief Financial Officer and Senior Vice-President since January 2005. On February 11, 2010. Mr. Gour informed us that he was resigning effective March 1, 2010. From September 2003 to December 2004, he served as Chief Financial Officer for GE Capital Business Processes. From September 2002 to September 2003, he served as Chief Financial Officer and Senior Vice-President of our business and of GE Capital India and from August 2001 to September 2002 as Senior Vice-President (Strategic Projects), GE Capital India.
N.V. Tyagarajan has served as our Chief Operating Officer since February 2009. From February 2005 to February 2009, he was our Executive Vice President and Head of Sales, Marketing & Business Development. From October 2002 to January 2005, he was Senior Vice President, Quality and Global Operations, for GE’s Commercial Equipment Finance division. Between 1999 and 2002, he served as our Chief Executive Officer.
Robert Pryor joined us as our Executive Vice President, Global Sales and Marketing in February 2009. From January 2007 to January 2009, he was Senior Vice President, Outsourcing Services, for Hewlett Packard Company. Between 2000 and 2006, he served as Chief Executive Officer of Capgemini and Capgemini Energy.
Mohit Bhatia has served as the Senior Vice President and Business Leader for our finance and accounting practice since December 2004. From October 2003 to December 2004 he served as our Chief Financial Officer. On March 1, 2010, Mr. Bhatia will replace Vivek Gour as our Chief Financial Officer.
Patrick Cogny became our Chief Executive Officer of Genpact Europe in 2005. Prior to this, he spent 15 years working for GE in the Healthcare business and in the GE Europe corporate headquarters, in France, the United States and Belgium.
Mitsuru Maekawa became our Chief Executive Officer of Genpact Asia, excluding India, in 2002. From 1988 to 2001 he worked for GE Medical Systems, a division of GE Healthcare, where he was General Manager of sales for GE Yokogawa Medical Systems from 1999 to 2001.
Victor Guaglianone has served as our Senior Vice President, General Counsel & Corporate Secretary since January 2007. From 2004 to 2007, he was senior counsel at Holland & Knight LLP. From 2003 to 2004, he served as a commercial arbitrator for the American Arbitration Association. Prior to 2003, he spent 16 years at GE Capital, most recently as Vice President and Associate General Counsel.
24
Table of Contents
Piyush Mehta became our Senior Vice President of Human Resources in March 2005. He has worked for us since 2001 as Vice President of Human Resources.
Walter A. Yosafat joined us as our Senior Vice President and Chief Information Officer in March 2007. In March 2009, he also became the business leader for our Americas operations. From 2001 to February 2007, he was the Chief Information Officer and eBusiness Leader at Trane, an American Standard company.
Risks Related to our Business
Our results of operations could be adversely affected by economic and political conditions and the effects of these conditions on our clients’ businesses and levels of business activity.
Global economic and political conditions affect our clients’ businesses and the markets they serve. The global economic downturn that began at the end of 2008 had an adverse impact on the volume of services we provide to our clients and could have a material adverse effect on our results of operations. If current global economic conditions continue or worsen, or if economic contraction continues in the industries or geographies where we operate, our business could be adversely affected by our clients’ financial condition and the levels of business activity in the industries we serve. Changes in global economic conditions could also shift demand to services for which we do not have competitive advantages, and this could negatively affect the amount of business that we are able to obtain. Negative or uncertain political climates, including adoption of restrictive legislation, in countries or geographies where we operate could also adversely affect us. In addition, if we are unable to successfully anticipate changing economic and political conditions, we may be unable to effectively plan for or respond to those changes, and our business could be negatively affected.
GE accounts for a significant portion of our revenues and any loss of business from, or change in our relationship with, GE could have a material adverse effect on our business, results of operations and financial condition.
We have derived and are likely to continue to derive a significant portion of our revenues from GE. For 2007, 2008 and 2009, GE accounted for 58.5%, 47.1% and 40.3% of our revenues, respectively. In addition, our more mature client relationships, such as GE, typically generate higher margins than those from newer clients. The loss of business from GE could have a material adverse effect on our business, results of operations and financial condition. Our master services agreement, or MSA, with GE commits GE to purchase, on an annual basis through 2016, a stipulated minimum dollar amount of services or pay us certain costs in lieu thereof. The costs which GE would be required to pay if it does not meet a minimum annual commitment are not necessarily equal to the amount by which GE’s purchases fall short of that minimum annual commitment. While our revenues from GE in 2009 were $451.3 million, exceeding by $91.3 million the stipulated minimum annual amount for that year, there is no assurance that actual revenues from GE in future years will meet the minimum annual commitment or exceed it by as much as in 2009 or that GE will continue to be a client at all. Revenues in excess of the minimum annual commitment can be credited, subject to certain limitations, against shortfalls in subsequent years. In addition, the MSA provides that the minimum annual committed amount of $360 million will be reduced during the last three years of the term, to $250 million in 2014, $150 million in 2015 and $90 million in 2016. The MSA provides that the minimum annual committed amount is subject to reduction in certain circumstances, including as a result of the termination of any statements of work, or SOWs, by GE for cause, non-performance of services by us due to specified force majeure events or certain other reasons. The MSA also does not require GE to engage us exclusively in respect of business process services. In addition, pricing terms and pricing levels under future SOWs may be lower than in the past. In particular, because of the size of GE and its importance to our business it is able to exert considerable leverage on us when negotiating the terms of SOWs.
25
Table of Contents
Our business from GE comes from a variety of GE’s businesses and decisions to use our services are currently, as a general matter, made by a number of people within GE. Therefore, although some decisions may be made centrally at GE, the total level of business we receive generally depends on the decisions of the various operating managers of such businesses. In addition, if GE sells or divests any of the businesses to which we provide services, the new management or new owners of such businesses may choose to discontinue our services. Furthermore, since December 31, 2009, GE is no longer subject to a contractual restriction with us on its ability to set up a separate business unit to provide English-language business process services from low-wage countries. There can be no assurance that GE will not now establish such a separate business unit or otherwise compete with us. GE, through its affiliates, is a significant shareholder of our company and as of December 31, 2009 it, through its affiliates, beneficially owns 18.37% of our common shares. If GE’s percentage of ownership of our common shares decreases in the future, there can be no assurance that GE will continue to contract for our services to the same extent or on the same terms.
Over the next few years we will lose certain tax benefits provided in India to companies in our industry and it is not clear whether new tax policies will provide equivalent benefits and incentives.
Under the Indian Income Tax Act, 1961, our Delivery Centers in India, from which we derived the majority of our revenues in fiscal 2009, benefit from a ten-year holiday from Indian corporate income taxes in respect of their export income (as defined in the legislation) under the Software Technology Parks of India (“STPI”) Scheme. As a result of this tax holiday, prior to 2007 we incurred minimal income tax expense with respect to our Indian operations. In the absence of this tax holiday, income derived from our Indian operations would be taxed up to the maximum tax rate generally applicable to Indian enterprises, which, as of December 31, 2009, was 33.99%. The tax holiday enjoyed by our Delivery Centers in India under the STPI Scheme expires in stages. Our tax holiday partially expired on March 31, 2007 (in respect of approximately 30% of our Indian operations), on March 31, 2008 (in respect of approximately 10% of our Indian operations) and on March 31, 2009 (in respect of approximately 30% of our Indian operations), depending in each case on when each Delivery Center commenced operations. The tax holiday in respect of the balance of our Indian operations under the STPI regime will expire on March 31, 2011. As the STPI tax holiday expires, our Indian tax expense will materially increase and our after-tax profitability will be materially reduced, unless we can obtain comparable benefits under new legislation or otherwise reduce our tax liability.
The Special Economic Zones Act, 2005, or the SEZ legislation, introduced a new 15-year tax holiday scheme for operations established in designated “special economic zones” or SEZs. Under the SEZ legislation, qualifying operations are eligible for a deduction from taxable income equal to (i) 100% of their export profits (as defined in the legislation) derived for the first five years from the commencement of operations; (ii) 50% of such export profits for the next five years; and (iii) 50% of the export profits for a further five years, subject to satisfying certain capital investment requirements. The SEZ legislation provides, among other restrictions, that this holiday is not available to operations formed by splitting up or reconstructing existing operations or transferring existing plant and equipment to new SEZ locations.
During the last 3 years, we established new centers that we expect to be eligible for the SEZ benefits. It is not clear, however, what percentage of our operations or income in India is eligible for SEZ benefits, as this will depend on how much of our business can be conducted at the qualifying locations and how much of that business can be considered to meet the restrictive conditions described above. In 2007, we signed agreements with certain developers and local governments to purchase and/or lease qualifying SEZ property. Our first SEZ unit also became operational during 2007 in a leased facility. However, because this is relatively new legislation, there is continuing uncertainty as to the interpretation of the required governmental and regulatory approvals. This uncertainty may delay development of our proposed SEZ locations.
The SEZ legislation continues to be a politically sensitive issue in India. The Ministry of Finance in India has expressed concern about potential tax revenues being lost as a result of the exemptions under the SEZ legislation. The SEZ legislation has been criticized on economic grounds by the International Monetary Fund and it has been suggested that the SEZ legislation may be challenged by the World Trade Organization. It is possible
26
Table of Contents
that, as a result of such political pressures, the procedure for obtaining the benefits of the SEZ legislation may become more onerous, that the types of real-property eligible for SEZ status will be further restricted or that the SEZ legislation will be amended or repealed.
Accordingly, we currently do not expect that the benefits, if any, that we may derive under the SEZ legislation will be equivalent to the benefits we will be gradually losing under the existing tax holiday. Consequently, we expect that our tax rate in India and our overall tax rate will increase over the next few years and that such increase is likely to be material and is likely to have a material adverse effect on our business, results of operations and financial condition.
If the transfer pricing arrangements we have among our subsidiaries are determined to be inappropriate, our tax liability may increase.
We have transfer pricing arrangements among our subsidiaries in relation to various aspects of our business, including operations, marketing, sales and delivery functions. U.S. and Indian transfer pricing regulations, as well as regulations applicable in other countries in which we operate, require that any international transaction involving associated enterprises be on arm’s-length terms. We consider the transactions among our subsidiaries to be substantially on arm’s-length terms. If, however, a tax authority in any jurisdiction reviews any of our tax returns and determines that the transfer prices and terms we have applied are not appropriate, or that other income of our affiliates should be taxed in that jurisdiction, we may incur increased tax liability, including accrued interest and penalties, which would cause our tax expense to increase, possibly materially, thereby reducing our profitability and cash flows.
New tax legislation and the results of actions by taxing authorities may have an adverse effect on our operations and our overall tax rate.
The Government of India may assert that certain of our clients have a “permanent establishment” in India by reason of the activities we perform on their behalf, particularly those clients that exercise control over or have substantial dependency on our services. Such an assertion could affect the size and scope of the services requested by such clients in the future.
The Government of India has served notice on the Company about its potential liability, as a representative assessee of GE, for Indian tax upon GE’s 2004 sale of shares of a predecessor of the Company. GE has challenged the positions of the Government of India in the Delhi High Court, naming Genpact India (one of the Company’s subsidiaries) as necessary party but without seeking relief against Genpact India. We believe that if Indian tax were due upon that sale, it could not be successfully asserted against us as a representative assessee. Moreover, GE is obligated to indemnify us for any tax on its 2004 sale of shares. Although there can be no assurance that the Government of India would agree, we also believe that no Indian tax is due upon the sale of our shares in the IPO by our existing significant shareholders; that even if such a tax were due it could not be successfully asserted against us as a representative assessee of such a shareholder; and that we would have a statutory right under Indian law to recover any such tax from such a shareholder. We also believe that sales by non-Indian shareholders of our shares in the market generally will not be subject to Indian tax, provided that the selling shareholder is not otherwise subject to tax in India.
The Government of India, or other jurisdictions, could enact new tax legislation which would have a material adverse effect on our business, results of operations and financial condition. In addition, our ability to repatriate surplus earnings from our Delivery Centers in a tax-efficient manner is dependent upon interpretations of local laws, possible changes in such laws and the renegotiation of existing double tax avoidance treaties. Changes to any of these may adversely affect our overall tax rate, which would have a material adverse effect on our business, results of operations and financial condition.
27
Table of Contents
We derive a significant portion of our revenues from clients in the United States. If events or conditions occur which adversely affect our ability to do business in the United States, our business, results of operations and financial condition may be materially and adversely affected.
We currently derive, and are likely to continue to derive, a significant portion of our revenues from clients located in the United States. A number of factors could adversely affect our ability to do business in the United States, which could in turn have a material adverse effect on our business, results of operations and financial condition. Since the end of 2008, the United States economy has been in a recession and undergoing a period of substantial economic uncertainty, resulting in credit market dislocations, declining business and consumer confidence and increased unemployment. A continuing deterioration in economic activity in the United States could adversely affect demand for our services, thus reducing our revenue. We could also be affected by declines in the value of the U.S. dollar against the Indian rupee, in which we incur the majority of our costs, or other currencies in which we incur costs. We may also be adversely affected by the enactment of laws in the United States that impose restrictions on, or taxation or other financial penalties with respect to, offshore outsourcing.
Future legislation in the United States and other jurisdictions could significantly affect the ability of our clients to utilize our services.
The issue of companies outsourcing services to organizations operating in other countries is a topic of political discussion in many countries. For example, many organizations and public figures in the United States have publicly expressed concern about a perceived association between offshore service providers and the loss of jobs in the United States. Current or prospective clients may elect to perform such services themselves or may be discouraged from transferring these services from onshore to offshore providers to avoid negative perceptions that may be associated with using an offshore provider. Any slowdown or reversal of existing industry trends toward offshore outsourcing would seriously harm our ability to compete effectively with competitors that provide services from the United States.
In the United States, measures aimed at limiting or restricting offshore outsourcing have been proposed. Such measures have been enacted in a few states and there is currently legislation pending in several states. The measures that have been enacted to date generally have restricted the ability of government entities to outsource work to offshore business process service providers and have not materially adversely affected our business, primarily because we do not currently work for such governmental entities and they are not currently a focus of our sales strategy. However, some legislative proposals would, for example, require call centers to disclose their geographic locations, require notice to individuals whose personal information is disclosed to non-U.S. affiliates or subcontractors, or limit eligibility for government contracts or financial incentives for companies that transfer work to foreign work locations. There can be no assurance that pending or future legislation in the United States that would significantly adversely affect our business, results of operations and financial condition will not be enacted.
Legislation enacted in certain European jurisdictions and any future legislation in Europe, Japan or any other country in which we have clients restricting the performance of business process services from an offshore location could also have a material adverse effect on our business, results of operations and financial condition. For example, legislation enacted in the United Kingdom, based on the 1977 EC Acquired Rights Directive, which has been adopted in some form by many European Union, or EU, countries, provides that if a company outsources all or part of its business to a service provider or changes its current service provider, the affected employees of the company or of the previous service provider are entitled to become employees of the new service provider, generally on the same terms and conditions as their original employment. In addition, dismissals of employees who were employed by the company or the previous service provider immediately prior to that transfer are automatically considered unfair dismissals that entitle such employees to compensation. As a result, in order to avoid unfair dismissal claims we may have to offer, and become liable for, voluntary redundancy payments to the employees of our clients in the United Kingdom and other EU countries who have
28
Table of Contents
adopted similar laws who outsource business to us. We believe that this legislation could materially affect our ability to obtain new business from companies in the EU and, after including the cost of the potential compensation paid for unfair dismissal claims or redundancies, to provide outsourced services to our current and future clients in the EU in a cost-effective manner.
We may be unable to manage our growth effectively and maintain effective internal controls, which could have a material adverse effect on our business, results of operations and financial condition.
Since we became an independent company, we have experienced rapid growth and significant expansion and diversification of our operations, which has placed significant demands on our leadership team’s time and our operational resources. From January 1, 2005 to December 31, 2009 our net revenues have grown at a compounded annual growth rate, or CAGR, of approximately 21.2% and similarly, our number of employees has grown at a CAGR of approximately 19.4%. There can be no assurance that our revenues will continue to grow as rapidly in the future or, if our revenues do grow, that our margins will also grow. In order to manage growth effectively, we must implement and improve operational systems, procedures and internal controls on a timely basis. If we fail to implement these systems, procedures and controls on a timely basis, we may not be able to retain clients or obtain new business, hire and retain new employees, complete future acquisitions or operate our business effectively.
We may fail to attract and retain enough qualified employees to support our operations.
Our industry relies on large numbers of skilled employees and our success depends on our ability to attract, train and retain a sufficient number of qualified employees. Historically, high employee attrition has been common in our industry. See Item 1—“Business—Our People.” In 2009, our attrition rate for all employees who were employed for a day or more was approximately 23%. We cannot assure you that we will be able to reduce our level of attrition or even maintain our attrition rate at the 2009 level. If our attrition rate increases, our operating efficiency and productivity may decrease.
Despite current economic conditions, competition for qualified employees, particularly in India and China, remains high and we expect such competition to continue. We compete for employees not only with other companies in our industry but also with companies in other industries, such as software services, engineering services and financial services companies. In many locations in which we operate, there is a limited pool of employees who have the skills and training needed to do our work. If our business continues to grow, the number of people we will need to hire will increase. We will also need to increase our hiring if we are not able to maintain our attrition rate through innovative recruiting and retention policies. Significant competition for employees could have an adverse effect on our ability to expand our business and service our clients, as well as cause us to incur greater personnel expenses and training costs.
Wage increases in the countries in which we have operations may prevent us from sustaining our competitive advantage and may reduce our profit margin.
Salaries and related benefits of our employees are our most significant costs. Most of our employees are based in India and other countries in which wage levels have historically been significantly lower than wage levels in the United States and Western Europe for comparably skilled professionals, which has been one of our competitive advantages. However, wage levels for comparably skilled employees in most of the countries in which we operate have increased and further increases are expected at a faster rate than in the United States and Western Europe because of, among other reasons, faster economic growth, increased competition for skilled employees and increased demand for business process services. We will lose this competitive advantage to the extent that we are not able to control or share wage increases with our clients. Sharing wage increases may cause our clients to be less willing to utilize our services. In addition, wage increases may reduce our margins. We will attempt to control such costs by our efforts to add capacity in locations where we consider wage levels of skilled personnel to be satisfactory, but we may not be successful in doing so. We may need to increase our wage levels
29
Table of Contents
significantly and rapidly in order to attract the quantity and quality of employees that are necessary for us to remain competitive, which may have a material adverse effect on our business, results of operations and financial condition. We also expect to increase the number of employees we have in the United States to higher levels than we have had historically, and this could have a negative effect on our profit margin.
Currency exchange rate fluctuations in various currencies in which we do business, especially the Indian rupee and the U.S. dollar, could have a material adverse effect on our business, results of operations and financial condition.
Most of our revenues are denominated in U.S. dollars, with the remaining amounts largely in euros, pounds sterling and Japanese yen. Most of our expenses are incurred and paid in Indian rupees, with the remaining amounts largely in U.S. dollars, Chinese renminbi, pounds sterling, euros, Guatemalan quetzal, Hungarian forints, Moroccan dirham, Philippine pesos, Australian dollars, Polish zloty, South African rand and Romania leu. As we expand our operations to new countries, we will incur expenses in other currencies. We report our financial results in U.S. dollars. The exchange rates between the Indian rupee and other currencies in which we incur costs or receive revenues, on the one hand, and the U.S. dollar, on the other hand, have changed substantially in recent years and may fluctuate substantially in the future. See Item 7A—“Quantitative and Qualitative Disclosures about Market Risk.”
Our results of operations could be adversely affected by certain movements in exchange rates, particularly if the Indian rupee or other currencies in which we incur expenses or receive revenues, appreciate against the U.S. dollar. Although we take steps to hedge a substantial portion of our Indian rupee-U.S. dollar, Mexican peso-U.S. dollar, Philippines peso-U.S. dollar, euro-U.S. dollar, euro- Romanian leu, euro-Hungarian forint, Pound Sterling-U.S. dollar, Australian dollar-U.S. dollar and our Chinese renminbi-Japanese yen foreign currency exposures, there is no assurance that our hedging strategy will be successful or that the hedging markets will have sufficient liquidity or depth for us to implement our strategy in a cost effective manner. In addition, in some countries such as India and China, we are subject to legal restrictions on hedging activities, as well as convertibility of currencies, which could limit our ability to use cash generated in one country in another country and could limit our ability to hedge our exposures. Finally, our hedging policies only provide near term protection from exchange rate fluctuations. If the Indian rupee or other currencies in which we incur expenses appreciate against the U.S. dollar, we may have to consider additional means of maintaining profitability, including by increasing pricing, which may or may not be achievable. See also Item 7—“Management’s Discussion and Analysis of Financial Condition and Results of Operations—Overview—Foreign exchange (gains) losses, net.”
Restrictions on entry visas may affect our ability to compete for and provide services to clients, which could have a material adverse effect on our business and financial results.
Our business depends on the ability of our employees to obtain the necessary visas and entry permits to do business in the countries where our clients and, in some cases, our Delivery Centers, are located. In response to recent terrorist attacks and global unrest, immigration authorities generally, and those in the United States in particular, have increased the level of scrutiny in granting visas. If further terrorist attacks occur, then obtaining visas for our personnel may become even more difficult. Local immigration laws may also require us to meet certain other legal requirements as a condition to obtaining or maintaining entry visas. Adverse economic conditions in countries where our clients may be located may create an environment where countries, including the United States, may restrict the number of visas or entry permits available. In addition, immigration laws are subject to legislative change and varying standards of application and enforcement due to political forces, economic conditions or other events, including terrorist attacks. If we are unable to obtain the necessary visas for our personnel who need to travel internationally, if the issuance of such visas is delayed or if the length of such visas is shortened, we may not be able to provide services to our clients or to continue to provide services on a timely and cost-effective basis, receive revenues as early as expected or manage our Delivery Centers as efficiently as we otherwise could, any of which could have a material adverse effect on our business, results of operations and financial condition.
30
Table of Contents
Our senior leadership team is critical to our continued success and the loss of such personnel could harm our business.
Our future success substantially depends on the continued service and performance of the members of our senior leadership team. These personnel possess business and technical capabilities that are difficult to replace. In particular, our Chief Executive Officer and other members of our senior leadership team have been involved in our business since its commencement under GE. Our employment agreement with our Chief Executive Officer does not obligate him to work for us for any specified period, but does contain a limited non-compete clause and a non-solicitation clause should his employment terminate. If we lose key members of our senior leadership team, we may not be able to effectively manage our current operations or meet ongoing and future business challenges, and this may have a material adverse effect on our business, results of operations and financial condition.
We typically face a long selling cycle to secure a new contract as well as long implementation periods that require significant resource commitments, which result in a long lead time before we receive revenues from new relationships.
We typically face a long selling cycle to secure a new contract. If we are successful in obtaining an engagement, that is generally followed by a long implementation period in which the services are planned in detail and we demonstrate to a client that we can successfully integrate our processes and resources with their operations. During this time a contract is also negotiated and agreed. There is then a long ramping up period in order to commence providing the services.
We typically incur significant business development expenses during the selling cycle. We may not succeed in winning a new client’s business, in which case we receive no revenues and may receive no reimbursement for such expenses. Even if we succeed in developing a relationship with a potential new client and begin to plan the services in detail, a potential client may choose a competitor or decide to retain the work in-house prior to the time a final contract is signed. If we enter into a contract with a client, we will typically receive no revenues until implementation actually begins. Our clients may also experience delays in obtaining internal approvals or delays associated with technology or system implementations, thereby further lengthening the implementation cycle. We generally hire new employees to provide services to a new client once a contract is signed. We may face significant difficulties in hiring such employees and incur significant costs associated with these hires before we receive corresponding revenues. If we are not successful in obtaining contractual commitments after the selling cycle, in maintaining contractual commitments after the implementation cycle or in maintaining or reducing the duration of unprofitable initial periods in our contracts, it may have a material adverse effect on our business, results of operations and financial condition.
Our profitability will suffer if we are not able to price appropriately, maintain asset utilization levels and control our costs.
Our profitability is largely a function of the efficiency with which we utilize our assets, and in particular our people and Delivery Centers, and the pricing that we are able to obtain for our services. Our utilization rates are affected by a number of factors, including our ability to transition employees from completed projects to new assignments, hire and assimilate new employees, forecast demand for our services and thereby maintain an appropriate headcount in each of our geographies and workforces and manage attrition, and our need to devote time and resources to training, professional development and other typically non-chargeable activities. The prices we are able to charge for our services are affected by a number of factors, including our clients’ perceptions of our ability to add value through our services, competition, introduction of new services or products by us or our competitors, our ability to accurately estimate, attain and sustain revenues from client engagements, margins and cash flows over increasingly longer contract periods and general economic and political conditions. Therefore, if we are unable to price appropriately or manage our asset utilization levels, there could be a material adverse effect on our business, results of operations and financial condition. Our profitability is also a function of our
31
Table of Contents
ability to control our costs and improve our efficiency. As we increase the number of our employees and grow our business, we may not be able to manage the significantly larger and more geographically diverse workforce that may result and our profitability may not improve. New taxes may also be imposed on our services such as sales taxes or service taxes which could affect our competitiveness as well as our profitability.
Our long selling cycle and implementation period make it difficult for us to prepare accurate internal financial forecasts and respond in a timely manner to offset such fluctuations.
Our operating results may fluctuate significantly from period to period. The long selling cycle for our services as well as the time required to complete the implementation phases of new contracts makes it difficult to accurately predict the timing of revenues from new clients or new SOWs as well as our costs. Our period to period results may also fluctuate due to changes in our costs or other unforeseen events. In addition, our results may vary due to currency fluctuations and changes in other global or regional economic and political conditions. We also may not generate predicted revenues from new service offerings, including Smart Enterprise Processes (SEPsm). Due to these factors, we may be unable to prepare accurate internal financial forecasts or replace anticipated revenues, and our operating results in future reporting periods may be significantly below the expectations of the public market, securities analysts or investors.
We enter into long-term contracts and fixed price contracts with our clients. Our failure to correctly price these contracts may negatively affect our profitability.
The pricing of our services is usually included in SOWs entered into with our clients, many of which are for terms of two to five years. In certain cases, we have committed to pricing over this period with only limited sharing of risk regarding inflation and currency exchange rates. In addition, we are obligated under some of our contracts to deliver productivity benefits to our clients. If we fail to estimate accurately future wage inflation rates, currency exchange rates or our costs, or if we fail to accurately estimate the productivity benefits we can achieve under a contract, it could have a material adverse effect on our business, results of operations and financial condition.
A small portion of our SOWs are currently billed on a fixed price basis rather than on a time and materials basis. We may increase the number of fixed price contracts we perform in the future. Any failure to accurately estimate the resources or time required to complete a fixed price engagement or to maintain the required quality levels or any unexpected increase in the cost to us of employees, office space or technology could expose us to risks associated with cost overruns and could have a material adverse effect on our business, results of operations and financial conditions.
We could be liable to our clients for damages and subject to criminal liability and our reputation could be damaged if our information systems are breached or client data is compromised.
We may be liable to our clients for damages caused by disclosure of confidential information or system failures. We are often required to collect and store sensitive or confidential client data to perform the services we provide under our contracts. Many of our contracts do not limit our potential liability for breaches of confidentiality. If any person, including any of our current or former employees, penetrates our network security or misappropriates sensitive data or if we do not adapt to changes in data protection legislation, we could be subject to significant liabilities to our clients or to our clients’ customers for breaching contractual confidentiality provisions or privacy laws. Unauthorized disclosure of sensitive or confidential client data, whether through breach of our computer systems, systems failure or otherwise, could also damage our reputation and cause us to lose existing and potential clients. We may also be subject to civil actions and criminal prosecution by government or government agencies for breaches relating to such data. Our insurance coverage for breaches or mismanagement of such data may not continue to be available on reasonable terms or in sufficient amounts to cover one or more large claims against us and our insurers may disclaim coverage as to any future claims.
32
Table of Contents
We may be subject to claims for substantial damages by our clients arising out of disruptions to their businesses or inadequate service, and our insurance coverage may be inadequate.
Most of our service contracts with clients contain service level and performance requirements, including requirements relating to the quality of our services. Failure to consistently meet service requirements of a client or errors made by our employees in the course of delivering services to our clients could disrupt the client’s business and result in a reduction in revenues or a claim for damages against us. Additionally, we could incur liability if a process we manage for a client were to result in internal control failures or impair our client’s ability to comply with its own internal control requirements.
Under our MSAs with our clients, our liability for breach of our obligations is generally limited to actual damages suffered by the client and is typically capped at the greater of an agreed amount or the fees paid or payable to us under the relevant agreement. These limitations and caps on liability may be unenforceable or otherwise may not protect us from liability for damages. In addition, certain liabilities, such as claims of third parties for which we may be required to indemnify our clients or liability for breaches of confidentiality, are generally not limited under those agreements. Our MSAs are governed by laws of multiple jurisdictions, therefore the interpretation of such provisions, and the availability of defenses to us, may vary, which may contribute to the uncertainty as to the scope of our potential liability. Although we have commercial general liability insurance coverage, the coverage may not continue to be available on acceptable terms or in sufficient amounts to cover one or more large claims and our insurers may disclaim coverage as to any future claims. The successful assertion of one or more large claims against us that exceed available insurance coverage, or changes in our insurance policies (including premium increases or the imposition of large deductible or co-insurance requirements), could have a material adverse effect on our business, results of operations and financial condition.
Any failures to adhere to the regulations that govern our business could result in our being unable to effectively perform our services. Failure to adhere to regulations that govern our clients’ businesses could result in breaches of contract under our MSAs.
Our clients’ business operations are often subject to regulation, and our clients may require that we perform our services in a manner that will enable them to comply with applicable regulations. Our clients are located around the world, and the laws and regulations that apply include, among others, United States federal laws such as the Gramm-Leach-Bliley Act and the Health Insurance Portability and Accountability Act, state laws on debt collection in the United States and the Financial Services Act in the United Kingdom as well as similar consumer protection laws in other countries in which our clients’ customers are based. Failure to perform our services in a manner that complies with any such requirement could result in breaches of contracts with our clients. In addition, we are required under various laws to obtain and maintain permits and licenses for the conduct of our business in all jurisdictions in which we have operations, including India, and, in some cases, where our clients receive our services, including the United States and Europe. If we do not maintain our licenses or other qualifications to provide our services or if we do not adapt to changes in legislation or regulation, we may have to cease operations in the relevant jurisdictions and may not be able to provide services to existing clients or be able to attract new clients. In addition, we may be required to expend significant resources in order to comply with laws and regulations in the jurisdictions mentioned above. Any failure to abide by regulations relating either to our business or our clients’ businesses may also, in some limited circumstances, result in civil fines and criminal penalties for us. Any such ceasing of operations or civil or criminal actions may have a material adverse effect on our business, results of operations and financial condition.
Some of our contracts contain provisions which, if triggered, could result in lower future revenues and have a material adverse effect on our business, results of operation and financial condition.
Many of our contracts allow a client, in certain limited circumstances, to request a benchmark study comparing our pricing and performance with that of an agreed list of other service providers for comparable services. Based on the results of the study and depending on the reasons for any unfavorable variance, we may be required to make improvements in the services we provide or to reduce the pricing for services on a prospective
33
Table of Contents
basis to be performed under the remaining term of the contract, which could have an adverse effect on our business, results of operations and financial condition.
Many of our contracts, including our contract with GE, contain provisions that would require us to pay penalties to our clients and/or provide our clients with the right to terminate the contract if we do not meet pre-agreed service level requirements. Failure to meet these requirements could result in the payment of significant penalties by us to our clients which in turn could have a material adverse effect on our business, results of operations and financial condition.
A few of our MSAs provide that during the term of the MSA and under specified circumstances, we may not provide similar services to the competitors of our client. Some of our contracts also provide that, during the term of the contract and for a certain period thereafter ranging from six to 12 months, we may not provide similar services to certain or any of our client’s competitors using the same personnel. These restrictions may hamper our ability to compete for and provide services to other clients in the same industry, which may inhibit growth and result in lower future revenues and profitability.
Many of our contracts with clients specify that if a change of control of our company occurs during the term of the contract, the client has the right to terminate the contract. These provisions may result in our contracts being terminated if there is such a change in control, resulting in a potential loss of revenues. In addition, these provisions may act as a deterrent to any attempt by a third party to acquire our company.
Many of our contracts with clients require that we bear the cost of any sales or withholding taxes or unreimbursed value-added taxes imposed on payments made under those contracts. While we have arranged our contracts to minimize the imposition of these taxes, changes in law or the interpretation thereof and changes in our internal structure may result in the imposition of these taxes and a reduction in our net revenues.
Our industry is highly competitive, and we may not be able to compete effectively.
Our industry is highly competitive, highly fragmented and subject to rapid change. We believe that the principal competitive factors in our markets are breadth and depth of process and technology expertise, service quality, the ability to attract, train and retain qualified people, compliance rigor, global delivery capabilities, price, knowledge of industries served and marketing and sales capabilities. We compete for business with a variety of companies, including large multinational firms that provide consulting, technology and/or business process services, off-shore business process service providers in low-cost locations like India, in-house captives of potential clients, software services companies that also provide business process services and accounting firms that also provide consulting or outsourcing services.
Some of our competitors have greater financial, marketing, technological or other resources and larger client bases than we do, and may expand their service offerings and compete more effectively for clients and employees than we do. Some of our competitors have more established reputations and client relationships in our markets than we do. In addition, some of our competitors who do not have global delivery capabilities may expand their delivery centers to the countries in which we are located which could result in increased competition for employees and could reduce our competitive advantage. The trend toward outsourcing and technological changes may result in new and different competitors entering our markets. There could also be newer competitors that are more powerful as a result of strategic consolidation of smaller competitors or of companies that each provide different services or service different industries.
We expect competition to intensify in the future as more companies enter our markets. Increased competition may result in lower prices and volumes, higher costs for resources, especially people, and lower profitability. We may not be able to supply clients with services that they deem superior and at competitive prices and we may lose business to our competitors. Any inability to compete effectively would adversely affect our business, results of operations and financial condition.
34
Table of Contents
Our business could be materially and adversely affected if we do not protect our intellectual property or if our services are found to infringe on the intellectual property of others.
Our success depends in part on certain methodologies, practices, tools and technical expertise we utilize in designing, developing, implementing and maintaining applications and other proprietary intellectual property rights. In order to protect our rights in these various intellectual properties, we rely upon a combination of nondisclosure and other contractual arrangements as well as trade secret, copyright and trademark laws. We also generally enter into confidentiality agreements with our employees, consultants, clients and potential clients and limit access to and distribution of our proprietary information. We also have submitted United States federal and foreign trademark applications for the names of additional service offerings. We may not be successful in maintaining or obtaining trademarks for these trade names. India is a member of the Berne Convention, an international intellectual property treaty, and has agreed to recognize protections on intellectual property rights conferred under the laws of other foreign countries, including the laws of the United States. There can be no assurance that the laws, rules, regulations and treaties in effect in the United States, India and the other jurisdictions in which we operate and the contractual and other protective measures we take, are adequate to protect us from misappropriation or unauthorized use of our intellectual property, or that such laws will not change. We may not be able to detect unauthorized use and take appropriate steps to enforce our rights, and any such steps may not be successful. Infringement by others of our intellectual property, including the costs of enforcing our intellectual property rights, may have a material adverse effect on our business, results of operations and financial condition.
Although we believe that we are not infringing on the intellectual property rights of others, claims may nonetheless be successfully asserted against us in the future. The costs of defending any such claims could be significant, and any successful claim may require us to modify, discontinue or rename any of our services. Any such changes may have a material adverse effect on our business, results of operations and financial condition.
A substantial portion of our assets and operations are located in India and we are subject to regulatory, economic, social and political uncertainties in India.
We are subject to several risks associated with having a substantial portion of our assets and operations located in India.
In recent years, we have benefited from many policies of the Government of India and the Indian state governments in the states in which we operate, which are designed to promote foreign investment generally and the business process services industry in particular, including significant tax incentives, relaxation of regulatory restrictions, liberalized import and export duties and preferential rules on foreign investment and repatriation. There is no assurance that such policies will continue. Various factors, such as changes in the current federal government, could trigger significant changes in India’s economic liberalization and deregulation policies and disrupt business and economic conditions in India generally and our business in particular.
In addition, our financial performance and the market price of our common shares may be adversely affected by general economic conditions and economic and fiscal policy in India, including changes in exchange rates and controls, interest rates and taxation policies, as well as social stability and political, economic or diplomatic developments affecting India in the future. In particular, India has experienced significant economic growth over the last several years, but faces major challenges in sustaining that growth in the years ahead. These challenges include the need for substantial infrastructure development and improving access to healthcare and education. Our ability to recruit, train and retain qualified employees, develop and operate our Delivery Centers, and attract and retain clients could be adversely affected if India does not successfully meet these challenges.
Our Delivery Centers are at risk of damage from natural disasters and other disruptions.
Our Delivery Centers and our data and voice communications may be damaged or disrupted as a result of natural disasters such as earthquakes, floods, heavy rains, epidemics, tsunamis and cyclones, technical disruptions such as electricity or infrastructure breakdowns, including damage to telecommunications cables,
35
Table of Contents
computer glitches and electronic viruses or man-made events such as protests, riots and labor unrest. Such events may lead to the disruption of information systems and telecommunication services for sustained periods. They also may make it difficult or impossible for employees to reach our business locations. Damage or destruction that interrupts our provision of services could adversely affect our reputation, our relationships with our clients, our leadership team’s ability to administer and supervise our business or it may cause us to incur substantial additional expenditure to repair or replace damaged equipment or Delivery Centers. We may also be liable to our clients for disruption in service resulting from such damage or destruction. While we currently have commercial liability insurance, our insurance coverage may not be sufficient. Furthermore, we may be unable to secure such insurance coverage at premiums acceptable to us in the future or at all. Prolonged disruption of our services would also entitle our clients to terminate their contracts with us. Any of the above factors may adversely affect our business, results of operations and financial condition.
We may face difficulties as we expand our operations into countries in which we have no prior operating experience.
We intend to continue to expand our global footprint in order to maintain an appropriate cost structure and meet our clients’ delivery needs. This may involve expanding into countries other than those in which we currently operate. It may involve expanding into less developed countries, which may have less political, social or economic stability and less developed infrastructure and legal systems. As we expand our business into new countries we may encounter regulatory, personnel, technological and other difficulties that increase our expenses or delay our ability to start up our operations or become profitable in such countries. This may affect our relationships with our clients and could have an adverse affect on our business, results of operations and financial condition.
Section 404 of the Sarbanes-Oxley Act of 2002 requires us to document and assess our internal control over financial reporting and requires our independent registered public accounting firm to report on the effectiveness of these controls. Any failure to maintain effective internal controls or difficulty in satisfying these requirements could adversely affect our results of operations and our stock price.
Section 404 of the Sarbanes-Oxley Act of 2002 requires us, on an ongoing basis, to document and assess the effectiveness of our internal control over financial reporting in accordance with an established internal control framework and to report on our conclusion as to the effectiveness of our internal controls. It also requires an independent registered public accounting firm to test our internal control over financial reporting and report on the effectiveness of such controls. In addition, we are required under the Securities Exchange Act of 1934 to maintain disclosure controls and procedures and internal control over financial reporting. Compliance with Section 404 requires substantial accounting expense and significant management efforts.
We may in the future fail to maintain the effectiveness of our internal controls, or we may discover areas of our internal controls that need improvement, particularly with respect to businesses that we may acquire. We cannot be certain that any remedial measures we take will ensure that we implement and maintain adequate internal controls over our financial processes and reporting in the future. Any failure to implement required new or improved controls, or difficulties encountered in their implementation, could harm our operating results or cause us to fail to meet our reporting obligations. If we are unable to conclude that we have effective internal control over financial reporting, or if our independent registered public accounting firm is unable to provide us with an unqualified opinion regarding the effectiveness of our internal control over financial reporting in future periods as required by Section 404, investors could lose confidence in the reliability of our consolidated financial statements, which could result in a decrease in the value of our common shares.
Terrorist attacks and other acts of violence involving any of the countries in which we or our clients have operations could adversely affect our operations and client confidence.
Terrorist attacks and other acts of violence or war, such as the attacks in recent years in the United States, India, Spain and England, as well as outbreaks of violence in Mexico, may adversely affect worldwide financial
36
Table of Contents
markets and could potentially lead to economic recession, which could adversely affect our business, results of operations, financial condition and cash flows. These events could adversely affect our clients’ levels of business activity and precipitate sudden significant changes in regional and global economic conditions and cycles. These events also pose significant risks to our people and to our Delivery Centers and operations around the world.
Southern Asia has, from time to time, experienced instances of civil unrest and hostilities among neighboring countries, including India and Pakistan. In recent years, military confrontations between India and Pakistan have occurred in the region of Kashmir and along the India/Pakistan border. There have also been incidents in and near India such as terrorist attacks on the Indian Parliament and in the city of Mumbai, troop mobilizations along the India/Pakistan border and an aggravated geopolitical situation in the region. Such military activity or terrorist attacks in the future could influence the Indian economy by disrupting communications and making travel more difficult. Resulting political tensions could create a greater perception that investments in companies with Indian operations involve a high degree of risk, and that there is a risk of disruption of services provided by companies with Indian operations, which could have a material adverse effect on our share price and/or the market for our services. Furthermore, if India were to become engaged in armed hostilities, particularly hostilities that were protracted or involved the threat or use of nuclear weapons, we might not be able to continue our operations. We generally do not have insurance for losses and interruptions caused by terrorist attacks, military conflicts and wars.
If more stringent labor laws become applicable to us or if our employees unionize, our profitability may be adversely affected.
India has stringent labor legislation that protects employee interests, including legislation that sets forth detailed procedures for dispute resolution and employee removal and legislation that imposes financial obligations on employers upon retrenchment. Though we are exempt from some of these labor laws at present under exceptions in some states for providers of IT-enabled services, there can be no assurance that such laws will not become applicable to us in the future. If these labor laws become applicable to our employees, it may become difficult for us to maintain flexible human resource policies and attract and employ the numbers of sufficiently qualified candidates that we need or discharge employees, and our compensation expenses may increase significantly.
In addition, our employees may in the future form unions. If employees at any of our Delivery Centers become eligible for union membership, we may be required to raise wage levels or grant other benefits that could result in an increase in our compensation expenses, in which case our profitability may be adversely affected.
We may engage in strategic transactions that could create risks.
As part of our business strategy, we regularly review potential strategic transactions, including potential acquisitions, dispositions, consolidations, joint ventures or similar transactions, some of which may be material. Through the acquisitions we pursue, we may seek opportunities to add to or enhance the services we provide, to enter new industries or expand our Global Client base, or to strengthen our global presence and scale of operations. We have made acquisitions in the past, including Symphony Marketing Solutions, Inc. in 2010, E-Transparent B.V. and certain related entities in 2007, which are controlling partners in a partnership collectively known as ICE, Axis Risk Consulting Private Limited in 2007, MoneyLine Lending Services Inc. in 2006 (now called Genpact Mortgage Services) and Creditek Corporation in 2005. There can be no assurance that we will find suitable candidates in the future for strategic transactions at acceptable prices, have sufficient capital resources to accomplish our strategy, or be successful in entering into agreements for desired transactions.
Acquisitions, including completed acquisitions, also pose the risk that any business we acquire may lose customers or employees or could under-perform relative to expectations. We could also experience financial or other setbacks if transactions encounter unanticipated problems, including problems related to execution or integration. Following the completion of an acquisition, we may have to rely on the seller to provide
37
Table of Contents
administrative and other support, including financial reporting and internal controls, to the acquired business for a period of time. There can be no assurance that the seller will do so in a manner that is acceptable to us.
Our principal shareholders will continue to exercise significant influence over us, and their interests in our business may be different from yours.
A majority of our issued and outstanding common shares are currently beneficially owned by General Atlantic, Oak Hill, GE and Wells Fargo & Company, or Wells Fargo. As of December 31, 2009:
| • | General Atlantic and Oak Hill beneficially own (through GICo, a jointly owned investment vehicle) 49.13% of our outstanding common shares; |
| • | GE beneficially owns (through its affiliates) 18.37% of our outstanding common shares; and |
| • | Wells Fargo beneficially owns (through its affiliates) 6.60% of our outstanding common shares. |
The shareholders agreement among affiliates of GE, GICo, Wells Fargo and us provides that GICo has the right to nominate four directors to our board, so long as they maintain certain minimum shareholding thresholds, and the shareholders party to the agreement have agreed to vote their shares for the election of such persons. These shareholders can exercise significant influence over our business policies and affairs and all matters requiring a shareholders’ vote, including the composition of our board of directors, the adoption of amendments to our certificate of incorporation and bye-laws, the approval of mergers or sales of substantially all of our assets, our dividend policy and our capital structure and financing. This concentration of ownership also may delay, defer or even prevent a change in control of our company and may make some transactions more difficult or impossible without the support of these shareholders, even if such transactions are beneficial to other shareholders. The interests of these shareholders may conflict with your interests. In particular, GE and Wells Fargo are our clients. General Atlantic and Oak Hill are significant shareholders and currently hold interests in companies that do compete with us and they may, from to time, make significant investments in companies that could compete with us. In addition, pursuant to our bye-laws and our shareholders agreement and to the extent permitted by applicable law, our directors who are affiliated with our major shareholders are not required to present to us corporate opportunities (e.g., acquisitions or new potential clients) that they become aware of unless such opportunities are presented to them expressly in their capacity as one of our directors.
We may become subject to taxation as a result of our incorporation in Bermuda, which would have a material adverse effect on our business, results of operations and financial condition.
We have received a written assurance from the Bermuda Minister of Finance under The Exempted Undertaking Tax Protection Act 1966 of Bermuda to the effect that if there is enacted in Bermuda any legislation imposing tax computed on profits or income, or computed on any capital asset, gain or appreciation, or any tax in the nature of estate duty or inheritance tax, then the imposition of any such tax shall not be applicable to us or to any of our operations or common shares, debentures or other obligations until March 28, 2016, except in so far as such tax applies to persons ordinarily resident in Bermuda or is payable by us in respect of real property owned or leased by us in Bermuda. We cannot assure you that a future Minister would honor that assurance, which is not legally binding, or that after such date we would not be subject to any such tax. If we were to become subject to taxation in Bermuda or any other jurisdiction as a result of our incorporation in Bermuda, it could have a material adverse effect on our business, results of operations and financial condition.
Risks Related to our Shares
Future sales of our common shares could cause our share price to decline.
Sales of substantial amounts of common shares by our employees and other shareholders, or the possibility of such sales, may adversely affect the price of our common shares and impede our ability to raise capital through the issuance of equity securities. As of December 31, 2009, General Atlantic, Oak Hill, GE and
38
Table of Contents
Wells Fargo beneficially owned in the aggregate 161,123,041 common shares, representing approximately 74.1% of our outstanding common shares. Such shareholders will be able to sell their common shares in the public market from time to time without registering them, subject to certain limitations on the timing, amount and method of those sales imposed by Rule 144 under the Securities Act of 1933, as amended.
Pursuant to the shareholders agreement, an affiliate of GE, GICo and Wells Fargo will have the right, subject to certain conditions, to require us to file registration statements covering all of the common shares (including restricted shares and common shares issuable upon the exercise of currently outstanding options) which they own or to include those common shares in registration statements that we may file for ourselves or other shareholders. Following their registration and sale under the applicable registration statement, those shares will become freely tradable. By exercising their registration rights and selling a large number of common shares, these holders could cause the price of our common shares to decline. In addition, the perception in the public markets that sales by them might occur could also adversely affect the market price of our common shares.
We do not intend to pay dividends in the foreseeable future.
We have never declared or paid any cash dividends on our common shares, other than dividends paid by the predecessor to GE in the 2004 Reorganization. For the foreseeable future, we intend to retain any earnings to finance the development and expansion of our business, and we do not anticipate paying any cash dividends on our common shares. Our ability to pay dividends is also subject to restrictive covenants contained in our credit facility agreement governing indebtedness we and our subsidiaries have incurred or may incur in the future.
We are organized under the laws of Bermuda, and Bermuda law differs from the laws in effect in the United States and may afford less protection to shareholders.
Our shareholders may have more difficulty protecting their interests than would shareholders of a corporation incorporated in a state of the United States. As a Bermuda company, we are governed by the Companies Act 1981 Bermuda, as amended, or the Companies Act. The Companies Act differs in some material respects from laws generally applicable to U.S. corporations and shareholders, including the provisions relating to interested directors, mergers, amalgamations and acquisitions, takeovers, shareholder lawsuits and indemnification of directors.
Generally, the duties of directors and officers of a Bermuda company are owed to the company only. Shareholders of Bermuda companies generally do not have rights to take action against directors or officers of the company and may only do so in limited circumstances. Officers of a Bermuda company must, in exercising their powers and performing their duties, act honestly and in good faith with a view to the best interests of the company and must exercise the care and skill that a reasonably prudent person would exercise in comparable circumstances. Directors have a duty not to put themselves in a position in which their duties to the company and their personal interests may conflict and also are under a duty to disclose any personal interest in any contract or arrangement with the company or any of its subsidiaries. If a director or officer of a Bermuda company is found to have breached his or her duties to that company, he may be held personally liable to the company in respect of that breach of duty. A director may be liable jointly and severally with other directors if it is shown that the director knowingly engaged in fraud or dishonesty. In cases not involving fraud or dishonesty, the liability of the director will be determined by the Bermuda courts on the basis of their estimation of the percentage of responsibility of the director for the matter in question, in light of the nature of the conduct of the director and the extent of the causal relationship between his or her conduct and the loss suffered.
In addition, our bye-laws contain a broad waiver by our shareholders of any claim or right of action, both individually and on our behalf, against any of our officers or directors. The waiver applies to any action taken by an officer or director, or the failure of an officer or director to take any action, in the performance of his or her duties, except with respect to any matter involving any fraud or dishonesty on the part of the officer or director or to recover any gain, personal profit or advantage to which such officer or director is not legally entitled. This
39
Table of Contents
waiver limits the right of shareholders to assert claims against our officers and directors unless the act or failure to act involves fraud or dishonesty. In addition, the rights of our shareholders and the fiduciary responsibilities of our directors under Bermuda law are not as clearly established as under statutes or judicial precedent in existence in jurisdictions in the United States, particularly the State of Delaware. Therefore, our shareholders may have more difficulty protecting their interests than would shareholders of a corporation incorporated in a state within the United States.
The market price for our common shares has been and may continue to be volatile.
The market price for our common shares has been and may continue to be volatile and subject to price and volume fluctuations in response to market and other factors, some of which are beyond our control. Among the factors that could affect our stock price are:
| • | actual or anticipated fluctuations in our quarterly and annual operating results; |
| • | changes in financial estimates by securities research analysts; |
| • | changes in the economic performance or market valuations of other companies engaged in providing business process services; |
| • | loss of one or more significant clients; |
| • | addition or loss of executive officers or key employees; |
| • | regulatory developments in our target markets affecting us, our clients or our competitors; |
| • | announcements of technological developments; |
| • | limited liquidity in our trading market; |
| • | sales or expected sales of additional common shares; and |
| • | terrorist attacks or natural disasters or other such events impacting countries where we or our clients have operations. |
In addition, securities markets generally and from time to time experience significant price and volume fluctuations that are not related to the operating performance of particular companies. These market fluctuations may have a material adverse effect on the market price of our common shares.
You may be unable to effect service of process or enforce judgments obtained in the United States or Bermuda against us or our assets in the jurisdictions in which we or our executive officers operate.
We are organized under the laws of Bermuda, and a significant portion of our assets are located outside the United States. It may not be possible to enforce court judgments obtained in the United States against us in Bermuda or in countries, other than the United States, where we have assets based on the civil liability or penal provisions of the federal or state securities laws of the United States. In addition, there is some doubt as to whether the courts of Bermuda and other countries would recognize or enforce judgments of United States courts obtained against us or our directors or officers based on the civil liability or penal provisions of the federal or state securities laws of the United States or would hear actions against us or those persons based on those laws. We have been advised by Appleby, our Bermuda counsel, that the United States and Bermuda do not currently have a treaty providing for the reciprocal recognition and enforcement of judgments in civil and commercial matters. Therefore, a final judgment for the payment of money rendered by any federal or state court in the United States based on civil liability, whether or not based solely on United States federal or state securities laws, would not automatically be enforceable in Bermuda. Similarly, those judgments may not be enforceable in countries, other than the United States, where we have assets.
40
Table of Contents
Item 1B. Unresolved Staff Comments
None.
We have Delivery Centers in thirteen countries. Our only material properties are our premises in India at Phase V, Gurgaon, which comprises of 193,898 square feet and Uppal, Hyderabad which comprises approximately 449,286 square feet, both of which we own. We have a mixture of owned and leased properties and substantially all of our leased properties are leased under long-term leases with varying expiration dates. We believe that all of our properties and facilities are well maintained.
There are no legal proceedings pending against us that we believe are likely to have a material adverse effect on our business, results of operations and financial condition.
Item 4. Submission of Matters to a Vote of Security Holders
None.
Item 5. Market for Registrant’s Common Equity, Related Stockholder Matters and Issuer Purchases of Equity Securities
Stock Price Information and Stockholders
The principal market on which the company’s common shares are traded is the New York Stock Exchange under the symbol “G”. The following table sets forth the high and low sales price of the Company’s common shares for each quarter of 2008 and 2009, the fourth quarter of 2007, and for the period from August 2, 2007 (the date trading commenced on the New York Stock Exchange) to September 30, 2007. As of February 19, 2010, there were approximately 33 holders of record of our common shares.
| Sales Price | ||||||
| High | Low | |||||
| Year Ended December 31, 2009: |
||||||
| First Quarter |
$ | 9.47 | $ | 7.08 | ||
| Second Quarter |
$ | 12.11 | $ | 8.52 | ||
| Third Quarter |
$ | 14.45 | $ | 10.99 | ||
| Fourth Quarter |
$ | 15.23 | $ | 11.04 | ||
| Year Ended December 31, 2008: |
||||||
| First Quarter |
$ | 16.16 | $ | 10.77 | ||
| Second Quarter |
$ | 15.98 | $ | 11.80 | ||
| Third Quarter |
$ | 15.33 | $ | 9.24 | ||
| Fourth Quarter |
$ | 10.84 | $ | 6.30 | ||
| Year Ended December 31, 2007: |
||||||
| Fourth Quarter |
$ | 18.87 | $ | 13.11 | ||
| August 2, 2007 to September 30, 2007 |
$ | 17.44 | $ | 13.01 | ||
41
Table of Contents
Dividends
The Company has not declared or paid any cash dividends on our common shares. Our board of directors does not anticipate authorizing the payment of cash dividends in the foreseeable future and intends to retain all available funds and any future earnings to fund the development and growth of our business. Any determination to pay dividends to holders of our common shares in the future will be at the discretion of our board of directors and will depend on many factors, including our financial condition, results of operations, general business conditions and any other factors our board of directors deems relevant.
Unregistered Sales of Equity Securities
None.
Use of Proceeds
On August 1, 2007, we commenced an initial public offering of our common shares, pursuant to which the Company and our selling shareholders each sold 17,647,059 common shares at a price of $14 per share. On August 14, 2007, the underwriters exercised their option to purchase 5,294,118 additional common shares from the Company at the initial offering price of $14 per share to cover over-allotments. The sales were made pursuant to a registration statement on Form S-1 (File No. 333-142875), which was declared effective by the SEC on August 1, 2007. The managing underwriters in the offering were Morgan Stanley & Co. Incorporated, Citigroup Global Markets Inc. and J.P. Morgan Securities Inc. The underwriting discounts and commissions and offering expenses payable by us aggregated $9.0 million, resulting in net proceeds to us of $294.5 million. We did not receive any proceeds from common shares sold by the selling shareholders.
We used $98.1 million of the net proceeds from our initial public offering to repay revolving loan indebtedness outstanding under our credit facility. In addition, we used $60.0 million of the net proceeds from our initial public offering partially to repay long term indebtedness outstanding under our credit facility in accordance with the regular payment schedule for such indebtedness. In addition, we acquired Symphony Marketing Solutions, Inc. for $29.0 million in February 2010 and a facility from Walgreens for $16.3 million in January 2010. The remaining proceeds are invested in short-term deposit accounts and U.S. Treasury bills and notes. There has been no material change in the planned use of proceeds from our initial public offering as described in our final prospectus filed with the SEC pursuant to Rule 424(b) on August 2, 2007.
Item 6. Selected Financial Data
The table below presents our selected historical financial and certain operating data.
On March 29, 2007, we formed Genpact Limited in Bermuda to be the holding company for our business. It was initially a wholly-owned subsidiary of GGH. On July 13, 2007, we effectuated a transaction that resulted in Genpact Limited owning 100% of the capital stock of GGH. This transaction together with other related transactions is referred to as the “2007 Reorganization.”
The Company prepares its consolidated financial statements in accordance with U.S. GAAP. The financial data as of December 31, 2008 and 2009 and for the three-year period ended December 31, 2009 have been derived from our audited consolidated financial statements included elsewhere in this Annual Report on Form 10-K. The financial data as of December 31, 2005, 2006 and 2007 and for the years ended December 31, 2005 and 2006 have been derived from our audited consolidated financial statements not included in this Annual Report on Form 10-K.
42
Table of Contents
You should read the selected financial data together with the financial statements included herein as well as Item 7—“Management’s Discussion and Analysis of Financial Condition and Results of Operations”.
| On Historical Basis(1) |
As Reclassified(1) | |||||||||||||||||||
| Year Ended December 31, | ||||||||||||||||||||
| 2005 | 2006 | 2007 | 2008 | 2009 | ||||||||||||||||
| (dollars in millions) | ||||||||||||||||||||
| Statement of income data: |
||||||||||||||||||||
| Net revenues GE |
$ | 449.7 | $ | 453.3 | $ | 481.3 | $ | 490.2 | $ | 451.3 | ||||||||||
| Net revenues Global Clients |
42.2 | 158.3 | 340.4 | 550.6 | 668.7 | |||||||||||||||
| Other revenues |
— | 1.5 | 1.5 | 0.1 | — | |||||||||||||||
| Total net revenues |
491.9 | 613.0 | 823.2 | 1,040.8 | 1,120.1 | |||||||||||||||
| Cost of revenue |
304.0 | 369.2 | 482.9 | 619.2 | 672.6 | |||||||||||||||
| Gross profit |
187.9 | 243.8 | 340.2 | 421.6 | 447.4 | |||||||||||||||
| Operating expenses: |
||||||||||||||||||||
| Selling, general and administrative expenses |
117.5 | 162.0 | 218.2 | 254.5 | 265.4 | |||||||||||||||
| Amortization of acquired intangible assets |
47.0 | 41.7 | 36.9 | 36.5 | 26.0 | |||||||||||||||
| Foreign exchange (gains) losses, net |
12.8 | — | — | — | — | |||||||||||||||
| Other operating income |
(6.2 | ) | (4.9 | ) | (4.3 | ) | (3.1 | ) | (6.1 | ) | ||||||||||
| Income from operations |
16.9 | 45.1 | 89.3 | 133.7 | 162.2 | |||||||||||||||
| Foreign exchange (gains) losses, net |
— | 1.9 | 2.5 | (4.1 | ) | 5.5 | ||||||||||||||
| Other income (expense), net |
(6.1 | ) | (9.2 | ) | (5.2 | ) | 6.5 | 4.4 | ||||||||||||
| Income before share of equity in (earnings) loss of affiliates and income tax expense |
10.7 | 33.9 | 81.6 | 144.3 | 161.1 | |||||||||||||||
| Equity in (earnings) loss of affiliates |
— | — | 0.3 | 0.9 | 0.7 | |||||||||||||||
| Income before income tax expense |
10.7 | 33.9 | 81.4 | 143.4 | 160.4 | |||||||||||||||
| Income tax expense (benefit) |
(6.4 | ) | (5.9 | ) | 16.5 | 8.8 | 25.5 | |||||||||||||
| Net income |
$ | 17.1 | $ | 39.8 | $ | 64.8 | $ | 134.6 | $ | 135.0 | ||||||||||
| Net income attributable to noncontrolling interest |
— | — | 8.4 | 9.5 | 7.7 | |||||||||||||||
| Net income attributable to Genpact Limited shareholders |
$ | 17.1 | $ | 39.8 | $ | 56.4 | $ | 125.1 | $ | 127.3 | ||||||||||
| Net income available to Genpact Limited common shareholders |
$ | (1.6 | ) | $ | (10.6 | ) | $ | 17.3 | $ | 125.1 | $ | 127.3 | ||||||||
| Earnings per common share |
||||||||||||||||||||
| Basic |
$ | (0.02 | ) | $ | (0.15 | ) | $ | 0.13 | $ | 0.59 | $ | 0.59 | ||||||||
| Diluted |
$ | (0.02 | ) | $ | (0.15 | ) | $ | 0.12 | $ | 0.57 | $ | 0.58 | ||||||||
| Weighted average number of common shares used in computing earnings per common share |
||||||||||||||||||||
| Basic |
71,274,600 | 70,987,180 | 135,517,771 | 213,480,623 | 215,503,749 | |||||||||||||||
| Diluted |
71,274,600 | 70,987,180 | 142,739,811 | 218,444,224 | 220,066,345 | |||||||||||||||
43
Table of Contents
| As of December 31, | |||||||||||||||
| 2005 | 2006 | 2007 | 2008 | 2009 | |||||||||||
| (dollars in millions) | |||||||||||||||
| Balance sheet data |
|||||||||||||||
| Cash and cash equivalents |
$ | 44.7 | $ | 35.4 | $ | 279.3 | $ | 184.1 | $ | 288.7 | |||||
| Total assets |
970.2 | 1,081.3 | 1,743.5 | 1,696.3 | 1,747.6 | ||||||||||
| Long-term debt, including current portion |
157.9 | 143 | 123.7 | 99.2 | 69.7 | ||||||||||
| Total liabilities |
378.2 | 456.6 | 489.7 | 852.0 | 547.8 | ||||||||||
| Retained earnings |
0.7 | 6.0 | 26.5 | 151.6 | 278.9 | ||||||||||
| Genpact Limited shareholders’ equity |
592.0 | 624.7 | 1,250.7 | 841.8 | 1,197.4 | ||||||||||
| Noncontrolling interest |
— | — | 3.1 | 2.6 | 2.35 | ||||||||||
| Total liabilities, noncontrolling interest and shareholders’ equity |
$ | 970.2 | $ | 1,081.3 | $ | 1,743.5 | $ | 1,696.3 | $ | 1,747.6 | |||||
| Operating data (unaudited): |
|||||||||||||||
| Employees |
19,532 | 26,060 | 32,674 | 36,203 | 38,645 | ||||||||||
| Delivery Centers |
17 | 23 | 33 | 38 | 39 | ||||||||||
| (1) | We have reclassified our foreign exchange gains or losses from a separate line item above income from operations to the underlying hedged items, namely, selling, general and administrative expenses, cost of revenue or net revenues, as applicable. The residual foreign exchange gains or losses, primarily relating to the re-measurement of foreign currency assets or liabilities, mainly accounts receivable, and the ineffective portion of foreign exchange gains or losses, if any, are now reclassified on the income statement below income from operations as foreign exchange (gains) losses, net. The 2006 and 2007 results reflect this reclassification. Although we were hedging our revenues in 2005, the impact on our revenues was not significant and therefore we have not reclassified our foreign exchange gains and losses for that year. All such gains or losses have been recorded under foreign exchange (gains) losses, net above the income from operations line. |
Item 7. Management’s Discussion and Analysis of Financial Condition and Results of Operations
The following discussion should be read in conjunction with our audited consolidated financial statements and the related notes that appear elsewhere in this Annual Report on Form 10-K. In addition to historical information, this discussion includes forward-looking information that involves risks and assumptions, which could cause actual results to differ materially from management’s expectations. See “Special Note Regarding Forward-Looking Statements” included elsewhere in this Annual Report on Form 10-K.
Overview
We are a leader in managing business processes, offering a broad portfolio of enterprise and industry-specific services. We have launched Smart Enterprise Processes (SEPSM), a groundbreaking, rigorously scientific methodology for managing business processes, which focuses on optimizing process effectiveness in addition to efficiency to deliver superior business outcomes. Services are seamlessly delivered from a global network of centers to meet a client’s business objectives, cultural and language needs and cost reduction goals.
We began in 1997 as the India-based captive business process services operation for GE Capital, GE’s financial services business. As the value of offshore outsourcing was demonstrated to the management of GE, it became a widespread practice at GE and our business grew in size and scope. We took on a wide range of complex and critical processes and we became a significant provider to many of GE’s businesses, including Consumer Finance (GE Money), Commercial Finance, Insurance, Healthcare, Industrial, NBC Universal and GE’s corporate offices.
Prior to December 30, 2004, the business of the Company was conducted through various entities and divisions of GE. On December 30, 2004, in a series of transactions we refer to as the “2004 Reorganization,” GE
44
Table of Contents
reorganized these operations by placing them all under Genpact Global Holdings, a newly formed entity, and subsequently an affiliate of GE sold an indirect 60% interest in that entity to General Atlantic and Oak Hill. See Item 1—“Business—The Company—The 2004 Reorganization.” Since the 2004 Reorganization, GE, through its affiliates, sold a portion of its equity in us pursuant to several separate transactions. As of December 31, 2009, GE (through its affiliates) owned 18.37% of our outstanding equity.
Following the 2004 Reorganization, we began operating as an independent company. We separated ourselves operationally from GE and began building the capabilities necessary to be successful as an independent company. Among other things, we expanded our management infrastructure and business development capabilities so that we could secure business from clients other than GE. We substantially expanded administrative functions for which we had previously relied primarily on GE, such as finance, legal, accounting and human resources. We created separate employee benefit and retirement plans, developed our own leadership training capability and enhanced our management information systems.
We began actively pursuing business from Global Clients as of January 1, 2005. Since that time, we have succeeded in increasing our business and diversifying our revenue sources. As a result, our net revenues from Global Clients have increased from $42.2 million in 2005 to $668.7 million in 2009. representing a compound annual growth rate, or CAGR, of approximately 100%. See “—Classification of Certain Net Revenues” for an explanation of the classification of revenues related to businesses once owned by GE and subsequently sold. During the same period, we marginally increased our net revenues from GE. Our net revenues from GE were $449.7 million in 2005 and $451.3 million in 2009. See “—Classification of Certain Net Revenues.” Our net revenues from Global Clients as a percentage of total net revenues have increased from 8.6% in 2005 to 59.7% in 2009.
On July 13, 2007, prior to the commencement of our initial public offering, we completed a series of transactions we refer to as the “2007 Reorganization.” See “—the 2007 Reorganization” below. On August 1, 2007, we commenced an initial public offering of our common shares, pursuant to which the Company and our selling shareholders each sold 17.65 million common shares at a price of $14 per share. The offering resulted in gross proceeds of $494.1 million and net proceeds to the Company and the selling shareholders of approximately $233.5 million each after deducting underwriting discounts and commissions. Additionally, the Company incurred offering-related expenses of approximately $9.0 million. On August 14, 2007, the underwriters exercised their option to purchase 5.29 million additional common shares from the Company at the initial offering price of $14 per share to cover over-allotments resulting in additional gross proceeds of $74.1 million and net proceeds of approximately $70.0 million to the Company, after deducting underwriting discounts and commissions.
Global Recession. Since the end of 2008, the United States and global economies have been experiencing a period of substantial economic uncertainty with wide-ranging effects, including contraction of overall economic activity in various parts of the world. Our outlook is subject to significant risks and uncertainties in this environment, including possible declines in demand for our services, pricing pressure, fluctuations in foreign currency exchange rates, risks relating to the financial condition of our clients and local legislative changes.
Revenues. We earn revenues pursuant to contracts which generally take the form of a master service agreement, or MSA, which is a framework agreement that is then supplemented by statements of work, or SOWs. Our MSAs specify the general terms applicable to the services we will provide. They are typically for terms of five to seven years, although they may also have an indefinite term. In most cases they do not specify pricing terms or obligate the client to purchase a particular amount of services. We then enter into SOWs under an MSA, which specify particular services to be provided and the pricing terms. Most of our SOWs have terms of two to five years. We typically have multiple SOWs under any given MSA, and the terms of the SOWs vary depending on the nature of the services provided.
We seek to develop long-term relationships with our clients. We believe that these relationships offer the greatest potential for benefits to our clients and to us as they create opportunities for us to provide a variety of services using the full range of our capabilities and to deliver continuous process improvement. We typically face
45
Table of Contents
a long selling cycle in securing a new client. It is not unusual for us to spend twelve months or more from the time we begin actively soliciting a new client until we begin to recognize revenues. Our sales efforts usually involve four phases. We may make an initial sales effort in response to an invitation by a client, a specific request for a proposal or at our own initiative. This may be followed by a second phase, during which we work with the client to determine the exact scope and nature of the required services, the proposed solutions and initial transition planning. It is typically only upon the completion of this second phase that a client would decide to retain us. A third phase follows which would involve negotiating the MSA, as well as the initial SOWs. This third phase would also involve detailed planning of the transition of the services as well as the transfer of the knowledge needed to implement the services under such SOWs. The final phase involves commencement of the work and ramping up to meet the agreed upon service levels.
We expend significant time and capital throughout all of these phases. We generally do not recognize any revenues or reimbursement of costs until an MSA and one or more SOWs are signed, which, as noted above, usually occurs sometime in the third phase of the client development effort. We typically begin hiring employees specifically for the services to be provided to a client once the SOW for the services is signed. Because there is no certainty that a new client will retain us, and because the time involved in these initial phases is significant and unpredictable, we may incur expenses for a significant period of time without receiving any revenues.
All costs related to contract acquisition prior to signing a contract are expensed as incurred and classified as selling, general and administrative expenses. Once a contract is signed, we defer revenues from the transition of services to our Delivery Centers, as well as the related cost of revenue. We recognize such deferred revenues and related cost of revenue over the period in which the related service delivery is expected to be performed, which is currently estimated to be three years.
We price our services under a variety of arrangements, including time and materials contracts and, to a lesser extent, fixed-price contracts. When services are priced on a time and materials basis, we charge the client based on full-time equivalent, or FTE rates for the personnel who will directly perform the services. The FTE rates are determined on an annual basis, vary by category of service delivery personnel and are set at levels to reflect all our costs, including the cost of supervisory personnel and the allocable portion of other costs, and a margin. In some cases, time and materials contracts are based on hourly rates of the personnel providing the services. Time and materials pricing does not require us to estimate the volume of transactions or other processes that the client expects us to operate. Some of our contracts give the client the option to prospectively change from a time and materials model to a transaction based pricing model, which has elements of both a time and materials and a fixed priced model. In transaction based pricing, which is a commonly used pricing model in our industry, clients are charged a fixed fee per transaction, with the fee per transaction sometimes linked to the total number of transactions processed.
A small portion of our revenues are derived from fixed-price contracts. Our profitability under a fixed-price contract, as compared to a time and materials contract, is more dependent on our ability to estimate the number of FTEs required to perform the services, the time required to complete the contract and the amount of travel and other expenses that will be incurred in performing that contract. Accordingly, while we may have an opportunity to realize a higher profit, our profitability under each of our fixed-price contracts could also be lower than we expect.
There are a variety of other aspects to our pricing of contracts, many of which represent options from which a client may choose, such as whether the client wants to provide for higher levels of business continuity planning or whether the client wants shared or dedicated support personnel and/or infrastructure. Under some of our MSAs, we are able to share a limited amount of inflation and currency exchange risk when services are priced on a time and materials basis. Many of our MSAs also provide that, under time and materials-based SOWs, we are entitled to retain a portion of certain productivity benefits we achieve, such as those resulting from being able to provide the same volume of services with fewer FTEs. However, some of our MSAs and/or SOWs require certain minimum productivity benefits to be passed on entirely to our clients. Once an MSA and related SOW are signed and production of services commences, our revenues and expenses increase as services are ramped up to
46
Table of Contents
the agreed upon level. In many cases, we may have opportunities to increase our margins over the life of an MSA and over the life of a particular SOW. This is due to a number of factors. Margins under an MSA can improve to the extent that the time and expense involved in negotiating additional SOWs, transitioning the processes to our Delivery Centers and commencement of production are generally less with respect to additional services provided under an MSA than they are with respect to the initial services provided under that MSA. Margins under an MSA or an SOW can improve as a result of the realization of economies of scale as the volume of services increases or the achievement of productivity benefits. Thus, our more mature client relationships typically generate higher margins. A critical part of our strategy is therefore to expand relationships with our clients as a means to increase our overall revenues and improve our margins.
We follow a rigorous review process to evaluate all new business. Each new business proposal typically is reviewed twice by a committee that includes not only our business development and operational employees, but also members of our finance team. In this way, we try to ensure that contract terms meet our pricing and service objectives. See Item 1—“Business—Our New Business Review Process.”
In January 2010, we extended our MSA with GE from a term ending December 31, 2014 to December 31, 2016. GE has agreed to provide a minimum annual volume commitment of $360 million for each of the nine years beginning January 1, 2005, subject to certain potential adjustments or credits. Such minimum annual commitment is then reduced in a phased manner for the final three years of the agreement, to $250 million for 2014, $150 million for 2015 and $90 million for 2016. However, the actual level of services purchased in the last five years has exceeded the respective minimum annual commitment. GE has the ability to carry forward surpluses of up to 10% of the excess purchases in any year against the minimum commitment requirements in the subsequent two years. Purchases made by GE affiliates count towards the GE minimum annual volume commitment. The actual amount of purchases in any given year depends on decisions by a variety of business units, and represents the sum of services ordered under approximately 2,200 SOWs. Our MSA with GE also includes specific productivity and price reduction commitments from Genpact, including volume discounts for increasing overall GE revenues.
Our pricing arrangements with GE vary by SOW and include some time and materials contracts and some fixed price contracts. Because of our long-term relationship with GE, the negotiation and implementation of new SOWs often occurs in less time than that required for a new client. Our business from GE comes from a variety of GE’s businesses and decisions to use our services are currently, as a general matter, made by a number of people within GE. Therefore, although some decisions may be made centrally at GE, the total level of business we receive generally depends on the decisions of the various operating managers of such businesses. In addition, because our business from GE is derived from a variety of businesses within GE, our exposure to GE is diversified in terms of industry risk. See Item 1A—“Risk Factors—GE accounts for a significant portion of our revenues and any loss of business from, or change in our relationship with, GE could have a material adverse effect on our business, results of operations and financial condition.”
Our MSA with Genworth Financial provides a minimum volume commitment of $24 million per year through 2009 and declining amounts per year thereafter through 2012. Most of our other MSAs do not obligate the client to purchase a specified amount of services. The volume of services provided to Global Clients thus depends on the commitments under individual SOWs.
Reimbursements of out-of-pocket expenses received from clients, consisting principally of travel expenses, have been included as part of net revenues from services. Net revenues represent revenues less certain business taxes we pay in China.
Classification of certain net revenues. Our net revenues are classified as net revenues from a significant shareholder (which is GE), net revenues from Global Clients and other net revenues. Net revenues from Global Clients consist of revenues from services provided to all clients other than GE and the companies in which GE owns 20% or more of the stock. Revenues from Global Clients in 2007, 2008 and 2009 include revenues from certain former GE-owned businesses. These businesses were wholly-owned by GE in the beginning of 2005, but
47
Table of Contents
GE gradually divested its interest in these businesses in 2007, 2008 and 2009. After GE ceased to own at least 20% of such businesses, we began to treat the revenues from those businesses as Global Client net revenues, in each case from the date that GE ceased to be a 20% shareholder. We have continued to perform services for such businesses following their divestiture by GE even though they were not obligated by the GE MSA to continue to use our services. We entered into either new MSAs with respect to such businesses following its divestment by GE or agreed with the businesses to continue to work pursuant to the terms agreed to by GE.
In addition to our revenues from GE and our revenues from Global Clients, our Genpact Mortgage Services subsidiary had $1.5 million in revenues in 2007 and nil in 2008 and 2009 from interest income on mortgage loans that it funded directly and held for sale, typically on a short-term basis. The primary activity of this subsidiary, which we acquired in 2006, consists of mortgage loan application processing for mid-size financial institutions. Funding and secondary remarketing of loans is not part of our business plan for this unit, and on June 1, 2007 we ceased funding new mortgage loans. See Item 7A—“Quantitative and Qualitative Disclosures about Market Risk—Credit Risk.”
Expenses. Personnel expenses are the major component of both our cost of revenue and selling, general and administrative expenses. Personnel expenses include salaries and benefits as well as costs related to recruiting, training and retention. Our industry is labor intensive. Wage levels in the countries in which our Delivery Centers are located have increased in recent years. We attempt to address the impact of wage increases, and pressures to increase wages, in a number of ways, which include seeking to control entry-level wages, managing our attrition rate, and delivering productivity. We try to control increases in entry-level wages by implementing innovative recruiting policies, emphasizing training and promotion opportunities and maintaining an attractive work atmosphere and company culture. We have succeeded at keeping our entry-level wages in India, where most of our employees are located, at a relatively constant level for the past five years, but there is no assurance we can continue to do so. Effective training allows us to expand the pool of potential applicants and to upgrade our employees’ skill levels so that employees may take on higher value-added tasks over time. In 2008, we formed a joint venture with NIIT, one of the largest training institutes in Asia, to create a training institute to assist us with training and reduce our training costs. By emphasizing training and promotion, we seek to create opportunities for employees to increase their salaries without increasing wage scales. In planning our expansion of capacity, we look for locations that help us ensure global delivery capability while helping us control average salary levels. In India and elsewhere where we may open multiple locations, we try to expand into cities where competition for personnel and wage levels may be lower than in more developed cities. In addition, under some of our contracts we have the ability to share with our clients a portion of any increase in costs due to inflation. Nevertheless, despite these steps, we expect general increases in wage levels in the future which could adversely affect our margins. A significant increase in attrition rates would also increase our recruiting and training costs and decrease our operating efficiency, productivity and profit margins. Increased attrition rates or increased pricing may also cause some clients to be less willing to use our services. See Item 1A—“Risk Factors—Wage increases in the countries in which we have operations may prevent us from sustaining our competitive advantage and may reduce our profit margin.”
Personnel expenses includes compensation, benefits and share options, and are allocated between cost of revenue and selling, general and administrative expenses based on the classification of the employee. Personnel expenses for employees who are directly responsible for performance of services, their supervisors and certain support personnel who may be dedicated to a particular client are included in cost of revenue. Personnel expenses for senior management employees who are not dedicated to a particular client, business development personnel and other personnel involved in support functions are included in selling, general and administrative expenses.
Our operational expenses include facilities maintenance expenses, travel and living costs, communications expenses and other costs. Travel and living costs, which represent the costs of travel, accommodation and meals of employees while traveling for business, are allocated between cost of revenue and selling, general and administrative expenses based on the allocation of the personnel expenses of the employee incurring such costs. Facilities maintenance, certain communication costs and certain other operational costs are allocated between
48
Table of Contents
cost of revenue and selling, general and administrative expenses in the same proportions as the allocation of our employees by headcount. Our depreciation and amortization expense is similarly allocated by headcount.
Cost of revenue. The principal component of cost of revenue is personnel expenses. We include in cost of revenue all personnel expenses for employees who are directly responsible for the performance of services, their supervisors and certain support personnel who may be dedicated to a particular client. Share based compensation is allocated between cost of revenue and selling, general and administrative expenses based on the function to which the employee belongs.
The operational expenses included in cost of revenue include a portion of our facilities maintenance expenses, travel and living expenses, communication expenses and certain other expenses. As noted above, facilities maintenance expenses, certain communication expenses and certain other expenses are allocated between cost of revenue and selling, general and administrative expenses based on headcount. Travel and living expenses are included in cost of revenue if the personnel expense for the employee incurring such expense is included in cost of revenue. The operational expenses component of cost of revenue also includes consulting charges, which represent the cost of third-party software and other consultants that we may retain for particular services. Cost of revenue also includes a portion of our depreciation and amortization expense, which is allocated between cost of revenue and selling, general and administrative expenses based on headcount.
The ratio of cost of revenue to revenues for any particular SOW or for all SOWs under an MSA is typically higher in the early periods of the contract or client relationship than in later periods. This is because the number of supervisory and support personnel relative to the number of employees who are performing services declines. It is also because we may retain a portion of the benefit of productivity increases realized over time.
Selling, general and administrative expenses. Our selling, general and administrative, or SG&A, expenses are primarily comprised of personnel expenses for senior management, business development personnel and other personnel who are not dedicated to particular clients. Stock based compensation is allocated between cost of revenue and selling, general and administrative expenses based on the function to which the employee belongs. The operational costs component of SG&A expenses includes travel and living costs for such personnel, as well as a portion of our total facilities maintenance expenses, certain communication expenses and certain other expenses. Such portion of such costs is equal to the percentage of our total employees, by headcount, whose compensation cost is classified as SG&A expenses. The operational costs component of SG&A expenses also includes professional fees, which represent the costs of third party legal, tax, accounting and other advisors, and a bad debt valuation allowance. SG&A expenses also include a portion of our depreciation and amortization expense, which is allocated between cost of revenue and SG&A expenses based on headcount.
SG&A as a percentage of net revenue has been decreasing since 2007, largely due to managed growth in support costs and discretionary spending. In addition, during 2007, SG&A as a percentage of net revenue increased, largely due to various professional fees, including fees relating to acquisition activities and being a public company.
Foreign exchange (gains) losses, net. Foreign exchange (gains) losses, net, primarily consist of gains or losses on the re-measurement of non-functional currency assets. In addition, it includes gains or losses on account of derivative contracts entered into to offset the impact of this re-measurement of non-functional currency assets. It also includes the realized and unrealized gains or losses on derivative contracts that do not qualify for “hedge” accounting and are deemed ineffective. It does not include the gains or losses on derivative contracts acquired to mitigate foreign currency exposure related to our foreign currency denominated revenues and expenditures and which qualify for “hedge” accounting or “cash flow hedges”. These gains or losses are deferred and included as other accumulated comprehensive income (loss) until such time as the derivative contracts mature where then the gains or losses on the cash flow hedges are classified as cost of revenue and selling general and administrative expenses based on the underlying risk being hedged. See note 2 to our consolidated financial statements and Item 7A—“Quantitative and Qualitative Disclosures about Market Risk—Foreign Currency Risk.”
49
Table of Contents
Approximately 74% of our revenues were earned in U.S. dollars in fiscal 2009. We also received payments in euros, U.K. pounds sterling, Australian dollars, Chinese renminbi, Japanese yen and South African rand. Our costs are primarily in Indian rupees, as well as in U.S. dollars, Chinese renminbi, Romanian leu, euro and the currencies of the other countries in which we have operations. While some of our contracts provide for limited sharing of the risk of inflation and fluctuations in currency exchange rates, we bear a substantial part of this risk, and therefore our operating results could be negatively affected by adverse changes in wage inflation rates and foreign currency exchange rates. See discussion of wage inflation under “—Expenses” above. We enter into forward currency contracts to hedge most of our Indian rupee-U.S. dollar, Mexican peso-U.S. dollar, Philippines peso-U.S. dollar, euro-U.S. dollar, euro- Romanian leu, euro-Hungarian forint, Pound Sterling-U.S. dollar, Australian dollar-U.S. dollar and our Chinese renminbi-Japanese yen currency exposure, which are generally designed to qualify for hedge accounting. However, our ability to hedge such risks is limited by local law, the liquidity of the market for such hedges and other practical considerations. Thus, our results of operations may be adversely affected if we are not able to enter into the desired hedging arrangements or if our hedging strategies are not successful. The realized gain or loss on derivative contracts that qualify for hedge accounting is allocated to cost of revenue and SG&A based on the underlying risk being hedged. The effective portion of the mark to market gains and losses on qualifying hedges is deferred and recorded as a component of accumulated other comprehensive income until the transactions occur and is then recognized in the consolidated statements of income. Our foreign exchange (gains) losses, net, includes the mark to market gain or loss on other derivatives.
Other income (expense). Other income (expense), net consists primarily of interest expense on indebtedness and capital lease obligations. Other income (expense) also includes interest income on intercorporate and other deposits.
Income taxes. We are incorporated in Bermuda and have operations in many countries. Our effective tax rate has varied and will, in the future, vary from year to year based on the tax rate in our jurisdiction of organization, the geographical source of our revenues and the tax rates in those countries, the tax relief and incentives available to us, the financing and tax planning strategies employed by us, changes in tax law or interpretation thereof and movements in our tax reserves, if any.
Bermuda and Luxembourg taxes. Since the 2007 Reorganization, our parent company has been organized in Bermuda. See “—The 2007 Reorganization” below. Bermuda does not impose any income tax on us.
Indian taxes. Under the Indian Income Tax Act, 1961, our Delivery Centers in India, from which we derived approximately 48% of our revenues in fiscal 2009, benefit from a ten-year holiday from Indian corporate income taxes in respect of their export income (as defined in the legislation) under the Software Technology Parks of India (“STPI”) Scheme. As a result of this tax holiday, prior to 2007 we incurred minimal income tax expense with respect to our Indian operations. In the absence of this tax holiday, income derived from our Indian operations would be taxed up to the maximum tax rate generally applicable to Indian enterprises, which, as of December 31, 2009, was 33.99%.
The tax holiday enjoyed by our Delivery Centers in India under the STPI Scheme expires in stages. Our tax holiday partially expired on March 31, 2007 (in respect of approximately 30% of our Indian operations), on March 31, 2008 (in respect of approximately 10% of our Indian operations) and expired on March 31, 2009 (in respect of approximately 30% of our Indian operations), depending in each case on when each Delivery Center commenced operations. The tax holiday in respect of the balance of our Indian operations under the STPI Scheme will expire on March 31, 2011. As the STPI tax holiday expires, our Indian tax expense will materially increase and our after-tax profitability will be materially reduced, unless we can obtain comparable benefits under new legislation or otherwise reduce our tax liability.
The SEZ legislation introduced a separate new 15-year tax holiday scheme for operations established in designated special economic zones, or SEZs. Under the SEZ legislation, qualifying operations are eligible for a deduction from taxable income equal to (i) 100% of their profits or gains derived from the export of services for the first five years from the commencement of operations; (ii) 50% of such profits or gains for the next five years; and (iii) 50% of such profits or gains for a further five years, subject to the creation of a “Special
50
Table of Contents
Economic Zone Re-investment Reserve Account,” to be utilized only for acquiring new plant or machinery, or for other business purposes not including the distribution of dividends. This holiday is available only for new business operations that are conducted at qualifying SEZ locations and is not available to operations formed by splitting up or reconstructing existing operations or transferring existing technology infrastructure to new locations. See Item 1A—“Risk Factors—Over the next few years we will lose certain tax benefits provided by India to companies in our industry and it is not clear whether new tax policies will provide equivalent benefits and incentives.”
During the last 3 years, we established new Delivery Centers that we expect to be eligible for the SEZ benefits. It is not clear, however, what percentage of our operations or income in India is eligible for SEZ benefits, as this will depend on how much of our business can be conducted at the qualifying locations and how much of that business can be considered to meet the restrictive conditions described above. In 2007, we signed agreements with certain developers and local governments to purchase and/or lease qualifying SEZ property. Our first SEZ unit also became operational during 2007 in a leased facility. However, because this is new legislation, there is continuing uncertainty as to the interpretation of the required governmental and regulatory approvals. This uncertainty may delay development of our proposed SEZ locations.
The Government of India may assert that certain of our clients have a “permanent establishment” in India by reason of the activities we perform on their behalf, particularly those clients that exercise control over or have substantial dependency on our services. Such an assertion could affect the size and scope of the services requested by such clients in the future.
Transfer pricing. We have transfer pricing arrangements among our subsidiaries involved in various aspects of our business, including operations, marketing, sales and delivery functions. U.S. and Indian transfer pricing regulations, as well as the regulations applicable in the other countries in which we operate, require that any international transaction involving affiliated enterprises be made on arm’s-length terms. We consider the transactions among our subsidiaries to be substantially on arm’s-length pricing terms. If, however, a tax authority in any jurisdiction reviews any of our tax returns and determines that the transfer prices we have applied are not appropriate, or that other income of our affiliates should be taxed in that jurisdiction, we may incur increased tax liability, including accrued interest and penalties, which would cause our tax expense to increase, possibly materially, thereby reducing our profitability and cash flows.
Other taxes. We have operating subsidiaries in other countries, including China, Hungary, Mexico, Morocco, the Netherlands, the Philippines, Romania, Spain, the United Kingdom, South Africa and the United States, as well as sales and marketing subsidiaries in certain jurisdictions including the United States and the United Kingdom, which are subject to tax in such jurisdictions.
During 2009, one of the Company’s subsidiaries in China obtained a ruling from the Government of China certifying it to be a Technologically Advanced Service Enterprise. That subsidiary is as a result subject to the lower corporate income tax rate of 15% and is entitled to a business tax exemption for a period of 3 years commencing January 1, 2009.
Effective January 1, 2008, the Government of Mexico enacted the IETU tax, or “Flat Tax”. A Presidential Decree was issued in 2007, which mitigates the impact of the Flat Tax on the Maquiladora industry in which we operate in Mexico. The Flat Tax does not currently have a material adverse effect on our financial statements.
Our ability to repatriate surplus earnings from our Delivery Centers in a tax-efficient manner is dependent upon interpretations of local law, possible changes in such laws and the renegotiation of existing double tax avoidance treaties. Changes to any of these may adversely affect our overall tax rate.
Tax audits. Our tax liabilities may also increase, including due to accrued interest and penalties, if the applicable income tax authorities in any jurisdiction, during the course of any audits, were to disagree with any of our tax return positions. Through the period ended December 30, 2004, we have an indemnity from GE for any additional taxes attributable to periods prior to the 2004 Reorganization.
51
Table of Contents
The 2004 Reorganization
As noted above, the 2004 Reorganization was consummated on December 30, 2004, pursuant to which we became an independent company. The 2004 Reorganization has been accounted for under the purchase method under SFAS 141, Business Combinations which resulted in a new basis of accounting. The total purchase consideration was $780 million. The allocation of the total consideration to the fair values of the net assets acquired resulted in goodwill of $485.2 million and intangible assets of $223.5 million. The intangible assets are being amortized over periods ranging from 1-10 years. As a result, for periods after December 31, 2004, we have had, and will continue to have, significant non-cash charges related to the amortization of such intangible assets. See notes 1 and 11 to our consolidated financial statements.
In connection with the 2004 Reorganization, we incurred indebtedness of $180 million, of which $156.9 million was paid to various GE entities to acquire the operations in India, Mexico, China, the United States and elsewhere that then constituted our business.
The 2007 Reorganization
Genpact Limited was incorporated in Bermuda on March 29, 2007 as a subsidiary of GGH with the intent of making it the new holding company of our business. On July 13, 2007, Genpact Limited effectuated a transaction that resulted in the shareholders of GGH exchanging their common shares in GGH for common shares of Genpact Limited, and the shareholders of Genpact Global (Bermuda) Limited, or GGL, exchanging their preferred and common shares in GGL for common shares of Genpact Limited. As a result, Genpact Limited became the owner of all the capital stock of GGL and GGH.
Pursuant to the above transaction, the ownership interests of the shareholders of GGH, including the minority shareholders, were exchanged for shares of Genpact Limited irrespective of whether such shareholders owned equity directly in GGH or indirectly through GGL. Such shareholders acquired the same proportionate economic interest in Genpact Limited as they had in GGH immediately prior to the 2007 Reorganization.
The above legal reorganization of GGH and GGL into the Company has been accounted for as a transfer of net assets or exchange of equity interests between entities under common control. Accordingly, the assets and liabilities transferred are recorded at their carrying value in a manner similar to the as-if pooling of interest accounting. Since the accounts of these entities were stated at their historical amounts for all periods presented, no adjustments were required for purposes of restating the financial statements on a consolidated basis for the current and the prior periods.
The effect of the exchange of common shares of the Company in the 2007 Reorganization with the common shares of GGH has been retrospectively applied to stockholders’ equity and per share amounts in the consolidated financial statements. This retrospective application had no material effect on other amounts. The effect of the exchange of preferred shares in the 2007 Reorganization has been applied to stockholders’ equity and per share amounts in the consolidated financial statements from the effective date of the 2007 Reorganization. The accompanying financial statements reflect the 2007 Reorganization as a change in reporting entity (Genpact Limited) at historical cost for purposes of the rules and regulations of the SEC.
Acquisitions
From time to time we may make acquisitions or engage in other strategic transactions if suitable opportunities arise, and we may use cash, securities or other assets as consideration.
In February 2010, we acquired Symphony Marketing Solutions, Inc., a leading provider of analytics and data management services with domain expertise in the retail, pharmaceutical and consumer packaged goods industries for cash consideration of $29.0 million and acquired short term liabilities of $5.4 million.
52
Table of Contents
In January 2010, we finalized an arrangement with Walgreens, the largest drug store chain in the U.S., to acquire a delivery center in Danville, Illinois for cash consideration of $16.3 million. At the same time, we entered into a ten year MSA with Walgreens. Pursuant to the terms of the MSA, approximately 500 Walgreens accounting employees in Danville will be transferred to Genpact.
In December 2007, we acquired Axis Risk Consulting Services Private Limited, a risk consulting firm providing a variety of risk assurance services, for cash consideration of Indian rupees 178,441,778 (approximately $4.5 million) and 143,453 common shares of the Company. As at December 31, 2009, Genpact has the right to repurchase 47,306 of the common shares issued as part of the purchase consideration at $1 per share if any of the Axis sellers now employed by Genpact cease to be Genpact employees at any time prior to March 31, 2011. The total purchase consideration amounted to $5.3 million including acquisition related expenses and cash acquired.
In March 2007, we acquired E-Transparent B.V. and certain related entities, which are controlling partners in a partnership known as ICE, a SAP enterprise solution provider, for cash consideration of euro 11.7 million (approximately $15.4 million) and 1,442,316 common shares of the Company with an estimated fair value as of March 2007 of $23.3 million. The total purchase consideration amounted to $45.3 million including acquisition related expenses and cash acquired. Certain partners, which we refer to as the Continuing Partners, retained an equity interest in ICE. As a result there is a noncontrolling interest in our income statement commencing with the first quarter of 2007, the size of which varies from period to period depending on the contribution of ICE to our results as well as the portion of the ICE business that relates to the Continuing Partners’ activities. In connection with the ICE transaction we were obligated to pay the sellers of E-Transparent B.V. and related entities an additional cash amount in 2009 not to exceed euro 15.6 million if certain profitability targets were met. As a result of the profitability targets being achieved, we paid additional consideration of euro 15.6 million (approximately $23.5 million) to the sellers of ICE on February 16, 2009.
In August 2006, we acquired MoneyLine Lending Services, Inc. (now called Genpact Mortgage Services), a provider of mortgage origination and fulfillment services, for cash consideration of approximately $14.3 million. The sale agreement with the sellers of Genpact Mortgage Services provides that an additional cash amount, not to exceed $10 million, is payable in 2008 if certain revenue and profitability targets are met. In November 2008, we agreed to pay $150,000 to the sellers of Genpact Mortgage Services in satisfaction of the earn-out provision and all other potential matters. In August 2005, we acquired all the outstanding capital stock of Creditek Corporation, which provided us with an order-to-cash and receivables management business, for cash consideration of approximately $14.4 million.
All acquisitions completed prior to December 31, 2008 were accounted for under the purchase method of accounting and, accordingly, the results of operations of these acquisitions are reflected in our financial statements from the respective dates of acquisition.
Critical Accounting Policies and Estimates
The discussion and analysis of our financial condition and results of operations are based upon the financial statements included in this Annual Report on Form 10-K, which have been prepared in accordance with U.S. GAAP. The notes to the financial statements contain a summary of our significant accounting policies. Set forth below are our critical accounting policies under U.S. GAAP.
Revenue recognition. As discussed previously, we derive revenues from our services which are provided on a time and materials, transaction based and a fixed-price basis. Revenues derived from time-and-materials and transaction based contracts are recognized as the related services are performed. In the case of fixed-price contracts, including those for application maintenance and support services, revenues are recognized ratably over the term of the contracts. Revenues with respect to fixed-price contracts for development of software are recognized on a percentage of completion method. Guidance has been drawn from FASB guidelines on Software —Revenue Recognition (previously referred to in paragraph 95 of the American Institute of Certified Public
53
Table of Contents
Accountants (“AICPA”) Statement of Position (“SOP”) 97-2, Software Revenue Recognition), to account for revenue from fixed price arrangements for software development and related services in conformity with FASB guidance on Revenue Recognition—Construction—Type and Production-Type Contracts (previously referred to as SOP 81-1, “Accounting for Performance of Construction-Type and Certain Production-Type Contracts”). The input (effort expended) method has been used to measure progress towards completion because management considers this to be the best available measure of progress on these contracts as there is a direct relation between input and productivity. Provisions for estimated losses, if any, on uncompleted contracts are recorded in the period in which such losses become probable based on the current contract estimates.
For our time and materials and transaction based contracts, we recognize revenue from services when persuasive evidence of an arrangement exists; the sales price is fixed or determinable; and collectability is reasonably assured. If we receive a cash payment in respect of services prior to the time a contract is signed, we recognize this as an advance from a client until such time as the contract is signed, it becomes revenue to the extent the services are rendered.
Some customer contracts can also include incentive payments for benefits delivered to clients. Revenues relating to such incentive payments are recorded when the contingency is satisfied and we conclude that the amounts are earned.
We defer the revenues that are for the transition of services to our Delivery Centers (which revenues may include reimbursement of transition costs) and the related costs over the period in which the applicable service delivery is expected to be performed, which is currently estimated to be three years. Further, the deferred costs are limited to the amount of the deferred revenues. Revenues are reported net of value-added tax, business tax and applicable discounts and allowances. Reimbursements of out-of-pocket expenses received from clients have been included as part of revenues.
Our accounts receivable include amounts for services that we have performed and for which an invoice has not yet been issued to the client. We follow a 30-day billing cycle and, as such, there may be at any point in time up to 30 days of revenues which we have accrued but not yet billed. These are disclosed as part of accounts receivable.
Business combinations, goodwill and other intangible assets. We account for business combinations by recognizing the identifiable tangible and intangible assets and liabilities assumed, and any noncontrolling interest in the acquired business, measured at their acquisition date fair values. All assets and liabilities of the acquired businesses, including goodwill, are assigned to reporting units.
Goodwill represents the cost of the acquired businesses in excess of the fair value of identifiable tangible and intangible net assets purchased. Goodwill is not amortized but is tested for impairment at least on an annual basis on September 30, based on a number of factors including operating results, business plans and future cash flows. Recoverability of goodwill is evaluated using a two-step process. The first step involves a comparison of the fair value of a reporting unit with its carrying value. If the carrying amount of the reporting unit exceeds its fair value, the second step of the process involves a comparison of the fair value and carrying value of the goodwill of that reporting unit. If the carrying value of the goodwill of a reporting unit exceeds the fair value of that goodwill, an impairment loss is recognized in an amount equal to the excess. Goodwill of a reporting unit will be tested for impairment between annual tests if an event occurs or circumstances change that would more likely than not reduce the fair value of the reporting unit below its carrying amount.
Intangible assets acquired individually, or with a group of other assets in a business combination, are carried at a cost less accumulated amortization based on their estimated useful lives as follows:
| Customer-related intangible assets |
3–10 years | |
| Marketing-related intangible assets |
1–5 years | |
| Contract-related intangible assets |
1 year | |
| Other intangible assets |
3 years |
54
Table of Contents
Intangible assets are amortized over their estimated useful lives using a method of amortization that reflects the pattern in which the economic benefits of the intangible assets are consumed or otherwise realized.
Derivative instruments and hedging activities. We enter into forward foreign exchange contracts to mitigate the risk of changes in foreign exchange rates on inter-company transactions and forecasted transactions denominated in foreign currencies and interest rate risk. Certain of these transactions meet the criteria for hedge accounting as cash flow hedges under FASB guidance on Derivatives and Hedging.
With respect to derivatives designated as cash flow hedges, we formally document all relationships between hedging instruments and hedged items, as well as its risk management objectives and strategy for undertaking various hedge transactions. In addition, we formally assess both at the inception of the hedge and on a quarterly basis, whether each derivative is highly effective in offsetting changes in fair values or cash flows of the hedged item. If it is determined that a derivative or a portion thereof is not highly effective as a hedge, or if a derivative ceases to be a highly effective hedge, we will prospectively discontinue hedge accounting with respect to that derivative.
We recognize derivative instruments and hedging activities as either assets or liabilities in our consolidated balance sheets and measure them at fair value. Changes in the fair values of these hedges are deferred and recorded as a component of accumulated other comprehensive income (losses), net of tax until the hedged transactions occur and are then recognized in the statement of income along with the underlying hedged item and disclosed as part of “Total net revenues”, “Cost of revenue” and “Selling, general and administrative expenses”, as applicable. Changes in the fair value for other derivative contracts and the ineffective portion of hedging instruments are recognized in the statement of income of each period and are included in foreign exchange (gains) losses, net and other income (expense), net, respectively.
We value our derivatives based on market observable inputs including both forward and spot prices for currencies. Derivative assets and liabilities included in Level 2 primarily represent foreign currency forward contracts. The quotes are taken from multiple independent sources including financial institutions.
In all situations in which hedge accounting is discontinued and the derivative is retained, we continue to carry the derivative at its fair value on the balance sheet and recognize any subsequent change in its fair value in the consolidated statement of income. When it is probable that a forecasted transaction will not occur, we discontinue the hedge accounting and recognize immediately in the consolidated statement of income the gains and losses attributable to such derivative that were accumulated in other comprehensive income (loss).
Income taxes. We account for income taxes using the asset and liability method of accounting for income taxes. Under this method, income tax expense is recognized for the amount of taxes payable or refundable for the current year. In addition, deferred tax assets and liabilities are recognized for future tax consequences attributable to differences between the financial statements carrying amounts of existing assets and liabilities and their tax bases and operating losses carried forward, if any. Deferred tax assets and liabilities are measured using enacted tax rates expected to apply to taxable income in the years in which those temporary differences are expected to be recovered or settled. The effect on deferred tax assets and liabilities of a change in tax rates is recognized in income in the period that includes the enactment date or the filing/ approval date of the tax status change. Deferred tax assets are recognized in full, subject to a valuation allowance that reduces the amount recognized to that which is more likely than not to be realized. In assessing the likelihood of realization, we consider estimates of future taxable income. In the case of an entity which benefits from a corporate tax holiday, deferred tax assets or liabilities for existing temporary differences are recorded only to the extent such temporary differences are expected to reverse after the expiration of the tax holiday.
We also evaluate potential exposures related to tax contingencies or claims made by the tax authorities in various jurisdictions and determine if a reserve is required. A reserve is recorded if we believe that a loss is more likely than not and the amount can be reasonably estimated. These reserves are based on estimates and subject to changing facts and circumstances considering the progress of ongoing audits, case laws and new legislation. We believe that the reserves established are adequate in relation to any possible additional tax assessments.
55
Table of Contents
We plan to indefinitely reinvest the undistributed earnings of foreign subsidiaries or have the ability to repatriate in a tax-free manner and, accordingly, do not accrue any income, distribution or withholding taxes that would arise if such earnings were repatriated.
On January 1, 2007, we modified our policies for accounting for uncertain tax positions. We apply a two-step approach for recognizing and measuring uncertain tax positions. The first step is to evaluate the tax position for recognition by determining, based on the technical merits, that the position will be more likely than not sustained upon examination. The second step is to measure the tax benefit as the largest amount of the tax benefit that is greater than 50% likely of being realized upon settlement. We also include interest and penalties related to unrecognized tax benefits within our provision for income tax expense.
Retirement benefits. Contributions to defined contribution plans are charged to consolidated statements of income in the period in which services are rendered by the covered employees. Current service costs for defined benefit plans are accrued in the period to which they relate. The liability in respect of defined benefit plans is calculated annually using the projected unit credit method. Prior service cost, if any, resulting from an amendment to a plan is recognized and amortized over the remaining period of service of the covered employees. We recognize the liabilities for compensated absences dependent on whether the obligation is attributable to employee services already rendered, relates to rights that vest or accumulate and payment is probable and estimable.
Share-Based compensation expense. Effective January 1, 2006, we adopted fair value accounting for our share based compensation plan following the prospective transition method. We recognize and measure compensation expense for all share-based awards based on the grant date fair value determined under the option pricing model (Black-Scholes model) of those awards. We recognize compensation expense for stock options net of estimated forfeitures. Stock-based compensation recognized in the consolidated statement of income for the years ended December 31, 2007, 2008 and 2009 is based on awards ultimately expected to vest. As a result the expense has been reduced for estimated forfeitures. Forfeitures are estimated at the time of grant and revised, if necessary, in subsequent periods if actual forfeitures differ from those estimates.
Prior to adoption of fair value accounting, we followed the minimum value method to account for our share-based awards. Under this method, compensation expense was recorded on the date of grant if the fair value of the underlying stock on the date of grant exceeded the present value of the exercise price of the stock options on the date of grant. We amortize the cost using the accelerated method of cost recognition. As required under the prospective transition method, for the portion of awards outstanding at the date of initial application of the fair value method, we continue to apply the minimum value method. For awards granted after the adoption of fair value method, we elected to amortize the compensation cost on a straight-line basis over the vesting period.
56
Table of Contents
Results of Operations
The following table sets forth certain data from our income statement in absolute amounts and as a percentage of net revenues for the years ended December 31, 2007, 2008, and 2009.
| Year ended December 31, | |||||||||||||||||||||
| 2007 | 2008 | 2009 | |||||||||||||||||||
| (dollars in millions) | |||||||||||||||||||||
| Net revenues—GE |
$ | 481.3 | 58.5 | % | $ | 490.2 | 47.1 | % | $ | 451.3 | 40.3 | % | |||||||||
| Net revenues—Global Clients |
340.4 | 41.4 | % | 550.6 | 52.9 | % | 668.7 | 59.7 | % | ||||||||||||
| Other revenues |
1.5 | — | 0.1 | — | — | ||||||||||||||||
| Total net revenues |
823.2 | 100.0 | % | 1,040.8 | 100.0 | % | 1,120.1 | 100.0 | % | ||||||||||||
| Cost of revenue—Services |
481.8 | 58.5 | % | 619.2 | 59.5 | % | 672.6 | 60.1 | % | ||||||||||||
| —Others |
1.1 | 0.1 | — | — | — | — | |||||||||||||||
| Gross profit |
340.2 | 41.3 | % | 421.6 | 40.5 | % | 447.4 | 39.9 | % | ||||||||||||
| Operating expenses |
|||||||||||||||||||||
| Selling, general and administrative expenses |
218.2 | 26.5 | % | 254.5 | 24.5 | % | 265.4 | 23.7 | % | ||||||||||||
| Amortization of acquired intangible assets |
36.9 | 4.5 | % | 36.5 | 3.5 | % | 26.0 | 2.3 | % | ||||||||||||
| Other operating expense |
(4.3 | ) | 0.5 | % | (3.1 | ) | 0.3 | % | (6.1 | ) | 0.5 | % | |||||||||
| Income from operations |
89.3 | 10.9 | % | 133.7 | 12.8 | % | 162.2 | 14.5 | % | ||||||||||||
| Foreign exchange (gains) losses, net |
2.5 | 0.3 | % | (4.1 | ) | 0.4 | % | 5.5 | 0.5 | % | |||||||||||
| Other income (expense), net |
(5.2 | ) | 0.6 | % | 6.5 | 0.6 | % | 4.4 | 0.4 | % | |||||||||||
| Income before share of equity in (earning) loss of affiliate, noncontrolling interest and income tax expense |
81.6 | 9.9 | % | 144.3 | 13.9 | % | 161.1 | 14.4 | % | ||||||||||||
| Equity in loss of affiliate |
0.3 | 0.0 | % | 0.9 | 0.1 | % | 0.7 | 0.1 | % | ||||||||||||
| Income before income tax expense |
81.4 | 9.9 | % | 143.4 | 13.8 | % | 160.4 | 14.3 | % | ||||||||||||
| Income tax expense |
16.5 | 2.0 | % | 8.8 | 0.8 | % | 25.5 | 2.3 | % | ||||||||||||
| Net Income |
64.8 | 7.9 | % | 134.6 | 12.9 | % | 135.0 | 12.0 | % | ||||||||||||
| Net income attributable to noncontrolling interest |
8.4 | 1.0 | 9.5 | 0.9 | 7.7 | 0.7 | |||||||||||||||
| Net income attributable to Genpact Limited shareholders |
$ | 56.4 | 6.9 | % | $ | 125.1 | 12.0 | % | $ | 127.3 | 11.4 | % | |||||||||
| Net income available to Genpact Limited common shareholders |
$ | 17.3 | $ | 125.1 | $ | 127.3 | |||||||||||||||
Fiscal Year Ended December 31, 2009 Compared to Fiscal Year Ended December 31, 2008
Net revenues. Our net revenues increased by $79.2 million, or 7.6%, in 2009 compared to 2008. Approximately 47% of the increase in our net revenues in 2009 came from client relationships that began prior to 2009. Our total headcount increased by 6.6% to approximately 38,600 at the end of 2009 from approximately 36,200 at the end of 2008. In addition, our net revenue per employee increased to $31.2 thousand in 2009 up from $30.8 thousand in 2008 due to increased volumes of more expensive service offerings including re-engineering and more effective deployment and utilization of personnel. Our net revenue increase was partly offset by the weakening of the pound sterling and the Australian dollar against the U.S. dollar, as a portion of our revenues are received in such currencies.
Revenues from business process management services increased to 84.0% of total net revenues in 2009 from 80.0% in 2008. Our business process management business grew 12.9% to $940.4 million in 2009, led by growth of 23% from Global Clients. Revenues from our information technology business declined to 16.0% of total net revenues in 2009 compared to 20.0% in 2008 primarily due to reduced information technology revenues coming from GE resulting from the general slow-down in the information technology sector.
57
Table of Contents
Net revenues from GE decreased by $38.8 million, or 7.9%, due to volume and price reductions in certain existing SOWs and non-renewals on some discretionary projects, primarily in the IT business as well as the weakening of the pound sterling and the Australian dollar against the U.S. dollar, as a portion of our GE revenues are received in such currencies. As described under “Management’s Discussion and Analysis of Financial Condition and Results of Operation—Overview—Classification of Certain Net Revenues” certain businesses in which GE ceased to be a 20% shareholder in 2008 were classified as GE net revenues for part of the year until the divesture by GE and as Global Clients net revenues after the divesture by GE. GE revenues for 2009 declined by 2.8% over 2008 after the adjustments for such dispositions by GE. GE net revenues declined as a percentage of our total net revenues from 47.1% in 2008 to 40.3% in 2009.
Net revenues from Global Clients increased by $118.1 million, or 21.4%. This increase was driven by expansion with Global Clients in the banking and financial services industries for whom we primarily provide finance and accounting services. This increase was partially offset by price reductions and volume contractions in certain existing SOWs. Revenue growth was also partially offset by the weakening of the pound sterling and Australian dollar against the U.S. dollar, as a portion of our Global Clients revenues are received in such currencies. Net revenues for 2009 also included $4.0 million received from one of our Global Clients related to cancellations. In addition, a portion of the increase in net revenues from Global Clients was also related to GE ceasing to be a 20% shareholder in certain businesses and the reclassification of related net revenues, as described above. As a percentage of total net revenues, net revenues from Global Clients increased from 52.9% in 2008 to 59.7% in 2009. Excluding revenues from businesses divested by GE in 2009, Global Client revenues increased organically by approximately 16.0%.
Cost of revenue. The following table sets forth the components of our cost of revenue in absolute amounts and as a percentage of net revenues:
| Year ended December 31, | ||||||||||||
| 2008 | 2009 | |||||||||||
| (dollars in millions) | ||||||||||||
| Personnel expenses |
$ | 379.9 | 36.5 | % | $ | 405.6 | 36.2 | % | ||||
| Operational expenses |
196.7 | 18.9 | 220.5 | 19.7 | ||||||||
| Depreciation and amortization |
42.7 | 4.1 | 46.5 | 4.1 | ||||||||
| Cost of revenue |
$ | 619.2 | 59.5 | % | $ | 672.6 | 60.1 | % | ||||
Cost of revenue increased by $53.4 million, or 8.6%. This increase reflected the general growth of our business. This increase was primarily due to an increase in operational expenses, and depreciation and amortization, relating to the opening of new Delivery Centers in South Africa, expansion of Delivery Centers in Guatemala and India, and the general increase in operational expenses due to increased headcount. As a percentage of net revenues, cost of revenue increased from 59.5% in 2008 to 60.1% in 2009 as a result of the foregoing factors, as well as price reductions in our information technology business and the weakening of the pound sterling and the Australian dollar against the U.S. dollar, as a portion of our revenues are received in such currencies.
The largest component of the increase in cost of revenue was personnel expenses, which increased by $25.8 million, or 6.8%. Such increase reflected the general growth of our business. This increase in absolute amount was primarily due to the hiring of new resources to manage growth. Our total headcount increased by approximately 2,400 employees during 2009, the majority of whom have client service responsibilities and are generating revenue. The increase also reflects overall wage inflation, although the rate at which salaries are increasing remains lower than it was in 2008. Personnel expenses as a percentage of net revenues marginally decreased from 36.5% in 2008 to 36.2% in 2009, primarily due to more effective deployment and utilization of supervisory personnel offset substantially by higher compensation costs due to wage inflation.
Operational expenses increased by $23.9 million, or 12.1%. The increase was largely due to expansion of existing Delivery Centers in 2009 in India (Gurgaon and Hyderabad), China, Morocco, Guatemala and the
58
Table of Contents
Philippines to support growth. This increase was also attributable to the addition of new Delivery Centers in South Africa in the third quarter of 2009. As a result, as a percentage of net revenues, operational expenses increased from 18.9% in 2008 to 19.7% in 2009.
Depreciation and amortization expenses as a component of cost of revenue increased by $3.7 million to $46.5 million in 2009. The increase was largely due to expansion of existing Delivery Centers in 2009 in India (Gurgaon and Hyderabad), China, Morocco, Guatemala and the Philippines to support growth, and to the general growth of our businesses, partially offset by a $3.3 million charge in the first quarter of 2008 attributable to the write-off of certain software licenses that did not have any further useful life.
As a result of the foregoing, though gross profit increased by $25.8 million, or 6.1%, our gross margin decreased marginally from 40.5% in 2008 to 39.9% in 2009.
Selling, general and administrative expenses. The following table sets forth the components of our selling, general and administrative expenses in absolute amounts and as a percentage of net revenues:
| Year ended December 31, | ||||||||||||
| 2008 | 2009 | |||||||||||
| (dollars in millions) | ||||||||||||
| Personnel expenses |
$ | 166.4 | 16.0 | % | $ | 178.8 | 16.0 | % | ||||
| Operational expenses |
77.0 | 7.4 | 76.0 | 6.8 | ||||||||
| Depreciation and amortization |
11.2 | 1.1 | 10.6 | 0.9 | ||||||||
| Selling, general and administrative expenses |
$ | 254.5 | 24.5 | % | $ | 265.4 | 23.7 | % | ||||
Selling, general and administrative expenses, or SG&A expenses, increased by $10.9 million, or 4.3%. This was primarily due to an increase in personnel expenses in our business development team due to recent new hires as well as marketing costs relating to the strengthening of our brand and investment in SEPSM partially offset by cost reduction measures, such as restrictions on travel, recruitment, management meeting expenses, reduction in leadership training expenses as well effective utilization and deployment of the support personnel. We increased our business development team to 115 people in 2009 from 94 in 2008. Many of the new hires are highly experienced, senior resources. As a percentage of net revenues, SG&A expenses decreased from 24.5% in 2008 to 23.7% in 2009.
Personnel expenses increased by $12.4 million, or 7.5%. This increase is primarily due to increased headcount in our business development team due to recent new hires as well as general wage inflation and higher share-based compensation expenses. This increase was partially offset by lower personnel cost relating to employees resident in India due to the abolishment of the fringe benefit tax, or FBT, on employee share options by the Indian Government in the third quarter of 2009. The impact of this abolishment resulted in lower FBT expense of $2.6 million in 2009 as compared to 2008. As a percentage of net revenues, personnel expenses remained constant at 16.0% in 2009 as compared to 2008 primarily due to increased internal efficiencies through effective utilization of existing resources partially offset by a higher charge of $16.6 million in 2009 compared to $16.3 million in 2008 for share-based compensation.
The operational expenses component of SG&A expenses decreased by $0.9 million, or 1.2%. This decrease is attributable to our reducing the number of support personnel as explained above in 2009 compared to 2008 and consequent reduced allocation to SG&A. This decrease was substantially offset by increased business development costs, digitization and brand strengthening. As a percentage of net revenues, such costs decreased from 7.4% in 2008 to 6.8% in 2009.
Depreciation and amortization expenses as a component of SG&A expenses decreased by $0.6 million to $10.6 million in 2009. This decrease in depreciation and amortization expenses is due to the reduced number of support personnel in 2009 compared to 2008 and consequent reduced allocation to SG&A partially offset by an increase in depreciation expense due to higher capital expenditure incurred for expansion of existing Delivery Centers over the last twelve months. As a percentage of net revenues, depreciation and amortization expenses were 1.1% in 2008 and 0.9% in 2009.
59
Table of Contents
Amortization of acquired intangibles. In 2008 and 2009, we continued to incur significant non-cash charges of $36.5 million and $26.0 million, respectively, consisting primarily of the amortization of acquired intangibles resulting from the 2004 Reorganization, consistent with the amortization schedule. These intangibles are evaluated for impairment at each period end, and to date, no impairments have been noted.
Other operating (income) expense, net. Other operating income, which primarily consists of income from shared services from GE for the use of our Delivery Centers and certain support functions that they manage and operate with their own employees, increased by $3.0 million in 2009 primarily due to a loss of $2.3 million incurred in connection with the sale of certain software licenses and the sale of a facility in the second quarter of 2008. We do not recognize this income as net revenues because it is not currently one of our primary service offerings; however, our costs are included in cost of revenue and SG&A.
Income from operations. Primarily due to the decrease in SG&A expenses and amortization of acquired intangibles as a percentage of net revenue, income from operations increased by $28.5 million to $162.2 million in 2009. As a percentage of net revenues, income from operations increased from 12.8% in 2008 to 14.5% in 2009.
Foreign exchange (gains) losses, net. We recorded a foreign exchange loss of $5.5 million for 2009 compared to a gain of $4.1 million in 2008. During 2009, a loss amounting to $11.7 million was reclassified from accumulated other comprehensive income (loss) to earnings as part of foreign exchange (gains) losses, net, as a result of the discontinuance of certain cash flow hedges. It was determined that certain hedges were ineffective because the underlying forecasted revenues were not likely to materialize as a result of lower than forecasted volumes and pricing resulting from the current economic environment. Accordingly, the hedge accounting for such cash flow hedges was discontinued. After excluding the above mentioned loss on ineffective hedges, the remaining gain of $6.2 million primarily relates to the net impact of re-measurement of our non-functional currency assets and liabilities resulting from movements in the Indian rupee and U.S. dollar exchange rates in 2009.
Other income (expense), net. We recorded other income, net of interest expense, of $4.4 million in 2009 compared to a net income of $6.5 million in 2008. The change was driven by lower interest income of $7.4 million primarily due to investment in U.S. Treasury bills yielding lower return in 2009 compared to investment in higher interest bearing bank deposits in 2008, in line with the Company’s investment strategy in the current economic environment and a decrease in interest expense by $4.1 million primarily due to repayment of a portion of a long-term loan during 2009. In addition, the weighted average rate of interest with respect to outstanding long-term loans under our credit facility was reduced from 4.3% in 2008 to 1.7% in 2009.
Income before share of equity in loss of affiliate, noncontrolling interest and income taxes. As a result of the foregoing factors, income before income taxes increased by $16.8 million or from 13.9% of net revenues in 2008 to 14.4% of net revenues in 2009.
Equity in loss of affiliate. This represents our share of loss from our non-consolidated affiliates, NGEN Media Services Private Limited, a joint venture with NDTV Networks Plc. and NIIT Uniqua, a joint venture with NIIT, one of the largest training institutes in Asia.
Income before income tax expense. As a result of the foregoing factors, income before income taxes increased by $17.0 million or from 13.8% of net revenues in 2008 to 14.3% of net revenues in 2009.
Income taxes. Our income tax expense increased from $8.8 million in 2008 to $25.5 million for 2009. This increase was primarily attributable to the partial expiration of our tax holiday in India as of March 31, 2009. In 2008, we also had certain non-recurring tax benefits that lowered our tax rate for that year such as (i) a $2.5 million reversal of prior period tax provisions following a favorable ruling from tax authorities in India in the first quarter of 2008 and (ii) tax benefits related to equity based compensation.
Net income. As a result of the foregoing factors, net income increased by $0.4 million from $134.6 million in 2008 to $135.0 million in 2009. As a percentage of net revenues, our net income was 12.9% in 2008 and 12.0 in 2009.
60
Table of Contents
Net income attributable to noncontrolling interest. The noncontrolling interest is due to the acquisition of ICE in 2007. It represents the apportionment of profits to the minority partners of ICE. The net income attributable to noncontrolling interest decreased from $9.5 million in 2008 to $7.7 million in 2009 consistent with the reduction in the number of noncontrolling partners and reduced revenue attributable to noncontrolling partners.
Net income attributable to Genpact Limited common shareholders. As a result of the foregoing factors, net income attributable to Genpact Limited common shareholders increased by $2.2 million from $125.1 million in 2008 to $127.3 million in 2009. As a percentage of net revenues, our net income was 12.0% in 2008 and 11.4% in 2009.
Fiscal Year Ended December 31, 2008 Compared to Fiscal Year Ended December 31, 2007
Net revenues. Our net revenues increased by $217.7 million, or 26.4%, in 2008 compared to 2007. We continue to grow our net revenues primarily through expanding relationships with existing clients. Approximately 85% of the increase in our net revenues came from existing client relationships during 2008. Net revenues also increased because of the acquisition of Axis in the fourth quarter of 2007. In addition, our net revenue per employee increased to $30.8 thousand in 2008 up from $28.2 thousand in 2007 due to increased volumes of more expensive service offerings including re-engineering, an increase in the number of revenue generating personnel compared to support personnel, increased price and favorable exchange rates for translating non-U.S. dollar revenues to U.S. dollars.
Revenues from business process services increased to 80.0% of total net revenues in 2008 from 75.5% in 2007. Our business process services business grew 34.0% to $833.0 million in 2008, primarily due to high growth with several existing clients. Revenues from our information technology business declined to 20.0% of total net revenues in 2008 compared to 24.5% in 2007 due to a general slow down in the information technology sector, attributable to decline in information technology budgets and lower discretionary information technology spends.
Net revenues from GE increased by $8.9 million, or 1.8%, due to higher revenues from GE’s infrastructure and commercial finance business. As described under “Management’s Discussion and Analysis of Financial Condition and Results of Operation—Overview—Classification of Certain Net Revenues” certain businesses in which GE ceased to be a 20% shareholder in 2008 were classified as GE net revenues for part of the year until the divesture by GE and as Global Clients net revenues after the divesture by GE. GE revenues for 2008 grew by 7.5% over 2007 after the adjustments for such dispositions by GE. GE net revenues declined as a percentage of our total net revenues from 58.5% in 2007 to 47.1% in 2008, due to growth in revenues from our Global Clients.
Net revenues from Global Clients increased by $210.2 million, or 61.8%. This increase resulted from revenues from several new clients with which we entered into master service agreements, or MSAs, in 2005, 2006, 2007 and 2008. A portion of the increase in net revenues from Global Clients was also related to GE ceasing to be a 20% shareholder in certain businesses and the reclassification of related net revenues, as described above. As a percentage of total net revenues, net revenues from Global Clients increased from 41.4% in 2007 to 52.9% in 2008. Excluding revenues from businesses divested by GE in 2008, Global Client revenues increased organically by approximately 59.6%.
Cost of revenue. The following table sets forth the components of our cost of revenue in absolute amounts and as a percentage of net revenues:
| Year ended December 31, | ||||||||||||
| 2007 | 2008 | |||||||||||
| (dollars in millions) | ||||||||||||
| Personnel expenses |
$ | 301.1 | 36.6 | % | $ | 379.9 | 36.5 | % | ||||
| Operational expenses |
147.1 | 17.9 | 196.7 | 18.9 | ||||||||
| Depreciation and amortization |
34.8 | 4.2 | 42.7 | 4.1 | ||||||||
| Cost of revenue |
$ | 482.9 | 58.7 | % | $ | 619.2 | 59.5 | % | ||||
61
Table of Contents
Cost of revenue increased by $136.3 million, or 28.2%. As a percentage of net revenues, cost of revenue increased marginally by 0.8%. This increase is primarily due to an increase in the operational expenses and the general growth of our business.
The largest component of the increase in cost of revenue was personnel expenses, which increased by $78.8 million, or 26.2%. Such increase reflected the general growth of our business. We added more than 3,500 employees during 2008, the majority of whom are directly working for our clients and generating revenue. The increase also reflects overall wage inflation. Personnel expenses as a percentage of net revenues marginally decreased from 36.6% in 2007 to 36.5% in 2008, primarily due to better utilization of our supervisory personnel offset substantially by higher compensation costs due to wage inflation.
Operational expenses increased by $49.5 million, or 33.7%. The increase was largely due to expansion of existing Delivery Centers over the last twelve months in India (Kolkata, Gurgaon, Hyderabad and Mumbai), Poland, Romania, China and the Philippines. This increase was also attributable to the addition of new Delivery Centers in Morocco and Poland and the opening of our Delivery Center in Guatemala through acquisition of assets from GE in the third quarter of 2008. In addition, we received a subsidy from the Hungarian government in the third quarter of 2007 for meeting certain employment and training criterion, which reduced operational expenses. As a result, as a percentage of net revenues, operational expenses increased from 17.9% in 2007 to 18.9% in 2008.
Depreciation and amortization expenses as a component of cost of revenue increased by $7.9 million to $42.7 million in 2008. This increase relates to a write-off in the first quarter of 2008 of certain software licenses amounting to $3.3 million that do not have any further useful life, which were subsequently disposed of in the second quarter of 2008, and to the general growth of our businesses. This increase was partially off-set by certain assets related to 2004 Reorganization being fully depreciated in 2007.
As a result of the foregoing, though gross profit increased by $81.4 million, or 23.9%, our gross margin decreased from 41.3% in 2007 to 40.5% in 2008.
Selling, general and administrative expenses. The following table sets forth the components of our selling, general and administrative expenses in absolute amounts and as a percentage of net revenues:
| Year ended December 31, | ||||||||||||
| 2007 | 2008 | |||||||||||
| (dollars in millions) | ||||||||||||
| Personnel expenses |
$ | 142.4 | 17.3 | % | $ | 166.4 | 16.0 | % | ||||
| Operational expenses |
66.5 | 8.1 | 77.0 | 7.4 | ||||||||
| Depreciation and amortization |
9.3 | 1.1 | 11.2 | 1.1 | ||||||||
| Selling, general and administrative expenses |
$ | 218.2 | 26.5 | % | $ | 254.5 | 24.5 | % | ||||
Selling, general and administrative expenses, or SG&A expenses, increased by $36.3 million, or 16.6%. This was primarily due to an increase in operational expenses and depreciation and amortization. This increase reflects general growth in our business. As a percentage of net revenues, SG&A expenses decreased from 26.5% in 2007 to 24.5% in 2008.
Personnel expenses increased by $24.0 million, or 16.9%. This increase reflects the general growth in our business, higher share-based compensation expenses and an increase in the number of higher cost senior employees in certain of our internal functions as well as general wage inflation. As a percentage of net revenues, personnel expenses decreased from 17.3% in 2007 to 16.0% in 2008 primarily due to increased internal efficiencies through effective utilization of existing resources partially offset by a higher charge of $16.3 million in 2008 compared to $12.7 million in 2007 for share-based compensation. In addition, there was a charge of $2.6 million in 2008 compared to $0.5 in 2007 for the Indian fringe benefit tax on share based-compensation, which has generally been recovered from employees and accounted for under shareholders’ equity.
62
Table of Contents
The operational expenses component of SG&A expenses increased by $10.4 million, or 15.7%. As a percentage of net revenues, such costs decreased from 8.1% in 2007 to 7.4% in 2008. In addition to the general growth in our business, the absolute increase reflected increases in facilities maintenance expenses and communications expenses to support growth, as well as expenses incurred in relation to our annual management and client conference.
Depreciation and amortization expenses as a component of SG&A expenses increased by $1.9 million to $11.2 million in 2008. As a percentage of net revenues, depreciation and amortization expenses were 1.1% in 2007 and 2008. This increase in absolute amount in depreciation and amortization expenses reflects the general growth of our business.
Amortization of acquired intangibles. In 2008, we continued to incur significant non-cash charges consisting primarily of the amortization of acquired intangibles resulting from the 2004 Reorganization. Such charges decreased marginally by $0.4 million compared to 2007, primarily due to changes in currency exchange rates. These intangibles are evaluated for impairment at each period end, and to date, no impairments have been noted.
Other operating (income) expense, net. Other operating income, which primarily consists of income from shared services from GE for the use of our Delivery Centers and certain support functions that they manage and operate with their own employees, decreased by $1.1 million in 2008. We do not recognize this income as net revenues because it is not currently one of our primary service offerings; however, our costs are included in cost of revenue and SG&A. Income from shared services increased by $1.2 million compared to 2007 due to the acquisition of a Delivery Center in Guatemala from GE and expansion in the Philippines. This increase was off-set by one-time losses of $2.3 million incurred in connection with the sale of certain software licenses and the sale of a facility in Mexico in the second quarter of 2008.
Income from operations. Primarily due to the decrease in SG&A expenses and amortization of acquired intangibles as a percentage of net revenue, income from operations increased by $44.4 million to $133.7 million in 2008. As a percentage of net revenues, income from operations increased from 10.9% in 2007 to 12.8% in 2008.
Foreign exchange (gains) losses, net. We recorded a foreign exchange gain of $4.1 million for 2008 compared to a loss of $2.5 million in 2007. This gain primarily relates to the re-measurement of our non-functional currency assets and liabilities due to significant depreciation of the Indian rupee and other currencies against the U.S. dollar in 2008.
Other income (expense), net. We recorded other income, net of interest expense, of $6.5 million in 2008 compared to a net expense of $5.2 million in 2007. The change was driven by higher interest income of $14.9 million primarily relating to deposits made from the proceeds of our initial public offering and a decrease in interest expense by $4.6 million on short term loans and $1.0 million on long term loans. This decrease was primarily due to repayment of a short-term loan in the third quarter of 2007 and repayment of a portion of a long-term loan during the 2008. The weighted average rate of interest with respect to outstanding long-term loans under the credit facility was reduced from 6.3% in 2007 to 4.3% in 2008.
Income before share of equity in loss of affiliate, noncontrolling interest and income taxes. As a result of the foregoing factors, income before income taxes increased by $62.7 million or from 9.9% of net revenues in 2007 to 13.9% of net revenues in 2008.
Equity in loss of affiliate. This represents our share of loss from our non-consolidated affiliates, NGEN Media Services Private Limited, a joint venture with NDTV Networks Plc. and NIIT Uniqua, a joint venture with NIIT, one of the largest training institutes in Asia. During the year ending December 31, we invested $1.8 million in our non-consolidated affiliates.
Income before income tax expense. As a result of the foregoing factors, income before income taxes increased by $62.1 million or from 9.9% of net revenues in 2007 to 13.8% of net revenues in 2008.
63
Table of Contents
Income taxes. Our income tax expense decreased from $16.5 million in 2007 to $8.8 million for 2008. This decrease was attributable to (i) a $2.6 million reversal of prior period tax provisions following a favorable ruling from tax authorities in India in the first quarter of 2008 (ii) a $9.3 million benefit related to the maturing of certain hedges for which we had recorded a deferred tax liability at U.S. Federal and state tax rates pursuant to the restructuring of our legal entities as of October 1, 2007, and (iii) certain additional tax benefits including related to equity based compensation. These are partially offset by higher taxes resulting from higher profits including the partial expiration of our tax holiday in India as of March 31, 2008 and taxes on interest income in India.
Net income. As a result of the foregoing factors, net income increased by $68.7 million from $56.4 million in 2007 to $125.1 million in 2008. As a percentage of net revenues, our net income was 6.9% in 2007 and 12.0% in 2008.
Net income attributable to non controlling interest. The non controlling interest is due to the acquisition of ICE in March 2007. It represents the apportionment of profits to the minority partners of ICE. Noncontrolling interest increased from $8.4 million in 2007 to $9.5 million in 2008.
Net income attributable to Genpact Limited common shareholders. As a result of the foregoing factors, net income attributable to Genpact Limited common shareholders increased by $68.7 million from $56.4 million in 2007 to $125.1 million in 2008. As a percentage of net revenues, our net income was 6.9% in 2007 and 12.0% in 2008.
Seasonality
Our financial results may vary somewhat from period to period. Our revenues are typically higher in the third and fourth quarters than the other quarters, as a result of several factors. We generally find that more contracts for software and IT services are signed in the first quarter as corporations begin new budget cycles. Volumes under such contracts then increase as the year progresses. In addition, revenues for collections services, as well as transaction processing, are often higher in the latter half of the year as our clients have greater demand for our services.
The following table presents unaudited quarterly financial information for each of our last eight fiscal quarters on a historical basis. We believe the quarterly information contains all adjustments necessary to fairly present this information. The comparison of results for the first quarter of 2009 with the fourth quarter of 2008 reflects the foregoing factors. The results for any interim period are not necessarily indicative of the results that may be expected for the full year.
| Three months period ended, | ||||||||||||
| March 31, 2009 |
June 30, 2009 |
September 30, 2009 |
December 31, 2009 | |||||||||
| (unaudited) | ||||||||||||
| (dollars in millions) | ||||||||||||
| Statement of income data: |
||||||||||||
| Total net revenues |
$ | 265.8 | $ | 272.9 | $ | 284.4 | $ | 296.9 | ||||
| Cost of revenue |
163.7 | 165.8 | 167.0 | 176.1 | ||||||||
| Gross profit |
102.1 | 107.0 | 117.4 | 120.8 | ||||||||
| Income from operations |
33.1 | 37.8 | 44.9 | 46.3 | ||||||||
| Income before share of equity in (earning) loss of affiliate, noncontrolling interest and income taxes |
37.0 | 37.7 | 42.6 | 43.8 | ||||||||
| Net income attributable to Genpact Limited shareholders |
$ | 30.0 | $ | 29.7 | $ | 33.1 | $ | 34.6 | ||||
64
Table of Contents
| Three months period ended, | ||||||||||||
| March 31, 2008 |
June 30, 2008 |
September 30, 2008 |
December 31, 2008 | |||||||||
| (unaudited) | ||||||||||||
| (dollars in millions) | ||||||||||||
| Statement of income data |
||||||||||||
| Total net revenues |
$ | 234.6 | $ | 253.6 | $ | 270.8 | $ | 281.8 | ||||
| Cost of revenue |
146.1 | 147.1 | 155.8 | 170.3 | ||||||||
| Gross profit |
88.5 | 106.5 | 115.0 | 111.6 | ||||||||
| Income from operations |
17.3 | 29.2 | 36.3 | 50.9 | ||||||||
| Income before share of equity in (earnings) loss of affiliate, noncontrolling interest and income tax expense |
25.9 | 31.4 | 41.1 | 45.8 | ||||||||
| Net Income attributable to Genpact Limited shareholders |
$ | 19.7 | $ | 24.8 | $ | 33.6 | $ | 47.0 | ||||
Liquidity and Capital Resources
Overview
Information about our financial position as of December 31, 2008 and 2009 is presented below:
| Year Ended, December 31, | |||||||||
| 2008 | 2009 | % Change |
|||||||
| (dollars in millions) | |||||||||
| Cash and cash equivalents |
$ | 184.1 | $ | 288.7 | 56.9 | % | |||
| Short term investment |
141.7 | 132.6 | (6.4 | ) | |||||
| Short term deposits with a significant shareholder |
59.3 | 9.6 | (83.8 | ) | |||||
| Long-term debt due within one year |
29.5 | 44.7 | 51.4 | ||||||
| Long-term debt other than the current portion |
69.7 | 25.0 | (64.2 | ) | |||||
| Short term debt |
25.0 | 0.2 | (99.3 | ) | |||||
| Genpact Limited shareholders’ equity |
$ | 841.8 | $ | 1,197.4 | 42.2 | % | |||
Financial Condition
We finance our operations and our expansion with cash from operations and short-term borrowing facilities. We also incurred $180 million of long-term debt to finance in part the 2004 Reorganization.
Our cash and cash equivalents were $288.7 million as of December 31, 2009 compared to $184.1 million as of December 31, 2008. Our cash and cash equivalents are comprised of (a) $58.0 million in cash in current accounts across all operating locations to be used for working capital and immediate capital requirements, (b) $192.2 million in deposits with banks to be used for medium term planned expenditure and capital requirements and (c) $38.6 million in U.S. Treasury bills with an original maturity of less than three months.
In addition, in 2009, $132.6 million was invested in U.S. Treasury bills to be used for longer term capital requirements and acquisitions and we had $9.6 million as short-term deposits with GE India affiliates compared to $59.3 million in 2008.
We expect that in the future our cash from operations, cash reserves and debt capacity will be sufficient to finance our operations as well as our growth and expansion. Our working capital needs are primarily to finance our payroll expenses in advance of the receipt of accounts receivable. Our capital requirements include the opening of new Delivery Centers, as well as acquisitions.
65
Table of Contents
Cash flows from operating, investing and financing activities, as reflected in our consolidated statements of cash flows, are summarized in the following table:
| Year Ended, December 31, | ||||||||||||
| 2007 | 2008 | 2009 | ||||||||||
| (dollars in millions) | ||||||||||||
| Net cash provided by (used in) |
||||||||||||
| Operating activities |
$ | 150.0 | $ | 211.2 | $ | 158.2 | ||||||
| Investing activities |
(115.3 | ) | (239.4 | ) | (13.7 | ) | ||||||
| Financing activities |
181.2 | 0.4 | (51.5 | ) | ||||||||
| Net increase (decrease) in cash and cash equivalents |
$ | 215.9 | $ | (27.8 | ) | $ | 93.0 | |||||
Cash flow from operating activities. Our net cash provided by operating activities decreased by $53.1 million from $211.2 million in 2008 to $158.2 million in 2009. Our net income adjusted for amortization and depreciation and other non-cash items decreased by $12.7 million. The decrease in cash flow from operating activities was due to higher working capital of $40.3 million primarily driven by a realized foreign exchange loss of $3.6 million relating to the payment of contingent consideration to the sellers of ICE in February 2009 and higher cash payout for income taxes of $29.4 due to partial expiration of our tax holiday in India as of March 31, 2009.
Cash flow from investing activities. Our net cash used in investing activities was $13.7 million in 2009 compared to $239.4 million in 2008. In 2009, we invested $52.5 million in purchases of property, plant and equipment in connection with the opening of new Delivery Centers compared to $62.4 million 2008. We invested $8.9 million (net) in U.S. Treasury bills with an original maturity of more than three months and $49.3 million with GE India during 2009. We paid $20.2 million as partial payment for the acquisition of ICE in 2009, including acquisition-related expenses and net of cash acquired.
Cash flow from financing activities. Our net cash used by financing activities was $51.5 million in 2009, compared to cash provided of $0.4 million in 2008. We repaid $30.0 million of our long term debt as part of our scheduled repayments under our credit agreement and $24.8 million of our short-term borrowings drawn in the fourth quarter of 2008 in 2009 as compared to repayment of $25.1 million of long term debt in 2008. In addition, we paid the noncontrolling partners of ICE $7.9 million in 2009 compared to $9.7 million in 2008. We received $13.7 million as proceeds from the issuance of common shares on exercise of employee stock options in 2009 as compared to $13.2 million in 2008.
Financing Arrangements
Total long-term debt excluding capital lease obligations was $69.7 million at December 31, 2009 compared to $99.2 million at December 31, 2008 and $123.7 million at December 31, 2007. All of this indebtedness at December 31, 2009 represented long-term debt incurred to finance the 2004 Reorganization.
The weighted average rate of interest with respect to outstanding long-term loans was 6.3%, 4.3% and 1.7% for the years ended December 31, 2007, 2008 and 2009, respectively. We did not incur any long-term debt until December 30, 2004.
We incurred $180 million of long-term indebtedness in connection with the 2004 Reorganization. This indebtedness was restructured in 2006 and has been reduced to $70.0 million as of December 31, 2009. We are obligated to repay such indebtedness in annual installments, with the final maturity in 2011. The agreement contains restrictive covenants, such as requiring lender consent for, among other things, the creation of any liens on any of our property, assets or revenues, the incurring of further indebtedness, the making of or holding of any investments, dispositions of assets, the declaration of any dividends, engaging in any substantially different material line of business, transactions with affiliates and entering into certain agreements. In addition, we must comply with financial covenants pertaining to interest coverage, leverage and the positive net worth of our Indian
66
Table of Contents
business. This debt is also secured by a charge over substantially all of our property and assets including but not limited to our equipment, goods, accounts receivable, real estate, bank accounts and our other current assets. As of the date of this Annual Report, we believe that we are in full compliance with all the covenants and undertakings as described above.
We finance our short-term working capital requirements through cash flow from operations and credit facilities from banks and financial institutions. Prior to January 1, 2005, affiliates of GE provided us with short-term borrowing facilities. As of December 31, 2009, short-term credit facilities available to the company aggregated $145.0 million, which are under the same agreement as our long-term debt facility and $42.3 million as fund-based and non-fund-based credit facilities with banks. As of December 31, 2009, a total of $14.1 million was utilized, which represented non-funded draw down and $0.2 million of temporary cash drawdown in Hungary.
Goodwill Impairment Testing
We test goodwill for impairment at least on an annual basis on September 30. Goodwill of a reporting unit is tested for impairment between annual tests if an event occurs or circumstances change that would more likely than not reduce the fair value of the reporting unit below its carrying amount. Determining whether an impairment has occurred requires valuation of the respective reporting units, which we estimate using the discounted cash flow method. Valuation of a reporting unit is judgmental in nature and involves the use of significant estimates and assumptions which we believe to be reasonable but that are unpredictable and inherently uncertain and accordingly actual results may differ from these estimates. These estimates and assumptions include revenue growth rates and operating margins used to calculate projected future cash flows, risk-adjusted discount rates, future economic and market conditions. The results of our evaluation as of September 30, 2009, showed that the fair values of all our reporting units exceeded their book values.
Based upon our analysis at September 30, 2009, the estimated fair value for each of our reporting units exceeded its carrying value by at least 80% except for one of our reporting units (ICE). For ICE, the fair value exceeded the carrying value by approximately 9%. The fair value for ICE had been calculated based on the discounted cash flow method whereby the future projections for revenue and margins had been based on historical trends, the expected operating plan for the year 2010 and management’s estimate of the long term revenue growth and operating margins. The projections reflect a CAGR of 12% in free cash flows over a ten year forecast period with a terminal growth rate of 3%. The risk-adjusted discount rate has been assumed at 8% per annum. If the macroeconomic environment continues to have an adverse impact on the operations of this reporting unit, its fair value may be reduced below carrying value leading to potential goodwill impairment for this reporting unit. The total goodwill allocated to ICE amounted to $65.1 and $64.9 million as of September 30, 2009 and December 31, 2009, respectively.
Off-Balance Sheet Arrangements
Our off-balance sheet arrangements consist of foreign exchange contracts and certain operating leases. For additional information, see the Risk Factor entitled “Currency exchange rate fluctuations in various currencies in which we do business, especially the Indian rupee and the U.S. dollar, could have a material adverse effect on our business, results of operations and financial condition,” “—Contractual Obligations” below and note 8 of our consolidated financial statements.
67
Table of Contents
Contractual Obligations
The following table sets forth our total future contractual obligations as of December 31, 2009:
| Payments due by Period (dollars in millions) | |||||||||||||||
| Less than 1 year |
1-3 years | 4-5 years | After 5 years |
Total | |||||||||||
| Long-term debt |
$ | 44.7 | $ | 25.0 | $ | — | $ | — | $ | 69.7 | |||||
| Short-term debt |
0.2 | — | — | — | 0.2 | ||||||||||
| Capital leases |
2.0 | 2.9 | 0.5 | — | 5.3 | ||||||||||
| Operating leases |
23.5 | 43.5 | 70.2 | — | 137.1 | ||||||||||
| Purchase obligations |
13.3 | — | — | — | 13.3 | ||||||||||
| Capital commitments net of advances |
33.5 | — | — | — | 33.5 | ||||||||||
| Other long-term liabilities(1) |
110.2 | 69.7 | 0.3 | — | 180.2 | ||||||||||
| Total contractual cash obligations |
$ | 227.3 | $ | 141.0 | $ | 71.0 | $ | — | $ | 439.3 | |||||
| (1) | Excludes $13.2 million related to uncertain tax positions. For such amount, the extent of the amount and timing of payment or cash settlement is not reliably estimatable or determinable, at present. |
Recent Accounting Pronouncements
In October 2009, the FASB issued amended revenue recognition guidance for arrangements with multiple deliverables. The new guidance eliminate the requirement that all undelivered elements have Vendor Specific Objective Evidence (VSOE) or Third Party Evidence (TPE) before an entity can recognize the portion of an overall arrangement fee that is attributable to items that already have been delivered. In the absence of VSOE or TPE of the standalone selling price for one or more delivered or undelivered elements in a multiple-element arrangement, the overall arrangement fee will be allocated to each element (both delivered and undelivered items) based on their relative estimated selling prices.
Application of the “residual method” of allocating an overall arrangement fee between delivered and undelivered elements will no longer be permitted upon adoption of this new FASB guidance. The provisions of this FASB guidance will be effective prospectively for revenue arrangements entered into or materially modified in fiscal years beginning on or after June 15, 2010. Early adoption will be permitted. The Company is currently evaluating the effect of adoption of the provisions of the FASB guidance on the Company’s consolidated financial statements.
In August 2009, the FASB issued guidance on the measurement of liabilities at fair value. The new guidance provides clarification that in circumstances in which a quoted price in an active market for the identical liability is not available, an entity is required to measure fair value utilizing one or more of the following techniques (1) a valuation technique that uses the quoted market price of an identical liability or similar liabilities when traded as assets; or (2) another valuation technique that is consistent with the principles of the FASB guidance on Fair Value Measurements and Disclosures, such as a present value technique or a market approach. The provisions of the new guidance are effective for the first reporting period (including the interim periods) beginning after issuance. The provisions of this FASB guidance will be effective for interim and annual periods beginning after August 27, 2009. The Company is currently evaluating the effect of the provisions of this FASB guidance on the Company’s consolidated financial statements.
68
Table of Contents
Item 7A. Quantitative and Qualitative Disclosures About Market Risk
Foreign Currency Risk
Our exposure to market risk arises principally from exchange rate risk. A substantial portion of our revenues (approximately 74% in fiscal 2009) are received in U.S. dollars. We also receive revenues in Japanese yen, euros, U.K. pound sterling, Australian dollars, Chinese renminbi, South African rand and Indian rupees. Our expenses are primarily in Indian rupees and we also incur expenses in U.S. dollars, Chinese renminbi, euro and the currencies of the other countries in which we have operations. Our exchange rate risk arises from our foreign currency revenues, expenses, receivables and payables. Based on the results of our European operations for fiscal 2009, and excluding any hedging arrangements that we had in place during that period, a 5.0% appreciation or depreciation of the euro against the U.S. dollar would have increased or decreased, as applicable, our revenues in fiscal 2009 by approximately $6 million. Similarly, 5.0% depreciation in the Indian rupee against the U.S. dollar would have decreased our expenses incurred and paid in Indian rupees in fiscal 2009 by approximately $20 million. Conversely, a 5.0% appreciation in the Indian rupee against the U.S. dollar would have increased our expenses incurred and paid in rupees in fiscal 2009 by approximately $23 million.
We have sought to reduce the effect of any Indian rupee-U.S. dollar, Chinese renmimbi-Japanese yen, euro-Hungarian forint and Romanian leu and certain other local currency exchange rate fluctuations on our results of operations by purchasing forward foreign exchange contracts to cover a portion of our expected cash flows. These instruments typically have maturities of one to forty months. We use these instruments as economic hedges and not for speculative purposes and most of them qualify for hedge accounting under the FASB guidance on Derivatives and Hedging. Our ability to enter into derivatives that meet our planning objectives is subject to the depth and liquidity of the market for such derivatives. In addition, the laws of China and India limit the maturity and amount of such arrangements. We may not be able to purchase contracts adequate to insulate ourselves from Indian rupee-U.S. dollar and Chinese renminbi-Japanese yen foreign exchange currency risks. In addition, any such contracts may not perform adequately as a hedging mechanism. See Item 7—“Management’s Discussion and Analysis of Financial Condition and Results of Operations—Foreign Exchange (gains) losses, net.”
Interest Rate Risk
Our exposure to interest rate risk arises principally from interest on our indebtedness. As of December 31, 2009, we had approximately $70.0 million of long-term indebtedness and $0.2 million of short term indebtedness under our credit facility. Interest on our indebtedness under our credit facility is variable based on LIBOR and we are subject to market risk from changes in interest rates. Based on our long-term indebtedness of $70.0 million as of December 31, 2009 a 1% change in interest rates would impact our net interest expense by $0.7 million.
In addition, we had invested $171.2 million in U.S. Treasury bills as of December 31, 2009. A 1% change in interest rates would impact our net interest income by $1.7 million.
Credit Risk
As of December 31, 2009, we had accounts receivable net of provision for doubtful receivables of $253.7 million, $116.2 million of which was owed by GE and the balance $137.5 million of which was owed by Global Clients. No single Global Client owed more than $10 million.
Item 8. Financial Statements and Supplementary Data
The financial statements and supplementary data required by this item are listed in Item 15—“Exhibits and Financial Statement Schedules” of this Annual Report on Form 10-K.
69
Table of Contents
Item 9. Changes in and Disagreements With Accountants on Accounting and Financial Disclosure
None.
Item 9A. Controls and Procedures
Evaluation of Disclosure Controls and Procedures
Disclosure controls and procedures are the Company’s controls and other procedures which are designed to ensure that information required to be disclosed by us in the reports that we file or submit under the Exchange Act is recorded, processed, summarized and reported, within the time periods specified in the SEC’s rules and forms. Disclosure controls and procedures include, without limitation, controls and procedures designed to ensure that information required to be disclosed by us in the reports that we file or submit under the Exchange Act is accumulated and communicated to our management, including our Chief Executive Officer and Chief Financial Officer, as appropriate, to allow timely decisions regarding required disclosure.
As of the end of the period covered by this report, the Company carried out an evaluation, under the supervision and with the participation of the Company’s management, including the Company’s Chief Executive Officer along with the Company’s Chief Financial Officer, of the effectiveness of the design and operation of the Company’s disclosure controls and procedures pursuant to the Securities Exchange Act of 1934 (“Exchange Act”) Rule 13a-15(b). Based upon that evaluation, the Company’s Chief Executive Officer along with the Company’s Chief Financial Officer concluded that the Company’s disclosure controls and procedures are effective in timely alerting them to material information relating to the Company (including its consolidated subsidiaries) required to be included in the Company’s periodic SEC filings.
Management’s Report on Internal Control Over Financial Reporting
Genpact’s management is responsible for establishing and maintaining adequate internal control over financial reporting to provide reasonable assurance regarding the reliability of our financial reporting and the preparation of financial statements for external purposes in accordance with generally accepted accounting principles. Internal control over financial reporting includes those policies and procedures that:
(i) pertain to the maintenance of records that in reasonable detail accurately and fairly reflect the transactions and dispositions of our assets;
(ii) provide reasonable assurance that the transactions are recorded as necessary to permit preparation of financial statements in accordance with generally accepted accounting principles, and that our receipts and expenditures are being made only in accordance with the authorization of management and/or our Board of Directors; and
(iii) provide reasonable assurance regarding the prevention or timely detection of any unauthorized acquisition, use or disposition of our assets that could have a material effect on our financial statements.
Due to its inherent limitations, internal control over financial reporting may not prevent or detect misstatements. Also, projections of any evaluation of effectiveness to future periods are subject to the risk that controls may become inadequate due to changes in conditions, or that the degree of compliance with the policies or procedures may deteriorate.
Under the supervision and with the participation of our management, including our chief executive officer and chief financial officer, we conducted an evaluation of the effectiveness of our internal control over financial reporting using the criteria set forth by the Committee of Sponsoring Organizations of the Treadway Commission (COSO) in Internal Control—Integrated Framework. Based on its evaluation, our management concluded that our internal control over financial reporting was effective as of December 31, 2009.
70
Table of Contents
KPMG, an independent registered public accounting firm, has audited the Consolidated Financial Statements included in this Annual Report on Form 10-K and, as part of their audit, has issued its attestation report, included herein, on the effectiveness of our internal control over financial reporting. See “Report of Independent Registered Public Accounting Firm” on page F-2.
Changes in Internal Control Over Financial Reporting
There were no changes in the Company’s internal control over financial reporting (as defined in Rules 13a-15(f) and 15d-15(f) under the Exchange Act) that occurred during the quarterly period ended December 31, 2009, that have materially affected, or are reasonably likely to materially affect, the Company’s internal control over financial reporting.
None.
Item 10. Directors, Executive Officers and Corporate Governance
The information required by this Item will be included in our Proxy Statement for the 2010 Annual Meeting of stockholders under the captions, “Election of Directors”, “Information about Executive Officers”, “Corporate Governance”, and “Section 16(a) Beneficial Ownership Reporting Compliance”, which will be filed with the SEC no later than 120 days after the close of the fiscal year ended December 31, 2009 and is incorporated by reference in this report.
Item 11. Executive Compensation
The information required by this Item will be included in our Proxy Statement for the 2010 Annual Meeting of stockholders under the caption, “Information about Executive and Director Compensation”, which will be filed with the SEC no later than 120 days after the close of the fiscal year ended December 31, 2009 and is incorporated by reference in this report.
| Item 12. Security | Ownership of Certain Beneficial Owners and Management and Related Stockholder Matters |
The information required by this Item will be included in our Proxy Statement for the 2010 Annual Meeting of stockholders under the captions, “Security Ownership Of Certain Beneficial Owners and Management” and “Securities Authorized for Issuance under Equity Compensation Plans”, which will be filed with the SEC no later than 120 days after the close of the fiscal year ended December 31, 2009 and is incorporated by reference in this report.
Item 13. Certain Relationships and Related Transactions
The information required by this Item will be included in our Proxy Statement for the 2010 Annual Meeting of stockholders under the caption, “Certain Relationships and Related Transactions”, which will be filed with the SEC no later than 120 days after the close of the fiscal year ended December 31, 2009 and is incorporated by reference in this report.
71
Table of Contents
Item 14. Principal Accounting Fees and Services
The information required by this Item will be included in our Proxy Statement for the 2010 Annual Meeting of stockholders under the caption, “Independent Registered Public Accounting Firm Fees and Other Matters”, which will be filed with the SEC no later than 120 days after the close of the fiscal year ended December 31, 2009 and is incorporated by reference in this report.
Item 15. Exhibits and Financial Statement Schedules
| (a) | Documents filed as part of this Annual Report on Form 10-K: |
| 1. | Consolidated Financial Statements |
The consolidated financial statements required to be filed in the Annual Report on Form 10-K are listed on page F-1 hereof. The required financial statements appear on pages F-2 through F-58 hereof.
| 2. | Financial Statement Schedules |
Separate financial statement schedules have been omitted either because they are not applicable or because the required information is included in the consolidated financial statements.
| 3. | Exhibits |
See the Exhibit Index on pages E-1 through E-3 for a list of the exhibits being filed or furnished with or incorporated by reference into this Annual Report on Form 10-K.
72
Table of Contents
GENPACT LIMITED AND ITS SUBSIDIARIES
Index to Consolidated Financial Statements
F-1
Table of Contents
Report of Independent Registered Public Accounting Firm
The Board of Directors and Shareholders
Genpact Limited:
We have audited the accompanying consolidated balance sheets of Genpact Limited and subsidiaries (“Genpact Limited” or the “Company”) as of December 31, 2009 and 2008, and the related consolidated statements of income, equity and comprehensive income (loss), and cash flows for each of the years in the three-year period ended December 31, 2009. We also have audited the Company’s internal control over financial reporting as of December 31, 2009, based on criteria established in Internal Control—Integrated Framework issued by the Committee of Sponsoring Organizations of the Treadway Commission (COSO). The Company’s management is responsible for these consolidated financial statements, for maintaining effective internal control over financial reporting, and for its assessment of the effectiveness of internal control over financial reporting, included in the accompanying Management’s Report on Internal Control over Financial Reporting. Our responsibility is to express an opinion on these consolidated financial statements and an opinion on the Company’s internal control over financial reporting based on our audits.
We conducted our audits in accordance with the standards of the Public Company Accounting Oversight Board (United States). Those standards require that we plan and perform the audits to obtain reasonable assurance about whether the financial statements are free of material misstatement and whether effective internal control over financial reporting was maintained in all material respects. Our audits of the consolidated financial statements included examining, on a test basis, evidence supporting the amounts and disclosures in the financial statements, assessing the accounting principles used and significant estimates made by management, and evaluating the overall financial statement presentation. Our audit of internal control over financial reporting included obtaining an understanding of internal control over financial reporting, assessing the risk that a material weakness exists, and testing and evaluating the design and operating effectiveness of internal control based on the assessed risk. Our audits also included performing such other procedures as we considered necessary in the circumstances. We believe that our audits provide a reasonable basis for our opinions.
A company’s internal control over financial reporting is a process designed to provide reasonable assurance regarding the reliability of financial reporting and the preparation of financial statements for external purposes in accordance with generally accepted accounting principles. A company’s internal control over financial reporting includes those policies and procedures that (1) pertain to the maintenance of records that, in reasonable detail, accurately and fairly reflect the transactions and dispositions of the assets of the company; (2) provide reasonable assurance that transactions are recorded as necessary to permit preparation of financial statements in accordance with generally accepted accounting principles, and that receipts and expenditures of the company are being made only in accordance with authorizations of management and directors of the company; and (3) provide reasonable assurance regarding prevention or timely detection of unauthorized acquisition, use, or disposition of the company’s assets that could have a material effect on the financial statements.
Because of its inherent limitations, internal control over financial reporting may not prevent or detect misstatements. Also, projections of any evaluation of effectiveness to future periods are subject to the risk that controls may become inadequate because of changes in conditions, or that the degree of compliance with the policies or procedures may deteriorate.
In our opinion, the consolidated financial statements referred to above present fairly, in all material respects, the financial position of the Company as of December 31, 2009 and 2008, and the results of their operations and their cash flows for each of the years in the three-year period ended December 31, 2009, in conformity with U.S. generally accepted accounting principles. Also in our opinion, the Company maintained, in all material respects, effective internal control over financial reporting as of December 31, 2009, based on criteria established in Internal Control—Integrated Framework issued by COSO.
KPMG
Gurgaon, India
February 23, 2010
F-2
Table of Contents
GENPACT LIMITED AND ITS SUBSIDIARIES
Consolidated Balance Sheets
(In thousands, except per share data)
| As of December 31, | ||||||||
| Notes | 2008 | 2009 | ||||||
| Assets |
||||||||
| Current assets |
||||||||
| Cash and cash equivalents |
4 | $ | 184,050 | $ | 288,734 | |||
| Short term investments |
5 | 141,662 | 132,601 | |||||
| Accounts receivable, net |
6 | 140,504 | 137,454 | |||||
| Accounts receivable from a significant shareholder, net |
6,28 | 88,793 | 116,228 | |||||
| Short term deposits with a significant shareholder |
28 | 59,332 | 9,634 | |||||
| Deferred tax assets |
26 | 38,629 | 45,929 | |||||
| Due from a significant shareholder |
9,28 | 1,428 | 9 | |||||
| Prepaid expenses and other current assets |
9 | 89,936 | 116,551 | |||||
| Total current assets |
744,334 | 847,140 | ||||||
| Property, plant and equipment, net |
10 | 174,266 | 189,112 | |||||
| Deferred tax assets |
26 | 111,002 | 36,527 | |||||
| Investment in equity affiliates |
28 | 970 | 588 | |||||
| Customer-related intangible assets, net |
11 | 56,942 | 36,041 | |||||
| Other intangible assets, net |
11 | 5,225 | 187 | |||||
| Goodwill |
11 | 531,897 | 548,723 | |||||
| Other assets |
12 | 71,690 | 89,247 | |||||
| Total assets |
$ | 1,696,326 | $ | 1,747,565 | ||||
See accompanying notes to the Consolidated Financial Statements.
F-3
Table of Contents
GENPACT LIMITED AND ITS SUBSIDIARIES
Consolidated Balance Sheets (Continued)
(In thousands, except per share data)
| As of December 31, | ||||||||||
| Notes | 2008 | 2009 | ||||||||
| Liabilities and equity |
||||||||||
| Current liabilities |
||||||||||
| Short-term borrowings |
16 | $ | 25,000 | $ | 177 | |||||
| Current portion of long-term debt |
17 | 29,539 | 44,715 | |||||||
| Current portion of capital lease obligations |
14 | 446 | 527 | |||||||
| Current portion of capital lease obligations payable to a significant shareholder |
14,28 | 1,563 | 1,429 | |||||||
| Accounts payable |
8,377 | 16,276 | ||||||||
| Income taxes payable |
26 | 2,081 | 1,579 | |||||||
| Deferred tax liabilities |
26 | 12 | 264 | |||||||
| Due to a significant shareholder |
15,28 | 10,865 | 7,843 | |||||||
| Accrued expenses and other current liabilities |
15 | 347,176 | 322,773 | |||||||
| Total current liabilities |
$ | 425,059 | $ | 395,583 | ||||||
| Long-term debt, less current portion |
17 | 69,665 | 24,950 | |||||||
| Capital lease obligations, less current portion |
14 | 1,950 | 1,570 | |||||||
| Capital lease obligations payable to a significant shareholder, less current portion |
14,28 | 2,391 | 1,809 | |||||||
| Deferred tax liabilities |
26 | 10,174 | 4,398 | |||||||
| Due to a significant shareholder |
18,28 | 7,322 | 10,474 | |||||||
| Other liabilities |
18 | 335,399 | 109,034 | |||||||
| Total liabilities |
$ | 851,960 | $ | 547,818 | ||||||
| Shareholders’ equity |
||||||||||
| Preferred shares, $0.01 par value, 250,000,000 authorized, none issued |
21 | — | — | |||||||
| Common shares, $0.01 par value, 500,000,000 authorized, 214,560,620 and 217,433,091 issued and outstanding as of December 31, 2008 and 2009, respectively |
21 | 2,146 | 2,174 | |||||||
| Additional paid-in capital |
1,030,304 | 1,063,304 | ||||||||
| Retained earnings |
151,610 | 278,911 | ||||||||
| Accumulated other comprehensive income (loss) |
(342,267 | ) | (146,993 | ) | ||||||
| Genpact Limited shareholders’ equity |
841,793 | 1,197,396 | ||||||||
| Noncontrolling interest |
2,573 | 2,351 | ||||||||
| Total equity |
844,366 | 1,199,747 | ||||||||
| Commitments and contingencies |
29 | |||||||||
| Total liabilities and equity |
$ | 1,696,326 | $ | 1,747,565 | ||||||
See accompanying notes to the Consolidated Financial Statements.
F-4
Table of Contents
GENPACT LIMITED AND ITS SUBSIDIARIES
Consolidated Statements of Income
(In thousands, except per share data)
| Year ended December 31, | ||||||||||||||
| Notes | 2007 | 2008 | 2009 | |||||||||||
| Net revenues |
||||||||||||||
| Net revenues from services—significant shareholder |
28 | $ | 481,270 | $ | 490,153 | $ | 451,338 | |||||||
| Net revenues from services—others |
340,408 | 550,639 | 668,733 | |||||||||||
| Other revenues |
1,493 | 55 | — | |||||||||||
| Total net revenues |
823,171 | 1,040,847 | 1,120,071 | |||||||||||
| Cost of revenue |
||||||||||||||
| Services |
23,28 | 481,805 | 619,231 | 672,624 | ||||||||||
| Others |
1,133 | — | — | |||||||||||
| Total cost of revenue |
482,938 | 619,231 | 672,624 | |||||||||||
| Gross profit |
340,233 | 421,616 | 447,447 | |||||||||||
| Operating expenses: |
||||||||||||||
| Selling, general and administrative expenses |
24,28 | 218,237 | 254,533 | 265,392 | ||||||||||
| Amortization of acquired intangible assets |
11 | 36,938 | 36,513 | 25,969 | ||||||||||
| Other operating (income) expense, net |
28 | (4,264 | ) | (3,143 | ) | (6,094 | ) | |||||||
| Income from operations |
$ | 89,322 | $ | 133,713 | $ | 162,180 | ||||||||
| Foreign exchange (gains) losses, net |
2,518 | (4,089 | ) | 5,493 | ||||||||||
| Other income (expense), net |
25,28 | (5,196 | ) | 6,547 | 4,437 | |||||||||
| Income before share of equity in (earnings) loss of affiliates and income tax expense |
81,608 | 144,349 | 161,124 | |||||||||||
| Equity in (earnings) loss of affiliates |
255 | 925 | 700 | |||||||||||
| Income before income tax expense |
81,353 | 143,424 | 160,424 | |||||||||||
| Income tax expense |
26 | 16,543 | 8,823 | 25,466 | ||||||||||
| Net Income |
$ | 64,810 | $ | 134,601 | $ | 134,958 | ||||||||
| Net income attributable to noncontrolling interest |
8,387 | 9,460 | 7,657 | |||||||||||
| Net income attributable to Genpact Limited shareholders |
$ | 56,423 | $ | 125,141 | $ | 127,301 | ||||||||
| Net income available to Genpact Limited common shareholders |
22 | $ | 17,285 | $ | 125,141 | $ | 127,301 | |||||||
| Earnings per common share attributable to Genpact Limited common shareholders |
22 | |||||||||||||
| Basic |
$ | 0.13 | $ | 0.59 | $ | 0.59 | ||||||||
| Diluted |
$ | 0.12 | $ | 0.57 | $ | 0.58 | ||||||||
| Weighted average number of common shares used in computing earnings per common share attributable to Genpact Limited common shareholders |
||||||||||||||
| Basic |
135,517,771 | 213,480,623 | 215,503,749 | |||||||||||
| Diluted |
142,739,811 | 218,444,224 | 220,066,345 | |||||||||||
See accompanying notes to the Consolidated Financial Statements.
F-5
Table of Contents
GENPACT LIMITED AND ITS SUBSIDIARIES
Consolidated Statements of Equity and Comprehensive Income (Loss)
(In thousands, except share data)
| Genpact Limited Shareholders | ||||||||||||||||||||||||||||||||||||||||||||||||||||||||
| 2% Cumulative Series A convertible preferred stock |
5% Cumulative Series B convertible preferred stock |
Treasury stock | ||||||||||||||||||||||||||||||||||||||||||||||||||||||
| Common shares | Additional Paid-in Capital |
Accumulated Other Comprehensive Income (loss) |
Series A Preferred stock (No.) |
Total Equity |
Comprehensive Income (loss) |
|||||||||||||||||||||||||||||||||||||||||||||||||||
| No. of shares |
Amount | No. of shares |
Amount | No. of shares |
Amount | Retained Earnings |
Common shares (No.) |
Amount | Noncontrolling interest |
|||||||||||||||||||||||||||||||||||||||||||||||
| Balance as of January 1, 2007 |
3,077,868 | $ | 95,414 | 3,017,868 | $ | 93,554 | 71,390,738 | $ | 714 | $ | 494,325 | $ | 5,978 | $ | (15,295 | ) | (3,628,130 | ) | (59,000 | ) | $ | (49,995 | ) | — | $ | 624,695 | ||||||||||||||||||||||||||||||
| Issuance of common shares on exercise of options (including fringe benefit tax recovered as discussed in Note 20) |
— | — | — | — | 616,174 | 6 | 2,839 | — | — | — | — | — | — | 2,845 | ||||||||||||||||||||||||||||||||||||||||||
| Noncontrolling interest—on business acquisition |
— | — | — | — | — | — | — | — | — | — | — | — | 2,776 | 2,776 | ||||||||||||||||||||||||||||||||||||||||||
| Treasury Stock issued in business combination |
— | — | — | — | — | — | 8,045 | — | — | 1,442,315 | — | 15,220 | — | 23,265 | ||||||||||||||||||||||||||||||||||||||||||
| Retirement of treasury stock |
(59,000 | ) | (1,829 | ) | — | — | (2,185,815 | ) | (22 | ) | (32,924 | ) | — | — | 2,185,815 | 59,000 | 34,775 | — | — | |||||||||||||||||||||||||||||||||||||
| Issuance of common shares in business combination |
— | — | — | — | 48,843 | — | 698 | — | — | — | — | — | — | 698 | ||||||||||||||||||||||||||||||||||||||||||
| Issuance of restricted common shares to Axis Trust (Note 3(b)) |
— | — | — | — | 94,610 | 1 | (1 | ) | — | — | — | — | — | — | — | |||||||||||||||||||||||||||||||||||||||||
| Repurchase and retirement of common share from employees |
— | — | — | — | (106,007 | ) | (1 | ) | (1,709 | ) | — | — | — | — | — | — | (1,710 | ) | ||||||||||||||||||||||||||||||||||||||
| Repurchase and retirement of cumulative Series A convertible preferred stock from employees |
(522 | ) | (16 | ) | — | — | — | — | (126 | ) | — | — | — | — | — | — | (142 | ) | ||||||||||||||||||||||||||||||||||||||
| Repurchase and retirement of cumulative Series B convertible preferred stock from employees |
— | — | (522 | ) | (16 | ) | — | — | (126 | ) | — | — | — | — | — | — | (142 | ) | ||||||||||||||||||||||||||||||||||||||
| Accrual of dividend on preferred stock (Note 21 and 22) |
— | — | — | — | — | — | 35,932 | (35,932 | ) | — | — | — | — | — | — | |||||||||||||||||||||||||||||||||||||||||
| Other issuance of common shares |
— | — | — | — | 547 | — | 9 | — | — | — | — | — | — | 9 | ||||||||||||||||||||||||||||||||||||||||||
| Effect of 2007 Reorganization (Note 21) |
(3,018,346 | ) | (93,569 | ) | (3,017,346 | ) | (93,538 | ) | 119,301,607 | 1,193 | 185,914 | — | — | — | — | — | — | — | ||||||||||||||||||||||||||||||||||||||
| Issuance of common shares through initial public offering, net (Note 1) |
— | — | — | — | 22,941,177 | 230 | 294,282 | — | — | — | — | — | — | 294,512 | ||||||||||||||||||||||||||||||||||||||||||
| Distribution to noncontrolling interest |
— | — | — | — | — | — | — | — | — | — | — | — | (8,495 | ) | (8,495 | ) | ||||||||||||||||||||||||||||||||||||||||
| Share-based compensation expense (Note 20) |
— | — | — | — | — | — | 13,021 | — | — | — | — | — | — | 13,021 | ||||||||||||||||||||||||||||||||||||||||||
| Comprehensive income: |
— | — | ||||||||||||||||||||||||||||||||||||||||||||||||||||||
| Net income |
— | — | — | — | — | — | — | 56,423 | — | — | — | — | 8,387 | 64,810 | 64,810 | |||||||||||||||||||||||||||||||||||||||||
| Other comprehensive income: |
— | |||||||||||||||||||||||||||||||||||||||||||||||||||||||
| Unrealized gain on cash flow hedging derivatives, net of taxes |
— | — | — | — | — | — | — | — | 122,071 | — | — | — | — | 122,071 | 122,071 | |||||||||||||||||||||||||||||||||||||||||
| Currency translation adjustments |
— | — | — | — | — | — | — | — | 115,406 | — | — | — | 398 | 115,804 | 115,804 | |||||||||||||||||||||||||||||||||||||||||
| Retirement benefits, net of taxes |
— | — | — | — | — | — | — | — | (222 | ) | — | — | — | — | (222 | ) | (222 | ) | ||||||||||||||||||||||||||||||||||||||
| Comprehensive income (loss) |
— | — | — | — | — | — | — | — | — | — | — | — | — | — | $ | 302,463 | ||||||||||||||||||||||||||||||||||||||||
| Balance as of December 31, 2007 |
— | — | — | — | $ | 212,101,874 | $ | 2,121 | $ | 1,000,179 | $ | 26,469 | $ | 221,960 | — | — | — | $ | 3,066 | $ | 1,253,795 | |||||||||||||||||||||||||||||||||||
See accompanying notes to the Consolidated Financial Statements.
F-6
Table of Contents
GENPACT LIMITED AND ITS SUBSIDIARIES
Consolidated Statements of Equity and Comprehensive Income (Loss)
(In thousands, except share data)
| Genapct Limited Shareholders | Noncontrolling interest |
Total Equity |
Comprehensive Income (loss) |
||||||||||||||||||||||||
| Common shares | Additional Paid- in Capital |
Retained Earnings |
Accumulated Other Comprehensive Income (loss) |
||||||||||||||||||||||||
| No. of shares | Amount | ||||||||||||||||||||||||||
| Balance as of January 1, 2008 |
212,101,874 | $ | 2,121 | $ | 1,000,179 | $ | 26,469 | $ | 221,960 | $ | 3,066 | $ | 1,253,795 | ||||||||||||||
| Issuance of common shares on exercise of options (including fringe benefit tax recovered as discussed in |
2,458,746 | 25 | 13,189 | — | — | — | 13,214 | ||||||||||||||||||||
| Distribution to noncontrolling interest |
— | — | — | — | — | (9,648 | ) | (9,648 | ) | ||||||||||||||||||
| Share-based compensation expense (Note 20) |
— | — | 16,936 | — | — | — | 16,936 | ||||||||||||||||||||
| Comprehensive income: |
|||||||||||||||||||||||||||
| Net income |
— | — | — | 125,141 | — | 9,460 | 134,601 | $ | 134,601 | ||||||||||||||||||
| Other comprehensive income: |
|||||||||||||||||||||||||||
| Net unrealized income (loss) on cash flow hedging derivatives, net of taxes |
— | — | — | — | (363,281 | ) | — | (363,281 | ) | (363,281 | ) | ||||||||||||||||
| Currency translation adjustments |
— | — | — | — | (199,553 | ) | (305 | ) | (199,858 | ) | (199,858 | ) | |||||||||||||||
| Retirement benefits, net of taxes |
— | — | — | — | (1,393 | ) | — | (1,393 | ) | (1,393 | ) | ||||||||||||||||
| Comprehensive income (loss) |
— | — | — | — | — | — | — | $ | (429,931 | ) | |||||||||||||||||
| Balance as of December 31, 2008 |
214,560,620 | $ | 2,146 | $ | 1,030,304 | $ | 151,610 | $ | (342,267 | ) | $ | 2,573 | $ | 844,366 | |||||||||||||
See accompanying notes to the Consolidated Financial Statements.
F-7
Table of Contents
GENPACT LIMITED AND ITS SUBSIDIARIES
Consolidated Statements of Equity and Comprehensive Income (Loss)
(In thousands, except share data)
| Genapct Limited Shareholders | Noncontrolling interest |
Total Equity |
Comprehensive Income (loss) |
||||||||||||||||||||||||
| Common shares | Additional Paid- in Capital |
Retained Earnings |
Accumulated Other Comprehensive Income (loss) |
||||||||||||||||||||||||
| No. of shares | Amount | ||||||||||||||||||||||||||
| Balance as of January 1, 2009 |
214,560,620 | $ | 2,146 | $ | 1,030,304 | $ | 151,610 | $ | (342,267 | ) | $ | 2,573 | $ | 844,366 | |||||||||||||
| Issuance of common shares on exercise of options (including fringe benefit tax recovered as discussed in |
2,830,995 | 28 | 13,307 | — | — | — | 13,335 | ||||||||||||||||||||
| Issuance of common shares under the employee share purchase plan |
41,476 | — | 408 | — | — | — | 408 | ||||||||||||||||||||
| Distribution to noncontrolling interest |
— | — | — | — | — | (7,866 | ) | (7,866 | ) | ||||||||||||||||||
| Share-based compensation expense (Note 20) |
— | — | 19,285 | — | — | — | 19,285 | ||||||||||||||||||||
| Comprehensive income: |
— | — | — | — | — | — | — | $ | — | ||||||||||||||||||
| Net income |
— | — | — | 127,301 | — | 7,657 | 134,958 | 134,958 | |||||||||||||||||||
| Other comprehensive income: |
— | — | — | — | — | — | — | — | |||||||||||||||||||
| Net unrealized income (loss) on cash flow hedging derivatives, net of taxes |
— | — | — | — | 160,023 | — | 160,023 | 160,023 | |||||||||||||||||||
| Unrealized gain on investment in U.S. treasury bills |
— | — | — | — | (197 | ) | — | (197 | ) | (197 | ) | ||||||||||||||||
| Currency translation adjustments |
— | — | — | — | 35,323 | (13 | ) | 35,310 | 35,310 | ||||||||||||||||||
| Retirement benefits, net of taxes |
— | — | — | — | 125 | — | 125 | 125 | |||||||||||||||||||
| Comprehensive income (loss) |
— | — | — | — | — | — | — | $ | 330,219 | ||||||||||||||||||
| Balance as of December 31, 2009 |
217,433,091 | $ | 2,174 | $ | 1,063,304 | $ | 278,911 | $ | (146,993 | ) | $ | 2,351 | $ | 1,199,747 | |||||||||||||
See accompanying notes to the Consolidated Financial Statements.
F-8
Table of Contents
GENPACT LIMITED AND ITS SUBSIDIARIES
Consolidated Statements of Cash Flows
(In thousands)
| Year ended December 31, | ||||||||||||
| 2007 | 2008 | 2009 | ||||||||||
| Operating activities |
||||||||||||
| Net income attributable to Genpact Limited shareholders |
$ | 56,423 | $ | 125,141 | $ | 127,301 | ||||||
| Adjustments to reconcile net income to net cash provided by (used for) operating activities: |
||||||||||||
| Depreciation and amortization |
47,652 | 54,640 | 53,047 | |||||||||
| Amortization of debt issue costs |
718 | 645 | 561 | |||||||||
| Amortization of acquired intangible assets |
37,956 | 37,426 | 26,540 | |||||||||
| Loss (gain) on sale of property, plant and equipment, net |
(145 | ) | 1,766 | 206 | ||||||||
| Provision for doubtful receivables |
3,934 | 1,876 | 1,614 | |||||||||
| Provision for (writeback of) mortgage loans |
1,590 | 754 | (1,022 | ) | ||||||||
| Unrealized (gain) loss on revaluation of foreign currency asset/liability |
(2,663 | ) | 2,583 | (166 | ) | |||||||
| Equity in loss of affiliates |
255 | 925 | 700 | |||||||||
| Noncontrolling interest |
8,387 | 9,460 | 7,657 | |||||||||
| Share-based compensation expense |
13,021 | 16,936 | 19,285 | |||||||||
| Deferred income taxes |
(4,873 | ) | (24,421 | ) | (20,740 | ) | ||||||
| Change in operating assets and liabilities: |
||||||||||||
| Increase in accounts receivable |
(39,459 | ) | (42,429 | ) | (23,154 | ) | ||||||
| Increase in other assets |
(6,173 | ) | (1,095 | ) | (30,831 | ) | ||||||
| (Decrease) increase in accounts payable |
(2,710 | ) | (3,054 | ) | 4,214 | |||||||
| (Decrease) increase in accrued expenses and other current liabilities |
25,372 | 29,506 | (11,155 | ) | ||||||||
| (Decrease) increase in income taxes payable |
5,984 | (4,758 | ) | (563 | ) | |||||||
| Increase in other liabilities |
4,718 | 5,334 | 4,675 | |||||||||
| Net cash provided by operating activities |
$ | 149,987 | $ | 211,235 | $ | 158,169 | ||||||
| Investing activities |
||||||||||||
| Purchase of property, plant and equipment |
(65,896 | ) | (62,421 | ) | (52,540 | ) | ||||||
| Purchase of property, plant and equipment in an asset acquisition |
— | (7,015 | ) | — | ||||||||
| Proceeds from sale of property, plant and equipment |
3,161 | 7,405 | 1,147 | |||||||||
| Investment in affiliates |
(441 | ) | (1,789 | ) | (296 | ) | ||||||
| Purchase of short term investments |
— | (182,442 | ) | (246,914 | ) | |||||||
| Proceeds from sale of short term investments |
— | 40,780 | 255,778 | |||||||||
| Short term deposits placed with significant shareholder |
(251,832 | ) | (282,348 | ) | (111,049 | ) | ||||||
| Redemption of short term deposits with significant shareholder |
219,317 | 248,383 | 160,405 | |||||||||
| Payment for business acquisition |
(19,588 | ) | — | (20,196 | ) | |||||||
| Net cash used in investing activities |
$ | (115,279 | ) | $ | (239,447 | ) | $ | (13,665 | ) | |||
| Financing activities |
||||||||||||
| Repayment of capital lease obligations |
(2,950 | ) | (3,139 | ) | (2,603 | ) | ||||||
| Proceeds from long-term debt |
1,525 | — | — | |||||||||
| Repayment of long-term debt |
(21,458 | ) | (25,063 | ) | (30,000 | ) | ||||||
| Short-term borrowings, net |
(83,000 | ) | 25,000 | (24,820 | ) | |||||||
| Repurchase of common shares and preferred stock |
(1,994 | ) | — | — | ||||||||
| Proceeds from issuance of common shares under share based compensation plans |
2,845 | 13,214 | 13,743 | |||||||||
| Proceeds from issuance of common shares from initial public offering |
303,512 | — | — | |||||||||
| Direct cost incurred in relation to initial public offering |
(8,830 | ) | — | — | ||||||||
| Distribution to noncontrolling interest |
(8,495 | ) | (9,648 | ) | (7,866 | ) | ||||||
| Net cash provided by (used for) financing activities |
$ | 181,155 | $ | 364 | $ | (51,546 | ) | |||||
| Effect of exchange rate changes |
28,013 | (67,408 | ) | 11,726 | ||||||||
| Net increase (decrease) in cash and cash equivalents |
215,863 | (27,848 | ) | 92,958 | ||||||||
| Cash and cash equivalents at the beginning of the period |
35,430 | 279,306 | 184,050 | |||||||||
| Cash and cash equivalents at the end of the period |
$ | 279,306 | $ | 184,050 | $ | 288,734 | ||||||
| Supplementary information |
||||||||||||
| Cash paid during the period for interest |
$ | 13,526 | $ | 6,250 | $ | 4,274 | ||||||
| Cash paid during the period for income taxes |
$ | 19,789 | $ | 38,193 | $ | 67,561 | ||||||
| Property, plant and equipment acquired under capital lease obligation |
$ | 2,487 | $ | 4,941 | $ | 1,558 | ||||||
| Shares issued for business acquisition |
$ | 23,963 | $ | — | $ | — | ||||||
See accompanying notes to the Consolidated Financial Statements.
F-9
Table of Contents
GENPACT LIMITED AND ITS SUBSIDIARIES
Notes to the Consolidated Financial Statements
(In thousands, except per share data)
1. Nature of Operations
(a) Organization
Genpact Limited (the “Company”) was incorporated in Bermuda on March 29, 2007 as a subsidiary of Genpact Global Holdings SICAR S.à.r.l. (“GGH”) with the intent of making it the new holding company of the business. On July 13, 2007, the Company effectuated a transaction that resulted in the shareholders of GGH exchanging their common stock in GGH for common shares of the Company, and the shareholders of Genpact Global (Lux) S.à.r.l. (“GGL”) exchanging their preferred and common stock in GGL for common shares of the Company. As a result, Genpact Limited became the owner of all the capital stock of GGL and GGH. This transaction and other related transactions commencing on this date are referred to as the “2007 Reorganization”.
Pursuant to the above transaction, the ownership interests of the shareholders of GGH, including the noncontrolling shareholders, were exchanged for shares of Genpact Limited irrespective of whether such shareholders owned equity directly in GGH or indirectly through GGL. Such shareholders acquired the same proportionate economic interest in Genpact Limited as they had in GGH immediately prior to the 2007 Reorganization.
The above legal reorganization of GGH and GGL into the Company has been accounted for as a transfer of net assets or exchange of equity interests between entities under common control. Accordingly, the assets and liabilities transferred are recorded at their carrying value in a manner similar to the as-if pooling of interest accounting. As part of the 2007 Reorganization, GGH became a Bermuda company and its name changed to Genpact Global Holdings (Bermuda) Limited. In addition, GGL also became a Bermuda company, in accordance with the laws of Bermuda and its name changed to Genpact Global (Bermuda) Limited. We use the terms “Genpact”, “Company”, “we” and “us” to refer to both GGH and its subsidiaries prior to July 13, 2007 and Genpact Limited and its subsidiaries after such date.
The effect of the exchange of common shares of the Company in the 2007 Reorganization with the common shares of GGH has been retrospectively applied to shareholders’ equity and per share amounts in the consolidated financial statements. This retrospective application had no material effect on other amounts. The effect of the exchange of preferred stock in the 2007 Reorganization has been applied to shareholders’ equity and per share amounts in the consolidated financial statements from the effective date of the 2007 Reorganization.
Prior to December 30, 2004, the business of the Company was conducted through various entities and divisions of the General Electric Company (“GE”). On December 30, 2004, in a series of transactions referred to as the “2004 Reorganization”, GE transferred such operations to a newly formed entity, GGH. In connection with such transfers, the Company incurred debt of $180,000, $156,859 of which was used to finance in part the consideration for the transfer. Subsequently GE sold a controlling interest in GGH.
As the 2004 Reorganization resulted in a transfer of control of the Company, the 2004 Reorganization was accounted for as a business combination utilizing the purchase method.
In connection with the 2004 Reorganization, GE indemnified the Company for potential income tax and other tax related liabilities relating to periods prior to the 2004 Reorganization. Subsequent to the 2004 Reorganization, any income tax adjustments for periods prior to the 2004 Reorganization and related recoveries would be recordable as adjustments to the goodwill prior to adoption of new Financial Accounting Standards Board (FASB) guidance on Business Combinations but thereafter, the adjustments to uncertain tax positions will be recognized in the consolidated statement of income under the FASB guidance on Business Combinations.
F-10
Table of Contents
GENPACT LIMITED AND ITS SUBSIDIARIES
Notes to the Consolidated Financial Statements (Continued)
(In thousands, except per share data)
1. Nature of Operations (Continued)
However, because GE has indemnified the Company for these amounts, the net adjustment to goodwill for 2007 and 2008 was $0. Adjustments for taxes are recorded through the income statement, as are any related recoveries from GE pursuant to its indemnities. The Company has elected to adjust any such recoveries for taxes other than income taxes against the related expense. Amounts due from GE for taxes other than income taxes, under such indemnification were ($4,403) and $0, respectively, for the years ended December 31, 2008 and 2009.
On August 1, 2007, the Company commenced an initial public offering of its common shares, pursuant to which the Company and certain of its existing shareholders (referred to as the “Selling Shareholders”) each sold 17,647,059 common shares at a price of $14 per share. The offering resulted in gross proceeds of $494,118 and net proceeds to the Company and the Selling Shareholders of $233,470 each, after deducting underwriting discounts and commissions. Additionally, the Company incurred offering related expenses of $9,000. On August 14, 2007, the underwriters exercised their option to purchase 5,294,118 additional common shares from the Company at the initial offering price of $14 per share to cover over-allotments, resulting in additional gross proceeds of $74,118 and net proceeds of $70,042 to the Company, after deducting underwriting discounts and commissions.
(b) Nature of Operations
The Company is a leader in the globalization of services and technology and a pioneer in managing business processes for companies around the world. The Company combines its process expertise, information technology expertise and analytical capabilities, together with operational insight derived from its experience in diverse industries, to provide a wide range of services using its global delivery platform. The Company’s service offerings include finance and accounting, collections and customer service, insurance services, supply chain and procurement, analytics, enterprise application services and IT infrastructure services. The Company delivers services from a global network of approximately 39 locations in thirteen countries. The Company’s service delivery locations, referred to as Delivery Centers, are in India, the United States (“U.S.”), China, Mexico, Romania, The Netherlands, Hungary, The Philippines, Spain, Poland, Guatemala, South Africa and Morocco.
2. Summary of significant accounting policies
(a) Basis of preparation and principles of consolidation
The accompanying consolidated financial statements have been prepared in conformity with U.S. generally accepted accounting principles.
The accompanying financial statements have been prepared on a consolidated basis and reflect the financial statements of Genpact Limited and all of its subsidiaries that are more than 50% owned and controlled. When the Company does not have a controlling interest in an entity, but exerts a significant influence on the entity, the Company applies the equity method of accounting. All inter-company transactions and balances are eliminated in consolidation.
The noncontrolling interest disclosed in the accompanying consolidated financial statements represents the noncontrolling partners’ interest in the operation of Genpact Netherlands B.V. and the profits or losses associated with the noncontrolling partners’ interest in those operations. The noncontrolling partners are individually liable for the tax obligations on their share of profit as it is a partnership and, accordingly, noncontrolling interest has been computed prior to tax and disclosed accordingly in the consolidated statements of income.
F-11
Table of Contents
GENPACT LIMITED AND ITS SUBSIDIARIES
Notes to the Consolidated Financial Statements (Continued)
(In thousands, except per share data)
2. Summary of significant accounting policies (Continued)
On January 1, 2009 the Company reclassified amounts previously attributable to minority interest (now referred to as noncontrolling interest) to a separate component of Equity on the accompanying consolidated balance sheets and consolidated statements of equity and comprehensive income (loss). Additionally, net income attributable to noncontrolling interest is shown separately from net income in the consolidated statements of income. This reclassification had no effect on the Company’s previously reported financial position or results of operations.
Prior period amounts related to noncontrolling interest (previously referred to as minority interest) have been reclassified to conform to the current period consolidated financial statement presentation.
(b) Use of estimates
The preparation of consolidated financial statements in accordance with U.S. generally accepted accounting principles requires management to make estimates and assumptions that affect the amounts reported in the consolidated financial statements. Significant items subject to such estimates and assumptions include the useful lives of property, plant and equipment, the carrying amount of property, plant and equipment, intangibles and goodwill, the provision for doubtful receivables and the valuation allowance for deferred tax assets, valuation of derivative financial instruments, the measurements of share-based compensation, assets and obligations related to employee benefits, income tax uncertainties and other contingencies. Management believes that the estimates used in the preparation of the consolidated financial statements are reasonable. Although these estimates are based upon management’s best knowledge of current events and actions, actual results could differ from these estimates. Any changes in estimates are adjusted prospectively in the consolidated financial statements.
(c) Revenue recognition
The Company derives its revenue primarily from business process services, which are provided on both time-and-materials and fixed-price basis. The Company recognizes revenue from services under time-and-materials contracts when persuasive evidence of an arrangement exists; the sales price is fixed or determinable; and collectibility is reasonably assured. Such revenues are recognized as the services are provided. The Company’s fixed-price contracts include contracts for application maintenance and support services. Revenues on these contracts are recognized ratably over the term of the agreement. The Company accrues for revenue and receivables for the services rendered between the last billing date and the balance sheet date.
Customer contracts can also include incentive payments received for discreet benefits delivered to clients. Revenues relating to such incentive payments are recorded when the contingency is satisfied and the Company concludes the amounts are earned.
Revenue with respect to fixed-price contracts for development of software is recognized on a percentage of completion method. Guidance has been drawn from FASB guidance on Software – Revenue Recognition (previously referred to in paragraph 95 of the American Institute of Certified Public Accountants (“AICPA”) Statement of Position (“SOP”) 97-2, Software Revenue Recognition), to account for revenue from fixed price arrangements for software development and related services in conformity with FASB guidance on Revenue Recognition – Construction–Type and Production-Type Contracts (previously referred to as SOP 81-1, “Accounting for Performance of Construction-Type and Certain Production-Type Contracts”). The input (effort
F-12
Table of Contents
GENPACT LIMITED AND ITS SUBSIDIARIES
Notes to the Consolidated Financial Statements (Continued)
(In thousands, except per share data)
2. Summary of significant accounting policies (Continued)
expended) method has been used to measure progress towards completion as there is a direct relationship between input and productivity. Provisions for estimated losses, if any, on uncompleted contracts are recorded in the period in which such losses become probable based on the current contract estimates.
The Company has deferred the revenue and the costs attributable to certain process transition activities with respect to its customers where such activities do not represent the culmination of a separate earnings process. Such revenue and costs are subsequently recognized ratably over the period in which the related services are performed. Further, the deferred costs are limited to the amount of the deferred revenues.
Revenues are reported net of value-added tax, business tax and applicable discounts and allowances. Reimbursements of out-of-pocket expenses received from customers have been included as part of revenues.
(d) Cash and cash equivalents
Cash and cash equivalents consist of cash balances and all highly liquid investments purchased with an original maturity of three months or less.
(e) Short term investments
All liquid investments with an original maturity greater than 90 days but less than one year are considered to be short term investments. Marketable short term investments are classified and accounted for as available-for-sale investments. Available-for-sale investments are reported at fair value with changes in unrealized gains and losses recorded as a separate component of accumulated other comprehensive income (loss) until realized. Realized gains and losses on investments are determined based on the specific identification method and are included in “Other income (expense), net”. The Company does not hold these investments for speculative or trading purposes.
(f) Property, plant and equipment, net
Property, plant and equipment are stated at cost less accumulated depreciation and amortization. Expenditures for replacements and improvements are capitalized whereas the cost of maintenance and repairs are charged to earnings as incurred. The Company depreciates and amortizes all property, plant and equipment using the straight-line method over the following estimated economic useful lives of the assets:
| Years | ||
| Buildings |
40 | |
| Furniture and fixtures |
4 | |
| Computer equipment and servers |
4 | |
| Plant, machinery and equipment |
4 | |
| Computer software |
4 | |
| Leasehold improvements |
Lesser of lease period or 10 years | |
| Vehicles |
3-4 |
F-13
Table of Contents
GENPACT LIMITED AND ITS SUBSIDIARIES
Notes to the Consolidated Financial Statements (Continued)
(In thousands, except per share data)
2. Summary of significant accounting policies (Continued)
The Company capitalizes certain computer software and software development costs incurred in connection with developing or obtaining computer software for internal use when both the preliminary project stage is completed and it is probable that the software will be used as intended. Capitalized software costs include only (i) external direct costs of materials and services utilized in developing or obtaining computer software, (ii) compensation and related benefits for employees who are directly associated with the software project and (iii) interest costs incurred while developing internal-use computer software. Capitalized software costs are included in property, plant and equipment on Company’s consolidated balance sheet and amortized on a straight-line basis when placed into service over the estimated useful lives of the software.
Advances paid towards acquisition of property, plant and equipment outstanding as of each balance sheet date and the cost of property, plant and equipment not put to use before such date are disclosed under “Capital work in progress”.
(g) Research and development expense
Development costs incurred for software to be sold, if any, will be expensed as incurred as research and development costs until technological feasibility has been established for the product. Technological feasibility is established upon completion of a detailed design program or, in its absence, completion of a working model. Thereafter, all software production costs will be capitalized and amortized over their useful lives and reported at the lower of unamortized cost and net realizable value.
(h) Business combinations, goodwill and other intangible assets
The Company accounts for its business combinations by recognizing the identifiable tangible and intangible assets and liabilities assumed, and any noncontrolling interest in the acquired business, measured at their acquisition date fair values. All assets and liabilities of the acquired businesses, including goodwill, are assigned to reporting units.
Goodwill represents the cost of the acquired businesses in excess of the fair value of identifiable tangible and intangible net assets purchased. Goodwill is not amortized but is tested for impairment at least on an annual basis on September 30, based on a number of factors including operating results, business plans and future cash flows. Recoverability of goodwill is evaluated using a two-step process. The first step involves a comparison of the fair value of a reporting unit with its carrying value. If the carrying value of the reporting unit exceeds its fair value, the second step of the process involves a comparison of the fair value and carrying value of the goodwill of that reporting unit. If the carrying value of the goodwill of a reporting unit exceeds the fair value of that goodwill, an impairment loss is recognized in an amount equal to the excess. Goodwill of a reporting unit will be tested for impairment between annual tests if an event occurs or circumstances change that would more likely than not reduce the fair value of the reporting unit below its carrying amount.
Intangible assets acquired individually or with a group of other assets or in a business combination are carried at cost less accumulated amortization based on their estimated useful lives as follows:
| Customer-related intangible assets |
3-10 years | |
| Marketing-related intangible assets |
1-5 years | |
| Contract-related intangible assets |
1 year | |
| Other intangible assets |
3 years |
F-14
Table of Contents
GENPACT LIMITED AND ITS SUBSIDIARIES
Notes to the Consolidated Financial Statements (Continued)
(In thousands, except per share data)
2. Summary of significant accounting policies (Continued)
Intangible assets are amortized over their estimated useful lives using a method of amortization that reflects the pattern in which the economic benefits of the intangible assets are consumed or otherwise realized.
(i) Impairment of long-lived assets
Long-lived assets, including certain intangible assets, to be held and used are reviewed for impairment whenever events or changes in circumstances indicate that the carrying amount of such assets may not be recoverable. Such assets are required to be tested for impairment if the carrying amount of the assets is higher than the future undiscounted net cash flows expected to be generated from the assets. The impairment amount to be recognized is measured as the amount by which the carrying value of the assets exceeds its fair value determined using the discounted cash flow approach.
(j) Foreign currency
The consolidated financial statements are reported in U.S. Dollars. The functional currency of the Company is U.S. Dollars. The functional currency for subsidiaries organized in Europe, other than the U.K., is the Euro, and the functional currencies of subsidiaries organized in Brazil, China, Guatemala, India, Japan, Morocco, the Philippines and the U.K. are their respective local currencies. The functional currency of all other legal entities forming part of the Company is the U.S. Dollar. The translation of the functional currencies of the respective subsidiaries into U.S. Dollars is performed for balance sheet accounts using the exchange rates in effect as of the balance sheet date and for revenues and expense accounts using a monthly average exchange rate prevailing during the respective period. The gains or losses resulting from such translation are reported under accumulated other comprehensive income (loss), net, as a separate component of shareholders’ equity.
Monetary assets and liabilities of each subsidiary denominated in currencies other than the subsidiary’s functional currency are translated into their respective functional currency at the rates of exchange prevailing at the balance sheet date. Transactions of each subsidiary in currencies other than the subsidiary’s functional currency are translated into the respective functional currency at the average monthly exchange rate prevailing during the period of the transaction. The gains or losses resulting from foreign currency transactions are included in the consolidated statements of income.
(k) Loans held for sale
In August 2006, the Company acquired MoneyLine Lending Services, Inc. (now known as Genpact Mortgage Services). Prior to May 31, 2007, one of its activities was to fund mortgage loans, which it then held for sale. Such loans held for sale are carried at the lower of cost or market value, which is determined on an individual loan basis. Market value is equal to the amount of unpaid principal, reduced by market valuation adjustments and increased or reduced by net deferred loan origination fees and costs.
(l) Derivative instruments and hedging activities
In the normal course of business, the Company uses derivative financial instruments to manage foreign currency exchange rate and interest rate risk. The Company purchases forward foreign exchange contracts to mitigate the risk of changes in foreign exchange rates on inter-company transactions and forecasted transactions denominated in foreign currencies.
F-15
Table of Contents
GENPACT LIMITED AND ITS SUBSIDIARIES
Notes to the Consolidated Financial Statements (Continued)
(In thousands, except per share data)
2. Summary of significant accounting policies (Continued)
The Company recognizes derivative instruments and hedging activities as either assets or liabilities in its consolidated balance sheets and measures them at fair value. Gains and losses resulting from changes in fair value are accounted for depending on the use of the derivative and whether it is designated and qualifies for hedge accounting. Changes in fair values of derivatives designated as cash flow hedges are deferred and recorded as a component of accumulated other comprehensive income (loss), net of taxes until the hedged transactions occur and are then recognized in the consolidated statements of income along with the underlying hedged item and disclosed as part of “Total net revenues”, “Cost of revenue” and “Selling, general and administrative expenses”, as applicable. Changes in fair value of derivatives not designated as hedging instruments and the ineffective portion of derivatives designated as cash flow, and interest rate hedges are recognized in the consolidated statements of income and are included in foreign exchange (gains) losses, net, and other income (expense), net, respectively.
With respect to derivatives designated as hedges, the Company formally documents all relationships between hedging instruments and hedged items, as well as its risk management objectives and strategy for undertaking various hedge transactions. The Company also formally assesses both at the inception of the hedge and on a quarterly basis, whether each derivative is highly effective in offsetting changes in fair values or cash flows of the hedged item. If it is determined that a derivative or a portion thereof is not highly effective as a hedge, or if a derivative ceases to be a highly effective hedge, the Company will prospectively discontinue hedge accounting with respect to that derivative.
In all situations in which hedge accounting is discontinued and the derivative is retained, the Company continues to carry the derivative at its fair value on the consolidated balance sheet and recognizes any subsequent change in its fair value in the consolidated statements of income. When it is probable that a forecasted transaction will not occur, the Company discontinues hedge accounting and recognizes immediately in the consolidated statements of income the gains and losses attributable to such derivative that were accumulated in other comprehensive income (loss).
(m) Income taxes
The Company accounts for income taxes using the asset and liability method of accounting for income taxes. Under this method, income tax expense is recognized for the amount of taxes payable or refundable for the current year. In addition, deferred tax assets and liabilities are recognized for future tax consequences attributable to differences between the financial statement carrying amounts of existing assets and liabilities and their tax bases and all operating loss carry forwards, if any. Deferred tax assets and liabilities are measured using enacted tax rates expected to apply to taxable income in the years in which those temporary differences are expected to be recovered or settled. The effect on deferred tax assets and liabilities of a change in tax rates or tax status is recognized in the consolidated statement of income in the period that includes the enactment date or the filing/ approval date of the tax status change. Deferred tax assets are reduced by a valuation allowance if, based on the weight of available evidence, it is more likely than not that some portion or all of the deferred tax assets will not be realized.
On January 1, 2007, the Company modified its policies for accounting for uncertain tax positions. The Company applies a two-step approach for recognizing and measuring uncertain tax positions. The first step is to evaluate the tax position for recognition by determining, based on the technical merits, that the position will be
F-16
Table of Contents
GENPACT LIMITED AND ITS SUBSIDIARIES
Notes to the Consolidated Financial Statements (Continued)
(In thousands, except per share data)
2. Summary of significant accounting policies (Continued)
more likely than not sustained upon examination. The second step is to measure the tax benefit as the largest amount of the tax benefit that is greater than 50% likely of being realized upon settlement. The Company includes interest and penalties related to unrecognized tax benefits within its provision for income tax expense.
(n) Retirement benefits
Contributions to defined contribution plans are charged to consolidated statements of income in the period in which services are rendered by the covered employees. Current service costs for defined benefit plans are accrued in the period to which they relate. The liability in respect of defined benefit plans is calculated annually by the Company using the projected unit credit method. Prior service cost, if any, resulting from an amendment to a plan is recognized and amortized over the remaining period of service of the covered employees. The Company recognizes its liabilities for compensated absences dependent on whether the obligation is attributable to employee services already rendered, relates to rights that vest or accumulate and payment is probable and estimable.
(o) Share-based compensation
Effective January 1, 2006, the Company adopted fair value accounting for its share based compensation plan following the prospective transition method. The Company recognizes and measures compensation expense for all share-based awards based on the grant date fair value determined under the option pricing model of those awards. The Company recognizes compensation expense for stock options net of estimated forfeitures. Share-based compensation recognized in the consolidated statements of income for the years ended December 31, 2007, 2008 and 2009 is based on awards ultimately expected to vest. As a result the expense has been reduced for estimated forfeitures. Forfeitures are estimated at the time of grant and revised, if necessary, in subsequent periods if actual forfeitures differ from those estimates.
Prior to adoption of fair value accounting for its share based compensation plans the Company followed the minimum value method, to account for its stock-based awards. Under this method, compensation expense was recorded on the date of grant if the fair value of the underlying stock on date of grant exceeded the present value of the stock options on the date of grant. The Company amortizes the cost using the accelerated method of cost recognition. As required under the prospective transition method, for the portion of awards outstanding at the date of initial application of the fair value method, the Company continues to apply the minimum value method. For awards granted after the adoption of fair value method, the Company amortizes the compensation cost on a straight-line basis over the vesting period.
(p) Financial instruments and concentration of credit risk
Financial instruments that potentially subject the Company to concentration of credit risk are reflected principally in cash and cash equivalents, short term investments, short term deposits, derivative financial instruments and accounts receivable. The Company places its cash and cash equivalents and derivative financial instruments with corporations and banks with high investment grade ratings, limits the amount of credit exposure with any one corporation or bank and conducts ongoing evaluation of the credit worthiness of the corporations and banks with which it does business. Short term deposits are with GE, a significant shareholder, and with other financial institutions. To reduce its credit risk on accounts receivable, the Company performs an ongoing credit
F-17
Table of Contents
GENPACT LIMITED AND ITS SUBSIDIARIES
Notes to the Consolidated Financial Statements (Continued)
(In thousands, except per share data)
2. Summary of significant accounting policies (Continued)
evaluation of customers. GE accounted for 39% and 46% of receivables as of December 31, 2008 and 2009, respectively. GE accounted for 58%, 47% and 40% of revenues for the years ended December 31, 2007, 2008 and 2009, respectively.
(q) Earnings (loss) per share
Basic earnings per share is computed using the weighted average number of common shares outstanding during the period. Diluted earnings per share are computed using the weighted average number of common and dilutive common equivalent shares outstanding during the period. For the purposes of calculating diluted earnings per share, the treasury stock method is used for options except where the results would be anti-dilutive.
(r) Commitments and contingencies
Liabilities for loss contingencies arising from claims, assessments, litigation, fines and penalties and other sources are recorded when it is probable that a liability has been incurred and the amount of the assessment and/or remediation can be reasonably estimated. Legal costs incurred in connection with the same are expensed as incurred.
(s) Recently adopted accounting pronouncements
The authoritative bodies release standards and guidance which are assessed by management for impact on the Company’s consolidated financial statements.
The following recently released accounting standards have been adopted by the Company and certain disclosures in the consolidated financial statements and footnotes to the consolidated financial statements have been modified. Adoption of these standards did not impact the consolidated financial results as they are disclosure-only in nature:
| • | In March 2008, the FASB issued new disclosure requirements regarding derivative instruments and hedging activities. Entities must now provide enhanced disclosures on an interim and annual basis regarding how and why the entity uses derivatives; how derivatives and related hedged items are accounted for, and how derivatives and related hedged items affect the entity’s financial position, financial results and cash flow. Pursuant to the transition provisions, the Company adopted these new requirements on January 1, 2009. See note 8 for information and related disclosures. |
| • | In April 2009, the FASB issued additional requirements regarding interim disclosures about the fair value of financial instruments which were previously only disclosed on an annual basis. Entities are now required to disclose the fair value of financial instruments which are not recorded at fair value in the financial statements in both their interim and annual financial statements. The new requirements were effective for interim and annual periods ending after June 15, 2009 on a prospective basis. The Company adopted these requirements in the quarter ended June 30, 2009. |
| • | In May 2009, the FASB issued guidelines on subsequent event accounting which sets forth: 1) the period after the balance sheet date during which management of a reporting entity should evaluate events or transactions that may occur for potential recognition or disclosure in the financial statements; 2) the |
F-18
Table of Contents
GENPACT LIMITED AND ITS SUBSIDIARIES
Notes to the Consolidated Financial Statements (Continued)
(In thousands, except per share data)
2. Summary of significant accounting policies (Continued)
| circumstances under which an entity should recognize events or transactions occurring after the balance sheet date in its financial statements; and 3) the disclosures that an entity should make about events or transactions that occurred after the balance sheet date. These guidelines were effective for interim and annual periods ending after June 15, 2009, and the Company adopted them in the quarter ended June 30, 2009. |
| • | On July 1, 2009, the FASB issued the FASB Accounting Standards Codification (the Codification). The Codification became the single source of authoritative nongovernmental U.S. GAAP, superseding existing FASB, American Institute of Certified Public Accountants (AICPA), Emerging Issues Task Force (EITF) and related literature. The Codification eliminates the previous US GAAP hierarchy and establishes one level of authoritative GAAP. All other literature is considered non-authoritative. The Codification was effective for interim and annual periods ending after September 15, 2009. |
| • | In December 2008, the FASB issued guidance regarding employers’ disclosures about postretirement benefit plan assets. This guidance requires more detailed disclosures about the fair value measurements of employers’ plan assets including: (a) investment policies and strategies; (b) major categories of plan assets; (c) information about valuation techniques and inputs to those techniques, including the fair value hierarchy classifications (as defined in the Codification) of the major categories of plan assets; (d) the effects of fair value measurements using significant unobservable inputs (Level 3) on changes in plan assets; and (e) significant concentrations of risk within plan assets. See note 19 for information and related disclosures. |
| • | In December 2007, the FASB issued new guidance on noncontrolling interests in consolidated financial statements. This guidance requires that the noncontrolling interest in the equity of a subsidiary be accounted for and reported as equity, provides revised guidance on the treatment of net income and losses attributable to the noncontrolling interest and changes in ownership interests in a subsidiary and requires additional disclosures that identify and distinguish between the interests of the controlling and noncontrolling owners. Pursuant to the transition provisions, the Company adopted this new guidance on January 1, 2009 via retrospective application of the presentation and disclosure requirements. See “Consolidated Balance Sheets”, “Consolidated Statements of Income”, “Consolidated Statements of Equity and Comprehensive Income (Loss)”, and note 2(a) for information and related disclosures regarding noncontrolling interest. |
The following recently released accounting standards have been adopted by the Company without material impact on the Company’s consolidated results of operations, cash flows, financial position or disclosures:
| • | The FASB guidance on fair value measurements and disclosures became effective January 1, 2008. However, in February 2008, the FASB delayed the effective date regarding fair value measurements and disclosures of nonfinancial assets and nonfinancial liabilities, except those that are recognized or disclosed at fair value in the financial statements on a recurring basis (at least annually), to January 1, 2009. |
| • | In April 2008, the FASB issued new requirements regarding the determination of the useful lives of intangible assets. In developing assumptions about renewal or extension options used to determine the useful life of an intangible asset, an entity needs to consider its own historical experience adjusted for |
F-19
Table of Contents
GENPACT LIMITED AND ITS SUBSIDIARIES
Notes to the Consolidated Financial Statements (Continued)
(In thousands, except per share data)
2. Summary of significant accounting policies (Continued)
| entity-specific factors. In the absence of that experience, an entity shall consider the assumptions that market participants would use about renewal or extension options. The new requirements apply to intangible assets acquired after January 1, 2009. |
| • | In November 2008, the FASB’s issued guidance which continues to account for the initial carrying value of equity method investments on a cost accumulation model, which generally excludes contingent consideration. This FASB guidance also specifies that other-than-temporary impairment testing by the investor should be performed at the investment level and that a separate impairment assessment of the underlying assets is not required. An impairment charge by the investee should result in an adjustment of the investor’s basis of the impaired asset for the investor’s pro-rata share of such impairment. In addition, this FASB guidance reached a consensus on how to account for an issuance of shares by an investee that reduces the investor’s ownership share of the investee. An investor should account for such transactions as if it had sold a proportionate share of its investment with any gains or losses recorded through earnings. This FASB guidance also addresses the accounting for a change in an investment from the equity method to the cost method. This FASB guidance affirms existing guidance which requires cessation of the equity method of accounting and the application of the cost method under this guidance. The Company adopted the FASB guidance effective January 1, 2009. |
| • | In April 2009, the FASB issued an amendment to the revised business combination guidance regarding the accounting for assets acquired and liabilities assumed in a business combination that arise from contingencies. The requirements of this amended guidance carry forward without significant revision the guidance on contingencies which existed prior to January 1, 2009. Assets acquired and liabilities assumed in a business combination that arise from contingencies are recognized at fair value if fair value can be reasonably estimated. If fair value cannot be reasonably estimated, the asset or liability would generally be recognized in accordance with the Accounting Standards Codification (ASC) Topic 450 on contingencies. |
| • | In April 2009, the FASB issued guidance on the recognition and presentation of other-than-temporary impairments on investments in debt securities. If an entity’s management asserts that it does not have the intent to sell a debt security and it is more likely than not that it will not have to sell the security before recovery of its cost basis, then an entity may separate other-than-temporary impairments into two components: 1) the amount related to credit losses (recorded in earnings), and 2) all other amounts (recorded in other comprehensive income). This guidance was effective on a prospective basis for interim and annual periods ending after June 15, 2009. The Company adopted this guidance for the quarter ended June 30, 2009. |
| • | In April 2009, the FASB issued guidance on determining fair value when the volume and level of activity for an asset or liability has significantly decreased, and in identifying transactions that are not orderly. Based on the guidance, if an entity determines that the level of activity for an asset or liability has significantly decreased and that a transaction is not orderly, further analysis of transactions or quoted prices is needed, and a significant adjustment to the transaction or quoted prices may be necessary to estimate fair value. The guidance was effective on a prospective basis for interim and annual periods ending after June 15, 2009. The Company adopted this guidance in the quarter ended June 30, 2009. |
| • | In January 2010, the FASB issued guidance which modified the scope provisions that were originally contained in ASC 810-10 on noncontrolling interests and also expands required disclosures about the fair |
F-20
Table of Contents
GENPACT LIMITED AND ITS SUBSIDIARIES
Notes to the Consolidated Financial Statements (Continued)
(In thousands, except per share data)
2. Summary of significant accounting policies (Continued)
| value measurements in accounting for a change in ownership of a subsidiary and previously held equity interests in business combinations achieved in stages. The guidance is effective for the first interim or annual reporting period ending on or after December 15, 2009 and is to be applied on a retrospective basis. |
(t) Reclassification
Certain reclassifications have been made in the consolidated financial statements of prior periods to conform to the classification used in the current period.
3. Business acquisitions
(a) Genpact Netherlands B.V. (ICE)
On March 1, 2007, the Company acquired E-Transparent B.V. (subsequently renamed as Genpact Netherlands B.V.) and certain related entities, which are controlling partners in a partnership known as ICE, for cash consideration of $20,135 and 1,442,316 common shares of the Company with an estimated fair value of $23,265. Additionally, acquisition-related expenses as incurred by the Company amounted to $1,912. The purchase consideration excluding contingent consideration amounted to $45,313. Through this acquisition, the Company provides SAP enterprise solutions to business enterprises. ICE also has certain noncontrolling partners and interest related to such noncontrolling partners has been shown as noncontrolling interest.
The operations of ICE have been consolidated in the financial statements of the Company from March 1, 2007.
The purchase price has been allocated based on management’s estimates of the fair values of the acquired assets and liabilities as follows:
| Tangible fixed assets |
$ | 556 | ||
| Current assets and liabilities, net |
2,179 | |||
| Customer related intangible assets |
4,120 | |||
| Goodwill |
39,509 | |||
| Deferred tax liabilities, net |
(1,051 | ) | ||
| $ | 45,313 | |||
The terms of the acquisition agreement for ICE provided for the payment of contingent consideration in 2009 to the former shareholders of ICE, if certain profitability targets were met. As a result of achieving these profitability targets, in May 2008 the Company entered into an agreement with the former shareholders of ICE providing that additional purchase consideration of $23,539 would be paid unconditionally on February 16, 2009, and recorded the payable with an offset to goodwill in the second quarter of 2008. Such amount was paid on February 16, 2009.
(b) Axis Risk Consulting Services Private Limited (Axis)
In December 2007, the Company consummated a transaction to acquire 100% of the outstanding shares of Axis for cash consideration of $4,541 and 143,453 common shares of the Company issued to selling
F-21
Table of Contents
GENPACT LIMITED AND ITS SUBSIDIARIES
Notes to the Consolidated Financial Statements (Continued)
(In thousands, except per share data)
3. Business acquisitions (Continued)
shareholders. 94,610 common shares that were issued to selling shareholders who became employees of the Company are subject to restrictions on transfer linked to continued employment with the Company for a specified period. The Company has accounted for such shares as compensation for services as the compensation was contingent upon continued employment of the relevant employees. Accordingly only 48,843 common shares have been considered as part of purchase consideration with a fair value of $698. Additionally, acquisition-related expenses as incurred by the Company amounted to $95. The total purchase consideration amounted to $5,334. Axis is engaged in the business of providing risk consultancy, advisory and risk assurance services.
The purchase price has been allocated based on management’s estimates of the fair values of the acquired assets and liabilities as follows:
| Tangible fixed assets |
$ | 531 | ||
| Current assets and liabilities, net |
(1,726 | ) | ||
| Customer related intangible assets |
1,077 | |||
| Goodwill |
5,248 | |||
| Deferred tax assets, net |
204 | |||
| $ | 5,334 | |||
4. Cash and Cash Equivalents
Cash and cash equivalents as of December 31, 2008 and 2009 comprise:
| As of December 31, | ||||||
| 2008 | 2009 | |||||
| Deposits with banks |
$ | 75,277 | $ | 192,222 | ||
| U.S. Treasury bills |
48,690 | 38,549 | ||||
| Other cash and bank balances |
60,083 | 57,963 | ||||
| $ | 184,050 | $ | 288,734 | |||
5. Short Term Investments
The components of the Company’s short term investments as of December 31, 2008 and 2009 are as follows:
| As of December 31, 2008 | ||||||||||||
| Carrying Value |
Unrealized gains |
Unrealized losses |
Estimated Fair Value | |||||||||
| Short term investments: |
||||||||||||
| U.S. Treasury bills |
$ | 141,662 | $ | — | $ | — | $ | 141,662 | ||||
| $ | 141,662 | $ | — | $ | — | $ | 141,662 | |||||
F-22
Table of Contents
GENPACT LIMITED AND ITS SUBSIDIARIES
Notes to the Consolidated Financial Statements (Continued)
(In thousands, except per share data)
5. Short Term Investments (Continued)
| As of December 31, 2009 | ||||||||||||
| Carrying Value |
Unrealized gains |
Unrealized losses |
Estimated Fair Value | |||||||||
| Short term investments: |
||||||||||||
| U.S. Treasury bills |
$ | 132,798 | $ | — | $ | 197 | $ | 132,601 | ||||
| $ | 132,798 | $ | — | $ | 197 | $ | 132,601 | |||||
The fair value of short term investments approximates the carrying value as of December 31, 2008.
6. Accounts receivable, net of provision for doubtful receivables
The following table provides provision for doubtful receivables as recorded by the Company:
| As of December 31, |
Balance at the beginning of the year |
Additions charged to cost and expense |
Deductions | Balance at the end of the year | |||||||
| 2007 |
$ | 1,818 | 3,934 | (247 | ) | $ | 5,505 | ||||
| 2008 |
$ | 5,505 | 1,876 | (1,375 | ) | $ | 6,006 | ||||
| 2009 |
$ | 6,006 | 1,614 | (2,391 | ) | $ | 5,229 | ||||
Accounts receivable were $235,303 and $258,911, and provision for doubtful receivables were $6,006 and $5,229, resulting in net accounts receivable balances of $229,297 and $253,682, as of December 31, 2008 and 2009, respectively.
Accounts receivable from a significant shareholder, GE, were $90,308 and $117,697, and provision for doubtful receivables were $1,515 and $1,469, resulting in net accounts receivable balances of $88,793 and $116,228, as of December 31, 2008 and 2009, respectively.
F-23
Table of Contents
GENPACT LIMITED AND ITS SUBSIDIARIES
Notes to the Consolidated Financial Statements (Continued)
(In thousands, except per share data)
7. Fair Value Measurements
The Company measures certain financial assets and liabilities at fair value on a recurring basis, including derivative instruments, U.S. Treasury bills and notes, and loans held for sale. The fair value measurements of these derivative instruments, U.S. Treasury bills and loans held for sale were determined using the following inputs as of December 31, 2008 and 2009:
| As of December 31, 2008 | ||||||||||||
| Fair Value Measurements at Reporting Date Using | ||||||||||||
| Total | Quoted Prices in Active Markets for Identical Assets |
Significant Other Observable Inputs |
Significant Other unobservable Inputs | |||||||||
| (Level 1) | (Level 2) | (Level 3) | ||||||||||
| Assets |
||||||||||||
| Derivative Instruments (Note a) |
$ | 4,348 | $ | — | $ | 4,348 | $ | — | ||||
| Loans held for sale (Note a) |
759 | — | — | 759 | ||||||||
| U.S. Treasury bills (Note c) |
190,352 | 190,352 | — | — | ||||||||
| Total |
$ | 195,459 | $ | 190,352 | $ | 4,348 | $ | 759 | ||||
| Liabilities |
||||||||||||
| Derivative Instruments (Note b) |
$ | 386,951 | $ | — | $ | 386,951 | $ | — | ||||
| Total |
$ | 386,951 | $ | — | $ | 386,951 | $ | — | ||||
| As of December 31, 2009 | ||||||||||||
| Fair Value Measurements at Reporting Date Using | ||||||||||||
| Quoted Prices in Active Markets for Identical Assets |
Significant Other Observable Inputs |
Significant Other unobservable Inputs | ||||||||||
| Total | (Level 1) | (Level 2) | (Level 3) | |||||||||
| Assets |
||||||||||||
| Derivative Instruments (Note a) |
$ | 30,347 | $ | — | $ | 30,347 | $ | — | ||||
| Loans held for sale (Note a) |
552 | — | — | 552 | ||||||||
| U.S. Treasury bills and notes (Note c) |
171,150 | 171,150 | — | — | ||||||||
| Total |
$ | 202,049 | $ | 171,150 | $ | 30,347 | $ | 552 | ||||
| Liabilities |
||||||||||||
| Derivative Instruments (Note b) |
$ | 159,965 | $ | — | $ | 159,965 | $ | — | ||||
| Total |
$ | 159,965 | $ | — | $ | 159,965 | $ | — | ||||
| (a) | Included in prepaid expenses and other current assets, and other assets in the consolidated balance sheets. |
| (b) | Included in accrued expenses and other current liabilities, and other liabilities in the consolidated balance sheets. |
| (c) | Included in either cash and cash equivalents or short term investment, depending on the maturity profile, in the consolidated balance sheets. |
F-24
Table of Contents
GENPACT LIMITED AND ITS SUBSIDIARIES
Notes to the Consolidated Financial Statements (Continued)
(In thousands, except per share data)
7. Fair Value Measurements (Continued)
Following is the reconciliation of loans held for sale which have been measured at fair value using significant unobservable inputs:
| Year ended December 31, |
||||||||
| 2008 | 2009 | |||||||
| Opening balance, net |
$ | 1,743 | $ | 759 | ||||
| Impact of fair value included in earnings |
(984 | ) | 552 | |||||
| Settlements |
— | (759 | ) | |||||
| Closing balance, net |
$ | 759 | $ | 552 | ||||
The Company values the derivative instruments based on market observable inputs including both forward and spot prices for currencies. The quotes are taken from multiple independent sources including financial institutions. Loans held for sale are valued using collateral values based on inputs from a single source when the Company is not able to corroborate the inputs and assumptions with other relevant market information. Investments in U.S. Treasury bills which are classified as available-for-sale and cash and cash equivalents, depending on the maturity profile, are measured using quoted market prices at the reporting date multiplied by the quantity held.
8. Derivative financial instruments
The Company is exposed to the risk of rate fluctuations on foreign currency assets and liabilities, and foreign currency denominated forecasted cash flows. The Company has established risk management policies, including the use of derivative financial instruments to hedge foreign currency assets and liabilities, and foreign currency denominated forecasted cash flows. These derivative financial instruments are largely deliverable and non-deliverable forward foreign exchange contracts. The Company enters into these contracts with counterparties which are banks / financial institutions and the Company considers the risks of non-performance by the counterparties as non-material. The forward foreign exchange contracts mature between zero and forty-two months and the forecasted transactions are expected to occur during the same period.
F-25
Table of Contents
GENPACT LIMITED AND ITS SUBSIDIARIES
Notes to the Consolidated Financial Statements (Continued)
(In thousands, except per share data)
8. Derivative financial instruments (Continued)
The following table presents the aggregate notional principal amounts of the outstanding derivative financial instruments together with the related balance sheet exposure:
| Notional principal amounts (Note a) |
Balance sheet exposure asset (liability) (Note b) |
|||||||||||||
| As of December 31, | As of December 31, | |||||||||||||
| 2008 | 2009 | 2008 | 2009 | |||||||||||
| Foreign exchange forward contracts denominated in: |
||||||||||||||
| United States Dollars (sell) Indian Rupees (buy) |
$ | 2,526,000 | $ | 2,215,000 | $ | (334,212 | ) | $ | (115,883 | ) | ||||
| United States Dollars (sell) Mexican Peso (buy) |
24,000 | 15,400 | (4,660 | ) | 599 | |||||||||
| United States Dollars (sell) Philippines Peso (buy) |
8,000 | 20,550 | (68 | ) | 577 | |||||||||
| Euro (sell) United States Dollars (buy) |
13,831 | 44,329 | (171 | ) | (42 | ) | ||||||||
| Euro (buy) United States Dollars (sell) |
23,033 | — | (2,181 | ) | — | |||||||||
| Euro (sell) Hungarian Forints (buy) |
29,739 | 9,095 | (767 | ) | 108 | |||||||||
| Euro (sell) Romanian Leu (buy) |
101,914 | 63,637 | (32,210 | ) | (7,781 | ) | ||||||||
| Japanese Yen (sell) Chinese Renminbi (buy) |
59,859 | 62,483 | (9,983 | ) | (4,985 | ) | ||||||||
| Pound Sterling (sell) United States Dollars (buy) |
11,993 | 51,149 | 1,568 | 406 | ||||||||||
| Australian Dollars (sell) United States Dollars (buy) |
4,418 | 26,461 | 81 | (2,617 | ) | |||||||||
| $ | (382,603 | ) | $ | (129,618 | ) | |||||||||
| (a) | Notional amounts are key elements of derivative financial instrument agreements, but do not represent the amount exchanged by counterparties and do not measure the Company’s exposure to credit or market risks. However, the amounts exchanged are based on the notional amounts and other provisions of the underlying derivative financial instruments agreements. |
| (b) | Balance sheet exposure is denominated in U.S. Dollars and denotes the mark-to-market impact of the derivative financial instruments on the reporting date. |
FASB guidance on Derivatives and Hedging (previously referred to as SFAS No. 133) requires companies to recognize all derivative instruments as either assets or liabilities at fair value in the statement of financial position. In accordance with the FASB guidance on Derivatives and Hedging, the Company designates foreign exchange forward contracts as cash flow hedges of forecasted revenues and purchase of services. In addition to this the Company also has derivative instruments that are not designated as hedges under the FASB guidance, to hedge the fluctuations in foreign exchange rates for recognized balance sheet items such as receivables and inter-company borrowings.
F-26
Table of Contents
GENPACT LIMITED AND ITS SUBSIDIARIES
Notes to the Consolidated Financial Statements (Continued)
(In thousands, except per share data)
8. Derivative financial instruments (Continued)
The fair value of the derivative instruments and their location on the financial statements of the Company is summarized in the table below:
| Cash flow | Non-designated | |||||||||||
| As of December 31, 2008 |
As of December 31, 2009 |
As of December 31, 2008 |
As of December 31, 2009 | |||||||||
| Assets |
||||||||||||
| Prepaid expenses and other current assets |
$ | 2,766 | $ | 4,133 | $ | 1,373 | $ | 3,502 | ||||
| Other assets |
$ | 209 | $ | 22,712 | $ | — | $ | — | ||||
| Liabilities |
||||||||||||
| Accrued expenses and other current liabilities |
$ | 100,381 | $ | 97,696 | $ | 9,571 | $ | 2,175 | ||||
| Other liabilities |
$ | 276,999 | $ | 60,094 | $ | — | $ | — | ||||
Cash flow hedges
For derivative instruments that are designated and qualify as a cash flow hedge, the effective portion of the gain (loss) on the derivative instrument is reported as a component of accumulated other comprehensive income (loss) and reclassified into earnings in the same period or periods during which the hedged transaction affects earnings. Gains (losses) on the derivatives representing either hedge ineffectiveness or hedge components excluded from the assessment of effectiveness are recognized in earnings.
In connection with cash flow hedges, the Company has recorded as a component of accumulated other comprehensive income (loss) or OCI within equity a gain (loss) of ($247,025), and ($87,001), net of taxes, as of December 31, 2008 and 2009, respectively.
F-27
Table of Contents
GENPACT LIMITED AND ITS SUBSIDIARIES
Notes to the Consolidated Financial Statements (Continued)
(In thousands, except per share data)
8. Derivative financial instruments (Continued)
The gains / losses recognized in accumulated other comprehensive income (loss), and their effect on financial performance is summarized below:
| Derivatives in Cash Flow Hedging Relationships |
Amount of Gain (Loss) recognized in OCI on Derivatives (Effective Portion) |
Location of (Gain) |
Amount of (Gain) Loss classified from Accumulated OCI into Income (Effective Portion) |
Location of (Gain) |
Amount of (Gain) Loss recognized in income on Derivative (Ineffective Portion and Amount excluded from Effectiveness Testing) | |||||||||||||||||||||||||||
| As of December 31, | Year ended December 31, | Year ended December 31, | ||||||||||||||||||||||||||||||
| 2008 | 2009 | 2007 | 2008 | 2009 | 2007 | 2008 | 2009 | |||||||||||||||||||||||||
| Forward foreign exchange contracts |
$ | (374,406 | ) | $ | (130,945 | ) | Revenue |
$ | (487 | ) | $ | (2,783 | ) | $ | 6,645 | Foreign exchange (gains) losses, net |
$ | — | $ | — | $ | — | ||||||||||
| Cost of revenue |
(32,525 | ) | (7,402 | ) | 43,344 | |||||||||||||||||||||||||||
| Selling, general and administrative expenses |
(13,083 | ) | (3,901 | ) | 10,985 | |||||||||||||||||||||||||||
| $ | (374,406 | ) | $ | (130,945 | ) | $ | (46,095 | ) | $ | (14,086 | ) | $ | 60,974 | $ | — | $ | — | $ | — | |||||||||||||
Non designated Hedges
| Derivatives not designated as hedging instruments |
Location of (Gain) Loss recognized in Statement of Income |
Amount of (Gain) Loss recognised in Statement of Income |
|||||||||||
| Year ended December 31, | |||||||||||||
| 2007 | 2008 | 2009 | |||||||||||
| Forward foreign exchange contracts (Note a) |
Foreign exchange (gains) losses, net |
$ | (24,552 | ) | $ | 37,237 | $ | (8,153 | ) | ||||
| Forward foreign exchange contracts (Note b) |
Foreign exchange (gains) losses, net |
— | — | 11,746 | |||||||||
| Interest rate swaps (Note c) |
Other income (expense), net |
69 | 283 | — | |||||||||
| $ | (24,483 | ) | $ | 37,520 | $ | 3,593 | |||||||
| (a) | These forward foreign exchange contracts were entered into to hedge the fluctuations in foreign exchange rates for recognized balance sheet items such as receivables and inter-company borrowings, and were not originally designated as hedges under FASB guidance on Derivatives and Hedging. Realized (gains) losses and changes in the fair value of these derivatives are recorded in foreign exchange (gains) losses, net in the consolidated statements of income. The amount of (gains) losses for the year ended 2007 includes realized (gains) losses and changes in the fair value of Options amounting to $(1,068). |
| (b) | These forward foreign exchange contracts were initially designated as cash flow hedges under FASB guidance on Derivatives and Hedging. The net loss amounts of $0, $0 and $11,746 for the years ended December 31, 2007, 2008 and 2009 respectively, include the recognition of previously unrecognized losses for certain |
F-28
Table of Contents
GENPACT LIMITED AND ITS SUBSIDIARIES
Notes to the Consolidated Financial Statements (Continued)
(In thousands, except per share data)
8. Derivative financial instruments (Continued)
| derivative contracts accounted for within accumulated other comprehensive income (loss). These losses were recognized as certain forecasted transactions are no longer expected to occur and therefore hedge accounting is no longer applied. For the years ended December 31, 2007, 2008 and 2009, losses of $0, $0 and $13,964, respectively, were recognized in the consolidated statements of income related to these non-designated contracts. In addition, these amounts also include subsequent realized (gains) losses and changes in the fair value of these derivatives and are recorded in foreign exchange (gains) losses, net in the consolidated statements of income. |
| (c) | The Company uses derivative instruments that are not designated as hedges under FASB guidance on Derivatives and Hedging, to hedge the fluctuations in interest rate on borrowings. Realized (gains) losses and changes in the fair value of these derivatives are recorded in other income (expense), net in the consolidated statements of income. |
9. Prepaid expenses and other current assets
Prepaid expenses and other current assets consist of the following:
| As of December 31, | ||||||||
| 2008 | 2009 | |||||||
| Advance taxes |
$ | 24,700 | $ | 47,966 | ||||
| Deferred transition costs |
47,006 | 39,765 | ||||||
| Loans held for sale |
759 | 552 | ||||||
| Derivative instruments |
4,139 | 7,635 | ||||||
| Employee advances |
2,611 | 2,214 | ||||||
| Advances to suppliers |
1,795 | 3,998 | ||||||
| Prepaid expenses |
5,867 | 9,492 | ||||||
| Deposits |
499 | 1,411 | ||||||
| Others |
3,988 | 3,527 | ||||||
| 91,364 | 116,560 | |||||||
| Less: Due from a significant shareholder |
(1,428 | ) | (9 | ) | ||||
| $ | 89,936 | $ | 116,551 | |||||
F-29
Table of Contents
GENPACT LIMITED AND ITS SUBSIDIARIES
Notes to the Consolidated Financial Statements (Continued)
(In thousands, except per share data)
10. Property, plant and equipment, net
Property, plant and equipment, net consist of the following:
| As of December 31, | ||||||||
| 2008 | 2009 | |||||||
| Land |
$ | 14,610 | $ | 20,355 | ||||
| Buildings |
38,708 | 40,641 | ||||||
| Furniture and fixtures |
22,002 | 23,763 | ||||||
| Computer equipment and servers |
93,408 | 111,094 | ||||||
| Plant, machinery and equipment |
32,329 | 40,583 | ||||||
| Computer software |
50,028 | 68,012 | ||||||
| Leasehold improvements |
47,672 | 58,705 | ||||||
| Vehicles |
7,225 | 7,439 | ||||||
| Capital work in progress |
13,067 | 10,658 | ||||||
| Property, plant and equipment, gross |
319,049 | 381,250 | ||||||
| Less: Accumulated depreciation and amortization |
(144,783 | ) | (192,138 | ) | ||||
| Property, plant, and equipment, net |
$ | 174,266 | $ | 189,112 | ||||
Depreciation expense on property, plant and equipment for the years ended December 31, 2007, 2008 and 2009 was $34,665, $37,094 and $44,601, respectively. The amount of computer software amortization for the years ended December 31, 2007, 2008 and 2009 was $9,434, $16,819 and $12,415, respectively.
The above depreciation and amortization expense includes the effect of reclassification of foreign exchange (gains) losses related to the effective portion of the foreign currency derivative contracts amounting to ($3,553), ($727) and $3,969 for the years ended December 31, 2007, 2008 and 2009, respectively.
Property, plant and equipment, net include assets held under capital lease arrangements, which consist of the following:
| As of December 31, | ||||||||
| 2008 | 2009 | |||||||
| Vehicles |
$ | 6,133 | $ | 5,981 | ||||
| Furniture and fixtures |
2,609 | 2,741 | ||||||
| 8,742 | 8,722 | |||||||
| Less: Accumulated depreciation |
(2,866 | ) | (5,146 | ) | ||||
| $ | 5,876 | $ | 3,576 | |||||
Depreciation expense in respect of these assets was $1,966, $2,122 and $3,390 for the years ended December 31, 2007, 2008 and 2009, respectively.
F-30
Table of Contents
GENPACT LIMITED AND ITS SUBSIDIARIES
Notes to the Consolidated Financial Statements (Continued)
(In thousands, except per share data)
11. Goodwill and intangible assets
The following table presents the changes in goodwill for the years ended December 31, 2008 and 2009:
| As of December 31, | |||||||
| 2008 | 2009 | ||||||
| Opening balance |
$ | 601,120 | $ | 531,897 | |||
| Additional goodwill representing contingent consideration in Genpact Netherlands B.V. (ICE) |
23,539 | — | |||||
| Reversal of valuation allowance recorded in connection with past business acquisitions |
(356 | ) | — | ||||
| Effect of exchange rate fluctuations |
(92,406 | ) | 16,826 | ||||
| Closing balance |
$ | 531,897 | $ | 548,723 | |||
Goodwill has been allocated as follows:
| As of December 31, | ||||||
| 2008 | 2009 | |||||
| India |
$ | 394,458 | $ | 405,466 | ||
| China |
22,253 | 22,319 | ||||
| Europe |
17,206 | 18,472 | ||||
| Americas |
37,604 | 37,604 | ||||
| Others |
60,376 | 64,862 | ||||
| $ | 531,897 | $ | 548,723 | |||
During 2008 and 2009, the Company performed its annual impairment review of goodwill and concluded that there was no impairment in either year. The results of evaluation showed that the fair values of all the reporting units exceeded their respective carrying values. The total amount of goodwill deductible for tax purposes is $15,980 and $13,805 as of December 31, 2008 and 2009, respectively.
The Company’s intangible assets acquired either individually or with a group of other assets or in a business combination are as follows:
| As of December 31, 2008 | As of December 31, 2009 | |||||||||||||||||
| Gross carrying amount |
Accumulated amortization |
Net | Gross carrying amount |
Accumulated amortization |
Net | |||||||||||||
| Customer-related intangible assets |
$ | 203,001 | $ | 146,059 | $ | 56,942 | $ | 208,117 | $ | 172,076 | $ | 36,041 | ||||||
| Marketing-related intangible assets |
15,433 | 10,508 | 4,925 | 15,685 | 15,685 | — | ||||||||||||
| Contract-related intangible assets |
458 | 458 | — | 471 | 471 | — | ||||||||||||
| Other intangible assets |
343 | 43 | 300 | 343 | 156 | 187 | ||||||||||||
| $ | 219,235 | $ | 157,068 | $ | 62,167 | $ | 224,616 | $ | 188,388 | $ | 36,228 | |||||||
Amortization expenses for intangible assets as disclosed in the consolidated statements of income under amortization of acquired intangible assets for the years ended December 31, 2007, 2008 and 2009 were $36,938, $36,513 and $25,969, respectively. Intangible assets recorded for the 2004 Reorganization include the incremental value of the minimum volume commitment from GE, entered into contemporaneously with the 2004
F-31
Table of Contents
GENPACT LIMITED AND ITS SUBSIDIARIES
Notes to the Consolidated Financial Statements (Continued)
(In thousands, except per share data)
11. Goodwill and intangible assets (Continued)
Reorganization, over the value of the pre-existing customer relationship with GE. The amortization of this intangible asset for the years ended December 31, 2007, 2008 and 2009 was $1,018, $913 and $571, respectively, and has been reported as a reduction of revenue. As of December 31, 2009, the unamortized value of the intangible asset was $552, which will be amortized in future periods and reported as a reduction of revenue.
The estimated amortization schedule for the intangible assets for future periods is set out below:
| For the year ending December 31 | |||
| 2010 |
$ | 14,032 | |
| 2011 |
9,381 | ||
| 2012 |
7,375 | ||
| 2013 |
3,264 | ||
| 2014 |
2,176 | ||
| $ | 36,228 | ||
12. Other assets
Other assets consist of the following:
| As of December 31, | ||||||
| 2008 | 2009 | |||||
| Advance taxes |
$ | 7,322 | $ | 10,474 | ||
| Deferred transition costs |
38,417 | 28,119 | ||||
| Deposits |
21,549 | 22,646 | ||||
| Derivative instruments |
209 | 22,712 | ||||
| Prepaid expenses |
688 | 1,214 | ||||
| Others |
3,505 | 4,082 | ||||
| $ | 71,690 | $ | 89,247 | |||
13. Loans held for sale
Loans held for sale were $2,049 and $1,009, and provision against loans held for sale were $1,290 and $457, resulting in net loans held for sale balances of $759 and $552 as of December 31, 2008 and 2009, respectively. Additionally, the Company has reserved $696 and $226 as of December 31, 2008 and 2009, respectively, for estimated losses on loans sold.
F-32
Table of Contents
GENPACT LIMITED AND ITS SUBSIDIARIES
Notes to the Consolidated Financial Statements (Continued)
(In thousands, except per share data)
14. Leases
The Company has taken vehicles, and furniture and fixtures on lease from a significant shareholder and other lessors under capital lease arrangements. Future minimum lease payments are as follows:
| As of December 31: |
||||
| 2010 |
$ | 2,544 | ||
| 2011 |
1,995 | |||
| 2012 |
1,355 | |||
| 2013 |
553 | |||
| 2014 |
4 | |||
| Total minimum lease payments |
6,451 | |||
| Less: amount representing future interest |
(1,116 | ) | ||
| Present value of minimum lease payments |
5,335 | |||
| Less: current portion |
(1,956 | ) | ||
| Long-term capital lease obligations |
$ | 3,379 | ||
The Company conducts its operations using facilities under non-cancellable operating lease agreements that expire at various dates. Future minimum lease payments under these agreements are as follows:
| Year ending December 31: |
|||
| 2010 |
$ | 23,457 | |
| 2011 |
23,026 | ||
| 2012 |
20,428 | ||
| 2013 |
18,932 | ||
| 2014 and beyond |
51,263 | ||
| Total minimum lease payments |
$ | 137,106 | |
Rental expenses in agreements with rent holidays and scheduled rent increases are recorded on a straight line basis over the lease term. Rent expenses under cancellable and non-cancellable operating leases were $18,400, $41,360 and $40,278 for the years ended December 31, 2007, 2008 and 2009, respectively.
The above rental expense includes the effect of reclassification of foreign exchange (gains) losses related to the effective portion of the foreign currency derivative contracts amounting to ($2,099), ($614) and $2,790 for the years ended December 31, 2007, 2008 and 2009, respectively.
F-33
Table of Contents
GENPACT LIMITED AND ITS SUBSIDIARIES
Notes to the Consolidated Financial Statements (Continued)
(In thousands, except per share data)
15. Accrued expenses and other current liabilities
Accrued expenses and other current liabilities consist of the following:
| As of December 31, | ||||||||
| 2008 | 2009 | |||||||
| Accrued expenses |
$ | 64,484 | $ | 73,061 | ||||
| Accrued employee cost |
59,114 | 72,882 | ||||||
| Deferred transition revenue |
54,716 | 46,983 | ||||||
| Statutory liabilities |
13,880 | 16,589 | ||||||
| Retirement benefits |
14,293 | 8,217 | ||||||
| Derivative instruments |
109,952 | 99,871 | ||||||
| Advance from customers |
15,335 | 10,397 | ||||||
| Other liabilities |
26,267 | 2,616 | ||||||
| 358,041 | 330,616 | |||||||
| Less: Due to a significant shareholder |
(10,865 | ) | (7,843 | ) | ||||
| $ | 347,176 | $ | 322,773 | |||||
16. Short-term borrowings
The Company has the following borrowing facilities:
| (a) | fund-based and non-fund-based credit facilities with banks which are available for operational requirements in the form of overdrafts, letters of credit, guarantees, short-term loans, and forward hedging. As of December 31, 2008 and 2009, the limits available were $41,927 and $42,310, respectively, and an amount of $ 177 was outstanding as of 31 December 2009 bearing interest of 7.28% p.a. (overnight BUBOR of 5.78% + margin of 1.5%) |
| (b) | fund-based and non-fund-based revolving credit facilities of $145,000 for operational requirements in the form of overdrafts and letters of credit, expiring in 2011. As of December 31, 2008 and 2009, the fund-based outstanding balances were $25,000 and $0, respectively. These facilities bear interest at LIBOR plus a margin of 0.70% to 0.875% (depending upon leverage). Indebtedness under these facilities is secured by certain assets. The agreement contains certain covenants including a restriction on indebtedness of the Company. |
17. Long-term debt
The outstanding loan bears interest at LIBOR plus a margin (depending on the Company’s leverage). The interest rates were 4.51% and 1.01%, as of December 31, 2008 and 2009, respectively. Indebtedness under the loan agreement is secured by certain assets, and the agreement contains certain covenants including a restriction on indebtedness of the Company. The amounts outstanding were $99,204 and $69,665, as of December 31, 2008 and 2009, respectively.
F-34
Table of Contents
GENPACT LIMITED AND ITS SUBSIDIARIES
Notes to the Consolidated Financial Statements (Continued)
(In thousands, except per share data)
17. Long-term debt (Continued)
The maturity profile of these loans is as follows:
| Year |
|||
| 2010 |
$ | 44,715 | |
| 2011 |
24,950 | ||
| $ | 69,665 | ||
18. Other liabilities
Other liabilities consist of the following:
| As of December 31, | ||||||||
| 2008 | 2009 | |||||||
| Accrued employee cost |
$ | 4,974 | $ | 2,434 | ||||
| Deferred transition revenue |
45,814 | 33,013 | ||||||
| Retirement benefits |
2,511 | 7,049 | ||||||
| Derivative instruments |
276,999 | 60,094 | ||||||
| Amount received from a significant shareholder under indemnification arrangement, pending adjustment |
7,322 | 10,474 | ||||||
| Others |
5,101 | 6,444 | ||||||
| 342,721 | 119,508 | |||||||
| Less: Due to a significant shareholder |
(7,322 | ) | (10,474 | ) | ||||
| $ | 335,399 | $ | 109,034 | |||||
19. Employee benefit plans
The Company has employee benefit plans in the form of certain statutory and other schemes covering its employees.
Defined benefit plans
In accordance with Indian law, the Company provides a defined benefit retirement plan (the “Gratuity Plan”) covering substantially all of its Indian employees. The Gratuity Plan provides a lump sum payment to vested employees upon retirement or termination of employment in an amount based on each employee’s salary and duration of employment with the Company. The Gratuity Plan benefit cost for the year is calculated on an actuarial basis. Current service costs for the Gratuity Plan are accrued in the year to which they relate on a monthly basis. Actuarial gains or losses or prior service costs, if any, resulting from amendments to the plans are recognized and amortized over the remaining period of service of the employees.
The following table sets forth the funded status of the Gratuity Plan and the amounts recognized in the Company’s consolidated financial statements based on an actuarial valuation carried out as of December 31, 2008 and 2009.
F-35
Table of Contents
GENPACT LIMITED AND ITS SUBSIDIARIES
Notes to the Consolidated Financial Statements (Continued)
(In thousands, except per share data)
19. Employee benefit plans (Continued)
| As of December 31, | ||||||||
| 2008 | 2009 | |||||||
| Change in benefit obligation |
||||||||
| Projected benefit obligation at the beginning of the year |
$ | 6,900 | $ | 8,036 | ||||
| Service cost |
1,623 | 1,969 | ||||||
| Actuarial loss (gain) |
1,531 | 287 | ||||||
| Interest cost |
641 | 806 | ||||||
| Benefits paid |
(1,082 | ) | (992 | ) | ||||
| Effect of exchange rate changes |
(1,577 | ) | 310 | |||||
| Projected benefit obligation at the end of the year |
$ | 8,036 | $ | 10,416 | ||||
| As of December 31, | ||||||||
| 2008 | 2009 | |||||||
| Change in fair value of plan assets |
||||||||
| Fair value of plan assets at the beginning of the year |
$ | 5,248 | $ | 6,270 | ||||
| Employer contributions |
2,777 | 3,908 | ||||||
| Actual gain on plan assets |
308 | 670 | ||||||
| Benefits paid |
(1,082 | ) | (992 | ) | ||||
| Effect of exchange rate changes |
(981 | ) | 167 | |||||
| Fair value of plan assets at the end of the year |
$ | 6,270 | $ | 10,023 | ||||
Amounts included in accumulated other comprehensive income (loss) as of December 31, 2008 and 2009 were as follows:
| As of December 31, | ||||||||
| 2008 | 2009 | |||||||
| Net actuarial loss |
$ | (2,486 | ) | $ | (2,451 | ) | ||
| Deferred tax assets |
148 | 152 | ||||||
| Accumulated other comprehensive income, net |
$ | (2,338 | ) | $ | (2,299 | ) | ||
Changes in accumulated other comprehensive income (loss) during the year ended December 31, 2009 were as follows:
| Net Actuarial loss |
$ | (325 | ) | |
| Amortization of net actuarial loss |
427 | |||
| Deferred income taxes |
— | |||
| Effect of exchange rate changes |
23 | |||
| Accumulated other comprehensive income (loss), net |
$ | 125 | ||
F-36
Table of Contents
GENPACT LIMITED AND ITS SUBSIDIARIES
Notes to the Consolidated Financial Statements (Continued)
(In thousands, except per share data)
19. Employee benefit plans (Continued)
Net Gratuity Plan costs for the years ended December 31, 2007, 2008 and 2009 include the following components:
| Year ended December 31, | ||||||||||||
| 2007 | 2008 | 2009 | ||||||||||
| Service costs |
$ | 1,325 | $ | 1,623 | $ | 1,969 | ||||||
| Interest costs |
345 | 641 | 806 | |||||||||
| Amortization of actuarial loss |
268 | 465 | 427 | |||||||||
| Expected return on plan assets |
(286 | ) | (347 | ) | (567 | ) | ||||||
| Net Gratuity Plan costs |
$ | 1,652 | $ | 2,382 | $ | 2,635 | ||||||
The amount in accumulated other comprehensive income (loss) that is expected to be recognized as a component of net periodic benefit cost over the next fiscal year is $348.
The weighted average assumptions used to determine the benefit obligations as of December 31, 2008 and 2009 are presented below:
| As of December 31, | ||||
| 2008 | 2009 | |||
| Discount rate |
8.75% | 7.90% | ||
| Rate of increase in compensation per annum |
10.5% for first 3 years & 7% thereafter |
8.0% | ||
The weighted average assumptions used to determine the Gratuity Plan costs for the years ended December 31, 2007, 2008 and 2009 are presented below:
| Year ended December 31, | ||||||
| 2007 | 2008 | 2009 | ||||
| Discount rate |
8.5% | 9.00% | 8.75% | |||
| Rate of increase in compensation per annum |
11.5% for first 3 years & 8% thereafter |
11.5% for first 3 years & 8% thereafter |
10.5% for first 3 years & 7% thereafter | |||
| Expected long term rate of return on plan assets per annum |
7.5% | 7.5% | 7.5% | |||
The above expected return on plan assets is based on Company’s expectation of the average long term rate of return expected to prevail over the next 15 to 20 years on the types of investments prescribed as per the statutory pattern of investment.
The Company assesses these assumptions with its projected long-term plans of growth and prevalent industry standards. Unrecognized actuarial loss is amortized over the average remaining service period of the active employees expected to receive benefits under the plan.
The Company contributes the required funding for all ascertained liabilities to the Genpact India Employees’ Gratuity Fund. Trustees administer contributions made to the trust, and contributions are invested in
F-37
Table of Contents
GENPACT LIMITED AND ITS SUBSIDIARIES
Notes to the Consolidated Financial Statements (Continued)
(In thousands, except per share data)
19. Employee benefit plans (Continued)
specific designated instruments as permitted by Indian law. The Company’s overall investment strategy is to invest predominantly in fixed income funds managed by asset management companies. These funds further invest in debt securities like money market instruments, government securities and public and private bonds. During the years ending December 31, 2007, 2008 and 2009, all of the plan assets were primarily invested in debt securities.
The fair values of Company’s plan assets as of December 31, 2009 by asset category are as follows:
| As of December 31, 2009 | ||||||||||||
| Fair Value Measurements at Reporting Date Using | ||||||||||||
| Total | Quoted Prices in Active Markets for Identical Assets |
Significant Other Observable Inputs |
Significant Unobservable Inputs | |||||||||
| (Level 1) | (Level 2) | (Level 3) | ||||||||||
| Asset Category |
||||||||||||
| Cash |
$ | 163 | $ | 163 | $ | — | $ | — | ||||
| Fixed Income Securities (Note a) |
7,954 | — | 7,954 | — | ||||||||
| Other Securities (Note b) |
1,906 | — | 1,906 | — | ||||||||
| Total |
$ | 10,023 | $ | 163 | $ | 9,860 | $ | — | ||||
| (a) | Include investment in funds which invest 100% in fixed income securities like money market instruments, government securities and public and private bonds. |
| (b) | Include investment in funds which invest 50% to 85% in fixed income securities and the remaining portion in equity securities. |
The following benefit payments reflect expected future service, as appropriate, which are expected to be paid during the years shown:
| Year ending December 31, |
|||
| 2010 |
$ | 1,869 | |
| 2011 |
2,421 | ||
| 2012 |
2,735 | ||
| 2013 |
2,958 | ||
| 2014 |
3,176 | ||
| 2015–2019 |
12,985 | ||
| $ | 26,144 | ||
The expected benefit payments are based on the same assumptions that were used to measure the Company’s benefit obligations as of December 31, 2009.
F-38
Table of Contents
GENPACT LIMITED AND ITS SUBSIDIARIES
Notes to the Consolidated Financial Statements (Continued)
(In thousands, except per share data)
19. Employee benefit plans (Continued)
Defined contribution plans
During the years ended December 31, 2007, 2008 and 2009, the Company contributed the following amounts to defined contribution plans in various jurisdictions:
| Year ended December 31, | |||||||||
| 2007 | 2008 | 2009 | |||||||
| India |
$ | 9,359 | $ | 8,654 | $ | 8,111 | |||
| U.S. |
1,741 | 1,047 | 1,011 | ||||||
| U.K. |
813 | 658 | 561 | ||||||
| Hungary |
176 | 101 | 62 | ||||||
| China |
3,368 | 5,977 | 6,771 | ||||||
| Morocco |
— | — | 100 | ||||||
| Mexico |
87 | 101 | 57 | ||||||
| South Africa |
— | — | 87 | ||||||
| Total |
$ | 15,544 | $ | 16,538 | $ | 16,760 | |||
20. Share-based compensation
The Company has issued options under the Genpact Global Holdings 2005 Plan (the “2005 Plan”), Genpact Global Holdings 2006 Plan (the “2006 Plan”), Genpact Global Holdings 2007 Plan (the “2007 Plan”) and Genpact Limited 2007 Omnibus Incentive Compensation Plan (the “2007 Omnibus Plan”) to eligible persons who are employees, directors and certain other persons associated with the Company. As stated in note 1(a), as part of the 2007 Reorganization, GGH’s existing equity-based compensation plans were assigned to Genpact Limited. As a result, all outstanding options issued under existing equity-based compensation plans became options to acquire common shares of Genpact Limited. As the fair value of options immediately before and after the 2007 Reorganization were the same, there is no accounting effect of the 2007 Reorganization.
With respect to options granted under the 2005, 2006 and 2007 Plans up to the date of adoption of the 2007 Omnibus Plan, if an award granted under any of the Plans is forfeited or otherwise expires, terminates, or is cancelled without the delivery of shares, then the shares covered by the forfeited, expired, terminated, or cancelled award will be added to the number of shares otherwise available for grant under the respective Plans.
From the date of adoption of the 2007 Omnibus Plan on July 13, 2007, the options forfeited, expired, terminated, or cancelled under any of the plans will be added to the number of shares otherwise available for grant under the 2007 Omnibus Plan.
A brief summary of each plan is provided below:
2005 Plan
Under the 2005 Plan, which was adopted on July 26, 2005, the Company is authorized to issue up to 12,210,750 options to eligible persons and has granted 12,403,445 options up to the year ended December 31, 2009.
F-39
Table of Contents
GENPACT LIMITED AND ITS SUBSIDIARIES
Notes to the Consolidated Financial Statements (Continued)
(In thousands, except per share data)
20. Share-based compensation (Continued)
2006 Plan
Under the 2006 Plan, which was adopted on February 27, 2006, the Company is authorized to issue up to 4,942,369 options to eligible persons and has granted 5,260,692 options up to the year ended December 31, 2009.
2007 Plan
Under the 2007 Plan, which was adopted on March 27, 2007, the Company is authorized to issue up to 16,733,250 options to eligible persons and has granted 8,647,050 options up to the year ended December 31, 2009.
2007 Omnibus Plan
The Company adopted the 2007 Omnibus Plan on July 13, 2007. The 2007 Omnibus Plan provides for the grant of options intended to qualify as incentive stock options, non-qualified stock options, share appreciation rights, restricted share awards, restricted share units, performance units, cash incentive awards and other equity-based or equity-related awards. Under the 2007 Omnibus Plan the Company is authorized to grant awards for the issuance of common shares in the future up to a limit of 9,406,800 common shares to eligible persons, of which 6,706,033 options and 325,000 Restricted Share Units were granted up to the year ended December 31, 2009.
The share-based compensation costs relating to the above plans during the years ended December 31, 2007, 2008 and 2009, were $13,021, $16,936 and $19,262, respectively, have been allocated to cost of revenue and selling, general, and administrative expenses.
The tax benefit recognized in relation to share based compensation charge during the years ended December 31, 2007, 2008 and 2009 was $449, $3,001 and $4,617, respectively. No realized tax benefit on the options exercised during the years ended December 31, 2007, 2008 and 2009 has been recorded through shareholders’ equity due to losses in U.S. subsidiaries.
The options granted are subject to the requirement of vesting. Options granted under the plan are exercisable into common shares of the Company, have a contractual period of ten years and vest over four to five years, unless specified otherwise in the applicable award agreement. For options granted after January 1, 2006, the Company recognizes compensation cost over the vesting period of the option. Compensation cost is determined at the date of grant by estimating the fair value of an option using the Black-Scholes option-pricing model.
The following table shows the significant assumptions used in connection with the determination of the fair value of options in 2007, 2008 and 2009:
| 2007 | 2008 | 2009 | ||||
| Dividend yield |
— | — | — | |||
| Expected life (in months) |
75-90 | 78 | 76-78 | |||
| Risk free rate of interest |
4.37%-4.78% | 3.04%-3.62% | 2.07%-3.39% | |||
| Volatility |
39.91%-40.92% | 37.7%-42.32% | 37.7%-46.44% |
Volatility was calculated based on the historical volatility of our comparative companies during a period equivalent to the estimated term of the option. The Company estimates the expected term of an option using the
F-40
Table of Contents
GENPACT LIMITED AND ITS SUBSIDIARIES
Notes to the Consolidated Financial Statements (Continued)
(In thousands, except per share data)
20. Share-based compensation (Continued)
“simplified method” which is based on the average of the vesting term and contractual term of the option. The risk-free interest rate that we use in the option valuation model is based on U.S. Treasury bonds with a term similar to the expected term of the options. Expected dividends during the estimated term of the option are based on recent dividend activity; the Company has not paid any cash dividends in the recent period and do not anticipate doing so in the foreseeable future.
The Company has issued, and intends to continue to issue, new shares to satisfy stock option exercises under its incentive plans.
A summary of the options granted during the years ended December 31, 2007, 2008 and 2009 is set out below:
| Year ended December 31, 2007 | ||||||||||||
| Shares arising out of options |
Weighted average exercise price |
Weighted average remaining contractual life (years) |
Aggregate intrinsic value | |||||||||
| Outstanding as of January 1, 2007 |
15,051,756 | $ | 4.56 | 8.5 | $ | — | ||||||
| Granted |
10,840,624 | 15.48 | — | — | ||||||||
| Forfeited |
(1,646,977 | ) | 8.35 | — | — | |||||||
| Expired |
(45,597 | ) | 3.94 | — | — | |||||||
| Exercised |
(616,174 | ) | 3.84 | — | 7,017 | |||||||
| Outstanding as of December 31, 2007 |
23,583,632 | $ | 9.33 | 8.5 | $ | 147,008 | ||||||
| Vested and exercisable as of December 31, 2007 and expected to vest thereafter (Note a) |
20,050,355 | $ | 8.54 | 8.5 | $ | 139,804 | ||||||
| Vested and exercisable as of December 31, 2007 |
5,537,931 | $ | 3.84 | 7.6 | $ | 63,081 | ||||||
| Weighted average grant date fair value of grants during the year |
$ | 7.68 | ||||||||||
| Year ended December 31, 2008 | ||||||||||||
| Shares arising out of options |
Weighted average exercise price |
Weighted average remaining contractual life (years) |
Aggregate intrinsic value | |||||||||
| Outstanding as of January 1, 2008 |
23,583,632 | $ | 9.33 | 8.5 | $ | — | ||||||
| Granted |
4,631,000 | 10.17 | — | — | ||||||||
| Forfeited |
(1,911,584 | ) | 12.58 | — | — | |||||||
| Expired |
(23,638 | ) | 8.93 | — | — | |||||||
| Exercised |
(2,458,746 | ) | 4.31 | — | 9,763 | |||||||
| Outstanding as of December 31, 2008 |
23,820,664 | $ | 9.75 | 7.9 | $ | 41,050 | ||||||
| Vested and exercisable as of December 31, 2008 and expected to vest thereafter (Note a) |
20,491,684 | $ | 9.44 | 7.9 | $ | 38,306 | ||||||
| Vested and exercisable as of December 31, 2008 |
6,029,589 | $ | 4.73 | 6.8 | $ | 23,705 | ||||||
| Weighted average grant date fair value of grants during the year |
$ | 4.47 | ||||||||||
F-41
Table of Contents
GENPACT LIMITED AND ITS SUBSIDIARIES
Notes to the Consolidated Financial Statements (Continued)
(In thousands, except per share data)
20. Share-based compensation (Continued)
| Year ended December 31, 2009 | ||||||||||||
| Shares arising out of options |
Weighted average exercise price |
Weighted average remaining contractual life (years) |
Aggregate intrinsic value | |||||||||
| Outstanding as of January 1, 2009 |
23,820,664 | $ | 9.75 | 7.9 | $ | — | ||||||
| Granted |
1,446,630 | 11.09 | — | — | ||||||||
| Forfeited |
(1,801,880 | ) | 12.85 | — | — | |||||||
| Expired |
(240,920 | ) | 14.14 | — | — | |||||||
| Exercised |
(2,830,995 | ) | 4.69 | — | 28,917 | |||||||
| Outstanding as of December 31, 2009 |
20,393,499 | $ | 10.23 | 7.2 | $ | 103,942 | ||||||
| Vested and exercisable as of December 31, 2009 and expected to vest thereafter (Note a) |
18,519,983 | $ | 10.20 | 7.2 | $ | 95,044 | ||||||
| Vested and exercisable as of December 31, 2009 |
6,729,735 | $ | 5.69 | 6.2 | $ | 62,516 | ||||||
| Weighted average grant date fair value of grants during the year |
$ | 4.93 | ||||||||||
| (a) | Options expected to vest reflect an estimated forfeiture rate. |
As of December 31, 2009, the total remaining unrecognized share-based compensation costs for options expected to vest amounted to $47,075, which will be recognized over the weighted average remaining requisite vesting period of 3.06 years.
Effective April 1, 2007, an amendment was made to the Indian Income Tax Act to subject specified securities allotted or transferred by an employer to its employee’s resident in India to fringe benefit tax, or FBT. When an employee covered under the Indian Income Tax Act exercises a stock option, the shares issued, or allocated and transferred, by the Company to such employee are subject to FBT. The employer liability for FBT arises and is expensed by the Company at the time of such employee’s exercise of the stock option.
On August 18, 2009, a further amendment was made to the Indian Income Tax Act, with retroactive effect from April 1, 2009, abolishing the provisions of FBT. Thus any exercises of stock options by the employee on or after April 1, 2009, the shares issued, or allocated and transferred by the Company, would no longer be subject to FBT.
During the period when FBT was applicable, the Company was entitled to and the Company’s plans allowed for the collection of the FBT payable from the employee in connection with and at the time of the stock option exercise. The FBT recovered from the employee was treated as an increase in the exercise price. The weighted average grant date fair value of stock options granted during the period when FBT was applicable, reflected an exercise price that included the recovered tax. The FBT recovery by the Company from an employee was recorded as additional paid-in capital in the Consolidated Statements of Equity and Comprehensive Income (Loss).
Share Issuances Subject to Restrictions
In connection with the acquisition of Axis Risk Consulting Services Private Limited in 2007, 143,453 common shares were issued to selling shareholders. Of the common shares that were issued, 94,610 common
F-42
Table of Contents
GENPACT LIMITED AND ITS SUBSIDIARIES
Notes to the Consolidated Financial Statements (Continued)
(In thousands, except per share data)
20. Share-based compensation (Continued)
shares were issued to selling shareholders who became employees of the Company and are subject to restrictions on transfer linked to continued employment with the Company for a specified period. The Company has accounted for such shares as compensation for services.
A summary of such shares granted that are subject to restrictions and accounted for as compensation for services, or restricted shares, during the year ended December 31, 2007, 2008 and 2009 is set out below:
| Year ended December 31, 2007 | |||||
| Number of Restricted Shares |
Weighted Average Grant Date Fair Value | ||||
| Outstanding as at January 1, 2007 |
— | $ | — | ||
| Granted |
94,610 | 14.04 | |||
| Vested and allotted |
— | — | |||
| Forfeited |
— | — | |||
| Outstanding as at December 31, 2007 |
94,610 | $ | 14.04 | ||
| Year ended December 31, 2008 | ||||||
| Number of Restricted Shares |
Weighted Average Grant Date Fair Value | |||||
| Outstanding as at January 1, 2008 |
94,610 | $ | 14.04 | |||
| Granted |
— | — | ||||
| Vested and allotted |
(23,651 | ) | 14.04 | |||
| Forfeited |
— | — | ||||
| Outstanding as at December 31, 2008 |
70,959 | $ | 14.04 | |||
| Year ended December 31, 2009 | ||||||
| Number of Restricted Shares |
Weighted Average Grant Date Fair Value | |||||
| Outstanding as at January 1, 2009 |
70,959 | $ | 14.04 | |||
| Granted |
— | — | ||||
| Vested and allotted |
(23,653 | ) | 14.04 | |||
| Forfeited |
— | — | ||||
| Outstanding as at December 31, 2009 |
47,306 | $ | 14.04 | |||
As of December 31, 2009, the total remaining unrecognized share-based compensation costs related to Restricted Shares amounted to $363 which will be recognized over the weighted average remaining requisite vesting period of 1.25 years.
Restricted Share Units
During the year ended December 31, 2009, the Company granted restricted share units, or RSUs, under the 2007 Omnibus Plan. Each RSU represents the right to receive one common share. The fair value of each RSU is
F-43
Table of Contents
GENPACT LIMITED AND ITS SUBSIDIARIES
Notes to the Consolidated Financial Statements (Continued)
(In thousands, except per share data)
20. Share-based compensation (Continued)
the market price of one common share of the Company on the date of grant. The RSUs granted to date have vesting schedules of three to four years and a contractual period of ten years. The compensation expense is recognized on a straight line over the vesting term.
A summary of RSUs granted during the year ended December 31, 2009 is set out below:
| Year ended December 31, 2009 | |||||
| Number of Restricted Shares |
Weighted Average Grant Date Fair Value | ||||
| Outstanding as of January 1, 2009 |
— | $ | — | ||
| Granted |
325,000 | 10.09 | |||
| Vested and allotted |
— | — | |||
| Forfeited |
— | — | |||
| Outstanding as at December 31, 2009 |
325,000 | $ | 10.09 | ||
As of December 31, 2009, the total remaining unrecognized share-based compensation costs related to RSUs amounted to $2,713 which will be recognized over the weighted average remaining requisite vesting period of 3.02 years.
Employee Stock Purchase Plan (ESPP)
On May 1, 2008, the Company adopted the Genpact Limited U.S. Employee Stock Purchase Plan and the Genpact Limited International Employee Stock Purchase Plan (together, the “ESPP”).
The ESPP allowed eligible employees to purchase the Company’s common shares through payroll deduction at 95% of the fair value per share on the last business day of each purchase interval ending on or prior to August 31, 2009. The purchase price has been reduced to 90% of the fair value per share on the last business day of each purchase interval commencing with effect from September 1, 2009. The dollar amount of common shares purchased under the ESPP shall not exceed the greater of 15% of the participating employee’s base salary or $25 per calendar year. With effect from September 1, 2009, the offering periods commence on the first business day in March, June, September and December of each year and end on the last business day in the subsequent May, August, November and February of each year. 4,200,000 common shares have been reserved for issuance in the aggregate over the term of the ESPP.
During the year ended December 31, 2009, common shares issued under ESPP were 41,476.
The ESPP was considered as non compensatory under the FASB guidance on Compensation-Stock Compensation (previously referred to as SFAS No. 123(R) “Share Based Payment”) until the purchase interval ending on or prior to August 31, 2009. As a result of the change in the discount rate, the ESPP is being considered compensatory with effect from September 1, 2009.
The compensation expenses for the employee stock purchase plan is recognized in accordance with the FASB guidance on Compensation-Stock Compensation. During the year ended December 31, 2009, $23 has been recognized as compensation expense, and has been allocated to cost of revenue and selling, general, and administrative expenses.
F-44
Table of Contents
GENPACT LIMITED AND ITS SUBSIDIARIES
Notes to the Consolidated Financial Statements (Continued)
(In thousands, except per share data)
21. Capital stock
The Company’s authorized capital stock as of December 31, 2008 and 2009 consisted of 500 million common shares with a par value of $0.01 per share, and 250 million preferred shares with a par value of $0.01 per share. Of the above, the Company had 214,560,620 and 217,433,091 common shares, and 0 and 0 preferred shares, issued and outstanding as of December 31, 2008 and 2009, respectively.
The holders of common shares are entitled to one vote per share. Upon the liquidation, dissolution or winding up of the Company, common shareholders are entitled to receive a ratable share of the available net assets of the Company after payment of all debts and other liabilities. The common shares have no preemptive, subscription, redemption or conversion rights.
The Company’s board of directors by resolution can establish one or more series of preferred shares having such par value, designations, dividend rates, relative voting rights, conversion or exchange rights, redemption rights, liquidation rights and other relative participation, optional or other rights, qualifications, limitations or restrictions as may be fixed by the board of directors without any shareholder approval. Such rights, preferences, powers and limitations as may be established could also have the effect of discouraging an attempt to obtain control of the Company. These preferred shares are of the type commonly known as “blank-check” preferred shares.
As part of the 2007 Reorganization, the shareholders of GGH exchanged their 394,642 common shares of GGH for 71,390,738 common shares of the Company, and the shareholders of GGL exchanged their 3,018,346 shares of 2% Cumulative Series A convertible preferred stock, 3,017,346 shares of 5% Cumulative Series B convertible preferred stock, and 300 shares of common shares of GGL for 119,302,154 common shares of the Company.
Prior to the 2007 Reorganization, the holders of shares of Cumulative Series A and Series B convertible preferred stock of GGH were entitled to cumulative cash dividends at an annual rate equal to 2.0% and 5.0%, respectively, of the Accreted Value of the stock, which was $62.3 each upon issuance. These dividends were not paid in cash but accrued on a daily basis from the date of issuance of the shares and cumulated, compounded, and added to the Accreted Value in effect immediately prior to each quarterly compounding date. The Company had accrued $9,896 and $25,197 on Series A preferred stock and Series B preferred stock, respectively until the date of the 2007 Reorganization.
The preferred shareholders also had the right, at any time and from time to time, to convert any or all of such holder’s shares, including all dividends accrued but unpaid on each share of the preferred stock, into common shares in the ratio of the Accreted Value at such time to the conversion price of $623. As the accrued dividend was convertible at a conversion price that is less than the fair value of the common shares on the dividend accrual date, the Company has recorded a beneficial conversion feature under the FASB guidance on Debt with Conversion and Other Options (previously referred to as EITF 98-5, “Accounting for Convertible Securities with Beneficial Conversion Features or Contingently Adjustable Conversion Ratios”), relating to the convertible accrued dividend. Accordingly, accrued preferred dividends include amounts aggregating $28,289 for 2007 relating to the beneficial conversion feature.
During the year ended December 31, 2007, the Company issued 1,442,315 common shares out of its treasury stock as a part of purchase consideration for the acquisition of ICE at a fair value of $16.13 per common share. Prior to the 2007 Reorganization, the Company also retired its remaining treasury stock comprising 59,000 shares of Series A convertible preferred stock and 2,185,815 common shares.
F-45
Table of Contents
GENPACT LIMITED AND ITS SUBSIDIARIES
Notes to the Consolidated Financial Statements (Continued)
(In thousands, except per share data)
21. Capital stock (Continued)
During the year ended December 31, 2007, the Company repurchased 106,007 common shares, 522 shares of Series A convertible preferred stock and 522 shares of Series B convertible preferred stock from the holders thereof at the fair value of these shares as of the date of repurchase. The total consideration amounted to $1,710 and $284 for common shares and preferred stock, respectively. The Company subsequently retired such repurchased common shares and preferred stock.
Under Bermuda law, the Company may declare and pay dividends from time to time unless there are reasonable grounds for believing that the Company is or would, after the payment, be unable to pay its liabilities as they become due or that the realizable value of its assets would thereby be less than the aggregate of its liabilities, its issued share capital, and its share premium accounts. Under the Company’s bye-laws, each common share is entitled to dividends if, as and when dividends are declared by the Company’s board of directors. There are no restrictions in Bermuda on the Company’s ability to transfer funds (other than funds denominated in Bermuda dollars) in or out of Bermuda or to pay dividends to U.S. residents who are holders of the Company’s common shares. The Company’s ability to declare and pay cash dividends is restricted by its debt covenants.
22. Earnings per share
Basic and diluted earnings (loss) per common share give effect to the change in the common shares of the Company resulting from the 2007 Reorganization and are therefore based on the retrospective adjustment to the common shares of GGH outstanding prior to the date of the 2007 Reorganization. The exchange of GGL preferred stock for common shares of Genpact Limited was accounted for as a conversion of such preferred stock. Such conversion has been given effect after the 2007 Reorganization. In the 2007 Reorganization, shareholders of GGH exchanged their common shares of GGH for common shares of Genpact Limited, and the shareholders of GGL exchanged their preferred and common shares of GGL for common shares of Genpact Limited. The GGL preferred stock was entitled to cumulative dividends that were not paid in cash and were accrued and added to the accreted value prior to the date of the 2007 Reorganization.
The calculation of basic earnings per common share was determined by dividing net income available to common shareholders by the weighted average number of common shares outstanding during the respective periods. Since the preferred stock was participative in nature, profits of the Company before the 2007 Reorganization continued to be apportioned towards the preferred shareholders in accordance with their entitlement to participate in the undistributed profits. The potentially dilutive shares, consisting of such preferred shares as well as outstanding options on common shares and restricted share units, have been included in the computation of diluted net earnings (loss) per share and the weighted average shares outstanding, except where the result would be anti-dilutive.
F-46
Table of Contents
GENPACT LIMITED AND ITS SUBSIDIARIES
Notes to the Consolidated Financial Statements (Continued)
(In thousands, except per share data)
22. Earnings per share (Continued)
The number of stock options outstanding but not included in the computation of diluted earnings per common share because their effect was anti-dilutive is 10,311,122, 16,388,096 and 12,480,950 for the year ended December 31, 2007, 2008 and 2009, respectively.
| Year ended December 31, | |||||||||
| 2007 | 2008 | 2009 | |||||||
| Net income (loss) available to common shareholders |
|||||||||
| Net income attributable to Genpact Limited shareholders |
$ | 56,423 | $ | 125,141 | $ | 127,301 | |||
| Less: preferred dividend |
7,643 | — | — | ||||||
| Less: undistributed earnings to preferred stock |
3,206 | — | — | ||||||
| Less: beneficial interest on conversion of preferred stock dividend |
28,289 | — | — | ||||||
| Net income available to common shareholders |
$ | 17,285 | $ | 125,141 | $ | 127,301 | |||
| Weighted average number of common shares used in computing basic earnings per common share |
135,517,771 | 213,480,623 | 215,503,749 | ||||||
| Dilutive effect of stock options |
7,222,040 | 4,963,601 | 4,562,596 | ||||||
| Weighted average number of common shares used in computing dilutive earnings per common share |
142,739,811 | 218,444,224 | 220,066,345 | ||||||
| Earnings per common share attributable to Genpact Limited common shareholders |
|||||||||
| Basic |
$ | 0.13 | $ | 0.59 | $ | 0.59 | |||
| Diluted |
$ | 0.12 | $ | 0.57 | $ | 0.58 | |||
23. Cost of revenue
Cost of revenue consists of the following:
| Year ended December 31, | |||||||||
| 2007 | 2008 | 2009 | |||||||
| Personnel expenses |
$ | 301,050 | $ | 379,851 | $ | 405,642 | |||
| Operational expenses |
147,111 | 196,659 | 220,524 | ||||||
| Depreciation and amortization |
34,777 | 42,721 | 46,458 | ||||||
| $ | 482,938 | $ | 619,231 | $ | 672,624 | ||||
24. Selling, general and administrative expenses
Selling, general and administrative expenses consist of the following:
| Year ended December 31, | |||||||||
| 2007 | 2008 | 2009 | |||||||
| Personnel expenses |
$ | 142,392 | $ | 166,388 | $ | 178,797 | |||
| Operational expenses |
66,523 | 76,953 | 76,037 | ||||||
| Depreciation and amortization |
9,322 | 11,192 | 10,558 | ||||||
| $ | 218,237 | $ | 254,533 | $ | 265,392 | ||||
F-47
Table of Contents
GENPACT LIMITED AND ITS SUBSIDIARIES
Notes to the Consolidated Financial Statements (Continued)
(In thousands, except per share data)
25. Other income (expense), net
Other income (expense), net consists of the following:
| Year ended December 31, | ||||||||||||
| 2007 | 2008 | 2009 | ||||||||||
| Interest income |
$ | 6,576 | $ | 14,895 | $ | 7,446 | ||||||
| Interest expense |
(14,114 | ) | (8,465 | ) | (4,332 | ) | ||||||
| Other income |
2,411 | 400 | 1,323 | |||||||||
| Loss on interest rate swaps |
(69 | ) | (283 | ) | — | |||||||
| $ | (5,196 | ) | $ | 6,547 | $ | 4,437 | ||||||
26. Income taxes
Income tax expense (benefit) for the years ended December 31, 2007, 2008 and 2009 is allocated as follows:
| Year ended December 31, | |||||||||||
| 2007 | 2008 | 2009 | |||||||||
| Income from continuing operations |
$ | 16,543 | $ | 8,823 | $ | 25,466 | |||||
| Goodwill |
— | (356 | ) | — | |||||||
| Shareholders’ equity for— |
|||||||||||
| Unrealized gains (losses) on cash flow hedges |
32,246 | (162,136 | ) | 83,502 | |||||||
| Retirement benefits |
(540 | ) | 407 | — | |||||||
| Total income tax expense (benefit) |
$ | 48,249 | $ | (153,262 | ) | $ | 108,968 | ||||
The components of income before income taxes from continuing operations are as follows:
| Year ended December 31, | |||||||||||
| 2007 | 2008 | 2009 | |||||||||
| Domestic |
$ | (10,957 | ) | $ | (6,848 | ) | $ | 1,835 | |||
| Foreign |
92,310 | 150,272 | 158,589 | ||||||||
| Income before income tax expense |
$ | 81,353 | $ | 143,424 | $ | 160,424 | |||||
F-48
Table of Contents
GENPACT LIMITED AND ITS SUBSIDIARIES
Notes to the Consolidated Financial Statements (Continued)
(In thousands, except per share data)
26. Income taxes (Continued)
Income tax expense (benefit) attributable to income from continuing operations consists of:
| Year ended December 31, | ||||||||||||
| 2007 | 2008 | 2009 | ||||||||||
| Current taxes |
||||||||||||
| Domestic |
444 | 603 | 2,473 | |||||||||
| Foreign |
20,972 | 32,641 | 43,733 | |||||||||
| $ | 21,416 | $ | 33,244 | $ | 46,206 | |||||||
| Deferred taxes |
||||||||||||
| Domestic |
2,011 | (14,005 | ) | (15,916 | ) | |||||||
| Foreign |
(6,884 | ) | (10,416 | ) | (4,824 | ) | ||||||
| $ | (4,873 | ) | $ | (24,421 | ) | $ | (20,740 | ) | ||||
| Total income tax expense (benefit) |
$ | 16,543 | $ | 8,823 | $ | 25,466 | ||||||
Income tax expense (benefit) attributable to income from continuing operations differed from the amounts computed by applying the U.S. federal statutory income tax rate of 35% to income before income taxes, as a result of the following:
| Year ended December 31, | ||||||||||||
| 2007 | 2008 | 2009 | ||||||||||
| Income before income taxes |
$ | 81,353 | $ | 143,424 | $ | 160,424 | ||||||
| Statutory tax rates |
35.00 | % | 35.00 | % | 35.00 | % | ||||||
| Computed expected income tax expense |
28,474 | 50,198 | 56,148 | |||||||||
| Increase (decrease) in income taxes resulting from: |
||||||||||||
| Foreign tax rate differential |
11,044 | 11,353 | 2,690 | |||||||||
| Tax benefit from tax holiday |
(31,144 | ) | (46,749 | ) | (26,024 | ) | ||||||
| Non-deductible expenses |
5,209 | 1,858 | 1,544 | |||||||||
| Effect of change in tax rates |
(366 | ) | (187 | ) | (1,691 | ) | ||||||
| Change in valuation allowance |
2,782 | 3,443 | (2,436 | ) | ||||||||
| Change in tax status |
(1,325 | ) | (10,595 | ) | (10,343 | ) | ||||||
| Others |
1,869 | (498 | ) | 5,578 | ||||||||
| Reported income tax expense (benefit) |
$ | 16,543 | $ | 8,823 | $ | 25,466 | ||||||
Under the Indian Income Tax Act, a substantial portion of the profits of the Company’s Indian operations is exempt from Indian income tax. The Indian tax year ends on March 31. This tax holiday is available for a period of ten consecutive years beginning in the year in which the respective Indian undertaking commenced operations but in no case extending beyond March 31, 2011. The tax holiday began expiring with respect to the Company’s Indian operations in the year ended March 31, 2007 and will continue to expire through the year ended March 31, 2011. Additionally, one of the Company’s Indian subsidiaries is eligible for a tax holiday as a Special Economic Zone unit commencing from 2007 onwards in respect of 100% of the export profits for a period of 5 years, 50% of such profits for next 5 years and 50% of the profits for further period of 5 years subject to satisfaction of certain capital investments requirements. Two of the Company’s Indian subsidiaries are eligible for tax holiday as Special Economic Zone units commencing from 2008 and 2009 onwards as described above.
F-49
Table of Contents
GENPACT LIMITED AND ITS SUBSIDIARIES
Notes to the Consolidated Financial Statements (Continued)
(In thousands, except per share data)
26. Income taxes (Continued)
The basic earnings per share effect of the tax holiday is $0.23, $0.22 and $0.12, respectively, for the years ended December 31, 2007, 2008 and 2009. The diluted earnings per share effect of the tax holiday is $0.22, $0.21 and $0.12, respectively, for the years ended December 31, 2007, 2008 and 2009.
As a result of the change in tax status of one of its subsidiaries in the U.S. during the year ended December 31, 2007, the Company recognized the tax effects in the consolidated statement of income for the adjustment in deferred tax liability associated with the unrealized gains on certain effective hedges in other comprehensive income. During the year ended December 31, 2009, the Company recognized a reversal of deferred tax liability amounting to $10,343 for these hedges that matured in 2009.
The components of the deferred tax balances as of December 31, 2008 and 2009 are as follows:
| As of December 31, | ||||||||
| 2008 | 2009 | |||||||
| Deferred tax assets |
||||||||
| Net operating loss carryforwards |
$ | 17,317 | $ | 19,005 | ||||
| Accrued liabilities and other expenses |
9,809 | 9,369 | ||||||
| Provision for doubtful debts |
2,011 | 2,517 | ||||||
| Property, plant and equipment |
1,824 | 1,675 | ||||||
| Unrealized losses on cash flow hedges, net |
129,860 | 44,961 | ||||||
| Unrealized losses on foreign currency balance, net |
1,233 | 1,665 | ||||||
| Share-based compensation |
6,989 | 11,648 | ||||||
| Retirement benefits |
417 | 515 | ||||||
| Deferred revenue |
29,834 | 26,078 | ||||||
| Others |
2,622 | 7,744 | ||||||
| $ | 201,916 | $ | 125,177 | |||||
| Less: Valuation allowance |
(14,919 | ) | (7,943 | ) | ||||
| Total deferred tax assets |
$ | 186,997 | $ | 117,234 | ||||
| Deferred tax liabilities |
||||||||
| Intangible assets |
$ | 15,074 | $ | 8,361 | ||||
| Property, plant and equipment |
4,173 | 5,260 | ||||||
| Deferred cost |
26,582 | 23,584 | ||||||
| Others |
1,723 | 2,235 | ||||||
| Total deferred tax liabilities |
$ | 47,552 | $ | 39,440 | ||||
| Net deferred tax asset |
$ | 139,445 | $ | 77,794 | ||||
| Classified as |
||||||||
| Deferred tax assets |
||||||||
| Current |
$ | 38,629 | $ | 45,929 | ||||
| Non-current |
$ | 111,002 | $ | 36,527 | ||||
| Deferred tax liabilities |
||||||||
| Current |
$ | 12 | $ | 264 | ||||
| Non-current |
$ | 10,174 | $ | 4,398 | ||||
F-50
Table of Contents
GENPACT LIMITED AND ITS SUBSIDIARIES
Notes to the Consolidated Financial Statements (Continued)
(In thousands, except per share data)
26. Income taxes (Continued)
The change in the total valuation allowance for deferred tax assets as of December 31, 2007, 2008 and 2009 is as follows:
| As of December 31, | ||||||||||||
| 2007 | 2008 | 2009 | ||||||||||
| Opening valuation allowance |
$ | 15,349 | $ | 6,772 | $ | 14,919 | ||||||
| Reduction due to expiry of operating losses |
(11,359 | ) | — | — | ||||||||
| Reduction during the year |
(612 | ) | (2,175 | ) | (7,840 | ) | ||||||
| Addition during the year |
3,394 | 10,322 | 864 | |||||||||
| Closing valuation allowance |
$ | 6,772 | $ | 14,919 | $ | 7,943 | ||||||
In assessing the realizability of deferred tax assets, management considers whether it is more likely than not that some or all of the deferred tax assets will not be realized. The ultimate realization of deferred tax assets depends on the generation of future taxable income during the periods in which those temporary differences are deductible. Management considers the scheduled reversal of deferred tax liabilities, projected taxable income, and tax planning strategies in making this assessment. In order to fully realize the deferred tax asset, the Company will need to generate future taxable income prior to the expiration of the deferred tax asset governed by the tax code. Based on the level of historical taxable income and projections for future taxable income over the periods for which the deferred tax assets are deductible, management believes that it is more likely than not that the Company will realize the benefits of these deductible differences, net of the existing valuation allowances at December 31, 2009. The amount of the deferred tax asset considered realizable, however, could be reduced in the near term if estimates of future taxable income during the carry-forward period are reduced.
As of December 31, 2009, the deferred tax assets related to operating loss carryforwards amounted to $19,005. Operating losses of subsidiaries in Hungary amounting to $15,666 can be carried forward for an indefinite period. The remaining tax loss carryforwards expire in the amounts shown below in the following years:
| Year ending December 31, |
US—Federal | Europe | Others | ||||||
| 2013 |
$ | — | $ | 6,917 | $ | — | |||
| 2014 |
— | 3,648 | — | ||||||
| 2016 |
— | — | 800 | ||||||
| 2017 |
— | — | 915 | ||||||
| 2018 |
— | — | 1,065 | ||||||
| 2019 |
— | — | 2,889 | ||||||
| 2021 |
6,592 | — | — | ||||||
| 2022 |
549 | — | — | ||||||
| 2023 |
314 | — | — | ||||||
| 2024 |
1,426 | 381 | — | ||||||
| 2025 |
5,116 | — | — | ||||||
| 2026 |
407 | — | — | ||||||
| 2028 |
21,155 | — | — | ||||||
| 2029 |
22,808 | — | — | ||||||
| $ | 58,367 | $ | 10,946 | $ | 5,669 | ||||
F-51
Table of Contents
GENPACT LIMITED AND ITS SUBSIDIARIES
Notes to the Consolidated Financial Statements (Continued)
(In thousands, except per share data)
26. Income taxes (Continued)
As of December 31, 2009, the Company had additional U.S. state and local tax loss carryforwards amounting to $1,625, of which $1,479 will expire between 2015 to 2029.
Undistributed earnings of the Company’s foreign subsidiaries amounted to approximately $425,213 as of December 31, 2009. It is impracticable to determine the amount of taxes payable in the event of repatriation of these earnings. The Company plans to indefinitely reinvest these undistributed earnings of foreign subsidiaries or has the ability to repatriate in a tax-free manner, and accordingly, does not accrue any income, distribution or withholding taxes that would arise if such earnings were repatriated.
The following table summarizes the activities related to the unrecognized tax benefits for uncertain tax positions from January 1, to December 31, for 2007, 2008 and 2009:
| 2007 | 2008 | 2009 | ||||||||||
| Opening balance at January 1 |
$ | 7,363 | $ | 11,898 | $ | 10,993 | ||||||
| Increase related to prior year tax positions |
859 | 267 | 3,043 | |||||||||
| Decrease related to prior year tax positions |
(112 | ) | (4,743 | ) | (2,736 | ) | ||||||
| Increase related to current year tax positions |
2,762 | 5,086 | 1,618 | |||||||||
| Effect of exchange rate changes |
1,026 | (1,515 | ) | 277 | ||||||||
| Closing balance at December 31 |
$ | 11,898 | $ | 10,993 | $ | 13,195 | ||||||
As of December 31, 2007, 2008 and 2009, the Company had unrecognized tax benefits amounting to $5,564, $7,210 and $13,019, respectively, which if recognized, would impact the effective tax rate.
As of December 31, 2007, 2008 and 2009, the Company has accrued approximately $2,081, $1,651 and $1,930, respectively, in interest relating to unrecognized tax benefits. During the years ended December 31, 2007, 2008 and 2009, the Company recognized approximately $798, $273 and $279, respectively, in interest expense. No penalties were accrued as of December 31, 2007, 2008 and 2009, as the Company believes that the tax positions taken have met the minimum statutory requirements to avoid payment of penalties.
For all the tax years that remain open to examinations by U.S. federal and various state, local, and non-U.S. tax authorities, the Company is unable to provide an estimate of the range of the total amount of unrecognized tax benefits that is reasonably possible to change significantly within the next twelve months.
With limited exceptions, the Company is no longer subject to U.S. federal, state and local or non-U.S. income tax audits by taxing authorities for years prior to 2006. The Company’s subsidiaries in India and China are open to examination by the relevant taxing authorities, respectively, for tax years beginning on April 1, 2006, and calendar year 2000. The Company regularly reviews the likelihood of additional tax assessments and adjusts its reserves as additional information or events require.
27. Segment reporting
The Company manages various types of business process and information technology services in an integrated manner to customers in various industries and geographic locations. The Company’s operations are located in thirteen countries. The Company’s Chief Executive Officer, who has been identified as the Chief Operation Decision Maker (CODM), reviews financial information prepared on a consolidated basis, accompanied by disaggregated information about revenue and earnings before interest and income taxes (EBIT)
F-52
Table of Contents
GENPACT LIMITED AND ITS SUBSIDIARIES
Notes to the Consolidated Financial Statements (Continued)
(In thousands, except per share data)
27. Segment reporting (Continued)
by identified business units. The identified business units are organized for operational reasons and represent either services-based, customer-based, industry-based or geography-based units. There is a significant overlap between the manner in which the business units are organized. Additionally, the composition and organization of the business units is fluid and the structure changes regularly in response to the growth of the overall business acquisitions and changes in reporting structure, clients, services, industries served, and Delivery Centers.
Based on an overall evaluation of all facts and circumstances and after combining operating segments with similar economic characteristics that comply with other aggregation criteria specified in the FASB guidance on Segment Reporting (previously referred to as SFAS No. 131, “Disclosure about Segments of an Enterprise and Related Information”), the Company has determined that it operates as a single reportable segment.
Net revenues for different types of services provided are as follows:
| Year ended December 31, | |||||||||
| 2007 | 2008 | 2009 | |||||||
| Business Process Services |
$ | 621,574 | $ | 832,975 | $ | 940,410 | |||
| Information Technology Services |
201,597 | 207,872 | 179,661 | ||||||
| Total net revenues |
$ | 823,171 | $ | 1,040,847 | $ | 1,120,071 | |||
Revenues from customers based on the industry serviced are as follows:
| Year ended December 31, | |||||||||
| 2007 | 2008 | 2009 | |||||||
| Banking, Financial Services and Insurance |
$ | 361,278 | $ | 442,124 | $ | 488,095 | |||
| Manufacturing and healthcare |
347,125 | 434,707 | 442,610 | ||||||
| Others |
114,768 | 164,016 | 189,366 | ||||||
| Total net revenues |
$ | 823,171 | $ | 1,040,847 | $ | 1,120,071 | |||
Net revenues from geographic areas based on location of service delivery units are as follows. A portion of net revenues attributable to India consists of net revenues for services performed by Delivery Centers in India or at clients’ premises outside of India by business units or personnel normally based in India.
| Year ended December 31, | |||||||||
| 2007 | 2008 | 2009 | |||||||
| India |
$ | 608,749 | $ | 763,972 | $ | 807,469 | |||
| Asia, other than India |
49,985 | 81,058 | 115,085 | ||||||
| Americas |
80,754 | 83,979 | 80,118 | ||||||
| Europe |
83,683 | 111,838 | 117,399 | ||||||
| Total net revenues |
$ | 823,171 | $ | 1,040,847 | $ | 1,120,071 | |||
F-53
Table of Contents
GENPACT LIMITED AND ITS SUBSIDIARIES
Notes to the Consolidated Financial Statements (Continued)
(In thousands, except per share data)
27. Segment reporting (Continued)
Property, plant and equipment, net by geographic areas are as follows:
| Year ended December 31, | ||||||
| 2008 | 2009 | |||||
| India |
$ | 117,157 | $ | 129,773 | ||
| Asia, other than India |
20,362 | 17,474 | ||||
| Americas |
23,757 | 29,575 | ||||
| Europe |
12,990 | 12,290 | ||||
| $ | 174,266 | $ | 189,112 | |||
GE comprised 58%, 47% and 40% of the consolidated total net revenue in 2007, 2008 and 2009, respectively. No other customer accounted for 10% or more of the consolidated total net revenue during these periods.
28. Related party transactions
The Company has entered into related party transactions with GE, a significant shareholder, and companies in which GE has a majority ownership interest or on which it exercises significant influence (collectively referred to as “GE” herein). The Company has also entered into related party transactions with its non-consolidating affiliates.
The related party transactions can be categorized as follows:
Revenue from services
Prior to December 31, 2004, substantially all of the revenues of the Company were derived from services provided to GE entities. In connection with the 2004 Reorganization, GE entered into a Master Service Agreement, or MSA, with the Company. The GE MSA, as amended, provides that GE will purchase services in an amount not less than a minimum volume commitment, or MVC, of $360,000 per year for nine years beginning January 1, 2005, $250,000 in 2014, $150,000 in 2015 and $90,000 in 2016. Revenues in excess of the MVC can be credited, subject to certain limitations, against shortfalls in the subsequent years.
For the years ended December 31, 2007, 2008 and 2009, the Company recognized net revenues from GE of $481,270, $490,153 and $451,338, respectively, representing 58%, 47% and 40%, respectively, of the consolidated total net revenues. For the years ended December 31, 2007, 2008 and 2009, the Company recognized net revenues from its non-consolidating affiliates of $0, $177 and $0, respectively.
Cost of revenue from services
The Company purchases certain services from GE mainly relating to communication and leased assets, which are included as part of operational expenses included in cost of revenue. For the years ended December 31, 2007, 2008 and 2009, cost of revenue, net of recovery, included amounts of $5,848, $4,171 and $6,426, respectively, relating to services procured from GE. Cost of revenue from services also include training & recruitment cost of $0, $0, and $708 for the years ended December 31, 2007, 2008 and 2009, respectively, from its non-consolidating affiliates.
F-54
Table of Contents
GENPACT LIMITED AND ITS SUBSIDIARIES
Notes to the Consolidated Financial Statements (Continued)
(In thousands, except per share data)
28. Related party transactions (Continued)
Selling, general and administrative expenses
The Company purchases certain services from GE mainly relating to communication and leased assets, which are included as part of operational expenses included in selling, general and administrative expenses. For the years ended December 31, 2007, 2008 and 2009, selling, general and administrative expenses, net of recovery, included amounts of $733, $345 and $545, respectively, relating to services procured from GE. For the years ended December 31, 2007, 2008 and 2009, selling, general, and administrative expenses also include a cost recovery, net, of $147, $369 and $539, respectively, in relation to cost recovery from its non-consolidating affiliates.
Other operating (income) expense, net
The Company provides certain shared services such as facility, recruitment, training, and communication to GE. Recovery for such services has been included as other operating income in the consolidated statements of income. For the years ended December 31, 2007, 2008 and 2009, income from these services was ($4,137), ($5,419) and ($3,233), respectively.
Interest income
The Company earned interest income on short-term deposits placed with GE. For the years ended December 31, 2007, 2008 and 2009, interest income earned on these deposits was $1,222, $3,214 and $1,996, respectively.
Interest expense
The Company incurred interest expense on finance lease obligations and external commercial borrowings from GE. For the years ended December 31, 2007, 2008 and 2009, interest expense relating to such related party debt amounted to $852, $859 and $423, respectively.
Sale of assets
During the year ended December 31, 2008, the Company sold a software asset for $1,200 to GE.
Investment in equity affiliate
During the year ended December 31, 2008 and 2009, the Company has made an investment of $1,789 and $296, respectively, in its non-consolidating affiliates.
As of December 31, 2008 and 2009, the balance of investment in non-consolidating affiliates amounted to $970 and $588, respectively.
Purchase of property, plant and equipment in an asset acquisition
On August 14, 2008, the Company and its subsidiary, Genpact Luxembourg S.à.r.l., purchased all the issued and outstanding shares of each of two Guatemalan entities, GE Money Administraciones-Guatemala, S.A. and
F-55
Table of Contents
GENPACT LIMITED AND ITS SUBSIDIARIES
Notes to the Consolidated Financial Statements (Continued)
(In thousands, except per share data)
28. Related party transactions (Continued)
Servicios Internacionales De Atencion Al Cliente, S.A., from affiliates of GE for a cash purchase price of $7,015. The acquisition has been treated as a purchase of net assets and not a business combination under SFAS No. 141 as the acquired entities did not fall under the definition of business as established in EITF No. 98-3, “Determining Whether a Nonmonetary Transaction Involves Receipt of Productive Assets or of a Business”.
The balances receivable from and payable to significant shareholder are summarized as follows:
| As of December, 31 | ||||||
| 2008 | 2009 | |||||
| Due from GE |
||||||
| Accounts receivable, net of allowance |
$ | 88,793 | $ | 116,228 | ||
| Short term deposits |
59,332 | 9,634 | ||||
| Prepaid expenses and other current assets |
1,428 | 9 | ||||
| $ | 149,553 | $ | 125,871 | |||
| Due to GE |
||||||
| Current portion of capital lease obligations |
$ | 1,563 | $ | 1,429 | ||
| Accrued expenses and other current liabilities |
10,865 | 7,843 | ||||
| Capital lease obligations, less current portion |
2,391 | 1,809 | ||||
| Other liabilities |
7,322 | 10,474 | ||||
| $ | 22,141 | $ | 21,555 | |||
29. Commitments and contingencies
Capital commitments
As of December 31, 2008 and 2009, the Company has committed to spend $15,879 and $33,493, respectively, under agreements to purchase property, plant and equipment. This amount is net of capital advances paid in respect of these purchases.
Bank Guarantees
The Company has outstanding Bank guarantees amounting to $994 and $1,242 as of December 31, 2008 and 2009, respectively. Bank guarantees are generally provided to government agencies, excise and customs authorities for the purposes of maintaining a bonded warehouse. These guarantees may be revoked by the governmental agencies if they suffer any losses or damage through the breach of any of the covenants contained in the agreements.
Other commitments
The Company’s business process Delivery Centers in India are 100% Export Oriented units or Software Technology Parks of India units (“STPI”) under the STPI guidelines issued by the Government of India. These units are exempted from customs, central excise duties, and levies on imported and indigenous capital goods,
F-56
Table of Contents
GENPACT LIMITED AND ITS SUBSIDIARIES
Notes to the Consolidated Financial Statements (Continued)
(In thousands, except per share data)
29. Commitments and contingencies (Continued)
stores, and spares. The Company has executed legal undertakings to pay custom duty, central excise duty, levies, and liquidated damages payable, if any, in respect of imported and indigenous capital goods, stores, and spares consumed duty free, in the event that certain terms and conditions are not fulfilled.
30. Subsequent events
The Company evaluated all events or transactions that occurred after December 31, 2009 up through February 23, 2010, the date the financial statements were issued. Based on this evaluation, the Company is not aware of any events or transactions that would require recognition or disclosure in the consolidated financial statements other than disclosure events stated below.
In January 2010, the Company finalized an arrangement with Walgreens, the largest drug store chain in the U.S., to acquire a delivery center in Danville, Illinois for cash consideration of $16,347. At the same time, the Company entered into a ten year MSA with Walgreens. Pursuant to the terms of the MSA, approximately 500 Walgreens accounting employees in Danville will be transferred to Genpact.
In January 2010, GE extended the MSA with the Company from a term ending December 31, 2014 to December 31, 2016. GE has agreed to provide a minimum annual volume commitment of $360,000 for each of the nine years beginning January 1, 2005, subject to certain potential adjustments or credits. Such minimum annual commitment is then reduced in a phased manner for the final three years of the agreement, to $250,000 for 2014, $150,000 for 2015 and $90,000 for 2016.
In February 2010, the Company acquired Symphony Marketing Solutions, Inc., a leading provider of analytics and data management services for cash consideration of $29,000 and acquired short term liabilities of $5,399.
F-57
Table of Contents
GENPACT LIMITED AND ITS SUBSIDIARIES
Notes to the Consolidated Financial Statements (Continued)
(In thousands, except per share data)
31. Quarterly financial data (unaudited)
| Three months ended | Year ended | ||||||||||||||
| March 31, 2009 |
June 30, 2009 |
September 30, 2009 |
December 31, 2009 |
December 31, 2009 | |||||||||||
| Total net revenues |
$ | 265,833 | $ | 272,851 | $ | 284,440 | $ | 296,947 | $ | 1,120,071 | |||||
| Gross profit |
$ | 102,114 | $ | 107,048 | $ | 117,445 | $ | 120,840 | $ | 447,447 | |||||
| Income from operations |
$ | 33,101 | $ | 37,849 | $ | 44,913 | $ | 46,317 | $ | 162,180 | |||||
| Income before share of equity in (earnings) loss of affiliates and income tax expense (benefit) |
$ | 36,978 | $ | 37,686 | $ | 42,642 | $ | 43,817 | $ | 161,124 | |||||
| Net Income |
$ | 31,876 | $ | 31,818 | $ | 34,586 | $ | 36,678 | $ | 134,958 | |||||
| Net income attributable to noncontrolling interest |
$ | 1,917 | $ | 2,131 | $ | 1,524 | $ | 2,084 | $ | 7,657 | |||||
| Net income attributable to Genpact Limited common shareholders |
$ | 29,959 | $ | 29,687 | $ | 33,062 | $ | 34,594 | $ | 127,301 | |||||
| Earnings per common share attributable to Genpact Limited common shareholders |
|||||||||||||||
| Basic |
$ | 0.14 | $ | 0.14 | $ | 0.15 | $ | 0.16 | $ | 0.59 | |||||
| Diluted |
$ | 0.14 | $ | 0.14 | $ | 0.15 | $ | 0.16 | $ | 0.58 | |||||
| Weighted average number of common shares used in computing earnings per common share attributable to Genpact Limited common shareholders |
|||||||||||||||
| Basic |
214,585,598 | 215,030,747 | 215,794,607 | 216,604,042 | 215,503,749 | ||||||||||
| Diluted |
217,242,725 | 218,644,090 | 221,799,597 | 222,578,760 | 220,066,345 | ||||||||||
| Three months ended | Year ended | ||||||||||||||
| March 31, 2008 |
June 30, 2008 |
September 30, 2008 |
December 31, 2008 |
December 31, 2008 | |||||||||||
| Total net revenues |
$ | 234,626 | $ | 253,576 | $ | 270,799 | $ | 281,846 | $ | 1,040,847 | |||||
| Gross profit |
$ | 88,545 | $ | 106,484 | $ | 115,034 | $ | 111,553 | $ | 421,616 | |||||
| Income from operations |
$ | 17,322 | $ | 29,178 | $ | 36,328 | $ | 50,885 | $ | 133,713 | |||||
| Income before share of equity in (earnings) loss of affiliates and income tax expense (benefit) |
$ | 25,911 | $ | 31,443 | $ | 41,148 | $ | 45,847 | $ | 144,349 | |||||
| Net Income |
$ | 22,535 | $ | 27,957 | $ | 35,493 | $ | 48,616 | $ | 134,601 | |||||
| Net income attributable to noncontrolling interest |
$ | 2,842 | $ | 3,141 | $ | 1,859 | $ | 1,619 | $ | 9,460 | |||||
| Net income attributable to Genpact Limited common shareholders |
$ | 19,693 | $ | 24,816 | $ | 33,634 | $ | 46,998 | $ | 125,141 | |||||
| Earnings per common share attributable to Genpact Limited common shareholders |
|||||||||||||||
| Basic |
$ | 0.09 | $ | 0.12 | $ | 0.16 | $ | 0.22 | $ | 0.59 | |||||
| Diluted |
$ | 0.09 | $ | 0.11 | $ | 0.15 | $ | 0.22 | $ | 0.57 | |||||
| Weighted average number of common shares used in computing earnings per common share attributable to Genpact Limited common shareholders |
|||||||||||||||
| Basic |
212,197,645 | 213,001,442 | 214,182,308 | 214,541,098 | 213,480,623 | ||||||||||
| Diluted |
218,508,968 | 218,863,648 | 219,350,826 | 217,053,504 | 218,444,224 | ||||||||||
F-58
Table of Contents
Pursuant to the requirements of Section 13 or 15(d) of the Securities Exchange Act of 1934, the Registrant has duly caused this report to be signed on its behalf by the undersigned, thereunto duly authorized.
Date: February 23, 2010
| GENPACT LIMITED | ||
| By: | /s/ PRAMOD BHASIN | |
| Pramod Bhasin | ||
| President and Chief Executive Officer | ||
POWER OF ATTORNEY
Each person whose signature appears below hereby constitutes and appoints each of Victor Guaglianone and Heather White, as his true and lawful attorney-in-fact and agent, with full powers of substitution and resubstitution, for him and in his name, place and stead, in any and all capacities, to sign any and all amendments to this Annual Report on Form 10-K, and to file the same, with all exhibits thereto, and other documents in connection therewith, with the Securities and Exchange Commission granting to said attorneys-in-fact and agents, and each of them, full power and authority to perform any other act on behalf of the undersigned required to be done in connection therewith.
Pursuant to the requirements of the Securities Exchange Act of 1934, this report has been signed below by the following persons on behalf of the registrant and in the capacities and on the dates indicated.
| Signature |
Title |
Date | ||
| /s/ PRAMOD BHASIN Pramod Bhasin |
President, Chief Executive Officer and Director (Principal Executive Officer) |
February 23, 2010 | ||
| /s/ VIVEK N. GOUR Vivek N. Gour |
Chief Financial Officer (Principal Financial and Accounting Officer) |
February 23, 2010 | ||
| /s/ RAJAT KUMAR GUPTA Rajat Kumar Gupta |
Director |
February 23, 2010 | ||
| /s/ CHARLES E. ALEXANDER Charles E. Alexander |
Director |
February 23, 2010 | ||
| /s/ JOHN BARTER John Barter |
Director |
February 23, 2010 | ||
| /s/ STEVEN A. DENNING Steven A. Denning |
Director |
February 23, 2010 | ||
| /s/ MARK F. DZIALGA Mark F. Dzialga |
Director |
February 23, 2010 | ||
| /s/ DOUGLAS M. KADEN Douglas M. Kaden |
Director |
February 23, 2010 | ||
| /s/ JAGDISH KHATTAR Jagdish Khattar |
Director |
February 23, 2010 | ||
Table of Contents
| Signature |
Title |
Date | ||
| /s/ JAMES C. MADDEN James C. Madden |
Director |
February 23, 2010 | ||
| /s/ DENIS J. NAYDEN Denis J. Nayden |
Director |
February 23, 2010 | ||
| /s/ ROBERT G. SCOTT Robert G. Scott |
Director |
February 23, 2010 | ||
| /s/ A. MICHAEL SPENCE A. Michael Spence |
Director |
February 23, 2010 | ||
Table of Contents
| Exhibit |
Description | |
| 3.1 |
Memorandum of Association of the Registrant (incorporated by reference to Exhibit 3.1 to Amendment No. 2 of the Registrant’s Registration Statement on Form S-1 (File No. 333-142875) filed with the SEC on July 16, 2007). | |
| 3.3 |
Bye-laws of the Registrant (incorporated by reference to Exhibit 3.3 to Amendment No. 4 of the Registrant’s Registration Statement on Form S-1 (File No. 333-142875) filed with the SEC on August 1, 2007). | |
| 4.1 |
Form of specimen certificate for the Registrant’s common shares (incorporated by reference to Exhibit 4.1 to Amendment No. 4 of the Registrant’s Registration Statement on Form S-1 (File No. 333-142875) filed with the SEC on August 1, 2007). | |
| 10.1 |
Form of Amended and Restated Shareholders’ Agreement by and among the Registrant, Genpact Global Holdings (Bermuda) Limited, Genpact Global (Bermuda) Limited and the shareholders listed on the signature pages thereto (incorporated by reference to Exhibit 10.1 to Amendment No. 4 of the Registrant’s Registration Statement on Form S-1 (File No. 333-142875) filed with the SEC on August 1, 2007). | |
| 10.2 |
Master Services Agreement dated December 30, 2004 between Genpact Global Holdings SICAR S.à.r.l. and General Electric Company (incorporated by reference to Exhibit 10.2 to Amendment No. 3 of the Registrant’s Registration Statement on Form S-1 (File No. 333-142875) filed with the SEC on July 20, 2007).‡ | |
| 10.3 |
Master Services Agreement 1st Amendment dated January 1, 2005 between Genpact Global Holdings SICAR S.à.r.l. and General Electric Company (incorporated by reference to Exhibit 10.3 to Amendment No. 3 of the Registrant’s Registration Statement on Form S-1 (File No. 333-142875) filed with the SEC on July 20, 2007). | |
| 10.4 |
Second Amendment dated December 16, 2005 between Genpact International S.à.r.l. and General Electric Company (incorporated by reference to Exhibit 10.4 to Amendment No. 3 of the Registrant’s Registration Statement on Form S-1 (File No. 333-142875) filed with the SEC on July 20, 2007). | |
| 10.5 |
Master Services Agreement Third Amendment dated September 6, 2006 between Genpact International S.à.r.l. and General Electric Company (incorporated by reference to Exhibit 10.5 to Amendment No. 3 of the Registrant’s Registration Statement on Form S-1 (File No. 333-142875) filed with the SEC on July 20, 2007).‡ | |
| 10.6 |
Master Professional Services Agreement dated November 30, 2005 by and between Genpact International S.à.r.l. and Macro*World Research Corporation (a subsidiary of Wells Fargo & Company) (incorporated by reference to Exhibit 10.6 to Amendment No. 3 of the Registrant’s Registration Statement on Form S-1 (File No. 333-142875) filed with the SEC on July 20, 2007).‡ | |
| 10.7 |
First Amendment to Master Professional Services Agreement dated August 26, 2006 by and between Genpact International S.à.r.l. and Macro*World Research Corporation (a subsidiary of Wells Fargo & Company) (incorporated by reference to Exhibit 10.7 to Amendment No. 3 of the Registrant’s Registration Statement on Form S-1 (File No. 333-142875) filed with the SEC on July 20, 2007). | |
| 10.8 |
Agreement dated November 30, 2005 among Genpact Global Holdings SICAR S.à.r.l., Macro*World Research Corporation and Wachovia Corporation (which was merged with Wells Fargo & Company) (incorporated by reference to Exhibit 10.8 to Amendment No. 3 of the Registrant’s Registration Statement on Form S-1 (File No. 333-142875) filed with the SEC on July 20, 2007).‡ | |
| 10.9 |
Amended and Restated Credit Agreement dated June 30, 2006 among Genpact International S.à.r.l., Genpact Global Holdings SICAR S.à.r.l., Bank of America Securities Asia Limited, Bank of America, N.A. and certain other parties (incorporated by reference to Exhibit 10.9 to Amendment No. 2 of the Registrant’s Registration Statement on Form S-1 (File No. 333-142875) filed with the SEC on July 16, 2007). | |
E-1
Table of Contents
| Exhibit |
Description | |
| 10.10 |
Gecis Global Holdings 2005 Stock Option Plan (incorporated by reference to Exhibit 10.10 to the Registrant’s Registration Statement on Form S-1 (File No. 333-142875) filed with the SEC on May 11, 2007).† | |
| 10.11 |
Genpact Global Holdings 2006 Stock Option Plan (incorporated by reference to Exhibit 10.11 to the Registrant’s Registration Statement on Form S-1 (File No. 333-142875) filed with the SEC on May 11, 2007).† | |
| 10.12 |
Genpact Global Holdings 2007 Stock Option Plan (incorporated by reference to Exhibit 10.12 to the Registrant’s Registration Statement on Form S-1 (File No. 333-142875) filed with the SEC on May 11, 2007).† | |
| 10.13 |
Form of Stock Option Agreement (incorporated by reference to Exhibit 10.13 to the Registrant’s Registration Statement on Form S-1 (File No. 333-142875) filed with the SEC on May 11, 2007).† | |
| 10.14 |
Stock Option Agreement dated as of July 26, 2005 between Gecis Global Holdings SICAR S.à.r.l. and Pramod Bhasin (incorporated by reference to Exhibit 10.14 to the Registrant’s Registration Statement on Form S-1 (File No. 333-142875) filed with the SEC on May 11, 2007).† | |
| 10.15 |
Employment Agreement dated as of July 26, 2005, with effect from January 1, 2005, by and among Gecis Global Holdings SICAR S.à.r.l., Gecis International S.à.r.l. and Pramod Bhasin (incorporated by reference to Exhibit 10.15 to the Registrant’s Registration Statement on Form S-1 (File No. 333-142875) filed with the SEC on May 11, 2007).† | |
| 10.16 |
Employment Agreement dated as of September 21, 2005, with effect from February 7, 2005, by and among Gecis Global Holdings SICAR S.à.r.l., Gecis International S.à.r.l. and N.V. Tyagarajan (incorporated by reference to Exhibit 10.16 to the Registrant’s Registration Statement on Form S-1 (File No. 333-142875) filed with the SEC on May 11, 2007).† | |
| 10.17 |
Reorganization Agreement dated as of July 13, 2007, by and among the Registrant, Genpact Global (Lux) S.à.r.l., Genpact Global Holdings SICAR S.à.r.l. and the shareholders listed on the signature pages thereto (incorporated by reference to Exhibit 10.17 to Amendment No. 2 of the Registrant’s Registration Statement on Form S-1 (File No. 333-142875) filed with the SEC on July 16, 2007). | |
| 10.18 |
Fiduciary Share Exchange Agreement dated as of July 13, 2007, by and among the Registrant, Genpact Global Holdings SICAR S.à.r.l. and Sal Oppenheim Jr. & Cie. S.C.A. (incorporated by reference to Exhibit 10.18 to Amendment No. 2 of the Registrant’s Registration Statement on Form S-1 (File No. 333-142875) filed with the SEC on July 16, 2007). | |
| 10.19 |
Assignment and Assumption Agreement dated as of July 13, 2007, among the Registrant, Genpact Global Holdings SICAR S.à.r.l. and Genpact International, LLC (incorporated by reference to Exhibit 10.19 to Amendment No. 2 of the Registrant’s Registration Statement on Form S-1 (File No. 333-142875) filed with the SEC on July 16, 2007). | |
| 10.20 |
Genpact Limited 2007 Omnibus Incentive Compensation Plan (incorporated by reference to Exhibit 10.20 to Amendment No. 2 of the Registrant’s Registration Statement on Form S-1 (File No. 333-142875) filed with the SEC on July 16, 2007).† | |
| 10.21 |
Form of Director Indemnity Agreement (incorporated by reference to Exhibit 10.21 to Amendment No. 4 of the Registrant’s Registration Statement on Form S-1(File No. 333-142875) filed with the SEC on August 1, 2007).† | |
| 10.22 |
Amended and Restated Employment Agreement dated as of December 24, 2007, with effect from January 1, 2005, by and between the Registrant and Pramod Bhasin (incorporated by reference to Exhibit 10.1 to the Registrant’s Current Report on Form 8-K (File No. 001-33626) filed with the SEC on December 27, 2007).† | |
| 10.23 |
Employment Agreement, with effect from October 1, 2007, by and between Genpact Romania SRL and Patrick Cogny (incorporated by reference to Exhibit 10.3 to the Registrant’s Current Report on Form 8-K (File No. 001-33626) filed with the SEC on December 27, 2007).† | |
E-2
Table of Contents
| Exhibit |
Description | |
| 10.24 |
Master Services Agreement Fourth Amendment dated March 27, 2008 between Genpact International, Inc. and General Electric Company (incorporated by reference to Exhibit 10.24 to the Registrant’s Annual Report on Form 10-K (File No. 001-33626) filed with the SEC on March 31, 2008). | |
| 10.25 |
Amendment No. 1 to the Amended and Restated Shareholders’ Agreement dated March 27, 2008 by and among the Registrant, Genpact Global Holdings (Bermuda) Limited, Genpact Global (Bermuda) Limited and the shareholders listed on the signature pages thereto(incorporated by reference to Exhibit 10.25 to the Registrant’s Annual Report on Form 10-K (File No. 001-33626) filed with the SEC on March 31, 2008). | |
| 10.26 |
U.S. Employee Stock Purchase Plan and International Employee Stock Purchase Plan (incorporated by reference to Exhibit A to the Registrant’s Proxy Statement filed on Schedule 14A with the SEC on April 3, 2008).† | |
| 10.27 |
Share Purchase Agreement dated August 14, 2008 by and among Genpact Limited, Genpact Luxembourg S.A.R.L., General Electric Capital Corporation (“GE Capital”) and GE Consumer Finance, Inc. incorporated by reference to Exhibit 10.1 to the Registrant’s Quarterly Report on Form 10-Q (File No. 001-33626) filed with the SEC on November 13, 2008). | |
| 10.28 |
Employment Agreement by and between Genpact Onsite Services Inc. and Patrick Cogny dated October 21, 2008 (incorporated by reference to Exhibit 10.1 to the Registrant’s Current Report on Form 8-K (File No. 001-33626) filed with the SEC on October 24, 2008).† | |
| 10.29 |
Master Services Agreement Fifth Amendment dated November 24, 2009 between Genpact International, Inc. and General Electric Company* | |
| 10.30 |
Master Services Agreement Sixth Amendment dated January 20, 2010 between Genpact International, Inc. and General Electric Company*‡ | |
| 10.31 |
Letter Agreement by and between Robert Pryor and Genpact US Holdings, Inc, dated December 31, 2008.*† | |
| 10.32 |
Form of RSU Award Agreement*† | |
| 21.1 |
Subsidiaries of the Registrant.* | |
| 23.1 |
Consent of KPMG.* | |
| 24.1 |
Powers of Attorney (included on the signature pages of this report).* | |
| 31.1 |
Certification of the Chief Executive Officer pursuant to Rule 13a-14(a) or 15d-14(a) of the Securities Exchange Act of 1934, as adopted pursuant to Section 302 of the Sarbanes-Oxley Act of 2002.* | |
| 31.2 |
Certification of the Chief Financial Officer pursuant to Rule 13a-14(a) or 15d-14(a) of the Securities Exchange Act of 1934, as adopted pursuant to Section 302 of the Sarbanes-Oxley Act of 2002.* | |
| 32.1 |
Certification of the Chief Executive Officer pursuant to 18 U.S.C. Section 1350, as adopted pursuant to Section 906 of the Sarbanes- Oxley Act of 2002.* | |
| 32.2 |
Certification of the Chief Financial Officer pursuant to 18 U.S.C. Section 1350, as adopted pursuant to Section 906 of the Sarbanes-Oxley Act of 2002.* | |
| * | Filed with this Annual Report on Form 10-K. |
| † | Indicates a management contract or compensatory plan, contract or arrangement in which any director or executive officer participates. |
| ‡ | Confidential treatment has been requested for certain portions that are omitted in the copy of the exhibit electronically filed with the SEC. The omitted information has been filed separately with the SEC pursuant to our application for confidential treatment. |
E-3