Attached files
| file | filename |
|---|---|
| EX-21.1 - EX-21.1 - Genpact LTD | d833545dex211.htm |
| EX-31.2 - EX-31.2 - Genpact LTD | d833545dex312.htm |
| EX-31.1 - EX-31.1 - Genpact LTD | d833545dex311.htm |
| EX-23.1 - EX-23.1 - Genpact LTD | d833545dex231.htm |
| EX-32.1 - EX-32.1 - Genpact LTD | d833545dex321.htm |
| EX-32.2 - EX-32.2 - Genpact LTD | d833545dex322.htm |
| EXCEL - IDEA: XBRL DOCUMENT - Genpact LTD | Financial_Report.xls |
Table of Contents
UNITED STATES
SECURITIES AND EXCHANGE COMMISSION
Washington, D.C. 20549
Form 10-K
| x | Annual Report Pursuant to Section 13 or 15(d) of the Securities Exchange Act of 1934 for the fiscal year ended December 31, 2014. |
| ¨ | Transition Report Pursuant to Section 13 or 15(d) of the Securities Exchange Act of 1934 for the transition period from to . |
| Commission file number: 001-33626 |
GENPACT LIMITED
(Exact name of registrant as specified in its charter)
| Bermuda | 98-0533350 | |
| (State or other jurisdiction of incorporation or organization) | (I.R.S. Employer Identification No.) |
Canon’s Court
22 Victoria Street
Hamilton HM 12
Bermuda
(441) 295-2244
(Address, including zip code, and telephone number, including area code, of registrant’s principal executive office)
Securities registered pursuant to Section 12(b) of the Act:
| Title of Each Class |
Name of Exchange on Which Registered | |
| Common shares, par value $0.01 per share | New York Stock Exchange |
Securities registered pursuant to Section 12(g) of the Act: None
Indicate by check mark if the registrant is a well-known seasoned issuer, as defined in Rule 405 of the Securities Act. Yes x No ¨
Indicate by check mark if the registrant is not required to file reports pursuant to Section 13 or 15(d) of the Act. Yes ¨ No x
Indicate by check mark whether the registrant (1) has filed all reports required to be filed by Section 13 or 15(d) of the Securities Exchange Act of 1934 during the preceding 12 months (or for such shorter period that the registrant was required to file such reports), and (2) has been subject to such filing requirements for the past 90 days. Yes x No ¨
Indicate by check mark whether the registrant has submitted electronically and posted on its corporate Web site, if any, every Interactive Data File required to be submitted and posted pursuant to Rule 405 of Regulation S-T (§232.405 of this chapter) during the preceding 12 months (or for such shorter period that the registrant was required to submit and post such files). Yes x No ¨
Indicate by check mark if disclosure of delinquent filers pursuant to Item 405 of Regulation S-K (§229.405 of this chapter) is not contained herein, and will not be contained, to the best of registrant’s knowledge, in definitive proxy or information statements incorporated by reference in Part III of this Annual Report on Form 10-K or any amendment to this Annual Report on Form 10-K. x
Indicate by check mark whether the registrant is a large accelerated filer, an accelerated filer, a non-accelerated filer, or a smaller reporting company. See the definitions of “large accelerated filer,” “accelerated filer” and “smaller reporting company” in Rule 12b-2 of the Exchange Act. (Check one):
| Large accelerated filer x |
Accelerated filer ¨ | Non-accelerated filer ¨ (Do not check if a smaller reporting company) |
Smaller reporting company ¨ |
Indicate by check mark whether the registrant is a shell company (as defined in Rule 12b-2 of the Act). Yes ¨ No x
As of June 30, 2014, the aggregate market value of the common shares of the registrant held by non-affiliates of the registrant was $2,777,881,756, based on the closing price of the registrant’s common shares, par value of $0.01 per share, reported on the New York Stock Exchange on such date of $17.53 per share. Directors, executive officers and significant shareholders of Genpact Limited are considered affiliates for purposes of this calculation, but should not necessarily be deemed affiliates for any other purpose.
As of February 19, 2015, there were 220,074,938 common shares of the registrant outstanding.
Documents incorporated by reference:
The registrant intends to file a definitive proxy statement pursuant to Regulation 14A within 120 days of the end of the fiscal year ended December 31, 2014. Portions of the proxy statement are incorporated herein by reference to the following parts of this Annual Report on Form 10-K:
Part III, Item 10, Directors, Executive Officers and Corporate Governance;
Part III, Item 11, Executive Compensation;
Part III, Item 12, Security Ownership of Certain Beneficial Owners and Management and Related Stockholder Matters;
Part III, Item 13, Certain Relationships and Related Transactions, and Director Independence; and
Part III, Item 14, Principal Accounting Fees and Services.
Table of Contents
| Page No. | ||||||||||
| PART I |
Item No. | |||||||||
| 1. | Business | 1 | ||||||||
| 1A. | 16 | |||||||||
| 1B. | 34 | |||||||||
| 2. | 34 | |||||||||
| 3. | 34 | |||||||||
| 4. | 34 | |||||||||
| PART II |
||||||||||
| 5. | 35 | |||||||||
| 6. | 38 | |||||||||
| 7. | Management’s Discussion and Analysis of Financial Condition and Results of Operations |
39 | ||||||||
| 7A. | 67 | |||||||||
| 8. | 68 | |||||||||
| 9. | Changes in and Disagreements with Accountants on Accounting and Financial Disclosure |
68 | ||||||||
| 9A. | 68 | |||||||||
| 9B. | 70 | |||||||||
| PART III |
||||||||||
| 10. | 70 | |||||||||
| 11. | 70 | |||||||||
| 12. | Security Ownership of Certain Beneficial Owners and Management and Related Stockholder Matters |
70 | ||||||||
| 13. | Certain Relationships and Related Transactions, and Director Independence |
70 | ||||||||
| 14. | 70 | |||||||||
| PART IV |
||||||||||
| 15. | 71 | |||||||||
| CONSOLIDATED FINANCIAL STATEMENTS |
||||||||||
| F-2 | ||||||||||
| F-4 | ||||||||||
| F-6 | ||||||||||
| F-7 | ||||||||||
| F-8 | ||||||||||
| F-11 | ||||||||||
| F-12 | ||||||||||
| E-1 | ||||||||||
i
Table of Contents
Special Note Regarding Forward-Looking Statements
We have made statements in this Annual Report on Form 10-K (the “Annual Report”) in, among other sections, Item 1—“Business,” Item 1A—“Risk Factors,” and Item 7—“Management’s Discussion and Analysis of Financial Condition and Results of Operations” that are forward-looking statements. In some cases, you can identify these statements by forward-looking terms such as “expect,” “anticipate,” “intend,” “plan,” “believe,” “seek,” “estimate,” “could,” “may,” “shall,” “will,” “would” and variations of such words and similar expressions, or the negative of such words or similar expressions. These forward-looking statements, which are subject to risks, uncertainties and assumptions about us, may include projections of our future financial performance, which in some cases may be based on our growth strategies and anticipated trends in our business. These statements are only predictions based on our current expectations and projections about future events. There are important factors that could cause our actual results, level of activity, performance or achievements to differ materially from those expressed or implied by the forward-looking statements. In particular, you should consider the numerous risks outlined under Item 1A—“Risk Factors” in this Annual Report. These forward looking statements include, but are not limited to, statements relating to:
| • | our ability to retain existing clients and contracts; |
| • | our ability to win new clients and engagements; |
| • | the expected value of the statements of work under our master service agreements; |
| • | our beliefs about future trends in our market; |
| • | political, economic or business conditions in countries where we have operations or where our clients operate; |
| • | expected spending on business process outsourcing and information technology services by clients; |
| • | foreign currency exchange rates; |
| • | our ability to convert bookings to revenue; |
| • | our rate of employee attrition; |
| • | our effective tax rate; and |
| • | competition in our industry. |
Factors that may cause actual results to differ from expected results include, among others:
| • | our ability to grow our business and effectively manage growth and international operations while maintaining effective internal controls; |
| • | our dependence on revenues derived from clients in the United States and Europe; |
| • | our dependence on favorable tax legislation and tax policies that may be amended in a manner adverse to us or be unavailable to us in the future; |
| • | our ability to successfully consummate or integrate strategic acquisitions; |
| • | our ability to maintain pricing and asset utilization rates; |
| • | our ability to hire and retain enough qualified employees to support our operations; |
| • | increases in wages in locations in which we have operations; |
| • | our relative dependence on the General Electric Company (GE); |
ii
Table of Contents
| • | financing terms, including, but not limited to, changes in the London Interbank Offered rate, or LIBOR; |
| • | restrictions on visas for our employees traveling to North America and Europe; |
| • | fluctuations in exchange rates between the U.S. dollar, the Euro, U.K. pound sterling, Chinese renminbi, Hungarian forint, Japanese yen, Indian rupee, Australian dollar, Philippines peso, Guatemalan quetzal, Mexican peso, Polish zloty, Romanian leu, South African rand, Hong Kong dollar, Singapore dollar, Arab Emirates dirham, Brazilian real, Swiss franc, Swedish krona, Danish krone, Thai baht, Kenyan shilling, Czech koruna, Canadian dollar, Colombian peso, Norwegian krone, Peruvian nuevo, Saudi Arabian riyal, Indonesian rupiah and Thai bhat; |
| • | our ability to retain senior management; |
| • | the selling cycle for our client relationships; |
| • | our ability to attract and retain clients and our ability to develop and maintain client relationships on attractive terms; |
| • | legislation in the United States or elsewhere that adversely affects the performance of business process outsourcing and information technology services offshore; |
| • | increasing competition in our industry; |
| • | telecommunications or technology disruptions or breaches, or natural or other disasters; |
| • | our ability to protect our intellectual property and the intellectual property of others; |
| • | deterioration in the global economic environment and its impact on our clients, including the bankruptcy of our clients; |
| • | regulatory, legislative and judicial developments, including the withdrawal of governmental fiscal incentives; |
| • | the international nature of our business; |
| • | technological innovation; |
| • | our ability to derive revenues from new service offerings; and |
| • | unionization of any of our employees. |
Although we believe the expectations reflected in the forward-looking statements are reasonable at the time they are made, we cannot guarantee future results, level of activity, performance or achievements. Achievement of future results is subject to risks, uncertainties, and potentially inaccurate assumptions. Should known or unknown risks or uncertainties materialize, or should underlying assumptions prove inaccurate, actual results could differ materially from past results and those anticipated, estimated or projected. You should bear this in mind as you consider forward looking statements. We undertake no obligation to update any of these forward-looking statements after the date of this filing to conform our prior statements to actual results or revised expectations. You are advised, however, to consult any further disclosures we make on related subjects in our Forms 10-Q and Form 8-K reports to the SEC.
iii
Table of Contents
PART I
Overview
Genpact stands for “generating business impact.” We design, transform, and run intelligent business operations including those that are complex and specific to a set of chosen industries. The result is advanced operating models that assist our clients in becoming more competitive by supporting their growth and managing cost, risk, and compliance across a range of functions such as finance and procurement, financial services account servicing, claims management, regulatory affairs, and industrial asset optimization. Our Smart Enterprise Processes (SEPSM) proprietary framework helps companies reimagine how they operate by integrating effective Systems of Engagement™, core IT, and Data-to-Action AnalyticsSM. Our hundreds of long-term clients include more than one-fourth of the Fortune Global 500. We employ over 67,000 people in 25 countries with key management and a corporate office in New York City, while remaining flexible and collaborative with a management team that drives client partnerships personally. We believe we generate impact quickly because of our unparalleled experience running complex operations and business domain expertise, driving our focus on what works and making transformation sustainable. We have a unique history: behind our passion for process and operational excellence is the Lean and Six Sigma heritage of a former General Electric division that has served GE businesses for more than 16 years.
In 2014, we had net revenues of $2.279 billion, of which $1.813 billion, or 79.6%, was from clients other than GE, which we refer to as Global Clients, with the remaining $466.1 million, or 20.4%, coming from GE.
Our business was initially conducted through various entities and divisions of GE. We began operating as an independent company in 2004, when GE placed our operations under a newly-formed Luxembourg company and sold indirect interests in us to our initial private equity sponsors. In 2007, we became a Bermuda company and completed our initial public offering. In 2012, affiliates of Bain Capital Investors, LLC, or Bain Capital, acquired the majority of our initial private equity sponsors’ interests. As of December 31, 2014, Bain Capital (through its affiliates) owned approximately 26% of our outstanding equity.
We use the terms “Genpact,” “Company,” “we” and “us” to refer to both our predecessor company and its subsidiaries, and Genpact Limited and its subsidiaries. Our registered office is located at Canon’s Court, 22 Victoria Street, Hamilton HM 12, Bermuda.
Our Solution
Our vision is to be the global leader in helping businesses make smarter decisions and realize better business outcomes through expertise and a deep understanding of process operations, analytics and technology. We seek to build long-term client relationships with companies that wish to improve the ways in which they do business and to whom we can offer a full range of services. With our broad and deep capabilities and our global delivery platform, our goal is to deliver comprehensive and innovative solutions and continuous process improvement to clients around the world.
Smart Enterprise Processes (SEPSM)
SEPSM is our unique and highly granular approach to dramatically improving the performance of business processes. In addition to efficiency, it focuses on maximizing process effectiveness.
SEPSM is based on work done in the Genpact Process Innovation Lab, where we have leveraged our exposure to thousands of business processes and hundreds of millions of client transactions to map and analyze end-to-end processes at a granular level. This enables us to test the effectiveness of a client’s processes by measuring opportunities for improvement across the value chain using best-in-class benchmarks gleaned from within and across industries and to apply our innovative process design, effective, market-leading technology,
1
Table of Contents
and analytical skills and tools to improve them. The result is a client-specific road map for maximizing process effectiveness. Benefits are delivered by combining Genpact’s deep domain knowledge of process, key insights and best practices with execution support including focused IT applications and technology, targeted analytics, re-engineering and global delivery services.
Unlike other approaches, SEPSM focuses on measuring business outcomes, such as cash flow and margins, which make visible the effectiveness of a process in driving business results. The approach also takes an end-to-end, enterprise-wide view, working beyond traditional organizational silos.
Genpact Digital
Genpact’s Digital practice helps clients reimagine their business operations with an innovative set of advanced technologies along with differentiated core IT services that drive transformative solutions for our clients. Our Systems of Engagement™ solutions provide an engagement layer of agile, nimble technologies that address end-to-end business processes and are built using social, mobility, big data and cloud-based technologies on a foundation of deep process experience and domain expertise.
Our Expertise
Our business focuses on industry verticals in banking and financial services, insurance, capital markets, consumer product goods, life sciences, infrastructure, manufacturing and services, healthcare and high tech.
Our offerings in these core vertical activities are driven by our broad end-to-end process expertise, which includes:
| • | finance and accounting (F&A) services; |
| • | analytics and research; |
| • | business consulting and enterprise risk consulting; |
| • | re-engineering; |
| • | supply chain and procurement services; |
| • | enterprise application services; |
| • | IT management services; and |
| • | collections and customer services. |
We seek to deliver significant business impact for our clients by designing, transforming and running a combination of processes, as well as providing multiple services that combine elements of several of our service offerings. In providing services across our global delivery platform, we draw on core capabilities in process expertise, analytical ability and technology expertise, as well as the operational insight we have acquired from our experience in managing thousands of processes for our clients.
| • | Process Expertise. We have extensive experience in running a wide range of processes and used this expertise to develop our Smart Enterprise Processes (SEPSM) proprietary framework. We believe we have built a science of process through SEPSM—a unique and highly granular approach to managing business processes. In addition to efficiency, it focuses on maximizing process effectiveness. We also apply the principles of Six Sigma and Lean to eliminate defects and variation and reduce inefficiency. Our Six Sigma and Lean process rigor also allows us to develop and track operational metrics to measure process performance as a means of monitoring service levels and enhancing productivity. |
2
Table of Contents
| • | Analytical and Research Capabilities. Our analytical and research capabilities are central to our ability to improve business processes. They enable us to work with our clients and identify weaknesses in business processes and redesign and transform them to create additional business value. The confluence of big data, regulatory changes and social media are causing a major shift in the way businesses operate. We help our clients harness data to identify trends and issues, uncover new insights, identify and prevent future risks and fine-tune operations to make smarter decisions and meet business goals. We also rigorously apply analytical methodologies, which we use to measure and enhance performance of our client services. In addition, we apply these methodologies to measure and improve our own internal functions, including recruitment and retention of personnel. |
| • | Technology Expertise. Our information technology expertise includes extensive knowledge and integration of third-party hardware, network and computing infrastructure, and enterprise resource planning (ERP) and other software applications. We also use technology to better manage the transition of processes, to automate and run processes more efficiently and to replace or redesign processes to enhance productivity. Our ability to combine our business process and IT expertise, along with our Six Sigma and Lean skills, allows us to ensure our clients achieve the full potential of business intelligence platforms and web-based software platforms. |
| • | Operational Insight. Our operational insight enables us to make the best use of our core capabilities. Operational insight starts with the ability to understand the business context of a process. We place great value on understanding not only the industry in which a client operates, but also the business culture and institutional parameters within which a process is operated. Operational insight also requires the judgment to determine the best way to improve a process in light of the knowledge of best practices across different industries, as well as an appreciation of what solutions can be fully implemented in the context of the particular business environment. |
Our Strategic Client Model
We seek to create long-term relationships with our clients where they view us as an integral part of their organization and not just as a service provider. These relationships often begin with the outsourcing of discrete processes or with shorter-cycle engagements in analytics and research, business consulting, enterprise risk consulting or re-engineering. Over time, these relationships expand to encompass multiple business processes across a broader set of functions and geographic areas. As clients adapt to a constantly changing environment, many are increasingly turning to Genpact for support in transforming their operations to become more competitive. These long-term transformative engagements are global and multi-tower, combining process, technology, and analytics. No matter how large or small the engagement, we strive to be a seamless extension of our client’s operations. To achieve this goal, we developed the Genpact Virtual CaptiveSM model for service delivery, and we may implement all or some of its features in any given client relationship, depending on the client’s needs. Under this approach, we provide a client with dedicated employees and management as well as dedicated infrastructure at our delivery centers to create a virtual extension of the client’s own team and environment. We train our personnel in the client’s culture so that they are familiar not only with the process but with the business environment in which it is being executed.
Our Strategy
The specific elements of our strategy include the following:
Guide Global Enterprises to Best-in-Class
Our Smart Enterprise Processes (SEPSM) framework, built on the foundation of thousands of Lean Six Sigma-based improvement ideas and benchmarks around granular process performance, builds deeper client relationships and delivers measurable business impact over time. Our differentiated framework is critical not only to extending client contracts but also creating an expansive partnership with our clients.
3
Table of Contents
Enhance Targeted Vertical Industry and Domain Expertise
Clients want partners who know their industry and processes at a granular level. We continue to enhance our industry and domain capabilities through acquisitions and by investing in experienced professionals in our targeted verticals and service areas to improve client intimacy and help us deliver end-to-end services that drive business impact.
Differentiate our Solutions by Combining Process Expertise, Analytics and Technology
Clients face an environment of uncertainty and change, which requires them to better leverage existing costs and investments, and make more informed decisions that address challenges around regulations and risk, while they continue to drive top-line growth and profitability. The insights we derive from our experience and expertise, combining smarter processes, analytics and technology, help us provide a differentiated solution to these challenges.
Expand Geographically in Key Markets
We deliver our services and solutions from 18 countries, including seven locations in the United States. We continue to expand and diversify our delivery capabilities in order to be closer to our clients.
Our Services
The services we provide often draw on processes and platforms from several of our service offerings. We understand that our clients’ senior management teams are focused on achieving business outcomes, rather than on transferring particular processes or employing particular platforms. Therefore, we focus on understanding the business needs of our clients and the business context of existing processes in order to design appropriate and comprehensive solutions.
Our core vertical activities for our clients include the following:
| • | Banking and Financial Services. Our banking and financial services core operations include application processing; mortgage origination; wealth management, risk management; account servicing and set-up; collections and customer services; commercial lending, business banking and auto finance. We use our analytics capabilities to help our clients price products, estimate capital and reserve requirements, analyze and monitor portfolios, and manage risk. We also handle reporting and monitoring services for statutory and regulatory compliance, portfolio and performance review services and financial planning and tax services. Our services for financial services clients include investment banking support for deals, asset-backed finance surveillance, trade finance support, payment and fraud operations support, Basel II/III support and risk analysis for derivatives and foreign exchange. Our wealth management services include brokerage and retirement offerings that provide end-to-end process services, including on-boarding, reconciliations, plan administration, fund administration, and trade support. |
| • | Insurance. Our insurance services include underwriting, claims management, risk and catastrophe modeling, and customer segmentation and loyalty. We offer insurance services to several industry sectors—life and annuities, property and casualty, and reinsurance—and provide what we refer to as a “virtual insurance company” for our clients in the insurance industry. We cover many phases of insurance business processes including product development, finance, risk management, actuarial, sales and marketing, underwriting support, and claims and policy administration. |
| • | Capital Markets. Our capital markets practice provides an end-to-end range of information technology services for the capital markets industry, including application development and maintenance; managed services such as quality assurance, testing and production support; business process outsourcing; domain knowledge-based consulting related to technology systems (domain consulting); and consulting not tied |
4
Table of Contents
| to a technology system (business consulting). Areas of domain focus within our capital markets practice include asset and wealth management; risk and compliance; client onboarding; Know Your Customer (KYC); collateral management; post trade processing; and data services, such as reference data and data scrubbing and reconciliation. We have also set up centers of excellence focusing on several technology platforms used by the financial services industry, including platforms focused on brokerage compliance, trade processing and portfolio accounting. |
| • | Consumer Product Goods. Our consumer product goods services include trade promotion optimization, trade promotion management, order management, master data management, customer service, marketing optimization, supply chain decision services, marketing analytics, market mix modeling, and enterprise services such as finance and accounting, indirect procurement and IT operations. We also provide supplier risk management, supplier recovery audit, shopper analytics, store- and product-mix optimization services. |
| • | Life Sciences. Our life sciences and pharmaceutical services include contract management for managed markets; regulatory affairs including regulatory strategy, Chemistry Manufacturing Controls (CMC) compliance, regulatory operations and post marketing maintenance; multi-channel customer experience for medical information, sales and marketing, direct-to-consumer support, patient assistance programs (access and reimbursement), and patient support programs; and enterprise services such as F&A, indirect procurement, IT operations, risk management and audit support. We also provide comprehensive analytics services including market research and competitive intelligence, patient level data analysis, physician and drug analysis, social media monitoring and data management. |
| • | Infrastructure, Manufacturing and Services. Our infrastructure and manufacturing services include enterprise processes such as finance and accounting, indirect procurement and IT operations. Our industry specific solutions include aftermarket services support, industrial asset optimization, engineering services covering the complete product lifecycle from concept to release and sustaining engineering, supply chain management, direct procurement and logistics services. |
| • | Healthcare. Our healthcare expertise covers a full spectrum of services including end-to-end transactional processes, advanced technology, analytics and consultative and transformational solutions for payers, providers and pharmacy benefit managers. Our payer solutions help manage the end-to-end life cycle of a claim, from claims processing and adjudication to claims recovery and payment integrity. Our regulatory compliance solutions for both payers and providers encompass planning, business alignment systems change management, training and testing. Our FX suite of products, which is delivered using a business process as a service, or BPaaS, model, helps payers in the areas of ICD-10 transition, DRG shift analysis and payment neutrality. Our services for accountable care organizations provide support for setup, population health, revenue administration and performance management. Our provider services, including hospital optimization, clinical coding and revenue cycle management, help providers to deliver an optimal experience to patients, improve efficiency and reduce administrative costs. |
| • | High Tech. Our high tech services include service support, including customer care service, technical product support and aftermarket services; lead-to-cash; sales force commission management; supply chain and consumer analytics; and enterprise services such as F&A, sourcing and procurement, and IT operations. |
In addition to these vertical activities, our broad end-to-end process expertise spans a number of service areas, including F&A services, analytics and research, business consulting services, enterprise risk consulting, re-engineering, supply chain and procurement services, enterprise application services, IT management services and collections and customer services.
5
Table of Contents
Finance and Accounting (F&A)
We are one of the world’s premier providers of F&A services, which services include our Accounts Payable (AP), Order to Cash (OTC), Record to Report (R2R), and Enterprise Risk and Compliance services. Our AP services span the end-to-end AP function and include document management, invoice processing, approval and resolution management. OTC services include customer master data management, credit and contract management, fulfillment, billing, collections, and dispute management services. Genpact’s R2R services encompass accounting, closing and reporting (ACR), including SEC reporting, treasury, tax services, financial planning and analysis, and product cost accounting. Genpact Enterprise Risk and Compliance specializes in operational risk, SOX advisory, Basel II and regulatory compliance with services such as enterprise risk management, internal audits, FCPA and IT risk management.
In addition to managing our clients’ finance and accounting processes, we help them design, transform, and run their finance operating models to achieve best-in-class performance. Genpact Systems of Engagement (SoE™) for F&A creates an agile technology layer that complements existing systems of record, providing continuity of information and operations across the entire enterprise. Our SoE™ modules for OTC, AP, and R2R support smart processes, detailed analytics, and a host of agile technologies, including proprietary cloud-based technology platforms and bolt-on, best-of-breed solutions from our technology partners.
Analytics and research
We offer analytics services both on a standalone basis and as an integrated part of our other service offerings. We help our clients re-imagine their business operations in the context of analytics and technology through the delivery of Genpact Intelligent OperationsSM. The Genpact Intelligent Process Insights Engine has been built using a Systems of Engagement™ approach to develop a process-aware platform that embeds technology and analytics to deliver purpose-built analytics applications that drive significant business outcomes for clients. We help our clients harness data to assess business opportunities, mitigate risks, improve performance or otherwise help their businesses with the sole objective of generating impact. Companies do not always recognize the inherent potential in data or do not have the capability to apply the rigorous analytical models that might reveal opportunities. Our domain-specific analytics prowess, along with a sophisticated innovation ecosystem, is increasingly embedded in all of our service offerings to help clients make fact-based decisions for superior results. By quantitatively and qualitatively scrutinizing data, we can deliver the insight necessary to assess a new business opportunity, mitigate market risks, or retain and build market share.
Business consulting and enterprise risk consulting
We partner with our clients through the entire lifecycle of designing, transforming and running a varied set of their commercial processes. In this journey, our business consulting and enterprise risk consulting groups help clients create the right design and target operating models for their commercial functions by developing transformation roadmaps and helping to execute the roadmaps for such processes. For our clients for whom we run processes in addition to designing their process roadmaps, the business and enterprise risk consulting teams also support the operating teams to deliver the value and transformation we have committed to provide. Our business consulting and enterprise risk consulting business is built on our deep expertise in process, our ability to leverage state-of-the-art technology, our competence in designing mitigation strategies that are woven into core operating processes, and our unique skills in applying cutting-edge analytics to drive fundamental shifts in business performance.
Re-engineering
Our re-engineering services, which we also refer to as our transformation services, help clients realize cost savings or increased revenues by improving processes that are underperforming or designing processes that are needed to meet growth objectives. Clients engage our transformation teams to provide an end-to-end view of
6
Table of Contents
their organization and help determine business process needs at a strategic level as well as at the execution level. Strategically, we help clients achieve a comprehensive assessment of how well their enterprise-level processes such as source-to-pay, order-to-cash, record-to-report, inquiry-to-order, new product introduction and sales force effectiveness perform against industry benchmarks and best practices. At the execution level, we institutionalize the recommendations by deploying resources to train the client team and drive sustainable best practices.
Supply Chain and Procurement
Our supply chain and procurement services include direct and indirect sourcing and procurement services, demand forecasting and management services, engineering services, inventory optimization and planning services, fleet and logistics services and aftermarket services. We work with our clients to design, execute and support optimum sourcing strategies for different expense categories and to drive compliance in the execution of those strategies and realize significant reductions in client sourcing expenses. This often includes designing sourcing and procurement processes to reduce operational costs, overhauling inventory planning systems to optimize inventory levels and improve fulfillment levels, designing and implementing logistics services that integrate disparate technology systems and provide dynamic digital “dashboard” reporting, or designing aftermarket services systems that ensure fulfillment of contractual obligations and improved service productivity. We commonly utilize our technology expertise in delivering our services in this area, particularly in automating order management processes and monitoring and optimizing supply chain logistics. We have competency in many of the custom platforms used by our clients and are not tied to any single platform or vendor.
Enterprise Application Services
With our enterprise application services, we plan, design, build, test, implement, run and support software solutions for our clients. We leverage our functional and domain knowledge and use Six Sigma and Lean principles to reduce the cycle time of software implementations. This can include ERP, supply chain management, financial management and customer relationship management solutions, as well as testing, database administration and architecture services. We also have significant expertise in Hyperion, SAS and Cognos, and platform support for ERP systems such as Oracle, SAP and Microsoft.
IT Management Services
Our IT management services consist of end user computing, IT infrastructure, database, security and production support services. We provide support in more than 25 languages with a global footprint of native speakers. We provide monitoring and management of clients’ data centers, servers, storage, emails, networks, databases, applications and end user devices. We use a network of Remote Operations Centers to provide 24/7 infrastructure monitoring and management. Along with ITIL (ISO 20000), we use Six Sigma and Lean principles to address technology problems and to enable our clients to align their IT to business priorities and at the same time reduce technology costs. We use our proprietary SEPSM framework Service Disruption to Restore (D2R), along with our accelerators and IP frameworks, to continuously reduce defects and create business priority outcomes. We also provide cloud enablement services, ITIL implementation services and comprehensive BPaaS services.
Collections and Customer Services
Our collections and customer services are provided primarily in the areas of consumer finance, business to business collections and mortgage services. Our collections services include a full range of accounts receivable management services, such as early to late stage collections, skip-tracing, refunds and other specialized services. In our collections services, we act as an agent only; we do not acquire debts for our own account or handle debtor payments. Our customer services include account servicing and customer care services such as handling customer queries, general servicing and dispute resolution. We provide voice and non-voice services, and we also provide origination and order management services.
7
Table of Contents
Our Clients
Our clients include some of the best known companies in the world, many of which are leaders in their respective industries. GE has been our largest client since our inception and we benefit from a long-term contract whereby GE has committed to purchase stipulated minimum dollar amounts of services through the end of 2016.
GE accounted for approximately 20.4% of our revenues in fiscal 2014. We currently provide services to most of GE’s business units, including GE Capital, Power and Water, Oil and Gas, Energy Management, Aviation, Healthcare, Transportation and Home and Business Solutions. The services we currently provide to GE are broad in their nature and are drawn from all of our service offerings. Although we have a single master services agreement, or MSA, with GE, we have a large number of statements of work, or SOWs, with GE. Currently, as a general matter, each GE business unit makes its own decisions as to whether to enter into a SOW with us and as to the terms of any such SOW. Therefore, although some decisions may be made centrally at GE, our revenues from GE are generally attributable to a number of different businesses each with its own leader responsible for decision-making regarding our services.
We have over 800 clients spread across a variety of industries and geographies. Our net revenues from Global Clients have grown rapidly in the last five years, from $668.7 million in 2009 to $1.813 billion in 2014. Our net revenues from Global Clients as a percentage of total net revenues increased from 59.7% in 2009 to 79.6% in 2014. Our 2014 net revenues from Global Clients include $13.6 million for businesses that were part of GE in 2013 and 2014 prior to their divestiture by GE. See Item 7—“Management’s Discussion and Analysis of Financial Condition and Results of Operations—Classification of Certain Net Revenues.” The majority of our Global Clients are based in the United States, and we also have Global Clients in Europe, Asia and Australia.
Our contracts with our clients generally take the form of an MSA, which is a framework agreement that is then supplemented by SOWs. Our MSAs specify the general terms applicable to the services we will provide. For a description of our MSAs and SOWs, see Item 7—“Management’s Discussion and Analysis of Financial Condition and Results of Operations—Overview—Revenues.”
Our clients include AstraZeneca, CVS Caremark, Citigroup, GE, GlaxoSmithKline, Honeywell, Hyatt, Ironshore, Merck, National Australia Bank, Nissan, Symantec, Walgreens and Wells Fargo.
Our People
Our people are critical to the success of our business. Our Chief Executive Officer and other members of our senior leadership team have been involved in our business since its commencement under GE resulting in an experienced and cohesive leadership team. Many members of our leadership team developed their management skills working within GE and many of them were involved in the founding of our business. They have built our business based on the experience gained in helping GE meet a wide range of challenges. As a result, we are an institutional embodiment of much of the wisdom and experience GE developed in improving and managing its own business processes.
We have created, and constantly reinforced, a culture that emphasizes teamwork, constant improvement of our processes and, most importantly, dedication to the client. We manage this challenge through innovative human resource practices. These include broadening the employee pool by opening delivery centers in diverse locations, using innovative recruiting techniques to attract the best employees, emphasizing ongoing training, instilling a vibrant and distinctive culture and providing well-defined, long-term career paths. We also have programs modeled on GE management training programs to develop the next generation of leaders and managers of our business.
As of December 31, 2014, we had approximately 67,900 employees. We monitor and manage our attrition rate very closely, and believe it is one of the lowest in the industry. We attribute this to our reputation, our ability to attract high quality applicants, our emphasis on maintaining our culture and the breadth of exposure, experience and opportunity for advancement that we provide to our employees.
8
Table of Contents
Six Sigma and Lean Methodologies
Six Sigma is a method for improving process quality by removing variation, defects and their causes in business activities while Lean is a methodology for reducing waste or inefficiency in a process. Among other things, it is designed to measure and eliminate overproduction, over-processing and waiting, and to improve the flow of a process. We have Six Sigma programs that train, test and grade employees in Lean and Six Sigma principles and award them Lean Six Sigma qualifications. The rankings of Lean Six Sigma qualifications from lowest to highest are green belt, black belt and master black belt.
As of December 31, 2014, we had more than 15,500 employees with Six Sigma green belt training, over 600 employees with Six Sigma black belt training, and more than 42,000 Lean-trained employees. This large number of employees with Six Sigma and Lean training helps infuse our organization with a disciplined, analytical approach to everything we do.
Recruiting
We face meaningful competition for skilled employees in every jurisdiction in which we operate. We have refined our talent acquisition strategy by organizing our recruiting teams by industry vertical and utilizing an internal executive recruiting team, social media platforms, online job portals and professional search firms to recruit globally. Our internal employee referral program has also become a key recruiting vehicle for us. We believe that our focus on our employees’ career development makes us attractive to candidates beyond our delivery center locations.
Training and Development
We believe in extensive and continuous training of our employees. We have the infrastructure to train approximately 6,450 people at any one time with 235 trainers. In 2014, we had more than 15,800 employees enrolled in part-time professional degree, e-learning and other non-degree programs provided internally or by universities and other third parties. Our training programs are designed to transfer the industry-specific knowledge and experience of our industry leaders to our employees to ensure we maintain our deep process and domain expertise across the industries and processes in which we work. Our training programs cover a large number of topics, including specific service offerings, key technical and IT skills, our different clients’ workplace cultures and Six Sigma and Lean methodologies. A large part of our continuous training is designed to impart the skills and knowledge required by our employees to move to positions of increasing responsibility within Genpact.
We also have programs modeled on GE management training programs to develop the next generation of leaders and managers of our business. We run these programs for employees at various levels of management, including front-line managers, and middle and senior management.
We are working with universities, colleges, governments and private institutes in some of the countries we operate in to develop talent supply chains. We are seeking to ensure the continued availability of skilled workers in the countries in which we operate.
Retention
In order to meet our growth and service commitments, we are constantly striving to attract and retain employees. There is significant turnover of employees in the business process outsourcing and information technology sectors generally, particularly in India where the majority of our employees are currently based. Our attrition rate for all employees who have been employed by us for one day or more was 25% in 2014. We believe this rate is relatively low for our industry based on statistics published by industry associations such as NASSCOM. We attribute this low attrition rate to a number of factors, including our effective recruiting
9
Table of Contents
measures, extensive training and a strong culture of providing opportunities for growth and learning. Approximately 13% of our employees were promoted in 2014, and we filled a majority of new positions internally.
We also take aggressive action to monitor and minimize potential attrition. Using Six Sigma principles we have developed an early warning system that tracks employees and gives us an insight into which employees are most likely to resign. These employees are automatically highlighted to management who can take action such as relocating the employee or enrolling the employee in continuing education programs to increase the likelihood of retention.
As another measure designed to minimize attrition, we “right-skill” our employees to the tasks assigned to them. This means that we match the level of services required to the experience and qualification of the employee concerned and we avoid having over-qualified people in any particular job. This allows us to give our highly qualified and experienced people higher-value jobs and, coupled with the practice of up-skilling, ensures better career paths for all of our employees.
Corporate Social Responsibility
Our Corporate Social Responsibility (CSR) initiative aims to integrate our social and environmental priorities with our operational fabric. Genpact’s approach to CSR focuses on three pillars that reflect our strengths and core expertise as well as causes that our employees are passionate about:
| • | Education and employability |
| • | Environment and sustainability |
| • | Inclusion |
We have institutionalized a culture of giving and volunteering through a number of global platforms, programs, projects and social initiatives. Among other things, our employee volunteers help underprivileged children and women to develop vocational skills; work on environmental initiatives such as rejuvenating urban forest land and participating in cleaning drives; and participate in programs that address the health and nutritional needs of the underprivileged.
Our Alliances
We have entered into partnerships or alliances with companies whose capabilities complement ours in an effort to enhance our existing solutions or create new solutions to address an existing market need. Such alliances may be transaction or deal-specific, may be for the development of joint capabilities in a service line or may take the form of enterprise-wide transformational partnerships. For example, we have entered into a joint venture with Markit Limited to create a streamlined service to manage “Know-Your-Customer” information for clients in our capital markets vertical.
Sales and Marketing
We market our services to both existing and potential clients through our business development team. Members of this team are based around the globe, including in the United States, Europe, Australia, Asia, and the Middle East, and dedicate their time to expanding the services we provide to our existing clients as well as acquiring new clients.
We have designated client partners or global relationship managers for each of our strategic relationships. The relationship manager is supported by process improvement, quality, transition, finance, human resources,
10
Table of Contents
information technology and industry/product subject matter expert teams to ensure the best possible solution is provided to our clients. We constantly measure our client satisfaction levels to ensure that we maintain high service levels for each client, using measures such as the Net Promoter Score. Our sales force is primarily organized by industry vertical teams that are supported by horizontal product offerings.
The length of our selling cycle varies depending on the type of engagement. The sales cycle for project work is much shorter than the sales cycle for a large business process engagement. Our efforts may begin in response to our lead generation program, a perceived opportunity, a reference by an existing client, a request for proposal or otherwise. In addition to our business development personnel, the sales effort involves people from the relevant service areas, people familiar with that prospective client’s industry, business leaders and Six Sigma resources. We may expend substantial time and resources in securing new business. See Item 7—“Management’s Discussion and Analysis of Financial Condition and Results of Operations—Overview—Revenues.”
As our relationship with a client grows, the time required to win an engagement for additional services often gradually declines. In addition, as we become more knowledgeable about a client’s business and processes, our ability to identify opportunities to create value for the client typically increases. For example, productivity benefits and greater business impact can often be achieved by applying our SEP methodology, by focusing on processes that are “upstream” or “downstream” from the processes we initially handle, or by applying our analytical and IT capabilities to re-engineer processes. In addition, clients often become more willing over time to turn over more complex and critical processes to us as we demonstrate our capabilities.
We also strive to foster relationships between our senior leadership team and our clients’ senior management. These “C-level” relationships ensure that both parties are focused on establishing priorities, aligning objectives and driving client value from the top down. High-level executive relationships have been particularly constructive as a means of increasing business from our existing clients. It also provides us with a forum for addressing client concerns. Our governance methodology is designed to ensure that we are well connected at all levels of our clients’ organizations (executive, management and operations).
We follow a rigorous review process to evaluate significant new business opportunities. This process starts with the presentation of new business to a deal review committee comprised of business and sales leaders from the applicable industry vertical, operations personnel, and members of our finance department. The committee applies a set of well-developed criteria to review the key terms of the new business. If, as a result of the review, the committee concludes that the new business is aligned with our strategic objectives and a good use of our resources, then our business development team is authorized to pursue the opportunity.
Global Delivery Platform
A key differentiator for us is our global network of 72 delivery centers in 18 countries. We also have a number of employees who work directly in client locations or provide services from a virtual environment which offers flexibility for both clients and employees. Our presence in locations around the world provides us with multi-lingual capabilities, access to a larger talent pool, “near-shoring” capabilities to take advantage of time zones, as well as the ability to provide services from the United States. With this network, we manage complex processes in multiple geographic regions. We use different locations for different types of services depending on the specific client needs and the mix of skills and cost of employees available in each location. We choose the location of our delivery centers based on a number of factors, which include the available talent pool, infrastructure, government support and operating costs, as well as client demand.
We have been a pioneer in our industry in opening centers in several cities in India as well as in some of the other countries in which we operate. We were one of the first companies in our industry to establish operating centers in certain locations, including Dalian, Foshan and Huaqiao in China; Bucharest, Romania; and Gurgaon, Hyderabad, Jaipur and Kolkata in India. We constantly evaluate new locations, including new countries and new cities within countries in which we currently operate, as potential sites for delivery centers and offices. Our delivery centers are located in Brazil, China, Colombia, the Czech Republic, England, Guatemala, India, Japan,
11
Table of Contents
Kenya, Mexico, the Netherlands, Northern Ireland, the Philippines, Poland, Romania, South Africa, the United Arab Emirates and the United States. As of December 31, 2014, we provided services in more than 30 languages.
The large number of different countries from which we serve our clients differentiates us from a number of our competitors and enables us to take advantage of different languages and time zones which, in turn, enhances our ability to serve our clients.
Intellectual Property
Increasingly, the solutions we offer our clients include a range of proprietary methodologies, software, and reusable knowledge capital. We also develop intellectual property in the course of our business and our agreements with our clients regulate the ownership of such intellectual property. We regularly apply for patents, trademarks, service marks, copyrights and domain names to protect our intellectual property. Some of our intellectual property rights are trade secrets and relate to proprietary business process enhancements.
At times, we use third-party software platforms and the software systems of our clients to provide our services. Our agreements with our clients normally include a license to use the client’s proprietary systems to provide our services. Clients authorize us to access and use third party software licenses held by the client so that we may provide our services.
It is our practice to enter into agreements with our employees and independent contractors that:
| • | ensure that all new intellectual property developed by our employees or independent contractors in the course of their employment or engagement is assigned to us; |
| • | provide for employees’ and independent contractors’ cooperation in intellectual property protection matters even if they no longer work for us; and |
| • | include a confidentiality undertaking by our employees and independent contractors. |
Competition
We operate in a highly competitive and rapidly evolving global market. We have a number of competitors offering services that are the same as or similar to ours. Our competitors include:
| • | large multinational service providers, such as Accenture plc, Capgemini S.A. and International Business Machines Corporation, and large multinational accounting firms, such as Deloitte Consulting LLP and PricewaterhouseCoopers LLP; |
| • | companies that are primarily business process service providers operating from low-cost countries, most commonly India, such as ExlService Holdings, Inc. and WNS Holdings Limited; |
| • | companies that are primarily information technology service providers with some business process service capabilities, such as Cognizant Technology Solutions, Infosys Technologies Limited, Tata Consultancy Services Limited and Wipro Limited; and |
| • | smaller, niche service providers that provide services in a specific geographic market, industry or service area. |
In addition, a client or potential client may choose not to outsource its business, including by setting up captive outsourcing operations or by performing formerly outsourced services for themselves.
Our revenues are derived primarily from Fortune Global 500 and Fortune 1000 companies. We believe that the principal competitive factors in our industry include:
| • | skills and capabilities; |
| • | technical and industry expertise; |
12
Table of Contents
| • | innovative service and product offerings; |
| • | ability to add value, including through continuous process improvement; |
| • | reputation and client references; |
| • | contractual terms, including competitive pricing; |
| • | scope of services; |
| • | quality of services and solutions; |
| • | ability to sustain long-term client relationships; and |
| • | global reach and scale. |
Our clients typically retain us on a non-exclusive basis.
Regulation
We are subject to regulation in many jurisdictions around the world as a result of the complexity of our operations and services, including at the federal, state and local level, particularly in the countries where we have operations and where we deliver services. We are also subject to regulation by regional bodies such as the European Union, or EU.
In addition, the terms of our service contracts typically require that we comply with applicable laws and regulations. In some contracts, we are required to comply even if such laws and regulations apply to our clients, but not to us. In other service contracts our clients undertake the responsibility to inform us about laws and regulations that may apply to us in jurisdictions in which they are located.
If we fail to comply with any applicable laws and regulations, we may be restricted in our ability to provide services, and may also be the subject of civil or criminal actions involving penalties, any of which could have a material adverse effect on our operations. Our clients generally have the right to terminate our contracts for cause in the event of regulatory failures, subject to notice periods. See Item 1A—“Risk Factors—Risks Related to our Business—Our global operations expose us to numerous and sometimes conflicting legal and regulatory requirements, and violations of these laws and regulations could harm our business.”
In the United States, we are subject to laws and regulations arising out of our work for clients operating there, especially in the area of banking, financial services and insurance, such as the Financial Modernization Act (sometimes referred to as the Gramm-Leach-Bliley Act), the Fair Credit Reporting Act, the Fair and Accurate Credit Transactions Act, the Right to Financial Privacy Act, the USA Patriot Act, the Bank Service Company Act, the Home Owners Loan Act, the Electronic Funds Transfer Act, the Equal Credit Opportunity Act, the Real Estate Settlement Procedures Act and the Troubled Assets Relief Program as well as regulation by U.S. agencies such as the SEC, the Federal Reserve, the Federal Deposit Insurance Corporation, the National Credit Union Administration, the Commodity Futures Trading Commission, the Federal Financial Institutions Examination Council, the Office of the Comptroller of the Currency, and the Consumer Financial Protection Bureau. We are also subject to regulation under the Health Insurance Portability and Accountability Act, the Federal Trade Commission Act, the Family Educational Rights and Privacy Act, the Communications Act, the Electronic Communications Privacy Act and applicable regulations in the area of health and other personal information that we process as part of our services.
Because of our debt collections work in the United States, we are also regulated by laws such as the Truth in Lending Act, the Fair Credit Billing Act and the Fair Debt Collections Practices Act and underlying regulations. We are currently licensed to engage in debt collection activities in all jurisdictions in the United States.
13
Table of Contents
Because of our mortgage processing activities in the United States, we are also regulated by laws such as the Fair Housing Act and the Home Mortgage Disclosure Act and by regulatory bodies such as the U.S. Department of Housing and Urban Development. We currently hold mortgage related licenses in 47 states and the District of Columbia.
Because of our insurance processing activities, we are currently licensed as a third party administrator in 41 states and are regulated by the department of insurance in each such state.
We are subject to laws in the United States, the United Kingdom and the EU that are intended to limit the impact of outsourcing on employees in those countries. See Item 1A—“Risk Factors—Risks Related to our Business—Future legislation in the United States and other jurisdictions could significantly affect the ability or willingness of our clients and prospective clients to utilize our services.”
We are also subject to laws and regulations on direct marketing, such as the Telemarketing Consumer Fraud and Abuse Prevention Act and the Telemarketing Sales Rule, the Telephone Consumer Protection Act and rules promulgated by the Federal Communications Commission, and the CAN-SPAM Act.
We are subject to laws and regulations governing foreign trade, such as the Arms Export Control Act, as well as by government bodies such as the Commerce Department’s Bureau of Industry and Security, the State Department’s Directorate of Defense Trade Controls and the Treasury Department’s Office of Foreign Assets Control.
Our service delivery centers benefit from tax incentives or concessional rates provided by laws and regulations in India, China, Colombia, the Philippines and Guatemala. The Indian Special Economic Zones Act of 2005, or SEZ legislation, introduced a tax holiday in certain situations for operations established in designated “special economic zones,” or SEZs. The SEZ tax benefits are available only for new business operations that are conducted at qualifying SEZ locations. We cannot predict what percentage of our operations or income in India or other jurisdictions in future years will be eligible for a tax holiday. See Item 7—“Management’s Discussion and Analysis of Financial Condition and Results of Operations—Overview—Income Taxes.” In addition to the tax holidays described above, certain benefits are also available to us under certain Indian state laws. These benefits include rebates and waivers in relation to payments for the transfer or registration of property (including for the purchase or lease of premises), waivers of conversion fees for land, exemption from state pollution control requirements, entry tax exemptions, labor law exemptions and commercial usage of electricity.
Our hedging activities and currency transfer are restricted by regulations in certain countries, including India, Romania and China.
Certain Bermuda Law Considerations
As a Bermuda company, we are also subject to regulation in Bermuda. Among other things, we must comply with the provisions of the Companies Act 1981 regulating the declaration and payment of dividends and the making of distributions from contributed surplus.
We are classified as a non-resident of Bermuda for exchange control purposes by the Bermuda Monetary Authority. Pursuant to our non-resident status, we may engage in transactions in currencies other than Bermuda dollars. There are no restrictions on our ability to transfer funds in and out of Bermuda or to pay dividends to United States residents that are holders of our common shares.
Under Bermuda law, “exempted” companies are companies formed for the purpose of conducting business outside Bermuda from a principal place of business in Bermuda. As an exempted company, we may not, without a license granted by the Minister of Education and Economic Development, participate in certain business transactions, including transactions involving Bermuda landholding rights and the carrying on of business of any kind for which we are not licensed in Bermuda.
14
Table of Contents
Available Information
We file current and periodic reports, proxy statements, and other information with the SEC, copies of which can be obtained from the SEC’s Public Reference Room at 100 F Street, NE., Washington, D.C. 20549. Information on the operation of the Public Reference Room can be obtained by calling the SEC at 1-800-SEC-0330.
The SEC maintains an Internet site that contains reports, proxy and information statements, and other information regarding issuers that file electronically with the SEC, at www.sec.gov. We make available free of charge on our website, www.genpact.com, our Annual Report on Form 10-K, Quarterly Reports on Form 10-Q, Current Reports on Form 8-K and amendments to those reports filed or furnished pursuant to Section 13(a) or 15(d) of the Securities Exchange Act of 1934, as amended, as soon as reasonably practicable after we electronically file such material with, or furnish it to, the SEC. The contents of our website are not incorporated by reference into this Annual Report.
Executive Officers
The following table sets forth information concerning our executive officers as of February 15, 2015:
| Name |
Age | Position(s) | ||||
| N.V. Tyagarajan |
53 | President, Chief Executive Officer and Director | ||||
| Edward Fitzpatrick |
48 | Chief Financial Officer | ||||
| Patrick Cogny |
48 | Senior Vice President, Infrastructure, Manufacturing and Services | ||||
| Victor Guaglianone |
59 | Senior Vice President and General Counsel | ||||
| Piyush Mehta |
46 | Senior Vice President, Human Resources | ||||
| Arvinder Singh |
50 | Senior Vice President, Capital Markets and IT Services | ||||
| Mohit Thukral |
49 | Senior Vice President, Banking, Financial Services and Insurance | ||||
N.V. Tyagarajan has served as our President and Chief Executive Officer since June 2011. From February 2009 to June 2011, he was our Chief Operating Officer. From February 2005 to February 2009, he was our Executive Vice President and Head of Sales, Marketing and Business Development. From October 2002 to January 2005, he was Senior Vice President, Quality and Global Operations, for GE’s Commercial Equipment Finance division. Between 1999 and 2002, he served as our Chief Executive Officer.
Edward Fitzpatrick became our Chief Financial Officer in July 2014. Prior to joining Genpact, he spent 13 years at Motorola Solutions Inc., most recently serving as executive vice president and Chief Financial Officer. Prior to Motorola, he worked at General Instrument Corporation and Price Waterhouse, LLP.
Patrick Cogny has served as our Senior Vice President of Infrastructure, Manufacturing and Services since September 2011. From 2005 to August 2011, he was the Chief Executive Officer of Genpact Europe. Prior to this, he spent 15 years working for GE in the Healthcare business and in the GE Europe corporate headquarters, in France, the United States and Belgium.
Victor Guaglianone has served as our Senior Vice President, General Counsel & Corporate Secretary since January 2007. From 2004 to 2007, he was senior counsel at Holland & Knight LLP. From 2003 to 2004, he served as a commercial arbitrator for the American Arbitration Association. Prior to 2003, he spent 16 years at GE Capital, most recently as Vice President and Associate General Counsel.
Piyush Mehta has served as our Senior Vice President of Human Resources since March 2005. He has worked for us since 2001 as Vice President of Human Resources.
Arvinder Singh has served as our Senior Vice President, Capital Markets and IT Services since October 2013. From August 2011 to October 2013, he was Senior Vice President, Sales and Marketing, Client Relationships and Re-engineering. From August 2008 to July 2011, he was Global Head of Client Relationships
15
Table of Contents
and GE, and from June 2005 to August 2008 he was the Business Leader for Lean Six Sigma, Transitions and Solutions. Prior to joining Genpact in June 2005 he was Senior Vice President, Six Sigma and Chief Quality Officer for GE Vendor Financial Services.
Mohit Thukral has served as our Senior Vice President, Banking, Financial Services and Insurance since 2004. He was also responsible for our healthcare business from July 2011 to December 2014.
Risks Related to our Business
Our results of operations could be adversely affected by economic and political conditions and the effects of these conditions on our clients’ businesses and levels of business activity.
Global macroeconomic conditions affect our clients’ businesses and the markets they serve. Volatile, negative or uncertain economic conditions in our significant markets have undermined and could in the future undermine business confidence in our significant markets or in other markets, which are increasingly interdependent, and cause our clients to reduce or defer their spending on new initiatives, or may result in clients reducing, delaying or eliminating spending under existing contracts with us, which would negatively affect our business. Growth in the markets we serve could be at a slow rate, or could stagnate or contract, in each case, for an extended period of time. Differing economic conditions and patterns of economic growth and contraction in the geographical regions in which we operate and the industries we serve have affected and may in the future affect demand for our services. A material portion of our revenues and profitability is derived from our clients in North America and Europe. Weak demand or a slower-than-expected recovery in these markets could have a material adverse effect on our results of operations. Ongoing economic volatility and uncertainty and changing demand patterns affect our business in a number of other ways, including making it more difficult to accurately forecast client demand and effectively build our revenue and resource plans. Economic volatility and uncertainty is particularly challenging because it may take some time for the effects and changes in demand patterns resulting from these and other factors to manifest themselves in our business and results of operations. Changing demand patterns from economic volatility and uncertainty could have a significant negative impact on our results of operations.
GE accounts for a significant portion of our revenues and any loss of business from, or change in our relationship with, GE could have a material adverse effect on our business, results of operations and financial condition.
We have derived and are likely to continue to derive a significant portion of our revenues from GE. For 2012, 2013 and 2014, GE accounted for 26.1%, 22.6% and 20.4% of our revenues, respectively. In addition, our more mature client relationships, such as GE, typically generate higher margins than our relationships with newer clients. The loss of business from GE could have a material adverse effect on our business, results of operations and financial condition. Our master services agreement, or MSA, with GE commits GE to purchase, on an annual basis through 2016, a stipulated minimum dollar amount of services or pay us certain costs in lieu thereof. The costs that GE would be required to pay if it does not meet a minimum annual commitment are not necessarily equal to the amount by which GE’s purchases fall short of that minimum annual commitment. While our revenues from GE in 2014 significantly exceeded the stipulated minimum annual amount for that year, there is no assurance that actual revenues from GE in future years will meet or exceed the minimum annual commitment or that GE will continue to be a client at all. Revenues in excess of the minimum annual commitment can be credited, subject to certain limitations, against shortfalls in subsequent years. In addition, under the MSA the minimum annual committed amount of $360 million is reduced during the last three years of the term, to $250 million in 2014, $150 million in 2015 and $90 million in 2016. The MSA provides that the minimum annual committed amount is subject to reduction in certain circumstances, including as a result of the termination of any statements of work, or SOWs, by GE for cause, non-performance of services by us due to specified force majeure
16
Table of Contents
events or certain other reasons. The MSA also does not require GE to engage us exclusively in respect of business process services. In addition, pricing terms and pricing levels under future SOWs may be lower than in the past. In particular, because of the size of GE and its importance to our business, it is able to exert considerable leverage on us when negotiating the terms of SOWs.
Our business from GE comes from a variety of GE’s businesses and decisions to use our services are currently, as a general matter, made by a number of people within GE. Therefore, although some decisions may be made centrally at GE, the total level of business we receive generally depends on the decisions of the various operating managers of such businesses. In addition, if GE sells or divests any of the businesses to which we provide services, the new management or new owners of such businesses may choose to discontinue our services. Finally, there can be no assurance that GE will not establish its own business unit to provide English-language business process services from low-wage countries or otherwise compete with us.
Future legislation in the United States and other jurisdictions could significantly affect the ability or willingness of our clients and prospective clients to utilize our services.
The topic of companies outsourcing services to organizations operating in other countries is a source of political discussion in many countries. For example, many organizations and public figures in the United States have publicly expressed concern about a perceived association between offshore service providers and the loss of jobs in the United States. Current or prospective clients may elect to perform such services themselves or may be discouraged from transferring these services from onshore to offshore providers to avoid negative perceptions that may be associated with using an offshore provider. Any slowdown or reversal of existing industry trends toward offshore outsourcing would seriously harm our ability to compete effectively with competitors that provide services from the United States.
In the United States, federal and state measures aimed at limiting or restricting offshore outsourcing have been occasionally proposed and enacted. The measures that have been enacted to date generally have restricted the ability of government entities to outsource work to offshore business process service providers and have not materially adversely affected our business, primarily because we do not currently work for such governmental entities and they are not currently a focus of our sales strategy. Such legislation might, for example, require call centers to disclose their geographic locations, require notice to individuals whose personal information is disclosed to non-U.S. affiliates or subcontractors, require disclosures of companies’ foreign outsourcing practices, or limit eligibility for government contracts or financial incentives for companies that transfer work to foreign work locations. Legislation to expand privacy protections in the United States could discourage offshore outsourcing by, for example, requiring notice and consent as a condition for sharing sensitive personal information with third party service providers. In addition, the current U.S. President has encouraged tax incentives for U.S. businesses to insource functions or return outsourced operations to the U.S. There can be no assurance that pending or future legislation in the United States that would significantly adversely affect our business, results of operations and financial condition will not be enacted. Legislation enacted in certain European jurisdictions and any future legislation in Europe, Japan or any other country in which we have clients restricting the performance of business process services from an offshore location could also have a material adverse effect on our business, results of operations and financial condition. For example, evolving European Union cloud computing standards and regulations and proposed taxes on outsourced data center activities may limit or restrict our operations, or make them more costly. Moreover, legislation enacted in the United Kingdom and by many EU countries, provides that if a company outsources all or part of its business to a service provider or changes its current service provider, the affected employees of the company or of the previous service provider are entitled to become employees of the new service provider, generally on the same terms and conditions as their original employment. In addition, dismissals of employees who were employed by the company or the previous service provider immediately prior to that outsourcing, if the dismissals resulted solely or principally from the outsourcing, are automatically considered unfair dismissals that entitle such employees to compensation. As a result, in order to avoid unfair dismissal claims we may have to offer, and become liable for, voluntary redundancy payments to the employees of our clients in the United Kingdom and other EU countries
17
Table of Contents
who have adopted similar laws who transfer business to us. We believe that this legislation could materially affect our ability to obtain new business from companies in the EU and, after including the cost of the potential compensation paid for unfair dismissal claims or redundancies, to provide outsourced services to our current and future clients in the EU in a cost-effective manner.
Our global operations expose us to numerous and sometimes conflicting legal and regulatory requirements, and violations of these laws and regulations could harm our business.
We are subject to numerous, and sometimes conflicting, legal regimes on matters as diverse as anticorruption, import/export controls, trade restrictions, taxation, immigration, internal and disclosure control obligations, securities regulation, anti-competition, data privacy and protection, wage-and-hour standards, and employment and labor relations. Our clients’ business operations are also subject to numerous regulations, and our clients may require that we perform our services in a manner that will enable them to comply with such regulations.
The global nature of our operations increases the difficulty of compliance. Compliance with diverse legal requirements is costly, time-consuming and requires significant resources. Violations of one or more of these regulations in the conduct of our business could result in significant fines, criminal sanctions against us and/or our employees, prohibitions on doing business, breach of contract damages and harm to our reputation. Due to the varying degrees of development of the legal systems of the countries in which we operate, local laws may not be well developed or provide sufficiently clear guidance and may be insufficient to protect our rights.
In particular, in many parts of the world, including countries in which we operate and/or seek to expand, practices in the local business community might not conform to international business standards and could violate anticorruption laws, or regulations, including the U.S. Foreign Corrupt Practices Act and the UK Bribery Act 2010. Our employees, subcontractors, agents, joint venture partners, the companies we acquire and their employees, subcontractors and agents, and other third parties with which we associate, could take actions that violate policies or procedures designed to promote legal and regulatory compliance or applicable anticorruption laws or regulations. Violations of these laws or regulations by us, our employees or any of these third parties could subject us to criminal or civil enforcement actions (whether or not we participated or knew about the actions leading to the violations), including fines or penalties, disgorgement of profits and suspension or disqualification from work, any of which could materially adversely affect our business, including our results of operations and our reputation.
Tax matters, new legislation and actions by taxing authorities may have an adverse effect on our operations, effective tax rate and financial condition.
We are subject to income taxes in the United States and in numerous foreign jurisdictions. Our tax expense and cash tax liability could be adversely affected by a variety of factors including, but not limited to, changes in tax laws and regulations, changes in accounting principles or interpretations, and potential adverse outcomes of tax examinations and pending tax-related litigation. Changes in the valuation of deferred tax assets and liabilities, which may result from a decline in our profitability or changes in tax rates or legislation, could have a material adverse effect on our tax expense.
Foreign governments in jurisdictions from which we deliver services may assert that certain of our clients have a “permanent establishment” in such foreign jurisdictions by reason of the activities we perform on their behalf, particularly if those clients exercise control over or have substantial dependency on our services. Such an assertion by foreign governments could affect the size and scope of the services requested in the future, which could have a material adverse effect on our business, results of operations and financial condition.
In 2007, the Government of India served us with notice regarding our potential liability, as a representative assessee of GE, for Indian tax with respect to GE’s 2004 transfer of shares of our predecessor company. GE challenged the positions of the Government of India in the Delhi High Court, and named Genpact India (one of our subsidiaries) as a necessary party without seeking relief against Genpact India. In 2011, the Delhi High Court ruled that Genpact India cannot be held to be a representative assessee in this transaction. The tax authorities have filed an appeal with the Supreme Court of India against this ruling, which appeal is currently pending. We believe that if it were determined that Indian tax is due for the 2004 transfer of shares, such tax could not be
18
Table of Contents
successfully asserted against us as a representative assessee and, even if such tax was successfully asserted against us as a representative assessee, we believe that GE would be obligated to indemnify us for such tax.
Indian tax authorities may claim that Indian tax is owed with respect to certain of our transactions, such as our acquisitions (including our subsidiaries organized under Indian law or owning assets located in India), internal reorganizations and the sale of our shares in public offerings or otherwise by our existing significant shareholders, in which indirect transfers of Indian subsidiaries or assets are involved. Indian tax authorities may seek to impose tax on us directly or as a withholding agent or representative assessee of the seller in these or other transactions.
In 2012, the Government of India enacted legislation purporting to clarify the intent of existing tax law (and hence the law applicable in prior periods) to tax “all income accruing or arising, whether directly or indirectly, through or from any business connection in India, or through or from any property in India, or through or from any asset or source of income in India, or through the transfer of a capital asset situate in India.” The legislation, which we refer to as the Indirect Transfer Rule, also provides that an “asset or a capital asset being any share or interest in a company or entity registered or incorporated outside India shall be deemed to be situated in India, if the share or interest derives, directly or indirectly, its value substantially from the assets located in India.” “Substantially” has not been defined for purposes of the Indirect Transfer Rule. Public commentary on the legislation, including statements by various officials of the Government of India, has suggested that the legislation was intended to allow for the taxation of indirect transfer of shares in an Indian company, possibly with retrospective effect. The full implications and scope of this legislation, and how its provisions will be interpreted and applied remain unclear, but arguably could apply to certain transactions in which we are involved as noted above. Because there are significant uncertainties relating to the application of the Indirect Transfer Rule to transactions in shares of non-Indian companies that have significant assets and operations in India, it is not clear whether, or to what extent, a buyer of any shares issued by us could be held liable for failure to withhold Indian tax on the purchase of such shares or be subject to Indian tax on gains realized on the disposition of such shares.
In addition, the Government of India issued an assessment order to us in 2014 seeking to assess tax on certain transactions that occurred in 2009 and 2010. We do not believe that the transactions should be subject to tax in India, primarily due to the relief provided under the Mauritius-India Treaty, and have accordingly filed an appeal. In May 2014, we received a demand for a potential tax claim resulting from this assessment for approximately $43 million, including interest. To date, we have paid $15 million to the Indian tax authority under protest, and may be required to pay the remainder of the demand pending resolution of the matter. There is no assurance that we will prevail in this matter or similar transactions where we have relied on the Mauritius-India Treaty, and a final determination of tax in the amounts claimed could have a material adverse effect on our results of operations, effective tax rate and financial condition.
Further, the Governments of India, the United States or other jurisdictions could enact new tax legislation, including anti-avoidance provisions, which could have a material adverse effect on our business, results of operations and financial condition. In 2012, the Indian government enacted anti-avoidance provisions, which are proposed to take effect on April 1, 2015. The full implications and scope of the new anti-avoidance provisions, if implemented, as well as how these changes may apply to us, are presently unclear. In addition, in 2013, the Indian government enacted changes to taxation on distributions from Indian companies. Our ability to repatriate surplus earnings from our subsidiaries in a tax-efficient manner is dependent upon interpretations of local laws and may vary with changes in such laws and the renegotiation of existing double tax treaties. Such changes may affect our overall effective tax rate, and increase the cost of our services, any of which could have a material adverse effect on our business, results of operations and financial condition.
Over the past few years certain tax benefits provided to companies in our industry have expired and it is not clear whether new tax policies will provide equivalent benefits and incentives.
In the absence of tax holidays or concessional rates, income derived from our Indian operations may be taxed up to the maximum tax rate generally applicable to Indian enterprises, which, as of December 31, 2014, was 34.0%.
19
Table of Contents
During the last eight years, we established new centers that we believe are eligible for tax benefits under the Special Economic Zones Act, 2005. The SEZ legislation introduced a 15-year tax holiday scheme for operations established in designated “special economic zones” or SEZs. Under the SEZ legislation, qualifying operations are eligible for a deduction from taxable income equal to (i) 100% of their profits or gains derived from the export of services for a period of five years from the commencement of operations; (ii) 50% of such profits or gains for the next five years; and (iii) 50% of such profits or gains for an additional period of five years, subject to satisfying certain capital investment requirements. The SEZ legislation provides, among other restrictions, that this holiday is not available to operations formed by splitting up or reconstructing existing operations or transferring existing plant and equipment (beyond a prescribed limit) to new SEZ locations.
The percentage of our operations or income in India that is eligible for SEZ benefits is variable, and depends, among other factors, upon how much of our business can be conducted at the qualifying locations and how much of that business can be considered to meet the restrictive conditions described above.
As the SEZ legislation benefits phase out, our Indian tax expense may materially increase and our after-tax profitability may be materially reduced, unless we can obtain comparable benefits under new legislation or otherwise reduce our tax liability. Similarly, alternative minimum taxes are imposed by certain jurisdictions on otherwise exempt income, which may increase our tax expense in future years.
Our delivery centers in certain other jurisdictions, such as Colombia, the Philippines and Guatemala, also enjoy corporate tax holidays or concessional tax rates. These tax concessions will expire over the next few years, possibly increasing our overall tax rate.
As a result of the foregoing, our overall tax rate may increase over the next few years and such increase may be material and may have a material adverse effect on our business, results of operations and financial condition.
If the transfer pricing arrangements we have among our subsidiaries are determined to be inappropriate, our tax liability may increase.
We have transfer pricing arrangements among our subsidiaries in relation to various aspects of our business, including operations, marketing, sales and delivery functions. U.S. and Indian transfer pricing regulations, as well as regulations applicable in other countries in which we operate, require that any international transaction involving associated enterprises be on arm’s-length terms. We consider the transactions among our subsidiaries to be substantially on arm’s-length terms. If, however, a tax authority in any jurisdiction reviews any of our tax returns and determines that the transfer prices and terms we have applied are not appropriate, or that other income of our affiliates should be taxed in that jurisdiction, we may incur increased tax liability, including accrued interest and penalties, which would cause our tax expense to increase, possibly materially, thereby reducing our profitability and cash flows.
We derive a significant portion of our revenues from clients in the United States. If events or conditions occur which adversely affect our ability to do business in the United States, our business, results of operations and financial condition may be materially and adversely affected.
We currently derive, and are likely to continue to derive, a significant portion of our revenues from clients located in the United States. A number of factors could adversely affect our ability to do business in the United States, which could in turn have a material adverse effect on our business, results of operations and financial condition. The United States economy is still in a period of economic uncertainty. Any deterioration in economic activity in the United States could adversely affect demand for our services, thus reducing our revenue. We could also be affected by decline in the value of the U.S. dollar against the Indian rupee, in which we incur the majority of our costs, or other currencies in which we incur costs. We may also be adversely affected by the enactment of laws in the United States that impose restrictions on, or taxation or other financial penalties with respect to, offshore outsourcing.
20
Table of Contents
We may face difficulties in providing end-to-end business solutions or delivering complex and large projects for our clients that could cause clients to discontinue their work with us, which in turn could harm our business.
We continue to expand the nature and scope of our engagements. Our ability to effectively offer a wide breadth of end-to-end business solutions depends on our ability to attract existing or new clients to new service offerings, and the market for end-to-end solutions is highly competitive. We cannot be certain that our new service offerings will effectively meet client needs or that we will be able to attract existing and new clients to these service offerings. The increased breadth of our service offerings may result in larger and more complex projects with our clients. This will require us to establish closer relationships with our clients and a thorough understanding of their operations. Our ability to establish such relationships will depend on a number of factors, including the proficiency of our employees and management. Our failure to deliver services that meet the requirements specified by our clients could result in termination of client contracts, and we could be liable to our clients for significant penalties or damages. Larger projects may involve multiple engagements or stages, and there is a risk that a client may choose not to retain us for additional stages or may cancel or delay additional planned engagements. These terminations, cancellations or delays may result from factors that have little or nothing to do with the quality of our services, such as the business or financial condition of our clients or the economy generally. Such cancellations or delays make it difficult to plan for project resource requirements and inaccuracies in such resource planning and allocation may have a negative impact on our profitability.
We may fail to attract and retain enough qualified employees to support our operations.
Our industry relies on large numbers of skilled employees and our success depends on our ability to attract, train and retain a sufficient number of qualified employees. Historically, high employee attrition has been common in our industry. See Item 1—“Business—Our People.” In 2014, our attrition rate for all employees who were employed for a day or more was approximately 25%. We cannot assure you that we will be able to reduce our level of attrition or even maintain our attrition rate at the 2014 level. If our attrition rate increases, our operating efficiency and productivity may decrease.
Competition for qualified employees, particularly in India and China, remains high and we expect such competition to continue. We compete for employees not only with other companies in our industry but also with companies in other industries, such as software services, engineering services and financial services companies. In many locations in which we operate, there is a limited pool of employees who have the skills and training needed to do our work. If our business continues to grow, the number of people we will need to hire will increase. We will also need to increase our hiring if we are not able to maintain our attrition rate through innovative recruiting and retention policies. Significant competition for employees could have an adverse effect on our ability to expand our business and service our clients, as well as cause us to incur greater personnel expenses and training costs.
Wage increases in the countries in which we have operations may prevent us from sustaining our competitive advantage and may reduce our profit margin.
Salaries and related benefits of our employees are our most significant costs. Most of our employees are based in India and other countries in which wage levels have historically been significantly lower than wage levels in the United States and Western Europe for comparably skilled professionals, which has been one of our competitive advantages. However, wage levels for comparably skilled employees in most of the countries in which we operate have increased and further increases are expected at a faster rate than in the United States and Western Europe because of, among other reasons, faster economic growth, increased competition for skilled employees and increased demand for business process services. We will lose this competitive advantage to the extent that we are not able to control or share wage increases with our clients. Sharing wage increases may cause our clients to be less willing to utilize our services. In addition, wage increases may reduce our margins. We will attempt to control such costs by our efforts to add capacity in locations where we consider wage levels of skilled personnel to be satisfactory, but we may not be successful in doing so. We may need to increase our wage levels
21
Table of Contents
significantly and rapidly in order to attract the quantity and quality of employees that are necessary for us to remain competitive, which may have a material adverse effect on our business, results of operations and financial condition. We have also increased, and expect to further increase, the number of employees we have in the United States from the levels than we have had historically, and this could have a negative effect on our profit margin.
Currency exchange rate fluctuations in various currencies in which we do business, especially the Indian rupee and the U.S. dollar, could have a material adverse effect on our business, results of operations and financial condition.
Most of our revenues are denominated in U.S. dollars, with the remaining amounts largely in euros, pounds sterling, the Australian dollar, the Japanese yen and the Indian rupee. Most of our expenses are incurred and paid in Indian rupees, with the remaining amounts largely in U.S. dollars, Chinese renminbi, Romanian lei, euros, pounds sterling, Philippine pesos, Japanese yen, Polish zloty, Mexican pesos, Guatemalan quetzals, the South African rand and Hungarian forints. As we expand our operations to new countries, we will incur expenses in other currencies. We report our financial results in U.S. dollars. The exchange rates between the Indian rupee and other currencies in which we incur costs or receive revenues, on the one hand, and the U.S. dollar, on the other hand, have changed substantially in recent years and may fluctuate substantially in the future. See Item 7A—“Quantitative and Qualitative Disclosures about Market Risk.”
Our results of operations could be adversely affected over time by certain movements in exchange rates, particularly if the Indian rupee or other currencies in which we incur expenses appreciate against the U.S. dollar or if the currencies in which we receive revenues, such as the Euro, depreciate against the U.S. dollar. Although we take steps to hedge a substantial portion of our Indian rupee-U.S. dollar, Mexican peso-U.S. dollar, Philippines peso-U.S. dollar, euro-U.S. dollar, euro- Romanian leu, euro-Hungarian forint, pound sterling-U.S. dollar, Australian dollar-U.S. dollar and our Chinese renminbi-Japanese yen foreign currency exposures, there is no assurance that our hedging strategy will be successful or that the hedging markets will have sufficient liquidity or depth for us to implement our strategy in a cost effective manner. In addition, in some countries such as India and China, we are subject to legal restrictions on hedging activities, as well as convertibility of currencies, which could limit our ability to use cash generated in one country in another country and could limit our ability to hedge our exposures. Finally, our hedging policies only provide near term protection from exchange rate fluctuations. If the Indian rupee or other currencies in which we incur expenses appreciate against the U.S. dollar, we may have to consider additional means of maintaining profitability, including by increasing pricing, which may or may not be achievable. See also Item 7—“Management’s Discussion and Analysis of Financial Condition and Results of Operations—Overview—Foreign exchange (gains) losses, net.”
Restrictions on entry visas may affect our ability to compete for and provide services to clients, which could have a material adverse effect on our business and financial results.
Our business depends on the ability of our employees to obtain the necessary visas and entry permits to do business in the countries where our clients and, in some cases, our delivery centers, are located. In recent years, in response to terrorist attacks and global unrest, immigration authorities generally, and those in the United States in particular, have increased the level of scrutiny in granting visas. If further terrorist attacks occur or global unrest intensifies, then obtaining visas for our personnel may become even more difficult. Local immigration laws may also require us to meet certain other legal requirements as a condition to obtaining or maintaining entry visas. Adverse economic conditions in countries where our clients may be located may create an environment where countries, including the United States, may restrict the number of visas or entry permits available. In addition, immigration laws are subject to legislative change and varying standards of application and enforcement due to political forces, economic conditions or other events, including terrorist attacks. If we are unable to obtain the necessary visas for our personnel who need to travel internationally, if the issuance of such visas is delayed or if the length of such visas is shortened, we may not be able to provide services to our clients or to continue to provide services on a timely and cost-effective basis, receive revenues as early as expected or
22
Table of Contents
manage our delivery centers as efficiently as we otherwise could, any of which could have a material adverse effect on our business, results of operations and financial condition.
The information technology industry is subject to rapid technological change and we may not be successful in addressing these changes.
The information technology industry is characterized by rapid technological change, evolving industry standards, changing client preferences and new product introductions. The success of our information technology business depends, in part, upon our ability to develop solutions that keep pace with changes in the industry. We may not be successful in addressing these changes on a timely basis or successfully marketing any changes that we implement. In addition, products or technologies developed by others may render our services uncompetitive or obsolete. Failure to address these developments could have a material adverse effect on our business, results of operations and financial condition.
Our senior leadership team is critical to our continued success and the loss of such personnel could harm our business.
Our future success substantially depends on the continued service and performance of the members of our senior leadership team. These personnel possess business and technical capabilities that are difficult to replace. In particular, our Chief Executive Officer and other members of our senior leadership team have been involved in our business since its commencement under GE. Our employment agreement with our Chief Executive Officer does not obligate him to work for us for any specified period. If we lose key members of our senior leadership team, we may not be able to effectively manage our current operations or meet ongoing and future business challenges, and this may have a material adverse effect on our business, results of operations and financial condition.
We may be unable to service our debt or obtain additional financing on competitive terms.
Our credit agreement contains covenants which require maintenance of certain financial ratios and also, under certain conditions, restrict our ability to pay dividends, repurchase common shares and make other restricted payments as defined in the credit agreement. Our credit agreement also provides that a substantial majority of the outstanding principal of the $675 million term loan facility is to be paid in a single payment at the end of the seven-year term. Our cash flow from operations provides the primary source of funds for our debt service payments. If our cash flow from operations declines, we may be unable to service or refinance our current debt which could adversely affect our business and financial condition.
In addition, we have limited ability to increase our borrowings under our existing credit agreement without increased pricing. We may in the future require additional financing to fund one or more acquisitions and may not be able to obtain such additional financing on competitive terms, which could restrict our ability to complete such transactions.
We often face a long selling cycle to secure a new contract as well as long implementation periods that require significant resource commitments, which result in a long lead time before we receive revenues from new relationships.
We often face a long selling cycle to secure a new contract. If we are successful in obtaining an engagement, that is generally followed by a long implementation period in which the services are planned in detail and we demonstrate to a client that we can successfully integrate our processes and resources with their operations. During this time a contract is also negotiated and agreed. There is then a long ramping up period in order to commence providing the services. We typically incur significant business development expenses during the selling cycle. We may not succeed in winning a new client’s business, in which case we receive no revenues and
23
Table of Contents
may receive no reimbursement for such expenses. Even if we succeed in developing a relationship with a potential new client and begin to plan the services in detail, a potential client may choose a competitor or decide to retain the work in-house prior to the time a final contract is signed. If we enter into a contract with a client, we will typically receive no revenues until implementation actually begins. Our clients may also experience delays in obtaining internal approvals or delays associated with technology or system implementations, thereby further lengthening the implementation cycle. We generally hire new employees to provide services to a new client once a contract is signed. We may face significant difficulties in hiring such employees and incur significant costs associated with these hires before we receive corresponding revenues. If we are not successful in obtaining contractual commitments after the selling cycle, in maintaining contractual commitments after the implementation cycle or in maintaining or reducing the duration of unprofitable initial periods in our contracts, it may have a material adverse effect on our business, results of operations and financial condition.
Our profitability will suffer if we are not able to price appropriately, maintain asset utilization levels and control our costs.
Our profitability is largely a function of the efficiency with which we utilize our assets, and in particular our people and delivery centers, and the pricing that we are able to obtain for our services. Our utilization rates are affected by a number of factors, including our ability to transition employees from completed projects to new assignments, hire and assimilate new employees, forecast demand for our services and thereby maintain an appropriate headcount in each of our geographies and workforce and manage attrition, and our need to devote time and resources to training, professional development and other typically non-chargeable activities. The prices we are able to charge for our services are affected by a number of factors, including our clients’ perceptions of our ability to add value through our services, competition, introduction of new services or products by us or our competitors, our ability to accurately estimate, attain and sustain revenues from client engagements, margins and cash flows over increasingly longer contract periods and general economic and political conditions. Therefore, if we are unable to price appropriately or manage our asset utilization levels, there could be a material adverse effect on our business, results of operations and financial condition. Our profitability is also a function of our ability to control our costs and improve our efficiency. As we increase the number of our employees and grow our business, we may not be able to manage the significantly larger and more geographically diverse workforce that may result and our profitability may not improve. New taxes may also be imposed on our services such as sales taxes or service taxes which could affect our competitiveness as well as our profitability.
Our results of operations and share price could be adversely affected if we are unable to maintain effective internal controls.
The accuracy of our financial reporting is dependent on the effectiveness of our internal controls. We are required to provide a report from management to our shareholders on our internal control over financial reporting that includes an assessment of the effectiveness of these controls. Internal control over financial reporting has inherent limitations, including human error, the possibility that controls could be circumvented or become inadequate because of changed conditions, and fraud. Because of these inherent limitations, internal control over financial reporting might not prevent or detect all misstatements or fraud. If we cannot maintain and execute adequate internal control over financial reporting or implement required new or improved controls that provide reasonable assurance of the reliability of the financial reporting and preparation of our financial statements for external use, we could suffer harm to our reputation, fail to meet our public reporting requirements on a timely basis, be unable to properly report on our business and our results of operations, or be required to restate our financial statements, and our results of operations, the market price of our common shares and our ability to obtain new business could be materially adversely affected.
We make estimates and assumptions in connection with the preparation of our consolidated financial statements, and any changes to those estimates and assumptions could adversely affect our financial results.
Our financial statements have been prepared in accordance with U.S. generally accepted accounting principles. The application of generally accepted accounting principles requires us to make estimates and
24
Table of Contents
assumptions about certain items and future events that affect our reported financial condition, and our accompanying disclosure with respect to, among other things, revenue recognition and income taxes. We base our estimates on historical experience, contractual commitments and on various other assumptions that we believe to be reasonable under the circumstances and at the time they are made. These estimates and assumptions involve the use of judgment and are subject to significant uncertainties, some of which are beyond our control. If our estimates, or the assumptions underlying such estimates, are not correct, actual results may differ materially from our estimates, and we may need to, among other things, adjust revenues or accrue additional charges that could adversely affect our results of operations.
Our operating results may experience significant fluctuations.
Our operating results may fluctuate significantly from period to period. The long selling cycle for many of our services as well as the time required to complete the implementation phases of new contracts makes it difficult to accurately predict the timing of revenues from new clients or new SOWs as well as our costs. In addition, our future revenues, operating margins and profitability may fluctuate as a result of: lower demand for our services; lower win rates versus our competition; changes in pricing in response to client demands and competitive pressures; changes to the financial condition of our clients; employee wage levels and utilization rates; changes in foreign exchange rates, including the Indian rupee versus the U.S. dollar and the euro versus the U.S. dollar; the timing of collection of accounts receivable; enactment of new taxes; changes in domestic and international income tax rates and regulations; and changes to levels and types of share-based compensation awards and assumptions used to determine the fair value of such awards. As a result of these factors, it is possible that in some future periods, our revenues and operating results may be significantly below the expectations of public market analysts and investors. In such an event, the price of our common shares would likely be materially and adversely affected.
We enter into long-term contracts and fixed price contracts with our clients. Our failure to price these contracts correctly may negatively affect our profitability.
The pricing of our services is usually included in SOWs entered into with our clients, many of which are for terms of two to five years. In certain cases, we have committed to pricing over this period with only limited sharing of risk regarding inflation and currency exchange rates. In addition, we are obligated under some of our contracts to deliver productivity benefits to our clients. If we fail to estimate accurately future wage inflation rates, currency exchange rates or our costs, or if we fail to accurately estimate the productivity benefits we can achieve under a contract, it could have a material adverse effect on our business, results of operations and financial condition.
A portion of our SOWs are currently billed on a fixed price basis rather than on a time and materials basis. We may increase the number of fixed price contracts we perform in the future. Any failure to accurately estimate the resources or time required to complete a fixed price engagement or to maintain the required quality levels or any unexpected increase in the cost to us of employees, office space or technology could expose us to risks associated with cost overruns and could have a material adverse effect on our business, results of operations and financial conditions.
We could be liable to our clients or others for damages and subject to criminal liability and our reputation could be damaged if our information systems are breached or client data is compromised.
The threat of incursion into our information systems and technology infrastructure has increased in recent years with the increasing number and sophistication of third parties who have hacked, attacked or otherwise invaded information systems of other companies and have misappropriated or disclosed data. We may be liable to our clients or others for damages caused by disclosure of confidential information or system failures. We are often required to collect and store sensitive or confidential client data to perform the services we provide under our contracts. Many of our contracts do not limit our potential liability for breaches of confidentiality. If any person, including any of our current or former employees, penetrates our network security or misappropriates sensitive data or if we do not adapt to changes in data protection legislation, we could be subject to significant
25
Table of Contents
liabilities to our clients or to our clients’ customers for breaching contractual confidentiality provisions or privacy laws. Unauthorized disclosure of sensitive or confidential client data, whether through breach of our computer systems, systems failure or otherwise, could also damage our reputation and cause us to lose existing and potential clients. We may also be subject to civil actions and criminal prosecution by government or government agencies for breaches relating to such data. Our insurance coverage for breaches or mismanagement of such data may not continue to be available on reasonable terms or in sufficient amounts to cover one or more large claims against us and our insurers may disclaim coverage as to any future claims.
We may be subject to claims for substantial damages by our clients arising out of disruptions to their businesses or inadequate service, and our insurance coverage may be inadequate.
Most of our service contracts with clients contain service level and performance requirements, including requirements relating to the quality of our services. Failure to consistently meet service requirements of a client or errors made by our employees in the course of delivering services to our clients could disrupt the client’s business and result in a reduction in revenues or a claim for damages against us. Additionally, we could incur liability if a process we manage for a client were to result in internal control failures or impair our client’s ability to comply with its own internal control requirements.
Under our MSAs with our clients, our liability for breach of our obligations is generally limited to actual damages suffered by the client and is typically capped at the greater of an agreed amount or the fees paid or payable to us under the relevant agreement. These limitations and caps on liability may be unenforceable or otherwise may not protect us from liability for damages. In addition, certain liabilities, such as claims of third parties for which we may be required to indemnify our clients or liability for breaches of confidentiality, are generally not limited under those agreements. Our MSAs are governed by laws of multiple jurisdictions, therefore the interpretation of such provisions, and the availability of defenses to us, may vary, which may contribute to the uncertainty as to the scope of our potential liability. Although we have commercial general liability insurance coverage, the coverage may not continue to be available on acceptable terms or in sufficient amounts to cover one or more large claims and our insurers may disclaim coverage as to any future claims. The successful assertion of one or more large claims against us that exceed available insurance coverage, or changes in our insurance policies (including premium increases or the imposition of large deductible or co-insurance requirements), could have a material adverse effect on our business, results of operations and financial condition.
If we are unable to collect our receivables or unbilled services, our results of operations, financial condition and cash flows could be adversely affected.
Our business depends on our ability to successfully obtain payment from our clients of the amounts they owe us for work performed. We evaluate the financial condition of our clients and usually bill and collect on relatively short cycles. We have established allowances for losses of receivables and unbilled services. Actual losses on client balances could differ from those that we currently anticipate, and, as a result, we might need to adjust our allowances. We might not accurately assess the creditworthiness of our clients. Macroeconomic conditions could also result in financial difficulties for our clients, including bankruptcy and insolvency. This could cause clients to delay payments to us, request modifications to their payment arrangements that could increase our receivables balance, or default on their payment obligations to us. If we experience an increase in the time to bill and collect for our services, our cash flows could be adversely affected.
Some of our contracts contain provisions which, if triggered, could result in lower future revenues and have a material adverse effect on our business, results of operation and financial condition.
Some of our contracts allow a client, in certain limited circumstances, to request a benchmark study comparing our pricing and performance with that of an agreed list of other service providers for comparable services. Based on the results of the study and depending on the reasons for any unfavorable variance, we may be required to make improvements in the services we provide or to reduce the pricing for services on a prospective basis to be performed under the remaining term of the contract, which could have an adverse effect on our business, results of operations and financial condition.
26
Table of Contents
Some of our contracts, including our contract with GE, contain provisions that would require us to pay penalties to our clients and/or provide our clients with the right to terminate the contract if we do not meet pre-agreed service level requirements. Failure to meet these requirements could result in the payment of significant penalties by us to our clients which in turn could have a material adverse effect on our business, results of operations and financial condition.
A few of our MSAs provide that during the term of the MSA and under specified circumstances, we may not provide similar services to the competitors of our client. Some of our contracts also provide that, during the term of the contract and for a certain period thereafter ranging from six to 12 months, we may not provide similar services to certain or any of our client’s competitors using the same personnel. These restrictions may hamper our ability to compete for and provide services to other clients in the same industry, which may inhibit growth and result in lower future revenues and profitability.
Some of our contracts with clients specify that if a change of control of our company occurs during the term of the contract, the client has the right to terminate the contract. These provisions may result in our contracts being terminated if there is such a change in control, resulting in a potential loss of revenues. In addition, these provisions may act as a deterrent to any attempt by a third party to acquire our company.
Some of our contracts with clients require that we bear the cost of any sales or withholding taxes or unreimbursed value-added taxes imposed on payments made under those contracts. While the imposition of these taxes is generally minimized under our contracts, changes in law or the interpretation thereof and changes in our internal structure may result in the imposition of these taxes and a reduction in our net revenues.
Our industry is highly competitive, and we may not be able to compete effectively.
Our industry is highly competitive, highly fragmented and subject to rapid change. We believe that the principal competitive factors in our markets are breadth and depth of process, technology and domain expertise, service quality, the ability to attract, train and retain qualified people, compliance rigor, global delivery capabilities, price and marketing and sales capabilities. We compete for business with a variety of companies, including large multinational firms that provide consulting, technology and/or business process services, off-shore business process service providers in low-cost locations like India, in-house captives of potential clients, software services companies that also provide business process services and accounting firms that also provide consulting or outsourcing services.
Some of our competitors have greater financial, marketing, technological or other resources and larger client bases than we do, and may expand their service offerings and compete more effectively for clients and employees than we do. Some of our competitors have more established reputations and client relationships in our markets than we do. In addition, some of our competitors who do not have global delivery capabilities may expand their delivery centers to the countries in which we are located which could result in increased competition for employees and could reduce our competitive advantage. There could also be new competitors that are more powerful as a result of strategic consolidation of smaller competitors or of companies that each provide different services or service different industries.
We expect competition to intensify in the future as more companies enter our markets. Increased competition may result in lower prices and volumes, higher costs for resources, especially people, and lower profitability. We may not be able to supply clients with services that they deem superior and at competitive prices and we may lose business to our competitors. Any inability to compete effectively would adversely affect our business, results of operations and financial condition.
Our business could be materially and adversely affected if we do not protect our intellectual property or if our services are found to infringe on the intellectual property of others.
Our success depends in part on certain methodologies, practices, tools and technical expertise we utilize in designing, developing, implementing and maintaining applications and other proprietary intellectual property rights. In order to protect our rights in these various intellectual properties, we rely upon a combination of
27
Table of Contents
nondisclosure and other contractual arrangements as well as trade secret, copyright and trademark laws. We also generally enter into confidentiality agreements with our employees, consultants, clients and potential clients and limit access to and distribution of our proprietary information. India is a member of the Berne Convention, an international intellectual property treaty, and has agreed to recognize protections on intellectual property rights conferred under the laws of other foreign countries, including the laws of the United States. There can be no assurance that the laws, rules, regulations and treaties in effect in the United States, India and the other jurisdictions in which we operate and the contractual and other protective measures we take, are adequate to protect us from misappropriation or unauthorized use of our intellectual property, or that such laws will not change. We may not be able to detect unauthorized use and take appropriate steps to enforce our rights, and any such steps may not be successful. Infringement by others of our intellectual property, including the costs of enforcing our intellectual property rights, may have a material adverse effect on our business, results of operations and financial condition.
Although we believe that we are not infringing on the intellectual property rights of others, claims may nonetheless be successfully asserted against us in the future. The costs of defending any such claims could be significant, and any successful claim may require us to modify, discontinue or rename any of our services. Any such changes may have a material adverse effect on our business, results of operations and financial condition.
A substantial portion of our assets and operations are located in India and we are subject to regulatory, economic, social and political uncertainties in India.
We are subject to several risks associated with having a substantial portion of our assets and operations located in India.
We have benefited from many policies of the Government of India and the Indian state governments in the states in which we operate which are designed to promote foreign investment generally and the business process services industry in particular, including significant tax incentives, relaxation of regulatory restrictions, liberalized import and export duties and preferential rules on foreign investment and repatriation. There is no assurance that such policies will continue. Various factors, such as changes in the current central government, could trigger significant changes in India’s economic liberalization and deregulation policies and disrupt business and economic conditions in India generally and our business in particular.
In addition, our financial performance and the market price of our common shares may be adversely affected by general economic conditions and economic and fiscal policy in India, including changes in exchange rates and controls, interest rates and taxation policies, as well as social stability and political, economic or diplomatic developments affecting India in the future. In particular, India has experienced significant economic growth over the last several years, but faces major challenges in sustaining that growth in the years ahead. These challenges include the need for substantial infrastructure development and improving access to healthcare and education. Our ability to recruit, train and retain qualified employees, develop and operate our delivery centers, and attract and retain clients could be adversely affected if India does not successfully meet these challenges.
Our delivery centers are at risk of damage from natural disasters and other disruptions.
Our delivery centers and our data and voice communications may be damaged or disrupted as a result of natural disasters such as earthquakes, floods, heavy rains, epidemics, tsunamis and cyclones, technical disruptions such as electricity or infrastructure breakdowns, including damage to telecommunications cables, computer glitches and electronic viruses or man-made events such as protests, riots and labor unrest. Such events may lead to the disruption of information systems and telecommunication services for sustained periods. They also may make it difficult or impossible for employees to reach our business locations. Damage or destruction that interrupts our provision of services could adversely affect our reputation, our relationships with our clients, our leadership team’s ability to administer and supervise our business or it may cause us to incur substantial additional expenditure to repair or replace damaged equipment or delivery centers. We may also be liable to our
28
Table of Contents
clients for disruption in service resulting from such damage or destruction. While we currently have commercial liability insurance, our insurance coverage may not be sufficient. Furthermore, we may be unable to secure such insurance coverage at premiums acceptable to us in the future or at all. Prolonged disruption of our services would also entitle our clients to terminate their contracts with us. Any of the above factors may adversely affect our business, results of operations and financial condition.
We may face difficulties as we expand our operations into countries in which we have no prior operating experience.
We intend to continue to expand our global footprint in order to maintain an appropriate cost structure and meet our clients’ delivery needs. This may involve expanding into countries other than those in which we currently operate. It may involve expanding into less developed countries, which may have less political, social or economic stability and less developed infrastructure and legal systems. As we expand our business into new countries we may encounter regulatory, personnel, technological and other difficulties that increase our expenses or delay our ability to start up our operations or become profitable in such countries. This may affect our relationships with our clients and could have an adverse effect on our business, results of operations and financial condition.
Terrorist attacks and other acts of violence involving any of the countries in which we or our clients have operations could adversely affect our operations and client confidence.
Terrorist attacks and other acts of violence or war may adversely affect worldwide financial markets and could potentially lead to economic recession, which could adversely affect our business, results of operations, financial condition and cash flows. These events could adversely affect our clients’ levels of business activity and precipitate sudden significant changes in regional and global economic conditions and cycles. These events also pose significant risks to our people and to our delivery centers and operations around the world.
Southern Asia has, from time to time, experienced instances of civil unrest and hostilities among neighboring countries, including India and Pakistan. In recent years, military confrontations between India and Pakistan have occurred in the region of Kashmir and along the India/Pakistan border. There have also been incidents in and near India such as terrorist attacks on the Indian Parliament and in the city of Mumbai, troop mobilizations along the India/Pakistan border and an aggravated geopolitical situation in the region. Such military activity or terrorist attacks in the future could influence the Indian economy by disrupting communications and making travel more difficult. Resulting political tensions could create a greater perception that investments in companies with Indian operations involve a high degree of risk, and that there is a risk of disruption of services provided by companies with Indian operations, which could have a material adverse effect on our share price and/or the market for our services. Furthermore, if India were to become engaged in armed hostilities, particularly hostilities that were protracted or involved the threat or use of nuclear weapons, we might not be able to continue our operations. We generally do not have insurance for losses and interruptions caused by terrorist attacks, military conflicts and wars.
If more stringent labor laws become applicable to us or if our employees unionize, our profitability may be adversely affected.
India has stringent labor legislation that protects employee interests, including legislation that sets forth detailed procedures for dispute resolution and employee removal and legislation that imposes financial obligations on employers upon retrenchment. Though we are exempt from some of these labor laws at present under exceptions in some states for providers of IT-enabled services, there can be no assurance that such laws will not become applicable to us in the future. If these labor laws become applicable to our employees, it may become difficult for us to maintain flexible human resource policies and attract and employ the numbers of sufficiently qualified candidates that we need or discharge employees, and our compensation expenses may increase significantly.
29
Table of Contents
In addition, our employees may in the future form unions. If employees at any of our delivery centers become eligible for union membership, we may be required to raise wage levels or grant other benefits that could result in an increase in our compensation expenses, in which case our profitability may be adversely affected.
We may engage in strategic transactions that could create risks.
As part of our business strategy, we regularly review potential strategic transactions, including potential acquisitions, dispositions, consolidations, joint ventures or similar transactions, some of which may be material. Through the acquisitions we pursue, we may seek opportunities to add to or enhance the services we provide, to enter new industries or expand our client base, or to strengthen our global presence and scale of operations. We have completed more than ten acquisitions since our inception. There can be no assurance that we will find suitable candidates in the future for strategic transactions at acceptable prices, have sufficient capital resources to accomplish our strategy, or be successful in entering into agreements for desired transactions.
Acquisitions, including completed acquisitions, also pose the risk that any business we acquire may lose clients or employees or could under-perform relative to expectations. We could also experience financial or other setbacks if transactions encounter unanticipated problems, including problems related to execution or integration. Following the completion of an acquisition, we may have to rely on the seller to provide administrative and other support, including financial reporting and internal controls, to the acquired business for a period of time. There can be no assurance that the seller will do so in a manner that is acceptable to us.
Our principal shareholders exercise significant influence over us, and their interests in our business may be different from yours.
A significant percentage of our issued and outstanding common shares are currently beneficially owned by affiliates of Bain Capital. As of December 31, 2014, Bain Capital (through its affiliates) beneficially owned approximately 26% of our outstanding common shares.
Our shareholder agreement with Bain Capital and its co-investors provides that Bain Capital has the right to nominate four directors to our board, so long as it maintains certain minimum shareholding thresholds, and the shareholders party to the agreement have agreed to vote their shares for the election of such persons. These shareholders can exercise significant influence over our business policies and affairs and all matters requiring a shareholders’ vote, including the composition of our board of directors, the adoption of amendments to our certificate of incorporation and bye-laws, the approval of mergers or sales of substantially all of our assets, our dividend policy and our capital structure and financing. This concentration of ownership also may delay, defer or even prevent a change in control of our company and may make some transactions more difficult or impossible without the support of these shareholders, even if such transactions are beneficial to other shareholders. The interests of these shareholders may conflict with your interests. Bain Capital currently holds interests in companies that compete with us and it may, from to time, make significant investments in companies that could compete with us. In addition, pursuant to our shareholder agreement and to the extent permitted by applicable law, our directors who are affiliated with Bain Capital are not required to present to us corporate opportunities (e.g., acquisitions or new potential clients) of which they become aware. So long as Bain Capital owns a significant amount of our equity it will be able to strongly influence our decisions.
We may become subject to taxation as a result of our incorporation in Bermuda or place of management, which would have a material adverse effect on our business, results of operations and financial condition.
We have received a written assurance from the Bermuda Minister of Finance under The Exempted Undertaking Tax Protection Act 1966 of Bermuda to the effect that if there is enacted in Bermuda any legislation imposing tax computed on profits or income, or computed on any capital asset, gain or appreciation, or any tax in the nature of estate duty or inheritance tax, then the imposition of any such tax shall not be applicable to us or to any of our operations or common shares, debentures or other obligations or securities until March 31, 2035, except insofar as such tax applies to persons ordinarily resident in Bermuda or is payable by us in respect of real
30
Table of Contents
property owned or leased by us in Bermuda. We cannot assure you that after such date we would not be subject to any such tax. If we were to become subject to taxation in Bermuda or any other jurisdiction as a result of our incorporation in Bermuda, it could have a material adverse effect on our business, results of operations and financial condition.
We may not be able to realize the entire book value of goodwill and other intangible assets from acquisitions.
As of December 31, 2014, we have approximately $1,057.2 million of goodwill and $114.5 million of intangible assets. We periodically assess these assets to determine if they are impaired and we monitor for impairment of goodwill relating to all acquisitions and our formation in 2004. Goodwill is not amortized but is tested for impairment testing at least on an annual basis as of December 31 of each year, based on a number of factors including macro-economic conditions, industry and market considerations, overall financial performance, business plans and expected future cash flows. Impairment testing of goodwill may also be performed between annual tests if an event occurs or circumstances change that would more likely than not reduce the fair value of goodwill below its carrying amount. We perform an assessment of qualitative factors to determine whether the existence of events or circumstances leads to a determination that it is more likely than not that the fair value of a reporting unit is less than its carrying amount. Based on the results of the qualitative assessment, the Company performs the quantitative assessment of goodwill impairment if it determines that it is more likely than not that the fair value of a reporting unit is less than its carrying amount. In the event that the book value of goodwill is impaired, any such impairment would be charged to earnings in the period of impairment. We cannot assure you that future impairment of goodwill will not have a material adverse effect on our business, financial condition or results of operations.
31
Table of Contents
Risks Related to our Shares
Future sales of our common shares could cause our share price to decline.
Sales of substantial amounts of common shares by our employees and other shareholders, or the possibility of such sales, may adversely affect the price of our common shares and impede our ability to raise capital through the issuance of equity securities. As of December 31, 2014, Bain Capital (through its affiliates) and its co-investors beneficially owned approximately 31% of our outstanding common shares. Subject to certain restrictions set forth in our shareholder agreement with Bain Capital and its co-investors, such shareholders are able to sell their common shares in the public market from time to time without registering them, subject to certain limitations on the timing, amount and method of those sales imposed by Rule 144 under the Securities Act of 1933, as amended.
Pursuant to our shareholder agreement, Bain Capital has the right, beginning on April 25, 2015, subject to certain conditions and with certain exceptions, to require us to file registration statements covering all of the common shares it owns or to include those common shares in registration statements that we may file for ourselves or for another holder of our common shares. Following their registration and sale under the applicable registration statement, those shares will become freely tradable. By exercising their registration rights and selling a large number of common shares, these holders could cause the price of our common shares to decline. In addition, the perception in the public markets that sales by them might occur could also adversely affect the market price of our common shares.
Historically we have generally not declared dividends, and future determinations to pay dividends will be at the discretion of our board of directors.
Historically we have not declared regular dividends. On August 30, 2012, we declared a special cash dividend of $2.24 per share, or approximately $502 million in the aggregate, which we paid on September 24, 2012 to holders of record as of September 10, 2012. Any determination to pay dividends to holders of our common shares in the future will be at the discretion of our board of directors and will depend on many factors, including our financial condition, results of operations and general business conditions and any other factors our board of directors deems relevant. Our ability to pay dividends will also continue to be subject to restrictive covenants contained in credit facility agreements governing indebtedness we and our subsidiaries have incurred or may incur in the future.
We are organized under the laws of Bermuda, and Bermuda law differs from the laws in effect in the United States and may afford less protection to shareholders.
Our shareholders may have more difficulty protecting their interests than would shareholders of a corporation incorporated in a state of the United States. As a Bermuda company, we are governed by, in particular, the Companies Act 1981, or the Companies Act. The Companies Act differs in some material respects from laws generally applicable to U.S. corporations and shareholders, including the provisions relating to interested directors, mergers, amalgamations, takeovers and indemnification of directors.
Generally, the duties of directors and officers of a Bermuda company are owed to the company only. Shareholders of Bermuda companies generally do not have the right to take action against directors or officers of the company except in limited circumstances. Directors of a Bermuda company must, in exercising their powers and performing their duties, act honestly and in good faith with a view to the best interests of the company, exercising the care and skill that a reasonably prudent person would exercise in comparable circumstances. Directors have a duty not to put themselves in a position in which their duties to the company and their personal interests may conflict and also are under a duty to disclose any personal interest in any contract or arrangement with the company or any of its subsidiaries. If a director of a Bermuda company is found to have breached his or her duties to that company, he may be held personally liable to the company in respect of that breach of duty. A director may be liable jointly and severally with other directors if it is shown that the director knowingly engaged
32
Table of Contents
in fraud or dishonesty. In cases not involving fraud or dishonesty, the liability of the director will be determined by the Bermuda courts on the basis of their estimation of the percentage of responsibility of the director for the matter in question, in light of the nature of the conduct of the director and the extent of the causal relationship between his or her conduct and the loss suffered.
In addition, our bye-laws contain a broad waiver by our shareholders of any claim or right of action, both individually and on our behalf, against any of our officers or directors. The waiver applies to any action taken by an officer or director, or the failure of an officer or director to take any action, in the performance of his or her duties, except with respect to any matter involving or arising out of any fraud or dishonesty on the part of the officer or director or to matters which would render it void pursuant to the Companies Act. This waiver limits the right of shareholders to assert claims against our officers and directors unless the act or failure to act involves fraud or dishonesty. Therefore, our shareholders may have more difficulty protecting their interests than would shareholders of a corporation incorporated in a state within the United States.
The market price for our common shares has been and may continue to be volatile.
The market price for our common shares has been and may continue to be volatile and subject to price and volume fluctuations in response to market and other factors, some of which are beyond our control. Among the factors that could affect our stock price are:
| • | actual or anticipated fluctuations in our quarterly and annual operating results; |
| • | changes in financial estimates by securities research analysts; |
| • | changes in the economic performance or market valuations of other companies engaged in providing business process and information technology services; |
| • | loss of one or more significant clients; |
| • | addition or loss of executive officers or key employees; |
| • | regulatory developments in our target markets affecting us, our clients or our competitors; |
| • | announcements of technological developments; |
| • | limited liquidity in our trading market; |
| • | sales or expected sales of additional common shares or purchases or expected purchases of common shares; and |
| • | terrorist attacks or natural disasters or other such events impacting countries where we or our clients have operations. |
In addition, securities markets generally and from time to time experience significant price and volume fluctuations that are not related to the operating performance of particular companies. These market fluctuations may have a material adverse effect on the market price of our common shares.
You may be unable to effect service of process or enforce judgments obtained in the United States or Bermuda against us or our assets in the jurisdictions in which we or our executive officers operate.
We are organized under the laws of Bermuda, and a significant portion of our assets are located outside the United States. It may not be possible to enforce court judgments obtained in the United States against us in Bermuda or in countries, other than the United States, where we have assets based on the civil liability or penal provisions of the federal or state securities laws of the United States. In addition, there is some doubt as to whether the courts of Bermuda and other countries would recognize or enforce judgments of United States courts
33
Table of Contents
obtained against us or our directors or officers based on the civil liability or penal provisions of the federal or state securities laws of the United States or would hear actions against us or those persons based on those laws. We have been advised by Appleby (Bermuda) Limited, our Bermuda counsel, that the United States and Bermuda do not currently have a treaty providing for the reciprocal recognition and enforcement of judgments in civil and commercial matters. Therefore, a final judgment for the payment of money rendered by any federal or state court in the United States based on civil liability, whether or not based solely on United States federal or state securities laws, would not automatically be enforceable in Bermuda. Similarly, those judgments may not be enforceable in countries, other than the United States, where we have assets.
Item 1B. Unresolved Staff Comments
None.
We have delivery centers in 18 countries. Our only material properties are our premises in India at Phase V, Gurgaon, which comprises of 212,531 square feet, and Uppal, Hyderabad which comprises approximately 449,286 square feet, both of which we own. We have a mixture of owned and leased properties and substantially all of our leased properties are leased under long-term leases with varying expiration dates. We believe that all of our properties and facilities are well-maintained.
There are no legal proceedings pending against us that we believe are likely to have a material adverse effect on our business, results of operations and financial condition.
Item 4. Mine Safety Disclosures
Not applicable.
34
Table of Contents
PART II
Item 5. Market for Registrant’s Common Equity, Related Stockholder Matters and Issuer Purchases of Equity Securities
Stock Price Information and Stockholders
The principal market on which the Company’s common shares are traded is the New York Stock Exchange under the symbol “G.” The following table sets forth the high and low closing sales price of the Company’s common shares for each quarter of 2013 and 2014. As of January 31, 2015, there were 24 holders of record of our common shares.
| Sales Price | ||||||||
| High | Low | |||||||
| Year Ended December 31, 2014: |
||||||||
| First Quarter |
$ | 18.25 | $ | 14.28 | ||||
| Second Quarter |
$ | 17.66 | $ | 16.04 | ||||
| Third Quarter |
$ | 18.27 | $ | 16.32 | ||||
| Fourth Quarter |
$ | 19.30 | $ | 15.81 | ||||
| Year Ended December 31, 2013: |
||||||||
| First Quarter |
$ | 18.19 | $ | 15.46 | ||||
| Second Quarter |
$ | 20.09 | $ | 17.85 | ||||
| Third Quarter |
$ | 21.19 | $ | 18.88 | ||||
| Fourth Quarter |
$ | 20.25 | $ | 17.20 | ||||
35
Table of Contents
The following graph and table compare the performance of an investment in our common shares with investments in the S&P 500 Index (capitalization weighted) and a peer group of companies for the period beginning August 2, 2007, the first day our common shares traded on the New York Stock Exchange, through December 31, 2014. The selected peer group for the period presented is comprised of six companies that we believe are our closest reporting issuer competitors: Accenture plc, Cognizant Technology Solutions Corp., ExlService Holdings, Inc., Infosys Technologies Limited, Wipro Technologies Limited, and WNS (Holdings) Limited. The graph presents the weighted average of the returns of the component entities of our peer group index as of the beginning of each period for which a return is presented. The performance shown in the graph and table below is historical and should not be considered indicative of future price performance.
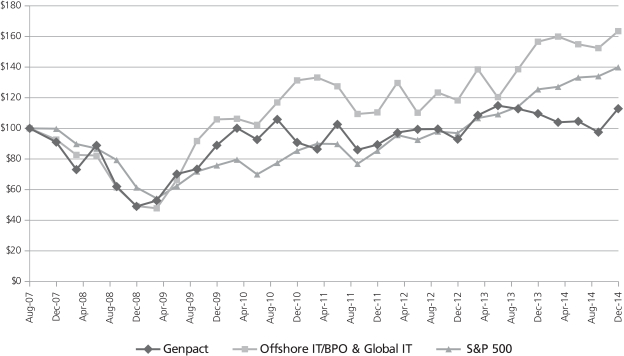
| 8/2/2007 | 12/31/2007 | 3/31/2008 | 6/30/2008 | 9/30/2008 | 12/31/2008 | |||||||||||||||||||
|
Genpact |
$ | 100.00 | $ | 90.93 | $ | 73.13 | $ | 89.07 | $ | 62.03 | $ | 49.07 | ||||||||||||
| Offshore IT/BPO & Global IT |
$ | 100.00 | $ | 92.75 | $ | 82.62 | $ | 82.26 | $ | 61.40 | $ | 49.32 | ||||||||||||
| S&P 500 |
$ | 100.00 | $ | 99.74 | $ | 89.85 | $ | 86.94 | $ | 79.23 | $ | 61.35 | ||||||||||||
| 3/31/2009 | 6/30/2009 | 09/30/2009 | 12/31/2009 | 03/31/2010 | 06/30/2010 | |||||||||||||||||||
|
Genpact |
$ | 52.90 | $ | 70.15 | $ | 73.43 | $ | 88.96 | $ | 100.12 | $ | 92.72 | ||||||||||||
| Offshore IT/BPO & Global IT |
$ | 47.84 | $ | 66.37 | $ | 91.83 | $ | 105.80 | $ | 106.28 | $ | 102.33 | ||||||||||||
| S&P 500 |
$ | 54.20 | $ | 62.45 | $ | 71.80 | $ | 75.74 | $ | 79.43 | $ | 70.01 | ||||||||||||
| 09/30/2010 | 12/31/2010 | 03/31/2011 | 06/30/2011 | 09/30/2011 | 12/30/2011 | |||||||||||||||||||
|
Genpact |
$ | 105.85 | $ | 90.75 | $ | 86.45 | $ | 102.93 | $ | 85.91 | $ | 89.25 | ||||||||||||
| Offshore IT/BPO & Global IT |
$ | 116.95 | $ | 131.39 | $ | 133.14 | $ | 127.84 | $ | 109.29 | $ | 110.35 | ||||||||||||
| S&P 500 |
$ | 77.52 | $ | 85.43 | $ | 90.06 | $ | 89.71 | $ | 76.85 | $ | 85.42 | ||||||||||||
| 03/31/2012 | 06/30/2012 | 09/30/2012 | 12/31/2012 | 03/31/2013 | 06/30/2013 | |||||||||||||||||||
|
Genpact |
$ | 97.31 | $ | 99.28 | $ | 99.58 | $ | 92.54 | $ | 108.60 | $ | 114.87 | ||||||||||||
| Offshore IT/BPO & Global IT |
$ | 130.11 | $ | 109.92 | $ | 123.38 | $ | 118.44 | $ | 138.65 | $ | 120.09 | ||||||||||||
| S&P 500 |
$ | 95.67 | $ | 92.53 | $ | 97.86 | $ | 96.87 | $ | 106.59 | $ | 109.11 | ||||||||||||
| 09/30/2013 | 12/31/2013 | 03/31/2014 | 06/30/2014 | 09/30/2014 | 12/31/2014 | |||||||||||||||||||
|
Genpact |
$ | 112.72 | $ | 109.67 | $ | 104.00 | $ | 104.66 | $ | 97.43 | $ | 113.01 | ||||||||||||
| Offshore IT/BPO & Global IT |
$ | 138.63 | $ | 156.49 | $ | 159.82 | $ | 154.99 | $ | 152.34 | $ | 163.50 | ||||||||||||
| S&P 500 |
$ | 114.22 | $ | 125.55 | $ | 127.18 | $ | 133.15 | $ | 133.97 | $ | 139.85 |
This graph is not deemed to be “filed” with the SEC or subject to the liabilities of Section 18 of the Securities Exchange Act of 1934, and should not be deemed to be incorporated by reference into any of our prior or subsequent filings under the Securities Act of 1933 or the Exchange Act of 1934.
36
Table of Contents
Dividends
On August 30, 2012, we declared a special cash dividend of $2.24 per share, or approximately $502 million in the aggregate, which we paid on September 24, 2012 to the holders of record as of September 10, 2012. Any determination to pay dividends to holders of our common shares in the future will be at the discretion of our board of directors and will depend on many factors, including our financial condition, results of operations, general business conditions and any other factors our board of directors deems relevant.
Unregistered Sales of Equity Securities
None.
Purchase of Equity Securities by the Issuer and Affiliated Purchasers
None.
37
Table of Contents
Item 6. Selected Financial Data
The table below presents our selected historical financial and certain operating data.
The Company prepares its consolidated financial statements in accordance with U.S. GAAP. The financial data as of December 31, 2013 and 2014 and for the three-year period ended December 31, 2014 have been derived from our audited consolidated financial statements included elsewhere in this Annual Report on Form 10-K. The financial data as of December 31, 2010, 2011 and 2012 and for the years ended December 31, 2010 and 2011 have been derived from our audited consolidated financial statements not included in this Annual Report on Form 10-K.
You should read the selected financial data together with the financial statements included herein and Item 7—“Management’s Discussion and Analysis of Financial Condition and Results of Operations.”
| Year Ended December 31, | ||||||||||||||||||||
| 2010 | 2011 | 2012 | 2013 | 2014 | ||||||||||||||||
| (dollars and share count in millions, except per share data) | ||||||||||||||||||||
| Statement of income data: |
||||||||||||||||||||
| Net revenues—GE |
$ | 479.2 | $ | 483.8 | $ | 496.7 | $ | 482.0 | $ | 466.1 | ||||||||||
| Net revenues—Global Clients |
779.7 | 1116.7 | 1,405.3 | 1,649.9 | 1813.4 | |||||||||||||||
|
|
|
|
|
|
|
|
|
|
|
|||||||||||
| Total net revenues |
1,259.0 | 1,600.4 | 1,902.0 | 2,132.0 | 2,279.4 | |||||||||||||||
|
|
|
|
|
|
|
|
|
|
|
|||||||||||
| Cost of revenue |
788.5 | 1,004.9 | 1,157.8 | 1,319.6 | 1,378.1 | |||||||||||||||
| Gross profit |
470.4 | 595.5 | 744.2 | 812.4 | 901.4 | |||||||||||||||
| Operating expenses: |
||||||||||||||||||||
| Selling, general and administrative expenses |
282.1 | 358.0 | 456.6 | 484.8 | 585.6 | |||||||||||||||
| Amortization of acquired intangible assets |
16.0 | 20.0 | 23.2 | 23.6 | 28.5 | |||||||||||||||
| Other operating (income) expense, net |
(5.5 | ) | 1.4 | 0.0 | (5.6 | ) | (6.9 | ) | ||||||||||||
|
|
|
|
|
|
|
|
|
|
|
|||||||||||
| Income from operations |
177.9 | 216.2 | 264.3 | 309.5 | 294.0 | |||||||||||||||
| Foreign exchange (gains) losses, net |
(1.1 | ) | (35.1 | ) | (13.1 | ) | (20.8 | ) | 12.4 | |||||||||||
| Other income (expense), net |
5.2 | 10.7 | (14.5 | ) | (24.3 | ) | (27.3 | ) | ||||||||||||
|
|
|
|
|
|
|
|
|
|
|
|||||||||||
| Income before equity-method investment activity, net and income tax expense |
184.2 | 262.1 | 263.0 | 306.0 | 254.4 | |||||||||||||||
| Loss (gain) on equity-method investment activity, net |
1.0 | 0.3 | (0.0 | ) | (0.2 | ) | 4.8 | |||||||||||||
|
|
|
|
|
|
|
|
|
|
|
|||||||||||
| Income before income tax expense |
183.2 | 261.7 | 263.0 | 306.2 | 249.6 | |||||||||||||||
| Income tax expense |
34.2 | 70.7 | 78.4 | 71.1 | 57.4 | |||||||||||||||
|
|
|
|
|
|
|
|
|
|
|
|||||||||||
| Net income |
$ | 149.0 | $ | 191.1 | $ | 184.6 | $ | 235.1 | $ | 192.2 | ||||||||||
| Net income attributable to noncontrolling interest |
6.9 | 6.8 | 6.4 | 5.3 | 0.2 | |||||||||||||||
|
|
|
|
|
|
|
|
|
|
|
|||||||||||
| Net income attributable to Genpact Limited shareholders |
$ | 142.2 | $ | 184.3 | $ | 178.2 | $ | 229.7 | $ | 192.0 | ||||||||||
|
|
|
|
|
|
|
|
|
|
|
|||||||||||
| Net income available to Genpact Limited common shareholders |
$ | 142.2 | $ | 184.3 | $ | 178.2 | $ | 229.7 | $ | 192.0 | ||||||||||
| Earnings per common share |
||||||||||||||||||||
| Basic |
$ | 0.65 | $ | 0.83 | $ | 0.80 | $ | 1.00 | $ | 0.87 | ||||||||||
| Diluted |
$ | 0.63 | $ | 0.81 | $ | 0.78 | $ | 0.97 | $ | 0.85 | ||||||||||
| Weighted average number of common shares used in computing earnings per common share |
||||||||||||||||||||
| Basic |
219.3 | 221.6 | 223.7 | 229.3 | 220.8 | |||||||||||||||
| Diluted |
224.8 | 226.4 | 229.5 | 235.8 | 225.2 | |||||||||||||||
38
Table of Contents
| As of December 31, | ||||||||||||||||||||
| 2010 | 2011 | 2012 | 2013 | 2014 | ||||||||||||||||
| (dollars in millions) | ||||||||||||||||||||
| Balance sheet data |
||||||||||||||||||||
| Cash and cash equivalents |
$ | 404.0 | $ | 408.0 | $ | 459.2 | $ | 571.3 | $ | 461.8 | ||||||||||
| Total assets |
1,893.5 | 2,403.4 | 2,605.9 | 2,689.4 | 2,742.5 | |||||||||||||||
| Long-term debt, including current portion |
25.0 | 102.9 | 661.9 | 657.9 | 653.6 | |||||||||||||||
| Total liabilities |
412.2 | 967.7 | 1,434.1 | 1,365.3 | 1,457.4 | |||||||||||||||
| Retained earnings |
421.1 | 605.4 | 282.0 | 511.7 | 398.7 | |||||||||||||||
| Genpact Limited shareholders’ equity |
1,478.7 | 1,433.1 | 1,168.4 | 1,322.7 | 1,285.1 | |||||||||||||||
| Noncontrolling interest |
2.6 | 2.6 | 3.4 | 1.3 | — | |||||||||||||||
| Total liabilities and equity |
$ | 1,893.5 | $ | 2,403.4 | $ | 2,605.9 | $ | 2,689.4 | $ | 2,742.5 | ||||||||||
| Operating data (unaudited): |
||||||||||||||||||||
| Employees (#) (approximate) |
43,912 | 55,400 | 60,200 | 63,600 | 67,900 | |||||||||||||||
| Delivery Centers (#) |
41 | 57 | 73 | 68 | 73 | |||||||||||||||
Item 7. Management’s Discussion and Analysis of Financial Condition and Results of Operations
The following discussion should be read in conjunction with our audited consolidated financial statements and the related notes that appear elsewhere in this Annual Report on Form 10-K. In addition to historical information, this discussion includes forward-looking information that involves risks and assumptions, which could cause actual results to differ materially from management’s expectations. See “Special Note Regarding Forward-Looking Statements” included elsewhere in this Annual Report on Form 10-K.
Overview
Genpact stands for “generating business impact.” We design, transform, and run intelligent business operations including those that are complex and specific to a set of chosen industries. The result is advanced operating models that assist our clients in becoming more competitive by supporting their growth and managing cost, risk, and compliance across a range of functions such as finance and procurement, financial services account servicing, claims management, regulatory affairs, and industrial asset optimization. Our Smart Enterprise Processes (SEPSM) proprietary framework helps companies reimagine how they operate by integrating effective Systems of Engagement™, core IT, and Data-to-Action AnalyticsSM. Our hundreds of long-term clients include more than one-fourth of the Fortune Global 500. We employ over 67,000 people in 25 countries with key management and a corporate office in New York City, while remaining flexible and collaborative with a management team that drives client partnerships personally. We believe we generate impact quickly because of our unparalleled experience running complex operations and business domain expertise, driving our focus on what works and making transformation sustainable. We have a unique history: behind our passion for process and operational excellence is the Lean and Six Sigma heritage of a former General Electric division that has served GE businesses for more than 16 years.
We began in 1997 as the India-based captive business process services operation for General Electric Capital Corporation, or GE Capital, GE’s financial services business. As we demonstrated our value to GE management, our business grew in size and scope. We took on a wide range of complex and critical processes and we became a significant provider to many of GE’s businesses, including Consumer Finance (GE Money), Commercial Finance, Healthcare, Industrial and GE’s corporate offices.
We started actively pursuing business from clients other than GE, or Global Clients, on January 1, 2005. Since that time, we have succeeded in increasing our business and diversifying our revenue sources, including through acquisitions. As a result, our net revenues from Global Clients have increased from $550.7 million in 2008 to $1,813.4 million in 2014, representing a compound annual growth rate, or CAGR, of approximately 22.0%. See “—Classification of Certain Net Revenues” for an explanation of the classification of revenues
39
Table of Contents
related to businesses once owned by GE and subsequently sold. During the same period, our net revenues from GE decreased from $490.2 million in 2008 to $466.1 million in 2014. See “—Classification of Certain Net Revenues.” As a percentage of total net revenues, our net revenues from Global Clients have increased from 52.9% in 2008 to 79.6% in 2014, and our net revenues from GE as a percentage of total net revenues have decreased proportionately over the same period.
On March 24, 2010, a secondary offering of 38.6 million common shares held by certain of our shareholders was completed at a price of $15 per share. All of the common shares were sold by our shareholders and, as a result, we did not receive any of the proceeds from the offering.
On August 1, 2012, we announced that Glory Investments A Limited, formerly known as South Asia Private Investments and an affiliate of Bain Capital Investors, LLC (“Bain Capital”) had entered into an agreement to purchase approximately 67.8 million of our common shares from affiliates of General Atlantic, LLC (“GA”) and Oak Hill Capital Partners (“OH”) for $14.76 per share, or approximately $1.0 billion, after our payment of a special cash dividend of $2.24 per share, or $501.6 million in the aggregate, which was paid on all issued and outstanding common shares. The special cash dividend was declared by our board of directors on August 30, 2012, and paid on September 24, 2012 to holders of record as of September 10, 2012. On October 25, 2012, Bain Capital, its affiliated assignees and two additional co-investors completed the purchase of approximately 67.8 million of our common shares.
On August 30, 2012, we terminated our credit facility of $380.0 million, which we obtained in May 2011, and entered into a new credit facility of $925.0 million, which we used to repay the May 2011 credit facility, fund a portion of the special cash dividend, pay fees and expenses in connection with the foregoing and to provide for our general corporate purposes, including working capital requirements. In addition to proceeds from the credit facility, we used cash on hand to fund the special cash dividend payment.
Bain Capital’s 2012 purchase of our shares, our entry into a new credit facility, and our payment of the special cash dividend are collectively referred to as the “2012 Recapitalization.”
We incurred expenses of approximately $23.5 million in connection with the 2012 Recapitalization, excluding fees associated with the termination of the May 2011 credit facility and the entry into the new credit facility. Of the total expenses of $23.5 million, $6.2 million was incurred in connection with the payment of the special cash dividend and recorded as a part of “selling, general and administrative expenses” in the Consolidated Statements of Income. The balance of the total expenses of approximately $17.2 million was incurred in relation to the share purchase transaction. At the closing of the share purchase transaction on October 25, 2012, GA and OH reimbursed $17.0 million of the $17.2 million. Such expenses and reimbursements thereof were recorded as part of “other income (expense), net.”
In accordance with the pre-existing anti-dilutive provisions of our stock-based compensation plans, as a result of our payment of the special cash dividend we reduced the exercise price per share of each outstanding stock option award and increased the number of all stock-based awards outstanding as of the record date of the special cash dividend in such a manner that the aggregate fair value, intrinsic value and the ratio of the exercise price to the market price of the outstanding stock-based awards were approximately equal immediately before and after the adjustments. Therefore, in accordance with the equity restructuring guidance under ASC 718, Compensation-Stock Compensation, no incremental compensation expense was recognized for the adjustment to the outstanding stock-based awards as a result of the special cash dividend.
On December 14, 2012, a secondary offering of 10.9 million common shares held by GA and OH was completed at an offering price of $15.50 per share. All of the common shares were sold by our shareholders and, as a result, we did not receive any of the proceeds from the offering. We incurred expenses in connection with the secondary offering amounting to approximately $0.2 million, which was recovered from the selling shareholders. After the completion of the secondary offering, GA and OH each owned approximately 2.4% of our outstanding common shares and ceased to be significant shareholders and related parties.
On April 8, 2014, we purchased 17,292,842 of our common shares at $17.50 per share for an aggregate amount of $302.6 million pursuant to a modified “Dutch Auction” self-tender offer announced on March 5, 2014.
40
Table of Contents
Under the terms of the offer, we were authorized to purchase up to $300.0 million in value of our common shares, including the right to upsize the offer by up to 2% of our then outstanding shares, which right we exercised. We incurred $2.5 million in direct costs resulting from the share purchase, which amount was deducted from retained earnings. The purchased shares were retired after the purchase.
Revenues. We earn revenues pursuant to contracts which generally take the form of a master service agreement, or MSA, which is a framework agreement that is then supplemented by statements of work, or SOWs. Our MSAs specify the general terms applicable to the services we will provide. Our MSAs are generally for terms of three to seven years, although they may also have an indefinite term or be for terms of less than three years. In most cases they do not specify pricing terms or obligate the client to purchase a particular amount of services. We then enter into SOWs under an MSA, which specify particular services to be provided and the pricing terms. Most of our revenues are from SOWs with terms of two to five years. We typically have multiple SOWs under any given MSA, and the terms of our SOWs vary depending on the nature of the services provided.
We seek to develop long-term relationships with our clients. We believe that these relationships best serve our clients as they create opportunities for us to provide a variety of services using the full range of our capabilities and to deliver continuous process improvement. We typically face a long selling cycle in securing a new client. It is not unusual for us to spend twelve to eighteen months or more from the time we begin actively soliciting a new client until we begin to recognize revenues. Our sales efforts usually involve four phases. We may make an initial sales effort in response to an invitation by a client, a specific request for a proposal or at our own initiative. This may be followed by a second phase, during which we work with the client to determine the exact scope and nature of the required services, the proposed solutions and initial transition planning. It is typically only upon the completion of this second phase that a client will decide to retain us. A third phase follows, during which we negotiate the MSA and the initial SOWs. This third phase also involves detailed planning of the transition of the services as well as the transfer of the knowledge needed to implement the services under such SOWs. The final phase involves commencement of the work and ramping up to meet the agreed upon service levels.
We expend significant time, resources and capital throughout all of these phases. We do not recognize any revenues or reimbursement of costs until an MSA and one or more SOWs are signed, which usually occurs sometime in the third phase of the client development effort. We typically begin hiring employees specifically for the services to be provided to a client once an SOW for the services is signed. Because there is no certainty that a new client will retain us, and because the time involved in these initial phases is significant and unpredictable, we may incur expenses for a significant period of time without receiving any revenues.
All costs related to contract acquisition prior to signing a contract are expensed as incurred. Once a contract is signed, we defer revenues from the transition of services to our delivery centers, as well as the related cost of revenue. We recognize such deferred revenues and related costs of revenue over the period in which the related service delivery is expected to be performed, which is currently estimated to be three years. Any costs incurred for acquiring contracts, such as contract acquisition fees or other upfront fees paid to a client or any other third party, are amortized over the period of a contract. Such amounts are generally recoverable from clients in the event of premature contract termination without cause.
We price our services under a variety of arrangements, including time and materials, transaction-based and, to a lesser extent, fixed-price contracts. When services are priced on a time-and-materials basis, we charge the client based on full-time equivalent, or FTE, rates for the personnel who will directly perform the services. The FTE rates are determined on a periodic basis, vary by category of service delivery personnel and are set at levels to reflect all of our costs, including the cost of supervisory personnel, the allocable portion of other costs, and a margin. In some cases, time-and-materials contracts are based on hourly rates of the personnel providing the services. Time-and-materials pricing does not require us to estimate the volume of transactions or other processes that the client expects us to operate.
41
Table of Contents
In transaction-based pricing, clients are charged a fixed fee per transaction, with the fee per transaction sometimes linked to the total number of transactions processed. Some of our contracts give the client the option to prospectively change from a time-and-materials model to a transaction-based pricing model.
A portion of our revenues is derived from fixed-price contracts. Our profitability under a fixed-price contract, compared to a time-and-materials or transaction-based contract, is more dependent on our ability to estimate the number of FTEs required to perform the services, the time required to complete the contract and the amount of travel and other expenses that will be incurred in performing that contract. Accordingly, while we may have an opportunity to realize a higher profit, our profitability under each of our fixed-price contracts could also be lower than we expect.
There are a variety of other aspects to our pricing of contracts. Under some of our MSAs, we are able to share a limited amount of inflation and currency exchange risk for engagements lasting longer than 12 months. Many of our MSAs also provide that, under transaction and fixed-price SOWs, we are entitled to retain a portion of certain productivity benefits we achieve. However, some of our MSAs and/or SOWs require certain minimum productivity benefits to be passed on to our clients. Once an MSA and related SOWs are signed and production of services commences, our revenues and expenses increase as services are ramped up to the agreed upon level. In many cases, we may have opportunities to increase our margins over the life of an MSA or SOW. This is driven by a number of factors. Margins under an MSA can improve to the extent that the time and expense involved in negotiating additional SOWs, transitioning the processes to our delivery centers and commencing production are generally less with respect to additional services provided under an MSA than they are with respect to the initial services provided under that MSA. Margins can also improve upon the realization of economies of scale as the volume of services increases with a comparatively minimal increase in support costs, or upon the achievement of productivity benefits. Thus, our more mature client relationships typically generate higher margins. A critical part of our strategy is therefore to expand relationships with our clients as a means to increase our overall revenues and improve our margins.
Reimbursements of out-of-pocket expenses received from clients, consisting principally of travel expenses, have been included as part of net revenues from services.
We follow a rigorous review process to evaluate significant new business opportunities. New business proposals are reviewed in the light of our strategy to target specific industry verticals and geographical markets. We begin each year with a set of named accounts, including prospective clients with operations in our target areas, and all opportunities during the year are reviewed by a committee comprised of business leaders from the applicable industry vertical, operations personnel, and members of our finance team. In this way, we try to ensure that contract terms meet our pricing, cash and service objectives. See Item 1—“Business—Sales and Marketing.”
In January 2010, we extended our MSA with GE from a term ending December 31, 2014 to December 31, 2016. The MSA provides for a minimum annual volume commitment of $360 million for each of the nine years beginning January 1, 2005, subject to certain potential adjustments or credits. Such minimum annual commitment is then reduced in a phased manner for the final three years of the agreement, to $250 million for 2014, $150 million for 2015 and $90 million for 2016. The actual level of services purchased by GE in the last eight years has exceeded its minimum annual commitment for each such year.
Although some decisions may be made centrally at GE, the total level of business we receive generally depends on the decisions of the various operating managers of the GE businesses we serve. In addition, because our business from GE is derived from a variety of businesses within GE, our exposure to GE is diversified in terms of industry risk. See Item 1A—“Risk Factors—GE accounts for a significant portion of our revenues and any loss of business from, or change in our relationship with, GE could have a material adverse effect on our business, results of operations and financial condition.”
Classification of certain net revenues. Our net revenues are classified as net revenues from GE and net revenues from Global Clients. Net revenues from Global Clients consist of revenues from services provided to all clients other than GE and the companies in which GE owns 20% or less of the outstanding equity interest. If GE ceases to own at least 20% of a business, we treat the revenues from such business as Global Client revenues
42
Table of Contents
from the date that GE ceases to be a 20% shareholder. In many cases, we have continued to perform services for such businesses following their divestiture by GE even though they were not obligated by the GE MSA to continue to use our services. In such cases, we have either entered into new MSAs with respect to such businesses following their divestiture by GE or agreed with such businesses to continue to work pursuant to the terms agreed to by GE.
Expenses. Personnel expenses are a major component of both our cost of revenue and selling, general and administrative expenses. Personnel expenses include salaries and benefits (including stock-based compensation) as well as costs related to recruiting and training. Our industry is labor-intensive. Wage levels in the countries in which our delivery centers are located have historically increased on a year-over-year basis. We attempt to address the impact of wage increases, and pressures to increase wages, in a number of ways, which include seeking to control entry-level wages, managing our attrition rate, delivering productivity and right-skilling. We try to control increases in entry-level wages by implementing innovative recruiting policies, utilizing continuous training techniques, emphasizing promotion opportunities and maintaining an attractive work atmosphere and company culture. In 2008, we formed a joint venture with NIIT, one of the largest training institutes in Asia, to create a training institute to assist us with training and reduce our training costs. Since then we have been expanding our internal hiring and training programs. In 2011, we launched an integrated talent management program globally to expand the pool of potential applicants we hire and to upgrade our employees’ skill levels so that employees may take on higher value-added tasks over time across multiple domains. We have been scaling up this program every year to hire at optimal costs and are now partnering with universities, governments, not-for-profit entities and private institutions to create sustainable pipelines for our talent supply. In planning capacity expansion, we look for locations that help us ensure global delivery capability while helping us control average salary levels. In India and in other countries where we may open multiple locations, we try to expand into cities where competition for personnel and wage levels may be lower than in more developed cities. In addition, under some of our contracts we have the ability to share with our clients a portion of any increase in costs due to inflation. Nevertheless, despite these steps, we expect general increases in wage levels in the future, which could adversely affect our margins. A significant increase in attrition rates would also increase our recruiting and training costs and decrease our operating efficiency, productivity and profit margins. Increased attrition rates or increased pricing may also cause some clients to be less willing to use our services. See Item 1A—“Risk Factors—Wage increases in the countries in which we have operations may prevent us from sustaining our competitive advantage and may reduce our profit margin.”
Personnel expenses are allocated between cost of revenue and selling, general and administrative expenses based on the classification of the employee.
Our operational expenses include facilities maintenance expenses, travel and living costs, communications expenses, consulting and other costs. Consulting charges, consisting of the cost of consultants and subcontractors who are directly responsible for the performance of services for clients, are included in cost of revenue.
Cost of revenue. The principal component of cost of revenue is personnel expenses. We include in cost of revenue all personnel expenses for employees who are directly responsible for the performance of services for clients, their supervisors and certain support personnel who may be dedicated to a particular client or a set of processes. Stock-based compensation is allocated between cost of revenue and selling, general and administrative expenses based on the function to which the employee belongs.
The operational expenses included in cost of revenue include a portion of our facilities maintenance expenses, travel and living expenses, communication expenses, consulting expenses and certain other expenses. Facilities maintenance expenses and certain other expenses are allocated between cost of revenue and selling, general and administrative expenses based on headcount. Travel and living expenses are included in cost of revenue if the personnel expense for the employee incurring such expense is included in cost of revenue. The operational expenses component of cost of revenue also includes consulting charges, which generally represent the cost of third-party consultants or subcontractors that we may engage for particular services. Cost of revenue also includes a portion of our depreciation and amortization expense, which is allocated between cost of revenue and selling, general and administrative expenses based on headcount.
43
Table of Contents
The ratio of cost of revenue to revenues for any particular SOW or for all SOWs under an MSA is typically higher in the early periods of the contract or client relationship than in later periods. This is because the number of supervisory and support personnel relative to the number of employees who are performing services declines. It is also because we may retain a portion of the benefit of productivity increases realized over time.
Selling, general and administrative expenses. Our selling, general and administrative, or SG&A, expenses are primarily comprised of personnel expenses for senior management, corporate personnel in enabling functions such as human resources, finance, legal, marketing, sales and sales-related personnel, and other operational personnel. Stock-based compensation is allocated between cost of revenue and selling, general and administrative expenses based on the function to which the employee belongs. The operational costs component of SG&A expenses also includes travel and living costs for such personnel. Further, total facilities maintenance expenses, certain communication expenses and certain other expenses are allocated to SG&A based on headcount. The operational costs component of SG&A expenses also includes professional fees, which represent the costs of third party legal, tax, accounting and other advisors, and an allowance for doubtful receivables. SG&A expenses also include a portion of our depreciation and amortization expense, which is allocated between cost of revenue and SG&A expenses based on headcount.
Other operating (income) expense, net. Other operating (income) expense, net primarily consists of the impact of the change in the fair value of earn-out consideration relating to business acquisitions and certain operating losses resulting from the impairment of property, plant and equipment and certain capital work-in-progress items.
Foreign exchange (gains) losses, net. Foreign exchange (gains) losses, net, primarily consist of gains or losses on the re-measurement of non-functional currency assets and liabilities. In addition, it includes gains or losses from derivative contracts entered into to offset the impact of the re-measurement of non-functional currency assets and liabilities. It also includes the realized and unrealized gains or losses on derivative contracts that do not qualify for “hedge” accounting. The gains or losses on derivative contracts that qualify for hedge accounting are deferred and included as other comprehensive income (loss) until the derivative contracts mature, at which time the gains or losses on the cash flow hedges are classified as net revenues, cost of revenue and selling, general and administrative expenses based on the underlying risk being hedged. See note 2 to our consolidated financial statements and Item 7A—“Quantitative and Qualitative Disclosures about Market Risk—Foreign Currency Risk.”
Approximately 71.2% of our revenues were earned in U.S. dollars in fiscal 2014. We also received payments in euros, U.K. pounds sterling, Australian dollars, Chinese renminbi, Japanese yen, South African rand and Indian rupees. Our costs are primarily in Indian rupees, as well as in U.S. dollars, Chinese renminbi, euros and the currencies of the other countries in which we have operations. While some of our contracts provide for limited sharing of the risk of inflation and fluctuations in currency exchange rates, we bear a substantial portion of this risk, and therefore our operating results could be negatively affected by adverse changes in wage inflation rates and foreign currency exchange rates. See our discussion of wage inflation under “—Expenses” above. We enter into forward currency contracts, which are generally designed to qualify for hedge accounting, in order to hedge most of our currency exposure between the U.S. dollar and the Indian rupee, Mexican peso, Philippine peso, pound sterling, Australian dollar and euro, between the euro and the Romanian leu and Hungarian forint, and between the Chinese renminbi and the Japanese yen. However, our ability to hedge such risks is limited by local law, the liquidity of the market for such hedges and other practical considerations. Thus, our results of operations may be adversely affected if we are not able to enter into the desired hedging arrangements or if our hedging strategies are not successful.
44
Table of Contents
Other income (expense), net. Other income (expense), net consists primarily of interest expense on indebtedness and capital lease obligations, interest adjustments relating to earn-out consideration in connection with certain acquisitions, and provisions created for losses on divestitures. Other income (expense), net also includes interest income on certain deposits.
Income taxes. We are incorporated in Bermuda and have operations in many countries. Our effective tax rate has historically varied and will continue to vary from year to year based on the tax rate in our jurisdiction of organization, the geographical sources of our earnings and the tax rates in those countries, the tax relief and incentives available to us, the financing and tax planning strategies employed by us, changes in tax laws or the interpretation thereof, and movements in our tax reserves, if any.
Bermuda taxes. We are organized in Bermuda. Bermuda does not impose any income tax on us.
Indian taxes. Indian SEZ legislation provides for a 15-year tax holiday scheme for operations established in designated special economic zones, or SEZs. Under the SEZ legislation, qualifying operations are eligible for a deduction from taxable income equal to (i) 100% of their profits or gains derived from the export of services for a period of five years from the commencement of operations; (ii) 50% of such profits or gains for the next five years; and (iii) 50% of such profits or gains for an additional period of five years, subject to the creation of a “Special Economic Zone Re-investment Reserve Account,” to be utilized only for acquiring new plant or machinery, or for other business purposes not including the distribution of dividends. This holiday is available only for new business operations that are conducted at qualifying SEZ locations and is not available to operations formed by splitting up or reconstructing existing operations or transferring existing plant and equipment (beyond prescribed limits) to new locations. During the last eight years, we established new delivery centers that we believe are eligible for the SEZ benefits. However, we cannot forecast what percentage of our operations or income in India will in the future be eligible for SEZ benefits, as this will depend on how much of our business can be conducted at the qualifying locations and how much of that business can be considered to meet the restrictive conditions described above.
Our tax expense will increase as a result of the expiration of our tax holidays and our after-tax profitability will be materially reduced unless we can obtain comparable benefits under new legislation or otherwise reduce our tax liability.
The governments of foreign jurisdictions from which we deliver services may assert that certain of our clients have a “permanent establishment” in such jurisdictions by reason of the activities we perform on their behalf, particularly those clients that exercise control over or have substantial dependency on our services. Such an assertion could affect the size and scope of the services requested by such clients in the future.
Transfer pricing. We have transfer pricing arrangements among our subsidiaries involved in various aspects of our business, including operations, marketing, sales and delivery functions. U.S. and Indian transfer pricing regulations, as well as the regulations applicable in the other countries in which we operate, require that any international transaction involving affiliated enterprises be made on arm’s-length terms. We consider the transactions among our subsidiaries to be substantially on arm’s-length pricing terms. If, however, a tax authority in any jurisdiction reviews any of our tax returns and determines that the transfer prices we have applied are not appropriate, or that other income of our affiliates should be taxed in that jurisdiction, we may incur increased tax liability, including accrued interest and penalties, which would cause our tax expense to increase, possibly materially, thereby reducing our profitability and cash flows.
Other taxes. We have operating subsidiaries in other countries, including Brazil, China, Colombia, the Czech Republic, Guatemala, Hungary, Japan, Kenya, Mexico, Morocco, the Netherlands, the Philippines, Poland, Romania, the United Kingdom, South Africa, the United Arab Emirates and the United States, as well as sales and marketing subsidiaries in certain jurisdictions, including the United States and the United Kingdom, which are subject to tax in such jurisdictions.
During 2009, one of our subsidiaries in China obtained a ruling from the Government of China certifying it to be a Technologically Advanced Service Enterprise. As a result, that subsidiary is subject to a lower corporate
45
Table of Contents
income tax rate of 15% for a three-year period starting in 2009, extendable with necessary approvals. This period was extended through December 31, 2014. Our delivery centers also enjoy corporate tax holidays or concessional tax rates in certain other jurisdictions, including the Philippines, Guatemala and Colombia. These tax concessions will expire over the next few years, possibly increasing our overall tax rate. Our ability to repatriate surplus earnings from our foreign subsidiaries in a tax-efficient manner is dependent upon interpretations of local law, possible changes in such laws and the renegotiation of existing double tax avoidance treaties. Changes to any of these may adversely affect our overall tax rate.
Tax audits. Our tax liabilities may also increase, including due to accrued interest and penalties, if the applicable income tax authorities in any jurisdiction, during the course of any audits, were to disagree with any of our tax return positions. Through the period ended December 30, 2004, we have an indemnity from GE for any additional taxes attributable to periods prior to December 30, 2004.
Tax losses and other deferred tax assets. Our ability to utilize our tax loss carry-forwards and other deferred tax assets and credits may be affected if our profitability deteriorates or if new legislation is introduced that changes carry-over or crediting rules. Additionally, reductions in enacted tax rates may affect the value of our deferred tax assets and our tax expense.
Acquisitions
From time to time we may make acquisitions or engage in other strategic transactions if suitable opportunities arise, and we may use cash, securities, other assets or a combination of these as consideration.
In November 2014, we acquired from Hitachi Management Partner, Corp. a finance and accounting service delivery center in Japan, and we simultaneously entered into a five-year master services agreement with Hitachi Ltd. This acquisition expands our presence in Japan and strengthens our finance and accounting service offerings. The preliminary estimated purchase consideration for the acquisition was $21.8 million. Goodwill arising from the acquisition amounted to $17.1 million and has been allocated to our China reporting unit.
In May 2014, we acquired 100% of the outstanding equity interest in each of Pharmalink Consulting Limited, a company incorporated under the laws of England and Wales, and Pharmalink Consulting Inc., a California corporation (collectively referred to as “Pharmalink”). This acquisition enabled us to provide additional regulatory consulting, outsourcing and operations capabilities for our clients in the life sciences industry. The preliminary estimated purchase consideration for the acquisition of Pharmalink was $138.6 million. Goodwill arising from the acquisition amounted to $110.0 million and was allocated to our India reporting unit.
In August 2013, we acquired certain assets, including contracts, and assumed certain liabilities of Third Pillar Systems, Inc. (“Third Pillar”) for cash consideration of $2.5 million. As part of the transaction, we also hired employees of Third Pillar. This acquisition gives us the ability to provide an end-to-end platform and processes for the commercial lending and leasing industry. Goodwill arising from the acquisition amounted to $2.0 million and has been allocated to our India reporting unit.
In March 2013, we increased our interest in NGEN Media Services Private Limited (“NGEN”) to 100% from 50%, making NGEN a wholly-owned subsidiary. We acquired the remaining 50% equity interest for cash consideration of $0.2 million. NGEN is engaged in the business of media services outsourcing.
In February 2013, we acquired 100% of the outstanding equity interests in each of Jawood Business Process Solutions, LLC (“Jawood”) and Felix Software Solutions Private Limited (“Felix”), providers of business consulting and information technology services to the healthcare payer industry. Felix had been a key subcontractor to Jawood. This transaction strengthened our solutions and services offerings in the healthcare payer market. The total purchase consideration for the acquisition of Jawood and Felix (collectively referred to as the “Jawood Business”) was $47.2 million. Goodwill arising from the acquisition amounted to $34.8 million and has been allocated to our India reporting unit.
46
Table of Contents
Divestitures
In December 2013, we completed the divestiture of Gantthead.com, Inc., an online technology portal for project management, which we acquired as a part of our acquisition of Headstrong Corporation in 2011. The divestiture was made for cash consideration of $3.2 million, resulting in a loss of $2.3 million.
In September 2013, we completed the divestiture of Clearbizz B.V, a provider of electronic invoicing services in the Netherlands that we acquired as a part of our acquisition of Accounting Plaza B.V. in 2012. The divestiture resulted in a loss of $1.2 million.
In February 2013, we completed the divestiture of Hello Communications (Shanghai) Co. Ltd., a provider of offshore tele-sales and other voice-based support services to telecom carriers and IT/telecom equipment manufacturers in Asia. The divestiture was made for cash consideration of $1.0 million, resulting in a loss of $0.4 million.
Each such divestiture was undertaken in accordance with our strategy to allocate capital and resources to support profitable growth and a higher return on investment. The results of operations of each of these former subsidiaries were not material to the Company’s results of operations or financial condition and, accordingly, were not reflected as discontinued operations for the periods presented.
Bookings
New bookings for 2014 were $2.156 billion. We provide information regarding our new bookings, which include certain renewals, extensions and changes to existing contracts, because we believe doing so provides useful trend information regarding changes in the volume of our new business over time. Regular renewals of contracts, which we consider business as usual, are not counted as new bookings.
New bookings can vary significantly year to year depending in part on the timing of the signing of a small number of large contracts. The types of services clients are demanding, the duration of the contract and the pace and level of their spending may impact the conversion of new bookings to revenues. For example, business process outsourcing bookings, which are typically for multi-year contracts, generally convert to revenue over a longer period of time compared to information technology outsourcing bookings which are often project based.
Information regarding our new bookings is not comparable to, nor should it be substituted for, an analysis of our revenues over time. New bookings involve estimates and judgments. There are no third-party standards or requirements governing the calculation of bookings. We do not update our new bookings for material subsequent terminations or reductions related to bookings originally recorded in prior fiscal years. New bookings are recorded using then-existing foreign currency exchange rates and are not subsequently adjusted for foreign currency exchange rate fluctuations.
Critical Accounting Policies and Estimates
The discussion and analysis of our financial condition and results of operations are based upon the financial statements included in this Annual Report on Form 10-K, which have been prepared in accordance with U.S. GAAP. The notes to the financial statements contain a summary of our significant accounting policies. Set forth below are our critical accounting policies under U.S. GAAP. The application of generally accepted accounting principles requires us to make estimates and assumptions about certain items and future events that affect our financial results. We base our estimates on historical experience, contractual commitments and on various other assumptions that we believe to be reasonable under the circumstances and at the time they are made. Actual results for these estimates might differ and are adjusted prospectively in the financial statements.
Revenue recognition. As discussed above, we derive revenues from our services, which are charged on a time-and-materials, transaction or fixed-price basis. We recognize revenues when persuasive evidence of an arrangement exists, the sales price is fixed or determinable, services have been rendered, and collectability is
47
Table of Contents
reasonably assured. Revenues derived from time-and-materials and transaction-based contracts are recognized as the related services are performed. In the case of fixed-price contracts, including those for application maintenance and support services, revenues are recognized ratably over the terms of the contracts. Revenues with respect to fixed-price contracts for the development, modification or customization of software are recognized on a percentage-of-completion method. Guidance has been drawn from FASB guidelines on Software—Revenue Recognition, to account for revenue from fixed-price arrangements for software development and related services in conformity with FASB guidance on Revenue Recognition—Construction—Type and Production-Type Contracts. The input (effort or cost expended) method has been used to measure progress towards completion, because management considers this to be the best available measure of progress on these contracts as there is a direct relation between input and productivity. Provisions for estimated losses, if any, on uncompleted contracts are recorded in the period in which such losses become probable based on current contract estimates.
If we receive a cash payment in respect of services prior to the time a contract is signed, we recognize this as an advance from a client. As the contract is signed, it becomes revenue to the extent the services are rendered and price is fixed or determinable.
Some of our client contracts also include incentive payments for benefits delivered to clients. Revenues relating to such incentive payments are recorded when the contingency is satisfied, price is determinable and we conclude that the amounts are earned.
We defer revenues for the transition of services to our delivery centers over the period in which the applicable service delivery is expected to be performed, which is currently an average of three years. Deferred costs are limited to the amount of deferred revenues. Revenues are reported net of value-added tax, business tax and applicable discounts and allowances. Reimbursements of out-of-pocket expenses received from clients have been included as part of revenues.
We enter into multiple-element revenue arrangements in which a client may purchase a combination of our services. We recognize revenue from multiple-element arrangements based on (1) whether and when each element has been delivered, (2) the fair value of each element as determined using the selling price hierarchy of vendor-specific objective evidence (“VSOE”) of fair value, third-party evidence or using best estimated selling price, as applicable, and (3) the allocation of the total price among the various elements based on the relative selling price method.
Accounts receivable. We record accounts receivable at the invoiced or to be invoiced amount and our accounts receivable do not bear interest. Our accounts receivable include amounts for services that we have performed and for which payment has not been received. We typically follow a 30-day billing cycle and, as such, at any point in time we may have accrued up to 30 days of revenues that have not been billed. Amounts collected on trade accounts receivable are included in net cash provided by operating activities in the Consolidated Statements of Cash Flows. Any receivable that is due after one year is classified under “Other Assets” in the Consolidated Balance Sheets. We maintain an allowance for doubtful accounts for estimated losses inherent in the accounts receivable portfolio. In establishing the required allowance, we consider current market conditions and our clients’ financial condition, the amount of receivables in dispute, and the current receivables’ aging and current payment patterns of the client. Account balances are charged off against the allowance after all means of collection have been exhausted and the potential for recovery is considered remote. We do not have any off-balance-sheet credit exposure related to our clients.
Business combinations, goodwill and other intangible assets. We account for business combinations by recognizing the identifiable tangible and intangible assets acquired and liabilities assumed, and any non-controlling interest in the acquired business, measured at their acquisition date fair values. We identify a business as an integrated set of activities and assets that is capable of being conducted and managed for the purpose of providing a return. Deferred and contingent consideration are included in the acquisition cost and are recognized at their fair values as of the acquisition date. A liability resulting from contingent consideration is remeasured to fair value at each reporting date until the contingency is resolved. Changes in fair value are recognized in “Other
48
Table of Contents
operating (income) expense, net” in the Consolidated Statements of Income. All assets and liabilities of the acquired businesses, including goodwill, are assigned to reporting units. Acquisition-related costs are expensed as incurred under selling, general and administrative expenses.
Goodwill represents the cost of acquired businesses in excess of the fair value of the identifiable tangible and intangible net assets purchased. Goodwill is not amortized but is tested for impairment at least on an annual basis on December 31 based on a number of factors, including operating results, business plans and future cash flows. We perform an assessment of qualitative factors to determine whether the existence of events or circumstances leads to a determination that it is more likely than not that the fair value of a reporting unit is less than its carrying amount. Based on our assessment of events or circumstances, we perform a quantitative assessment of goodwill impairment if it is determined that it is more likely than not that the fair value of a reporting unit is less than its carrying amount. In the quantitative assessment, recoverability of goodwill is evaluated using a two-step process. The first step involves a comparison of the fair value of a reporting unit with its carrying value. If the carrying amount of the reporting unit exceeds its fair value, the second step of the process involves a comparison of the fair value and carrying value of the goodwill of that reporting unit. If the carrying value of the goodwill of a reporting unit would exceed the fair value of that goodwill, we recognize an impairment loss in an amount equal to the excess. In addition, we perform qualitative assessments of goodwill impairment between annual tests as necessary to identify if an event occurred or circumstances changed that would more likely than not reduce the fair value of the reporting unit below its carrying amount. Intangible assets acquired individually, or with a group of other assets in a business combination, are carried at a cost less accumulated amortization based on their estimated useful lives as follows:
| Customer-related intangible assets |
1–14 years | |||
| Marketing-related intangible assets |
1–10 years | |||
| Other intangible assets |
3–9 years |
Intangible assets are amortized over their estimated useful lives using a method of amortization that reflects the pattern in which the economic benefits of the intangible assets are consumed or otherwise realized.
In business combinations, where the fair value of identifiable tangible and intangible net assets purchased exceeds the cost of the acquired business, the Company recognizes the resulting gain under ‘Other operating (income) expense, net’ in the Consolidated Statements of Income on the acquisition date.
Derivative instruments and hedging activities. We enter into forward foreign exchange contracts to mitigate interest rate and foreign exchange risk on intercompany transactions and forecasted transactions denominated in foreign currencies. Most of these transactions meet the criteria for hedge accounting as cash flow hedges under FASB guidance on Derivatives and Hedging.
With respect to derivatives designated as cash flow hedges, we formally document all relationships between hedging instruments and hedged items, as well as our risk management objectives and strategy for undertaking various hedge transactions. In addition, we formally assess, both at the inception of a hedge and on a quarterly basis, whether each derivative is highly effective in offsetting changes in fair values or cash flows of the hedged item. If it is determined that a derivative or a portion thereof is not highly effective as a hedge, or if a derivative ceases to be a highly effective hedge, we will prospectively discontinue hedge accounting with respect to that derivative.
We recognize derivative instruments and hedging activities as either assets or liabilities in our Consolidated Balance Sheets and measure them at fair value. Changes in the fair values of these hedges are deferred and recorded as a component of other comprehensive income (losses), net of tax until the hedged transactions occur and are then recognized in the Consolidated Statements of Income along with the underlying hedged item and disclosed as a part of “Total net revenues,” “Cost of revenue” and “Selling, general and administrative expenses,” as applicable.
Changes in the fair value of other derivative contracts and the ineffective portion of hedging instruments are recognized in the Consolidated Statement of Income of each period and are included in foreign exchange (gains) losses, net and other income (expense), net, respectively.
49
Table of Contents
We value our derivatives based on market observable inputs including both forward and spot prices for currencies. Derivative assets and liabilities included in Level 2 primarily represent foreign currency forward contracts. The quotes are taken from independent sources and databases.
In all situations in which hedge accounting is discontinued and a derivative is retained, we continue to carry the derivative at its fair value on the balance sheet and recognize any subsequent change in its fair value in the Consolidated Statement of Income. When it is probable that a forecasted transaction will not occur, we discontinue hedge accounting and recognize immediately in foreign exchange (gains) losses, net in the Consolidated Statements of Income, the gains and losses attributable to such derivative that were accumulated in other comprehensive income (loss).
Income taxes. We account for income taxes using the asset and liability method. Under this method, income tax expense is recognized for the amount of taxes payable or refundable for the current year. In addition, deferred tax assets and liabilities are recognized for future tax consequences attributable to differences between the financial statement carrying amounts of existing assets and liabilities, and their tax bases and operating losses are carried forward, if any. Deferred tax assets and liabilities are measured using enacted tax rates expected to apply to taxable income in the years in which those temporary differences are expected to be recovered or settled. The effect on deferred tax assets and liabilities of a change in tax rates is recognized in income in the period in which the tax status change becomes effective. Deferred tax assets are recognized in full, subject to a valuation allowance that reduces the amount recognized to that which is more likely than not to be realized. In assessing the likelihood of realization, we consider estimates of future taxable income. In the case of an entity that benefits from a corporate tax holiday, deferred tax assets or liabilities for existing temporary differences are recorded only to the extent such temporary differences are expected to reverse after the expiration of the tax holiday.
We also evaluate potential exposures related to tax contingencies or claims made by the tax authorities in various jurisdictions and determine if a reserve is required. A reserve is recorded if we believe that a loss is more likely than not to occur and the amount can be reasonably estimated. These reserves are based on estimates and subject to changing facts and circumstances considering the progress of ongoing audits, case law and new legislation. We believe that the reserves we have established are adequate in relation to any possible additional tax assessments.
We generally plan to indefinitely reinvest the undistributed earnings of foreign subsidiaries, except for those earnings that can be repatriated in a tax-free manner and, accordingly, do not accrue any material income, distribution or withholding taxes that would arise if such earnings were repatriated.
We apply a two-step approach for recognizing and measuring uncertain tax positions. The first step is to evaluate the tax position for recognition by determining, based on the technical merits, that the position will more likely than not be sustained upon examination. The second step is to measure the tax benefit as the largest amount of the tax benefit that is greater than 50% likely of being realized upon settlement. We also include interest and penalties related to unrecognized tax benefits within our provision for income tax expense.
Retirement benefits. Contributions to defined contribution plans are charged to the consolidated statements of income in the period in which services are rendered by the covered employees. Current service costs for defined benefit plans are accrued in the period to which they relate. The liability in respect of defined benefit plans is calculated annually using the projected unit credit method. Prior service cost, if any, resulting from an amendment to a plan is recognized and amortized over the remaining period of service of the covered employees. We recognize liabilities for compensated absences depending on whether the obligation is attributable to employee services already rendered, relates to rights that vest or accumulate over time, and payment is probable and estimable.
We record annual amounts relating to defined benefit plans based on calculations that incorporate various actuarial and other assumptions, including discount rates, mortality, assumed rates of return, compensation increases and turnover rates. We review these assumptions on an annual basis and modify the assumptions based on current rates and trends when it is appropriate to do so. The effect of modifications to these assumptions is
50
Table of Contents
recorded in other comprehensive income and amortized to net periodic cost over future periods using the corridor method. We believe that the assumptions used in recording the obligations under our defined benefit plans are reasonable based on historical trends, future expectations and market conditions.
Stock-based compensation expense. We recognize and measure compensation expense for all stock-based awards based on the grant date fair value. For option awards, grant date fair value is determined under the option pricing model (Black-Scholes-Merton model) and for awards other than option awards, grant date fair value is determined on the basis of the fair market value of the Company’s shares on the grant date of such awards. We recognize compensation expense for stock-based awards net of estimated forfeitures. Stock-based compensation recognized in the Consolidated Statements of Income is based on awards ultimately expected to vest. As a result, the expense has been reduced for estimated forfeitures. Forfeitures are estimated at the time of grant and revised, if necessary, in subsequent periods if actual forfeitures differ from those estimates. We amortize the compensation cost on a straight-line basis over the vesting period.
Results of Operations
The following table sets forth certain data from our income statement for the years ended December 31, 2012, 2013 and 2014.
| Year ended December 31, | Percentage Change Increase/(Decrease) |
|||||||||||||||||||
| 2012 | 2013 | 2014 | 2013 vs. 2012 |
2014 vs. 2013 |
||||||||||||||||
| (dollars in millions) | ||||||||||||||||||||
| Net revenues—GE* |
$ | 496.7 | $ | 482.0 | $ | 466.1 | (2.9 | )% | (3.3 | )% | ||||||||||
| Net revenues—Global Clients* |
1,405.3 | 1,649.9 | 1,813.4 | 17.4 | % | 9.9 | % | |||||||||||||
|
|
|
|
|
|
|
|||||||||||||||
| Total net revenues |
1,902.0 | 2,132.0 | 2,279.4 | 12.1 | % | 6.9 | % | |||||||||||||
|
|
|
|
|
|
|
|||||||||||||||
| Cost of revenue |
||||||||||||||||||||
| Services |
1,157.8 | 1,319.6 | 1,378.1 | 14.0 | % | 4.4 | % | |||||||||||||
| Gross profit |
744.2 | 812.4 | 901.4 | 9.2 | % | 10.9 | % | |||||||||||||
| Gross profit margin |
39.1 | % | 38.1 | % | 39.5 | % | ||||||||||||||
| Operating expenses |
||||||||||||||||||||
| Selling, general and administrative expenses |
456.6 | 484.8 | 585.6 | 6.2 | % | 20.8 | % | |||||||||||||
| Amortization of acquired intangible assets |
23.2 | 23.6 | 28.5 | 1.8 | % | 20.7 | % | |||||||||||||
| Other operating (income) expense, net |
0.0 | (5.6 | ) | (6.9 | ) | NM | ** | 23.7 | % | |||||||||||
|
|
|
|
|
|
|
|||||||||||||||
| Income from operations |
264.3 | 309.5 | 294.0 | 17.1 | % | (5.0 | )% | |||||||||||||
| Income from operations as a percentage of total net revenues |
13.9 | % | 14.5 | % | 12.9 | % | ||||||||||||||
| Foreign exchange (gains) losses, net |
(13.1 | ) | (20.8 | ) | 12.4 | 57.9 | % | (159.5 | )% | |||||||||||
| Other income (expense), net |
(14.5 | ) | (24.3 | ) | (27.3 | ) | 67.7 | % | 12.2 | % | ||||||||||
|
|
|
|
|
|
|
|||||||||||||||
| Income before equity-method investment activity, net and income tax expense |
263.0 | 306.0 | 254.4 | 16.3 | % | (16.9 | )% | |||||||||||||
| Loss (gain) on equity method investment activity, net |
(0.0 | ) | (0.2 | ) | 4.8 | NM | ** | (2,937.3 | )% | |||||||||||
|
|
|
|
|
|
|
|||||||||||||||
| Income before income tax expense |
263.0 | 306.2 | 249.6 | 16.4 | % | (18.5 | )% | |||||||||||||
| Income tax expense |
78.4 | 71.1 | 57.4 | (9.3 | )% | (19.2 | )% | |||||||||||||
|
|
|
|
|
|
|
|||||||||||||||
| Net Income |
184.6 | 235.1 | 192.2 | 27.3 | % | (18.2 | )% | |||||||||||||
| Net income attributable to noncontrolling interest |
6.4 | 5.3 | 0.2 | (16.3 | )% | (96.8 | )% | |||||||||||||
|
|
|
|
|
|
|
|||||||||||||||
| Net income attributable to Genpact Limited shareholders |
$ | 178.2 | $ | 229.7 | $ | 192.0 | 28.9 | % | (16.4 | )% | ||||||||||
|
|
|
|
|
|
|
|||||||||||||||
| Net income attributable to Genpact Limited shareholders as a percentage of total net revenues |
9.4 | % | 10.8 | % | 8.4 | % | ||||||||||||||
51
Table of Contents
| * | As described under “Management’s Discussion and Analysis of Financial Condition and Results of Operations—Overview—Classification of Certain Net Revenues,” net revenues from certain businesses in which GE ceased to be a 20% shareholder are classified as a part of GE net revenues up to the time of their divestiture by GE and as a part of Global Client net revenues post-divestiture. Net revenues from GE in the year ended December 31, 2014, after excluding net revenues from such dispositions by GE, decreased by 2.4% from the year ended December 31, 2013. |
| ** | NM = Not Measurable |
Fiscal Year Ended December 31, 2014 Compared to Fiscal Year Ended December 31, 2013
Net revenues. Our net revenues were $2,279.4 million in 2014, up $147.4 million, or 6.9%, from $2,132.0 million in 2013. The growth in net revenues was primarily driven by an increase in business process outsourcing, or BPO, services delivered to our Global Clients, an increase in information technology, or IT, services delivered to both our Global Clients and GE, and by the acquisition of Pharmalink, which we refer to as our “regulatory affairs acquisition,” which contributed $26.1 million to our net revenues in 2014. Adjusted for foreign exchange, which had an adverse impact on our net revenues in 2014, our net revenues grew $168.1 million, or 7.9%, compared to 2013. Our average headcount increased by 8.6% to approximately 64,400 in 2014 from approximately 59,300 in 2013. Our annualized net revenues per employee were $35,900 in 2014, compared to $36,000 in 2013.
| Year ended December 31, | Percentage Change Increase/ (Decrease) |
|||||||||||
| 2013 | 2014 | 2014 vs. 2013 | ||||||||||
| (dollars in millions) | ||||||||||||
| Global Clients: |
||||||||||||
| BPO Services |
$ | 1,231.5 | 1,381.2 | 12.2 | % | |||||||
| IT Services |
418.5 | 432.2 | 3.3 | % | ||||||||
|
|
|
|
|
|||||||||
| Total net revenues from Global Clients |
$ | 1,649.9 | $ | 1,813.4 | 9.9 | % | ||||||
| GE: |
||||||||||||
| BPO Services |
376.8 | 355.5 | (5.6 | )% | ||||||||
| IT Services |
105.3 | 110.6 | 5.0 | % | ||||||||
|
|
|
|
|
|||||||||
| Total net revenues from GE |
$ | 482.0 | $ | 466.1 | (3.3 | )% | ||||||
| Total net revenues from BPO Services |
1,608.2 | 1,736.7 | 8.0 | % | ||||||||
| Total net revenues from IT Services |
523.8 | 542.7 | 3.6 | % | ||||||||
|
|
|
|
|
|||||||||
| Total net revenues |
$ | 2,132.0 | $ | 2,279.4 | 6.9 | % | ||||||
|
|
|
|
|
|||||||||
Net revenues from Global Clients in 2014 were $1,813.4 million, up $163.4 million, or 9.9%, from $1,649.9 million in 2013. This increase was primarily driven by growth in five of our targeted verticals—consumer product goods, life sciences, insurance, capital markets and infrastructure, manufacturing and services—and by revenues derived from our regulatory affairs acquisition. As a percentage of total net revenues, net revenues from Global Clients increased from 77.4% in 2013 to 79.6% in 2014.
Net revenues from GE were $466.1 million in 2014, down $16.0 million, or 3.3%, from 2013, primarily as a result of divestitures made by GE and an expected decline in BPO services delivered to GE, which was partially offset by growth in short-cycle IT and consulting projects. Net revenues from GE declined as a percentage of our total net revenues from 22.6% in 2013 to 20.4% in 2014. Net revenues from GE in 2014, after excluding net revenues from dispositions by GE, decreased 2.4% from 2013.
Net revenues from BPO services for 2014 were $1,736.7 million, up $128.5 million, or 8.0%, from $1,608.2 million in 2013. This increase was primarily attributable to an increase in revenues from our Global Clients—particularly for finance and accounting services, core vertical operations and consulting services—and to our
52
Table of Contents
regulatory affairs acquisition. Net revenues from IT services were $542.7 million in 2014, up $18.9 million, or 3.6%, from $523.8 million in 2013 due to an increase in IT services delivered to both our Global Clients and GE.
Net revenues from BPO services as a percentage of total net revenues increased to 76.2% in 2014 from 75.4% in 2013 with a corresponding decline in the percentage of total net revenues attributable to IT services.
Cost of revenue and gross profit. The following table sets forth the components of our cost of revenue and the resulting gross profit:
| Year Ended December 31, | As a percentage of total net revenues |
|||||||||||||||
| 2013 | 2014 | 2013 | 2014 | |||||||||||||
| (dollars in millions) | ||||||||||||||||
| Personnel expenses |
$ | 904.4 | $ | 943.1 | 42.4 | % | 41.4 | % | ||||||||
| Operational expenses |
367.2 | 390.4 | 17.2 | 17.1 | ||||||||||||
| Depreciation and amortization |
47.9 | 44.5 | 2.2 | 2.0 | ||||||||||||
|
|
|
|
|
|||||||||||||
| Cost of revenue |
$ | 1,319.6 | $ | 1,378.1 | 61.9 | % | 60.5 | % | ||||||||
|
|
|
|
|
|||||||||||||
| Gross Profit |
$ | 812.4 | $ | 901.4 | 38.1 | % | 39.5 | % | ||||||||
Our gross margin increased from 38.1% in 2013 to 39.5% in 2014. This increase is primarily attributable to improved operational efficiencies, including the more effective deployment and use of operations personnel. The increase in gross margin is also attributable to foreign exchange volatility, which causes gains and losses on our foreign currency hedges and has a foreign currency translation impact when we convert our non-U.S. dollar income statement items to the U.S. dollar, our reporting currency. The impact of these factors was partially offset by the effects of wage inflation.
Cost of revenue was $1,378.1 million, up $58.5 million, or 4.4%, from 2013. Of this increase, $18.5 million is attributable to our regulatory affairs acquisition. Wage inflation, an increase in personnel expenses due to an increase in our operational headcount, and increased use of subcontractors for service delivery also contributed to higher cost of revenue in 2014 compared to 2013. These increases were partially offset by lower stock-based compensation costs, the effects of foreign exchange volatility, and the improved operational efficiencies described above in 2014 compared to 2013.
Personnel expenses. Personnel expenses as a percentage of total net revenues decreased from 42.4% in 2013 to 41.4% in 2014, primarily due to improved operational efficiencies, including the more effective deployment and use of operations personnel, the increased use of subcontractors for service delivery, the effects of foreign exchange volatility and a decrease in stock-based compensation expenses. The impact of these factors was partially offset by a $10.6 million increase in personnel expenses attributable to our regulatory affairs acquisition in 2014. Wage inflation and an approximately 3,500-person, or 6.8%, increase in our operational headcount (excluding the regulatory affairs acquisition) also resulted in higher personnel expenses in 2014 compared to 2013. As a result, personnel expenses for 2014 were $943.1 million, up $38.7 million, or 4.3%, from $904.4 million in 2013.
Operational expenses. Operational expenses for 2014 were $390.4 million, up $23.2 million, or 6.3%, from 2013 as a result of the increased use of subcontractors for service delivery and an approximately $7.7 million increase in operational expenses attributable to our regulatory affairs acquisition. Operational expenses as a percentage of total net revenues decreased from 17.2% in 2013 to 17.1% in 2014 primarily due to the effects of foreign exchange volatility.
Depreciation and amortization expenses. Depreciation and amortization expenses as a component of cost of revenue for 2014 were $44.5 million, down $3.4 million, or 7.0%, from 2013. Depreciation and amortization expenses as a percentage of total net revenues declined to 2.0% in 2014 from 2.2% in 2013. These decreases were primarily due to an increase in fully depreciated assets since the end of 2013 at our delivery centers located in India, the U.S. and Europe and to the effects of foreign exchange volatility and were partially offset by
53
Table of Contents
depreciation and amortization expenses resulting from the expansion of certain existing facilities and the addition of new delivery centers in India.
Selling, general and administrative expenses. The following table sets forth the components of our selling, general and administrative, or SG&A, expenses:
| Year Ended December 31, | As a percentage of total net revenues |
|||||||||||||||
| 2013 | 2014 | 2013 | 2014 | |||||||||||||
| (dollars in millions) | ||||||||||||||||
| Personnel expenses |
$ | 347.4 | $ | 419.3 | 16.3 | % | 18.4 | % | ||||||||
| Operational expenses |
129.0 | 157.8 | 6.0 | 6.9 | ||||||||||||
| Depreciation and amortization |
8.4 | 8.6 | 0.4 | 0.4 | ||||||||||||
|
|
|
|
|
|||||||||||||
| Selling, general and administrative expenses |
$ | 484.8 | $ | 585.6 | 22.7 | % | 25.7 | % | ||||||||
|
|
|
|
|
|||||||||||||
SG&A expenses in 2014 were $585.6 million, up $100.8 million, or 20.8%, from 2013. SG&A expenses as a percentage of total net revenues increased from 22.7% in 2013 to 25.7% in 2014. Our sales and marketing expenses in 2014 were $151.5 million, or 25.9% of SG&A expenses, up from $100.8 million, or 20.8% of SG&A expenses, in 2013. SG&A expenses increased primarily as a result of our investments in sales and business development personnel and subject matter experts through the hiring of more than 100 seasoned professionals in our targeted markets—such as the United States and Europe—and industry verticals—namely, banking and financial services, insurance, consumer product goods and life sciences. Wage inflation also contributed to the increase in SG&A expenses in 2014. As a result, our sales and marketing expenses as a percentage of net revenues were approximately 6.6% in 2014, up from approximately 4.7% in 2013.
Of the total increase in SG&A expenses, $5.4 million is attributable to our regulatory affairs acquisition. Additionally, travel costs related to sales and marketing activities and fees for professional services related to strategic initiatives contributed to higher SG&A expenses. These increases were partially offset by a lower reserve for doubtful receivables in 2014 compared to 2013, an expense of $1.1 million in 2013 resulting from the amendment of our credit facility and by the effects of foreign exchange volatility.
Personnel expenses. Personnel expenses as a component of SG&A expenses were $419.3 million in 2014, up $71.9 million, or 20.7%, from 2013. Our sales team personnel expenses increased by approximately 47.6%, primarily driven by the addition of more than 100 client-facing personnel in 2014. Another $3.6 million of the increase is due to our regulatory affairs acquisition. Wage inflation and an increase in our support headcount also resulted in higher personnel costs in 2014 compared to 2013. This increase was partially offset by the effects of foreign exchange volatility. As a result, personnel expenses as a percentage of total net revenues in 2014 were 18.4%, up from 16.3% in 2013.
Operational expenses. Operational expenses as a component of SG&A expenses increased by $28.8 million, or 22.3%, in 2014 compared to 2013. Higher sales and marketing related travel and fees for professional services resulted in higher operational expenses in 2014 compared to 2013. Of this increase, $1.8 million is attributable to our regulatory affairs acquisition. We also incurred acquisition-related expenses of $2.8 million in 2014. These increases were partially offset by an $8.3 million decline in the reserve for doubtful receivables in 2014, an expense of $1.1 million relating to the amendment of our credit facility in 2013, and the effects of foreign exchange volatility. As a result, our operational expenses as a percentage of total net revenues increased from 6.0% in 2013 to 6.9% in 2014.
Depreciation and amortization. Depreciation and amortization expenses as a percentage of total net revenues were 0.4% in 2014, unchanged from 2013. Depreciation and amortization expenses for 2014 were $8.6 million, compared to $8.4 million in 2013. Fully depreciated assets increased since the end of 2013 at our facilities in India, the U.S. and Europe, which, together with the effects of foreign exchange volatility, resulted in lower depreciation in 2014. This decrease was offset by depreciation and amortization expenses resulting from the expansion of certain facilities in India, the addition of new facilities, and the acquisitions we consummated in 2013 and 2014.
54
Table of Contents
Amortization of acquired intangibles. Non-cash charges on account of the amortization of acquired intangibles were $28.5 million in 2014, up $4.9 million from 2013. Our 2014 acquisitions contributed additional amortization expenses of $5.3 million. This increase was partially offset by a decline of $1.0 million in the amortization expense of intangibles arising out of the Company’s 2004 reorganization when we began operating as an independent company. In each case, the amortization was consistent with the applicable estimated useful life of the acquired intangible assets.
Other operating (income) expense, net. The following table sets forth the components of other operating (income) expense, net:
| Year ended December 31, | Percentage Change Increase/(Decrease) |
|||||||||||
| 2013 | 2014 | 2014 vs. 2013 | ||||||||||
| (dollars in millions) | ||||||||||||
| Other operating (income) expense |
$ | (3.3 | ) | $ | (3.2 | ) | (2.9 | )% | ||||
| Provision for impairment of capital work in progress / property, plant and equipment |
2.4 | — | (100.0 | ) | ||||||||
| Change in fair value of earn out consideration and deferred consideration (relating to business acquisitions) |
(4.7 | ) | (3.7 | ) | (20.6 | ) | ||||||
|
|
|
|
|
|||||||||
| Other operating (income) expense, net |
$ | (5.6 | ) | $ | (6.9 | ) | 23.7 | % | ||||
|
|
|
|
|
|||||||||
| Other operating (income) expense, net as a percentage of total net revenues |
(0.3 | )% | (0.3 | )% | ||||||||
Other operating income, net of expenses, was $6.9 million in 2014, up from $5.6 million in 2013. In 2013, we recorded a $2.4 million non-recurring provision for impairment against certain capital assets in India. This was partially offset by a $1.0 million lower gain resulting from changes in the earn-out consideration payable in connection with certain acquisitions.
Income from operations. As a result of the foregoing factors, income from operations decreased by $15.5 million to $294.0 million in 2014 compared to $309.5 million in 2013. As a percentage of net revenues, income from operations decreased from 14.5% in 2013 to 12.9% in 2014.
Foreign exchange (gains) losses, net. We recorded a net foreign exchange loss of $12.4 million in 2014, compared to a net foreign exchange gain of $20.8 million in 2013. The net foreign exchange loss in 2014 is primarily due to the re-measurement of our non-functional currency assets and liabilities and related foreign exchange contracts resulting from the depreciation of the Euro against the U.S. dollar in 2014. The net foreign exchange gain in 2013 is primarily due to the depreciation of the Indian rupee against the U.S. dollar in 2013.
Other income (expense), net. The following table sets forth the components of other income (expense), net:
| Year ended December 31, | Percentage Change Increase/(Decrease) |
|||||||||||
| 2013 | 2014 | 2014 vs. 2013 | ||||||||||
| ((dollars in millions) | ||||||||||||
| Interest income |
$ | 15.7 | $ | 4.4 | (72.0 | )% | ||||||
| Interest expense |
(38.9 | ) | (33.8 | ) | (13.1 | ) | ||||||
| Provision (created) reversed for loss on divestures |
(3.5 | ) | — | (100.0 | ) | |||||||
| Other income |
2.3 | 2.1 | (8.9 | ) | ||||||||
|
|
|
|
|
|||||||||
| Other income (expense), net |
$ | (24.3 | ) | $ | (27.3 | ) | 12.2 | % | ||||
|
|
|
|
|
|||||||||
| Other income (expense), net as a percentage of total net revenues |
(1.1 | )% | (1.2 | )% | ||||||||
Our net other expenses increased by $3.0 million in the year ended 2014 compared to the year ended 2013, primarily on account of higher net interest expense in 2014. This increase was partially offset by a $3.5 million
55
Table of Contents
provision, created in 2013, for losses on the divestitures of Clearbizz B.V. and Gantthead.com, Inc. Our net interest expense increased by $6.3 million as the result of a $5.1 million decrease in interest expense and an $11.3 million decrease in interest income in 2014 compared to 2013. The decrease in interest expense was the result of a $3.1 million expense in June 2013 in connection with the amendment of our credit facility and lower interest expense of $2.1 million in 2014 due to a lower interest rate on our amended facility. The weighted average rate of interest on our debt decreased from 3.8% in 2013 to 3.4% in 2014. Our interest income decreased by $11.3 million in 2014 primarily due to higher account balances in jurisdictions in which we earn lower interest rates during 2014 compared to 2013 and to the non-recurring receipt of interest income on an income tax refund in 2013.
Income before equity method investment, activity, net and income tax expense. As a result of the foregoing factors, income before equity method investment activity, net and income tax expense decreased by $51.6 million in 2014 compared to 2013. As a percentage of net revenues, income before equity method investment activity, net and income tax expense decreased from 14.4% of net revenues in 2013 to 11.2% of net revenues in 2014.
Equity-method investment activity, net. Equity-method investment activity, net in 2014 primarily represents our share of loss from our non-consolidated affiliate, Markit Genpact KYC Services Limited, a joint venture with Markit Group Limited. We entered into this joint venture in 2014. Equity-method investment activity, net in 2013 primarily represents our share of gain from NIIT Uniqua, our joint venture with NIIT.
Income before income tax expense. As a result of the foregoing factors, in particular our increased SG&A expenses and foreign exchange volatility, income before income tax expense decreased by $56.6 million. As a percentage of total net revenues, income before income tax expense decreased from 14.4 % in 2013 to 10.9 % in 2014.
Income tax expense. Our income tax expense decreased from $71.1 million in 2013 to $57.4 million in 2014, representing an effective tax rate, or ETR, of 23.0% in 2014, down from 23.6% in 2013. The improvement in our ETR was primarily driven by the growth of our operations in low-tax and tax-exempt locations, mostly in India.
Net income. As a result of the foregoing factors, net income decreased by $42.9 million from $235.1 million in 2013 to $192.2 million in 2014. As a percentage of net revenues, our net income was 11.0% in 2013 and 8.4 % in 2014.
Net income attributable to noncontrolling interest. Noncontrolling interest primarily refers to profit or loss associated with the noncontrolling partners’ interest in the operations of Genpact Netherlands B.V. and the noncontrolling shareholders’ interest in the operations of Hello Communications (Shanghai) Co., Ltd. Net income attributable to noncontrolling interest decreased from $5.3 million in 2013 to $0.2 million in 2014. This decrease was the result of our purchase of the noncontrolling interests in Genpact Netherlands B.V. in the third quarter of 2014, over which we now have 100% control, and to our divestiture of Hello Communications (Shanghai) Co. Ltd. in February 2013.
Net income attributable to Genpact Limited common shareholders. As a result of the foregoing factors, net income attributable to Genpact Limited common shareholders decreased by $37.7 million from $229.7 million in 2013 to $192.0 million in 2014. As a percentage of net revenues, our net income was 10.8% in 2013 and 8.4% in 2014.
Fiscal Year Ended December 31, 2013 Compared to Fiscal Year Ended December 31, 2012
Net revenues. Our net revenues were $2,132.0 million in 2013, up $230.0 million, or 12.1%, from $1,902.0 million in 2012. The growth in net revenues was primarily due to an increase in BPO and IT services delivered to our Global Clients and acquisitions completed during 2012 and 2013. Approximately $126.0 million,
56
Table of Contents
or 54.8%, of the growth in our 2013 net revenues came from client relationships that began prior to 2013. Our average headcount increased by 4.9% to approximately 59,300 in 2013 from approximately 56,500 in 2012. Our annualized net revenues per employee were $36,000 in 2013, up from $34,000 in 2012.
| Year Ended December 31, | Percentage Change Increase/ (Decrease) |
|||||||||||
| 2012 | 2013 | 2013 vs. 2012 | ||||||||||
| (dollars in millions) | ||||||||||||
| BPO |
$ | 1,456.2 | $ | 1,608.2 | 10.4 | % | ||||||
| IT |
445.8 | 523.8 | 17.5 | |||||||||
|
|
|
|
|
|||||||||
| Total Net Revenues |
$ | 1,902.0 | $ | 2,132.0 | 12.1 | % | ||||||
|
|
|
|
|
|||||||||
BPO revenues for 2013 were $1,608.2 million, up $152.1 million, or 10.4%, from $1,456.2 million in 2012, led by revenues from our Global Clients and the acquisitions of Accounting Plaza, the Triumph Companies and Atyati. Growth in BPO services included a $15.3 million increase in our analytics, business and enterprise risk consulting, and re-engineering services revenues from Global Clients. Net revenues from IT services were $523.8 million in 2013, up $78.0 million, or 17.5%, from $445.8 million in 2012, primarily driven by revenues from our Global Clients and the acquisition of the Jawood Business.
Net revenues from IT services as a percentage of total net revenues increased to 24.6% in 2013 from 23.4% in 2012. BPO revenues as a percentage of total net revenues decreased to 75.4% in 2013 from 76.6% in 2012.
| Year Ended December 31, | Percentage Change Increase/ (Decrease) |
|||||||||||
| 2012 | 2013 | 2013 vs. 2012 | ||||||||||
| (dollars in millions) | ||||||||||||
| GE |
$ | 496.7 | $ | 482.0 | -2.9 | % | ||||||
| Global Clients |
1,405.3 | 1,649.9 | 17.4 | |||||||||
|
|
|
|
|
|||||||||
| Total Net Revenues |
$ | 1,902.0 | $ | 2,132.0 | 12.1 | % | ||||||
|
|
|
|
|
|||||||||
Net revenues from Global Clients for 2013 were $1,649.9 million, up $244.6 million, or 17.4%, from $1,405.3 million in 2012. Of this increase, $60.9 million, or 24.9%, was from clients in the banking and financial services industries. Another $56.6 million, or 23.1%, of the increase came from clients in the consumer product goods, retail and life sciences industries. $48.4 million, or 19.8%, of the increase came from clients in the healthcare industry, including IT services revenue from the acquisition of the Jawood Business. Additionally, $31.5 million, or 12.9%, and $22.2 million, or 9.1%, of total increase in Global Clients net revenues came from the infrastructure, manufacturing and services (IMS) and insurance verticals, respectively. As a percentage of total net revenues, net revenues from Global Clients increased from 73.9% in 2012 to 77.4% in 2013.
Net revenues from GE were $482.0 million in 2013, down $14.6 million, or 2.9%, from 2012, primarily as a result of divestitures by GE. As described under “Management’s Discussion and Analysis of Financial Condition and Results of Operation—Overview—Classification of Certain Net Revenues,” certain businesses in which GE ceased to be a 20% shareholder in 2013 were classified as a part of GE net revenues up to the time of their divestiture by GE and as a part of Global Clients net revenues post-divestiture. Net revenues from GE in 2013 decreased by 0.6% from 2012 after excluding net revenues from such dispositions by GE, primarily as a result of productivity improvements in the services delivered to GE. Net revenues from GE declined as a percentage of our total net revenues from 26.1% in 2012 to 22.6% in 2013.
57
Table of Contents
Cost of revenue and gross profit. The following table sets forth the components of our cost of revenue and the resulting gross profit:
| Year Ended December 31, | As a Percentage of Total Net Revenues |
|||||||||||||||
| 2012 | 2013 | 2012 | 2013 | |||||||||||||
| (dollars in millions) | ||||||||||||||||
| Personnel expenses |
$ | 795.5 | $ | 904.4 | 41.8 | % | 42.4 | % | ||||||||
| Operational expenses |
313.4 | 367.2 | 16.5 | 17.2 | ||||||||||||
| Depreciation and amortization |
48.8 | 47.9 | 2.6 | 2.2 | ||||||||||||
|
|
|
|
|
|||||||||||||
| Cost of revenue |
$ | 1,157.8 | $ | 1,319.6 | 60.9 | % | 61.9 | % | ||||||||
|
|
|
|
|
|||||||||||||
| Gross Profit |
$ | 744.20 | $ | 812.4 | 39.1 | % | 38.1 | % | ||||||||
Cost of revenue as a percentage of total net revenues increased from 60.9% in 2012 to 61.9% in 2013 primarily due to wage inflation and an expanded onshore presence resulting primarily from our 2012 acquisition of Accounting Plaza and our 2013 acquisition of the Jawood Business. This was partially offset by higher operational efficiencies in 2013.
Cost of revenue was $1,319.6 million, up $161.8 million, or 14.0%, from 2012. Of this increase, $65.4 million is attributable to acquisitions completed during 2012 and 2013 and approximately $42.1 million is due to higher headcount in 2013 to manage growth. The impact of wage inflation along with an increase in operational expenses also contributed to a higher cost of revenue in 2013 compared to 2012.
Personnel expenses. The impact of wage inflation and a higher onshore presence relating to acquisitions completed in 2012 and 2013 resulted in an increase in personnel expenses as a percentage of total net revenues from 41.8% in 2012 to 42.4% in 2013. Personnel expenses for 2013 were $904.4 million, up $108.9 million, or 13.7%, from 2012. Approximately $43.8 million of this increase is attributable to acquisitions completed during 2012 and 2013. To manage additional growth, our average operational headcount, excluding these acquisitions, increased by approximately 2,600 employees, or 5.4%, in 2013 compared to 2012. This increase, along with the impact of wage inflation, resulted in an increase in personnel expense in 2013 compared to 2012, which was partially offset by higher operational efficiencies in 2013.
Operational expenses. Operational expenses as a percentage of total net revenues increased from 16.5% in 2012 to 17.2% in 2013, primarily due to the use of subcontractors for service delivery by companies we acquired in 2012 and 2013 and higher infrastructure and IT related expenses. Operational expenses for 2013 were $367.2 million, up $53.8 million, or 17.2%, from 2012. Of this increase, approximately $20.6 million, or 38.4%, is attributable to acquisitions completed during 2012 and 2013. Additionally, we incurred higher facility and infrastructure related expenses in 2013 in connection with the expansion of our existing facilities and opening new delivery centers in India, Europe and the U.S., which contributed to approximately 22.3% of the increase. The balance of the increase is attributable to higher communication and consulting expenses in 2013 compared to 2012.
Depreciation and amortization expenses. Depreciation and amortization expenses as a percentage of total net revenues declined to 2.2% in 2013 from 2.6% in 2012 primarily due to an increase in fully depreciated assets since the end of 2012 at our delivery centers located in India, the Philippines and Europe. As a component of cost of revenue, depreciation and amortization expenses for 2013 were $47.9 million, down $0.9 million, or 1.8%, from 2012. This decrease was due to the impact of fully depreciated assets since the end of 2012. The decrease was partially offset by depreciation and amortization expenses resulting from the expansion of certain existing facilities, the addition of new delivery centers and from acquisitions completed in 2012 and 2013.
As a result of the foregoing, our gross profit increased by $68.2 million, or 9.2%, in 2013 compared to 2012 and our gross margin decreased from 39.1% in 2012 to 38.1% in 2013.
58
Table of Contents
Selling, general and administrative expenses. The following table sets forth the components of our selling, general and administrative, or SG&A, expenses:
| Year Ended December 31, | As a Percentage of Total Net Revenues |
|||||||||||||||
| 2012 | 2013 | 2012 | 2013 | |||||||||||||
| (dollars in millions) | ||||||||||||||||
| Personnel expenses |
$ | 314.6 | $ | 347.4 | 16.5 | % | 16.3 | % | ||||||||
| Operational expenses |
133.2 | 129.0 | 7.0 | 6.0 | ||||||||||||
| Depreciation and amortization |
8.9 | 8.4 | 0.5 | 0.4 | ||||||||||||
|
|
|
|
|
|||||||||||||
| Selling, general and administrative expenses |
$ | 456.6 | $ | 484.8 | 24.0 | % | 22.7 | % | ||||||||
|
|
|
|
|
|||||||||||||
SG&A expenses as a percentage of total net revenue declined from 24.0% in 2012 to 22.7% in 2013 due to increased productivity represented by a lower support headcount and reduced travel and living expenses. In addition, our 2012 and 2013 acquisitions have lower SG&A expenses as a percentage of revenue owing to synergies achieved post-integration, and there was a non-recurring expense of $6.2 million in 2012 in connection with the 2012 Recapitalization. The above factors, resulting in a decline in SG&A expenses as percentage of revenue for 2013 compared to 2012, were partially offset by the impacts of wage inflation and a higher reserve for doubtful debts created in 2013.
SG&A expenses for 2013 were $484.8 million, up $28.2 million, or 6.2%, from 2012. Of this increase, $12.4 million is attributable to acquisitions completed during 2012 and 2013. Additionally, the investment in front-end sales and relationship management teams through the hiring, primarily in the second half of 2013, of more experienced and higher cost resources in our targeted industry verticals, namely banking and financial services, insurance, consumer product goods, life sciences and healthcare, along with the effect of wage inflation, contributed to higher SG&A expenses. The increase in SG&A expenses was also due to a higher reserve for doubtful debts created in 2013. The increase in SG&A expenses was partially offset by a net reduction in our average headcount in 2013 along with a reduction in travel and consulting expenses through optimal use of collaborative tools and efficiencies leading to lower general and administrative expenses in 2013. SG&A expenses for 2012 also included one-time legal and consultancy fees of $6.2 million incurred in connection with the 2012 Recapitalization, which was partially offset by an expense of $1.1 million in 2013 resulting from the amendment of our credit facility as described below in the section titled “Financial Condition.”
Personnel expenses. Personnel expenses as a percentage of total net revenues in 2013 were 16.3%, compared to 16.5% in 2012. This decline was primarily due to a net reduction in our average support headcount in 2013 compared to 2012 and lower SG&A expenses as a percentage of revenue in our acquisitions completed in 2012 and 2013. Personnel expenses as a component of SG&A expenses were $347.4 million in 2013, up $32.8 million, or 10.4%, from 2012. Of this increase, $9.0 million is attributable to the acquisitions completed during 2012 and 2013. Further, investments in front-end sales and relationship management teams to generate revenue growth, including the hiring, primarily in the second half of 2013, of more experienced and higher-cost resources in our targeted industry verticals, namely banking and financial services, insurance, consumer product goods, life sciences and healthcare, combined with the impact of wage inflation, resulted in a 7.1% increase in sales team personnel expenses. This increase was partially offset by a net reduction in our average headcount in 2013.
Operational expenses. Operational expenses as a percentage of total net revenues decreased from 7.0% in 2012 to 6.0% in 2013 due to lower operational expenses as a percentage of revenue in acquisitions completed in 2012 and 2013, lower travel, facility and infrastructure related expenses resulting from optimal use of collaborative tools, higher utilization of our facilities in 2013 and one-time legal and consultancy fees of $6.2 million incurred in 2012 in connection with the 2012 Recapitalization. These were partially offset by a higher reserve for doubtful debts of $6.6 million with respect to certain aged outstanding balances created in 2013. As a result of the above factors, our operational expenses as a component of SG&A expenses decreased by $4.2 million, or 3.1%, in 2013 compared to 2012.
59
Table of Contents
Depreciation and amortization. Depreciation and amortization expenses as a percentage of total net revenues declined to 0.4% in 2013 from 0.5% in 2012, primarily due to an increase in fully depreciated assets since the end of 2012 at our delivery centers located in India, the Philippines and Europe. As a component of SG&A expenses, depreciation and amortization expenses for 2013 were $8.4 million, down $0.5 million from 2012. This decrease was due to the impact of fully depreciated assets since the end of 2012 and was partially offset by depreciation and amortization expenses resulting from the expansion of certain existing facilities, the addition of new delivery centers and from acquisitions completed in 2012 and 2013.
Amortization of acquired intangibles. Non-cash charges on account of amortization of acquired intangibles were $23.6 million in 2013, up $0.4 million from 2012. The acquisitions completed during 2011, 2012 and 2013 resulted in additional amortization expenses of $4.3 million. This increase was partially offset by a decline of $3.9 million in the amortization expense of intangibles arising out of Company’s 2004 reorganization when we began operating as an independent company. In each case, the amortization was consistent with the applicable estimated useful life of the acquired intangible assets.
Other operating (income) expense, net. The following table sets forth the components of other operating (income) expense, net:
| Year ended December 31, | Percentage Change Increase/(Decrease) |
|||||||||||
| 2012 | 2013 | 2013 vs. 2012 | ||||||||||
| (dollars in millions) | ||||||||||||
| Other operating (income) expense |
$ | (3.2 | ) | $ | (3.3 | ) | 2.3 | % | ||||
| Provision for impairment of capital work in progress / property, plant and equipment |
6.2 | 2.4 | (61.8 | ) | ||||||||
| Change in fair value of earn out consideration and deferred consideration (relating to business acquisitions) |
(3.0 | ) | (4.7 | ) | 55.0 | |||||||
|
|
|
|
|
|||||||||
| Other operating (income) expense, net |
$ | 0.0 | $ | (5.6 | ) | (34,825 | )% | |||||
|
|
|
|
|
|||||||||
| Other operating (income) expense, net as a percentage of total net revenues |
0.0 | % | (0.3 | )% | ||||||||
Other operating income, net of expenses, for 2013 was $5.6 million, compared to $0.02 million of expenses (net of income) for 2012. This increase in income is due to a non-recurring provision for impairment in 2013 of $2.4 million against certain capital assets compared to a $6.2 million provision in 2012. These provisions were made against assets that are no longer strategic to our growth. Further, in 2013, there was gain of $4.7 million as a result of a change in the fair value of earn-out consideration relating to the acquisitions of the Triumph Companies, Atyati, Empower and HPP compared to $3.0 million of gain in 2012 resulting from a change in the fair value of earn-out consideration relating to the acquisitions of Empower, Akritiv, Atyati and HPP.
Income from operations. As a result of the foregoing factors, income from operations increased by $45.2 million to $309.5 million in 2013 compared to $264.3 million in 2012. As a percentage of net revenues, income from operations increased from 13.9% in 2012 to 14.5% in 2013.
Foreign exchange (gains) losses, net. We recorded a net foreign exchange gain of $20.8 million in 2013, compared to a net foreign exchange gain of $13.1 million in 2012, primarily due to the re-measurement of our non-functional currency assets and liabilities and related foreign exchange contracts resulting from depreciation of the Indian rupee against the U.S. dollar in 2013 compared to 2012.
60
Table of Contents
Other income (expense), net. The following table sets forth the components of other income (expense), net:
| Year ended December 31, | Percentage Change Increase/(Decrease) |
|||||||||||
| 2012 | 2013 | 2013 vs. 2012 | ||||||||||
| (dollars in millions) | ||||||||||||
| Interest income |
$ | 12.0 | $ | 15.7 | 31.1 | % | ||||||
| Interest expense |
(28.1 | ) | (38.9 | ) | 38.2 | |||||||
| Provision (created) /reversed for loss on divestures |
(0.5 | ) | (3.5 | ) | 659.7 | |||||||
| Other income |
2.1 | 2.3 | 11.8 | |||||||||
|
|
|
|
|
|||||||||
| Other income (expense), net |
$ | (14.5 | ) | $ | (24.3 | ) | 67.7 | % | ||||
|
|
|
|
|
|||||||||
| Other income (expense), net as a percentage of total net revenues |
(0.8 | )% | (1.1 | )% | ||||||||
An increase in interest expense was the primary cause of the increase in our net other expense. Our interest expense increased by $13.7 million due to the $675.0 million term loan obtained in August 2012, which had a full year impact in 2013 compared to a single quarter impact in 2012, and an increase in the weighted average rate of interest from 3.2% in 2012 to 3.8% in 2013 due to a higher rate of interest under the August 2012 credit facility compared to the May 2011 facility. The increase in net other expenses in 2013 is also attributable to a loss of $3.5 million in connection with the divestitures of Clearbizz B.V. and Gantthead.com, Inc. This increase was partially offset by expenses of $5.5 million in 2012 due to the accelerated amortization of a debt issuance cost related to the prepayment and termination of our prior credit facility in August 2012, compared to $3.2 million of such expenses related to the amendment of the August 2012 credit facility in June 2013. The increase in net other expenses was also offset by higher interest income of $15.7 million in 2013 compared to $12.0 million in 2012, primarily as a result of higher deposits in India and the non-recurring receipt of interest income on an income tax refund in 2013.
Income before equity method investment, activity, net and income tax expense. As a result of the foregoing factors, income before equity method investment activity, net and income tax expense increased by $43.0 million in 2013 compared to 2012. As a percentage of net revenues, income before equity method investment activity, net and income tax expense increased from 13.8% of net revenues in 2012 to 14.4% of net revenues in 2013.
Equity-method investment activity, net. Equity-method investment activity, net represents our share of gain or loss from our non-consolidated affiliates, NGEN Media Services Private Limited, a joint venture with NDTV Networks Plc. and NIIT Uniqua, a joint venture with NIIT, one of the largest training institutes in Asia. In March 2013, we acquired the remaining equity interest in NGEN.
Income before income tax expense. As a result of the foregoing factors, income before income tax expense increased by $43.1 million. As a percentage of net revenues, income before income tax expense increased from 13.8% of net revenues in 2012 to 14.4% of net revenues in 2013.
Income tax expense. Our income tax expense decreased from $78.4 million in 2012 to $71.1 million in 2013, representing an effective tax rate, or ETR, of 23.6% in 2013, down from 30.6% in 2012. The improvement in our ETR was primarily driven by the growth of our operations in low-tax and tax-exempt locations, mostly in India, and by the impact of certain period items in 2012 relating to our 2012 Recapitalization, such as withholding taxes and non-deductible expenses.
Net income. As a result of the foregoing factors, net income increased by $50.5 million from $184.6 million in 2012 to $235.1 million in 2013. As a percentage of net revenues, our net income was 9.7% in 2012 and 11.0% in 2013.
Net income attributable to noncontrolling interest. Noncontrolling interest primarily refers to profit or loss associated with the noncontrolling partners’ interest in the operations of Genpact Netherlands B.V. and the noncontrolling shareholders’ interest in the operations of Hello Communications (Shanghai) Co., Ltd. Net
61
Table of Contents
income attributable to noncontrolling interest decreased from $6.4 million in 2012 to $5.3 million in 2013. This decrease was primarily driven by the divestiture of Hello Communications (Shanghai) Co. Ltd. in the first quarter of 2013.
Net income attributable to Genpact Limited common shareholders. As a result of the foregoing factors, net income attributable to Genpact Limited common shareholders increased by $51.5 million from $178.2 million in 2012 to $229.7 million in 2013. As a percentage of net revenues, our net income was 9.4% in 2012 and 10.8% in 2013.
Seasonality
Our financial results may vary from period to period. Our revenues are typically higher in the third and fourth quarters than in other quarters, as a result of several factors. We generally find that demand for short-term IT projects, re-engineering services and analytics services increases in the fourth quarter as our clients utilize the balance of their budgets for the year. In addition, contracts for long-term IT Services and BPO engagements are often signed in the first and second quarters as clients begin new budget cycles. Volumes under such contracts then increase in the latter part of the year. Additionally, demand for certain services, such as collections and transaction processing, is often greater in the second half of the year as our clients’ volumes in such areas increase.
The following table presents unaudited quarterly financial information for each of our last eight fiscal quarters on a historical basis. We believe the quarterly information contains all adjustments necessary to fairly present this information. The comparison of results for the first quarter of 2014 with the fourth quarter of 2013 reflects the foregoing factors. The results for any interim period are not necessarily indicative of the results that may be expected for the full year.
| Three months ended | ||||||||||||||||
| March 31, 2014 |
June 30, 2014 |
September 30, 2014 |
December 31, 2014 |
|||||||||||||
| (dollars in millions) | ||||||||||||||||
| Statement of income data |
||||||||||||||||
| Total net revenues |
$ | 528.2 | $ | 561.6 | $ | 588.1 | $ | 601.5 | ||||||||
| Cost of revenue |
324.3 | 340.1 | 354.5 | 359.2 | ||||||||||||
| Gross profit |
203.9 | 221.5 | 233.6 | 242.3 | ||||||||||||
| Income from operations |
77.2 | 73.1 | 72.9 | 70.9 | ||||||||||||
| Income before Equity method investment activity, net and income tax expense |
67.1 | 62.7 | 61.8 | 62.8 | ||||||||||||
| Net income attributable to Genpact Limited common shareholders |
$ | 50.6 | $ | 49.0 | $ | 46.7 | $ | 45.8 | ||||||||
| Three months ended | ||||||||||||||||
| March 31, 2013 |
June 30, 2013 |
September 30, 2013 |
December 31, 2013 |
|||||||||||||
| (dollars in millions) | ||||||||||||||||
| Statement of income data |
||||||||||||||||
| Total net revenues |
$ | 503.8 | $ | 534.8 | $ | 534.9 | $ | 558.5 | ||||||||
| Cost of revenue |
311.7 | 332.7 | 329.3 | 345.8 | ||||||||||||
| Gross profit |
192.1 | 202.1 | 205.6 | 212.6 | ||||||||||||
| Income from operations |
73.9 | 78.0 | 86.0 | 71.6 | ||||||||||||
| Income before Equity method investment activity, net and income tax expense |
65.5 | 84.6 | 93.3 | 62.6 | ||||||||||||
| Net income attributable to Genpact Limited common shareholders |
$ | 46.7 | $ | 63.9 | $ | 70.3 | $ | 48.8 | ||||||||
62
Table of Contents
Liquidity and Capital Resources
Overview
Information about our financial position as of December 31, 2013 and 2014 is presented below:
| Year ended December 31, | Percentage Change Increase/(Decrease) |
|||||||||||
| 2013 | 2014 | 2014 vs. 2013 | ||||||||||
| (dollars in millions) | ||||||||||||
| Cash and cash equivalents |
$ | 571.3 | $ | 461.8 | (19.2 | )% | ||||||
| Short-term borrowings |
— | 135.0 | NM | * | ||||||||
| Current portion of long term debt |
4.3 | 4.3 | 0.6 | |||||||||
| Long term debt, less current portion |
653.6 | 649.3 | (0.7 | ) | ||||||||
| Genpact Limited shareholder’s equity |
$ | 1,322.7 | $ | 1,285.1 | (2.8 | )% | ||||||
| * | NM = Not Measurable |
Financial Condition
We have historically financed our operations and our expansion, including acquisitions, with cash from operations and borrowing facilities. In 2014, we purchased our common shares for an aggregate cash amount of approximately $302.6 million pursuant to a modified “Dutch Auction” self-tender offer.
Our cash and cash equivalents were $461.8 million as of December 31, 2014, compared to $571.3 million as of December 31, 2013. Our cash and cash equivalents are comprised of (a) $331.2 million in cash in current accounts across all operating locations to be used for working capital and immediate capital requirements and (b) $130.6 million in deposits with banks to be used for medium-term planned expenditures and capital requirements. We held no short-term deposits as of December 31, 2014 and December 31, 2013.
As of December 31, 2014, $454.0 million of the $461.8 million of cash and cash equivalents was held by our foreign (non-Bermuda) subsidiaries. $9.1 million of this cash is held by a foreign subsidiary for which the Company expects to incur and has accrued a deferred tax liability on the repatriation of $8.0 million of retained earnings. $106.4 million of the cash and cash equivalents held by our foreign subsidiaries is held in jurisdictions where no tax is expected to be imposed upon repatriation.
We expect that in the future our cash from operations, cash reserves and debt capacity will be sufficient to finance our operations as well as our growth and expansion plans. Our working capital needs are primarily to finance our payroll and other administrative and information technology expenses in advance of the receipt of accounts receivable. Our capital requirements include opening new delivery centers and financing acquisitions.
Cash flows from operating, investing and financing activities, as reflected in our Consolidated Statements of Cash Flows, are summarized in the following table:
| Year ended December 31, | Percentage Change Increase/(Decrease) |
|||||||||||
| 2013 | 2014 | 2014 vs. 2013 | ||||||||||
| (dollars in millions) | ||||||||||||
| Net cash provided by (used for) |
||||||||||||
| Operating activities |
$ | 311.6 | $ | 271.8 | (12.8 | )% | ||||||
| Investing activities |
(78.4 | ) | (192.8 | ) | 145.8 | |||||||
| Financing activities |
(65.3 | ) | (177.4 | ) | 171.5 | |||||||
|
|
|
|
|
|||||||||
| Net increase (decrease) in cash and cash equivalents |
$ | 167.8 | $ | (98.4 | ) | (158.6 | )% | |||||
|
|
|
|
|
|||||||||
Cash flows from operating activities. Our net cash generated from operating activities was $271.8 million in 2014, compared to $311.6 million in 2013. This decrease in cash flow from operating activities primarily resulted from a $49.1 million decrease in our net income adjusted for depreciation and amortization and other
63
Table of Contents
non-cash items mainly due to our investments in sales and marketing described above and the $17.5 million impact of foreign exchange fluctuations. Further, upfront investments in certain large deals resulted in additional cash outflow of approximately $11.0 million in 2014. We also paid an intercompany dividend distribution tax of $5.0 million in 2014 compared to the receipt of a one-time tax refund in 2013. The increased outflow was partially offset by the improved collection of client receivables in 2014 compared to 2013, resulting in a $36.7 million lower investment in accounts receivable. Our days sales outstanding were 79 days as of December 31, 2014 compared to 81 days as of December 31, 2013.
Cash flows from investing activities. Our net cash used for investing activities was $192.8 million in 2014, compared to $78.4 million in 2013. This increase in net cash used for investing activities was primarily due to the payment of $130.8 million, net of cash acquired, for acquisitions consummated in 2014, compared to the payment of $49.2 million in 2013, net of cash acquired, for the acquisitions consummated during that period. The balance of the increase in net cash used for investing activities was due to higher payments for purchases of property, plant and equipment (net of sales proceeds) of $62.0 million in 2014 compared to $45.4 million in 2013 and $14.2 million more in short-term deposit redemptions (net of placements) in 2013 than in 2014.
Cash flows from financing activities. Our net cash used for financing activities was $177.4 million in 2014, compared to $65.3 million in 2013. This increase was primarily due to the payment of $302.6 million for our April 2014 purchase of Company common shares and related expenses of $2.5 million. Lower proceeds from the issuance of common shares under stock-based compensation plans in 2014 also accounted for a $15.7 million reduction in cash inflows in 2014 compared to 2013. Additionally, payments for net settlement of stock-based awards were $16.7 million higher in 2014 than in 2013. The impact of these items on cash flows was offset by higher proceeds from short-term borrowings (net of repayments) of $135.0 million in 2014 compared to the repayment of short-term borrowings (net of proceeds) of $80.0 million in 2013 and by the payment of $8.1 million in expenses relating to the amendment of our credit facility in 2013.
Financing Arrangements (Credit Facility)
Total long-term debt, net of debt issuance cost excluding capital lease obligations, was $653.6 million as of December 31, 2014, compared to $657.9 million as of December 31, 2013 and $661.9 million as of December 31, 2012.
The weighted average rate of interest with respect to outstanding long-term loans under our credit facility was 3.2%, 3.8% and 3.4% for the years ended December 31, 2012, 2013 and 2014, respectively.
On August 30, 2012, we fully prepaid and terminated our credit facility of $380.0 million, which we obtained in May 2011, and entered into a credit agreement with a total borrowing limit of $925.0 million, consisting of a $675.0 million term loan and a $250.0 million revolving credit facility. Borrowings under the 2012 credit agreement bear interest at a rate of LIBOR (LIBOR floor of 1%) plus a margin of 3.25% on the term loan and LIBOR plus a margin of 3.25% on the funded revolver. The unutilized amount on the revolving facility bears a commitment fee of 0.50%. Under the 2012 credit agreement, we could borrow additional funds without approval from the lenders to the extent our consolidated net leverage ratio did not exceed 2.25. In addition, we had to comply with certain covenants pertaining to our leverage ratio. For the year ended December 31, 2012, we were in compliance with all of the financial covenants and material undertakings described above.
In June 2013, we amended the August 2012 credit facility. Under the amended facility, the applicable margin on the term loan and revolving credit facility was reduced from 3.25% to 2.75% and 2.50%, respectively. In addition, the LIBOR floor on the term loan was reduced from 1% under the earlier facility to 0.75% under the amended credit facility. The amendment did not result in a substantial modification to $553.6 million of the term loan then outstanding. Further, as a result of the amendment we extinguished $118.0 million of the outstanding term loan and obtained additional funding amounting to $121.4 million, thereby increasing the total term loan outstanding to $675.0 million. The amount outstanding on the term loan as of December 31, 2014 will be repaid through quarterly payments of 0.25% of the principal amount of $675.0 million, and the balance will be paid upon the maturity of the term loan on August 30, 2019. For the years ended December 31, 2013 and December 31, 2014, we were in compliance with all of the financial covenants and material undertakings of the amended credit facility.
64
Table of Contents
Our short-term credit facility will expire in August 2017. The funded drawdown amount bears interest at LIBOR plus a margin of 2.50% as of both December 31, 2013 and December 31, 2014. The unutilized amount on the facility bears a commitment fee of 0.50%. Indebtedness under these facilities is secured by certain assets of the Company, and the credit agreement contains certain covenants, including a maximum leverage covenant that becomes effective only if the revolving facility is drawn for $50.0 million or more.
We finance our short-term working capital requirements through cash flows from operations and credit facilities from banks and financial institutions. As of each of December 31, 2014 and December 31, 2013, short-term credit facilities available to us aggregated $250.0 million and are governed by the same agreement as our refinanced long-term credit facility. There was no change in the overall borrowing capacity under the revolving loan facility as a result of the amendment to our credit facility. As of December 31, 2013 and December 31, 2014, a total of $4.4 million and $137.2 million, respectively, was utilized, of which $0 and $135.0 million, respectively, constituted funded drawdown and $4.4 million and $2.2 million, respectively, constituted non-funded drawdown.
As of December 31, 2012, short-term credit facilities available to us aggregated $250.0 million. Of this, as of December 31, 2012, $87.4 million was utilized, of which $80.0 million constituted funded drawdown and $7.4 million constituted non-funded drawdown.
In addition, we have fund-based and non-fund-based credit facilities with banks that are available for operational requirements in the form of overdrafts, letters of credit, guarantees and short-term loans. As of December 31, 2013 and December 31, 2014, the limits available were $13.9 million and $14.3 million, respectively, of which $6.7 million and $8.1 million, was utilized, constituting non-funded drawdown. As of December 31, 2012, we had fund-based and non-fund-based credit facilities with banks for operational requirements amounting to $18.4 million and $18.5 million, respectively, of which a total of $5.9 million was utilized as of December 31, 2012, constituting non-funded drawdown.
On January 27, 2015, we entered into a credit agreement under which we obtained two term loans in an aggregate amount of $672.5 million. The loans, which were repaid on January 30, 2015, were used in connection with the consummation of certain internal reorganization transactions. Borrowings under the credit agreement bore interest at a rate equal to 2.00% per annum.
Goodwill Impairment Testing
Goodwill of a reporting unit is tested for impairment at least annually and between annual tests if an event occurs or circumstances change that would more likely than not reduce the fair value of the reporting unit below its carrying amount. In accordance with ASU 2011-08, the Company has an option to perform an assessment of qualitative factors, such as macro-economic conditions, industry and market considerations, overall financial performance, business plans and expected future cash flows, to determine whether events or circumstances exist which lead to a determination that it is more likely than not that the fair value of a reporting unit is less than its carrying amount. Based on our assessment of such qualitative factors, we concluded that the fair values of all of our reporting units are likely to be higher than their respective carrying values as of December 31, 2014.
In line with our long term strategy and focus for the business, during the year ended December 31, 2013, we decided to integrate with our Headstrong reporting unit a portion of the IT business within our India reporting unit. This integration enabled us to leverage business experience, knowledge, and resources more effectively and to provide a global service delivery model. Therefore, goodwill attributable to the IT business included in our India reporting unit prior to and including the year ended December 31, 2012 is being reported as a component of our Headstrong reporting unit beginning with the year ended December 31, 2013. As a result of this change, we tested the goodwill of each of the India reporting unit, the transferred IT business and the Headstrong reporting unit before and after such integration and concluded that the fair value of each such reporting unit or portion thereof, calculated using a discounted cash flow model, exceeded its respective book value. In the year ended December 31, 2013, the Company performed an assessment of qualitative factors to determine whether events or
65
Table of Contents
circumstances exist that may lead to a determination that it is more likely than not that the fair value of a reporting unit is less than its carrying amount. Based on such assessment, the Company concluded, with respect to all reporting units other than the Americas and Headstrong, that it is not more likely than not that the fair value of any such reporting unit is less than its carrying amount. For our Headstrong and Americas reporting units, we conducted a quantitative assessment to determine if their fair values are less than their respective carrying amounts. Determining, through a quantitative approach, whether an impairment has occurred requires valuation of the respective reporting units, which we estimate using a discounted cash flow model. The fair valuation of a reporting unit is judgmental in nature and involves the use of significant estimates and assumptions. While we believe that our estimates and assumptions are reasonable at the time they are made, they are unpredictable and inherently uncertain, and, accordingly, actual results may differ from such estimates. Our estimates and assumptions included revenue growth rates and operating margins to calculate projected future cash flows, risk-adjusted discount rates, and terminal growth rates. We derived our discount rate using the capital asset pricing model to estimate the weighted average cost of capital relevant to our reporting units. We used a discount rate that is commensurate with the risks and uncertainties in the business and our internally developed forecasts. Based on the results of our quantitative assessment we determined that the fair values of the Headstrong and Americas reporting units exceeded their carrying values by at least 54% as of December 31, 2013.
Off-Balance Sheet Arrangements
Our off-balance sheet arrangements consist of foreign exchange contracts and certain operating leases. For additional information, see the Risk Factor entitled “Currency exchange rate fluctuations in various currencies in which we do business, especially the Indian rupee and the U.S. dollar, could have a material adverse effect on our business, results of operations and financial condition,” the section titled “Contractual Obligations” below, and Note 7 to our Consolidated Financial Statements.
Contractual Obligations
The following table sets forth our total future contractual obligations as of December 31, 2014:
| Total | Less than 1 year |
1-3 years | 3-5 years | After 5 years | ||||||||||||||||
| (dollars in millions) | ||||||||||||||||||||
| Long-term debt |
$ | 761.2 | $ | 27.8 | $ | 55.0 | $ | 678.4 | $ | — | ||||||||||
| —Principal payments |
653.6 | 4.3 | 8.6 | 640.7 | — | |||||||||||||||
| — Interest payments* |
107.6 | 23.5 | 46.4 | 37.8 | — | |||||||||||||||
| Short-term borrowings |
135.0 | 135.0 | — | — | — | |||||||||||||||
| —Principal payments |
135.0 | 135.0 | — | — | — | |||||||||||||||
| —Interest payments** |
0.0 | 0.0 | — | — | — | |||||||||||||||
| Capital leases |
5.5 | 1.9 | 2.5 | 1.1 | — | |||||||||||||||
| —Principal payments |
4.1 | 1.4 | 2.1 | 0.5 | — | |||||||||||||||
| —Interest payments |
1.4 | 0.5 | 0.4 | 0.5 | — | |||||||||||||||
| Operating leases |
120.3 | 32.6 | 45.3 | 25.4 | 17.2 | |||||||||||||||
| Purchase obligations |
15.9 | 13.2 | 2.1 | 0.6 | — | |||||||||||||||
| Capital commitments net of advances |
6.1 | 6.1 | — | — | — | |||||||||||||||
| Earn-out Consideration |
42.5 | 3.3 | 35.1 | 4.1 | — | |||||||||||||||
| —Reporting Date Fair Value |
34.0 | 3.2 | 28.3 | 2.4 | — | |||||||||||||||
| —Interest |
8.5 | 0.1 | 6.8 | 1.7 | — | |||||||||||||||
| Other long-term liabilities |
117.5 | 78.0 | 34.2 | 5.2 | — | |||||||||||||||
|
|
|
|
|
|
|
|
|
|
|
|||||||||||
| Total contractual cash obligations |
$ | 1,204.0 | $ | 297.9 | $ | 174.2 | $ | 714.8 | $ | 17.2 | ||||||||||
|
|
|
|
|
|
|
|
|
|
|
|||||||||||
| * | Our interest payments on long-term debt represent payments based on the prevailing rate as of December 31, 2014. |
| ** | Our interest payments on short-term debt represent estimated payments based on the prevailing interest rate as of December 31, 2014 and our expectation for the repayment of such debt. |
66
Table of Contents
Recent Accounting Pronouncements
Recently adopted accounting pronouncements
For a description of recently adopted accounting pronouncements, see Note 2—“Recently adopted accounting pronouncements” under Item 1—“Financial Statements” above and Part II, Item 7—“Management’s Discussion and Analysis of Financial Condition and Results of Operations”—“Critical Accounting Policies and Estimates” in our Annual Report on Form 10-K for the year ended December 31, 2014.
Recently issued accounting pronouncements
In April 2014, FASB issued ASU No. 2014-08, Reporting Discontinued Operations and Disclosures of Disposals of Components of an Entity, which changes the criteria for reporting discontinued operations and requires additional disclosures about discontinued operations. The ASU requires an entity to report as a discontinued operation only a disposal that represents a strategic shift in its operations that has a major effect on it operational and financial results. The ASU will be effective for us beginning January 1, 2015, including interim periods in our fiscal year 2015, and does not allow for retrospective adoption. Early application is permitted, but only for those disposals (or classifications as held-for-sale) that have not been reported in financial statements previously issued or available for issuance. We do not expect the adoption of this update to have a material impact on our consolidated results of operations, cash flows, financial position or disclosures.
In May 2014, the FASB issued Accounting Standards Update (“ASU”) No. 2014-09, Revenue from Contracts with Customers, which will replace most existing revenue recognition guidance in U.S. GAAP. The core principle of the ASU is that an entity should recognize revenue for the transfer of goods or services equal to the amount that it expects to be entitled to receive for those goods or services. The ASU requires additional disclosure about the nature, amount, timing and uncertainty of revenue and cash flows arising from customer contracts, including significant judgments and changes in judgments. The ASU will be effective for us beginning January 1, 2017, including interim periods in our fiscal year 2017, and allows for both retrospective and prospective adoption. We are in the process of determining the method of adoption and assessing the impact of this ASU on our consolidated results of operations, cash flows, financial position or disclosures.
In June 2014, FASB issued ASU No. 2014-12, Accounting for Share-Based Payments When the Terms of an Award Provide That a Performance Target Could be Achieved after the Requisite Service Period, which requires an entity to treat a performance target that affects vesting and that could be achieved after the requisite service period as a performance condition. The ASU will be effective for us beginning January 1, 2016, including interim periods in our fiscal year 2016. Early adoption and retrospective application are permitted. We do not expect the adoption of this update to have a material impact on our consolidated results of operations, cash flows, financial position or disclosures.
Item 7A. Quantitative and Qualitative Disclosures About Market Risk
Foreign Currency Risk
Our exposure to market risk arises principally from exchange rate risk. A substantial portion of our revenues (approximately 71.2% in fiscal 2014) are received in U.S. dollars. We also receive revenues in Japanese yen, euros, U.K. pounds sterling, Australian dollars, Chinese renminbi, South African rand and Indian rupees. Our expenses are primarily in Indian rupees and we also incur expenses in U.S. dollars, Chinese renminbi, euros and the currencies of the other countries in which we have operations. Our exchange rate risk arises from our foreign currency revenues, expenses, receivables and payables. Based on the results of our European operations for fiscal 2014, and excluding any hedging arrangements that we had in place during that period, a 5.0% appreciation or depreciation of the Euro against the U.S. dollar would have increased or decreased, as applicable, our revenues in fiscal 2014 by approximately $8 million. Similarly, excluding any hedging arrangements that we had in place during that period, a 5.0% depreciation of the Indian rupee against the U.S. dollar would have decreased our
67
Table of Contents
expenses incurred and paid in Indian rupees in fiscal 2014 by approximately $31 million. Conversely, a 5.0% appreciation of the Indian rupee against the U.S. dollar would have increased our expenses incurred and paid in rupees in fiscal 2014 by approximately $35 million.
We have sought to reduce the effect of any Indian rupee-U.S. dollar, Chinese renminbi-Japanese yen, euro-Hungarian forint, euro-Romanian leu and certain other local currency exchange rate fluctuations on our results of operations by purchasing forward foreign exchange contracts to cover a portion of our expected cash flows. These instruments typically have maturities of zero to sixty months. We use these instruments as economic hedges and not for speculative purposes, and most of them qualify for hedge accounting under the FASB guidance on Derivatives and Hedging. Our ability to enter into derivatives that meet our planning objectives is subject to the depth and liquidity of the market for such derivatives. In addition, the laws of China and India limit the maturity and amount of such arrangements. We may not be able to purchase contracts adequate to insulate us from Indian rupee-U.S. dollar and Chinese renminbi-Japanese yen foreign exchange currency risks. In addition, any such contracts may not perform adequately as hedging mechanisms. See Item 7—“Management’s Discussion and Analysis of Financial Condition and Results of Operations—Foreign Exchange (gains) losses, net.”
Interest Rate Risk
Our exposure to interest rate risk arises principally from interest on our indebtedness. As of December 31, 2014, we had approximately $799.9 million of indebtedness under our credit facility, comprised of a long-term loan of $664.9 million, which includes $11.3 million of debt amortization expenses, and a revolving loan of $135 million. Interest on indebtedness under our credit facility is variable based on LIBOR and we are subject to market risk from changes in interest rates. Based on our indebtedness as of December 31, 2014, a 1% change in interest rates would impact our net interest expense by $8.1 million in 2015.
Credit Risk
As of December 31, 2014, we had accounts receivable, including long-term accounts receivable, net of provisions for doubtful receivables, of $537.4 million. Of this, $130.0 million was owed by GE and the balance, or $407.4 million, was owed by Global Clients. No single Global Client owed more than 5% of the accounts receivable balance as of December 31, 2014.
Item 8. Financial Statements and Supplementary Data
The financial statements and supplementary data required by this item are listed in Item 15—“Exhibits and Financial Statement Schedules” of this Annual Report on Form 10-K.
Item 9. Changes in and Disagreements with Accountants on Accounting and Financial Disclosure
None.
Item 9A. Controls and Procedures
Evaluation of Disclosure Controls and Procedures
Disclosure controls and procedures are the Company’s controls and other procedures which are designed to ensure that information required to be disclosed by us in the reports that we file or submit under the Exchange Act is recorded, processed, summarized and reported, within the time periods specified in the SEC’s rules and forms. Disclosure controls and procedures include, without limitation, controls and procedures designed to ensure that information required to be disclosed by us in the reports that we file or submit under the Exchange Act is accumulated and communicated to our management, including our Chief Executive Officer and Chief Financial Officer, as appropriate, to allow timely decisions regarding required disclosure.
68
Table of Contents
As of the end of the period covered by this report, the Company carried out an evaluation, under the supervision and with the participation of the Company’s management, including the Company’s Chief Executive Officer along with the Company’s Chief Financial Officer, of the effectiveness of the design and operation of the Company’s disclosure controls and procedures pursuant to the Securities Exchange Act of 1934 (“Exchange Act”) Rule 13a-15(b). Based upon that evaluation, the Company’s Chief Executive Officer along with the Company’s Chief Financial Officer concluded that the Company’s disclosure controls and procedures are effective in timely alerting them to material information relating to the Company (including its consolidated subsidiaries) required to be included in the Company’s periodic SEC filings.
Management’s Report on Internal Control over Financial Reporting
Genpact’s management is responsible for establishing and maintaining adequate internal control over financial reporting to provide reasonable assurance regarding the reliability of our financial reporting and the preparation of financial statements for external purposes in accordance with generally accepted accounting principles. Internal control over financial reporting includes those policies and procedures that:
(i) pertain to the maintenance of records that in reasonable detail accurately and fairly reflect the transactions and dispositions of our assets;
(ii) provide reasonable assurance that the transactions are recorded as necessary to permit preparation of financial statements in accordance with generally accepted accounting principles, and that our receipts and expenditures are being made only in accordance with the authorization of management and/or our Board of Directors; and
(iii) provide reasonable assurance regarding the prevention or timely detection of any unauthorized acquisition, use or disposition of our assets that could have a material effect on our financial statements.
Due to its inherent limitations, internal control over financial reporting may not prevent or detect misstatements. Also, projections of any evaluation of effectiveness to future periods are subject to the risk that controls may become inadequate due to changes in conditions, or that the degree of compliance with the policies or procedures may deteriorate.
Under the supervision and with the participation of our management, including our Chief Executive Officer and Chief Financial Officer, we conducted an evaluation of the effectiveness of our internal control over financial reporting using the criteria set forth by the Committee of Sponsoring Organizations of the Treadway Commission (COSO) in Internal Control—Integrated Framework (1992). Based on its evaluation, our management concluded that our internal control over financial reporting was effective as of December 31, 2014.
We acquired Pharmalink Consulting Limited, Pharmalink Consulting Inc. and Genpact Japan Business Services K.K., during 2014, and excluded from our assessment of the effectiveness of the Company’s internal control over financial reporting as of December 31, 2014 Pharmalink Consulting Limited, Pharmalink Consulting Inc. and Genpact Japan Business Services K.K.’s internal control over financial reporting associated with total assets of $180,603 thousand (of which $153,891 thousand represents goodwill and intangible assets included within the scope of the assessment) and total revenues of $29,414 thousand included in the Consolidated Financial Statements of the Company as of and for the year ended December 31, 2014.
KPMG, an independent registered public accounting firm, has audited the Consolidated Financial Statements included in this Annual Report on Form 10-K and, as part of its audit, has issued an attestation report, included herein, on the effectiveness of our internal control over financial reporting. See “Report of Independent Registered Public Accounting Firm” on page F-3.
Changes in Internal Control over Financial Reporting
There were no changes in the Company’s internal control over financial reporting (as defined in Rules 13a-15(f) and 15d-15(f) under the Exchange Act) during the quarterly period ended December 31, 2014 that have materially affected, or are reasonably likely to materially affect, the Company’s internal control over financial reporting.
69
Table of Contents
None.
PART III
Item 10. Directors, Executive Officers and Corporate Governance
The information required by this Item will be included in our Proxy Statement for the 2015 Annual General Meeting of Shareholders under the captions “Election of Directors,” “Information about Executive Officers,” “Corporate Governance,” and “Section 16(a) Beneficial Ownership Reporting Compliance,” which will be filed with the SEC no later than 120 days after the close of the fiscal year ended December 31, 2014 and is incorporated by reference in this report.
Item 11. Executive Compensation
The information required by this Item will be included in our Proxy Statement for the 2015 Annual General Meeting of Shareholders under the caption “Information about Executive and Director Compensation,” which will be filed with the SEC no later than 120 days after the close of the fiscal year ended December 31, 2014 and is incorporated by reference in this report.
Item 12. Security Ownership of Certain Beneficial Owners and Management and Related Stockholder Matters
The information required by this Item will be included in our Proxy Statement for the 2015 Annual General Meeting of Shareholders under the captions “Security Ownership of Certain Beneficial Owners and Management” and “Securities Authorized for Issuance under Equity Compensation Plans,” which will be filed with the SEC no later than 120 days after the close of the fiscal year ended December 31, 2014 and is incorporated by reference in this report.
Item 13. Certain Relationships and Related Transactions, and Director Independence
The information required by this Item will be included in our Proxy Statement for the 2015 Annual General Meeting of Shareholders under the caption “Certain Relationships and Related Transactions,” which will be filed with the SEC no later than 120 days after the close of the fiscal year ended December 31, 2014 and is incorporated by reference in this report.
Item 14. Principal Accounting Fees and Services
The information required by this Item will be included in our Proxy Statement for the 2015 Annual General Meeting of Shareholders under the caption “Independent Registered Public Accounting Firm Fees and Other Matters,” which will be filed with the SEC no later than 120 days after the close of the fiscal year ended December 31, 2014 and is incorporated by reference in this report.
70
Table of Contents
PART IV
Item 15. Exhibits and Financial Statement Schedules
| (a) | Documents filed as part of this Annual Report on Form 10-K: |
| 1. | Consolidated Financial Statements |
The consolidated financial statements required to be filed in the Annual Report on Form 10-K are listed on page F-1 hereof. The required financial statements appear on pages F-4 through F-63 hereof.
| 2. | Financial Statement Schedules |
Separate financial statement schedules have been omitted either because they are not applicable or because the required information is included in the consolidated financial statements.
| 3. | Exhibits |
See the Exhibit Index on pages E-1 through E-3 for a list of the exhibits being filed or furnished with or incorporated by reference into this Annual Report on Form 10-K.
71
Table of Contents
GENPACT LIMITED AND ITS SUBSIDIARIES
Index to Consolidated Financial Statements
F-1
Table of Contents
Report of Independent Registered Public Accounting Firm
The Board of Directors and Shareholders
Genpact Limited:
We have audited the accompanying consolidated balance sheets of Genpact Limited and subsidiaries (“Genpact Limited” or the “Company”) as of December 31, 2013 and 2014, and the related consolidated statements of income, comprehensive income (loss), equity, and cash flows for each of the years in the three-year period ended December 31, 2014. These consolidated financial statements are the responsibility of the Company’s management. Our responsibility is to express an opinion on these consolidated financial statements based on our audits.
We conducted our audits in accordance with the standards of the Public Company Accounting Oversight Board (United States). Those standards require that we plan and perform the audit to obtain reasonable assurance about whether the financial statements are free of material misstatement. An audit includes examining, on a test basis, evidence supporting the amounts and disclosures in the financial statements. An audit also includes assessing the accounting principles used and significant estimates made by management, as well as evaluating the overall financial statement presentation. We believe that our audits provide a reasonable basis for our opinion.
In our opinion, the consolidated financial statements referred to above present fairly, in all material respects, the financial position of the Company as of December 31, 2013 and 2014, and the results of their operations and their cash flows for each of the years in the three-year period ended December 31, 2014, in conformity with U.S. generally accepted accounting principles.
We also have audited, in accordance with the standards of the Public Company Accounting Oversight Board (United States), the Company’s internal control over financial reporting as of December 31, 2014, based on criteria established in Internal Control – Integrated Framework (1992) issued by the Committee of Sponsoring Organizations of the Treadway Commission (COSO), and our report dated February 27, 2015, expressed an unqualified opinion on the effectiveness of the Company’s internal control over financial reporting.
KPMG
Gurgaon, India
February 27, 2015
F-2
Table of Contents
Report of Independent Registered Public Accounting Firm
The Board of Directors and Shareholders
Genpact Limited:
We have audited Genpact Limited and subsidiaries’ (“Genpact Limited” or the “Company”) internal control over financial reporting as of December 31, 2014, based on criteria established in Internal Control – Integrated Framework (1992) issued by the Committee of Sponsoring Organizations of the Treadway Commission (COSO). The Company’s management is responsible for maintaining effective internal control over financial reporting and for its assessment of the effectiveness of internal control over financial reporting, included in the accompanying Management’s Report on Internal Control Over Financial Reporting. Our responsibility is to express an opinion on the Company’s internal control over financial reporting based on our audit.
We conducted our audit in accordance with the standards of the Public Company Accounting Oversight Board (United States). Those standards require that we plan and perform the audit to obtain reasonable assurance about whether effective internal control over financial reporting was maintained in all material respects. Our audit included obtaining an understanding of internal control over financial reporting, assessing the risk that a material weakness exists, and testing and evaluating the design and operating effectiveness of internal control based on the assessed risk. Our audit also included performing such other procedures as we considered necessary in the circumstances. We believe that our audit provides a reasonable basis for our opinion.
A company’s internal control over financial reporting is a process designed to provide reasonable assurance regarding the reliability of financial reporting and the preparation of financial statements for external purposes in accordance with generally accepted accounting principles. A company’s internal control over financial reporting includes those policies and procedures that (1) pertain to the maintenance of records that, in reasonable detail, accurately and fairly reflect the transactions and dispositions of the assets of the company; (2) provide reasonable assurance that transactions are recorded as necessary to permit preparation of financial statements in accordance with generally accepted accounting principles, and that receipts and expenditures of the company are being made only in accordance with authorizations of management and directors of the company; and (3) provide reasonable assurance regarding prevention or timely detection of unauthorized acquisition, use, or disposition of the company’s assets that could have a material effect on the financial statements.
Because of its inherent limitations, internal control over financial reporting may not prevent or detect misstatements. Also, projections of any evaluation of effectiveness to future periods are subject to the risk that controls may become inadequate because of changes in conditions, or that the degree of compliance with the policies or procedures may deteriorate.
In our opinion, the Company maintained, in all material respects, effective internal control over financial reporting as of December 31, 2014, based on criteria established in Internal Control – Integrated Framework (1992) issued by the Committee of Sponsoring Organizations of the Treadway Commission (COSO).
The Company acquired Pharmalink Consulting Limited, Pharmalink Consulting Inc. and Genpact Japan Business Services K.K., during 2014, and management excluded from its assessment of the effectiveness of the Company’s internal control over financial reporting as of December 31, 2014, Pharmalink Consulting Limited’s, Pharmalink Consulting Inc.’s and Genpact Japan Business Services K.K.’s internal control over financial reporting associated with total assets of $180,603 thousands (of which $153,891 thousands represents goodwill and intangible assets included within the scope of the assessment) and total revenues of $29,414 thousands included in the consolidated financial statements of the Company as of and for the year ended December 31, 2014. Our audit of internal control over financial reporting of the Company also excluded an evaluation of the internal control over financial reporting of Pharmalink Consulting Limited, Pharmalink Consulting Inc. and Genpact Japan Business Services K.K.
We also have audited, in accordance with the standards of the Public Company Accounting Oversight Board (United States), the consolidated balance sheets of the Company as of December 31, 2013 and 2014, and the related consolidated statements of operations, comprehensive income (loss), equity and cash flows for each of the years in the three-year period ended December 31, 2014, and our report dated February 27, 2015, expressed an unqualified opinion on those consolidated financial statements.
KPMG
Gurgaon, India
February 27, 2015
F-3
Table of Contents
GENPACT LIMITED AND ITS SUBSIDIARIES
Consolidated Balance Sheets
(In thousands, except per share data and share count)
| Notes | As of December 31, 2013 |
As of December 31, 2014 |
||||||||||
| Assets |
||||||||||||
| Current assets |
||||||||||||
| Cash and cash equivalents |
4 | $ | 571,276 | $ | 461,788 | |||||||
| Accounts receivables, net |
5 | 505,117 | 525,754 | |||||||||
| Deferred tax assets |
25 | 60,638 | 45,486 | |||||||||
| Prepaid expenses and other current assets |
8 | 139,113 | 155,480 | |||||||||
|
|
|
|
|
|||||||||
| Total current assets |
1,276,144 | 1,188,508 | ||||||||||
| Property, plant and equipment, net |
9 | 173,204 | 175,936 | |||||||||
| Deferred tax assets |
25 | 89,305 | 59,135 | |||||||||
| Investment in equity affiliates |
384 | 494 | ||||||||||
| Intangible assets, net |
10 | 99,116 | 114,544 | |||||||||
| Goodwill |
10 | 953,849 | 1,057,214 | |||||||||
| Other assets |
11 | 97,365 | 146,706 | |||||||||
|
|
|
|
|
|||||||||
| Total assets |
$ | 2,689,367 | $ | 2,742,537 | ||||||||
|
|
|
|
|
|||||||||
See accompanying notes to the Consolidated Financial Statements.
F-4
Table of Contents
GENPACT LIMITED AND ITS SUBSIDIARIES
Consolidated Balance Sheets
(In thousands, except per share data and share count)
| Notes | As of December 31, 2013 |
As of December 31, 2014 |
||||||||||
| Liabilities and equity |
||||||||||||
| Current liabilities |
||||||||||||
| Short-term borrowings |
15 | $ | — | $ | 135,000 | |||||||
| Current portion of long-term debt |
14 | 4,263 | 4,288 | |||||||||
| Current portion of capital lease obligations |
1,405 | 1,443 | ||||||||||
| Accounts payable |
18,412 | 15,544 | ||||||||||
| Income taxes payable |
25 | 15,007 | 13,586 | |||||||||
| Deferred tax liabilities |
25 | 614 | 1,239 | |||||||||
| Accrued expenses and other current liabilities |
13 | 421,992 | 451,014 | |||||||||
|
|
|
|
|
|||||||||
| Total current liabilities |
$ | 461,693 | $ | 622,114 | ||||||||
| Long-term debt, less current portion |
14 | 653,601 | 649,314 | |||||||||
| Capital lease obligations, less current portion |
2,657 | 2,660 | ||||||||||
| Deferred tax liabilities |
25 | 4,464 | 6,671 | |||||||||
| Other liabilities |
16 | 242,884 | 176,642 | |||||||||
|
|
|
|
|
|||||||||
| Total liabilities |
$ | 1,365,299 | $ | 1,457,401 | ||||||||
|
|
|
|
|
|||||||||
| Shareholders’ equity |
||||||||||||
| Preferred shares, $0.01 par value, 250,000,000 authorized, none issued |
— | — | ||||||||||
| Common shares, $0.01 par value, 500,000,000 authorized, 231,262,576 and 218,684,205 issued and outstanding as of December 31, 2013 and December 31, 2014, respectively |
2,310 | 2,184 | ||||||||||
| Additional paid-in capital |
1,268,344 | 1,296,730 | ||||||||||
| Retained earnings |
511,699 | 398,706 | ||||||||||
| Accumulated other comprehensive income (loss) |
(459,614 | ) | (412,484 | ) | ||||||||
|
|
|
|
|
|||||||||
| Genpact Limited shareholders’ equity |
$ | 1,322,739 | $ | 1,285,136 | ||||||||
| Noncontrolling interest |
1,329 | — | ||||||||||
|
|
|
|
|
|||||||||
| Total equity |
$ | 1,324,068 | $ | 1,285,136 | ||||||||
| Commitments and contingencies |
28 | |||||||||||
|
|
|
|
|
|||||||||
| Total liabilities and equity |
$ | 2,689,367 | $ | 2,742,537 | ||||||||
|
|
|
|
|
|||||||||
See accompanying notes to the Consolidated Financial Statements.
F-5
Table of Contents
GENPACT LIMITED AND ITS SUBSIDIARIES
Consolidated Statements of Income
(In thousands, except per share data and share count)
| Year ended December 31, | ||||||||||||||||
| Notes | 2012 | 2013 | 2014 | |||||||||||||
| Net revenues |
||||||||||||||||
| Net revenues from services |
$ | 1,901,971 | $ | 2,131,997 | $ | 2,279,438 | ||||||||||
| Cost of revenue |
||||||||||||||||
| Services |
21 | 1,157,766 | 1,319,571 | 1,378,088 | ||||||||||||
|
|
|
|
|
|
|
|||||||||||
| Gross profit |
$ | 744,205 | $ | 812,426 | $ | 901,350 | ||||||||||
| Operating expenses: |
||||||||||||||||
| Selling, general and administrative expenses |
22 | 456,611 | 484,810 | 585,646 | ||||||||||||
| Amortization of acquired intangible assets |
10 | 23,233 | 23,645 | 28,543 | ||||||||||||
| Other operating (income) expense, net |
23 | 16 | (5,556 | ) | (6,870 | ) | ||||||||||
|
|
|
|
|
|
|
|||||||||||
| Income from operations |
$ | 264,345 | $ | 309,527 | $ | 294,031 | ||||||||||
| Foreign exchange (gains) losses, net |
(13,146 | ) | (20,763 | ) | 12,363 | |||||||||||
| Other income (expense), net |
24 | (14,499 | ) | (24,308 | ) | (27,283 | ) | |||||||||
|
|
|
|
|
|
|
|||||||||||
| Income before equity-method investment activity, net and income tax expense |
$ | 262,992 | $ | 305,982 | $ | 254,385 | ||||||||||
| Loss(gain) on equity-method investment activity, net |
(17 | ) | (169 | ) | 4,795 | |||||||||||
|
|
|
|
|
|
|
|||||||||||
| Income before income tax expense |
$ | 263,009 | $ | 306,151 | $ | 249,590 | ||||||||||
| Income tax expense |
25 | 78,419 | 71,100 | 57,419 | ||||||||||||
|
|
|
|
|
|
|
|||||||||||
| Net income |
$ | 184,590 | $ | 235,051 | $ | 192,171 | ||||||||||
| Net income attributable to noncontrolling interest |
6,374 | 5,334 | 169 | |||||||||||||
|
|
|
|
|
|
|
|||||||||||
| Net income attributable to Genpact Limited shareholders |
$ | 178,216 | $ | 229,717 | $ | 192,002 | ||||||||||
|
|
|
|
|
|
|
|||||||||||
| Net income available to Genpact Limited common shareholders |
20 | $ | 178,216 | $ | 229,717 | $ | 192,002 | |||||||||
| Earnings per common share attributable to Genpact Limited common shareholders |
20 | |||||||||||||||
| Basic |
$ | 0.80 | $ | 1.00 | $ | 0.87 | ||||||||||
| Diluted |
$ | 0.78 | $ | 0.97 | $ | 0.85 | ||||||||||
| Weighted average number of common shares used in computing earnings per common share attributable to Genpact Limited common shareholders |
||||||||||||||||
| Basic |
223,696,567 | 229,348,411 | 220,847,098 | |||||||||||||
| Diluted |
229,532,516 | 235,754,267 | 225,168,665 | |||||||||||||
See accompanying notes to the Consolidated Financial Statements.
F-6
Table of Contents
GENPACT LIMITED AND ITS SUBSIDIARIES
Consolidated Statements of Comprehensive Income (Loss)
(In thousands)
| Year Ended December 31, | ||||||||||||||||||||||||
| 2012 | 2013 | 2014 | ||||||||||||||||||||||
| Genpact Limited Shareholders |
Non-controlling interest |
Genpact Limited Shareholders |
Non-controlling interest |
Genpact Limited Shareholders |
Non-controlling interest |
|||||||||||||||||||
| Net Income |
178,216 | 6,374 | 229,717 | 5,334 | 192,002 | 169 | ||||||||||||||||||
| Other comprehensive income: |
||||||||||||||||||||||||
| Currency translation adjustments |
(21,560 | ) | 131 | (114,555 | ) | 103 | (41,964 | ) | (11 | ) | ||||||||||||||
| Net income (loss) on cash flow hedging derivatives, net of taxes (Note 7) |
27,195 | — | (28,654 | ) | — | 90,200 | — | |||||||||||||||||
| Retirement benefits, net of taxes |
(3,154 | ) | — | 1,867 | — | (1,106 | ) | — | ||||||||||||||||
|
|
|
|
|
|
|
|
|
|
|
|
|
|||||||||||||
| Other comprehensive income (loss) |
2,481 | 131 | (141,342 | ) | 103 | 47,130 | (11 | ) | ||||||||||||||||
|
|
|
|
|
|
|
|
|
|
|
|
|
|||||||||||||
| Comprehensive income (loss) |
180,697 | 6,505 | 88,375 | 5,437 | 239,132 | 158 | ||||||||||||||||||
|
|
|
|
|
|
|
|
|
|
|
|
|
|||||||||||||
See accompanying notes to the Consolidated Financial Statements.
F-7
Table of Contents
GENPACT LIMITED AND ITS SUBSIDIARIES
Consolidated Statements of Equity
(In thousands, except share count)
| Genpact Limited Shareholders | ||||||||||||||||||||||||||||
| Common shares | Additional Paid-in Capital |
Retained Earnings |
Accumulated
Other Comprehensive Income (Loss) |
Non controlling interest |
Total Equity |
|||||||||||||||||||||||
| No. of Shares |
Amount | |||||||||||||||||||||||||||
| Balance as of January 1, 2012 |
222,347,968 | $ | 2,222 | $ | 1,146,203 | $ | 605,386 | $ | (320,753 | ) | $ | 2,625 | $ | 1,435,683 | ||||||||||||||
| Issuance of common shares on exercise of options (Note 18) |
2,539,517 | 25 | 24,931 | — | — | — | 24,956 | |||||||||||||||||||||
| Issuance of common shares under the employee stock purchase plan (Note 18) |
86,214 | 1 | 1,270 | — | — | — | 1,271 | |||||||||||||||||||||
| Net settlement on vesting of restricted share units (Note 18) |
506,473 | 5 | (2,108 | ) | — | — | — | (2,103 | ) | |||||||||||||||||||
| Distribution to noncontrolling interest |
— | — | — | — | — | (5,760 | ) | (5,760 | ) | |||||||||||||||||||
| Stock-based compensation expense (Note 18) |
— | — | 32,152 | — | — | — | 32,152 | |||||||||||||||||||||
| Comprehensive income: |
||||||||||||||||||||||||||||
| Net income |
— | — | — | 178,216 | — | 6,374 | 184,590 | |||||||||||||||||||||
| Other comprehensive income |
— | — | — | — | 2,481 | 131 | 2,612 | |||||||||||||||||||||
| Dividend (Note 19) |
— | — | — | (501,620 | ) | — | — | (501,620 | ) | |||||||||||||||||||
|
|
|
|
|
|
|
|
|
|
|
|
|
|
|
|||||||||||||||
| Balance as of December 31, 2012 |
225,480,172 | $ | 2,253 | $ | 1,202,448 | $ | 281,982 | $ | (318,272 | ) | $ | 3,370 | $ | 1,171,781 | ||||||||||||||
|
|
|
|
|
|
|
|
|
|
|
|
|
|
|
|||||||||||||||
See accompanying notes to the Consolidated Financial Statements.
F-8
Table of Contents
GENPACT LIMITED AND ITS SUBSIDIARIES
Consolidated Statements of Equity
(In thousands, except share count)
| Genpact Limited Shareholders | ||||||||||||||||||||||||||||
| Common shares | Additional Paid-in Capital |
Retained Earnings |
Accumulated
Other Comprehensive Income (Loss) |
Non controlling interest |
Total Equity |
|||||||||||||||||||||||
| No. of Shares |
Amount | |||||||||||||||||||||||||||
| Balance as of January 1, 2013 |
225,480,172 | $ | 2,253 | $ | 1,202,448 | $ | 281,982 | $ | (318,272 | ) | $ | 3,370 | $ | 1,171,781 | ||||||||||||||
| Issuance of common shares on exercise of options (Note 18) |
4,635,977 | 46 | 43,979 | — | — | — | 44,025 | |||||||||||||||||||||
| Issuance of common shares under the employee stock purchase plan (Note 18) |
109,698 | 1 | 1,833 | — | — | — | 1,834 | |||||||||||||||||||||
| Net settlement on vesting of restricted share units (Note 18) |
540,617 | 5 | (4,470 | ) | — | — | — | (4,465 | ) | |||||||||||||||||||
| Net settlement on vesting of performance units (Note 18) |
496,112 | 5 | (6,575 | ) | — | — | — | (6,570 | ) | |||||||||||||||||||
| Disposition of noncontrolling interest |
— | — | — | — | — | (1,055 | ) | (1,055 | ) | |||||||||||||||||||
| Distribution to noncontrolling interest |
— | — | — | — | — | (6,423 | ) | (6,423 | ) | |||||||||||||||||||
| Stock-based compensation expense (Note 18) |
— | — | 31,129 | — | — | — | 31,129 | |||||||||||||||||||||
| Comprehensive income: |
||||||||||||||||||||||||||||
| Net income |
— | — | — | 229,717 | — | 5,334 | 235,051 | |||||||||||||||||||||
| Other comprehensive income |
— | — | — | — | (141,342 | ) | 103 | (141,239 | ) | |||||||||||||||||||
|
|
|
|
|
|
|
|
|
|
|
|
|
|
|
|||||||||||||||
| Balance as of December 31, 2013 |
231,262,576 | $ | 2,310 | $ | 1,268,344 | $ | 511,699 | $ | (459,614 | ) | $ | 1,329 | $ | 1,324,068 | ||||||||||||||
|
|
|
|
|
|
|
|
|
|
|
|
|
|
|
|||||||||||||||
See accompanying notes to the Consolidated Financial Statements.
F-9
Table of Contents
GENPACT LIMITED AND ITS SUBSIDIARIES
Consolidated Statements of Equity
(In thousands, except share count)
| Genpact Limited Shareholders | ||||||||||||||||||||||||||||
| Common shares | Additional Paid-in Capital |
Retained Earnings |
Accumulated
Other Comprehensive Income (Loss) |
Non controlling interest |
Total Equity |
|||||||||||||||||||||||
| No. of Shares |
Amount | |||||||||||||||||||||||||||
| Balance as of January 1, 2014 |
231,262,576 | $ | 2,310 | $ | 1,268,344 | $ | 511,699 | $ | (459,614 | ) | $ | 1,329 | $ | 1,324,068 | ||||||||||||||
| Net settlement on issuance of common shares on exercise of options (Note 18) |
3,319,760 | 33 | 16,018 | — | — | — | 16,051 | |||||||||||||||||||||
| Issuance of common shares under the employee stock purchase plan (Note 18) |
151,461 | 2 | 2,345 | — | — | — | 2,347 | |||||||||||||||||||||
| Net settlement on vesting of restricted share units (Note 18) |
329,311 | 3 | (2,361 | ) | — | — | — | (2,358 | ) | |||||||||||||||||||
| Net settlement on vesting of performance units (Note 18) |
913,939 | 9 | (15,681 | ) | — | — | — | (15,672 | ) | |||||||||||||||||||
| Stock purchased and retired |
(17,292,842 | ) | (173 | ) | — | (302,452 | ) | — | — | (302,625 | ) | |||||||||||||||||
| Expenses related to stock purchase |
— | — | — | (2,543 | ) | — | — | (2,543 | ) | |||||||||||||||||||
| Distribution to noncontrolling interest |
— | — | — | — | — | (1,487 | ) | (1,487 | ) | |||||||||||||||||||
| Stock-based compensation expense (Note 18) |
— | — | 28,065 | — | — | — | 28,065 | |||||||||||||||||||||
| Comprehensive income: |
||||||||||||||||||||||||||||
| Net income |
— | — | — | 192,002 | — | 169 | 192,171 | |||||||||||||||||||||
| Other comprehensive income |
— | — | — | — | 47,130 | (11 | ) | 47,119 | ||||||||||||||||||||
|
|
|
|
|
|
|
|
|
|
|
|
|
|
|
|||||||||||||||
| Balance as of December 31, 2014 |
218,684,205 | $ | 2,184 | $ | 1,296,730 | $ | 398,706 | $ | (412,484 | ) | $ | — | $ | 1,285,136 | ||||||||||||||
|
|
|
|
|
|
|
|
|
|
|
|
|
|
|
|||||||||||||||
See accompanying notes to the Consolidated Financial Statements.
F-10
Table of Contents
GENPACT LIMITED AND ITS SUBSIDIARIES
Consolidated Statements of Cash Flows
(In thousands)
| Year ended December 31, | ||||||||||||
| 2012 | 2013 | 2014 | ||||||||||
| Operating activities |
||||||||||||
| Net income attributable to Genpact Limited shareholders |
$ | 178,216 | $ | 229,717 | $ | 192,002 | ||||||
| Net income attributable to noncontrolling interest |
6,374 | 5,334 | 169 | |||||||||
| Net income |
$ | 184,590 | $ | 235,051 | $ | 192,171 | ||||||
| Adjustments to reconcile net income to net cash provided by (used for) operating activities: |
||||||||||||
| Depreciation and amortization |
56,089 | 52,815 | 51,064 | |||||||||
| Amortization of debt issue costs (including loss on extinguishment of debt) |
8,079 | 6,035 | 3,240 | |||||||||
| Amortization of acquired intangible assets |
23,305 | 23,645 | 28,543 | |||||||||
| Reserve for doubtful receivables |
3,878 | 11,420 | 3,107 | |||||||||
| Unrealized (gain) loss on revaluation of foreign currency asset/liability |
(13,700 | ) | (6,251 | ) | 9,419 | |||||||
| Equity-method investment activity, net |
(17 | ) | (169 | ) | 4,795 | |||||||
| Stock-based compensation expense |
32,152 | 31,129 | 28,065 | |||||||||
| Deferred income taxes |
(10,028 | ) | (1,116 | ) | (12,252 | ) | ||||||
| Others, net |
6,579 | 5,939 | 1,291 | |||||||||
| Change in operating assets and liabilities: |
||||||||||||
| Increase in accounts receivables |
(36,171 | ) | (60,817 | ) | (24,088 | ) | ||||||
| Decrease (Increase) in other assets |
(20,525 | ) | 9,377 | (31,657 | ) | |||||||
| Increase (Decrease) in accounts payable |
(4,380 | ) | 1,785 | (7,268 | ) | |||||||
| Increase in other liabilities |
79,034 | 9,316 | 27,500 | |||||||||
| Increase (Decrease) in income taxes payable |
1,775 | (6,555 | ) | (2,092 | ) | |||||||
|
|
|
|
|
|
|
|||||||
| Net cash provided by operating activities |
$ | 310,660 | $ | 311,604 | $ | 271,838 | ||||||
|
|
|
|
|
|
|
|||||||
| Investing activities |
||||||||||||
| Purchase of property, plant and equipment |
(83,337 | ) | (48,879 | ) | (62,577 | ) | ||||||
| Proceeds from sale of property, plant and equipment |
500 | 3,442 | 564 | |||||||||
| Investment in equity affiliates |
(205 | ) | — | — | ||||||||
| Short term deposits placed |
(43,978 | ) | (55,001 | ) | (25,000 | ) | ||||||
| Redemption of short term deposits |
25,638 | 69,249 | 25,000 | |||||||||
| Payment for business acquisitions, net of cash acquired |
(55,901 | ) | (49,235 | ) | (130,809 | ) | ||||||
| Proceeds from divestiture of business, net of cash divested |
— | 1,982 | — | |||||||||
|
|
|
|
|
|
|
|||||||
| Net cash used for investing activities |
$ | (157,283 | ) | $ | (78,442 | ) | $ | (192,822 | ) | |||
|
|
|
|
|
|
|
|||||||
| Financing activities |
||||||||||||
| Repayment of capital lease obligations |
(2,279 | ) | (1,803 | ) | (2,095 | ) | ||||||
| Proceeds from long-term debt |
675,000 | 121,410 | — | |||||||||
| Repayment of long-term debt |
(106,688 | ) | (123,098 | ) | (6,750 | ) | ||||||
| Proceeds from Short-term borrowings |
80,000 | 275,000 | 195,000 | |||||||||
| Repayment of Short-term borrowings |
(253,004 | ) | (355,000 | ) | (60,000 | ) | ||||||
| Proceeds from issuance of common shares under stock-based compensation plans |
26,227 | 45,859 | 30,144 | |||||||||
| Payment for net settlement of stock-based awards |
(2,103 | ) | (9,315 | ) | (25,975 | ) | ||||||
| Payment of earn-out and deferred consideration |
(587 | ) | (3,868 | ) | (1,088 | ) | ||||||
| Cost incurred in relation to debt amendment and refinancing |
(15,266 | ) | (8,104 | ) | — | |||||||
| Distribution to noncontrolling interest |
(5,760 | ) | (6,423 | ) | (1,487 | ) | ||||||
| Expenses related to stock purchase |
— | — | (2,543 | ) | ||||||||
| Stock purchased and retired |
— | — | (302,625 | ) | ||||||||
| Dividend Paid |
(501,620 | ) | — | — | ||||||||
|
|
|
|
|
|
|
|||||||
| Net cash used for financing activities |
$ | (106,080 | ) | $ | (65,342 | ) | $ | (177,419 | ) | |||
|
|
|
|
|
|
|
|||||||
| Effect of exchange rate changes |
3,911 | (55,772 | ) | (11,085 | ) | |||||||
| Net increase (decrease) in cash and cash equivalents |
47,297 | 167,820 | (98,403 | ) | ||||||||
| Cash and cash equivalents at the beginning of the period |
408,020 | 459,228 | 571,276 | |||||||||
|
|
|
|
|
|
|
|||||||
| Cash and cash equivalents at the end of the period |
$ | 459,228 | $ | 571,276 | $ | 461,788 | ||||||
|
|
|
|
|
|
|
|||||||
| Supplementary information |
||||||||||||
| Cash paid during the period for interest |
$ | 14,061 | $ | 30,788 | $ | 27,175 | ||||||
| Cash paid during the period for income taxes |
$ | 91,825 | $ | 71,857 | $ | 83,803 | ||||||
| Property, plant and equipment acquired under capital lease obligations |
$ | 2,699 | $ | 2,342 | $ | 2,176 | ||||||
See accompanying notes to the Consolidated Financial Statements.
F-11
Table of Contents
GENPACT LIMITED AND ITS SUBSIDIARIES
Notes to the Consolidated Financial Statements
(In thousands, except per share data and share count)
1. Organization
(a) Nature of Operations
The Company designs, transforms, and runs intelligent business operations, including those that are complex and specific to a set of chosen industries. The result is advanced operating models that assist the Company’s clients in becoming more competitive by supporting their growth and managing cost, risk, and compliance across a range of functions, such as finance and procurement, financial services account servicing, claims management, regulatory affairs, and industrial asset optimization. The Company’s Smart Enterprise Processes (SEPSM) proprietary framework helps companies reimagine how they operate by integrating effective Systems of EngagementTM, core IT, and Data-to-Action AnalyticsSM. The Company’s hundreds of long-term clients include more than one-fourth of the Fortune Global 500. The Company has a unique history: behind its passion for process and operational excellence is the Lean and Six Sigma heritage of a former General Electric division that has served GE businesses for more than 16 years.
(b) Organization
Prior to December 30, 2004, the business of the Company was conducted through various entities and divisions of the General Electric Company (“GE”). On December 30, 2004, in a series of transactions referred to as the “2004 Reorganization,” GE transferred such operations to the Company. In August 2007, the Company completed an initial public offering of its common shares, pursuant to which the Company and certain of its existing shareholders each sold 17,647,059 common shares. On March 24, 2010, the Company completed a secondary offering of its common shares pursuant to which GE’s shareholding in the Company decreased to 9.1% and it ceased to be a significant shareholder, although it continued to be a related party. During the year ended December 31, 2012, GE’s shareholding declined to less than 5.0%, as a result of which GE is no longer considered a related party.
2012 Recapitalization
On August 1, 2012, affiliates of GA and OH entered into an agreement to sell 67,750,678 common shares of the Company to Glory Investments A Limited, formerly known as South Asia Private Investments, an affiliate of Bain Capital Investors, LLC (“Bain Capital”). On October 25, 2012, Bain Capital and its affiliated assignees, along with two additional co-investors (RGIP, LLC, an investor in certain investment funds which are affiliated with Bain Capital, and Twickenham Investment Private Limited, an affiliate of the Government of Singapore Investment Corporation Private Limited), completed the purchase of the Company’s common shares covered by the share purchase agreement.
On December 14, 2012, a secondary offering of the Company’s common shares by affiliates of General Atlantic (“GA”) and Oak Hill Capital Partners (“OH”) was completed. Upon the completion of the secondary offering, GA and OH each owned approximately 2.4% of the Company’s common shares outstanding, and they ceased to be significant shareholders and related parties.
On August 30, 2012, the Company terminated its previous credit facility of $380,000 and entered into a new credit facility of $925,000. Net proceeds from the credit facility along with cash on hand were partially used to fund the payment of a special cash dividend in the amount of $2.24 per share in the third quarter of 2012. The share purchase transaction described above, the entry into a new credit facility and the payment of the special cash dividend are referred to collectively as the “2012 Recapitalization.” In June 2013, the Company amended the new credit facility as described in Note 14.
F-12
Table of Contents
GENPACT LIMITED AND ITS SUBSIDIARIES
Notes to the Consolidated Financial Statements
(In thousands, except per share data and share count)
1. Organization (Continued)
The Company incurred expenses of approximately $23,464 for the 2012 Recapitalization, excluding fees associated with terminating the previous credit facility and entering into the new credit facility. Of the total expenses of $23,464, $6,237 was incurred and recorded as part of “selling, general and administrative expenses” in the Consolidated Statements of Income. The balance of the total expenses of approximately $17,227 relating to the share purchase transaction was incurred and accrued as of December 31, 2012 and reported as a part of “other income (expense), net” in the Consolidated Statements of Income. GA and OH jointly reimbursed the Company for $17,000 of the $17,227 on October 25, 2012 at the closing of the share purchase transaction in accordance with the letter agreement among the Company, GA and OH. This reimbursement was recorded as part of “other income (expense), net” in the Consolidated Statements of Income for the year ended December 31, 2012.
2. Summary of significant accounting policies
(a) Basis of preparation and principles of consolidation
The accompanying consolidated financial statements have been prepared in conformity with U.S. generally accepted accounting principles (U.S. GAAP).
The accompanying financial statements have been prepared on a consolidated basis and reflect the financial statements of Genpact Limited, a Bermuda company and all of its subsidiaries that are more than 50% owned and controlled, including variable interest entities in which the Company is the primary beneficiary. When the Company does not have a controlling interest in an entity, but exerts significant influence on the entity, the Company applies the equity method of accounting. All intercompany transactions and balances are eliminated in consolidation.
The noncontrolling interest disclosed in the accompanying consolidated financial statements represents the noncontrolling partners’ interest in the operation of Genpact Netherlands B.V., the noncontrolling shareholders’ interest in the operation of Hello Communications (Shanghai) Co., Ltd. and the profits or losses associated with the noncontrolling interest in such operations. The noncontrolling partners of Genpact Netherlands B.V. are individually liable for the tax obligations on their shares of profit as it is a partnership. Accordingly, noncontrolling interest relating to Genpact Netherlands B.V. has been computed prior to tax and disclosed accordingly in the Consolidated Statements of Income. During the year ended December 31, 2013, the Company completed the divestiture of Hello Communications (Shanghai) Co., Ltd as described in Note 3B(a). Further, during the year ended December 31, 2014, the Company purchased the noncontrolling interest in Genpact Netherlands B.V., resulting in the Company’s 100% control of the partnership.
(b) Use of estimates
The preparation of consolidated financial statements in accordance with U.S. GAAP requires management to make estimates and assumptions that affect the amounts reported in the consolidated financial statements. Significant items subject to such estimates and assumptions include the useful lives of property, plant and equipment, the carrying amount of property, plant and equipment, intangibles and goodwill, the reserve for doubtful receivables, the valuation allowance for deferred tax assets, the valuation of derivative financial instruments, the measurements of stock-based compensation, assets and obligations related to employee benefits, income tax uncertainties, undistributed foreign earnings planned to be indefinitely reinvested and other contingencies. Management believes that the estimates used in the preparation of the consolidated financial statements are reasonable. Although these estimates are based upon management’s best knowledge of current events and actions, actual results could differ from these estimates. Any changes in estimates are adjusted prospectively in the consolidated financial statements.
F-13
Table of Contents
GENPACT LIMITED AND ITS SUBSIDIARIES
Notes to the Consolidated Financial Statements
(In thousands, except per share data and share count)
2. Summary of significant accounting policies (Continued)
c) Revenue recognition
The Company derives its revenue primarily from business process and technology management services, which are provided on a time-and-material, transaction or fixed-price basis. The Company recognizes revenue when persuasive evidence of an arrangement exists, the sales price is fixed or determinable, services have been rendered and collectability is reasonably assured. Revenues from services rendered under time-and-materials and transaction-based contracts are recognized as the services are provided. The Company’s fixed-price contracts include contracts for application development, maintenance and support services. Revenues on these contracts are recognized ratably over the term of the agreement. The Company accrues for revenue and receivables for the services rendered between the last billing date and the balance sheet date.
Customer contracts can also include incentive payments received for discrete benefits delivered to clients. Revenues relating to such incentive payments are recorded when the contingency is satisfied and the Company concludes the amounts are earned.
Revenue with respect to fixed-price contracts for the development of software and related services is recognized in accordance with the percentage of completion method. Guidance has been drawn from Financial Accounting Standards Board (“FASB”) guidance on Software—Revenue Recognition to account for revenue from fixed-price arrangements for software development and related services in conformity with FASB guidance on Revenue Recognition—Construction—Type and Production-Type Contracts. The input (effort or cost expended) method has been used to measure progress towards completion as there is a direct relationship between input and productivity. Provisions for estimated losses, if any, on uncompleted contracts are recorded in the period in which such losses become probable based on the current contract estimates.
The Company has deferred the revenue and costs attributable to certain process transition activities with respect to its customers where such activities do not represent the culmination of a separate earnings process. Such revenue and costs are subsequently recognized ratably over the period in which the related services are performed. Further, the deferred costs are limited to the amount of the deferred revenues.
Revenues are reported net of value-added tax, business tax and applicable discounts and allowances. Reimbursements of out-of-pocket expenses received from customers have been included as part of revenues.
The Company enters into multiple-element revenue arrangements in which a customer may purchase a combination of its services. Revenue from multiple-element arrangements is recognized, for each respective element, based on (1) the attainment of the delivery criterion; (2) its fair value, which is determined using the selling price hierarchy of vendor-specific objective evidence (“VSOE”) of fair value, third-party evidence or best estimated selling price, as applicable, and (3) its allocated selling price, which is based on the relative sales price method.
d) Accounts receivable
Accounts receivable are recorded at the invoiced or to be invoiced amount and do not bear interest. Amounts collected on trade accounts receivable are included in net cash provided by operating activities in the Consolidated Statements of Cash Flows. The Company maintains an allowance for doubtful accounts for estimated losses inherent in its accounts receivable portfolio. In establishing the required allowance, management considers historical losses adjusted to take into account current market conditions and its customers’ financial condition, the amount of receivables in dispute, and the current receivables’ aging and current payment patterns.
F-14
Table of Contents
GENPACT LIMITED AND ITS SUBSIDIARIES
Notes to the Consolidated Financial Statements
(In thousands, except per share data and share count)
2. Summary of significant accounting policies (Continued)
Account balances are charged off against the allowance after all means of collection have been exhausted and the potential for recovery is considered remote. The Company does not have any off-balance-sheet credit exposure related to its customers.
(e) Cash and cash equivalents
Cash and cash equivalents consist of cash and bank balances and all highly liquid investments purchased with an original maturity of three months or less.
(f) Short- term investments
All liquid investments with an original maturity greater than 90 days but less than one year are considered to be short-term investments. Marketable short-term investments are classified and accounted for as available-for-sale investments. Available-for-sale investments are reported at fair value with changes in unrealized gains and losses recorded as a separate component of other comprehensive income (loss) until realized. Realized gains and losses on investments are determined based on the specific identification method and are included in “Other income (expense), net.” The Company does not hold these investments for speculative or trading purposes.
(g) Property, plant and equipment, net
Property, plant and equipment are stated at cost less accumulated depreciation and amortization. Expenditures for replacements and improvements are capitalized, whereas the costs of maintenance and repairs are charged to earnings as incurred. The Company depreciates and amortizes all property, plant and equipment using the straight-line method over the following estimated economic useful lives of the assets:
| Years | ||
| Buildings |
40 | |
| Furniture and fixtures |
4 | |
| Computer equipment and servers |
4 | |
| Plant, machinery and equipment |
4 | |
| Computer software |
4 | |
| Leasehold improvements |
Lesser of lease period or 10 years | |
| Vehicles |
3-4 |
The Company capitalizes certain computer software and software development costs incurred in connection with developing or obtaining computer software for internal use when both the preliminary project stage is completed and it is probable that the software will be used as intended. Capitalized software costs include only (i) external direct costs of materials and services utilized in developing or obtaining computer software, (ii) compensation and related benefits for employees who are directly associated with the software project, and (iii) interest costs incurred while developing internal-use computer software. Capitalized software costs are included in property, plant and equipment on the Company’s balance sheet and amortized on a straight-line basis when placed into service over the estimated useful lives of the software.
Advances paid towards the acquisition of property, plant and equipment outstanding as of each balance sheet date and the cost of property, plant and equipment not put to use before such date are disclosed under “Capital work in progress.”
F-15
Table of Contents
GENPACT LIMITED AND ITS SUBSIDIARIES
Notes to the Consolidated Financial Statements
(In thousands, except per share data and share count)
2. Summary of significant accounting policies (Continued)
(h) Research and development expense
Development costs incurred for software to be sold, if any, are expensed as incurred as research and development costs until technological feasibility has been established for the product. Technological feasibility is established upon completion of a detailed design program or, in its absence, completion of a working model. Thereafter, all software production costs will be capitalized and amortized over their useful lives and reported at the lower of unamortized cost and net realizable value.
(i) Business combinations, goodwill and other intangible assets
The Company accounts for its business combinations using the acquisition method of accounting in accordance with ASC 805, Business Combinations, by recognizing the identifiable tangible and intangible assets acquired and liabilities assumed, and any noncontrolling interest in the acquired business, measured at their acquisition date fair values. Contingent consideration is included within the acquisition cost and is recognized at its fair value on the acquisition date. A liability resulting from contingent consideration is remeasured to fair value as of each reporting date until the contingency is resolved. Changes in fair value are recognized in earnings. All assets and liabilities of the acquired businesses, including goodwill, are assigned to reporting units. Acquisition related costs are expensed as incurred under Selling, General and Administrative Expenses.
Goodwill represents the cost of acquired businesses in excess of the fair value of identifiable tangible and intangible net assets purchased. Goodwill is not amortized but is tested for impairment at least on an annual basis on December 31, based on a number of factors, including operating results, business plans and future cash flows. The Company performs an assessment of qualitative factors to determine whether the existence of events or circumstances leads to a determination that it is more likely than not that the fair value of a reporting unit is less than its carrying amount. Based on the assessment of events or circumstances, the Company performs the quantitative assessment of goodwill impairment if it determines that it is more likely than not that the fair value of a reporting unit is less than its carrying amount. If, based on the quantitative impairment analysis, the carrying value of the goodwill of the reporting unit exceeds the fair value of that goodwill, an impairment loss is recognized in an amount equal to the excess. In addition, the Company performs the qualitative assessment of goodwill impairment between annual tests if an event occurs or circumstances change that would more likely than not reduce the fair value of the reporting unit below its carrying amount. See Note 10 for information and related disclosures.
Intangible assets acquired individually or with a group of other assets or in a business combination are carried at cost less accumulated amortization based on their estimated useful lives as follows:
| Customer-related intangible assets |
1-14 years | |
| Marketing-related intangible assets |
1-10 years | |
| Other intangible assets |
3-9 years |
Intangible assets are amortized over their estimated useful lives using a method of amortization that reflects the pattern in which the economic benefits of the intangible assets are consumed or otherwise realized.
In business combinations, where the fair value of identifiable tangible and intangible net assets purchased exceeds the cost of the acquired business, the Company recognizes the resulting gain under “Other operating (income) expense, net” in the Consolidated Statements of Income.
F-16
Table of Contents
GENPACT LIMITED AND ITS SUBSIDIARIES
Notes to the Consolidated Financial Statements
(In thousands, except per share data and share count)
2. Summary of significant accounting policies (Continued)
(j) Impairment of long-lived assets
Long-lived assets, including certain intangible assets, to be held and used are reviewed for impairment whenever events or changes in circumstances indicate that the carrying amount of such assets may not be recoverable. Such assets are required to be tested for impairment if the carrying amount of the assets is higher than the future undiscounted net cash flows expected to be generated from the assets. The impairment amount to be recognized is measured as the amount by which the carrying value of the assets exceeds their fair value. The Company determines fair value by using a discounted cash flow approach.
(k) Foreign currency
The consolidated financial statements are reported in U.S. dollars. The functional currency of Genpact Limited is the U.S. dollar. The functional currency for subsidiaries organized in Europe, other than the U.K., the Czech Republic and one subsidiary in Poland, is the Euro, and the functional currencies of subsidiaries organized in Brazil, China, Colombia, Guatemala, India, Japan, Morocco, South Africa, the Philippines, the U.K., Poland, the Czech Republic, Hong Kong, Singapore, Australia, Canada and United Arab Emirates are their respective local currencies. The functional currency of all other Company subsidiaries is the U.S. dollar. The translation of the functional currencies of the respective subsidiaries into U.S. dollars is performed for balance sheet accounts using the exchange rates in effect as of the balance sheet date and for revenues and expense accounts using a monthly average exchange rate prevailing during the respective period. The gains or losses resulting from such translation are reported as currency translation adjustments under other comprehensive income (loss), net, under accumulated other comprehensive income (loss) as a separate component of equity.
Monetary assets and liabilities of each subsidiary denominated in currencies other than the subsidiary’s functional currency are translated into their respective functional currency at the rates of exchange prevailing at the balance sheet date. Transactions of each subsidiary in currencies other than the subsidiary’s functional currency are translated into the respective functional currencies at the average monthly exchange rate prevailing during the period of the transaction. The gains or losses resulting from foreign currency transactions are included in the consolidated statements of income.
(l) Derivative instruments and hedging activities
In the normal course of business, the Company uses derivative financial instruments to manage fluctuations in foreign currency exchange rates. The Company purchases forward foreign exchange contracts to mitigate the risk of changes in foreign exchange rates on intercompany transactions and forecasted transactions denominated in foreign currencies.
The Company recognizes derivative instruments and hedging activities as either assets or liabilities in its consolidated balance sheets and measures them at fair value. Gains and losses resulting from changes in fair value are accounted for depending on the use of the derivative and whether it is designated and qualifies for hedge accounting. Changes in the fair values of derivatives designated as cash flow hedges are deferred and recorded as a component of other comprehensive income (loss) reported under accumulated other comprehensive income (loss) until the hedged transactions occur and are then recognized in the consolidated statements of income along with the underlying hedged item and disclosed as part of “Total net revenues,” “Cost of revenue,” and “Selling, general and administrative expenses,” as applicable. Changes in the fair value of derivatives not
F-17
Table of Contents
GENPACT LIMITED AND ITS SUBSIDIARIES
Notes to the Consolidated Financial Statements
(In thousands, except per share data and share count)
2. Summary of significant accounting policies (Continued)
designated as hedging instruments, and the ineffective portion of derivatives designated as cash flow hedges are recognized in the consolidated statements of income and are included in foreign exchange (gains) losses, net, and other income (expense), net, respectively.
With respect to derivatives designated as hedges, the Company formally documents all relationships between hedging instruments and hedged items, as well as its risk management objectives and strategy for undertaking various hedge transactions. The Company also formally assesses, both at the inception of the hedge and on a quarterly basis, whether each derivative is highly effective in offsetting changes in fair values or cash flows of the hedged item. If it is determined that a derivative or a portion thereof is not highly effective as a hedge, or if a derivative ceases to be a highly effective hedge, the Company will prospectively discontinue hedge accounting with respect to that derivative.
In all situations in which hedge accounting is discontinued and the derivative is retained, the Company continues to carry the derivative at its fair value on the balance sheet and recognizes any subsequent change in its fair value in the consolidated statements of income. When it is probable that a forecasted transaction will not occur, the Company discontinues hedge accounting and recognizes immediately, in foreign exchange (gains) losses, net in the consolidated statements of income, the gains and losses attributable to such derivative that were accumulated in other comprehensive income (loss).
(m) Income taxes
The Company accounts for income taxes using the asset and liability method of accounting for income taxes. Under this method, income tax expense is recognized for the amount of taxes payable or refundable for the current year. In addition, deferred tax assets and liabilities are recognized for future tax consequences attributable to differences between the financial statement carrying amounts of existing assets and liabilities and their tax bases and all operating loss carry forwards, if any. Deferred tax assets and liabilities are measured using enacted tax rates expected to apply to taxable income in the years in which those temporary differences are expected to be recovered or settled. The effect on deferred tax assets and liabilities of a change in tax rates or tax status is recognized in the statement of income in the period that includes the enactment date or the filing or approval date of the tax status change. Deferred tax assets are reduced by a valuation allowance if, based on the weight of available evidence, it is more likely than not that some portion or all of the deferred tax assets will not be realized.
The Company applies a two-step approach for recognizing and measuring uncertain tax positions. The first step is to evaluate the tax position for recognition by determining, based on the technical merits, that the position will more likely than not be sustained upon examination. The second step is to measure the tax benefit as the largest amount of the tax benefit that is greater than 50% likely of being realized upon settlement. The Company includes interest and penalties related to unrecognized tax benefits within its provision for income tax expense.
(n) Employee Benefit Plan
Contributions to defined contribution plans are charged to consolidated statements of income in the period in which services are rendered by the covered employees. Current service costs for defined benefit plans are accrued in the period to which they relate. The liability in respect of defined benefit plans is calculated annually by the Company using the projected unit credit method. Prior service cost, if any, resulting from an amendment to a plan is recognized and amortized over the remaining period of service of the covered employees. The Company recognizes its liabilities for compensated absences dependent on whether the obligation is attributable to employee services already rendered, relates to rights that vest or accumulate and payment is probable and estimable.
F-18
Table of Contents
GENPACT LIMITED AND ITS SUBSIDIARIES
Notes to the Consolidated Financial Statements
(In thousands, except per share data and share count)
2. Summary of significant accounting policies (Continued)
The Company records annual amounts relating to its defined benefit plans based on calculations that incorporate various actuarial and other assumptions, including discount rates, mortality, assumed rates of return, compensation increases and turnover rates. The Company reviews its assumptions on an annual basis and makes modifications to the assumptions based on current rates and trends when it is appropriate to do so. The effect of modifications to those assumptions is recorded in other comprehensive income (loss) and amortized to net periodic cost over future periods using the corridor method. The Company believes that the assumptions utilized in recording its obligations under its plans are reasonable based on its experience and market conditions.
(o) Stock-based compensation
The Company recognizes and measures compensation expense for all stock-based awards based on the grant date fair value. For option awards, grant date fair value is determined under the option-pricing model (Black-Scholes-Merton) and for awards other than option awards, grant date fair value is determined on the basis of the fair market value of a Company common share on the date of grant of such awards. The Company recognizes compensation expense for stock-based awards net of estimated forfeitures. Stock-based compensation recognized in the consolidated statements of income for the years ended December 31, 2012, 2013 and 2014 is based on awards ultimately expected to vest. As a result, the expense has been reduced for estimated forfeitures. Forfeitures are estimated at the time of grant and revised, if necessary, in subsequent periods if actual forfeitures differ from such estimates.
(p) Financial instruments and concentration of credit risk
Financial instruments that potentially subject the Company to concentration of credit risk are reflected principally in cash and cash equivalents, short term investments, short term deposits, derivative financial instruments and accounts receivable. The Company places its cash and cash equivalents and derivative financial instruments with corporations and banks with high investment grade ratings, limits the amount of credit exposure with any one corporation or bank and conducts ongoing evaluations of the creditworthiness of the corporations and banks with which it does business. To reduce its credit risk on accounts receivable, the Company conducts ongoing credit evaluations of its clients. GE accounted for 28% and 25% of receivables as of December 31, 2013 and 2014, respectively. GE accounted for 26%, 23% and 20% of revenues for the years ended December 31, 2012, 2013 and 2014, respectively.
(q) Earnings (loss) per share
Basic earnings per share is computed using the weighted average number of common shares outstanding during the period. Diluted earnings per share is computed using the weighted average number of common and dilutive common equivalent shares outstanding during the period. For the purposes of calculating diluted earnings per share, the treasury stock method is used for stock-based awards except where the results would be anti-dilutive.
(r) Commitments and contingencies
Liabilities for loss contingencies arising from claims, assessments, litigation, fines and penalties, and other sources are recorded when it is probable that a liability has been incurred and the amount of the assessment and/or remediation can be reasonably estimated. Legal costs incurred in connection with such liabilities are expensed as incurred.
F-19
Table of Contents
GENPACT LIMITED AND ITS SUBSIDIARIES
Notes to the Consolidated Financial Statements
(In thousands, except per share data and share count)
2. Summary of significant accounting policies (Continued)
(s) Recently adopted accounting pronouncements
The authoritative bodies release standards and guidance which are assessed by management for impact on the Company’s consolidated financial statements.
The following recently released accounting standards have been adopted by the Company. Adoption of these standards did not have a material impact on the Company’s consolidated results of operations, cash flows, financial position or disclosures:
| • | Effective January 1, 2014, the Company adopted FASB ASU 2013-05, Foreign Currency Matters (Topic 830): Parent’s Accounting for the Cumulative Translation Adjustment upon De-recognition of Certain Subsidiaries or Groups of Assets within a Foreign Entity or of an Investment in a Foreign Entity(“ASU 2013-05”). This new guidance requires that the parent release any related cumulative translation adjustment into net income only if the sale or transfer results in the complete or substantially complete liquidation of the foreign entity in which the subsidiary or group of assets had resided. |
| • | Effective January 1, 2014, the Company adopted FASB ASU 2013-11, Income Taxes (Topic 740): Presentation of an Unrecognized Tax Benefit When a Net Operating Loss Carryforward, a Similar Tax Loss, or a Tax Credit Carryforward Exists (“ASU 2013-11”). This new guidance requires an entity to present an unrecognized tax benefit, or a portion of an unrecognized tax benefit, as a reduction to a deferred tax asset for a net operating loss carryforward, a similar tax loss, or a tax credit carryforward, except as follows: to the extent a net operating loss carryforward, a similar tax loss, or a tax credit carryforward is not available at the reporting date under the tax law of the applicable jurisdiction to settle any additional income taxes that would result from the disallowance of a tax position or the tax law of the applicable jurisdiction does not require the entity to use, and the entity does not intend to use, the deferred tax asset for such purpose, the unrecognized tax benefit should be presented in the financial statements as a liability and should not be combined with deferred tax assets. |
(t) Reclassification
Certain reclassifications have been made in the consolidated financial statements of prior periods to conform to the classification used in the current period. The impact of such reclassifications on the consolidated financial statements is not material.
3. Business acquisitions and divestitures
A. Acquisitions
(a) Acquisition of delivery center in Japan
On November 4, 2014, the Company acquired from Hitachi Management Partner, Corp., a finance and accounting service delivery center in Japan. In connection with the acquisition, the Company entered into a five year business process outsourcing agreement with Hitachi Ltd. The purchase consideration for the acquisition is set forth below:
| Cash consideration after preliminary adjustment for pension underfunding and closing net assets value |
$ | 10,599 | ||
| Fair value of contingent earn-out consideration (ranging from $0 to $15,750) |
11,198 | |||
| Total preliminary estimated purchase consideration |
$ | 21,797 |
F-20
Table of Contents
GENPACT LIMITED AND ITS SUBSIDIARIES
Notes to the Consolidated Financial Statements
(In thousands, except per share data and share count)
3. Business acquisitions and divestitures (Continued)
The contingent earn-out consideration for this acquisition is based on additional work contracted by the delivery center for the period from November 4, 2014 to November 4, 2021. The total consideration paid by the Company at the closing of the transaction was $7,108, net of cash acquired of $3,491. With this acquisition, the Company expands its presence in Japan and strengthens its finance and accounting service offering.
As of the date of these financial statements, the purchase consideration is pending final adjustment for pension underfunding and closing date net assets value, which may result in a corresponding adjustment to goodwill during the measurement period. The Company is also evaluating certain pension assets , pension liabilities and tax positions with respect to this acquisition which, when determined, may result in the recognition of additional assets and liabilities as of the acquisition date. Changes to the preliminary recorded assets and liabilities may result in a corresponding adjustment to goodwill. The measurement period will not exceed one year from the acquisition date.
The following table summarizes the allocation of the preliminary estimated purchase price based on the fair value of the assets acquired and the liabilities assumed as of the date of acquisition:
| Preliminary estimated purchase price |
$ | 21,797 | ||
| Acquisition related costs included in selling, general and administrative expenses as incurred |
796 | |||
| Recognized amounts of identifiable assets acquired and liabilities assumed |
||||
| Net assets acquired |
(323 | ) | ||
| Customer related intangible assets |
7,522 | |||
| Deferred tax asset/(liability), net |
(2,496 | ) | ||
| Total identifiable net assets acquired |
$ | 4,703 | ||
| Goodwill |
17,094 | |||
| Total |
$ | 21,797 |
Goodwill has been allocated to the China reporting unit and is non-deductible for tax purposes as the Company has not recorded any tax benefit for amortization. The above customer related intangible assets have a weighted average amortization period of 7 years.
The results of operations of the delivery center, which was named as Genpact Japan Business Services K.K., and the fair value of its assets and liabilities are included in the Company’s Consolidated Financial Statements with effect from November 4, 2014, the date of the acquisition.
(b) Pharmalink Consulting Limited and Pharmalink Consulting Inc.
On May 29, 2014, the Company acquired 100% of the outstanding equity interest in each of Pharmalink Consulting Limited, a company incorporated under the laws of England and Wales, and Pharmalink Consulting Inc., a California corporation (collectively referred to as “Pharmalink”). The purchase consideration for the acquisition is set forth below:
| Cash consideration after preliminary adjustment for net debt and working capital |
$ | 125,901 | ||
| Fair value of contingent earn-out consideration (ranging from $0 to $27,405) |
12,730 | |||
| Total preliminary estimated purchase consideration |
$ | 138,631 |
The contingent earn-out consideration is based on gross profits and order bookings of sustainable outsourcing contracts for the period from June 1, 2014 to June 30, 2016. The total consideration paid at closing
F-21
Table of Contents
GENPACT LIMITED AND ITS SUBSIDIARIES
Notes to the Consolidated Financial Statements
(In thousands, except per share data and share count)
3. Business acquisitions and divestitures (Continued)
for the Company’s acquisition of Pharmalink was $123,701, net of cash acquired of $2,200. Pharmalink is a provider of regulatory affairs services to the life sciences industry. With this acquisition, the Company adds regulatory consulting, outsourcing and operations capabilities for clients in the life sciences industry.
As of the date of these financial statements, the purchase consideration and the allocation for the acquisition are pending final adjustment for working capital and net debt, which may result in a corresponding adjustment to goodwill during the measurement period. Changes to the preliminary recorded assets and liabilities may result in a corresponding adjustment to goodwill. The measurement period will not exceed one year from the acquisition date.
During the quarter ended December 31, 2014, the Company recorded a measurement period adjustment that resulted in a non-current liability of $585 and a corresponding indemnification asset with no impact on goodwill. The measurement period adjustment did not have a significant impact on the Company’s Consolidated Statements of Income, Balance Sheets or Cash Flows in any period and, thus, was recorded during the period ended December 31, 2014.
The following table summarizes the preliminary allocation of the estimated purchase price based on the fair value of the assets acquired and the liabilities assumed as of the date of acquisition including measurement period adjustments:
| Preliminary estimated purchase price |
$ | 138,631 | ||
| Acquisition related costs included in selling, general and administrative expenses as incurred |
1,977 | |||
| Recognized amounts of identifiable assets acquired and liabilities assumed |
||||
| Net assets acquired |
7,174 | |||
| Intangible assets |
29,923 | |||
| Deferred tax asset/(liability), net |
(8,419 | ) | ||
| Total identifiable net assets acquired |
$ | 28,678 | ||
| Goodwill |
109,953 | |||
| Total |
$ | 138,631 |
Goodwill has been allocated to the India reporting unit and is not deductible for tax purposes. The intangible assets consist of customer related and marketing related intangible assets with a weighted average amortization period of 6 years.
The results of operations of Pharmalink and the fair value of its assets and liabilities are included in the Company’s Consolidated Financial Statements with effect from May 29, 2014, the date of the acquisition.
(c) Third Pillar Systems, Inc.
On August 30, 2013, the Company acquired certain assets, including contracts, and assumed certain liabilities of Third Pillar Systems, Inc., a Nevada corporation (“Third Pillar”), a provider of software solutions for the commercial lending and leasing industry, for cash consideration of $2,500. As a part of the transaction, the Company also hired employees of Third Pillar. With this transaction, the Company has acquired an integrated set of processes and assets capable of independently providing returns to the Company. There are no contingent consideration arrangements in connection with the acquisition. Of the cash consideration of $2,500, the Company held back $225 in accordance with the terms of the asset purchase agreement.
F-22
Table of Contents
GENPACT LIMITED AND ITS SUBSIDIARIES
Notes to the Consolidated Financial Statements
(In thousands, except per share data and share count)
3. Business acquisitions and divestitures (Continued)
The following table summarizes the allocation of the purchase price based on the fair value of assets acquired and liabilities assumed as of the acquisition date:
| Cash Consideration |
$ | 2,500 | ||
| Recognized amounts of identifiable assets acquired and liabilities assumed |
||||
| Net assets acquired |
199 | |||
| Intangible assets |
298 | |||
| Total identifiable net assets acquired |
$ | 497 | ||
| Goodwill |
2,003 | |||
| Total |
$ | 2,500 |
Through this transaction, the Company has acquired an end-to-end platform and processes to supplement its commercial lending and leasing portfolio, thereby strengthening the Company’s service offerings in this industry. Goodwill representing the excess of the purchase consideration over the net assets acquired is deductible for tax purposes and has been allocated to the India reporting unit. The intangible assets in the table above include a technology-related intangible asset with an estimated useful life of 8 years.
The results of operations of the business acquired from Third Pillar and the fair values of the assets acquired and liabilities assumed have been included in the Company’s Consolidated Financial Statements with effect from August 30, 2013, the date of the acquisition.
(d) NGEN Media Services Private Limited
On March 28, 2013, the Company acquired the remaining 50% of the outstanding equity interest in NGEN Media Services Private Limited (“NGEN”), a private limited company organized under the laws of India, and thereby increased its interest from 50% to 100%, providing the Company control over NGEN as a wholly-owned subsidiary. NGEN is engaged in the business of media services outsourcing.
The Company acquired the remaining 50% equity interest for cash consideration of $158. There are no contingent consideration arrangements in connection with the acquisition. The Company previously accounted for its 50% interest in NGEN as an equity-method investment.
The results of operations of NGEN and the fair value of its assets and liabilities have been included in the Company’s Consolidated Financial Statements with effect from March 28, 2013, the date of the acquisition.
(e) Jawood Business Process Solutions, LLC and Felix Software Solutions Private Limited
On February 6, 2013, the Company acquired 100% of the outstanding membership interest in Jawood Business Process Solutions, LLC, (“Jawood”) a Michigan limited liability company, for cash consideration of $51,000, subject to adjustment based on closing date net working capital, indebtedness and cash and cash equivalents. There are no contingent consideration arrangements in connection with the acquisition.
The transaction also included the acquisition of 100% of the outstanding shares of Felix Software Solutions Private Limited, (“Felix”) a company organized under the laws of India, for cash consideration of $2,295, subject to adjustment based on closing date net working capital. There are no contingent consideration arrangements in connection with the acquisition of Felix.
F-23
Table of Contents
GENPACT LIMITED AND ITS SUBSIDIARIES
Notes to the Consolidated Financial Statements
(In thousands, except per share data and share count)
3. Business acquisitions and divestitures (Continued)
Jawood and Felix (collectively referred to as the “Jawood Business”) are, respectively, U.S. and India based providers of business consulting and information technology services to the healthcare payer industry. Felix is a key subcontractor to Jawood. This transaction strengthened the Company’s solutions and services offerings in the healthcare payer market.
Pursuant to the terms of the acquisition agreements, the purchase consideration for the Jawood Business is comprised of the following:
| Purchase consideration after adjustment for closing date net debt working capital, indebtedness and cash |
$ | 48,576 | ||
| Seller expenses |
(1,379 | ) | ||
| Total purchase price |
$ | 47,197 |
During the third quarter ended September 30, 2013, the Company recorded a measurement period adjustment that resulted in a $1,089 decrease in the purchase consideration with a corresponding change in goodwill. The measurement period adjustment did not have a significant impact on the Company’s consolidated statements of income, balance sheets or cash flows in any period and, thus, were recorded during the period ended September 30, 2013. The total amount paid by the Company to acquire the Jawood Business, net of cash acquired of $1,364 and including seller expenses amounting to $1,379, was $47,212.
The following table summarizes the allocation of the purchase price based on the fair value of the assets acquired and liabilities assumed as of the date of the acquisition, including measurement period adjustments:
| Purchase price |
$ | 47,197 | ||
| Acquisition related costs included in selling, general and administrative expenses as incurred |
310 | |||
| Recognized amounts of identifiable assets acquired and liabilities assumed |
||||
| Net assets acquired |
1,171 | |||
| Intangible assets |
11,200 | |||
| Total identifiable net assets acquired |
$ | 12,371 | ||
| Goodwill |
34,826 | |||
| Total |
$ | 47,197 |
Goodwill, representing the excess of the purchase price over the net assets acquired, has been allocated to the India reporting unit and is deductible for tax purposes to the extent of $32,656. The values and estimated useful lives of the intangible assets are as follows:
| Value | Estimated useful life | |||||
| Customer related intangible assets |
$ | 10,200 | 1 – 7 years | |||
| Marketing related intangible assets |
1,000 | 1 – 5 years | ||||
The weighted average amortization period in respect of the acquired intangible assets is 6 years.
The results of operations of the Jawood business and the fair value of its assets and liabilities have been included in the Company’s Consolidated Financial Statements with effect from February 6, 2013, the date of the acquisition.
F-24
Table of Contents
GENPACT LIMITED AND ITS SUBSIDIARIES
Notes to the Consolidated Financial Statements
(In thousands, except per share data and share count)
3. Business acquisitions and divestitures (Continued)
B. Divestitures
(a) Hello Communications (Shanghai) Co., Ltd.
On February 22, 2013, the Company completed the divestiture of Hello Communications (Shanghai) Co., Ltd., a provider of offshore tele-sales and other voice-based support services to telecom carriers and IT/telecom equipment manufacturers in Asia, for cash consideration of $998, resulting in loss of $447. The expected loss on the sale was recorded within other income (expense), net in the Consolidated Statements of Income for the year ended December 31, 2012 and did not materially differ from the actual realized loss. The balance of cash and cash equivalents of Hello Communications (Shanghai) Co., Ltd. on the date of sale was $2,047, resulting in a net cash outflow of $1,049. The results of operations of Hello Communications (Shanghai) Co., Ltd. are not material to the Company’s results of operations or financial condition and, therefore, are not reflected as discontinued operations for the periods presented.
(b) Clearbizz B.V.
On September 13, 2013, the Company completed the divestiture of Clearbizz, B.V., a provider of electronic invoicing services in the Netherlands, for cash consideration of $1, resulting in a loss of $1,184, which has been recorded within other income (expense), net in the Consolidated Statements of Income. The results of operations of Clearbizz B.V. are not material to the Company’s results of operations or financial condition and, therefore, are not reflected as discontinued operations for the periods presented.
(c) Gantthead.com, Inc.
On December 31, 2013, the Company completed the divestiture of Gantthead.com, Inc., the operator of an online technology portal for project management, for cash consideration of $3,171, resulting in a loss of $2,303, which has been recorded within other income (expense), net in the Consolidated Statements of Income. The results of operations of Gantthead.com, Inc. are not material to the Company’s results of operations or financial condition and, therefore, are not reflected as discontinued operations for the periods presented.
4. Cash and cash equivalents
Cash and cash equivalents as of December 31, 2013 and 2014 comprise:
| As of December 31, | ||||||||
| 2013 | 2014 | |||||||
| Deposits with banks |
$ | 123,545 | $ | 130,610 | ||||
| Other cash and bank balances |
447,731 | 331,178 | ||||||
|
|
|
|
|
|||||
| Total |
$ | 571,276 | $ | 461,788 | ||||
|
|
|
|
|
|||||
F-25
Table of Contents
GENPACT LIMITED AND ITS SUBSIDIARIES
Notes to the Consolidated Financial Statements
(In thousands, except per share data and share count)
5. Accounts receivable, net of reserve for doubtful receivables
The following table provides details of the reserve for doubtful receivables recorded by the Company:
| As of December 31, | ||||||||||||
| 2012 | 2013 | 2014 | ||||||||||
| Opening Balance as of January 1 |
$ | 8,704 | $ | 9,073 | $ | 16,560 | ||||||
| Additions due to acquisitions |
184 | — | 178 | |||||||||
| Additions charged to expense |
3,878 | 11,420 | 3,107 | |||||||||
| Deductions |
(3,693 | ) | (3,933 | ) | (4,653 | ) | ||||||
|
|
|
|
|
|
|
|||||||
| Closing Balance |
$ | 9,073 | $ | 16,560 | $ | 15,192 | ||||||
|
|
|
|
|
|
|
|||||||
Accounts receivable were $521,677 and $540,946 and the reserves for doubtful receivables were $16,560 and $15,192, resulting in net accounts receivable balances of $505,117 and $525,754 as of December 31, 2013 and 2014, respectively. In addition, accounts receivable due after one year of $15,844 and $11,635 as of December 31, 2013 and 2014, respectively, are included under other assets in the Consolidated Balance Sheets.
Accounts receivable from related parties were $403 and $5,840, and the reserve for doubtful receivables was $0 and $0, resulting in net accounts receivable balances of $403 and $5,840 as of December 31, 2013 and 2014, respectively.
6. Fair Value Measurements
The Company measures certain financial assets and liabilities, including derivative instruments, at their fair values on a recurring basis. The fair value measurements of these derivative instruments were determined using the following inputs as of December 31, 2013 and 2014:
| As of December 31, 2013 | ||||||||||||||||
| Fair Value Measurements at Reporting Date Using | ||||||||||||||||
| Quoted Prices in Active Markets for Identical Assets |
Significant Other Observable Inputs |
Significant Other Unobservable Inputs |
||||||||||||||
| Total | (Level 1) | (Level 2) | (Level 3) | |||||||||||||
| Assets |
||||||||||||||||
| Derivative instruments (Note a) |
$ | 7,963 | $ | — | $ | 7,963 | $ | — | ||||||||
|
|
|
|
|
|
|
|
|
|||||||||
| Total |
$ | 7,963 | $ | — | $ | 7,963 | $ | — | ||||||||
|
|
|
|
|
|
|
|
|
|||||||||
| Liabilities |
||||||||||||||||
| Derivative instruments (Note b) |
$ | 213,941 | $ | — | $ | 213,941 | $ | — | ||||||||
|
|
|
|
|
|
|
|
|
|||||||||
| Total |
$ | 213,941 | $ | — | $ | 213,941 | $ | — | ||||||||
|
|
|
|
|
|
|
|
|
|||||||||
| As of December 31, 2014 | ||||||||||||||||
| Fair Value Measurements at Reporting Date Using | ||||||||||||||||
| Quoted Prices in Active Markets for Identical Assets |
Significant Other Observable Inputs |
Significant Other Unobservable Inputs |
||||||||||||||
| Total | (Level 1) | (Level 2) | (Level 3) | |||||||||||||
| Assets |
||||||||||||||||
| Derivative instruments (Note a) |
$ | 33,967 | $ | — | $ | 33,967 | $ | — | ||||||||
|
|
|
|
|
|
|
|
|
|||||||||
| Total |
$ | 33,967 | $ | — | $ | 33,967 | $ | — | ||||||||
|
|
|
|
|
|
|
|
|
|||||||||
| Liabilities |
||||||||||||||||
| Derivative instruments (Note b) |
$ | 101,516 | $ | — | $ | 101,516 | $ | — | ||||||||
|
|
|
|
|
|
|
|
|
|||||||||
| Total |
$ | 101,516 | $ | — | $ | 101,516 | $ | — | ||||||||
|
|
|
|
|
|
|
|
|
|||||||||
F-26
Table of Contents
GENPACT LIMITED AND ITS SUBSIDIARIES
Notes to the Consolidated Financial Statements
(In thousands, except per share data and share count)
6. Fair Value Measurements (Continued)
| (a) | Included in prepaid expenses and other current assets and other assets in the consolidated balance sheets. |
| (b) | Included in accrued expenses and other current liabilities and other liabilities in the consolidated balance sheets. |
The Company values its derivative instruments based on market observable inputs including both forward and spot prices for the respective currencies. The quotes are taken from an independent market database.
7. Derivative financial instruments
The Company is exposed to the risk of rate fluctuations on foreign currency assets and liabilities and foreign currency denominated forecasted cash flows. The Company has established risk management policies, including the use of derivative financial instruments to hedge foreign currency assets and liabilities, and foreign currency denominated forecasted cash flows. Derivative financial instruments used by the Company are largely deliverable and non-deliverable forward foreign exchange contracts. The Company enters into these contracts with counterparties that are banks or other financial institutions, and the Company considers the risk of non-performance by the counterparties not to be material. The forward foreign exchange contracts mature between zero and sixty months and the forecasted transactions are expected to occur during the same period.
The following table presents the aggregate notional principal amounts of outstanding derivative financial instruments together with the related balance sheet exposure:
| Notional principal amounts (note a) |
Balance sheet exposure asset (liability) (note b) |
|||||||||||||||
| As of December 31, 2013 |
As of December 31, 2014 |
As of December 31, 2013 |
As of December 31, 2014 |
|||||||||||||
| Foreign exchange forward contracts denominated in: |
||||||||||||||||
| United States Dollars (sell) Indian Rupees (buy) |
$ | 1,143,000 | $ | 1,282,800 | $ | (203,822 | ) | $ | (86,913 | ) | ||||||
| United States Dollars (sell) Mexican Peso (buy) |
9,000 | 5,640 | (268 | ) | (514 | ) | ||||||||||
| United States Dollars (sell) Philippines Peso (buy) |
52,200 | 72,900 | (2,357 | ) | (738 | ) | ||||||||||
| Euro (sell) United States Dollars (buy) |
43,779 | 98,903 | (2,434 | ) | 5,458 | |||||||||||
| Euro (sell) Hungarian Forints (buy) |
4,121 | — | 131 | — | ||||||||||||
| Euro (sell) Romanian Leu (buy) |
61,977 | 81,072 | 1,751 | 562 | ||||||||||||
| Japanese Yen (sell) Chinese Renminbi (buy) |
30,731 | 28,586 | 1,970 | 2,766 | ||||||||||||
| Pound Sterling (sell) United States Dollars (buy) |
94,338 | 133,435 | (4,312 | ) | 4,278 | |||||||||||
| Australian Dollars (sell) United States Dollars (buy) |
85,156 | 104,362 | 3,363 | 7,552 | ||||||||||||
|
|
|
|
|
|||||||||||||
| $ | (205,978 | ) | $ | (67,549 | ) | |||||||||||
|
|
|
|
|
|||||||||||||
| (a) | Notional amounts are key elements of derivative financial instrument agreements but do not represent the amount exchanged by counterparties and do not measure the Company’s exposure to credit or market risks. However, the amounts exchanged are based on the notional amounts and other provisions of the underlying derivative financial instrument agreements. |
| (b) | Balance sheet exposure is denominated in U.S. dollars and denotes the mark-to-market impact of the derivative financial instruments on the reporting date. |
F-27
Table of Contents
GENPACT LIMITED AND ITS SUBSIDIARIES
Notes to the Consolidated Financial Statements
(In thousands, except per share data and share count)
7. Derivative financial instruments (Continued)
FASB guidance on Derivatives and Hedging requires companies to recognize all derivative instruments as either assets or liabilities at fair value in the statement of financial position. In accordance with the FASB guidance on Derivatives and Hedging, the Company designates foreign exchange forward contracts as cash flow hedges for forecasted revenues and the purchase of services. In addition to this program, the Company has derivative instruments that are not accounted for as hedges under the FASB guidance in order to hedge the foreign exchange risks related to balance sheet items such as receivables and intercompany borrowings denominated in currencies other than the underlying functional currency.
The fair value of the derivative instruments and their location in the Company’s financial statements are summarized in the table below:
| Cash flow hedges | Non-designated | |||||||||||||||
| As of December 31, 2013 |
As of December 31, 2014 |
As of December 31, 2013 |
As of December 31, 2014 |
|||||||||||||
| Assets |
||||||||||||||||
| Prepaid expenses and other current assets |
$ | 6,098 | $ | 16,636 | $ | — | $ | 202 | ||||||||
| Other assets |
$ | 1,865 | $ | 17,129 | $ | — | $ | — | ||||||||
| Liabilities |
||||||||||||||||
| Accrued expenses and other current liabilities |
$ | 83,667 | $ | 64,650 | $ | 26 | $ | 965 | ||||||||
| Other liabilities |
$ | 130,248 | $ | 35,901 | $ | — | $ | — | ||||||||
Cash flow hedges
For derivative instruments that are designated and qualify as cash flow hedges, the effective portion of the gain (loss) on the derivative instrument is reported as a component of other comprehensive income (loss) and reclassified into earnings in the same period or periods during which the hedged transaction is recognized in the consolidated statements of income. Gains (losses) on the derivatives representing either hedge ineffectiveness or hedge components excluded from the assessment of effectiveness are recognized in earnings as incurred.
In connection with cash flow hedges, the gains (losses) recorded as a component of other comprehensive income (loss), or OCI, and the related tax effects are summarized below:
| Year Ended December 31, | ||||||||||||||||||||||||||||||||||||
| 2012 | 2013 | 2014 | ||||||||||||||||||||||||||||||||||
| Before- Tax amount |
Tax (Expense) or Benefit |
Net of tax Amount |
Before- Tax amount |
Tax (Expense) or Benefit |
Net of tax Amount |
Before- Tax amount |
Tax (Expense) or Benefit |
Net of tax Amount |
||||||||||||||||||||||||||||
| Opening balance as of January 1 |
$ | (203,006 | ) | $ | 71,125 | $ | (131,881 | ) | $ | (163,756 | ) | $ | 59,070 | $ | (104,686 | ) | $ | (205,952 | ) | $ | 72,612 | $ | (133,340 | ) | ||||||||||||
|
|
|
|
|
|
|
|
|
|
|
|
|
|
|
|
|
|
|
|||||||||||||||||||
| Net gains (losses) reclassified into statement of income on completion of hedged transactions |
(34,927 | ) | 12,651 | (22,276 | ) | (66,812 | ) | 25,239 | (41,573 | ) | (49,161 | ) | 17,498 | (31,663 | ) | |||||||||||||||||||||
| Changes in fair value of effective portion of outstanding derivatives, net |
4,323 | 596 | 4,919 | (109,008 | ) | 38,781 | (70,227 | ) | 90,005 | (31,468 | ) | 58,537 | ||||||||||||||||||||||||
|
|
|
|
|
|
|
|
|
|
|
|
|
|
|
|
|
|
|
|||||||||||||||||||
| Gain (loss) on cash flow hedging derivatives, net |
39,250 | (12,055 | ) | 27,195 | (42,196 | ) | 13,542 | (28,654 | ) | 139,166 | (48,966 | ) | 90,200 | |||||||||||||||||||||||
|
|
|
|
|
|
|
|
|
|
|
|
|
|
|
|
|
|
|
|||||||||||||||||||
| Closing balance as of December 31 |
$ | (163,756 | ) | $ | 59,070 | $ | (104,686 | ) | $ | (205,952 | ) | $ | 72,612 | $ | (133,340 | ) | $ | (66,786 | ) | $ | 23,646 | $ | (43,140 | ) | ||||||||||||
|
|
|
|
|
|
|
|
|
|
|
|
|
|
|
|
|
|
|
|||||||||||||||||||
F-28
Table of Contents
GENPACT LIMITED AND ITS SUBSIDIARIES
Notes to the Consolidated Financial Statements
(In thousands, except per share data and share count)
7. Derivative financial instruments (Continued)
The gains or losses recognized in other comprehensive income (loss) and their effects on financial performance are summarized below:
| Derivatives in |
Amount of Gain (Loss) recognized in OCI on Derivatives (Effective Portion) |
Location of Gain (Loss) reclassified from OCI into Statement of Income (Effective Portion) |
Amount of Gain (Loss) reclassified from OCI into Statement of Income (Effective Portion) |
Location of Gain (Loss) recognized in Income on Derivatives (Ineffective Portion and Amount excluded from Effectiveness Testing) |
Amount of Gain (Loss) recognized in income on Derivatives (Ineffective Portion and Amount excluded from Effectiveness Testing) |
|||||||||||||||||||||||||||||||||||
| Year ended December 31, | Year ended December 31, | Year ended December 31, |
||||||||||||||||||||||||||||||||||||||
| 2012 | 2013 | 2014 | 2012 | 2013 | 2014 | 2012 | 2013 | 2014 | ||||||||||||||||||||||||||||||||
| Forward foreign exchange contracts |
$ | 4,323 | $ | (109,008 | ) | $ | 90,005 | Revenue | $ | (4,432 | ) | $ | 7,548 | $ | (4,301 | ) | Foreign exchange (gains) losses, net |
$ | — | $ | — | $ | — | |||||||||||||||||
| Cost of revenue | (24,183 | ) | (59,929 | ) | (35,539 | ) | ||||||||||||||||||||||||||||||||||
| Selling, general and administrative expenses |
(6,312 | ) | (14,431 | ) | (9,321 | ) | ||||||||||||||||||||||||||||||||||
|
|
|
|
|
|
|
|
|
|
|
|
|
|
|
|
|
|
|
|||||||||||||||||||||||
| $ | 4,323 | $ | (109,008 | ) | $ | 90,005 | $ | (34,927 | ) | $ | (66,812 | ) | $ | (49,161 | ) | $ | — | $ | — | $ | — | |||||||||||||||||||
|
|
|
|
|
|
|
|
|
|
|
|
|
|
|
|
|
|
|
|||||||||||||||||||||||
Non-designated Hedges
| Derivatives not designated as hedging instruments |
Location of (Gain) Loss recognized in Statement of |
Amount of (Gain) Loss recognized in Statement of Income on Derivatives |
||||||||||||
| Year ended December 31, | ||||||||||||||
| 2012 | 2013 | 2014 | ||||||||||||
| Forward foreign exchange contracts (Note a) |
Foreign exchange (gains) losses, net | $ | (3,884 | ) | $ | 18,353 | $ | (287 | ) | |||||
|
|
|
|
|
|
|
|||||||||
| $ | (3,884 | ) | $ | 18,353 | $ | (287 | ) | |||||||
|
|
|
|
|
|
|
|||||||||
| (a) | These forward foreign exchange contracts were entered into to hedge the fluctuations in foreign exchange rates for recognized balance sheet items, such as receivables and intercompany borrowings, and were not originally designated as hedges under FASB guidance on derivatives and hedging. Realized (gains) losses and changes in the fair value of these derivatives are recorded in foreign exchange (gains) losses, net in the consolidated statements of income. |
F-29
Table of Contents
GENPACT LIMITED AND ITS SUBSIDIARIES
Notes to the Consolidated Financial Statements
(In thousands, except per share data and share count)
8. Prepaid expenses and other current assets
Prepaid expenses and other current assets consist of the following:
| As of December 31, | ||||||||
| 2013 | 2014 | |||||||
| Advance taxes |
$ | 65,053 | $ | 61,251 | ||||
| Deferred transition costs |
37,050 | 40,185 | ||||||
| Derivative instruments |
6,098 | 16,838 | ||||||
| Employee advances |
5,397 | 5,816 | ||||||
| Advances to suppliers |
1,994 | 3,358 | ||||||
| Prepaid expenses |
12,569 | 12,949 | ||||||
| Customer acquisition cost |
1,904 | 5,557 | ||||||
| Deposits |
3,896 | 1,754 | ||||||
| Others |
5,152 | 7,772 | ||||||
|
|
|
|
|
|||||
| $ | 139,113 | $ | 155,480 | |||||
|
|
|
|
|
|||||
9. Property, plant and equipment, net
Property, plant and equipment, net consist of the following:
| As of December 31, | ||||||||
| 2013 | 2014 | |||||||
| Land |
$ | 10,566 | $ | 10,324 | ||||
| Buildings |
48,743 | 46,272 | ||||||
| Furniture and fixtures |
30,275 | 33,908 | ||||||
| Computer equipment and servers |
163,106 | 176,572 | ||||||
| Plant, machinery and equipment |
61,514 | 68,139 | ||||||
| Computer software |
87,443 | 93,054 | ||||||
| Leasehold improvements |
86,937 | 89,770 | ||||||
| Vehicles |
6,506 | 6,607 | ||||||
| Capital work in progress |
7,803 | 7,314 | ||||||
|
|
|
|
|
|||||
| Property, plant and equipment, gross |
$ | 502,893 | $ | 531,960 | ||||
| Less: Accumulated depreciation and amortization |
(329,689 | ) | (356,024 | ) | ||||
|
|
|
|
|
|||||
| Property, plant and equipment, net |
$ | 173,204 | $ | 175,936 | ||||
|
|
|
|
|
|||||
Depreciation expense on property, plant and equipment for the years ended December 31, 2012, 2013 and 2014 was $46,046, $46,408 and $44,029, respectively. The amount of computer software amortization for the years ended December 31, 2012, 2013 and 2014 was $11,613, $9,949 and $9,105, respectively.
The depreciation and amortization expense includes the effect of the reclassification of foreign exchange (gains) losses related to the effective portion of the foreign currency derivative contracts, amounting to $1,570, $3,542 and $2,070 for the years ended December 31, 2012, 2013 and 2014, respectively.
Property, plant and equipment, net include assets held under capital lease arrangements amounting to $3,524 and $3,435 as of December 31, 2013 and December 31, 2014, respectively. Depreciation expense in respect of these assets was $1,830, $1,726 and $1,786 for the years ended December 31, 2012, 2013 and 2014, respectively.
F-30
Table of Contents
GENPACT LIMITED AND ITS SUBSIDIARIES
Notes to the Consolidated Financial Statements
(In thousands, except per share data and share count)
10. Goodwill and intangible assets
The following table presents changes in goodwill for the years ended December 31, 2013 and 2014:
| As of December 31, | ||||||||
| 2013 | 2014 | |||||||
| Opening balance |
$ | 956,064 | $ | 953,849 | ||||
| Goodwill relating to acquisitions consummated during the period |
37,918 | 127,047 | ||||||
| Goodwill relating to divestitures consummated during the period |
(3,450 | ) | — | |||||
| Impact of measurement period adjustments |
(362 | ) | — | |||||
| Effect of exchange rate fluctuations |
(36,321 | ) | (23,682 | ) | ||||
|
|
|
|
|
|||||
| Closing balance |
$ | 953,849 | $ | 1,057,214 | ||||
|
|
|
|
|
|||||
Goodwill has been allocated to the following reporting units, which represent different business units of the Company, as follows:
| As of December 31, | ||||||||
| 2013 | 2014 | |||||||
| India |
$ | 384,533 | $ | 477,969 | ||||
| China |
45,699 | 60,585 | ||||||
| Europe |
44,146 | 39,189 | ||||||
| Americas |
46,583 | 46,583 | ||||||
| Headstrong |
432,888 | 432,888 | ||||||
|
|
|
|
|
|||||
| $ | 953,849 | $ | 1,057,214 | |||||
|
|
|
|
|
|||||
In line with the Company’s strategy, during the year ended December 31, 2013, the Company integrated a portion of the IT business within the Company’s India reporting unit with the Headstrong reporting unit. This integration enabled the Company to leverage business experience, knowledge, and resources more effectively and to provide a global service delivery model. Accordingly, goodwill attributable to the IT business included in the India reporting unit prior to and including the year ended December 31, 2012 is being reported as a component of the Headstrong reporting unit beginning with the year ended December 31, 2013. The Company tested goodwill allocated to the transferred IT Business for impairment prior to the integration with the Headstrong reporting unit for events and conditions identified in accordance with the guidance in ASC 350, “Intangibles—Goodwill and Other.” The fair value of this goodwill was calculated using a discounted cash flow model using estimated future cash flows. Further, the Company tested the goodwill of each of the India reporting unit, the transferred IT business and the Headstrong reporting unit before and after such integration and concluded that the fair value of each such reporting unit or portion thereof exceeded its respective book value.
In the year ended December 31, 2013, the Company performed an assessment of qualitative factors to determine whether events or circumstances exist that may lead to a determination that it is more likely than not that the fair value of a reporting unit is less than its carrying amount. Based on such assessment, the Company concluded, with respect to all reporting units other than the Americas and Headstrong, ,that it is not more likely than not that the fair value of any such reporting unit is less than its carrying amount. Accordingly, the Company performed the quantitative assessment of goodwill impairment for the Americas and Headstrong reporting units. Based on the quantitative assessment for these two reporting units, the Company concluded that there is no impairment in the year ended December 31, 2013 and the fair value of these two reporting units exceeded their respective carrying values.
F-31
Table of Contents
GENPACT LIMITED AND ITS SUBSIDIARIES
Notes to the Consolidated Financial Statements
(In thousands, except per share data and share count)
10. Goodwill and intangible assets (Continued)
In the year ended December 31, 2014, in accordance with ASU 2011-08, the Company performed an assessment of qualitative factors to determine whether events or circumstances exist that may lead to a determination that it is more likely than not that the fair value of a reporting unit is less than its carrying amount. Based on its assessment, the Company concluded that it is not more likely than not that the fair value of a reporting unit is less than its carrying amount for all reporting units.
The total amount of goodwill deductible for tax purposes is $38,512 and $37,628 as of December 31, 2013 and 2014, respectively.
The Company’s intangible assets acquired either individually or with a group of other assets or in a business combination are as follows:
| As of December 31, 2013 | As of December 31, 2014 | |||||||||||||||||||||||
| Gross carrying amount |
Accumulated amortization |
Net | Gross carrying amount |
Accumulated amortization |
Net | |||||||||||||||||||
| Customer-related intangible assets |
$ | 288,983 | $ | 213,878 | $ | 75,105 | $ | 310,069 | $ | 228,095 | $ | 81,974 | ||||||||||||
| Marketing-related intangible assets |
37,919 | 20,545 | 17,374 | 43,137 | 23,801 | 19,336 | ||||||||||||||||||
| Other intangible assets |
10,245 | 3,608 | 6,637 | 19,002 | 5,768 | 13,234 | ||||||||||||||||||
|
|
|
|
|
|
|
|
|
|
|
|
|
|||||||||||||
| $ | 337,147 | $ | 238,031 | $ | 99,116 | $ | 372,208 | $ | 257,664 | $ | 114,544 | |||||||||||||
|
|
|
|
|
|
|
|
|
|
|
|
|
|||||||||||||
Amortization expenses for intangible assets disclosed in the consolidated statements of income under amortization of acquired intangible assets for the years ended December 31, 2012, 2013 and 2014 were $23,233, $23,645 and $28,543, respectively. Intangible assets recorded for the 2004 reorganization, when the Company began operating independently from GE, include the incremental value of the minimum volume commitment of GE at the time of the 2004 reorganization over the value of the pre-existing customer relationship with GE. The amortization of this intangible asset for the years ended December 31, 2012, 2013 and 2014 was $72, $0 and $0, respectively, and has been reported as a reduction of revenue.
The estimated amortization schedule for the Company’s intangible assets for future periods is set out below:
| For the year ending December 31: |
||||
| 2015 |
$ | 27,577 | ||
| 2016 |
22,987 | |||
| 2017 |
19,902 | |||
| 2018 |
16,316 | |||
| 2019 and beyond |
27,762 | |||
|
|
|
|||
| $ | 114,544 | |||
|
|
|
F-32
Table of Contents
GENPACT LIMITED AND ITS SUBSIDIARIES
Notes to the Consolidated Financial Statements
(In thousands, except per share data and share count)
11. Other assets
Other assets consist of the following:
| As of December 31, | ||||||||
| 2013 | 2014 | |||||||
| Customer acquisition cost |
$ | 6,088 | $ | 15,035 | ||||
| Advance taxes |
7,839 | 27,381 | ||||||
| Deferred transition costs |
27,818 | 37,230 | ||||||
| Deposits |
23,287 | 24,989 | ||||||
| Derivative instruments |
1,865 | 17,129 | ||||||
| Prepaid expenses |
4,895 | 2,565 | ||||||
| Accounts Receivable due after one year |
15,844 | 11,635 | ||||||
| Others |
9,729 | 10,742 | ||||||
|
|
|
|
|
|||||
| $ | 97,365 | $ | 146,706 | |||||
|
|
|
|
|
|||||
12. Leases
The Company has leased vehicles, furniture and fixtures, computer equipment and servers, and plants, machinery and equipment from various lessors under capital lease arrangements which are not material to the consolidated financial statements.
The Company conducts its operations using facilities under non-cancellable operating lease agreements that expire at various dates. Future minimum lease payments under these agreements are as follows:
| Year ending December 31: |
||||
| 2015 |
$ | 48,191 | ||
| 2016 |
45,628 | |||
| 2017 |
37,894 | |||
| 2018 |
28,956 | |||
| 2019 |
24,888 | |||
| 2020 and beyond |
89,737 | |||
|
|
|
|||
| Total minimum lease payments |
$ | 275,294 | ||
|
|
|
Rental expenses in agreements with rent holidays and scheduled rent increases are recorded on a straight-line basis over the applicable lease term. Rent expenses under cancellable and non-cancellable operating leases were $49,912, $55,450 and $57,178 for the years ended December 31, 2012, 2013 and 2014, respectively.
The rental expenses set out above include the effect of reclassification of foreign exchange (gains) losses related to the effective portion of foreign currency derivative contracts amounting to $1,112, $2,851 and $1,823 for the years ended December 31, 2012, 2013 and 2014, respectively.
F-33
Table of Contents
GENPACT LIMITED AND ITS SUBSIDIARIES
Notes to the Consolidated Financial Statements
(In thousands, except per share data and share count)
13. Accrued expenses and other current liabilities
Accrued expenses and other current liabilities consist of the following:
| As of December 31, | ||||||||
| 2013 | 2014 | |||||||
| Accrued expenses |
$ | 98,988 | $ | 114,770 | ||||
| Accrued employee cost |
126,814 | 143,829 | ||||||
| Deferred transition revenue |
46,895 | 49,792 | ||||||
| Statutory liabilities |
24,466 | 24,713 | ||||||
| Retirement benefits |
14,853 | 16,807 | ||||||
| Derivative instruments |
83,693 | 65,615 | ||||||
| Advance from customers |
18,334 | 19,857 | ||||||
| Earn-out and deferred consideration |
3,492 | 3,232 | ||||||
| Other liabilities |
4,457 | 12,399 | ||||||
|
|
|
|
|
|||||
| $ | 421,992 | $ | 451,014 | |||||
|
|
|
|
|
|||||
14. Long-term debt
In August 2012, the Company obtained credit facilities aggregating $925,000 from a consortium of financial institutions to (i) finance the repayment of the $380,000 balance outstanding under the previous existing credit facility, (ii) fund a portion of its special cash dividend discussed in Note 19, and (iii) for general corporate purposes of the Company and its subsidiaries, including working capital requirements. The credit agreement provides for a term loan of $675,000 and a revolving credit facility of $250,000.
In June 2013, the Company amended this credit facility. Under the amended facility, the applicable margin on the term loan and the revolving credit facility has been reduced from 3.25% p.a. to 2.75% p.a. and 2.50% p.a., respectively. In addition, the LIBOR floor on the term loan was reduced from 1% under the earlier facility to 0.75% under the amended facility. As of the amendment date, the gross outstanding term loan amounted to $671,625. The amendment did not result in a substantial modification of $553,589 of the outstanding term loan under the previous credit facility. Further, as a result of the amendment, the Company extinguished $118,036 of the outstanding term loan under the previous credit facility and obtained additional funding amounting to $121,410, increasing the total term loan outstanding to $675,000. As a result, the Company expensed $3,103 representing partial acceleration of the amortization of the existing unamortized debt issuance costs and an additional fee paid to the lenders in respect of the extinguished amount. The overall borrowing capacity under the revolving facility did not change. The amendment of the revolving facility resulted in accelerated amortization of $54 relating to the existing unamortized debt issuance cost. The remaining unamortized costs and an additional third party fee paid in connection with the amendment of the term loan and revolving facility will be amortized over the term of the term loan and revolving facility, which end on August 30, 2019 and August 30, 2017, respectively.
As of December 31, 2013 and December 31, 2014, the outstanding term loan, net of debt amortization expense of $13,761 and $11,274, was $657,864 and $653,602, respectively. As of December 31, 2013 and 2014, the term loan bears interest at LIBOR (LIBOR floor of 0.75%) plus an applicable margin of 2.75% p.a. Indebtedness under the loan facility is secured by certain assets of the Company. The amount outstanding on the term loan as of December 31, 2014 will be repaid through quarterly payments of 0.25% of the principal amount of $675,000, and the balance will be repaid upon the maturity of the term loan on August 30, 2019.
F-34
Table of Contents
GENPACT LIMITED AND ITS SUBSIDIARIES
Notes to the Consolidated Financial Statements
(In thousands, except per share data and share count)
14. Long-term debt (Continued)
The maturity profile of the term loan, net of debt amortization expense, is as follows:
| Year ended |
Amount | |||
| 2015 |
$ | 4,288 | ||
| 2016 |
4,306 | |||
| 2017 |
4,338 | |||
| 2018 |
4,363 | |||
| 2019 |
636,307 | |||
|
|
|
|||
| $ | 653,602 | |||
|
|
|
15. Short-term borrowings
The Company has the following borrowing facilities:
| (a) | Fund-based and non-fund-based credit facilities with banks, which are available for operational requirements in the form of overdrafts, letters of credit, guarantees and short-term loans. As of December 31, 2013 and December 31, 2014, the limits available were $13,906 and $14,282, respectively, out of which $6,689 and $8,138 was utilized, constituting non-funded drawdown. |
| (b) | A fund-based and non-fund based revolving credit facility of $250,000, which was initially entered into in August 2012 and amended in June 2013 as described in note 14. A portion of this facility was initially used to fund the special cash dividend paid in September 2012 and for the acquisition of the Jawood Business in February 2013. Additionally, this facility was utilized to fund in part the Company’s stock purchase pursuant to its March 2014 self-tender offer and its acquisition of Pharmalink, each in the second quarter of 2014. As of December 31, 2013 and December 31, 2014, a total of $4,397 and $137,224, respectively, was utilized, of which $0 and $135,000, respectively, constituted funded drawdown and $4,397 and $2,224, respectively, constituted non-funded drawdown. This facility expires in August 2017. The funded drawdown amount bears interest at LIBOR plus a margin of 2.50% as of both December 31, 2013 and December 31, 2014. The unutilized amount on the facility bears a commitment fee of 0.50%. Indebtedness under the facility is secured by certain assets of the Company, and the credit agreement contains certain covenants, including a maximum leverage covenant that becomes effective only if the revolving facility is drawn for $50,000 or more. For the year ended December 31, 2014, the Company is in compliance with all of the financial covenants. |
F-35
Table of Contents
GENPACT LIMITED AND ITS SUBSIDIARIES
Notes to the Consolidated Financial Statements
(In thousands, except per share data and share count)
16. Other liabilities
Other liabilities consist of the following:
| As of December 31, | ||||||||
| 2013 | 2014 | |||||||
| Accrued employee cost |
$ | 5,103 | $ | 5,121 | ||||
| Deferred transition revenue |
47,405 | 52,419 | ||||||
| Retirement benefits |
24,330 | 29,652 | ||||||
| Derivative instruments |
130,248 | 35,901 | ||||||
| Amount received from GE under indemnification arrangement, pending adjustment |
7,839 | 5,129 | ||||||
| Advance from customers |
8,000 | 6,000 | ||||||
| Earn-out and deferred consideration |
9,857 | 30,758 | ||||||
| Others |
10,102 | 11,662 | ||||||
|
|
|
|
|
|||||
| $ | 242,884 | $ | 176,642 | |||||
|
|
|
|
|
|||||
17. Employee benefit plans
The Company has employee benefit plans in the form of certain statutory and other schemes covering its employees.
Defined benefit plans
In accordance with Indian law, the Company provides a defined benefit retirement plan (the “Gratuity Plan”) covering substantially all of its Indian employees. The Gratuity Plan provides a lump-sum payment to vested employees upon retirement or termination of employment in an amount based on each employee’s salary and duration of employment with the Company. The Gratuity Plan benefit cost for the year is calculated on an actuarial basis. The Company contributes the required funding for all ascertained liabilities to the Genpact India Employees’ Gratuity Fund. Trustees administer contributions made to the trust, and contributions are invested in specific designated instruments as permitted by Indian law. The Company’s overall investment strategy is to invest predominantly in fixed income funds managed by asset management companies. These funds further invest in debt securities such as money market instruments, government securities and public and private bonds. During the years ended December 31, 2012, 2013 and 2014, all of the plan assets were primarily invested in debt securities.
In addition, in accordance with Mexican law, the Company provides certain termination benefits to its Mexican employees (the “Mexican Plan”) based on the age, duration of service and salary of each eligible employee. The Mexican Plan benefit cost for the year is calculated on an actuarial basis.
In addition, certain of the Company’s subsidiaries organized or operating in the Philippines and Japan have sponsored defined benefit retirement programs (respectively, the “Philippines Plan” and the “Japan Plan”). The benefit costs of the Japan Plan and the Philippines Plan for the year are calculated on an actuarial basis. The Philippines Plan and the Japan Plan are funded and Company contributions in respect of these benefits are made to insurer-managed funds or to a trust. The trust contributions are further invested in government bonds.
F-36
Table of Contents
GENPACT LIMITED AND ITS SUBSIDIARIES
Notes to the Consolidated Financial Statements
(In thousands, except per share data and share count)
17. Employee benefit plans (Continued)
Current service costs for defined benefit plans are accrued in the year to which they relate on a monthly basis. Actuarial gains or losses, or prior service costs, if any, resulting from amendments to the plans are recognized and amortized over the remaining period of service of the employees or over the average remaining life expectancies for inactive employees if most of the plan obligations are payable to inactive employees.
The following table sets forth the funded status of the defined benefit plans and the amounts recognized in the Company’s financial statements based on an actuarial valuation carried out as of December 31, 2013 and 2014.
| As of December 31, | ||||||||
| 2013 | 2014 | |||||||
| Change in benefit obligation |
||||||||
| Projected benefit obligation at the beginning of the year |
$ | 29,821 | $ | 28,596 | ||||
| Service cost |
4,511 | 4,721 | ||||||
| Actuarial loss (gain) |
(1,310 | ) | 1,843 | |||||
| Interest cost |
2,104 | 2,410 | ||||||
| Liabilities assumed on acquisition |
— | 3,967 | ||||||
| Benefits paid |
(2,996 | ) | (3,736 | ) | ||||
| Effect of exchange rate changes |
(3,534 | ) | (1,356 | ) | ||||
|
|
|
|
|
|||||
| Projected benefit obligation at the end of the year |
$ | 28,596 | $ | 36,445 | ||||
|
|
|
|
|
|||||
| Change in fair value of plan assets |
||||||||
| Fair value of plan assets at the beginning of the year |
$ | 14,957 | $ | 22,798 | ||||
| Employer contributions |
12,325 | 7,139 | ||||||
| Actual gain on plan assets |
1,037 | 1,907 | ||||||
| Assets assumed on acquisition |
— | 2,825 | ||||||
| Acturial gain/(loss) |
(6 | ) | (6 | ) | ||||
| Benefits paid |
(2,996 | ) | (3,736 | ) | ||||
| Effect of exchange rate changes |
(2,519 | ) | (1,206 | ) | ||||
|
|
|
|
|
|||||
| Fair value of plan assets at the end of the year |
$ | 22,798 | $ | 29,721 | ||||
|
|
|
|
|
|||||
Amounts included in other comprehensive income (loss) as of December 31, 2013 and 2014 were as follows:
| As of December 31, | ||||||||
| 2013 | 2014 | |||||||
| Net actuarial loss |
$ | (5,659 | ) | $ | (7,178 | ) | ||
| Deferred tax assets |
1,765 | 2,178 | ||||||
|
|
|
|
|
|||||
| Other comprehensive income, net |
$ | (3,894 | ) | $ | (5,000 | ) | ||
|
|
|
|
|
|||||
F-37
Table of Contents
GENPACT LIMITED AND ITS SUBSIDIARIES
Notes to the Consolidated Financial Statements
(In thousands, except per share data and share count)
17. Employee benefit plans (Continued)
Changes in other comprehensive income (loss) during the year ended December 31, 2014 were as follows:
| 2014 | ||||
| Net Actuarial loss |
$ | (1,674 | ) | |
| Amortization of net actuarial loss |
411 | |||
| Deferred income taxes |
413 | |||
| Effect of exchange rate changes |
(256 | ) | ||
|
|
|
|||
| Other comprehensive income (loss), net |
$ | (1,106 | ) | |
|
|
|
|||
Net defined benefit plan costs for the years ended December 31, 2012, 2013 and 2014 include the following components:
| Year ended December 31, | ||||||||||||
| 2012 | 2013 | 2014 | ||||||||||
| Service costs |
$ | 4,047 | $ | 4,511 | $ | 4,721 | ||||||
| Interest costs |
1,807 | 2,104 | 2,410 | |||||||||
| Amortization of actuarial loss |
854 | 421 | 419 | |||||||||
| Expected return on plan assets |
(961 | ) | (968 | ) | (1,719 | ) | ||||||
|
|
|
|
|
|
|
|||||||
| Net Defined Benefit Plan costs |
$ | 5,747 | $ | 6,068 | $ | 5,831 | ||||||
|
|
|
|
|
|
|
|||||||
The amount in other comprehensive income (loss) that is expected to be recognized as a component of net periodic benefit cost over the next fiscal year is $5,582.
The weighted average assumptions used to determine the benefit obligations of the Gratuity Plan as of December 31, 2013 and 2014 are presented below:
| As of December 31, | ||||
| 2013 | 2014 | |||
| Discount rate |
9.55% | 8.50%-8.55% | ||
| Rate of increase in compensation per annum |
5.20%-11.00% | 5.20%-11.00% | ||
The weighted average assumptions used to determine the Gratuity Plan costs for the years ended December 31, 2012, 2013 and 2014 are presented below:
| Year ended December 31, | ||||||
| 2012 | 2013 | 2014 | ||||
| Discount rate |
9.30%-9.70% | 8.85% | 9.50%-9.55% | |||
| Rate of increase in compensation per annum |
5.20%-11.00% | 5.20%-11.00% | 5.20%-11.00% | |||
| Expected long term rate of return on plan assets per annum |
7.30%-8.50% | 8.50% | 8.50% | |||
F-38
Table of Contents
GENPACT LIMITED AND ITS SUBSIDIARIES
Notes to the Consolidated Financial Statements
(In thousands, except per share data and share count)
17. Employee benefit plans (Continued)
The weighted average assumptions used to determine the benefit obligations of the Mexican Plan as of December 31, 2013 and 2014 are presented below:
| As of December 31, | ||||||||
| 2013 | 2014 | |||||||
| Discount rate |
6.50 | % | 6.50 | % | ||||
| Rate of increase in compensation per annum |
5.50 | % | 5.50 | % | ||||
The weighted average assumptions used to determine the Mexico Plan costs for the years ended December 31, 2012, 2013 and 2014 are presented below:
| Year ended December 31, | ||||||||||||
| 2012 | 2013 | 2014 | ||||||||||
| Discount rate |
6.50 | % | 6.50 | % | 6.50 | % | ||||||
| Rate of increase in compensation per annum |
5.50 | % | 5.50 | % | 5.50 | % | ||||||
| Expected long term rate of return on plan assets per annum |
0.00 | % | 0.00 | % | 0.00 | % | ||||||
The weighted average assumptions used to determine the benefit obligation of the Japan Plans as of December 31, 2013 and 2014 are presented below:
| As of December 31, | ||||||
| 2013 | 2014 | |||||
| Discount rate |
0.50 | % | 0.24%-1.44% | |||
| Rate of increase in compensation per annum |
0.00 | % | 0.00% | |||
The weighted average assumptions used to determine the Japan Plans costs for the years ended December 31, 2012, 2013 and 2014 are presented below:
| Year ended December 31, | ||||||||||
| 2012 | 2013 | 2014 | ||||||||
| Discount rate |
0.90 | % | 0.90 | % | 0.50%-1.44% | |||||
| Rate of increase in compensation per annum |
0.00 | % | 0.00 | % | 0.00% | |||||
| Expected long term rate of return on plan assets per annum |
2.69 | % | 2.69 | % | 2.69% | |||||
The foregoing expected returns on plan assets are based on the Company’s expectation of the average long-term rate of return expected to prevail over the next 15 to 20 years on the types of investments prescribed by the statutory pattern of investment.
The Company assesses these assumptions with its projected long-term plans of growth and prevalent industry standards. Unrecognized actuarial loss is amortized over the average remaining service period of the active employees expected to receive benefits under the plan.
F-39
Table of Contents
GENPACT LIMITED AND ITS SUBSIDIARIES
Notes to the Consolidated Financial Statements
(In thousands, except per share data and share count)
17. Employee benefit plans (Continued)
The fair value of the Company’s plan assets as of December 31, 2013 and 2014 by asset category are as follows:
| As of December 31, 2014 | ||||||||||||||||
| Fair Value Measurements at Reporting Date Using | ||||||||||||||||
| Quoted Prices in Active Markets for Identical Assets |
Significant Other Observable Inputs |
Significant Other Unobservable Inputs |
||||||||||||||
| Total | (Level 1) | (Level 2) | (Level 3) | |||||||||||||
| Asset Category |
||||||||||||||||
| Cash |
$ | 6,104 | $ | 6,104 | $ | — | $ | — | ||||||||
| Fixed Income Securities (Note a) |
21,532 | 4,053 | 17,479 | — | ||||||||||||
| Other Securities (Note b) |
2,085 | 512 | 1,573 | — | ||||||||||||
|
|
|
|
|
|
|
|
|
|||||||||
| Total |
$ | 29,721 | $ | 10,669 | $ | 19,052 | $ | — | ||||||||
|
|
|
|
|
|
|
|
|
|||||||||
| As of December 31, 2013 | ||||||||||||||||
| Fair Value Measurements at Reporting Date Using | ||||||||||||||||
| Quoted Prices in Active Markets for Identical Assets |
Significant Other Observable Inputs |
Significant Other Unobservable Inputs |
||||||||||||||
| Total | (Level 1) | (Level 2) | (Level 3) | |||||||||||||
| Asset Category |
||||||||||||||||
| Cash |
$ | 10,674 | $ | 10,674 | $ | — | $ | — | ||||||||
| Fixed Income Securities (Note a) |
9,490 | 1,092 | 8,398 | — | ||||||||||||
| Other Securities (Note b) |
2,634 | 1,326 | 1,308 | — | ||||||||||||
|
|
|
|
|
|
|
|
|
|||||||||
| Total |
$ | 22,798 | $ | 13,092 | $ | 9,706 | $ | — | ||||||||
|
|
|
|
|
|
|
|
|
|||||||||
| (a) | Include investments in funds that invest 100% of their assets in fixed income securities such as money market instruments, government securities and public and private bonds. |
| (b) | Include investments in funds that invest primarily in fixed income securities and the remaining portion in equity securities. |
F-40
Table of Contents
GENPACT LIMITED AND ITS SUBSIDIARIES
Notes to the Consolidated Financial Statements
(In thousands, except per share data and share count)
17. Employee benefit plans (Continued)
The expected benefit plan payments set forth below reflect expected future service:
| Year ending December 31, |
||||
| 2015 |
$ | 4,487 | ||
| 2016 |
4,935 | |||
| 2017 |
5,465 | |||
| 2018 |
5,951 | |||
| 2019 |
6,578 | |||
| 2020 – 2024 |
33,833 | |||
|
|
|
|||
| $ | 61,249 | |||
|
|
|
The expected benefit plan payments are based on the same assumptions that were used to measure the Company’s benefit obligations as of December 31, 2014.
Defined contribution plans
During the years ended December 31, 2012, 2013 and 2014, the Company contributed the following amounts to defined contribution plans in various jurisdictions:
| Year ended December 31, | ||||||||||||
| 2012 | 2013 | 2014 | ||||||||||
| India |
$ | 14,102 | $ | 14,443 | $ | 15,272 | ||||||
| China |
10,888 | 14,681 | 14,518 | |||||||||
| U.S. |
3,012 | 3,268 | 5,565 | |||||||||
| U.K. |
1,444 | 1,789 | 3,361 | |||||||||
| Other Regions |
3,738 | 4,641 | 4,355 | |||||||||
|
|
|
|
|
|
|
|||||||
| Total |
33,184 | 38,822 | 43,071 | |||||||||
|
|
|
|
|
|
|
|||||||
18. Stock-based compensation
The Company has issued options under the Genpact Global Holdings 2005 Plan (the “2005 Plan”), Genpact Global Holdings 2006 Plan (the “2006 Plan”), Genpact Global Holdings 2007 Plan (the “2007 Plan”) and Genpact Limited 2007 Omnibus Incentive Compensation Plan (the “2007 Omnibus Plan”) to eligible persons who are employees, directors and certain other persons associated with the Company.
With respect to options granted under the 2005, 2006 and 2007 Plans before the date of adoption of the 2007 Omnibus Plan, if an award granted under any such plan is forfeited or otherwise expires, terminates, or is cancelled without the delivery of shares, then the shares covered by the forfeited, expired, terminated, or cancelled award will be added to the number of shares otherwise available for grant under the respective plans.
From the date of adoption of the 2007 Omnibus Plan on July 13, 2007, the options forfeited, expired, terminated, or cancelled under any of the plans will be added to the number of shares otherwise available for grant under the 2007 Omnibus Plan. The 2007 Omnibus Plan was amended and restated on April 11, 2012 to increase the number of common shares authorized for issuance by 5,593,200 shares to 15,000,000 shares.
F-41
Table of Contents
GENPACT LIMITED AND ITS SUBSIDIARIES
Notes to the Consolidated Financial Statements
(In thousands, except per share data and share count)
18. Stock-based compensation (Continued)
On August 30, 2012, the Company’s Board of Directors declared a special cash dividend of $2.24 per share. The special cash dividend resulted in an adjustment to stock-based awards under both the 2007 Omnibus Plan and the 2005 Plan. Accordingly, effective September 24, 2012, the payment date of the special cash dividend, the number of common shares authorized for issuance under the 2007 Omnibus Plan was increased by 2,544,327 shares. The number of common shares authorized for issuance under the 2005 Plan was increased by 495,915 shares.
Further, as of December 31, 2012, the number of common shares authorized for issuance under the 2007 Omnibus Plan had been increased by 6,314,496 shares as a result of the termination, expiration or forfeiture of options granted under the Company’s stock incentive plans other than the 2007 Omnibus Plan.
In accordance with the anti-dilutive provisions of the 2005 Plan, 2006 Plan, 2007 Plan and 2007 Omnibus Plan, the Company adjusted both the exercise price and the number of stock based awards outstanding as of the record date of the special cash dividend. The aggregate fair value, intrinsic value and the ratio of the exercise price to the market price were approximately equal immediately before and after the adjustments. Therefore, in accordance with the equity restructuring guidance under ASC 718, Compensation-Stock Compensation, no incremental compensation expense was recognized for the adjustment to the outstanding stock-based awards as a result of the special cash dividend.
A brief summary of each plan is provided below:
2005 Plan
Under the 2005 Plan, which was adopted on July 26, 2005, the Company is authorized to issue up to 12,706,665 options (including an increase of 495,915 options representing the adjustment to outstanding stock-based awards as a result of the special cash dividend) to eligible persons and has granted 12,986,802 options (including 583,357 options representing the adjustment to outstanding stock-based awards as a result of the special cash dividend) up to the year ended December 31, 2014.
2006 Plan
Under the 2006 Plan, which was adopted on February 27, 2006, the Company is authorized to issue up to 4,942,369 options to eligible persons and has granted 5,328,697 options (including 68,005 options representing the adjustment to outstanding stock-based awards as a result of the special cash dividend) up to the year ended December 31, 2014.
2007 Plan
Under the 2007 Plan, which was adopted on March 27, 2007, the Company is authorized to issue up to 16,733,250 options to eligible persons and has granted 9,133,255 options (including 486,205 options representing the adjustment to outstanding stock-based awards as a result of the special cash dividend) up to the year ended December 31, 2014.
2007 Omnibus Plan
The Company adopted the 2007 Omnibus Plan on July 13, 2007 and amended and restated it on April 11, 2012. The 2007 Omnibus Plan provides for the grant of options intended to qualify as incentive stock options, non-qualified stock options, share appreciation rights, restricted share awards, restricted share units, performance
F-42
Table of Contents
GENPACT LIMITED AND ITS SUBSIDIARIES
Notes to the Consolidated Financial Statements
(In thousands, except per share data and share count)
18. Stock-based compensation (Continued)
units, cash incentive awards and other equity-based or equity-related awards. Under the 2007 Omnibus Plan the Company is authorized to grant awards for the issuance of up to a total of 23,995,184 common shares to eligible persons, of which 12,991,104 options (including 489,071 options representing the adjustment to outstanding stock-based awards as a result of the special cash dividend), 3,680,405 restricted share units (including 272,335 restricted share units representing the adjustment to outstanding stock-based awards as a result of the special cash dividend) and 7,837,377 performance units (including 482,341 performance units representing the adjustment to outstanding stock-based awards as a result of the special cash dividend) have been granted as of December 31, 2014.
Stock-based compensation costs relating to the foregoing plans during the years ended December 31, 2012, 2013 and 2014, were $31,999, $30,901 and $27,773, respectively, and have been allocated to cost of revenue and selling, general, and administrative expenses.
Tax benefits recognized in relation to the stock-based compensation charge during the years ended December 31, 2012, 2013 and 2014 were $8,032, $6,913 and $6,366, respectively. In addition, the Company realized a cash tax benefit of $2,277, $3,368 and $5,061, during the years ended December 31, 2012, 2013 and 2014, respectively. No excess tax benefit was realized on the options exercised during the years ended December 31, 2012, 2013 and 2014 and no amount was recorded through additional paid-in capital due to losses in U.S. subsidiaries.
Stock options
Options granted are subject to vesting requirements. Options granted under the plan are exercisable into common shares of the Company, have a contractual period of ten years and vest over four to five years unless specified otherwise in the applicable award agreement. The Company recognizes compensation cost over the vesting period of the option. Compensation cost is determined at the date of grant by estimating the fair value of an option using the Black-Scholes option-pricing model.
The following table shows the significant assumptions used in connection with the determination of the fair value of options granted in 2013 and 2014. No options were granted in 2012 other than pertaining to the adjustment to outstanding stock options as a result of the special cash dividend paid in September 2012:
| 2013 | 2014 | |||
| Dividend yield |
— | — | ||
| Expected life (in months) |
84 | 84 | ||
| Risk free rate of interest for expected life |
1.55% | 2.18% - 2.29% | ||
| Volatility |
39.39% | 37.27% - 38.34% |
Volatility was calculated based on the historical volatility of the Company during a period equivalent to the estimated term of the option. The Company estimates the expected term of an option using the “simplified method,” which is based on the average of its contractual vesting term. The risk-free interest rate that the Company uses in the option valuation model is based on U.S. Treasury bonds with a term similar to the expected term of the options. The Company has not paid any regular cash dividends in the recent period and does not anticipate doing so in the foreseeable future.
The Company has issued, and intends to continue to issue, new common shares to satisfy stock option exercises under its incentive plans.
F-43
Table of Contents
GENPACT LIMITED AND ITS SUBSIDIARIES
Notes to the Consolidated Financial Statements
(In thousands, except per share data and share count)
18. Stock-based compensation (Continued)
A summary of stock option activity during the years ended December 31, 2012, 2013 and 2014 is set out below:
| Year ended December 31, 2012 | ||||||||||||||||
| Shares arising out of options |
Weighted average exercise price |
Weighted average remaining contractual life (years) |
Aggregate intrinsic value |
|||||||||||||
| Outstanding as of January 1, 2012 |
13,734,820 | $ | 10.58 | 5.4 | $ | — | ||||||||||
| Granted |
— | — | — | — | ||||||||||||
| Forfeited |
(327,590 | ) | 11.28 | — | — | |||||||||||
| Expired |
(81,053 | ) | 15.46 | — | — | |||||||||||
| Exercised |
(2,539,517 | ) | 9.83 | — | 14,748 | |||||||||||
| Adjustment for special cash dividend |
1,626,638 | |||||||||||||||
|
|
|
|
|
|
|
|
|
|||||||||
| Outstanding as of December 31, 2012 |
12,413,298 | $ | 9.29 | 4.2 | $ | 77,017 | ||||||||||
|
|
|
|
|
|
|
|
|
|||||||||
| Vested and exercisable as of December 31, 2012 and expected to vest thereafter (Note a) |
12,271,334 | $ | 9.28 | 4.2 | $ | 76,339 | ||||||||||
| Vested and exercisable as of December 31, 2012 |
10,752,875 | $ | 8.97 | 3.8 | $ | 70,217 | ||||||||||
| Weighted average grant date fair value of grants during the period |
$ | — | ||||||||||||||
| Year ended December 31, 2013 | ||||||||||||||||
| Shares arising out of options |
Weighted average exercise price |
Weighted average remaining contractual life (years) |
Aggregate intrinsic value |
|||||||||||||
| Outstanding as of January 1, 2013 |
12,413,298 | $ | 9.29 | 4.2 | $ | — | ||||||||||
| Granted |
3,483,000 | 19.35 | — | — | ||||||||||||
| Forfeited |
(69,863 | ) | 10.65 | — | — | |||||||||||
| Expired |
(88,295 | ) | 13.26 | — | — | |||||||||||
| Exercised |
(4,635,977 | ) | 9.31 | — | 41,849 | |||||||||||
|
|
|
|
|
|
|
|
|
|||||||||
| Outstanding as of December 31, 2013 |
11,102,163 | $ | 12.40 | 5.2 | $ | 70,512 | ||||||||||
|
|
|
|
|
|
|
|
|
|||||||||
| Vested and exercisable as of December 31, 2013 and expected to vest thereafter (Note a) |
10,759,137 | $ | 12.11 | 5.2 | $ | 70,465 | ||||||||||
| Vested and exercisable as of December 31, 2013 |
7,091,889 | $ | 8.82 | 3.0 | $ | 67,719 | ||||||||||
| Weighted average grant date fair value of grants during the period |
$ | 8.33 | ||||||||||||||
F-44
Table of Contents
GENPACT LIMITED AND ITS SUBSIDIARIES
Notes to the Consolidated Financial Statements
(In thousands, except per share data and share count)
18. Stock-based compensation (Continued)
| Year ended December 31, 2014 | ||||||||||||||||
| Shares arising out of options |
Weighted average exercise price |
Weighted average remaining contractual life (years) |
Aggregate intrinsic value |
|||||||||||||
| Outstanding as of January 1, 2014 |
11,102,163 | $ | 12.40 | 5.2 | $ | — | ||||||||||
| Granted |
520,000 | 17.54 | — | — | ||||||||||||
| Forfeited |
(250,673 | ) | 19.20 | — | — | |||||||||||
| Expired |
(27,228 | ) | 12.32 | — | — | |||||||||||
| Exercised (Note b) |
(3,972,535 | ) | 7.00 | — | 47,399 | |||||||||||
|
|
|
|
|
|
|
|
|
|||||||||
| Outstanding as of December 31, 2014 |
7,371,727 | $ | 15.44 | 5.9 | $ | 27,886 | ||||||||||
|
|
|
|
|
|
|
|
|
|||||||||
| Vested as of December 31, 2014 and expected to vest thereafter (Note a) |
7,073,004 | $ | 15.19 | 5.9 | $ | 27,755 | ||||||||||
| Vested and Exercisable as of December 31, 2014 |
3,542,821 | $ | 11.37 | 3.1 | $ | 26,781 | ||||||||||
| Weighted average grant date fair value of grants during the period |
$ | 7.54 | ||||||||||||||
| (a) | Options expected to vest reflect an estimated forfeiture rate. |
| (b) | Of this, 2,138,601 options have been net settled upon exercise by issuing 1,485,826 shares (net of minimum statutory withholding taxes). |
As of December 31, 2014, the total remaining unrecognized stock-based compensation cost for options expected to vest amounted to $19,651, which will be recognized over the weighted average remaining requisite vesting period of 3.2 years.
Restricted Share Units
The Company has granted restricted share units, or RSUs, under the 2007 Omnibus Plan. Each RSU represents the right to receive one common share. The fair value of each RSU is the market price of one common share of the Company on the date of the grant. The RSUs granted to date have graded vesting schedules of three months to four years. The compensation expense is recognized on a straight-line basis over the vesting term.
A summary of RSUs granted during the years ended December 31, 2012, 2013 and 2014 is set out below:
| Year ended December 31, 2012 | ||||||||
| Number of Restricted Share Units |
Weighted Average Grant Date Fair Value |
|||||||
| Outstanding as of January 1, 2012 |
2,262,153 | $ | 15.27 | |||||
| Granted |
185,551 | 15.95 | ||||||
| Vested (Note b) |
(779,986 | ) | 13.68 | |||||
| Forfeited |
(251,651 | ) | 14.39 | |||||
| Adjustment for special cash dividend |
272,335 | |||||||
|
|
|
|
|
|||||
| Outstanding as of December 31, 2012 |
1,688,402 | $ | 13.74 | |||||
|
|
|
|
|
|||||
| Expected to vest (Note a) |
1,357,447 | |||||||
F-45
Table of Contents
GENPACT LIMITED AND ITS SUBSIDIARIES
Notes to the Consolidated Financial Statements
(In thousands, except per share data and share count)
18. Stock-based compensation (Continued)
| Year ended December 31, 2013 | ||||||||
| Number of Restricted Share Units |
Weighted Average Grant Date Fair Value |
|||||||
| Outstanding as of January 1, 2013 |
1,688,402 | $ | 13.74 | |||||
| Granted |
91,623 | 19.52 | ||||||
| Vested (Note c) |
(683,522 | ) | 14.28 | |||||
| Forfeited |
(224,731 | ) | 13.60 | |||||
|
|
|
|
|
|||||
| Outstanding as of December 31, 2013 |
871,772 | $ | 13.96 | |||||
|
|
|
|
|
|||||
| Expected to vest (Note a) |
802,481 | |||||||
| Year ended December 31, 2014 | ||||||||
| Number of Restricted Share Units |
Weighted Average Grant Date Fair Value |
|||||||
| Outstanding as of January 1, 2014 |
871,772 | $ | 13.96 | |||||
| Granted |
227,248 | 16.58 | ||||||
| Vested (Note d) |
(511,513 | ) | 13.83 | |||||
| Forfeited |
(99,089 | ) | 13.77 | |||||
|
|
|
|
|
|||||
| Outstanding as of Dec 31, 2014 |
488,418 | $ | 15.36 | |||||
|
|
|
|
|
|||||
| Expected to vest (Note a) |
451,721 | |||||||
| (a) | RSUs expected to vest reflect an estimated forfeiture rate. |
| (b) | Of this, 717,448 RSUs were net settled upon vesting by issuing 506,473 shares (net of minimum statutory tax withholding). 102,000 shares vested in the year ended December 2011, shares in respect of which were issued in January 2013 (100,800 shares, net of minimum statutory withholding taxes). Shares in respect of an additional 13,719 RSUs, reflecting an adjustment to the 102,000 vested RSUs as a result of the special cash dividend, were issued in January 2013 (13,557 shares, net of minimum statutory withholding taxes). |
Additionally, as of December 31, 2012, 4,533 RSUs vested (including 533 RSUs reflecting an adjustment to 4,000 vested RSUs as a result of the special cash dividend), shares in respect of which were issued in April 2013 (2,059 shares, net of minimum statutory withholding taxes). 44,286 RSUs vested in the year ended December 31, 2012, shares in respect of which were issued in January 2014 after withholding 681 shares to the extent of the minimum statutory withholding taxes.
| (c) | Of this, 622,465 RSUs were net settled upon vesting by issuing 424,201 shares (net of minimum statutory tax withholding). 61,057 RSUs vested in the year ended December 31, 2013, shares in respect of which were issued in January 2015 after withholding shares to the extent of the minimum statutory withholding taxes. |
| (d) | Of this, 418,821 RSUs were net settled upon vesting by issuing 285,706 shares (net of minimum statutory withholding taxes). 92,692 RSUs vested in the year ended December 31, 2014, shares in respect of which will be issuable on December 31, 2015 after withholding shares to the extent of the minimum statutory withholding taxes. |
As of December 31, 2014, the total remaining unrecognized stock-based compensation cost related to RSUs amounted to $4,433, which will be recognized over the weighted average remaining requisite vesting period of 2.1 years.
F-46
Table of Contents
GENPACT LIMITED AND ITS SUBSIDIARIES
Notes to the Consolidated Financial Statements
(In thousands, except per share data and share count)
18. Stock-based compensation (Continued)
Performance Units
The Company also grants stock awards in the form of Performance Units, or PUs, under the 2007 Omnibus Plan.
The Company granted PUs, each of which represents the right to receive a common share at a future date based on the Company’s performance against specified targets. PUs granted to date have vesting schedules of six months to three years. The fair value of each PU is the market price of one common share of the Company on the date of grant and assumes that performance targets will be achieved. The PUs granted under the plan are subject to cliff or graded vesting. For awards with cliff vesting, the compensation expense is recognized on a straight-line basis over the vesting terms. For awards with graded vesting, compensation expense is recognized over the vesting term of each separately vesting portion. Over the performance period, the number of shares that will be issued will be adjusted upward or downward based upon the probability of achievement of the performance targets. The ultimate number of shares issued and the related compensation cost recognized will be based on a comparison of the final performance metrics to the specified targets.
A summary of PU activity during the years ended December 31, 2012, 2013 and 2014 is set out below:
| Year ended December 31, 2012 | ||||||||||||
| Number of Performance Units |
Weighted Average Grant Date Fair Value |
Maximum Shares Eligible to Receive |
||||||||||
| Outstanding as of January 1, 2012 |
2,271,724 | $ | 15.17 | 3,247,322 | ||||||||
| Granted |
1,200,000 | 15.25 | 1,800,000 | |||||||||
| Vested (Note b) |
(772,745 | ) | 13.28 | (1,149,390 | ) | |||||||
| Forfeited |
(139,809 | ) | 15.56 | (190,053 | ) | |||||||
| Adjustment for special cash dividend |
482,341 | 694,718 | ||||||||||
|
|
|
|
|
|
|
|||||||
| Outstanding as of December 31, 2012 |
3,041,511 | $ | 13.26 | 4,402,597 | ||||||||
|
|
|
|
|
|
|
|||||||
| Expected to vest (Note a) |
2,413,073 | |||||||||||
| Year ended December 31, 2013 | ||||||||||||
| Number of Performance Units |
Weighted Average Grant Date Fair Value |
Maximum Shares Eligible to Receive |
||||||||||
| Outstanding as of January 1, 2013 |
3,041,511 | $ | 13.26 | 4,402,597 | ||||||||
| Granted |
2,025,090 | 18.57 | 3,694,635 | |||||||||
| Vested (Note c) |
(1,024,434 | ) | 12.03 | (1,024,434 | ) | |||||||
| Forfeited |
(426,345 | ) | 15.19 | (550,078 | ) | |||||||
| Addition due to achievement of higher than target performance goals (Note d) |
297,911 | 17.50 | ||||||||||
| Reduction due to achievement of lower than maximum performance goals (Note e) |
(373,702 | ) | ||||||||||
|
|
|
|
|
|
|
|||||||
| Outstanding as of December 31, 2013 |
3,913,733 | $ | 16.44 | 6,149,018 | ||||||||
|
|
|
|
|
|
|
|||||||
| Expected to vest (Note a) |
1,372,781 | |||||||||||
F-47
Table of Contents
GENPACT LIMITED AND ITS SUBSIDIARIES
Notes to the Consolidated Financial Statements
(In thousands, except per share data and share count)
18. Stock-based compensation (Continued)
| Year ended December 31, 2014 | ||||||||||||
| Number of Performance Units |
Weighted Average Grant Date Fair Value |
Maximum Shares Eligible to Receive |
||||||||||
| Outstanding as of January 1, 2014 |
3,913,733 | $ | 16.44 | 6,149,018 | ||||||||
| Granted |
1,337,750 | 16.78 | 2,729,125 | |||||||||
| Vested (Note f) |
(1,469,200 | ) | 14.5 | (1,469,183 | ) | |||||||
| Forfeited (Note g) |
(2,629,463 | ) | 17.30 | (2,664,980 | ) | |||||||
| Addition due to achievement of higher than target performance goals (Note f) |
139,930 | 12.04 | ||||||||||
| Reduction due to achievement of lower than maximum performance goals (Note h) |
(2,095,354 | ) | ||||||||||
|
|
|
|
|
|
|
|||||||
| Outstanding as of December 31, 2014 |
1,292,750 | $ | 16.78 | 2,648,626 | ||||||||
|
|
|
|
|
|
|
|||||||
| Expected to vest (Note a) |
1,153,277 | |||||||||||
| (a) | PUs expected to vest are based on the probable achievement of the performance targets after considering an estimated forfeiture rate. |
| (b) | 28,901 of the PUs shown as vested as of December 31, 2012 represent an adjustment for the special cash dividend with respect to 214,880 PUs that had vested as of December 31, 2011, shares in respect of which were issued in January 2013 (156,511 shares, net of minimum statutory withholding taxes). |
503,969 shares vested in respect of the PUs granted in March 2010 (including the PUs issued as an adjustment to account for the special cash dividend). Shares in respect of such PUs were issued in March 2013 (334,922 shares) and April 2013 (4,679 shares), net of minimum statutory withholding taxes.
231,029 shares vested in the year ended December 31, 2012 in respect of the PUs granted in August 2010. Shares in respect of these PUs were issued in January 2014 after withholding 92,994 shares representing the minimum statutory withholding taxes.
| (c) | 1,033,474 shares and 130,890 shares, respectively, vested in respect of the PUs granted in March and June 2011, respectively. |
| (d) | Represents additional shares issued in respect of the PUs granted in March 2012 due to the achievement of higher-than-target performance. |
| (e) | Represents a reduction in the maximum shares eligible to vest for the PUs granted in March 2012. |
Outstanding PUs as of December 31, 2013 includes 483,999, 1,250,807 and 657,000 shares underlying awards granted in May 2011, March 2013 and May 2013, respectively, for which the performance conditions were not fulfilled.
| (f) | Vested PUs as of December 31, 2014 include an additional 139,930 shares issued for the PUs granted in March 2011 (122,490 shares) and June 2011 (17,440 shares). These shares, in addition to the shares referred to in note (c) above, were issued in March 2014 (697,853 shares) and April 2014 (432 shares) with respect to grants made in March 2011, and 77,619 shares were issued in March 2014 with respect to grants made in June 2011, after withholding shares to the extent of the minimum statutory withholding taxes. |
Vested PUs as of December 31, 2014 also include 1,329,270 shares for the PUs granted in March 2012 based on the compensation committee’s certification of the achievement of the performance goals for the performance period based on the Company’s audited financial statements. Shares in respect of these PUs were issued in January 2015 after withholding shares to the extent of the minimum statutory withholding taxes.
| (g) | Includes 251,427 shares underlying PUs granted in May 2011, 1,244,507 shares underlying PUs granted in March 2013 and 630,000 shares underlying PUs granted in May 2013, all of which were forfeited due to non-fulfillment of the performance conditions as certified by the compensation committee based on the Company’s audited financial statements. |
F-48
Table of Contents
GENPACT LIMITED AND ITS SUBSIDIARIES
Notes to the Consolidated Financial Statements
(In thousands, except per share data and share count)
18. Stock-based compensation (Continued)
| (h) | Represents a reduction of 333,002 and 39,285 of the maximum shares eligible to vest with respect to PUs granted in March 2011 and June 2011, respectively, as a result of the compensation committee’s certification of the level of achievement of the performance conditions based on the Company’s audited financial statements. Also includes a reduction of 616,568 shares for grants made in March 2013, 985,500 shares for grants made in May 2013 and 121,000 shares for grants made in May 2011, due to non-fulfillment of the performance conditions as certified by the compensation committee based on the Company’s audited financial statements. |
As of December 31, 2014, the total remaining unrecognized stock-based compensation costs related to PUs amounted to $14,267, which will be recognized over the weighted average remaining requisite vesting period of 2.1 years.
Employee Stock Purchase Plan (ESPP)
On May 1, 2008, the Company adopted the Genpact Limited U.S. Employee Stock Purchase Plan and the Genpact Limited International Employee Stock Purchase Plan (together, the “ESPP”).
The ESPP allows eligible employees to purchase the Company’s common shares through payroll deductions at 90% of the fair value of a Company common share on the last business day of each purchase interval. The dollar amount of common shares purchased under the ESPP must not exceed 15% of the participating employee’s base salary, subject to a cap of $25 per employee per calendar year. With effect from September 1, 2009, the offering periods commence on the first business day in March, June, September and December of each year and end on the last business day in the subsequent May, August, November and February of each year. 4,200,000 common shares have been reserved for issuance in the aggregate over the term of the ESPP.
During the year ended December 31, 2012, 2013 and 2014, 86,214, 109,698 and 151,461 common shares, respectively, were issued under ESPP.
The ESPP is considered compensatory under the FASB guidance on Compensation-Stock Compensation.
The compensation expense for the employee stock purchase plan is recognized in accordance with the FASB guidance on Compensation-Stock Compensation. The compensation expense for ESPP during the years ended December 31, 2012, 2013 and 2014 was $153, $228 and $292, respectively, and has been allocated to cost of revenue and selling, general, and administrative expenses.
19. Capital stock
The Company’s authorized capital stock as of December 31, 2013 and 2014 consisted of 500 million common shares with a par value of $0.01 per share, and 250 million preferred shares with a par value of $0.01 per share. Of the above, the Company had 231,262,576 and 218,684,205 common shares, and no preferred shares, issued and outstanding as of December 31, 2013 and 2014, respectively.
Holders of common shares are entitled to one vote per share. Upon the liquidation, dissolution or winding up of the Company, common shareholders are entitled to receive a ratable share of the available net assets of the Company after payment of all debts and other liabilities. The common shares have no preemptive, subscription, redemption or conversion rights.
F-49
Table of Contents
GENPACT LIMITED AND ITS SUBSIDIARIES
Notes to the Consolidated Financial Statements
(In thousands, except per share data and share count)
19. Capital stock (Continued)
The Company’s board of directors by resolution can establish one or more series of preferred shares having such par value, designations, dividend rates, relative voting rights, conversion or exchange rights, redemption rights, liquidation rights and other relative participation, optional or other rights, qualifications, limitations or restrictions as may be fixed by the board of directors without any shareholder approval. Such rights, preferences, powers and limitations as may be established could also have the effect of discouraging an attempt to obtain control of the Company. These preferred shares are of the type commonly known as “blank-check” preferred shares.
Under Bermuda law, the Company may declare and pay dividends from time to time unless there are reasonable grounds for believing that the Company is or would, after the payment, be unable to pay its liabilities as they become due or that the realizable value of its assets would thereby be less than the aggregate of its liabilities, its issued share capital, and its share premium accounts. Under the Company’s bye-laws, each common share is entitled to dividends if, as and when dividends are declared by the Company’s board of directors. There are no restrictions in Bermuda on the Company’s ability to transfer funds (other than funds denominated in Bermuda dollars) in or out of Bermuda or to pay dividends to U.S. residents who are holders of common shares. The Company’s ability to declare and pay cash dividends is restricted by its debt covenants.
Dividend
On August 30, 2012, the Company declared a special cash dividend of $2.24 per share, or approximately $501,620 in aggregate value. The special cash dividend was paid on September 24, 2012 to shareholders of record as of the close of business on September 10, 2012. Further, in accordance with the terms of the Company’s stock-based compensation plans, in order to preserve the value of the stock-based awards outstanding as of the record date, the Company reduced the exercise price per share of each outstanding stock option award and increased the number of shares in relation to the outstanding stock-based awards as of the record date of the special cash dividend.
Stock Purchase
On April 8, 2014, the Company purchased 17,292,842 of its common shares at $17.50 per share for an aggregate cash amount of approximately $302,625 pursuant to the Company’s modified “Dutch Auction” self-tender offer announced on March 5, 2014. Under the terms of the offer the Company was authorized to purchase up to $300,000 of its common shares. The number of shares accepted for purchase included the Company’s exercise of its right to upsize the offer by up to 2% of the Company’s shares then outstanding. The purchased shares have been retired.
Any purchase by the Company of its common shares is accounted for when the transaction is settled. There were no unsettled share purchases as of December 31, 2014. Shares purchased and retired are deducted to the extent of their par value from common stock and from retained earnings for the excess over par value. Direct costs incurred to acquire the shares are included in the total cost of the shares. For the year ended December 31, 2014, $2,543 was deducted from retained earnings as direct costs related to share purchases.
20. Earnings per share
The Company calculates earnings per share in accordance with FASB guidance on Earnings per Share. Basic and diluted earnings per common share give effect to the change in the number of common shares of the Company. The calculation of basic earnings per common share was determined by dividing net income available
F-50
Table of Contents
GENPACT LIMITED AND ITS SUBSIDIARIES
Notes to the Consolidated Financial Statements
(In thousands, except per share data and share count)
20. Earnings per share (Continued)
to common shareholders by the weighted average number of common shares outstanding during the respective periods. The potentially dilutive shares, consisting of outstanding options on common shares, restricted share units, common shares to be issued under the employee stock purchase plan and performance units, have been included in the computation of diluted net earnings per share and the weighted average shares outstanding, except where the result would be anti-dilutive.
The number of stock options outstanding but not included in the computation of diluted earnings per common share because their effect was anti-dilutive is 3,525,625, 2,616,000 and 3,758,000 for the years ended December 31, 2012, 2013 and 2014, respectively.
| Year Ended December 31, | ||||||||||||
| 2012 | 2013 | 2014 | ||||||||||
| Net income available to Genpact Limited common shareholders |
$ | 178,216 | $ | 229,717 | $ | 192,002 | ||||||
| Weighted average number of common shares used in computing basic earnings per common share |
223,696,567 | 229,348,411 | 220,847,098 | |||||||||
| Dilutive effect of stock-based awards |
5,835,949 | 6,405,856 | 4,321,567 | |||||||||
|
|
|
|
|
|
|
|||||||
| Weighted average number of common shares used in computing dilutive earnings per common share |
229,532,516 | 235,754,267 | 225,168,665 | |||||||||
|
|
|
|
|
|
|
|||||||
| Earnings per common share attributable to Genpact Limited common shareholders |
||||||||||||
| Basic |
$ | 0.80 | $ | 1.00 | $ | 0.87 | ||||||
| Diluted |
$ | 0.78 | $ | 0.97 | $ | 0.85 | ||||||
|
|
|
|
|
|
|
|||||||
21. Cost of revenue
Cost of revenue consists of the following:
| Year ended December 31, | ||||||||||||
| 2012 | 2013 | 2014 | ||||||||||
| Personnel expenses |
$ | 795,525 | $ | 904,445 | $ | 943,105 | ||||||
| Operational expenses |
313,432 | 367,213 | 390,441 | |||||||||
| Depreciation and amortization |
48,809 | 47,913 | 44,542 | |||||||||
|
|
|
|
|
|
|
|||||||
| $ | 1,157,766 | $ | 1,319,571 | $ | 1,378,088 | |||||||
|
|
|
|
|
|
|
|||||||
22. Selling, general and administrative expenses
Selling, general and administrative expenses consist of the following:
| Year ended December 31, | ||||||||||||
| 2012 | 2013 | 2014 | ||||||||||
| Personnel expenses |
$ | 314,587 | $ | 347,384 | $ | 419,299 | ||||||
| Operational expenses |
133,173 | 128,982 | 157,755 | |||||||||
| Depreciation and amortization |
8,851 | 8,444 | 8,592 | |||||||||
|
|
|
|
|
|
|
|||||||
| $ | 456,611 | $ | 484,810 | $ | 585,646 | |||||||
|
|
|
|
|
|
|
|||||||
F-51
Table of Contents
GENPACT LIMITED AND ITS SUBSIDIARIES
Notes to the Consolidated Financial Statements
(In thousands, except per share data and share count)
23. Other operating (income) expense, net
| Year ended December 31, | ||||||||||||
| 2012 | 2013 | 2014 | ||||||||||
| Other operating (income) expense |
$ | (3,185 | ) | $ | (3,259 | ) | $ | (3,163 | ) | |||
| Provision for impairment of capital work in progress / property, plant and equipment |
6,214 | 2,373 | — | |||||||||
| Change in fair value of earn out consideration and deferred consideration (relating to business acquisitions) |
(3,013 | ) | (4,670 | ) | (3,707 | ) | ||||||
|
|
|
|
|
|
|
|||||||
| Other operating (income) expense, net |
$ | 16 | $ | (5,556 | ) | $ | (6,870 | ) | ||||
|
|
|
|
|
|
|
|||||||
24. Other income (expense), net
Other income (expense), net consists of the following:
| Year ended December 31, | ||||||||||||
| 2012 | 2013 | 2014 | ||||||||||
| Interest income |
$ | 12,007 | $ | 15,736 | $ | 4,405 | ||||||
| Interest expense* |
(28,121 | ) | (38,876 | ) | (33,800 | ) | ||||||
| Provision (created) reversed for loss on divestures |
(459 | ) | (3,487 | ) | — | |||||||
| Other income (expense) ** |
2,074 | 2,319 | 2,112 | |||||||||
|
|
|
|
|
|
|
|||||||
| Other income (expense), net |
$ | (14,499 | ) | $ | (24,308 | ) | $ | (27,283 | ) | |||
|
|
|
|
|
|
|
|||||||
| * | The years ended December 31, 2012 and 2013 include $5,534 and $3,157, respectively, representing acceleration of the amortization of debt issuance costs relating to the prepayment and termination of the previous credit facility in August 2012, and the amendment of the new credit facility in June 2013 as described in Note 14. |
| ** | The year ended December 31, 2012 includes $17,227, representing 2012 recapitalization expenses, net of reimbursement from GA and OH amounting to $17,000, as described in Note 1. |
25. Income taxes
Income tax expense (benefit) for the years ended December 31, 2012, 2013 and 2014 is allocated as follows:
| Year ended December 31, | ||||||||||||
| 2012 | 2013 | 2014 | ||||||||||
| Income from continuing operations |
$ | 78,419 | $ | 71,100 | $ | 57,419 | ||||||
| Other Comprehensive Income: |
||||||||||||
| Unrealized gains (losses) on cash flow hedges |
12,055 | (13,542 | ) | 48,966 | ||||||||
| Retirement benefits |
(643 | ) | 138 | (413 | ) | |||||||
|
|
|
|
|
|
|
|||||||
| Total income tax expense (benefit) |
$ | 89,831 | $ | 57,696 | $ | 105,972 | ||||||
|
|
|
|
|
|
|
|||||||
F-52
Table of Contents
GENPACT LIMITED AND ITS SUBSIDIARIES
Notes to the Consolidated Financial Statements
(In thousands, except per share data and share count)
25. Income taxes (Continued)
The components of income before income taxes from continuing operations are as follows:
| Year ended December 31, | ||||||||||||
| 2012 | 2013 | 2014 | ||||||||||
| Domestic (U.S.) |
$ | (11,631 | ) | $ | 8,199 | $ | 19,614 | |||||
| Foreign (Non U.S.) |
274,640 | 297,952 | 229,976 | |||||||||
|
|
|
|
|
|
|
|||||||
| Income before income taxes |
$ | 263,009 | $ | 306,151 | $ | 249,590 | ||||||
|
|
|
|
|
|
|
|||||||
Income tax expense (benefit) attributable to income from continuing operations consists of:
| Year ended December 31, | ||||||||||||
| 2012 | 2013 | 2014 | ||||||||||
| Current taxes : |
||||||||||||
| Domestic (U.S. Federal Taxes) |
$ | 2,171 | $ | 1,443 | $ | 3,768 | ||||||
| Domestic (U.S. State Taxes) |
899 | 2,152 | 666 | |||||||||
| Foreign (Non U.S.) |
85,377 | 68,621 | 65,237 | |||||||||
|
|
|
|
|
|
|
|||||||
| $ | 88,447 | $ | 72,216 | $ | 69,671 | |||||||
|
|
|
|
|
|
|
|||||||
| Deferred taxes : |
||||||||||||
| Domestic (U.S. Federal Taxes) |
$ | (7,819 | ) | $ | 8,357 | $ | 2,761 | |||||
| Domestic (U.S. State Taxes) |
546 | (2,216 | ) | (193 | ) | |||||||
| Foreign (Non U.S.) |
(2,755 | ) | (7,257 | ) | (14,820 | ) | ||||||
|
|
|
|
|
|
|
|||||||
| $ | (10,028 | ) | $ | (1,116 | ) | $ | (12,252 | ) | ||||
|
|
|
|
|
|
|
|||||||
| Total income tax expense (benefit) |
$ | 78,419 | $ | 71,100 | $ | 57,419 | ||||||
|
|
|
|
|
|
|
|||||||
Income tax expense (benefit) attributable to income from continuing operations differed from the amounts computed by applying the U.S. federal statutory income tax rate of 35% to income before income taxes, as a result of the following:
| Year ended December 31, | ||||||||||||
| 2012 | 2013 | 2014 | ||||||||||
| Income before income tax expense |
$ | 263,009 | $ | 306,151 | $ | 249,590 | ||||||
| Statutory tax rates |
35 | % | 35 | % | 35 | % | ||||||
| Computed expected income tax expense |
92,053 | 107,153 | 87,356 | |||||||||
| Increase (decrease) in income taxes resulting from: |
||||||||||||
| Foreign tax rate differential |
2,408 | 520 | 2,339 | |||||||||
| Tax benefit from tax holiday |
(25,554 | ) | (39,785 | ) | (35,868 | ) | ||||||
| Tax exempt income |
(1,077 | ) | (7,224 | ) | (8,572 | ) | ||||||
| Non-deductible expenses |
959 | 5,637 | 5,319 | |||||||||
| Effect of change in tax rates |
635 | (2,268 | ) | 176 | ||||||||
| Change in valuation allowance |
12,548 | 1,088 | (2,880 | ) | ||||||||
| Prior year tax expense (benefit) * |
(7,490 | ) | — | — | ||||||||
| Intercompany transfers |
— | — | 2,822 | |||||||||
| Other |
3,937 | 5,979 | 6,727 | |||||||||
|
|
|
|
|
|
|
|||||||
| Reported income tax expense (benefit) |
$ | 78,419 | $ | 71,100 | $ | 57,419 | ||||||
|
|
|
|
|
|
|
|||||||
F-53
Table of Contents
GENPACT LIMITED AND ITS SUBSIDIARIES
Notes to the Consolidated Financial Statements
(In thousands, except per share data and share count)
25. Income taxes (Continued)
| * | During 2012, the Company filed an income tax return in a foreign jurisdiction that resulted in the recognition of a deferred tax asset for a capital loss arising from an earlier period that amounted to $7,490. It was not more likely than not that the capital loss would be realized. Therefore, a full valuation allowance was established to offset the recorded deferred tax asset. |
A portion of the profits of the Company’s operations is exempt from income tax in India. The tax holiday under the STPI Scheme was available for a period of ten consecutive years beginning in the year in which the respective Indian undertaking commenced operations and expired completely as of March 31, 2011. One of the Company’s Indian subsidiaries has fourteen units eligible for tax holiday as a Special Economic Zone unit in respect of 100% of the export profits for a period of 5 years from commencement, 50% of such profits for the next 5 years (year 6 to year 10 from commencement) and 50% of the profits for an additional period of 5 years (year 11 to year 15 from commencement), subject to the satisfaction of certain capital investment requirements. The complete tax holiday for the current SEZ units will start expiring from March 31, 2022 and will fully expire by March 31, 2029.
The basic earnings per share effect of the tax holiday is $0.11, $0.17 and $0.16, respectively, for the years ended December 31, 2012, 2013 and 2014. The diluted earnings per share effect of the tax holiday is $0.11, $0.17 and $0.16, respectively, for the years ended December 31, 2012, 2013 and 2014.
The components of the Company’s deferred tax balances as of December 31, 2013 and 2014 are as follows:
| As of December 31, | ||||||||
| 2013 | 2014 | |||||||
| Deferred tax assets |
||||||||
| Net operating loss carryforwards |
$ | 74,259 | $ | 55,592 | ||||
| Accrued liabilities and other expenses |
17,738 | 14,731 | ||||||
| Provision for doubtful debts |
6,199 | 5,643 | ||||||
| Property, plant and equipment |
5,110 | 4,647 | ||||||
| Unrealized losses on cash flow hedges, net |
74,030 | 24,646 | ||||||
| Share-based compensation |
19,673 | 11,226 | ||||||
| Retirement benefits |
2,718 | 4,517 | ||||||
| Deferred revenue |
38,051 | 41,024 | ||||||
| Tax credit carryforwards |
12,299 | 36,602 | ||||||
| Other |
7,640 | 6,906 | ||||||
|
|
|
|
|
|||||
| Gross deferred tax assets |
$ | 257,717 | $ | 205,534 | ||||
| Less: Valuation allowance |
(24,654 | ) | (21,094 | ) | ||||
|
|
|
|
|
|||||
| Total deferred tax assets |
$ | 233,063 | $ | 184,440 | ||||
|
|
|
|
|
|||||
| Deferred tax liabilities |
||||||||
| Intangible assets |
$ | 29,102 | $ | 29,653 | ||||
| Property, plant and equipment |
4,128 | 4,971 | ||||||
| Deferred cost |
22,490 | 27,261 | ||||||
| Investments in foreign subsidiaries not indefinitely reinvested |
24,948 | 17,429 | ||||||
| Other |
7,530 | 8,415 | ||||||
|
|
|
|
|
|||||
| Total deferred tax liabilities |
$ | 88,198 | $ | 87,729 | ||||
|
|
|
|
|
|||||
| Net deferred tax asset |
$ | 144,865 | $ | 96,711 | ||||
|
|
|
|
|
|||||
F-54
Table of Contents
GENPACT LIMITED AND ITS SUBSIDIARIES
Notes to the Consolidated Financial Statements
(In thousands, except per share data and share count)
25. Income taxes (Continued)
| As of December 31, | ||||||||
| Classified as | 2013 | 2014 | ||||||
| Deferred tax assets |
||||||||
| Current |
$ | 60,638 | $ | 45,486 | ||||
| Non-current |
$ | 89,305 | $ | 59,135 | ||||
| Deferred tax liabilities |
||||||||
| Current |
$ | 614 | $ | 1,239 | ||||
| Non-current |
$ | 4,464 | $ | 6,671 | ||||
|
|
|
|
|
|||||
| $ | 144,865 | $ | 96,711 | |||||
|
|
|
|
|
|||||
The change in the Company’s total valuation allowance for deferred tax assets as of December 31, 2012, 2013 and 2014 is as follows:
| Year ended December 31 | ||||||||||||
| 2012 | 2013 | 2014 | ||||||||||
| Opening valuation allowance |
$ | 11,542 | $ | 23,922 | $ | 24,654 | ||||||
| Reduction during the year |
(364 | ) | (2,643 | ) | (8,662 | ) | ||||||
| Addition during the year |
12,744 | 3,375 | 5,102 | |||||||||
|
|
|
|
|
|
|
|||||||
| Closing valuation allowance |
$ | 23,922 | $ | 24,654 | $ | 21,094 | ||||||
|
|
|
|
|
|
|
|||||||
In assessing the realizability of deferred tax assets, management considers whether it is more likely than not that some or all of the deferred tax assets will not be realized. The ultimate realization of deferred tax assets depends on the generation of future taxable income during the periods in which those temporary differences are deductible. Management considers the scheduled reversal of deferred tax liabilities, projected taxable income and tax planning strategies in making this assessment. In order to fully realize a deferred tax asset, the Company will need to generate future taxable income prior to the expiration of the deferred tax asset governed by the tax code. Based on the level of historical taxable income and projections for future taxable income over the periods during which the Company’s deferred tax assets are deductible, management believes that it is more likely than not that the Company will realize the benefits of these deductible differences, net of the existing valuation allowances at December 31, 2014. The amount of the Company’s deferred tax assets considered realizable, however, could be reduced in the near term if estimates of future taxable income during the carry-forward period are reduced.
In 2014, the Company determined that it was more likely than not that the deferred tax assets of a foreign subsidiary would be partially realized after considering all positive and negative evidence. Prior to 2014, because of significant negative evidence, including a history of losses, an uncertain revenue stream, and potential reorganization activity that could adversely affect the foreign subsidiary’s future operations and profitability on a continuing basis in future years, the Company determined that it was more likely than not that the deferred tax assets would not be realized. However, as of December 31, 2014, such subsidiary had realized cumulative pre-tax income for the preceding three years and has forecasted future pre-tax income sufficient to realize a portion of its deferred tax assets. After consideration of the relative impact of all evidence, both negative and positive, and the weight accorded to each, the Company concluded that it was more likely than not that a portion of the subsidiary’s deferred tax assets would be realized and that the applicable valuation allowance should be partially released up to $3,000.
F-55
Table of Contents
GENPACT LIMITED AND ITS SUBSIDIARIES
Notes to the Consolidated Financial Statements
(In thousands, except per share data and share count)
25. Income taxes (Continued)
As of December 31, 2014, the Company’s deferred tax assets related to net operating loss carry-forwards amounted to $55,592. Net operating losses of subsidiaries in the UK, Hong Kong, Australia, South Africa, Colombia, Brazil, India (unabsorbed depreciation) and Luxembourg amounting to $98,900 can be carried forward for an indefinite period. The remaining tax loss carry-forwards expire as set forth in the table below:
| US - Federal | Europe | Others | ||||||||||
| Year ending December 31, |
||||||||||||
| 2015 |
$ | — | $ | 56 | $ | — | ||||||
| 2016 |
— | 79 | 112 | |||||||||
| 2017 |
— | 147 | 206 | |||||||||
| 2018 |
— | 524 | 75 | |||||||||
| 2019 |
— | — | 116 | |||||||||
| 2020 |
— | — | 1,387 | |||||||||
| 2021 |
— | — | 1,259 | |||||||||
| 2022 |
— | 1,416 | 414 | |||||||||
| 2023 |
— | 11,202 | 5,479 | |||||||||
| 2024 |
— | 330 | 4,972 | |||||||||
| 2025 |
— | 30,515 | 3,918 | |||||||||
| 2026 |
— | 405 | — | |||||||||
| 2030 |
— | 228 | — | |||||||||
| 2031 |
117,303 | 219 | — | |||||||||
| 2032 |
— | 75 | — | |||||||||
| 2033 |
4,538 | — | — | |||||||||
|
|
|
|
|
|
|
|||||||
| $ | 121,841 | $ | 45,196 | $ | 17,938 | |||||||
|
|
|
|
|
|
|
|||||||
Of the total U.S. federal net operating loss carry-forwards of approximately $121,841, $83,377 relates to excess tax deductions resulting from share-based compensation as of December 31, 2014. No federal deferred tax benefit has been recognized for this deduction. If and when realized, the tax benefit associated with this excess deduction will be credited to additional paid-in capital.
As of December 31, 2014, the Company had additional deferred tax assets on U.S. state and local tax loss carry-forwards amounting to $8,002 with varying expiration periods that begin to expire in 2016 through 2033.
As of December 31, 2014, the company had a total alternative minimum tax credit of $22,798, of which $11,709 and $8,597 for India will expire in 2024 and 2025 respectively, and the balance can be carried forward for an indefinite period.
As of December 31, 2014, the company had a total foreign tax credit of $15,296, which will expire as set forth in the table below:
| Year ending December 31, |
Amount | |||
| 2019 |
$ | 106 | ||
| 2020 |
681 | |||
| 2021 |
399 | |||
| 2022 |
778 | |||
| 2023 |
683 | |||
| 2024 |
12,649 | |||
|
|
|
|||
| $ | 15,296 | |||
|
|
|
F-56
Table of Contents
GENPACT LIMITED AND ITS SUBSIDIARIES
Notes to the Consolidated Financial Statements
(In thousands, except per share data and share count)
25. Income taxes (Continued)
Undistributed earnings of the Company’s foreign (non-Bermuda) subsidiaries amounted to approximately $514,823 as of December 31, 2014. The Company plans to indefinitely reinvest such undistributed earnings, except for those earnings for which a deferred tax liability has already been accrued or which can be repatriated in a tax-free manner. Accordingly, with limited exceptions, the Company does not accrue any income, distribution or withholding taxes that would arise if such earnings were repatriated. Due to the Company’s changing corporate structure, the various methods that are available to repatriate earnings, and uncertainty relative to the applicable taxes at the time of repatriation, it is not practicable to determine the amount of tax that would be imposed upon repatriation. If undistributed earnings are repatriated in the future, or are no longer deemed to be indefinitely reinvested, the company will accrue the applicable amount of taxes associated with such earnings at that time.
As of December 31, 2014, $453,976 of the Company’s $461,788 in cash and cash equivalents was held by the Company’s foreign (non-Bermuda) subsidiaries. $9,120 of this cash is held by a foreign subsidiary for which the Company expects to incur and has accrued a deferred tax liability on the repatriation of $8,000 of retained earnings. $106,379 of the cash and cash equivalents held by our foreign subsidiaries is held in jurisdictions where no tax is expected to be imposed upon repatriation.
The following table summarizes activities related to our unrecognized tax benefits for uncertain tax positions from January 1 to December 31 for each of 2012, 2013 and 2014:
| Year Ended December 31, | ||||||||||||
| 2012 | 2013 | 2014 | ||||||||||
| Opening Balance at January 1 |
$ | 23,712 | $ | 21,024 | $ | 21,832 | ||||||
| Increase related to prior year tax positions, including recorded in acquisition accounting |
1,864 | 1,685 | 2,472 | |||||||||
| Decrease related to prior year tax positions |
(3,144 | ) | (1,952 | ) | (1,002 | ) | ||||||
| Decrease related to prior year due to lapse of applicable statute of limitation |
— | — | (753 | ) | ||||||||
| Increase related to current year tax positions, including recorded in acquisition accounting |
1,514 | 2,905 | 442 | |||||||||
| Decrease related to settlements with tax authorities |
(2,492 | ) | — | — | ||||||||
| Effect of exchange rate changes |
(430 | ) | (1,830 | ) | (273 | ) | ||||||
|
|
|
|
|
|
|
|||||||
| Closing Balance at December 31 |
$ | 21,024 | $ | 21,832 | $ | 22,718 | ||||||
|
|
|
|
|
|
|
|||||||
As of December 31, 2012, 2013 and 2014, the Company had unrecognized tax benefits amounting to $20,871, $20,901 and 21,268, respectively, which, if recognized, would impact the effective tax rate.
As of December 31, 2012, 2013 and 2014, the Company has accrued approximately $3,423, $3,373 and $3,417 respectively, for interest relating to unrecognized tax benefits. During the years ended December 31, 2012, 2013 and 2014, the Company recognized approximately $887, $(50) and $44 respectively, for interest expense. As of December 31, 2013, and 2014 the company has accrued $350 and $561 for penalties. No penalties were accrued as of December 31, 2012.
In the next twelve months and for all tax years that remain open to examinations by U.S. federal and various state, local, and non-U.S. tax authorities, the Company estimates that it is reasonably possible that the total amount of its unrecognized tax benefits will vary. However, the Company does not expect significant changes within the next twelve months other than depending on the progress of tax matters or examinations with various tax authorities, which are difficult to predict.
F-57
Table of Contents
GENPACT LIMITED AND ITS SUBSIDIARIES
Notes to the Consolidated Financial Statements
(In thousands, except per share data and share count)
25. Income taxes (Continued)
With exceptions, the Company is no longer subject to U.S. federal, state and local or non-U.S. income tax audits by taxing authorities for years prior to 2009. The Company’s subsidiaries in India and China are open to examination by the relevant taxing authorities for tax years beginning on or after April 1, 2009, and January 1, 2000, respectively. The Company regularly reviews the likelihood of additional tax assessments and adjusts its reserves as additional information or events require.
26. Segment reporting
The Company manages various types of business process and information technology services in an integrated manner for clients in various industries and geographic locations. The Company’s Chief Executive Officer, who has been identified as the Chief Operation Decision Maker (CODM), reviews financial information prepared on a consolidated basis, accompanied by disaggregated information about revenue and adjusted operating income by identified business units. The identified business units are organized for operational reasons and represent either services-based, customer-based, industry-based or geography-based units. There is significant overlap between the manner in which the business units are organized. Additionally, the composition and organization of the business units is fluid and the structure changes regularly in response to growth of the overall business, acquisitions and changes in the reporting structure, clients, services, industries served, and delivery centers.
Based on an overall evaluation of all facts and circumstances and after combining operating segments with similar economic characteristics that comply with other aggregation criteria specified in the FASB guidance on Segment Reporting, the Company has determined that it operates as a single reportable segment.
Net revenues by service type are as follows:
| Year ended December 31, | ||||||||||||
| 2012 | 2013 | 2014 | ||||||||||
| Business Process Outsourcing |
$ | 1,456,171 | $ | 1,608,224 | $ | 1,736,716 | ||||||
| Information Technology Services |
445,800 | 523,773 | 542,722 | |||||||||
|
|
|
|
|
|
|
|||||||
| Total net revenues |
$ | 1,901,971 | $ | 2,131,997 | $ | 2,279,438 | ||||||
|
|
|
|
|
|
|
|||||||
Revenues from clients based on the industry serviced are as follows:
| Year ended December 31, | ||||||||||||
| 2012 | 2013 | 2014 | ||||||||||
| Banking, Financial Services and Insurance |
$ | 796,655 | $ | 888,916 | $ | 940,345 | ||||||
| Manufacturing including Pharmaceuticals and Medical Equipment Manufacturing |
640,553 | 711,184 | 796,872 | |||||||||
| Technology, Healthcare and Other Services |
464,763 | 531,897 | 542,221 | |||||||||
|
|
|
|
|
|
|
|||||||
| Total net revenues |
$ | 1,901,971 | $ | 2,131,997 | $ | 2,279,438 | ||||||
|
|
|
|
|
|
|
|||||||
F-58
Table of Contents
GENPACT LIMITED AND ITS SUBSIDIARIES
Notes to the Consolidated Financial Statements
(In thousands, except per share data and share count)
26. Segment reporting (Continued)
Net revenues from geographic areas based on the location of service delivery centers are as follows. A portion of net revenues attributable to India consists of net revenues for services performed by delivery centers in India or at clients’ premises outside of India by business units or personnel normally based in India.
| Year ended December 31, | ||||||||||||
| 2012 | 2013 | 2014 | ||||||||||
| India |
$ | 1,197,400 | $ | 1,328,201 | $ | 1,505,960 | ||||||
| Asia, other than India |
208,149 | 224,657 | 232,349 | |||||||||
| North and Latin America |
306,260 | 359,774 | 302,515 | |||||||||
| Europe |
190,162 | 219,365 | 238,614 | |||||||||
|
|
|
|
|
|
|
|||||||
| Total net revenues |
$ | 1,901,971 | $ | 2,131,997 | $ | 2,279,438 | ||||||
|
|
|
|
|
|
|
|||||||
Revenues from GE comprised 26%, 23% and 20% of the consolidated total net revenues in 2012, 2013 and 2014, respectively. No other customer accounted for 10% or more of the Company’s consolidated total net revenues during these periods.
Property, plant and equipment, net by geographic areas are as follows:
| As of December 31, | ||||||||
| 2013 | 2014 | |||||||
| India |
$ | 112,971 | $ | 116,734 | ||||
| Asia, other than India |
15,199 | 13,461 | ||||||
| North and Latin America |
35,391 | 36,617 | ||||||
| Europe |
9,643 | 9,124 | ||||||
|
|
|
|
|
|||||
| Total |
$ | 173,204 | $ | 175,936 | ||||
|
|
|
|
|
|||||
27. Related party transactions
The Company has entered into related party transactions with GE and companies in which GE has a majority ownership interest or over which it exerts significant influence (collectively referred to as “GE” herein). During the year ended December 31, 2012, GE’s ownership of Company common shares decreased to less than 5.0% of the Company’s outstanding shares and it ceased to be a related party; accordingly, revenue from GE is no longer presented as related party revenue. Related party transactions during the year ended December 31, 2012 included transactions with a client who had a significant interest in the Company. During the year ended December 31, 2012, such interest decreased to less than 5% of the Company’s outstanding shares and such client is no longer a related party. The Company has also entered into related party transactions with its non-consolidating affiliates and a client in which one of the Company’s directors has a controlling interest. During the year ended December 31, 2013, the Company acquired the remaining equity interest in one of its non-consolidating affiliates, which is now a wholly-owned subsidiary, as described in note 3A(d). The Company has also entered into related party transactions with a significant shareholder and its affiliates. During the year ended December 31, 2014, the Company also entered into related party transactions with its non-consolidating affiliates.
F-59
Table of Contents
GENPACT LIMITED AND ITS SUBSIDIARIES
Notes to the Consolidated Financial Statements
(In thousands, except per share data and share count)
27. Related party transactions (Continued)
The Company’s related party transactions can be categorized as follows:
Revenue from services
For the year ended December 31, 2012, the Company recognized net revenues of $145 from a client in which one of the Company’s directors has a controlling interest.
For the year ended December 31, 2012, the Company recognized net revenues of $405 from a client which has a significant interest in the Company.
For the year ended December 31, 2013, the Company recognized net revenues of $938 from clients which are affiliates of a significant shareholder of the Company.
For the year ended December 31, 2014, the Company recognized net revenues of $285 from a client which is a significant shareholder of the Company.
For the year ended December 31, 2014, the Company recognized net revenues of $5,580, from a client which is one of the non-consolidating affiliates of the Company and this amount is receivable as of December 31, 2014.
Cost of revenue from services
The Company purchases certain services from its non-consolidating affiliates mainly relating to training and recruitment, the costs of which are included in cost of revenue. For the years ended December 31, 2012, 2013 and 2014, cost of revenue includes an amount of $2,458, $2,140 and $2,126, respectively.
Selling, general and administrative expenses
The Company purchases certain services from its non-consolidating affiliates mainly relating to training and recruitment, the costs of which are included in selling, general and administrative expenses. For the years ended December 31, 2012, 2013 and 2014, selling, general and administrative expenses includes an amount of $532, $505 and $613, respectively. Further, for the year ended December 31, 2014, the Company entered into transactions with a significant shareholder of the Company amounting to $900 and the same is outstanding as of December 31, 2014.
Investment in equity affiliates
During the years ended December 31, 2012, 2013 and 2014, the Company made investments of $205, $0 and $5,146, respectively, in its non-consolidating affiliates. As of December 31, 2014, the investment amount is outstanding and has been included in accrued expenses and other current liabilities in the Company’s consolidated balance sheet. Further, in the first quarter of 2013, the Company acquired the balance of the outstanding interest in its non-consolidating affiliate, NGEN for contingent consideration amounting to $158, which resulted in such affiliate becoming a wholly-owned subsidiary. The results of operations and the fair value of the assets and liabilities of such wholly-owned subsidiaries are included in the Company’s Consolidated Financial Statements from the date of acquisition.
F-60
Table of Contents
GENPACT LIMITED AND ITS SUBSIDIARIES
Notes to the Consolidated Financial Statements
(In thousands, except per share data and share count)
27. Related party transactions (Continued)
As of December 31, 2013 and 2014, the Company’s investment in its non-consolidating affiliates amounted to $384 and $494, respectively.
Others
The Company has also entered into transactions with one of its non-consolidating affiliates for certain cost reimbursements amounting to $1,530 that are receivable and have been included in prepaid expenses and other current assets in the consolidated balance sheet.
28. Commitments and contingencies
Capital commitments
As of December 31, 2013 and 2014, the Company has committed to spend $4,491 and $6,073, respectively, under agreements to purchase property, plant and equipment. This amount is net of capital advances paid in respect of these purchases.
Bank Guarantees
The Company has outstanding bank guarantees amounting to $11,086 and $10,362 as of December 31, 2013 and 2014, respectively. Bank guarantees are generally provided to government agencies, excise and customs authorities for the purposes of maintaining a bonded warehouse. These guarantees may be revoked by the government agencies if they suffer any losses or damage through the breach of any of the covenants contained in the agreements governing such guarantees.
Other commitments
The Company’s business process delivery centers in India are 100% export oriented units or Software Technology Parks of India units (“STPI”) under the STPI guidelines issued by the Government of India. These units are exempt from customs, central excise duties, and levies on imported and indigenous capital goods, stores, and spares. The Company has undertaken to pay custom duties, service taxes, levies, and liquidated damages payable, if any, in respect of imported and indigenous capital goods, stores, and spares consumed duty free, in the event that certain terms and conditions are not fulfilled.
F-61
Table of Contents
GENPACT LIMITED AND ITS SUBSIDIARIES
Notes to the Consolidated Financial Statements
(In thousands, except per share data and share count)
29. Quarterly financial data (unaudited)
| Three months ended | Year
ended December 31, 2014 |
|||||||||||||||||||
| March 31, 2014 | June 30, 2014 | September 30, 2014 |
December 31, 2014 |
|||||||||||||||||
| Total net revenues |
$ | 528,190 | $ | 561,611 | $ | 588,107 | $ | 601,530 | $ | 2,279,438 | ||||||||||
| Gross profit |
$ | 203,901 | $ | 221,486 | $ | 233,632 | $ | 242,331 | $ | 901,350 | ||||||||||
| Income from operations |
$ | 77,247 | $ | 73,051 | $ | 72,867 | $ | 70,866 | $ | 294,031 | ||||||||||
| Income before loss(gain) on Equity method investment activity, net and income tax expense |
$ | 67,121 | $ | 62,717 | $ | 61,757 | $ | 62,790 | $ | 254,385 | ||||||||||
| Net Income |
$ | 50,853 | $ | 48,900 | $ | 46,666 | $ | 45,752 | $ | 192,171 | ||||||||||
| Net income attributable to noncontrolling interest |
$ | 240 | $ | (84 | ) | $ | 13 | $ | — | $ | 169 | |||||||||
| Net income attributable to Genpact Limited common shareholders |
$ | 50,613 | $ | 48,984 | $ | 46,653 | $ | 45,752 | $ | 192,002 | ||||||||||
| Earnings per common share attributable to Genpact Limited common shareholders |
||||||||||||||||||||
| Basic |
$ | 0.22 | $ | 0.23 | $ | 0.22 | $ | 0.20 | $ | 0.87 | ||||||||||
| Diluted |
$ | 0.21 | $ | 0.22 | $ | 0.21 | $ | 0.21 | $ | 0.85 | ||||||||||
| Weighted average number of common shares used in computing earnings per common share attributable to Genpact Limited common shareholders |
||||||||||||||||||||
| Basic |
232,093,917 | 217,541,960 | 216,472,908 | 217,279,606 | 220,847,098 | |||||||||||||||
| Diluted |
237,275,651 | 221,509,867 | 220,535,530 | 221,353,612 | 225,168,665 | |||||||||||||||
F-62
Table of Contents
GENPACT LIMITED AND ITS SUBSIDIARIES
Notes to the Consolidated Financial Statements
(In thousands, except per share data and share count)
29. Quarterly financial data (unaudited) (Continued)
| Three months ended | Year
ended December 31, 2013 |
|||||||||||||||||||
| March 31, 2013 | June 30, 2013 | September 30, 2013 |
December 31, 2013 |
|||||||||||||||||
| Total net revenues |
$ | 503,848 | $ | 534,804 | $ | 534,886 | $ | 558,459 | $ | 2,131,997 | ||||||||||
| Gross profit |
$ | 192,122 | $ | 202,090 | $ | 205,597 | $ | 212,617 | $ | 812,426 | ||||||||||
| Income from operations |
$ | 73,949 | $ | 77,988 | $ | 85,957 | $ | 71,633 | $ | 309,527 | ||||||||||
| Income before loss(gain) on Equity method investment activity, net and income tax expense |
$ | 65,456 | $ | 84,633 | $ | 93,320 | $ | 62,573 | $ | 305,982 | ||||||||||
| Net Income |
$ | 48,252 | $ | 65,462 | $ | 71,431 | $ | 49,906 | $ | 235,051 | ||||||||||
| Net income attributable to noncontrolling interest |
$ | 1,515 | $ | 1,586 | $ | 1,169 | $ | 1,064 | $ | 5,334 | ||||||||||
| Net income attributable to Genpact Limited common shareholders |
$ | 46,737 | $ | 63,876 | $ | 70,262 | $ | 48,842 | $ | 229,717 | ||||||||||
| Earnings per common share attributable to Genpact Limited common shareholders |
||||||||||||||||||||
| Basic |
$ | 0.21 | $ | 0.28 | $ | 0.31 | $ | 0.20 | $ | 1.00 | ||||||||||
| Diluted |
$ | 0.20 | $ | 0.27 | $ | 0.30 | $ | 0.21 | $ | 0.97 | ||||||||||
| Weighted average number of common shares used in computing earnings per common share attributable to Genpact Limited common shareholders |
||||||||||||||||||||
| Basic |
227,227,226 | 229,237,503 | 230,057,508 | 230,871,408 | 229,348,411 | |||||||||||||||
| Diluted |
233,620,751 | 235,329,303 | 236,336,924 | 237,730,091 | 235,754,267 | |||||||||||||||
30. Subsequent events
On January 27, 2015, the Company entered into a credit agreement under which it obtained two term loans in an aggregate amount of $672,500. The loans, which were repaid on January 30, 2015, were used in connection with the consummation of certain internal reorganization transactions. Borrowings under the credit agreement bore interest at a rate equal to 2.00% per annum.
F-63
Table of Contents
Pursuant to the requirements of Section 13 or 15(d) of the Securities Exchange Act of 1934, the Registrant has duly caused this report to be signed on its behalf by the undersigned, thereunto duly authorized.
| GENPACT LIMITED | ||
| By: |
/s/ N.V. TYAGARAJAN | |
| N.V. Tyagarajan | ||
| President and Chief Executive Officer | ||
Date: February 27, 2015
POWER OF ATTORNEY
Each person whose signature appears below hereby constitutes and appoints each of Victor Guaglianone and Heather White, as his true and lawful attorney-in-fact and agent, with full powers of substitution and resubstitution, for him and in his name, place and stead, in any and all capacities, to sign any and all amendments to this Annual Report on Form 10-K, and to file the same, with all exhibits thereto, and other documents in connection therewith, with the Securities and Exchange Commission granting to said attorneys-in-fact and agents, and each of them, full power and authority to perform any other act on behalf of the undersigned required to be done in connection therewith.
Pursuant to the requirements of the Securities Exchange Act of 1934, this report has been signed below by the following persons on behalf of the registrant and in the capacities and on the dates indicated.
| Signature |
Title |
Date | ||
| /s/ N.V. TYAGARAJAN N.V. Tyagarajan |
President, Chief Executive Officer and Director (Principal Executive Officer) |
February 27, 2015 | ||
| /s/ EDWARD J. FITZPATRICK Edward J. Fitzpatrick |
Chief Financial Officer (Principal Financial and Accounting Officer) |
February 27, 2015 | ||
| /s/ ROBERT G. SCOTT Robert G. Scott |
Director |
February 27, 2015 | ||
| /s/ AMIT CHANDRA Amit Chandra |
Director |
February 27, 2015 | ||
| /s/ LAURA CONIGLIARO Laura Conigliaro |
Director |
February 27, 2015 | ||
| /s/ DAVID HUMPHREY David Humphrey |
Director |
February 27, 2015 | ||
| /s/ JAMES C. MADDEN James C. Madden |
Director |
February 27, 2015 | ||
| /s/ ALEX MANDL Alex Mandl |
Director |
February 27, 2015 | ||
| /s/ MARK NUNNELLY Mark Nunnelly |
Director |
February 27, 2015 | ||
Table of Contents
| Signature |
Title |
Date | ||
| /s/ HANSPETER SPEK Hanspeter Spek |
Director |
February 27, 2015 | ||
| /s/ MARK VERDI Mark Verdi |
Director |
February 27, 2015 | ||
Table of Contents
| Exhibit Number |
Description | |
| 3.1 |
Memorandum of Association of the Registrant (incorporated by reference to Exhibit 3.1 to Amendment No. 2 of the Registrant’s Registration Statement on Form S-1 (File No. 333-142875) filed with the SEC on July 16, 2007). | |
| 3.3 |
Bye-laws of the Registrant (incorporated by reference to Exhibit 3.3 to Amendment No. 4 of the Registrant’s Registration Statement on Form S-1 (File No. 333-142875) filed with the SEC on August 1, 2007). | |
| 4.1 |
Form of specimen certificate for the Registrant’s common shares (incorporated by reference to Exhibit 4.1 to Amendment No. 4 of the Registrant’s Registration Statement on Form S-1 (File No. 333-142875) filed with the SEC on August 1, 2007). | |
| 10.1 |
Gecis Global Holdings 2005 Stock Option Plan (incorporated by reference to Exhibit 10.10 to the Registrant’s Registration Statement on Form S-1 (File No. 333-142875) filed with the SEC on May 11, 2007).† | |
| 10.2 |
Genpact Global Holdings 2006 Stock Option Plan (incorporated by reference to Exhibit 10.11 to the Registrant’s Registration Statement on Form S-1 (File No. 333-142875) filed with the SEC on May 11, 2007).† | |
| 10.3 |
Genpact Global Holdings 2007 Stock Option Plan (incorporated by reference to Exhibit 10.12 to the Registrant’s Registration Statement on Form S-1 (File No. 333-142875) filed with the SEC on May 11, 2007).† | |
| 10.4 |
Form of Stock Option Agreement (incorporated by reference to Exhibit 10.13 to the Registrant’s Registration Statement on Form S-1 (File No. 333-142875) filed with the SEC on May 11, 2007).† | |
| 10.5 |
Reorganization Agreement dated as of July 13, 2007, by and among the Registrant, Genpact Global (Lux) S.à.r.l., Genpact Global Holdings SICAR S.à.r.l. and the shareholders listed on the signature pages thereto (incorporated by reference to Exhibit 10.17 to Amendment No. 2 of the Registrant’s Registration Statement on Form S-1 (File No. 333-142875) filed with the SEC on July 16, 2007). | |
| 10.6 |
Assignment and Assumption Agreement dated as of July 13, 2007, among the Registrant, Genpact Global Holdings SICAR S.à.r.l. and Genpact International, LLC (incorporated by reference to Exhibit 10.19 to Amendment No. 2 of the Registrant’s Registration Statement on Form S-1 (File No. 333-142875) filed with the SEC on July 16, 2007). | |
| 10.7 |
Form of Director Indemnity Agreement (incorporated by reference to Exhibit 10.21 to Amendment No. 4 of the Registrant’s Registration Statement on Form S-1(File No. 333-142875) filed with the SEC on August 1, 2007).† | |
| 10.8 |
U.S. Employee Stock Purchase Plan and International Employee Stock Purchase Plan (incorporated by reference to Exhibit A to the Registrant’s Proxy Statement filed on Schedule 14A with the SEC on April 3, 2008).† | |
| 10.9 |
Form of RSU Award Agreement (incorporated by reference to Exhibit 10.32 to the Registrant’s Annual Report on Form 10-K (File No. 001-33626) filed with the SEC on February 23, 2010).† | |
| 10.10 |
Form of Performance Share Award Agreement (incorporated by reference to Exhibit 10.1 to the Registrant’s Current Report on Form 8-K (File No. 001-33626) filed with the SEC on March 15, 2010).† | |
| 10.11 |
Form of Performance Share Award Agreement (incorporated by reference to Exhibit 10.1 to the Registrant’s Current Report on Form 8-K (File No. 001-33626) filed with the SEC on March 21, 2011).† | |
| 10.12 |
Form of RSU Award Agreement, as amended (incorporated by reference to Exhibit 10.1 to the Registrant’s Current Report on Form 8-K (File No. 001-33626) filed with the SEC on March 31, 2011).† | |
| 10.13 |
Form of Amended and Restated Genpact Limited 2007 Omnibus Incentive Compensation Plan (incorporated by reference to Exhibit 1 to the Registrant’s Definitive Proxy Statement on Schedule 14A (File No. 001-33626) filed with the SEC on April 15, 2011).† | |
E-1
Table of Contents
| Exhibit Number |
Description | |
| 10.14 |
Agreement and Plan of Merger dated April 5, 2011 among Genpact International, Inc., Hawk International Corporation, Headstrong Corporation, WCAS Hawk Corp. and the Registrant (incorporated by reference to Exhibit 10.1 to the Registrant’s Quarterly Report on Form 10-Q (File No. 001-33626) filed with the SEC on May 10, 2011). | |
| 10.15 |
Employment Agreement by and between the Registrant and N.V. Tyagarajan, dated June 15, 2011 (incorporated by reference to Exhibit 10.1 to the Registrant’s Current Report on Form 8-K (File No. 001-33626) filed with the SEC on June 17, 2011).† | |
| 10.16 |
Employment Agreement by and between Genpact LLC and Patrick Cogny, dated August 5, 2011 (incorporated by reference to Exhibit 10.1 to the Registrant’s Current Report on Form 8-K (File No. 001-33626) filed with the SEC on August 10, 2011).† | |
| 10.17 |
Form of Performance Share Award Agreement (incorporated by reference to Exhibit 10.1 to the Registrant’s Quarterly Report on Form 10-Q (File No. 001-33626) filed with the SEC on May 10, 2012).† | |
| 10.18 |
Performance Share Award Agreement with N.V. Tyagarajan, dated March 6, 2012 (incorporated by reference to the Registrant’s Quarterly Report on Form 10-Q (File No. 001-33626) filed with the SEC on May 10, 2012).† | |
| 10.19 |
Letter Agreement dated August 1, 2012 between the Registrant and South Asia Private Investments (incorporated by reference to Exhibit 10.1 to the Registrant’s Current Report on Form 8-K (File No. 001-33626) filed with the SEC on August 3, 2012). | |
| 10.20 |
Letter Agreement dated August 1, 2012 by and among the Registrant and the shareholders listed on the signature pages thereto (incorporated by reference to Exhibit 10.2 to the Registrant’s Current Report on Form 8-K (File No. 001-33626) filed with the SEC on August 3, 2012). | |
| 10.21 |
Shareholder Agreement dated August 1, 2012 by and among the Registrant and South Asia Private Investments (incorporated by reference to Exhibit 10.3 to the Registrant’s Current Report on Form 8-K (File No. 001-33626) filed with the SEC on August 3, 2012). | |
| 10.22 |
First Amendment to the Genpact Limited 2007 Omnibus Incentive Compensation Plan (as Amended and Restated April 11, 2012), effective as of August 1, 2012 (incorporated by reference to Exhibit 10.4 to the Registrant’s Current Report on Form 8-K (File No. 001-33626) filed with the SEC on August 3, 2012). | |
| 10.23 |
First Amendment to the Genpact Limited International Employee Stock Purchase Plan and U.S. Employee Stock Purchase Plan, effective as of August 1, 2012 (incorporated by reference to Exhibit 10.5 to the Registrant’s Current Report on Form 8-K (File No. 001-33626) filed with the SEC on August 3, 2012). | |
| 10.24 |
Letter Agreement by and between the Registrant and N.V. Tyagarajan, dated August 2, 2012 (incorporated by reference to Exhibit 10.6 to the Registrant’s Current Report on Form 8-K (File No. 001-33626) filed with the SEC on August 3, 2012).† | |
| 10.25 |
Credit Agreement dated as of August 30, 2012 by and among the Registrant, Genpact International, Inc., Headstrong Corporation, Genpact Global Holdings (Bermuda) Limited, Morgan Stanley Senior Funding, Inc., as administrative agent, swingline lender and a term lender, Morgan Stanley Bank, N.A., as issuing bank and a revolving lender, Citigroup Global Markets Inc., as syndication agent and documentation agent, the other joint lead arrangers and joint bookrunning managers identified therein and the other lenders listed on the signature pages thereto (incorporated by reference to Exhibit 10.1 to the Registrant’s Current Report on Form 8-K (File No. 001-33626) filed with the SEC on August 30, 2012). | |
| 10.26 |
Amended and Restated Shareholder Agreement, dated as of October 25, 2012, by and among the Registrant, Glory Investments A Limited, Glory Investments B Limited, Glory Investments IV Limited, Glory Investments IV-B Limited, RGIP, LLC, Twickenham Investment Private Limited and Glory Investments TA IV Limited (incorporated by reference to Exhibit 10.1 to the Registrant’s Current Report on Form 8-K (File No. 001-33626) filed with the SEC on October 25, 2012). | |
E-2
Table of Contents
| Exhibit Number |
Description | |
| 10.27 |
Amendment No. 1, dated as of June 14, 2013, to the Credit Agreement, dated as of August 30, 2012, by and among the Registrant, Genpact International, Inc., Headstrong Corporation, Genpact Global Holdings (Bermuda) Limited, the other subsidiaries of the Registrant party thereto, the lenders party thereto, Morgan Stanley Senior Funding, Inc., as administrative agent and swingline lender, Morgan Stanley Bank, N.A., as issuing bank, and the joint lead arrangers and joint bookrunning managers identified therein (incorporated by reference to Exhibit 10.1 to the Registrant’s Current Report on Form 8-K (File No. 001-33626) filed with the SEC on June 14, 2013). | |
| 10.28 |
Form of Director Indemnity Agreement (incorporated by reference to Exhibit 10.1 to the Registrant’s Quarterly Report on Form 10-Q (File No. 001-33626) filed with the SEC on August 9, 2013).† | |
| 10.29 |
Employment Agreement by and between the Registrant and Edward Fitzpatrick, dated June 26, 2014 (incorporated by reference to Exhibit 10.1 to the Registrant’s Current Report on Form 8-K (File No. 001-33626) filed with the SEC on July 2, 2014). † | |
| 10.30 |
Form of Share Option Agreement with Edward Fitzpatrick (incorporated by reference to Exhibit 10.2 to the Registrant’s Current Report on Form 8-K (File No. 001-33626) filed with the SEC on July 2, 2014). † | |
| 10.31 |
Form of RSU Award Agreement with Edward Fitzpatrick (incorporated by reference to Exhibit 10.3 to the Registrant’s Current Report on Form 8-K (File No. 001-33626) filed with the SEC on July 2, 2014). † | |
| 10.32 |
Form of Director Indemnity Agreement (incorporated by reference to Exhibit 10.1 to the Registrant’s Quarterly Report on Form 10-Q (File No. 001-33626) filed with the SEC on August 8, 2014). † | |
| 21.1 |
Subsidiaries of the Registrant.* | |
| 23.1 |
Consent of KPMG.* | |
| 24.1 |
Powers of Attorney (included on the signature pages of this report).* | |
| 31.1 |
Certification of the Chief Executive Officer pursuant to Rule 13a-14(a) or 15d-14(a) of the Securities Exchange Act of 1934, as adopted pursuant to Section 302 of the Sarbanes-Oxley Act of 2002.* | |
| 31.2 |
Certification of the Chief Financial Officer pursuant to Rule 13a-14(a) or 15d-14(a) of the Securities Exchange Act of 1934, as adopted pursuant to Section 302 of the Sarbanes-Oxley Act of 2002.* | |
| 32.1 |
Certification of the Chief Executive Officer pursuant to 18 U.S.C. Section 1350, as adopted pursuant to Section 906 of the Sarbanes- Oxley Act of 2002.* | |
| 32.2 |
Certification of the Chief Financial Officer pursuant to 18 U.S.C. Section 1350, as adopted pursuant to Section 906 of the Sarbanes-Oxley Act of 2002.* | |
| 101.INS |
XBRL Instance Document (1) | |
| 101.SCH |
XBRL Taxonomy Extension Schema Document (1) | |
| 101.CAL |
XBRL Taxonomy Extension Calculation Linkbase Document (1) | |
| 101.DEF |
XBRL Taxonomy Extension Definition Linkbase Document (1) | |
| 101.LAB |
XBRL Taxonomy Extension Label Linkbase Document (1) | |
| 101.PRE |
XBRL Taxonomy Extension Presentation Linkbase Document (1) | |
| * | Filed with this Annual Report on Form 10-K. |
| † | Indicates a management contract or compensatory plan, contract or arrangement in which any director or executive officer participates. |
| (1) | Attached as Exhibit 101 to this report are the following documents formatted in XBRL (Extensible Business Reporting Language): (i) Consolidated Balance Sheets as of December 31, 2013 and December 31, 2014, (ii) Consolidated Statements of Income for the years ended December 31, 2012, December 31, 2013 and December 31, 2014, (iii) Consolidated Statement of Comprehensive Income (Loss) for the years ended December 31, 2012, December 31, 2013 and December 31, 2014, (iv) Consolidated Statement of Equity for the years ended December 31, 2012, December 31, 2013 and December 31, 2014, (v) Consolidated Statements of Cash Flows for the years ended December 31, 2012, December 31, 2013 and December 31, 2014, and (vi) Notes to Consolidated Financial Statements. |
E-3