Attached files
| file | filename |
|---|---|
| 8-K - 8-K - ANCHOR BANCORP WISCONSIN INC | d919136d8k.htm |
| EX-99.1 - EX-99.1 - ANCHOR BANCORP WISCONSIN INC | d919136dex991.htm |
 First Quarter 2015 Earnings Presentation |
 2
This
presentation
does
not
constitute
an
offer
to
sell,
nor
a
solicitation
of
an
offer
to
buy,
any
securities
of
Anchor
BanCorp
Wisconsin,
Inc.
(“Anchor”
or
the
“Company”)
by
any
person
in
any
jurisdiction
in
which
it
is
unlawful
for
such
person
to
make
such
an
offering
or
solicitation.
Neither the Securities and Exchange Commission nor any other regulatory body has
approved or disapproved of the securities of Anchor or passed upon the accuracy or adequacy of this
presentation. Any representation to the contrary is a criminal offense.
Except as otherwise indicated, this presentation speaks as of the date hereof. The
delivery of this presentation shall not, under any circumstances, create any implication that there has
been no change in the affairs of the Company after the date hereof.
Market
and
other
statistical
data
used
in
this
presentation
has
been
obtained
from
independent
industry
sources
and
publications
as
well
as
from
research
reports
prepared
for
other
purposes. Industry publications and surveys and forecasts generally state that the
information contained therein has been obtained from sources believed to be reliable. Anchor has not
independently verified the data obtained from these sources. Forward-looking
information obtained from these sources is subject to the same qualifications and the additional uncertainties
regarding the other forward-looking statements in this presentation.
From time to time, Anchor may make forward-looking statements that reflect the
Company’s views with respect to, among other things, future events and financial performance. Words such
as “may,”
“should,”
“could,”
“predict,”
“potential,”
“believe,”
“will likely result,”
“expect,”
“continue,”
“will,”
“anticipate,”
“seek,”
“estimate,”
“intend,”
“plan,”
“projection,”
“would”
and “outlook,”
or
the negative version of those words or other comparable words are intended to
identify forward-looking statements, but are not the exclusive means of identifying such statements. These
forward-looking statements are not historical facts, and are based on current
expectations, estimates and projections about the Company’s industry, management’s beliefs and certain
assumptions made by management, many of which, by their nature, are inherently
uncertain and beyond the Company’s control. Accordingly, you are cautioned that any such forward-
looking
statements
are
not
guarantees
of
future
performance
and
are
subject
to
certain
risks,
uncertainties
and
assumptions
that
are
difficult
to
predict.
Although
the
Company
believes
that
the expectations reflected in such forward-looking statements are reasonable as
of the date made, actual results may prove to be materially different from the expected results expressed or
implied by such forward-looking statements. Any forward-looking statement
speaks only as of the date on which it was made, and unless otherwise required by law, the Company does not
undertake any obligation to update or review any forward-looking statements,
whether as a result of new information, future developments or otherwise.
This presentation includes certain non-GAAP financial measures. These
non-GAAP financial measures should be considered only as supplemental to, and not as superior to, financial
measures prepared in accordance with GAAP. Please refer to the Appendix of this
presentation for a reconciliation of the non-GAAP financial measures included in this presentation to the
most directly comparable financial measures prepared in accordance with GAAP.
Cautionary Statement Regarding Forward-Looking
Information and Non-GAAP Financial Information |
 3
Continuing the Recovery & Executing Our
Business Plan
Continue Credit Improvement
Execute Business Development
Strategies
Improve Efficiency
Potential Future Value of the DTA¹
Normalize Excess Capital
Building
Shareholder
Value
1)
“DTA”
refers to Anchor’s deferred tax asset. |
 4
2015 First Quarter Highlights
Asset Quality
Net Interest
Income
Non-Interest
Expense
Non-Interest
Income
Capital
•
Capital remains strong with Common Equity Tier 1 ratio of 15.84%
•
Successful public offering completed in October 2014
•
Market capitalization as of March 31, 2015 of $334 million
•
Non-interest expense lower Q-O-MRQ by $3.6 million or a reduction of 14.8%
•
Announced efficiency initiatives designed to lower non-interest expense
–
anticipating one-time charge in Q2 2015 associated with initiatives
•
Non-interest income exclusive of the Capitol Square building and Richland Center
branch sales higher Q-O-MRQ by $2.2 million or an increase of 33.2%
•
Gain on sale of loans and loan fees up Q-O-MRQ by $1.5 million or 177.9%
•
Deposit Service Fees higher Q-O-Q1 2014 by $0.1 million or an increase of 4.5%
•
Net interest income of $17.1 million during Q1 2015
•
Funded/renewed $111 million of loans during Q1 2015
•
Cost of funds low and stable at 0.23%
•
NPLs down $10.0 million during Q1 2015, or a decline of 28.7%
•
OREO down $4.9 million during Q1 2015, or a decline of 13.7%
•
De-provision of $1.4 million in Q1 2015 |
 5
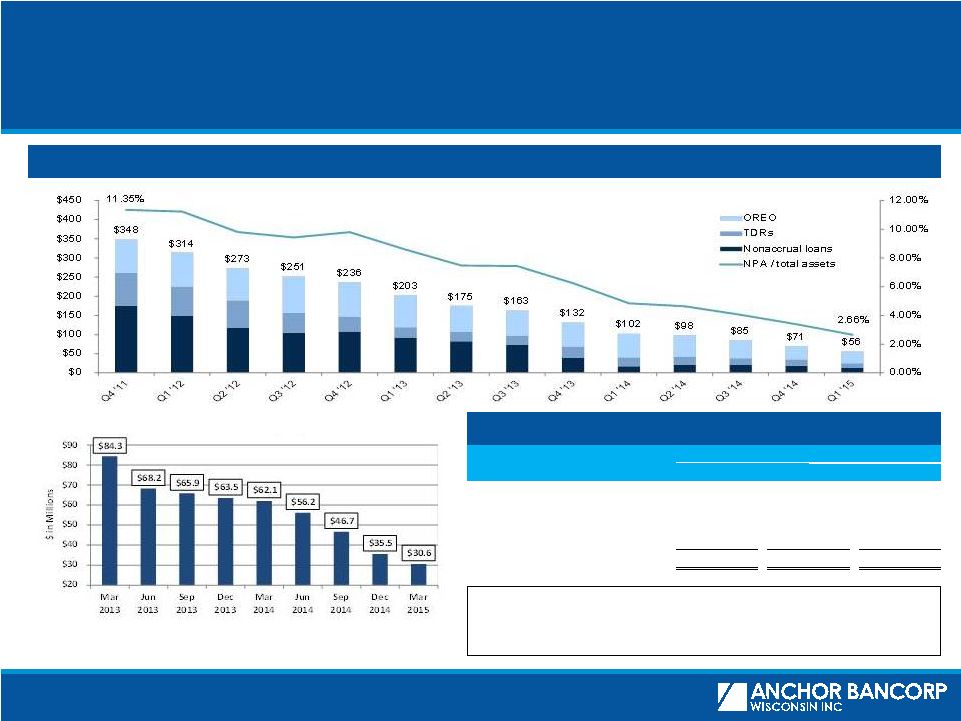
Continued Improving Asset Quality
Proactively managing asset quality
Non-performing Asset Levels ($mm)
1)
Non-performing
loans
and
assets
exclude
troubled
debt
restructurings
that
are
now
accruing.
Source: Anchor SEC filings.
Credit Quality Overview
($000s)
As of
12/31/2013
12/31/2014
3/31/2015
Nonaccrual loans
$39,151
$18,632
$13,248
Troubled debt restructurings¹
29,346
16,483
11,806
OREO
63,460
35,491
30,632
Total nonperforming assets
$131,957
$70,606
$55,686
NPLs / Gross Loans
4.22%
2.22%
1.60%
NPAs / Total Assets
6.25
3.39
2.66
ALLL / Gross Loans
4.02
2.97
3.00
ALLL / NPLs
95.16
133.95
187.74
REO Net Balance by Quarter |
 6
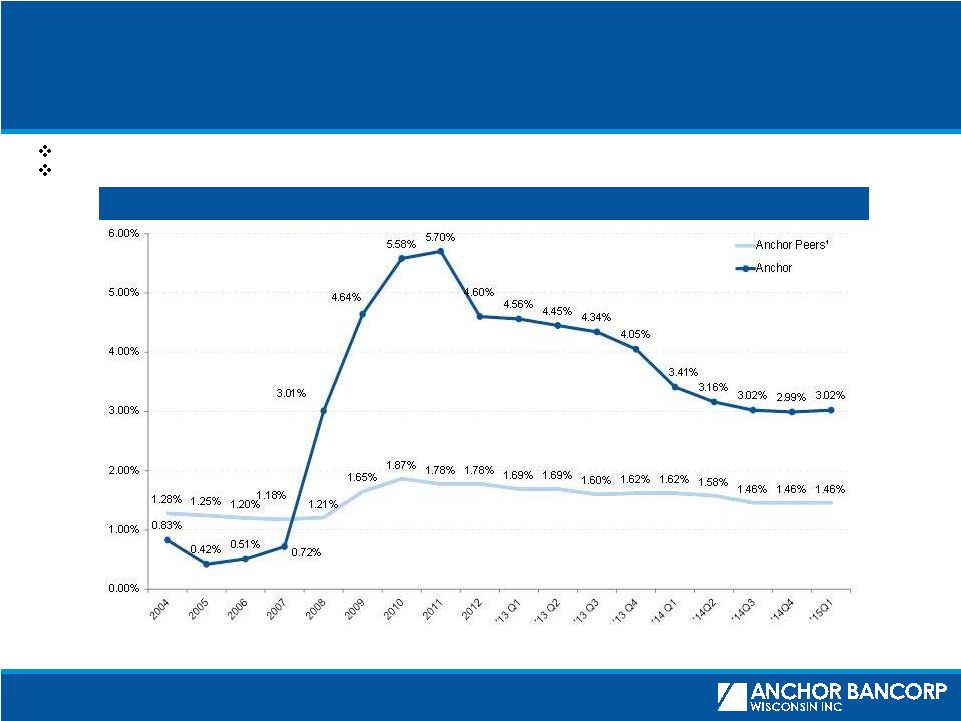
Maintaining Appropriate Loan Loss Reserves
Allowance to Total Loans Held-for-Investment
Anchor has built an allowance sufficient to cover potential credit losses
The ALLL to total NPLs was 187.74% at March 31, 2015, an increase from 95.16% at
December 31, 2013
1)
Anchor peer group represents all Wisconsin banks and thrifts with total assets
greater than $500 million as of March 31, 2015. Note: Anchor data reflects the
consolidated entity. Source: SNL Financial and Anchor SEC filings.
|
 7
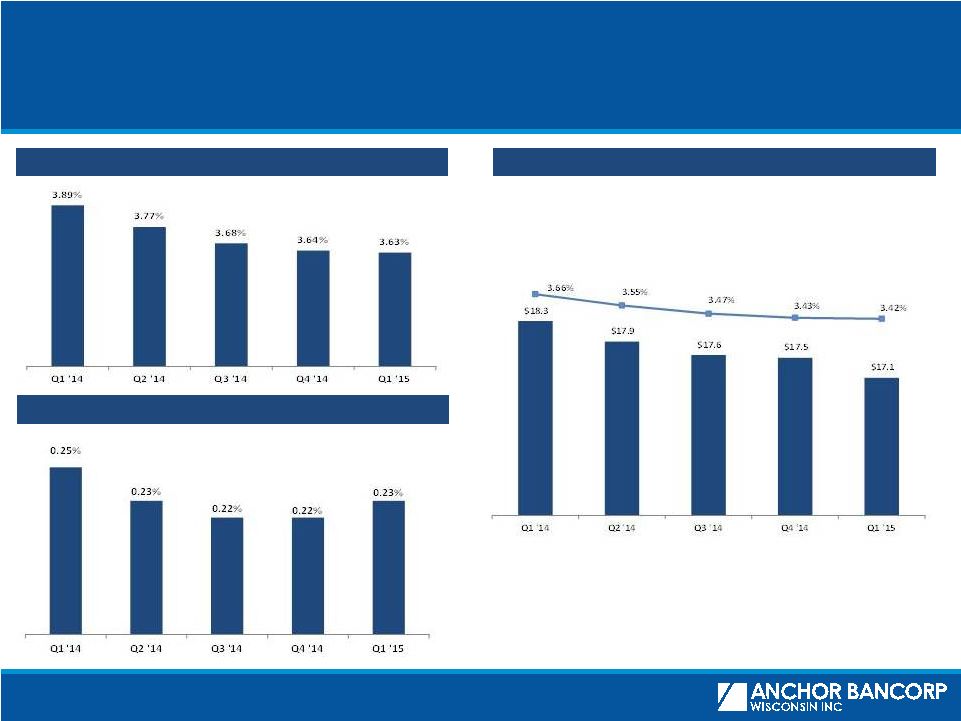
Net Interest Income
Yield on Interest-earning Assets
Cost of Interest-bearing Liabilities
Net Interest Income & Net Interest Margin
$ in Millions |
 8
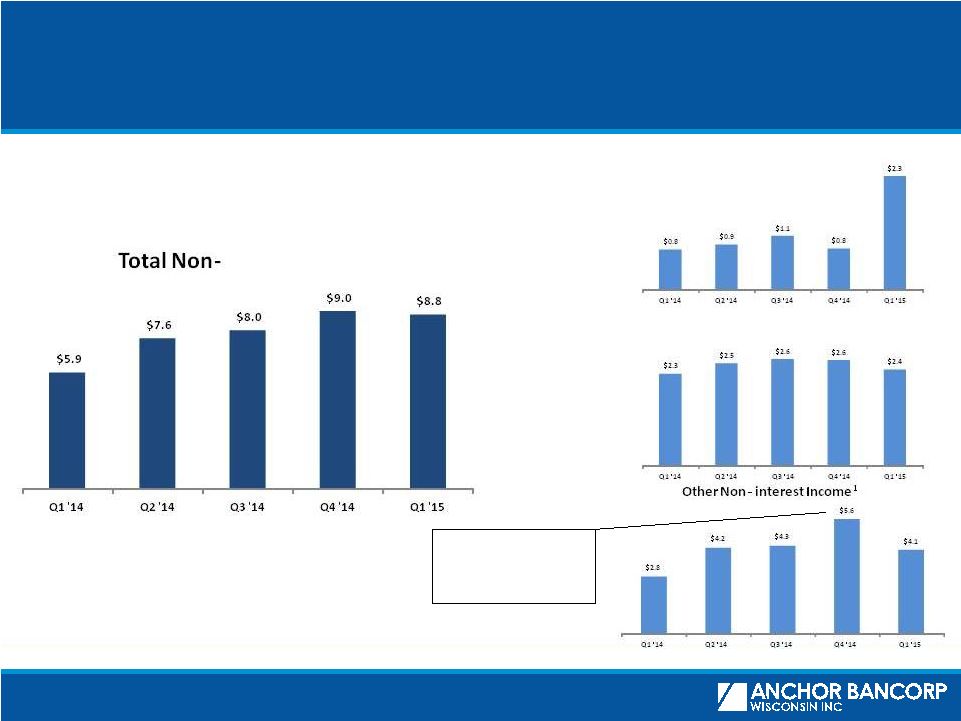
Non-Interest Income
1
Other Non-interest Income
includes investment and insurance commissions, gains/losses
on sale of investment securities, other than temporary impairment of investment
securities, gains/losses on sale of OREO, and other miscellaneous items
$ in Millions
interest Income
Gain on Sale of Loans and Loan Fees
Q4 2014 includes gains on
sales of the Capitol Square
building and Richland
Center branch
Deposit Service Fees |
 9
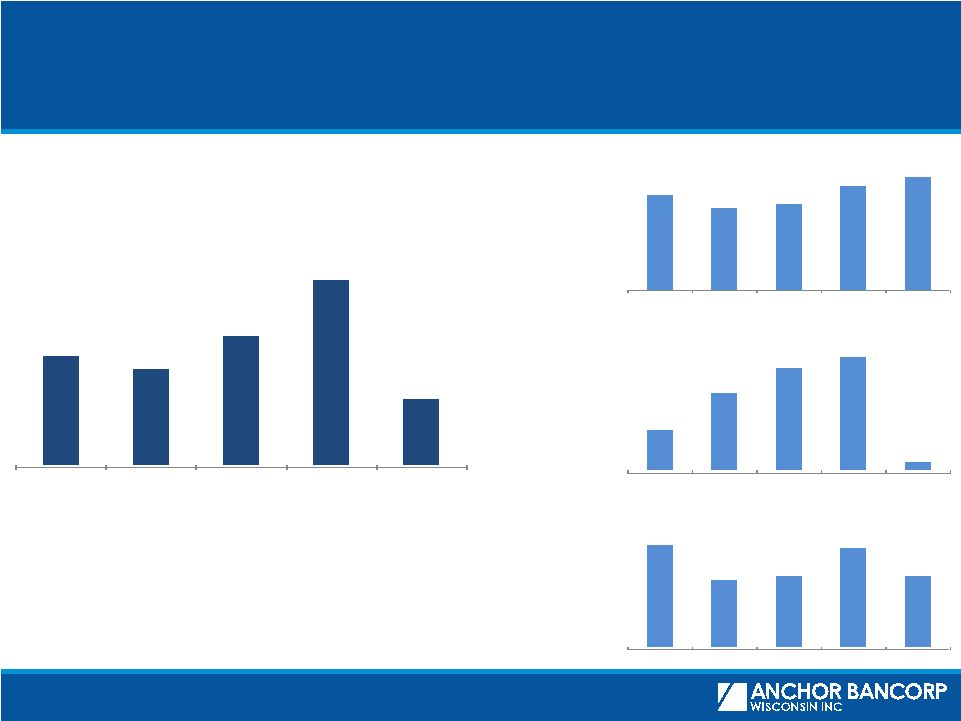
Non-Interest Expense
$1.2
$2.3
$3.0
$3.3
$0.2
Q1 '14
Q2 '14
Q3 '14
Q4 '14
Q1 '15
OREO Expense, net
$ in Millions
1
Other Non-interest Expense
includes occupancy, FDIC insurance, furniture and
equipment, data processing, marketing, MSR impairment/recovery, provision for unfunded
commitments, and other miscellaneous items
$22.3
$21.9
$22.9
$24.6
$21.0
Q1 '14
Q2 '14
Q3 '14
Q4 '14
Q1 '15
Total Non-interest Expense
$11.2
$10.7
$10.9
$11.5
$11.8
Q1 '14
Q2 '14
Q3 '14
Q4 '14
Q1 '15
Compensation and Benefits
$9.9
$8.9
$9.0
$9.8
$9.0
Q1 '14
Q2 '14
Q3 '14
Q4 '14
Q1 '15
Other Non-interest Expense
1 |
 10
Summary of Recent Initiatives
Branch Sales
Branch
Consolidations
Compensation &
Benefits
Occupancy
Universal
Banker Branch
Staffing Model
•
2015 Q1 –
announced sale of the Viroqua branch to Royal Bank of Elroy,
anticipated to settle in May 2015
•
2015 Q2 –
announced sale of the Winneconne branch to Premier Community
Bank, anticipated to settle in August 2015
•
2015 Q2 –
announced consolidation of 6 branches in the Wisconsin communities
of Appleton, Menasha, Oshkosh, Janesville, Franklin, and Madison, all with other
branches within 5 miles.
•
Expanding Appleton Commercial facility for Retail Bank business
•
2015
Q2
–
Creating
a
new
Universal
Banker
Branch
staffing
model
–
the
majority
of
staff will be able to open new accounts and perform most branch transactions for
customers improving branch efficiency and providing customers with strong
customer service
•
2015 Q2 –
Offering Voluntary Separation Plan packages to approximately 140
eligible employees providing a variety of benefits including additional
compensation,
subsidized
COBRA
health
benefits,
and
optional
job
placement
services
•
2014 Q4 –
completed sale of Capitol Square Madison Headquarters facility
•
2015 Q1 -
completed purchase of new City View Madison Support Center which
will consolidate various operational teams |
 11
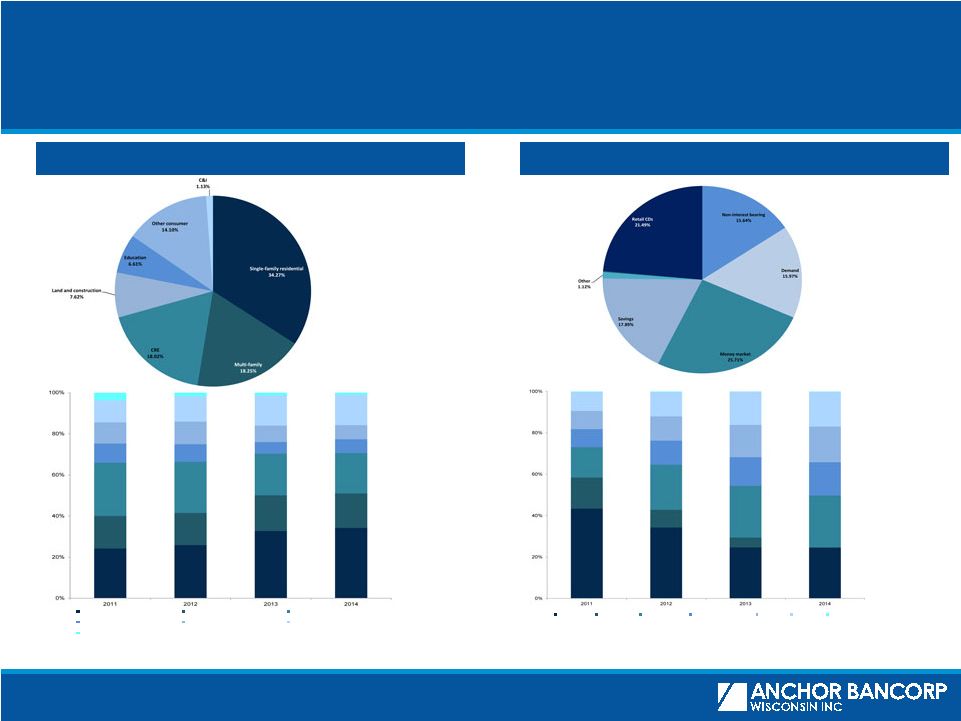
Loan and Deposit Overview
Loan Composition
Deposit Composition
1)
For the three months ended March 31, 2015. Cost represents the cost of
interest-bearing deposits only. Gross Loans
at 3/31/15 = $1.6bn
Yield¹
= 4.25%
Deposits
at 3/31/15 = $1.8bn
Cost¹
= 0.22%
Single-family residential
Multi-family
CRE
Land and construction
Education
Other consumer
C&I
Jumbo CDs
Retail CDs
Jumbo CDs
Money market
Non-interest bearing
Savings
Demand
Other
Note:
Loan
and
deposit
data
as
of
March
31
for
years
2011
–
2012
and
as
of
December
31
for
2013
-
2014. |
 12
Reconciliation of Non-GAAP Measures
Non-GAAP Financial Measures¹
1)
Tangible common equity to tangible assets (the “tangible common equity
ratio”) is a non-GAAP financial measure. The Company calculates the tangible common equity ratio by excluding the balance of preferred
equity,
goodwill
and
other
intangible
assets
from
common
shareholders’
equity
and
assets.
The
Company
considers
this
information
important
to
shareholders
as
tangible
equity
is
a
measure
that
is
consistent
with
the calculation of capital for bank regulatory purposes, which excludes intangible
assets from the calculation of risk-based ratios. This disclosure should not be viewed as a substitute for results determined to be in
accordance with GAAP, nor is it necessarily comparable to non-GAAP performance
measures presented by other companies. ($000s)
12/31/2013
03/31/2014
06/30/2014
09/30/2014
12/31/2014
03/31/2015
Total GAAP Equity
202,198
$
206,708
$
211,507
$
214,709
$
227,663
$
236,856
$
Less: Preferred Equity
-
-
-
-
-
-
Less: Goodwill and Other Intangibles
-
-
-
-
-
-
Tangible Common Equity
202,198
$
206,708
$
211,507
$
214,709
$
227,663
$
236,856
$
Total GAAP Assets
2,112,474
$
2,109,824
$
2,121,249
$
2,106,521
$
2,082,379
$
2,094,161
$
Less: Goodwill and Other Intangibles
-
-
-
-
-
-
Tangible Assets
2,112,474
$
2,109,824
$
2,121,249
$
2,106,521
$
2,082,379
$
2,094,161
$
Tang. Common Equity / Tang. Assets
9.57%
9.80%
9.97%
10.19%
10.93%
11.31%
As of |