Attached files
| file | filename |
|---|---|
| 8-K - AMERICAN CAMPUS COMMUNITIES, INC. 8-K - AMERICAN CAMPUS COMMUNITIES INC | a51089188.htm |
| EX-99.1 - EXHIBIT 99.1 - AMERICAN CAMPUS COMMUNITIES INC | a51089188ex99_1.htm |
Exhibit 99.2
SUPPLEMENTAL ANALYST PACKAGE 1Q 2015 April 27, 2015
AMERICAN CAMPUS COMMUNITIES TABLE OF CONTENTS Financial Highlights ____________________________________ 1 Consolidated Balance Sheets ____________________________ 2 Consolidated Statements of Comprehensive Income __________ 3 Consolidated Statements of Funds from Operations __________ 4 Wholly-owned Properties Results of Operations ______________ 5 Same Store Wholly-owned Properties Operating Expenses _____ 6 Seasonality of Operations _______________________________ 7 Portfolio Overview ____________________________________ 8 2015 / 2016 Leasing Status - Summary ____________________ 9 2015 / 2016 Leasing Status - Detail _______________________ 10 Investment Update ____________________________________ 16 Owned Development Update _____________________________ 17 Third-party Development Update _________________________ 18 Management Services Update ____________________________ 19 Capital Structure ______________________________________ 20 Definitions ___________________________________________ 21 Investor Information ___________________________________ 23
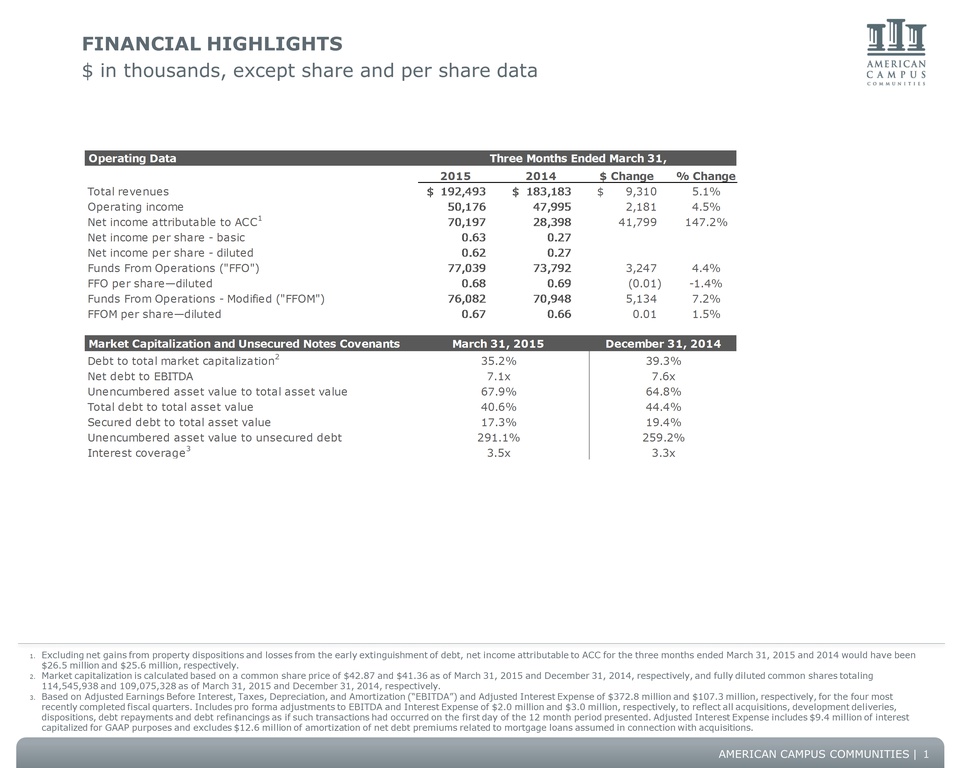
FINANCIAL HIGHLIGHTS $ in thousands, except share and per share data Operating Data Three Months Ended March 31, 2015 2014 $ Change % Change Total revenues $ 192,493 $ 183,183 $ 9,310 5.1% Operating income 50,176 47,995 2,181 4.5% Net income attributable to ACC 1 70,197 28,398 41,799 147.2% Net income per share - basic 0.63 0.27 Net income per share - diluted 0.62 0.27 Funds From Operations ("FFO") 77,039 73,792 3,247 4.4% FFO per share—diluted 0.68 0.69 (0.01) -1.4% Funds From Operations - Modified ("FFOM") 76,082 70,948 5,134 7.2% FFOM per share—diluted 0.67 0.66 0.01 1.5% Market Capitalization and Unsecured Notes Covenants March 31, 2015 December 31, 2014 Debt to total market capitalization 2 35.2% 39.3% Net debt to EBITDA 7.1x 7.6x Unencumbered asset value to total asset value 67.9% 64.8% Total debt to total asset value 40.6% 44.4% Secured debt to total asset value 17.3% 19.4% Unencumbered asset value to unsecured debt 291.1% 259.2% Interest coverage 3 3.5x 3.3x 1. Excluding net gains from property dispositions and losses from the early extinguishment of debt, net income attributable to ACC for the three months ended March 31, 2015 and 2014 would have been $26.5 million and $25.6 million, respectively. 2. Market capitalization is calculated based on a common share price of $42.87 and $41.36 as of March 31, 2015 and December 31, 2014, respectively, and fully diluted common shares totaling 114,545,938 and 109,075,328 as of March 31, 2015 and December 31, 2014, respectively. 3. Based on Adjusted Earnings Before Interest, Taxes, Depreciation, and Amortization (“EBITDA”) and Adjusted Interest Expense of $372.8 million and $107.3 million, respectively, for the four most recently completed fiscal quarters. Includes pro forma adjustments to EBITDA and Interest Expense of $2.0 million and $3.0 million, respectively, to reflect all acquisitions, development deliveries, dispositions, debt repayments and debt refinancings as if such transactions had occurred on the first day of the 12 month period presented. Adjusted Interest Expense includes $9.4 million of interest capitalized for GAAP purposes and excludes $12.6 million of amortization of net debt premiums related to mortgage loans assumed in connection with acquisitions. AMERICAN CAMPUS COMMUNITIES 1
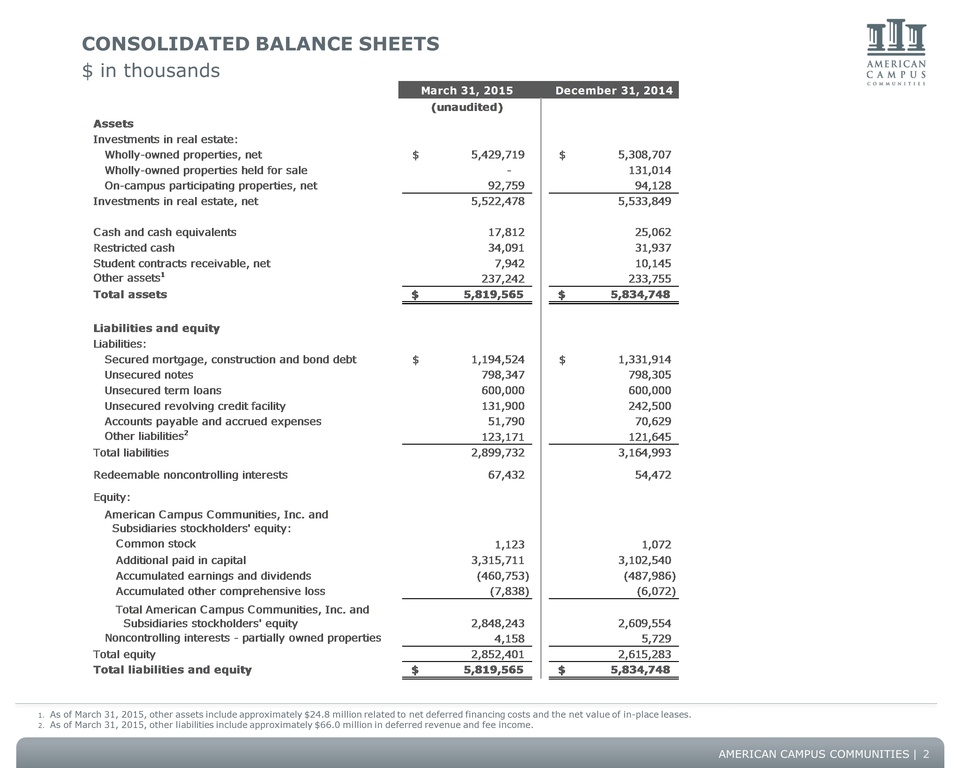
CONSOLIDATED BALANCE SHEETS $ in thousands March 31, 2015 December 31, 2014 (unaudited) Assets Investments in real estate: Wholly-owned properties, net $ 5,429,719 $ 5,308,707 Wholly-owned properties held for sale - 131,014 On-campus participating properties, net 92,759 94,128 Investments in real estate, net 5,522,478 5,533,849 Cash and cash equivalents 17,812 25,062 Restricted cash 34,091 31,937 Student contracts receivable, net 7,942 10,145 Other assets 1 237,242 233,755 Total assets $ 5,819,565 $ 5,834,748 Liabilities and equity Liabilities: Secured mortgage, construction and bond debt $ 1,194,524 $ 1,331,914 Unsecured notes 798,347 798,305 Unsecured term loans 600,000 600,000 Unsecured revolving credit facility 131,900 242,500 Accounts payable and accrued expenses 51,790 70,629 Other liabilities 2 123,171 121,645 Total liabilities 2,899,732 3,164,993 Redeemable noncontrolling interests 67,432 54,472 Equity: American Campus Communities, Inc. and Subsidiaries stockholders' equity: Common stock 1,123 1,072 Additional paid in capital 3,315,711 3,102,540 Accumulated earnings and dividends (460,753) (487,986) Accumulated other comprehensive loss (7,838) (6,072) Total American Campus Communities, Inc. and Subsidiaries stockholders' equity 2,848,243 2,609,554 Noncontrolling interests - partially owned properties 4,158 5,729 Total equity 2,852,401 2,615,283 Total liabilities and equity $ 5,819,565 $ 5,834,748 1. As of March 31, 2015, other assets include approximately $24.8 million related to net deferred financing costs and the net value of in-place leases. 2. As of March 31, 2015, other liabilities include approximately $66.0 million in deferred revenue and fee income. AMERICAN CAMPUS COMMUNITIES 2
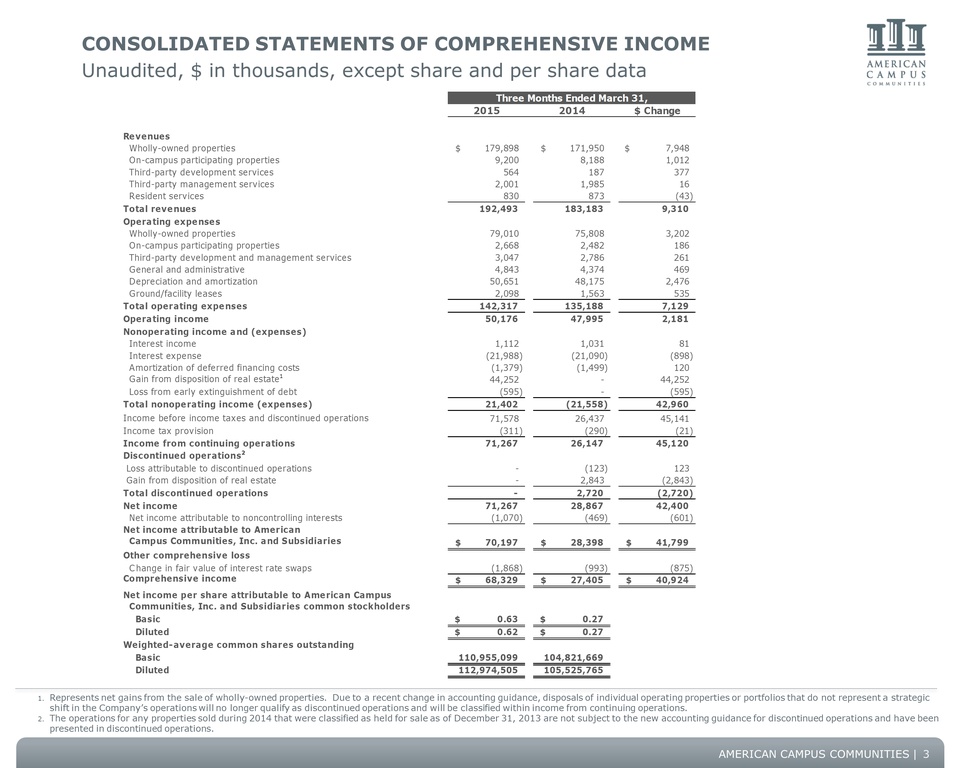
CONSOLIDATED STATEMENTS OF COMPREHENSIVE INCOME Unaudited, $ in thousands, except share and per share data Three Months Ended March 31, 2015 2014 $ Change Revenues Wholly-owned properties $ 179,898 $ 171,950 $ 7,948 On-campus participating properties 9,200 8,188 1,012 Third-party development services 564 187 377 Third-party management services 2,001 1,985 16 Resident services 830 873 (43) Total revenues 192,493 183,183 9,310 Operating expenses Wholly-owned properties 79,010 75,808 3,202 On-campus participating properties 2,668 2,482 186 Third-party development and management services 3,047 2,786 261 General and administrative 4,843 4,374 469 Depreciation and amortization 50,651 48,175 2,476 Ground/facility leases 2,098 1,563 535 Total operating expenses 142,317 135,188 7,129 Operating income 50,176 47,995 2,181 Nonoperating income and (expenses) Interest income 1,112 1,031 81 Interest expense (21,988) (21,090) (898) Amortization of deferred financing costs (1,379) (1,499) 120 Gain from disposition of real estate 1 44,252 - 44,252 Loss from early extinguishment of debt (595) - (595) Total nonoperating income (expenses) 21,402 (21,558) 42,960 Income before income taxes and discontinued operations 71,578 26,437 45,141 Income tax provision (311) (290) (21) Income from continuing operations 71,267 26,147 45,120 Discontinued operations 2 Loss attributable to discontinued operations - (123) 123 Gain from disposition of real estate - 2,843 (2,843) Total discontinued operations - 2,720 (2,720) Net income 71,267 28,867 42,400 Net income attributable to noncontrolling interests (1,070) ( 469) (601) Net income attributable to American Campus Communities, Inc. and Subsidiaries $ 70,197 $ 28,398 $ 41,799 Other comprehensive loss Change in fair value of interest rate swaps (1,868) (993) (875) Comprehensive income $ 68,329 $ 27,405 $ 40,924 Net income per share attributable to American Campus Communities, Inc. and Subsidiaries common stockholders Basic $ 0.63 $ 0.27 Diluted $ 0.62 $ 0.27 Weighted-average common shares outstanding Basic 110,955,099 104,821,669 Diluted 112,974,505 105,525,765 1. Represents net gains from the sale of wholly-owned properties. Due to a recent change in accounting guidance, disposals of individual operating properties or portfolios that do not represent a strategic shift in the Company’s operations will no longer qualify as discontinued operations and will be classified within income from continuing operations. 2. The operations for any properties sold during 2014 that were classified as held for sale as of December 31, 2013 are not subject to the new accounting guidance for discontinued operations and have been presented in discontinued operations. AMERICAN CAMPUS COMMUNITIES 3
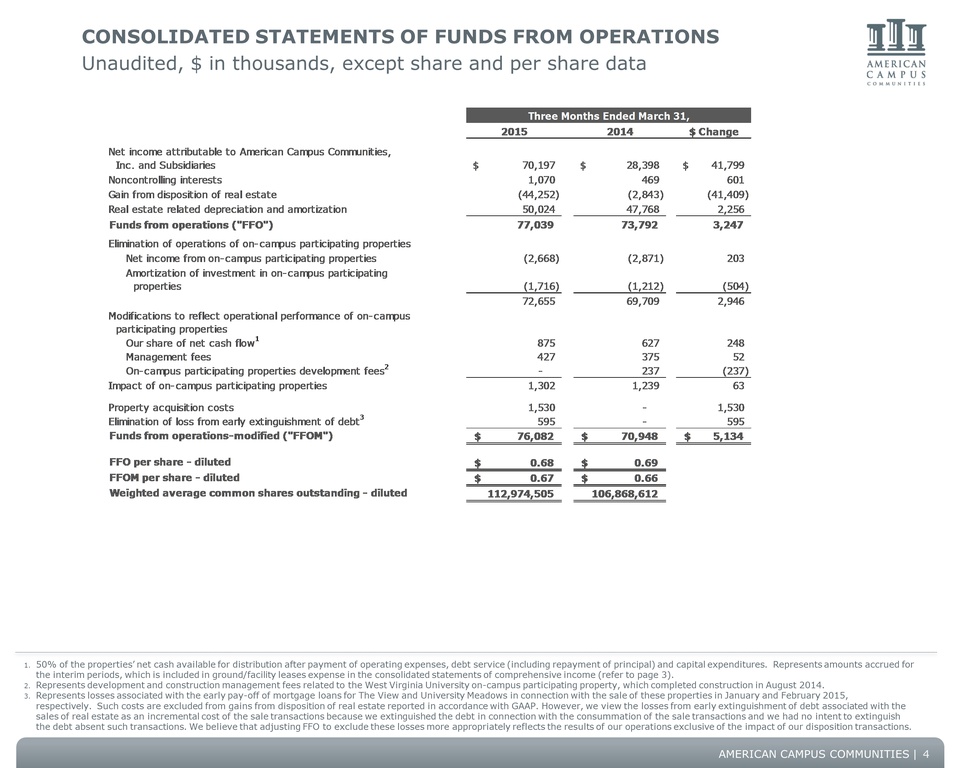
CONSOLIDATED STATEMENTS OF FUNDS FROM OPERATIONS Unaudited, $ in thousands, except share and per share data Three Months Ended March 31, 2015 2014 $ Change Net income attributable to American Campus Communities, Inc. and Subsidiaries $ 70,197 $ 28,398 $ 41,799 Noncontrolling interests 1,070 4 69 601 Gain from disposition of real estate (44,252) (2,843) (41,409) Real estate related depreciation and amortization 50,024 47,768 2,256 Funds from operations ("FFO") 77,039 73,792 3,247 Elimination of operations of on-campus participating properties Net income from on-campus participating properties (2,668) (2,871) 203 Amortization of investment in on-campus participating properties (1,716) (1,212) (504) 72,655 69,709 2,946 Modifications to reflect operational performance of on-campus participating properties Our share of net cash flow 1 875 627 248 Management fees 427 375 52 On-campus participating properties development fees 2 - 237 (237) Impact of on-campus participating properties 1,302 1,239 63 Property acquisition costs 1,530 - 1,530 Elimination of loss from early extinguishment of debt 3 595 - 595 Funds from operations-modified ("FFOM") $ 76,082 $ 70,948 $ 5,134 FFO per share - diluted $ 0.68 $ 0.69 FFOM per share - diluted $ 0.67 $ 0.66 Weighted average common shares outstanding - diluted 112,974,505 106,868,612 1. 50% of the properties’ net cash available for distribution after payment of operating expenses, debt service (including repayment of principal) and capital expenditures. Represents amounts accrued for the interim periods, which is included in ground/facility leases expense in the consolidated statements of comprehensive income (refer to page 3). 2. Represents development and construction management fees related to the West Virginia University on-campus participating property, which completed construction in August 2014. 3. Represents losses associated with the early pay-off of mortgage loans for The View and University Meadows in connection with the sale of these properties in January and February 2015, respectively. Such costs are excluded from gains from disposition of real estate reported in accordance with GAAP. However, we view the losses from early extinguishment of debt associated with the sales of real estate as an incremental cost of the sale transactions because we extinguished the debt in connection with the consummation of the sale transactions and we had no intent to extinguish the debt absent such transactions. We believe that adjusting FFO to exclude these losses more appropriately reflects the results of our operations exclusive of the impact of our disposition transactions. AMERICAN CAMPUS COMMUNITIES 4
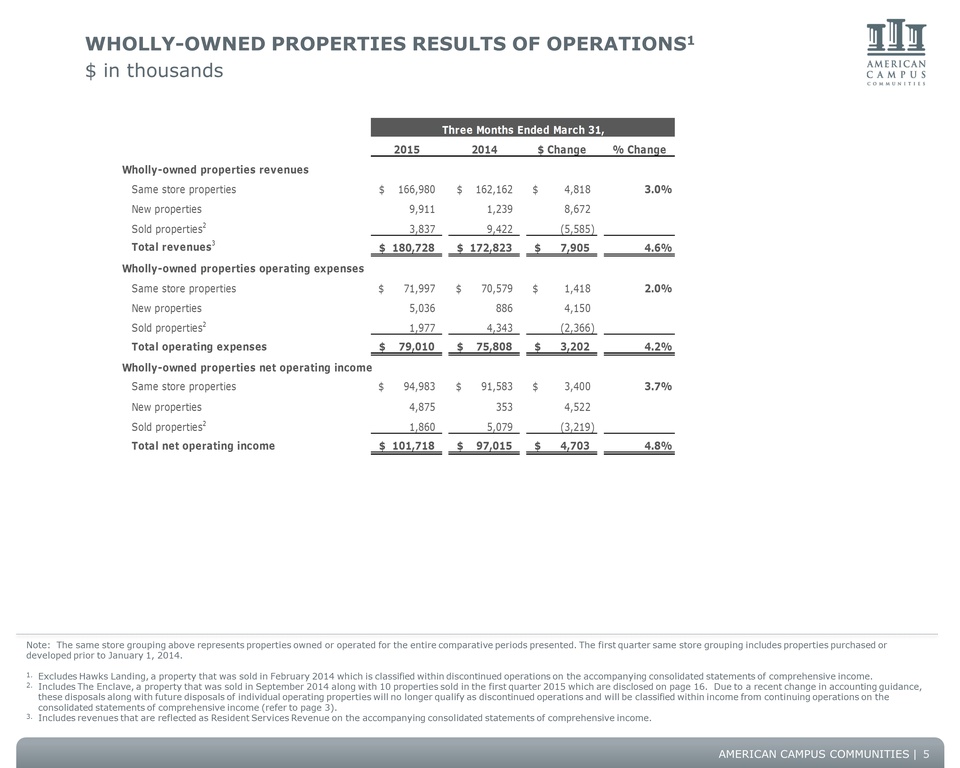
WHOLLY-OWNED PROPERTIES RESULTS OF OPERATIONS 1 $ in thousands Three Months Ended March 31, 2015 2014 $ Change % Change Wholly-owned properties revenues Same store properties $ 166,980 $ 162,162 $ 4,818 3.0% New properties 9,911 1,239 8,672 Sold properties 2 3,837 9,422 (5,585) Total revenues 3 $ 180,728 $ 172,823 $ 7 ,905 4.6% Wholly-owned properties operating expenses Same store properties $ 71,997 $ 70,579 $ 1,418 2.0% New properties 5,036 886 4,150 Sold properties 2 1,977 4,343 (2,366) Total operating expenses $ 79,010 $ 75,808 $ 3,202 4.2% Wholly-owned properties net operating income Same store properties $ 94,983 $ 91,583 $ 3,400 3.7% New properties 4,875 353 4,522 Sold properties 2 1,860 5,079 (3,219) Total net operating income $ 101,718 $ 97,015 $ 4,703 4.8% Note: The same store grouping above represents properties owned or operated for the entire comparative periods presented. The first quarter same store grouping includes properties purchased or developed prior to January 1, 2014. 1. Excludes Hawks Landing, a property that was sold in February 2014 which is classified within discontinued operations on the accompanying consolidated statements of comprehensive income. 2. Includes The Enclave, a property that was sold in September 2014 along with 10 properties sold in the first quarter 2015 which are disclosed on page 16. Due to a recent change in accounting guidance, these disposals along with future disposals of individual operating properties will no longer qualify as discontinued operations and will be classified within income from continuing operations on the consolidated statements of comprehensive income (refer to page 3). 3. Includes revenues that are reflected as Resident Services Revenue on the accompanying consolidated statements of comprehensive income. AMERICAN CAMPUS COMMUNITIES 5
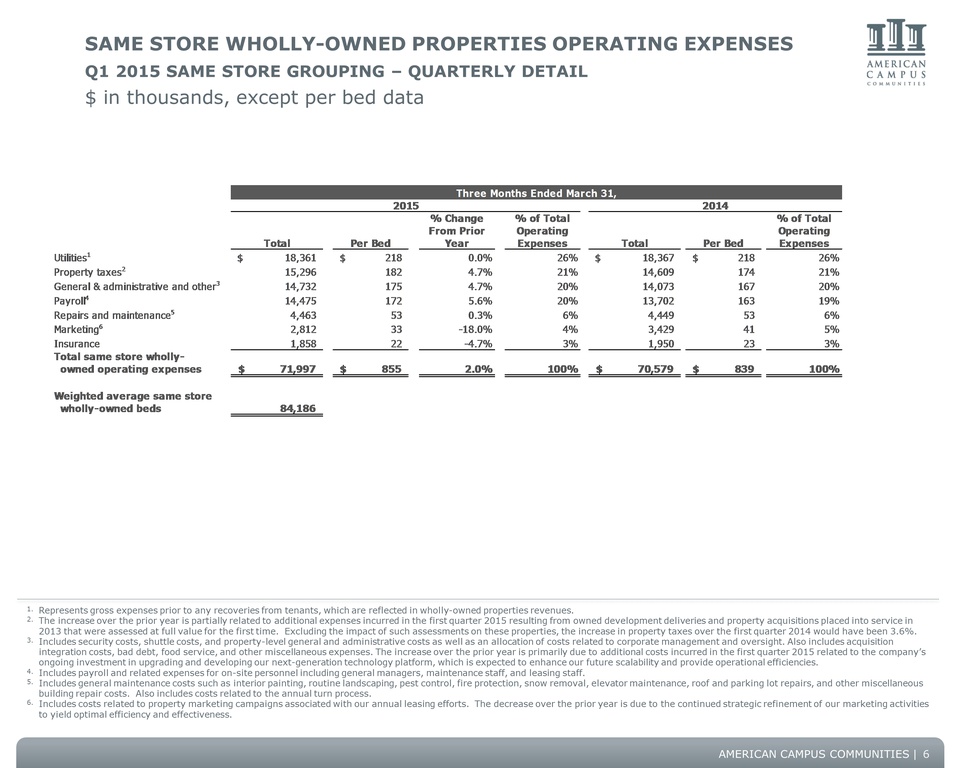
SAME STORE WHOLLY-OWNED PROPERTIES OPERATING EXPENSES Q1 2015 SAME STORE GROUPING – QUARTERLY DETAIL $ in thousands, except per bed data Three Months Ended March 31, 2015 2014 Total Per Bed % Change From Prior Year % of Total Operating Expenses Total Per Bed % of Total Operating Expenses Utilities 1 $ 18,361 $ 218 0.0% 26% $ 18,367 $ 218 26% Property taxes 2 15,296 182 4.7% 21% 14,609 174 21% General & administrative and other 3 14,732 175 4.7% 20% 14,073 167 20% Payroll 4 14,475 172 5.6% 20% 13,702 163 19% Repairs and maintenance 5 4,463 53 0.3% 6% 4,449 53 6% Marketing 6 2,812 33 -18.0% 4% 3,429 41 5% Insurance 1,858 22 -4.7% 3% 1,950 23 3% Total same store wholly-owned operating expenses $ 71,997 $ 8 55 2.0% 100% $ 70,579 $ 839 100% Weighted average same store wholly-owned beds 84,186 1. Represents gross expenses prior to any recoveries from tenants, which are reflected in wholly-owned properties revenues. 2. The increase over the prior year is partially related to additional expenses incurred in the first quarter 2015 resulting from owned development deliveries and property acquisitions placed into service in 2013 that were assessed at full value for the first time. Excluding the impact of such assessments on these properties, the increase in property taxes over the first quarter 2014 would have been 3.6%. 3. Includes security costs, shuttle costs, and property-level general and administrative costs as well as an allocation of costs related to corporate management and oversight. Also includes acquisition integration costs, bad debt, food service, and other miscellaneous expenses. The increase over the prior year is primarily due to additional costs incurred in the first quarter 2015 related to the company’s ongoing investment in upgrading and developing our next-generation technology platform, which is expected to enhance our future scalability and provide operational efficiencies. 4. Includes payroll and related expenses for on-site personnel including general managers, maintenance staff, and leasing staff. 5. Includes general maintenance costs such as interior painting, routine landscaping, pest control, fire protection, snow removal, elevator maintenance, roof and parking lot repairs, and other miscellaneous building repair costs. Also includes costs related to the annual turn process. 6. Includes costs related to property marketing campaigns associated with our annual leasing efforts. The decrease over the prior year is due to the continued strategic refinement of our marketing activities to yield optimal efficiency and effectiveness. AMERICAN CAMPUS COMMUNITIES 6
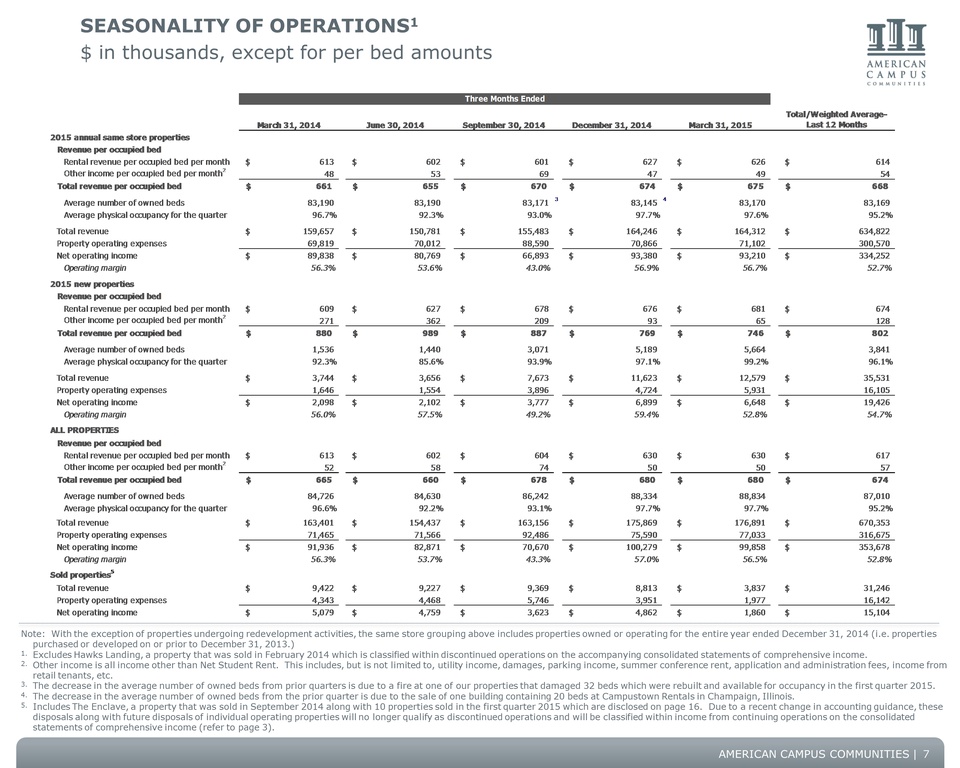
SEASONALITY OF OPERATIONS 1 $ in thousands, except for per bed amounts Three Months Ended March 31, 2014 June 30, 2014 September 30, 2014 December 31, 2014 March 31, 2015 Total/Weighted Average-Last 12 Months 2015 annual same store properties Revenue per occupied bed Rental revenue per occupied bed per month $ 613 $ 602 $ 601 $ 627 $ 626 $ 614 Other income per occupied bed per month 2 48 53 69 47 49 54 Total revenue per occupied bed $ 661 $ 655 $ 670 $ 674 $ 675 $ 6 68 Average number of owned beds 83,190 83,190 83,171 3 8 3,145 4 83,170 83,169 Average physical occupancy for the quarter 96.7% 92.3% 93.0% 97.7% 97.6% 95.2% Total revenue $ 159,657 $ 150,781 $ 155,483 $ 164,246 $ 164,312 $ 634,822 Property operating expenses 69,819 70,012 88,590 70,866 71,102 300,570 Net operating income $ 89,838 $ 80,769 $ 66,893 $ 93,380 $ 93,210 $ 334,252 Operating margin 56.3% 53.6% 43.0% 56.9% 56.7% 52.7% 2015 new properties Revenue per occupied bed Rental revenue per occupied bed per month $ 609 $ 627 $ 678 $ 676 $ 681 $ 674 Other income per occupied bed per month 2 271 362 209 93 65 128 Total revenue per occupied bed $ 880 $ 989 $ 887 $ 769 $ 746 $ 802 Average number of owned beds 1,536 1,440 3,071 5,189 5,664 3,841 Average physical occupancy for the quarter 92.3% 85.6% 93.9% 97.1% 99.2% 96.1% Total revenue $ 3,744 $ 3,656 $ 7,673 $ 11,623 $ 12,579 $ 35,531 Property operating expenses 1,646 1,554 3,896 4,724 5,931 16,105 Net operating income $ 2,098 $ 2,102 $ 3,777 $ 6,899 $ 6,648 $ 19,426 Operating margin 56.0% 57.5% 49.2% 59.4% 52.8% 54.7% ALL PROPERTIES Revenue per occupied bed Rental revenue per occupied bed per month $ 613 $ 602 $ 604 $ 630 $ 630 $ 617 Other income per occupied bed per month 2 52 58 74 50 50 57 Total revenue per occupied bed $ 665 $ 660 $ 678 $ 680 $ 680 $ 674 Average number of owned beds 84,726 84,630 86,242 88,334 88,834 87,010 Average physical occupancy for the quarter 96.6% 92.2% 93.1% 97.7% 97.7% 95.2% Total revenue $ 163,401 $ 154,437 $ 163,156 $ 175,869 $ 176,891 $ 670,353 Property operating expenses 71,465 71,566 92,486 75,590 77,033 316,675 Net operating income $ 91,936 $ 82,871 $ 70,670 $ 100,279 $ 99,858 $ 353,678 Operating margin 56.3% 53.7% 43.3% 57.0% 56.5% 52.8% Sold properties 5 Total revenue $ 9,422 $ 9,227 $ 9,369 $ 8,813 $ 3,837 $ 31,246 Property operating expenses 4,343 4,468 5,746 3 ,951 1,977 16,142 Net operating income $ 5,079 $ 4,759 $ 3,623 $ 4,862 $ 1,860 $ 15,104 Note: With the exception of properties undergoing redevelopment activities, the same store grouping above includes properties owned or operating for the entire year ended December 31, 2014 (i.e. properties purchased or developed on or prior to December 31, 2013.) 1. Excludes Hawks Landing, a property that was sold in February 2014 which is classified within discontinued operations on the accompanying consolidated statements of comprehensive income. 2. Other income is all income other than Net Student Rent. This includes, but is not limited to, utility income, damages, parking income, summer conference rent, application and administration fees, income from retail tenants, etc. 3. The decrease in the average number of owned beds from prior quarters is due to a fire at one of our properties that damaged 32 beds which were rebuilt and available for occupancy in the first quarter 2015. 4. The decrease in the average number of owned beds from the prior quarter is due to the sale of one building containing 20 beds at Campustown Rentals in Champaign, Illinois. 5. Includes The Enclave, a property that was sold in September 2014 along with 10 properties sold in the first quarter 2015 which are disclosed on page 16. Due to a recent change in accounting guidance, these disposals along with future disposals of individual operating properties will no longer qualify as discontinued operations and will be classified within income from continuing operations on the consolidated statements of comprehensive income (refer to page 3). AMERICAN CAMPUS COMMUNITIES 7
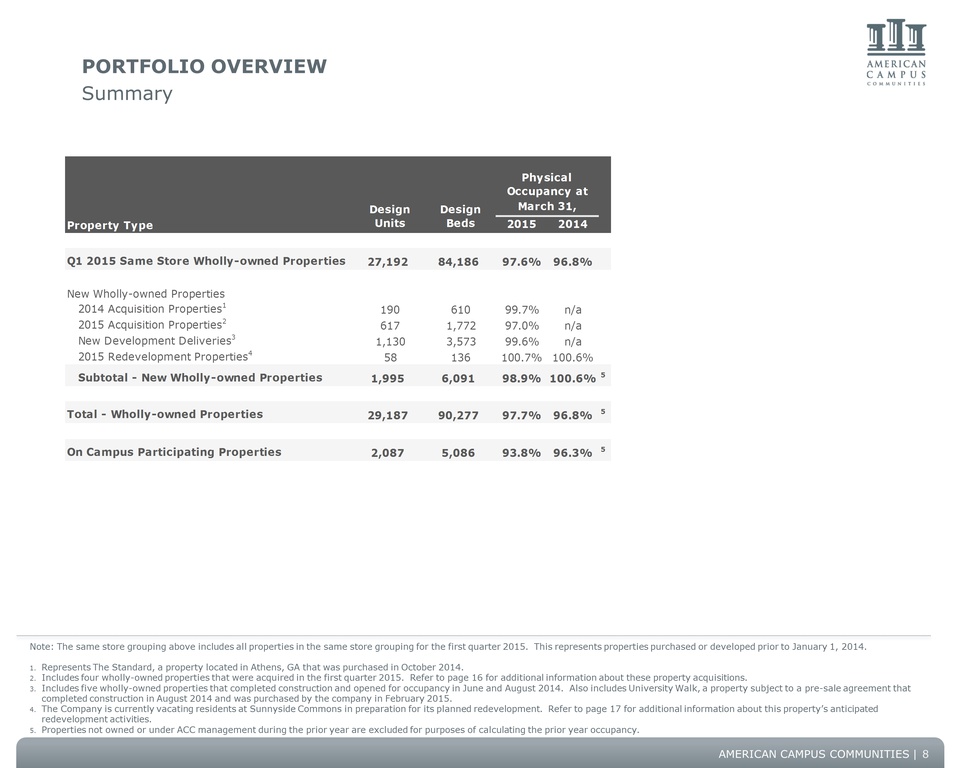
PORTFOLIO OVERVIEW Summary Property Type Design Units Design Beds Physical Occupancy at March 31, 2015 2014 Q1 2015 Same Store Wholly-owned Properties 27,192 84,186 97.6% 96.8% New Wholly-owned Properties 2014 Acquisition Properties 1 190 610 99.7% n/a 2015 Acquisition Properties 2 617 1,772 97.0% n/a New Development Deliveries 3 1,130 3,573 99.6% n/a 2015 Redevelopment Properties 4 58 136 100.7% 100.6% Subtotal - New Wholly-owned Properties 1,995 6,091 98.9% 100.6% 5 Total - Wholly-owned Properties 29,187 90,277 97.7% 96.8% 5 On Campus Participating Properties 2,087 5,086 93.8% 96.3% 5 Note: The same store grouping above includes all properties in the same store grouping for the first quarter 2015. This represents properties purchased or developed prior to January 1, 2014. 1. Represents The Standard, a property located in Athens, GA that was purchased in October 2014. 2. Includes four wholly-owned properties that were acquired in the first quarter 2015. Refer to page 16 for additional information about these property acquisitions. 3. Includes five wholly-owned properties that completed construction and opened for occupancy in June and August 2014. Also includes University Walk, a property subject to a pre-sale agreement that completed construction in August 2014 and was purchased by the company in February 2015. 4. The Company is currently vacating residents at Sunnyside Commons in preparation for its planned redevelopment. Refer to page 17 for additional information about this property’s anticipated redevelopment activities. 5. Properties not owned or under ACC management during the prior year are excluded for purposes of calculating the prior year occupancy. AMERICAN CAMPUS COMMUNITIES 8
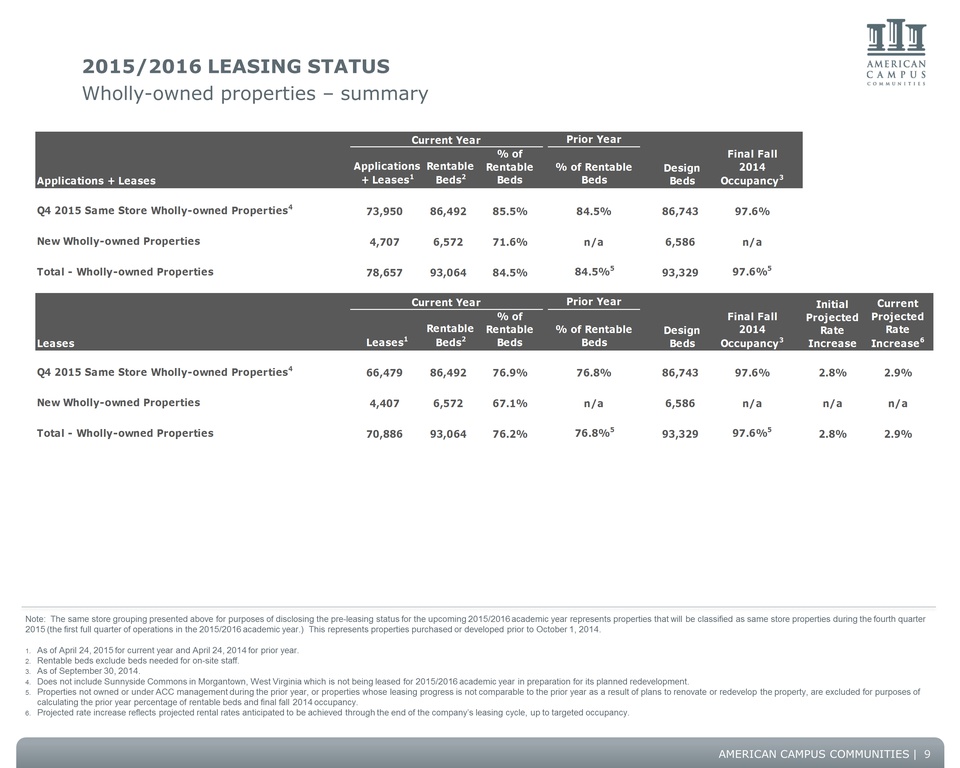
2015/2016 LEASING STATUS Wholly-owned properties – summary Current Year Prior Year Applications + Leases Applications + Leases 1 Rentable Beds 2 % of Rentable Beds % of Rentable Beds Design Beds Final Fall 2014 Occupancy 3 Q4 2015 Same Store Wholly-owned Properties 4 73,950 86,492 85.5% 84.5% 86,743 97.6% New Wholly-owned Properties 4,707 6,572 71.6% n/a 6,586 n/a Total - Wholly-owned Properties 78,657 93,064 84.5% 84.5%5 93,329 97.6% 5 Current Year Prior Year Leases Leases 1 Rentable Beds 2 % of Rentable Beds % of Rentable Beds Design Beds Final Fall 2014 Occupancy 3 Initial Projected Rate Increase Current Projected Rate Increase 6 Q4 2015 Same Store Wholly-owned Properties 4 66,479 86,492 76.9% 76.8% 86,743 97.6% 2.8% 2.9% New Wholly-owned Properties 4,407 6,572 67.1% n/a 6,586 n/a n/a n/a Total - Wholly-owned Properties 70,886 93,064 76.2% 76.8%5 93,329 97.6%5 2.8% 2.9% Note: The same store grouping presented above for purposes of disclosing the pre-leasing status for the upcoming 2015/2016 academic year represents properties that will be classified as same store properties during the fourth quarter 2015 (the first full quarter of operations in the 2015/2016 academic year.) This represents properties purchased or developed prior to October 1, 2014. 1. As of April 24, 2015 for current year and April 24, 2014 for prior year. 2. Rentable beds exclude beds needed for on-site staff. 3. As of September 30, 2014. 4. Does not include Sunnyside Commons in Morgantown, West Virginia which is not being leased for 2015/2016 academic year in preparation for its planned redevelopment. 5. Properties not owned or under ACC management during the prior year, or properties whose leasing progress is not comparable to the prior year as a result of plans to renovate or redevelop the property, are excluded for purposes of calculating the prior year percentage of rentable beds and final fall 2014 occupancy. 6. Projected rate increase reflects projected rental rates anticipated to be achieved through the end of the company’s leasing cycle, up to targeted occupancy. AMERICAN CAMPUS COMMUNITIES 9
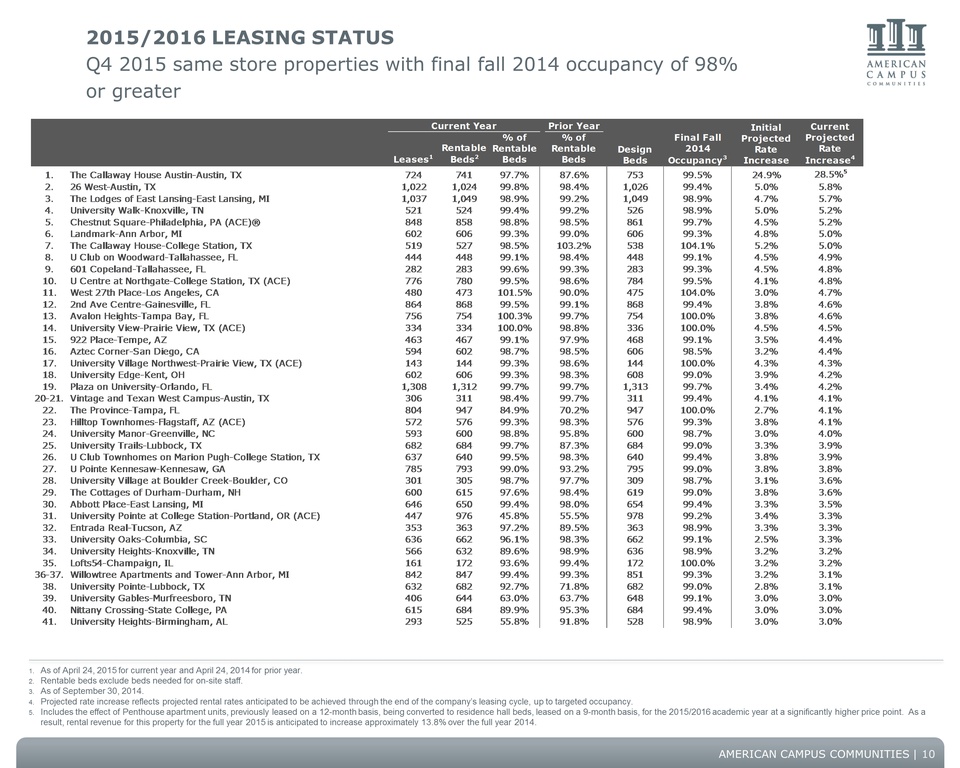
2015/2016 LEASING STATUS Q4 2015 same store properties with final fall 2014 occupancy of 98% or greater Current Year Prior Year Leases 1 Rentable Beds 2 % of Rentable Beds % of Rentable Beds Design Beds Final Fall 2014 Occupancy 3 Initial Projected Rate Increase Current Projected Rate Increase 4 1. The Callaway House Austin-Austin, TX 724 741 97.7% 87.6% 753 99.5% 24.9% 28.5% 5 2. 26 West-Austin, TX 1,022 1,024 99.8% 98.4% 1,026 99.4% 5.0% 5.8% 3. The Lodges of East Lansing-East Lansing, MI 1,037 1,049 98.9% 99.2% 1,049 98.9% 4.7% 5.7% 4. University Walk-Knoxville, TN 521 524 99.4% 99.2% 526 98.9% 5.0% 5.2% 5. Chestnut Square-Philadelphia, PA (ACE)® 848 858 98.8% 98.5% 861 99.7% 4.5% 5.2% 6. Landmark-Ann Arbor, MI 602 606 99.3% 99.0% 606 99.3% 4.8% 5.0% 7. The Callaway House-College Station, TX 519 527 98.5% 103.2% 538 104.1% 5.2% 5.0% 8. U Club on Woodward-Tallahassee, FL 444 448 99.1% 98.4% 448 99.1% 4.5% 4.9% 9. 601 Copeland-Tallahassee, FL 282 283 99.6% 99.3% 283 99.3% 4.5% 4.8% 10. U Centre at Northgate-College Station, TX (ACE) 776 780 99.5% 98.6% 784 99.5% 4.1% 4.8% 11. West 27th Place-Los Angeles, CA 480 473 101.5% 90.0% 475 104.0% 3.0% 4.7% 12. 2nd Ave Centre-Gainesville, FL 864 868 99.5% 99.1% 868 99.4% 3.8% 4.6% 13. Avalon Heights-Tampa Bay, FL 756 754 100.3% 99.7% 754 100.0% 3.8% 4.6% 14. University View-Prairie View, TX (ACE) 334 334 100.0% 98.8% 336 100.0% 4.5% 4.5% 15. 922 Place-Tempe, AZ 463 467 99.1% 97.9% 468 99.1% 3.5% 4.4% 16. Aztec Corner-San Diego, CA 594 602 98.7% 98.5% 606 98.5% 3.2% 4.4% 17. University Village Northwest-Prairie View, TX (ACE) 143 144 99.3% 98.6% 144 100.0% 4.3% 4.3% 18. University Edge-Kent, OH 602 606 99.3% 98.3% 608 99.0% 3.9% 4.2% 19. Plaza on University-Orlando, FL 1,308 1,312 99.7% 99.7% 1,313 99.7% 3.4% 4.2% 20-21. Vintage and Texan West Campus-Austin, TX 306 311 98.4% 99.7% 311 99.4% 4.1% 4.1% 22. The Province-Tampa, FL 804 947 84.9% 70.2% 947 100.0% 2.7% 4.1% 23. Hilltop Townhomes-Flagstaff, AZ (ACE) 572 576 99.3% 98.3% 576 99.3% 3.8% 4.1% 24. University Manor-Greenville, NC 593 600 98.8% 95.8% 600 98.7% 3.0% 4.0% 25. University Trails-Lubbock, TX 682 684 99.7% 87.3% 684 99.0% 3.3% 3.9% 26. U Club Townhomes on Marion Pugh-College Station, TX 637 640 99.5% 98.3% 640 99.4% 3.8% 3.9% 27. U Pointe Kennesaw-Kennesaw, GA 785 793 99.0% 93.2% 795 99.0% 3.8% 3.8% 28. University Village at Boulder Creek-Boulder, CO 301 305 98.7% 97.7% 309 98.7% 3.1% 3.6% 29. The Cottages of Durham-Durham, NH 600 615 97.6% 98.4% 619 99.0% 3.8% 3.6% 30. Abbott Place-East Lansing, MI 646 650 99.4% 98.0% 654 99.4% 3.3% 3.5% 31. University Pointe at College Station-Portland, OR (ACE) 447 976 45.8% 55.5% 978 99.2% 3.4% 3.3% 32. Entrada Real-Tucson, AZ 353 363 97.2% 89.5% 363 98.9% 3.3% 3.3% 33. University Oaks-Columbia, SC 636 662 96.1% 98.3% 662 99.1% 2.5% 3.3% 34. University Heights-Knoxville, TN 566 632 89.6% 98.9% 636 98.9% 3.2% 3.2% 35. Lofts54-Champaign, IL 161 172 93.6% 99.4% 172 100.0% 3.2% 3.2% 36-37. Willowtree Apartments and Tower-Ann Arbor, MI 842 847 99.4% 99.3% 851 99.3% 3.2% 3.1% 38. University Pointe-Lubbock, TX 632 682 92.7% 71.8% 682 99.0% 2.8% 3.1% 39. University Gables-Murfreesboro, TN 406 644 63.0% 63.7% 648 99.1% 3.0% 3.0% 40. Nittany Crossing-State College, PA 615 684 89.9% 95.3% 684 99.4% 3.0% 3.0% 41. University Heights-Birmingham, AL 293 525 55.8% 91.8% 528 98.9% 3.0% 3.0% 1. As of April 24, 2015 for current year and April 24, 2014 for prior year. 2. Rentable beds exclude beds needed for on-site staff. 3. As of September 30, 2014. 4. Projected rate increase reflects projected rental rates anticipated to be achieved through the end of the company’s leasing cycle, up to targeted occupancy. 5. Includes the effect of Penthouse apartment units, previously leased on a 12-month basis, being converted to residence hall beds, leased on a 9-month basis, for the 2015/2016 academic year at a significantly higher price point. As a result, rental revenue for this property for the full year 2015 is anticipated to increase approximately 13.8% over the full year 2014. AMERICAN CAMPUS COMMUNITIES 10
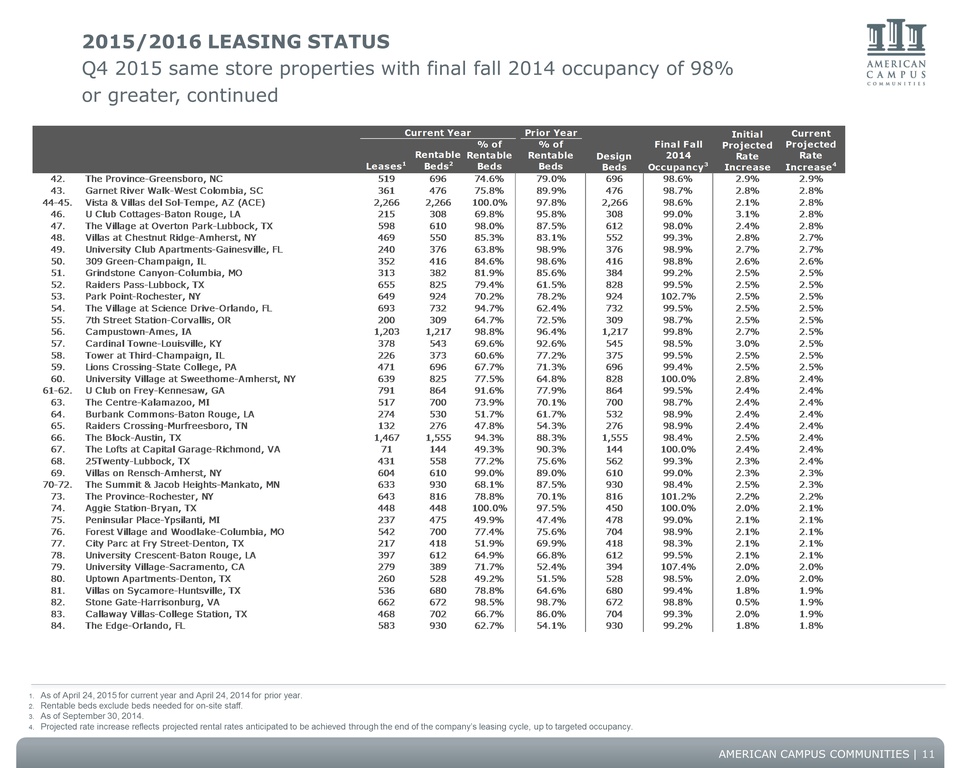
2015/2016 LEASING STATUS Q4 2015 same store properties with final fall 2014 occupancy of 98% or greater, continued Current Year Prior Year Leases 1 Rentable Beds 2 % of Rentable Beds % of Rentable Beds Design Beds Final Fall 2014 Occupancy 3 Initial Projected Rate Increase Current Projected Rate Increase 4 42. The Province-Greensboro, NC 519 696 74.6% 79.0% 696 98.6% 2.9% 2.9% 43. Garnet River Walk-West Colombia, SC 361 476 75.8% 89.9% 476 98.7% 2.8% 2.8% 44-45. Vista & Villas del Sol-Tempe, AZ (ACE) 2,266 2,266 100.0% 97.8% 2,266 98.6% 2.1% 2.8% 46. U Club Cottages-Baton Rouge, LA 215 308 69.8% 95.8% 308 99.0% 3.1% 2.8% 47. The Village at Overton Park-Lubbock, TX 598 610 98.0% 87.5% 612 98.0% 2.4% 2.8% 48. Villas at Chestnut Ridge-Amherst, NY 469 550 85.3% 83.1% 552 99.3% 2.8% 2.7% 49. University Club Apartments-Gainesville, FL 240 376 63.8% 98.9% 376 98.9% 2.7% 2.7% 50. 309 Green-Champaign, IL 352 416 84.6% 98.6% 416 98.8% 2.6% 2.6% 51. Grindstone Canyon-Columbia, MO 313 382 81.9% 85.6% 384 99.2% 2.5% 2.5% 52. Raiders Pass-Lubbock, TX 655 825 79.4% 61.5% 828 99.5% 2.5% 2.5% 53. Park Point-Rochester, NY 649 924 70.2% 78.2% 924 102.7% 2.5% 2.5% 54. The Village at Science Drive-Orlando, FL 693 732 94.7% 62.4% 732 99.5% 2.5% 2.5% 55. 7th Street Station-Corvallis, OR 200 309 64.7% 72.5% 309 98.7% 2.5% 2.5% 56. Campustown-Ames, IA 1,203 1,217 98.8% 96.4% 1,217 99.8% 2.7% 2.5% 57. Cardinal Towne-Louisville, KY 378 543 69.6% 92.6% 545 98.5% 3.0% 2.5% 58. Tower at Third-Champaign, IL 226 373 60.6% 77.2% 375 99.5% 2.5% 2.5% 59. Lions Crossing-State College, PA 471 696 67.7% 71.3% 696 99.4% 2.5% 2.5% 60. University Village at Sweethome-Amherst, NY 639 825 77.5% 64.8% 828 100.0% 2.8% 2.4% 61-62. U Club on Frey-Kennesaw, GA 791 864 91.6% 77.9% 864 99.5% 2.4% 2.4% 63. The Centre-Kalamazoo, MI 517 700 73.9% 70.1% 700 98.7% 2.4% 2.4% 64. Burbank Commons-Baton Rouge, LA 274 530 51.7% 61.7% 532 98.9% 2.4% 2.4% 65. Raiders Crossing-Murfreesboro, TN 132 276 47.8% 54.3% 276 98.9% 2.4% 2.4% 66. The Block-Austin, TX 1,467 1,555 94.3% 88.3% 1,555 98.4% 2.5% 2.4% 67. The Lofts at Capital Garage-Richmond, VA 71 144 49.3% 90.3% 144 100.0% 2.4% 2.4% 68. 25Twenty-Lubbock, TX 431 558 77.2% 75.6% 562 99.3% 2.3% 2.4% 69. Villas on Rensch-Amherst, NY 604 610 99.0% 89.0% 610 99.0% 2.3% 2.3% 70-72. The Summit & Jacob Heights-Mankato, MN 633 930 68.1% 87.5% 930 98.4% 2.5% 2.3% 73. The Province-Rochester, NY 643 816 78.8% 70.1% 816 101.2% 2.2% 2.2% 74. Aggie Station-Bryan, TX 448 448 100.0% 97.5% 450 100.0% 2.0% 2.1% 75. Peninsular Place-Ypsilanti, MI 237 475 49.9% 47.4% 478 99.0% 2.1% 2.1% 76. Forest Village and Woodlake-Columbia, MO 542 700 77.4% 75.6% 704 98.9% 2.1% 2.1% 77. City Parc at Fry Street-Denton, TX 217 418 51.9% 69.9% 418 98.3% 2.1% 2.1% 78. University Crescent-Baton Rouge, LA 397 612 64.9% 66.8% 612 99.5% 2.1% 2.1% 79. University Village-Sacramento, CA 279 389 71.7% 52.4% 394 107.4% 2.0% 2.0% 80. Uptown Apartments-Denton, TX 260 528 49.2% 51.5% 528 98.5% 2.0% 2.0% 81. Villas on Sycamore-Huntsville, TX 536 680 78.8% 64.6% 680 99.4% 1.8% 1.9% 82. Stone Gate-Harrisonburg, VA 662 672 98.5% 98.7% 672 98.8% 0.5% 1.9% 83. Callaway Villas-College Station, TX 468 702 66.7% 86.0% 704 99.3% 2.0% 1.9% 84. The Edge-Orlando, FL 583 930 62.7% 54.1% 930 99.2% 1.8% 1.8% 1. As of April 24, 2015 for current year and April 24, 2014 for prior year. 2. Rentable beds exclude beds needed for on-site staff. 3. As of September 30, 2014. 4. Projected rate increase reflects projected rental rates anticipated to be achieved through the end of the company’s leasing cycle, up to targeted occupancy. AMERICAN CAMPUS COMMUNITIES 11
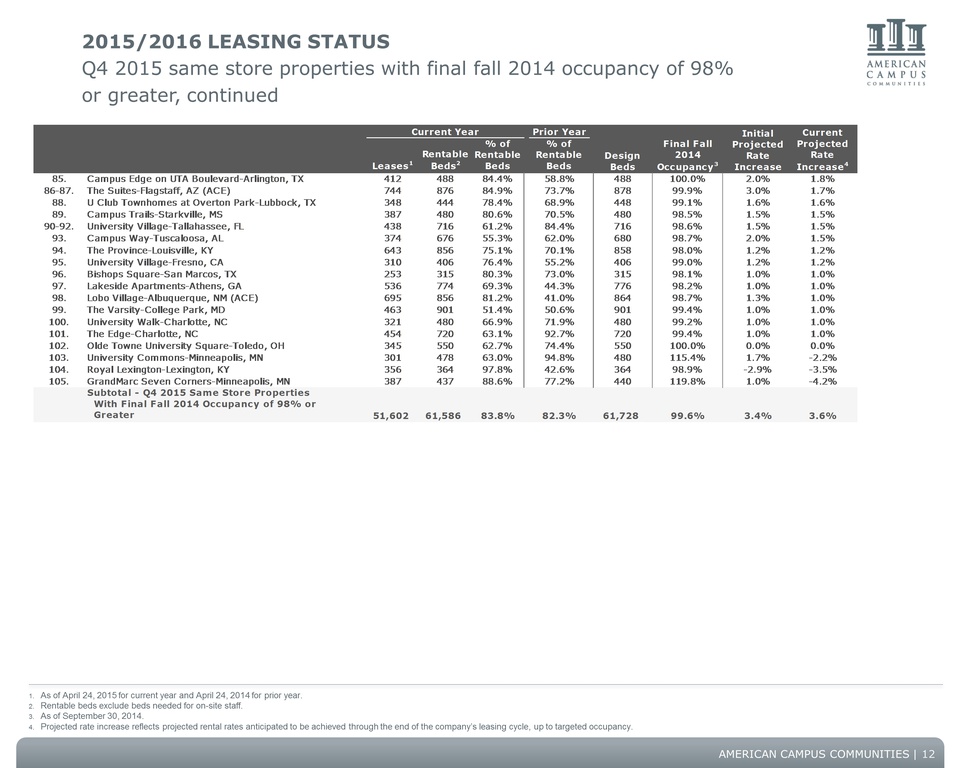
2015/2016 LEASING STATUS Q4 2015 same store properties with final fall 2014 occupancy of 98% or greater, continued Current Year Prior Year Leases 1 Rentable Beds 2 % of Rentable Beds % of Rentable Beds Design Beds Final Fall 2014 Occupancy 3 Initial Projected Rate Increase Current Projected Rate Increase 4 85. Campus Edge on UTA Boulevard-Arlington, TX 412 488 84.4% 58.8% 488 100.0% 2.0% 1.8% 86-87. The Suites-Flagstaff, AZ (ACE) 744 876 84.9% 73.7% 878 99.9% 3.0% 1.7% 88. U Club Townhomes at Overton Park-Lubbock, TX 348 444 78.4% 68.9% 448 99.1% 1.6% 1.6% 89. Campus Trails-Starkville, MS 387 480 80.6% 70.5% 480 98.5% 1.5% 1.5% 90-92. University Village-Tallahassee, FL 438 716 61.2% 84.4% 716 98.6% 1.5% 1.5% 93. Campus Way-Tuscaloosa, AL 374 676 55.3% 62.0% 680 98.7% 2.0% 1.5% 94. The Province-Louisville, KY 643 856 75.1% 70.1% 858 98.0% 1.2% 1.2% 95. University Village-Fresno, CA 310 406 76.4% 55.2% 406 99.0% 1.2% 1.2% 96. Bishops Square-San Marcos, TX 253 315 80.3% 73.0% 315 98.1% 1.0% 1.0% 97. Lakeside Apartments-Athens, GA 536 774 69.3% 44.3% 776 98.2% 1.0% 1.0% 98. Lobo Village-Albuquerque, NM (ACE) 695 856 81.2% 41.0% 864 98.7% 1.3% 1.0% 99. The Varsity-College Park, MD 463 901 51.4% 50.6% 901 99.4% 1.0% 1.0% 100. University Walk-Charlotte, NC 321 480 66.9% 71.9% 480 99.2% 1.0% 1.0% 101. The Edge-Charlotte, NC 454 720 63.1% 92.7% 720 99.4% 1.0% 1.0% 102. Olde Towne University Square-Toledo, OH 345 550 62.7% 74.4% 550 100.0% 0.0% 0.0% 103. University Commons-Minneapolis, MN 301 478 63.0% 94.8% 480 115.4% 1.7% -2.2% 104. Royal Lexington-Lexington, KY 356 364 97.8% 42.6% 364 98.9% -2.9% -3.5% 105. GrandMarc Seven Corners-Minneapolis, MN 387 437 88.6% 77.2% 440 119.8% 1.0% -4.2% Subtotal - Q4 2015 Same Store Properties With Final Fall 2014 Occupancy of 98% or Greater 51,602 61,586 83.8% 82.3% 61,728 99.6% 3.4% 3.6% 1. As of April 24, 2015 for current year and April 24, 2014 for prior year. 2. Rentable beds exclude beds needed for on-site staff. 3. As of September 30, 2014. 4. Projected rate increase reflects projected rental rates anticipated to be achieved through the end of the company’s leasing cycle, up to targeted occupancy. AMERICAN CAMPUS COMMUNITIES 12
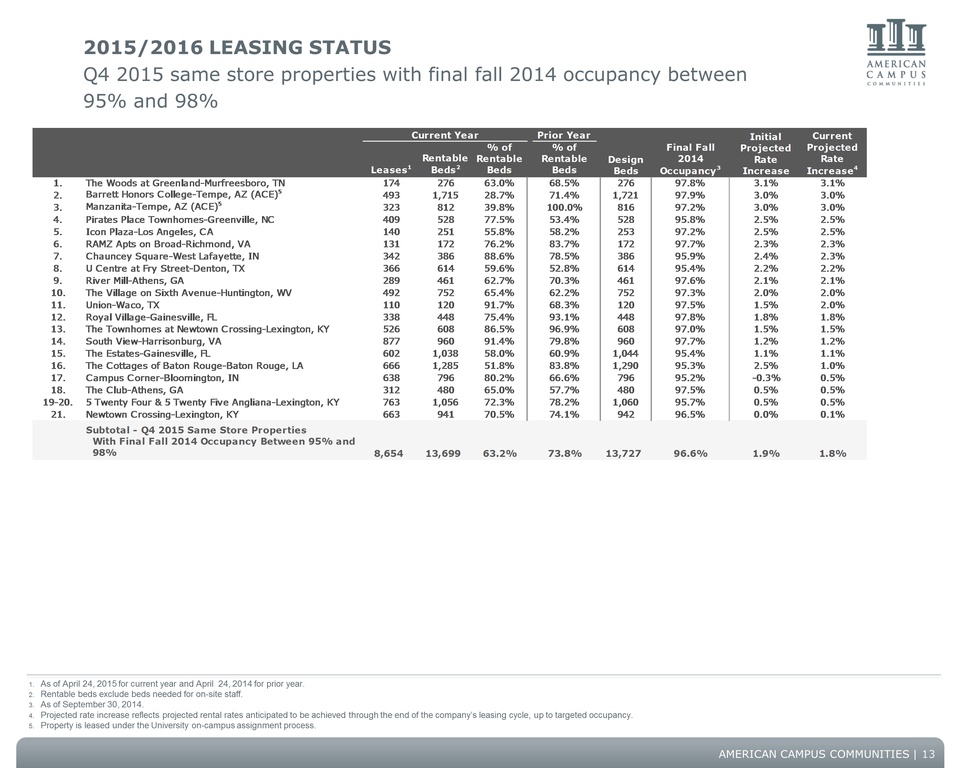
2015/2016 LEASING STATUS Q4 2015 same store properties with final fall 2014 occupancy between 95% and 98% Current Year Prior Year Leases 1 Rentable Beds 2 % of Rentable Beds % of Rentable Beds Design Beds Final Fall 2014 Occupancy 3 Initial Projected Rate Increase Current Projected Rate Increase 4 1. The Woods at Greenland-Murfreesboro, TN 174 276 63.0% 68.5% 276 97.8% 3.1% 3.1% 2. Barrett Honors College-Tempe, AZ (ACE) 5 493 1,715 28.7% 71.4% 1,721 97.9% 3.0% 3.0% 3. Manzanita-Tempe, AZ (ACE)5 323 812 39.8% 100.0% 816 97.2% 3.0% 3.0% 4. Pirates Place Townhomes-Greenville, NC 409 528 77.5% 53.4% 528 95.8% 2.5% 2.5% 5. Icon Plaza-Los Angeles, CA 140 251 55.8% 58.2% 253 97.2% 2.5% 2.5% 6. RAMZ Apts on Broad-Richmond, VA 131 172 76.2% 83.7% 172 97.7% 2.3% 2.3% 7. Chauncey Square-West Lafayette, IN 342 386 88.6% 78.5% 386 95.9% 2.4% 2.3% 8. U Centre at Fry Street-Denton, TX 366 614 59.6% 52.8% 614 95.4% 2.2% 2.2% 9. River Mill-Athens, GA 289 461 62.7% 70.3% 461 97.6% 2.1% 2.1% 10. The Village on Sixth Avenue-Huntington, WV 492 752 65.4% 62.2% 752 97.3% 2.0% 2.0% 11. Union-Waco, TX 110 120 91.7% 68.3% 120 97.5% 1.5% 2.0% 12. Royal Village-Gainesville, FL 338 448 75.4% 93.1% 448 97.8% 1.8% 1.8% 13. The Townhomes at Newtown Crossing-Lexington, KY 526 608 86.5% 96.9% 608 97.0% 1.5% 1.5% 14. South View-Harrisonburg, VA 877 960 91.4% 79.8% 960 97.7% 1.2% 1.2% 15. The Estates-Gainesville, FL 602 1,038 58.0% 60.9% 1,044 95.4% 1.1% 1.1% 16. The Cottages of Baton Rouge-Baton Rouge, LA 666 1,285 51.8% 83.8% 1,290 95.3% 2.5% 1.0% 17. Campus Corner-Bloomington, IN 638 796 80.2% 66.6% 796 95.2% -0.3% 0.5% 18. The Club-Athens, GA 312 480 65.0% 57.7% 480 97.5% 0.5% 0.5% 19-20. 5 Twenty Four & 5 Twenty Five Angliana-Lexington, KY 763 1,056 72.3% 78.2% 1,060 95.7% 0.5% 0.5% 21. Newtown Crossing-Lexington, KY 663 941 70.5% 74.1% 942 96.5% 0.0% 0.1% Subtotal - Q4 2015 Same Store Properties With Final Fall 2014 Occupancy Between 95% and 98% 8,654 13,699 63.2% 73.8% 13,727 96.6% 1.9% 1.8% 1. As of April 24, 2015 for current year and April 24, 2014 for prior year. 2. Rentable beds exclude beds needed for on-site staff. 3. As of September 30, 2014. 4. Projected rate increase reflects projected rental rates anticipated to be achieved through the end of the company’s leasing cycle, up to targeted occupancy. 5. Property is leased under the University on-campus assignment process. AMERICAN CAMPUS COMMUNITIES 13
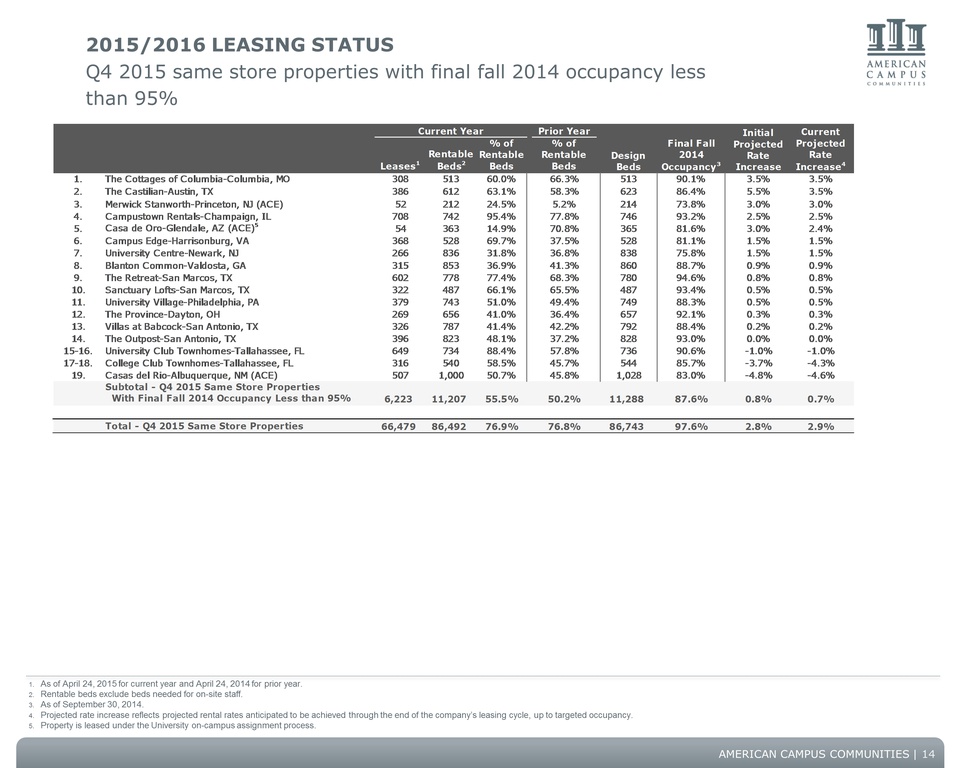
2015/2016 LEASING STATUS Q4 2015 same store properties with final fall 2014 occupancy less than 95% Current Year Prior Year Leases 1 Rentable Beds 2 % of Rentable Beds % of Rentable Beds Design Beds Final Fall 2014 Occupancy 3 Initial Projected Rate Increase Current Projected Rate Increase 4 1. The Cottages of Columbia-Columbia, MO 308 513 60.0% 66.3% 513 90.1% 3.5% 3.5% 2. The Castilian-Austin, TX 386 612 63.1% 58.3% 623 86.4% 5.5% 3.5% 3. Merwick Stanworth-Princeton, NJ (ACE) 52 212 24.5% 5.2% 214 73.8% 3.0% 3.0% 4. Campustown Rentals-Champaign, IL 708 742 95.4% 77.8% 746 93.2% 2.5% 2.5% 5. Casa de Oro-Glendale, AZ (ACE) 5 54 363 14.9% 70.8% 365 81.6% 3.0% 2.4% 6. Campus Edge-Harrisonburg, VA 368 528 69.7% 37.5% 528 81.1% 1.5% 1.5% 7. University Centre-Newark, NJ 266 836 31.8% 36.8% 838 75.8% 1.5% 1.5% 8. Blanton Common-Valdosta, GA 315 853 36.9% 41.3% 860 88.7% 0.9% 0.9% 9. The Retreat-San Marcos, TX 602 778 77.4% 68.3% 780 94.6% 0.8% 0.8% 10. Sanctuary Lofts-San Marcos, TX 322 487 66.1% 65.5% 487 93.4% 0.5% 0.5% 11. University Village-Philadelphia, PA 379 743 51.0% 49.4% 749 88.3% 0.5% 0.5% 12. The Province-Dayton, OH 269 656 41.0% 36.4% 657 92.1% 0.3% 0.3% 13. Villas at Babcock-San Antonio, TX 326 787 41.4% 42.2% 792 88.4% 0.2% 0.2% 14. The Outpost-San Antonio, TX 396 823 48.1% 37.2% 828 93.0% 0.0% 0.0% 15-16. University Club Townhomes-Tallahassee, FL 649 734 88.4% 57.8% 736 90.6% -1.0% -1.0% 17-18. College Club Townhomes-Tallahassee, FL 316 540 58.5% 45.7% 544 85.7% -3.7% -4.3% 19. Casas del Rio-Albuquerque, NM (ACE) 507 1,000 50.7% 45.8% 1,028 83.0% -4.8% -4.6% Subtotal - Q4 2015 Same Store Properties With Final Fall 2014 Occupancy Less than 95% 6,223 11,207 55.5% 50.2% 11,288 87.6% 0.8% 0.7% Total - Q4 2015 Same Store Properties 66,479 86,492 76.9% 76.8% 86,743 97.6% 2.8% 2.9% 1. As of April 24, 2015 for current year and April 24, 2014 for prior year. 2. Rentable beds exclude beds needed for on-site staff. 3. As of September 30, 2014. 4. Projected rate increase reflects projected rental rates anticipated to be achieved through the end of the company’s leasing cycle, up to targeted occupancy. 5. Property is leased under the University on-campus assignment process. AMERICAN CAMPUS COMMUNITIES 14
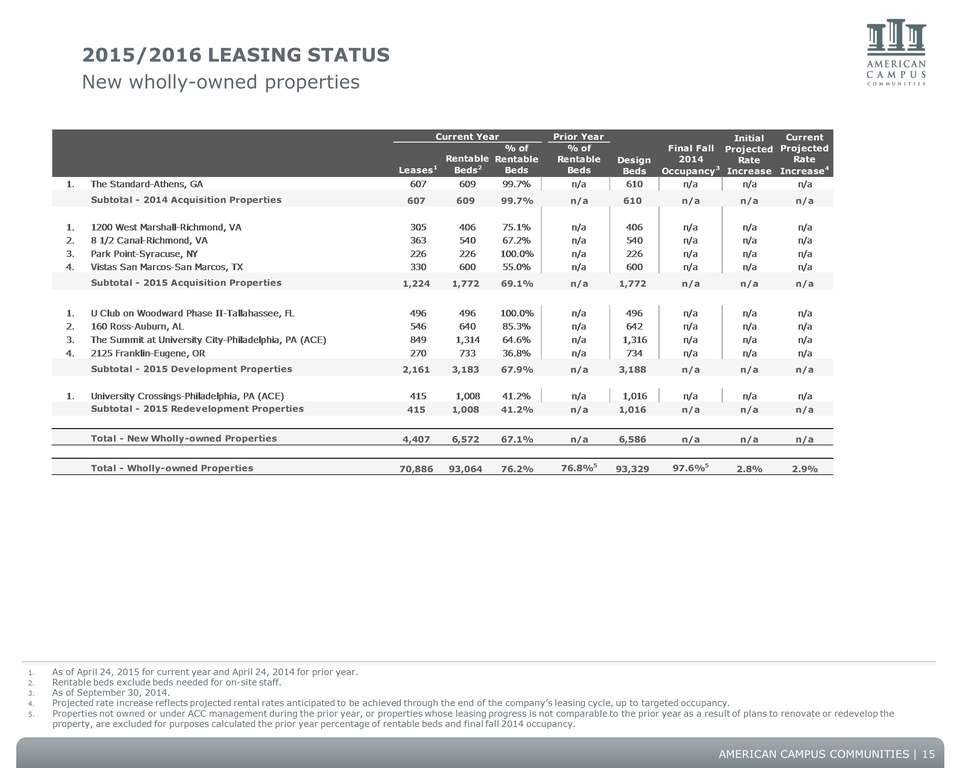
2015/2016 LEASING STATUS New wholly-owned properties Current Year Prior Year Leases 1 Rentable Beds 2 % of Rentable Beds % of Rentable Beds Design Beds Final Fall 2014 Occupancy 3 Initial Projected Rate Increase Current Projected Rate Increase 4 1. The Standard-Athens, GA 607 609 99.7% n/a 610 n/a n/a n/a Subtotal - 2014 Acquisition Properties 607 609 99.7% n/a 610 n/a n/a n/a 1. 1200 West Marshall-Richmond, VA 305 406 75.1% n/a 406 n/a n/a n/a 2. 8 1/2 Canal-Richmond, VA 363 540 67.2% n/a 540 n/a n/a n/a 3. Park Point-Syracuse, NY 226 226 100.0% n/a 226 n/a n/a n/a 4. Vistas San Marcos-San Marcos, TX 330 600 55.0% n/a 600 n/a n/a n/a Subtotal - 2015 Acquisition Properties 1,224 1,772 69.1% n/a 1,772 n/a n/a n/a 1. U Club on Woodward Phase II-Tallahassee, FL 496 496 100.0% n/a 496 n/a n/a n/a 2. 160 Ross-Auburn, AL 546 640 85.3% n/a 642 n/a n/a n/a 3. The Summit at University City-Philadelphia, PA (ACE) 849 1,314 64.6% n/a 1,316 n/a n/a n/a 4. 2125 Franklin-Eugene, OR 270 733 36.8% n/a 734 n/a n/a n/a Subtotal - 2015 Development Properties 2,161 3,183 67.9% n/a 3,188 n/a n/a n/a 1. University Crossings-Philadelphia, PA (ACE) 415 1,008 41.2% n/a 1,016 n/a n/a n/a Subtotal - 2015 Redevelopment Properties 415 1,008 41.2% n/a 1,016 n/a n/a n/a Total - New Wholly-owned Properties 4,407 6,572 67.1% n/a 6,586 n/a n/a n/a Total - Wholly-owned Properties 70,886 93,064 76.2% 76.8%5 93,329 97.6%5 2.8% 2.9% 1. As of April 24, 2015 for current year and April 24, 2014 for prior year. 2. Rentable beds exclude beds needed for on-site staff. 3. As of September 30, 2014. 4. Projected rate increase reflects projected rental rates anticipated to be achieved through the end of the company’s leasing cycle, up to targeted occupancy. 5. Properties not owned or under ACC management during the prior year, or properties whose leasing progress is not comparable to the prior year as a result of plans to renovate or redevelop the property, are excluded for purposes calculated the prior year percentage of rentable beds and final fall 2014 occupancy. AMERICAN CAMPUS COMMUNITIES 15
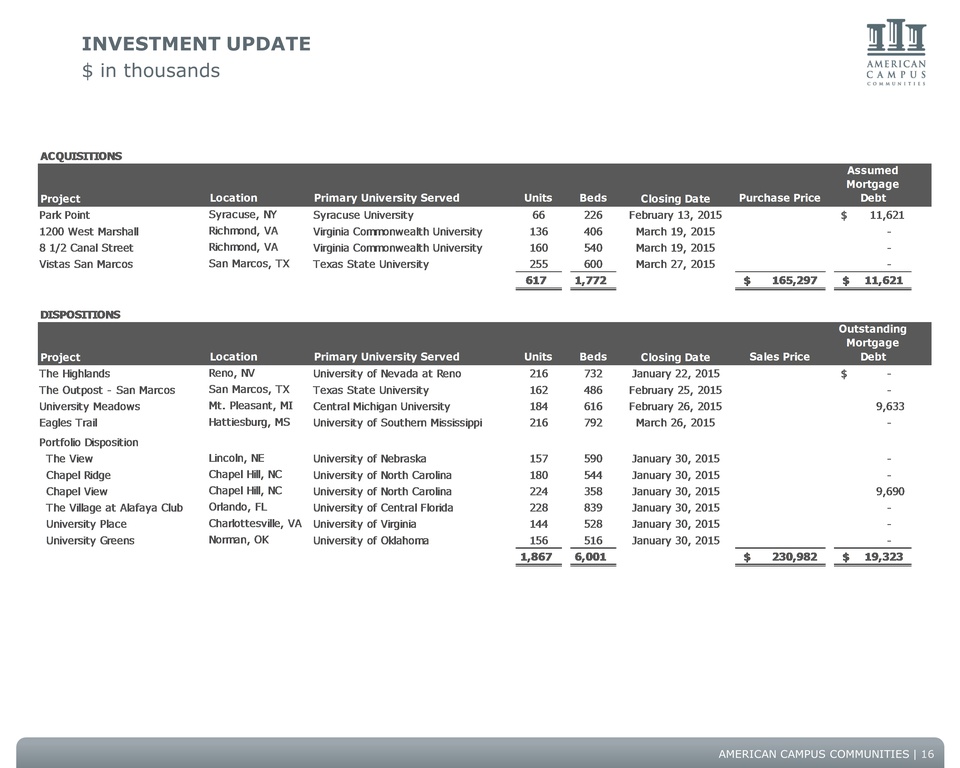
INVESTMENT UPDATE $ in thousands ACQUISITIONS Project Location Primary University Served Units Beds Closing Date Purchase Price Assumed Mortgage Debt Park Point Syracuse, NY Syracuse University 66 226 February 13, 2015 $ 11,621 1200 West Marshall Richmond, VA Virginia Commonwealth University 136 406 March 19, 2015 - 8 1/2 Canal Street Richmond, VA Virginia Commonwealth University 160 540 March 19, 2015 - Vistas San Marcos San Marcos, TX Texas State University 255 600 March 27, 2015 - 617 1,772 $ 165,297 $ 11,621 DISPOSITIONS Project Location Primary University Served Units Beds Closing Date Sales Price Outstanding Mortgage Debt The Highlands Reno, NV University of Nevada at Reno 216 732 January 22, 2015 $ - The Outpost - San Marcos San Marcos, TX Texas State University 162 486 February 25, 2015 - University Meadows Mt. Pleasant, MI Central Michigan University 184 616 February 26, 2015 9,633 Eagles Trail Hattiesburg, MS University of Southern Mississippi 216 792 March 26, 2015 - Portfolio Disposition The View Lincoln, NE University of Nebraska 157 590 January 30, 2015 - Chapel Ridge Chapel Hill, NC University of North Carolina 180 544 January 30, 2015 - Chapel View Chapel Hill, NC University of North Carolina 224 358 January 30, 2015 9,690 The Village at Alafaya Club Orlando, FL University of Central Florida 228 839 January 30, 2015 - University Place Charlottesville, VA University of Virginia 144 528 January 30, 2015 - University Greens Norman, OK University of Oklahoma 156 516 January 30, 2015 - 1,867 6,001 $ 230,982 $ 19,323 AMERICAN CAMPUS COMMUNITIES 16
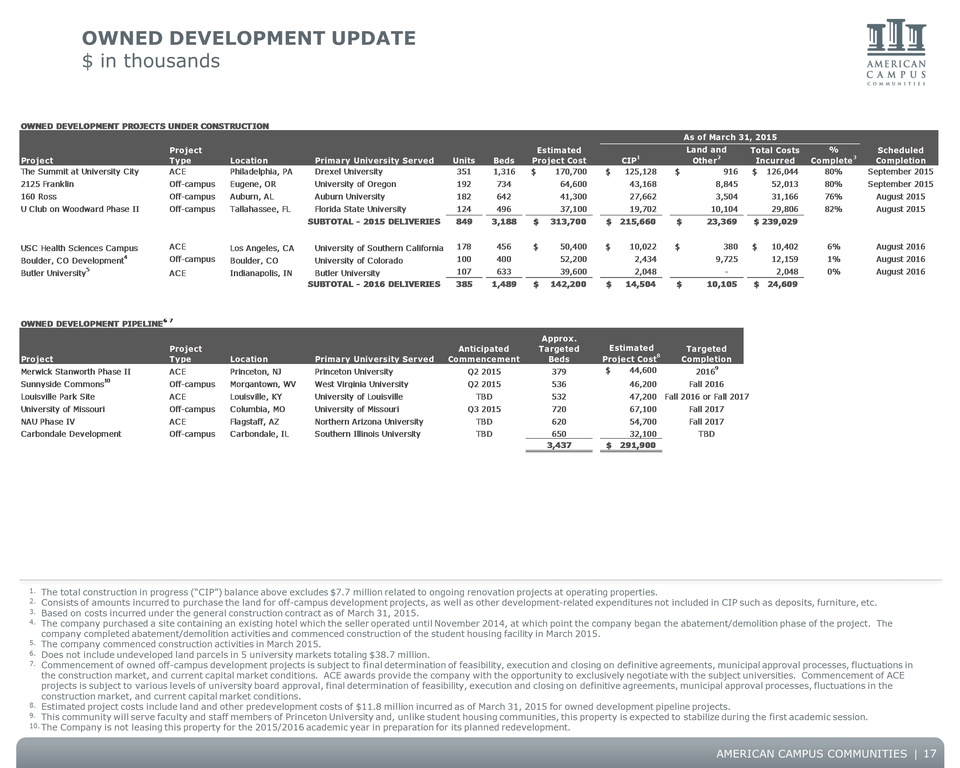
OWNED DEVELOPMENT UPDATE $ in thousands OWNED DEVELOPMENT PROJECTS UNDER CONSTRUCTION Project Project Type Location Primary University Served Units Beds Estimated Project Cost As of March 31, 2015 CIP1 Land and Other 2 Total Costs Incurred % Complete 3 Scheduled Completion The Summit at University City ACE Philadelphia, PA Drexel University 351 1,316 $ 170,700 $ 125,128 $ 916 $ 126,044 80% September 2015 2125 Franklin Off-campus Eugene, OR University of Oregon 192 734 64,600 43,168 8,845 52,013 80% September 2015 160 Ross Off-campus Auburn, AL Auburn University 182 642 41,300 27,662 3,504 31,166 76% August 2015 U Club on Woodward Phase II Off-campus Tallahassee, FL Florida State University 124 496 37,100 19,702 1 0,104 29,806 82% August 2015 SUBTOTAL - 2015 DELIVERIES 849 3,188 $ 313,700 $ 215,660 $ 23,369 $ 239,029 USC Health Sciences Campus ACE Los Angeles, CA University of Southern California 178 456 $ 50,400 $ 10,022 $ 380 $ 10,402 6% August 2016 Boulder, CO Development 4 Off-campus Boulder, CO University of Colorado 100 400 52,200 2,434 9,725 12,159 1% August 2016 Butler University 5 ACE Indianapolis, IN Butler University 107 633 39,600 2,048 - 2,048 0% August 2016 SUBTOTAL - 2016 DELIVERIES 385 1,489 $ 142,200 $ 14,504 $ 10,105 $ 24,609 OWNED DEVELOPMENT PIPELINE 6 7 Project Project Type Location Primary University Served Anticipated Commencement Approx. Targeted Beds Estimated Project Cost 8 Targeted Completion Merwick Stanworth Phase II ACE Princeton, NJ Princeton University Q3 2015 379 $ 44,600 2016 9 Sunnyside Commons 10 Off-campus Morgantown, WV West Virginia University Q3 2015 536 46,200 Fall 2016 Louisville Park Site ACE Louisville, KY University of Louisville TBD 532 47,200 Fall 2016 or Fall 2017 University of Missouri Off-campus Columbia, MO University of Missouri Q3 2015 720 67,100 Fall 2017 NAU Phase IV ACE Flagstaff, AZ Northern Arizona University TBD 620 54,700 Fall 2017 Carbondale Development Off-campus Carbondale, IL Southern Illinois University TBD 650 32,100 TBD 3,437 $ 291,900 1. The total construction in progress (“CIP”) balance above excludes $7.7 million related to ongoing renovation projects at operating properties. 2. Consists of amounts incurred to purchase the land for off-campus development projects, as well as other development-related expenditures not included in CIP such as deposits, furniture, etc. 3. Based on costs incurred under the general construction contract as of March 31, 2015. 4. The company purchased a site containing an existing hotel which the seller operated until November 2014, at which point the company began the abatement/demolition phase of the project. The company completed abatement/demolition activities and commenced construction of the student housing facility in March 2015. 5. The company commenced construction activities in March 2015. 6. Does not include undeveloped land parcels in 5 university markets totaling $38.7 million. 7. Commencement of owned off-campus development projects is subject to final determination of feasibility, execution and closing on definitive agreements, municipal approval processes, fluctuations in the construction market, and current capital market conditions. ACE awards provide the company with the opportunity to exclusively negotiate with the subject universities. Commencement of ACE projects is subject to various levels of university board approval, final determination of feasibility, execution and closing on definitive agreements, municipal approval processes, fluctuations in the construction market, and current capital market conditions. 8. Estimated project costs include land and other predevelopment costs of $11.8 million incurred as of March 31, 2015 for owned development pipeline projects. 9. This community will serve faculty and staff members of Princeton University and, unlike student housing communities, this property is expected to stabilize during the first academic session. 10.The Company is not leasing this property for the 2015/2016 academic year in preparation for its planned redevelopment. AMERICAN CAMPUS COMMUNITIES 17
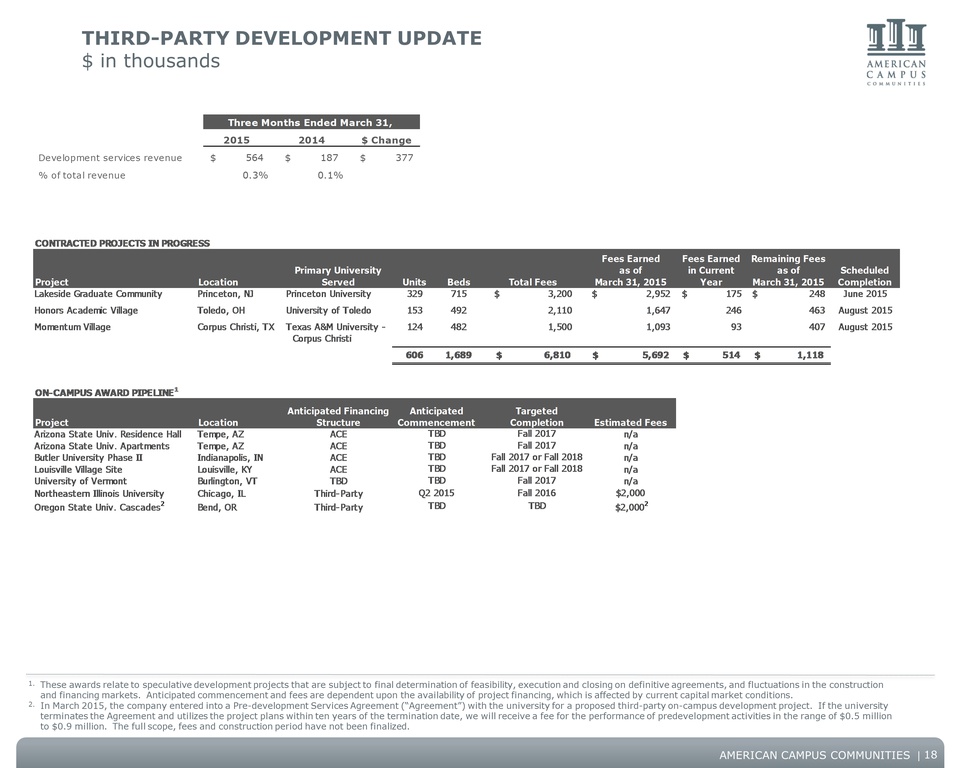
THIRD-PARTY DEVELOPMENT UPDATE $ in thousands Three Months Ended March 31, 2015 2014 $ Change Development services revenue $ 564 $ 187 $ 377 % of total revenue 0.3% 0.1% CONTRACTED PROJECTS IN PROGRESS Project Location Primary University Served Units Beds Total Fees Fees Earned as of March 31, 2015 Fees Earned in Current Year Remaining Fees as of March 31, 2015 Scheduled Completion Lakeside Graduate Community Princeton, NJ Princeton University 329 715 $ 3,200 $ 2,952 $ 175 $ 248 June 2015 Honors Academic Village Toledo, OH University of Toledo 153 492 2,110 1,647 246 463 August 2015 Momentum Village Corpus Christi, TX Texas A&M University - Corpus Christi 124 482 1,500 1,093 93 407 August 2015 606 1,689 $ 6,810 $ 5,692 $ 514 $ 1,118 ON-CAMPUS AWARD PIPELINE 1 Project Location Anticipated Financing Structure Anticipated Commencement Targeted Completion Estimated Fees Arizona State Univ. Residence Hall Tempe, AZ ACE TBD Fall 2017 n/a Arizona State Univ. Apartments Tempe, AZ ACE TBD Fall 2017 n/a Butler University Phase II Indianapolis, IN ACE TBD Fall 2017 or Fall 2018 n/a Louisville Village Site Louisville, KY ACE TBD Fall 2017 or Fall 2018 n/a University of Vermont Burlington, VT TBD TBD Fall 2017 n/a Northeastern Illinois University Chicago, IL Third-Party Q2 2015 Fall 2016 $2,000 Oregon State Univ. Cascades 2 Bend, OR Third-Party TBD TBD $2,000 2 1. These awards relate to speculative development projects that are subject to final determination of feasibility, execution and closing on definitive agreements, and fluctuations in the construction and financing markets. Anticipated commencement and fees are dependent upon the availability of project financing, which is affected by current capital market conditions. 2. In March 2015, the company entered into a Pre-development Services Agreement (“Agreement”) with the university for a proposed third-party on-campus development project. If the university terminates the Agreement and utilizes the project plans within ten years of the termination date, we will receive a fee for the performance of predevelopment activities in the range of $0.5 million to $0.9 million. The full scope, fees and construction period have not been finalized. AMERICAN CAMPUS COMMUNITIES 18
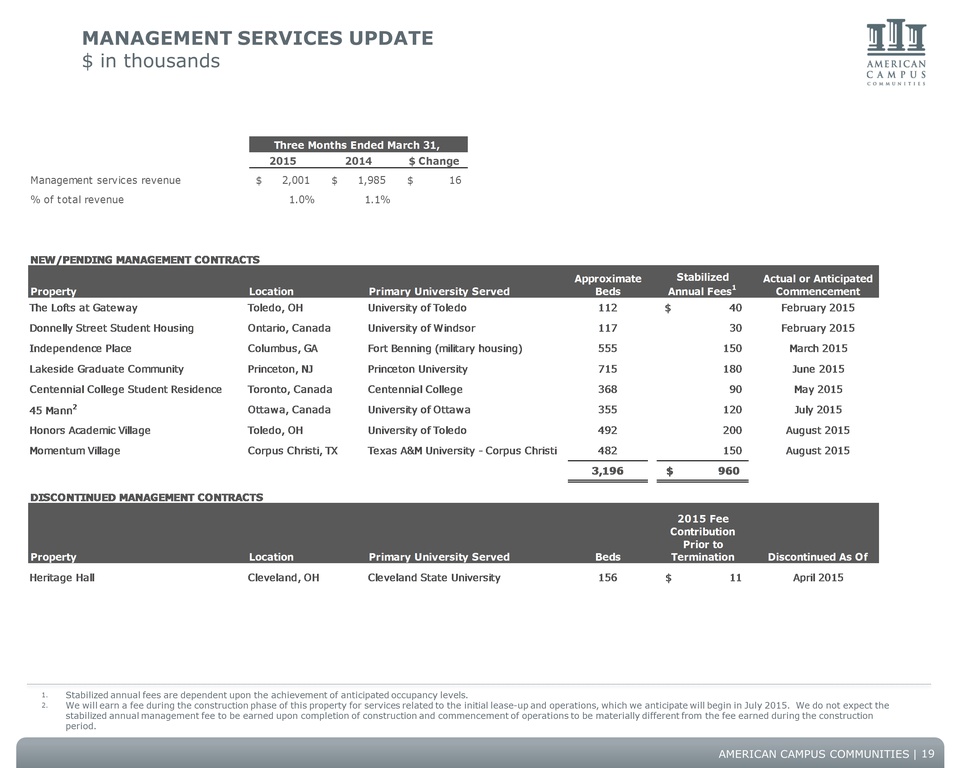
MANAGEMENT SERVICES UPDATE $ in thousands Three Months Ended March 31, 2015 2014 $ Change Management services revenue $ 2,001 $ 1,985 $ 16 % of total revenue 1.0% 1.1% NEW/PENDING MANAGEMENT CONTRACTS Property Location Primary University Served Approximate Beds Stabilized Annual Fees 1 Actual or Anticipated Commencement The Lofts at Gateway Toledo, OH University of Toledo 112 $ 40 February 2015 Donnelly Street Student Housing Ontario, Canada University of Windsor 117 30 February 2015 Independence Place Columbus, GA Fort Benning (military housing) 555 150 March 2015 Lakeside Graduate Community Princeton, NJ Princeton University 715 180 June 2015 Centennial College Student Residence Toronto, Canada Centennial College 368 90 May 2015 45 Mann 2 Ottawa, Canada University of Ottawa 355 120 July 2015 July 2015 Honors Academic Village Toledo, OH University of Toledo 492 200 August 2015 Momentum Village Corpus Christi, TX Texas A&M University - Corpus Christi 482 150 August 2015 3,196 $ 960 DISCONTINUED MANAGEMENT CONTRACTS Property Location Primary University Served Beds 2015 Fee Contribution Prior to Termination Discontinued As Of Heritage Hall Cleveland, OH Cleveland State University 156 $ 11 April 2015 1. Stabilized annual fees are dependent upon the achievement of anticipated occupancy levels. 2. We will earn a fee during the construction phase of this property for services related to the initial lease-up and operations, which we anticipate will begin in July 2015. We do not expect the stabilized annual management fee to be earned upon completion of construction and commencement of operations to be materially different from the fee earned during the construction period. AMERICAN CAMPUS COMMUNITIES 19
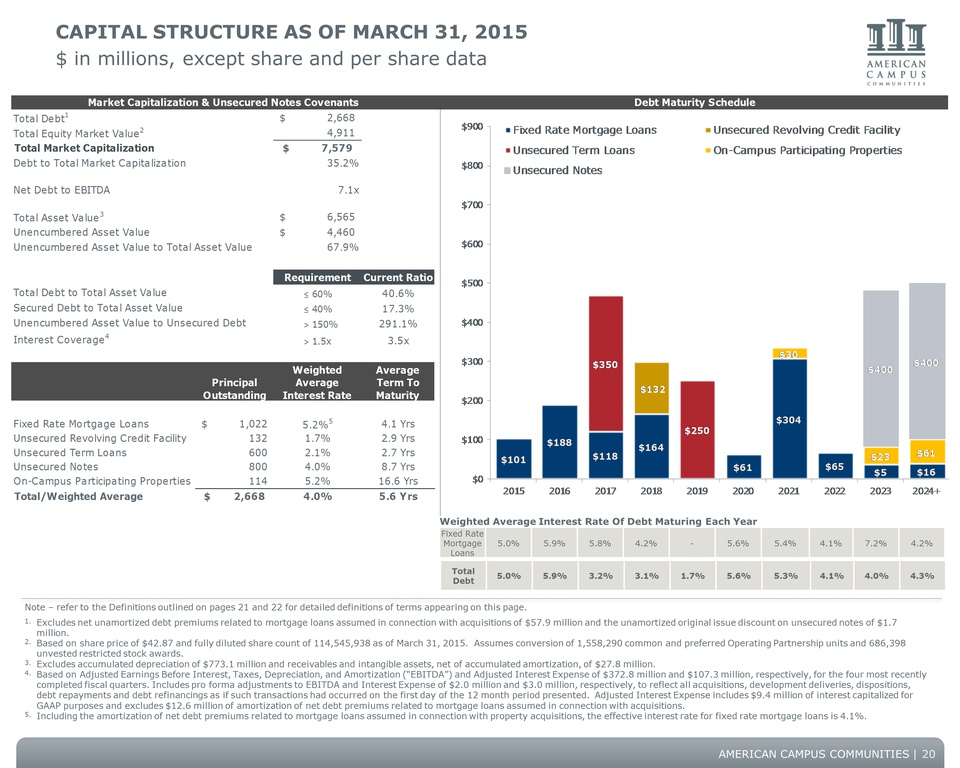
CAPITAL STRUCTURE AS OF MARCH 31, 2015 $ in millions, except share and per share data Market Capitalization & Unsecured Notes Covenants Debt Maturity Schedule Total Debt 1 $ 2,668 Total Equity Market Value 2 4,911 Total Market Capitalization $ 7,579 Debt to Total Market Capitalization 35.2% Net Debt to EBITDA 7.1x Total Asset Value 3 $ 6,565 Unencumbered Asset Value $ 4,460 Unencumbered Asset Value to Total Asset Value 67.9% Requirement Current Ratio Total Debt to Total Asset Value less than or equal to 60% 40.6% Secured Debt to Total Asset Value less than or equal to 40% 17.3% Unencumbered Asset Value to Unsecured Debt greater than 150% 291.1% Interest Coverage 4 greater than 1.5x 3.5x Principal Outstanding Weighted Average Interest Rate Average Term to Maturity Fixed Rate Mortgage Loans $ 1,022 5.2% 5 4.1 yrs Unsecured Revolving Credit Facility 132 1.7% 2.9 yrs Unsecured Term Loans 600 2.1% 2.7 yrs Unsecured Notes 800 4.0% 8.7 yrs On-Campus Participating Properties 144 5.2% 16.6 yrs Total/Weighted Average $ 2,668 4.0% 5.6 yrs Weighted Average Interest Rate Of Debt Maturing Each Year Fixed Rate Mortgage Loans 5.0% 5.9% 5.8% 4.2% - 5.6% 5.4% 4.1% 7.2% 4.2% Total Debt 5.0% 5.9% 3.2% 3.1% 1.7% 5.6% 5.3% 4.1% 4.0% 4.3% Note – refer to the Definitions outlined on pages 21 and 22 for detailed definitions of terms appearing on this page. 1. Excludes net unamortized debt premiums related to mortgage loans assumed in connection with acquisitions of $57.9 million and the unamortized original issue discount on unsecured notes of $1.7 million. 2. Based on share price of $42.87 and fully diluted share count of 114,545,938 as of March 31, 2015. Assumes conversion of 1,558,290 common and preferred Operating Partnership units and 686,398 unvested restricted stock awards. 3. Excludes accumulated depreciation of $773.1 million and receivables and intangible assets, net of accumulated amortization, of $27.8 million. 4. Based on Adjusted Earnings Before Interest, Taxes, Depreciation, and Amortization (“EBITDA”) and Adjusted Interest Expense of $372.8 million and $107.3 million, respectively, for the four most recently completed fiscal quarters. Includes pro forma adjustments to EBITDA and Interest Expense of $2.0 million and $3.0 million, respectively, to reflect all acquisitions, development deliveries, dispositions, debt repayments and debt refinancings as if such transactions had occurred on the first day of the 12 month period presented. Adjusted Interest Expense includes $9.4 million of interest capitalized for GAAP purposes and excludes $12.6 million of amortization of net debt premiums related to mortgage loans assumed in connection with acquisitions. 5. Including the amortization of net debt premiums related to mortgage loans assumed in connection with property acquisitions, the effective interest rate for fixed rate mortgage loans is 4.1%. AMERICAN CAMPUS COMMUNITIES 20
DEFINITIONS ACE The company’s American Campus Equity program, whereby the company enters into long-term ground/facility lease agreements with Universities to finance, construct, and operate on-campus student housing communities. Properties under this structure are considered to be wholly-owned and are included in the company's consolidated financial statements. Adjusted EBITDA* EBITDA, including pro forma adjustments to reflect acquisitions, development deliveries, and dispositions as if such transactions had occurred on the first day of the 12-month period presented. Adjusted Interest Expense* Interest Expense, including pro forma adjustments to reflect acquisitions, development deliveries, dispositions, debt repayments, and debt refinancings as if such transactions had occurred on the first day of the 12-month period presented. Cash Cash and cash equivalents, determined on a consolidated basis in accordance with GAAP. Design Beds Total beds based on the original property design, generally as specified in the construction documents. EBITDA* Consolidated net income calculated in accordance with GAAP, plus amounts which have been deducted and minus amounts which have been added for, without duplication: (i) interest expense; (ii) provision for income taxes; (iii) depreciation, amortization and all other non-cash items; (iv) provision for gains and losses; (v) noncontrolling interests; and (vi) extraordinary and other non-recurring items, as we determine in good faith. Funds from Operations (“FFO”) Determined based on the definition adopted by the Board of Governors of the National Association of Real Estate Investment Trusts (“NAREIT”). Calculated as consolidated net income or loss attributable to common shares computed in accordance with GAAP, excluding gains or losses from depreciable operating property sales, plus real estate depreciation and amortization, and after adjustments for unconsolidated partnerships and joint ventures. Also excludes non-cash impairment charges. FFO Modified (“FFOM”) FFO modified to reflect certain adjustments related to the economic performance of our on-campus participating properties, and the elimination of property acquisition costs and other non-cash items, as we determine in good faith. The company believes it is meaningful to eliminate the FFO generated from the on-campus participating properties and instead to reflect the company's 50% share of the properties' net cash flow and management and development fees received, as this measure better reflects the economic benefit derived from the company's involvement in the operation of these properties. GAAP Accounting principles generally accepted in the United States of America. Interest Coverage* Adjusted EBITDA / Adjusted Interest Expense. Interest Expense* Consolidated interest expense calculated in accordance with GAAP, plus amounts which have been deducted and minus amounts which have been added for, without duplication: (i) the amortization of mark-to-market premiums/discounts on mortgage loans assumed in connection with acquisitions; (ii) capitalized interest; and (iii) the change in accrued interest during the period presented. Net Debt* Total Debt less Cash. * These definitions are provided for purposes of calculating the company’s bond covenants and other key ratios. AMERICAN CAMPUS COMMUNITIES 21
DEFINITIONS, CONTINUED Net Debt to EBITDA* Net Debt divided by Adjusted EBITDA. Net Operating Income “NOI” Property revenues less direct property operating expenses, excluding depreciation, but including allocated corporate general and administrative expenses. On-campus Participating Properties A transaction structure whereby the company enters into long-term ground/facility lease agreements with Universities to develop, construct, and operate student housing communities. Under the terms of the leases, title to the constructed facilities is held by the University/lessor and such lessor receives 50% of net cash flows, as defined, on an annual basis through the term of the lease. Physical Occupancy Occupied beds, including staff accommodations, divided by Design Beds. Rentable Beds Design beds less beds used by on-site staff. Secured Debt* The portion of Total Debt that is secured by a mortgage, trust, deed of trust, deed to secure indebtedness, pledge, security interest, assignment of collateral, or any other security agreement. Total Asset Value* Undepreciated book value of real estate assets and all other assets, excluding receivables and intangibles, of our consolidated subsidiaries, all determined in accordance with GAAP. Total Debt* Total consolidated debt calculated in accordance with GAAP, including capital leases and excluding mark-to-market premiums/discounts on mortgage loans assumed in connection with acquisitions. Total Equity Market Value Fully diluted common shares times the company’s stock price at period-end. Unencumbered Asset Value* The sum of (i) the undepreciated book value of real estate assets which are not subject to secured debt; and (ii) all other assets, excluding accounts receivable and intangibles, for such properties. Does not include assets of unconsolidated joint ventures. Unsecured Debt* The portion of Total Debt that is not Secured Debt. * These definitions are provided for purposes of calculating the company’s bond covenants and other key ratios. AMERICAN CAMPUS COMMUNITIES 22
INVESTOR INFORMATION Executive Management Bill Bayless Chief Executive Officer Jim Hopke Chief Operating Officer Jon Graf Chief Financial Officer William Talbot Chief Investment Officer Research Coverage Jeffery Spector / Jana Galan Bank of America / Merrill Lynch (646) 855-1363 / (646) 855-3081 jeff.spector@baml.com / jana.galan@baml.com Michael Bilerman / Nick Joseph Citigroup Equity Research (212) 816-1383 / (212) 816-1909 michael.bilerman@citi.com / nicholas.joseph@citi.com Vincent Chao/ Mike Husseini Deutsche Bank Securities, Inc. (212) 250-6799 / (212) 250-7703 vincent.chao@db.com/ mike.husseini@db.com Steve Sakwa / Derek Bower Evercore ISI (212) 446-9462 / (212) 888-3842 ssakwa@evercoreisi.com / dbower@evercoreisi.com Andrew Rosivach / Jeff Pehl Goldman Sachs (212) 902-2796 / (212) 357-4474 andrew.rosivach@gs.com / jeffrey.pehl@gs.com Dave Bragg / Ryan Burke Green Street Advisors (949) 640-8780 / (949) 640-8780 dbragg@greenst.com / rburke@greenst.com Carol Kemple Hilliard Lyons (502) 588-1839 ckemple@hilliard.com Anthony Paolone / Emil Shalmiyev J.P. Morgan Securities (212) 622-6682 / (212) 622-6615 anthony.paolone@jpmorgan.com / emil.shalmiyev@jpmorgan.com Jordan Sadler / Austin Wurschmidt KeyBanc Capital Markets (917) 368-2280 / (917) 368-2311 jsadler@keybanccm.com /awurschmidt@key.com Ryan Meliker MLV & Co (212) 542-5872 rmeliker@mlvco.com Drew Babin Robert W. Baird & Co. (212) 553-7816 dbabin@rwbaird.com Alexander Goldfarb / Ryan Peterson Sandler O'Neill + Partners, L.P. (212) 466-7937 / (212) 466-7927 agoldfarb@sandleroneill.com / rpeterson@sandleroneill.com Rod Petrik / David Corak Stifel, Nicolaus & Company, Inc. (443) 224-1306 / (410) 246-6312 rpetrik@stifel.com / corakd@stifel.com Ross Nussbaum / Nick Yulico UBS Investment Research (212) 713-2484 / (212) 713-3402 ross.nussbaum@ubs.com / nick.yulico@ubs.com American Campus Communities, Inc. is followed by the analysts listed above. Please note that any opinions, estimates or forecasts regarding American Campus Communities, Inc.'s performance made by such analysts are theirs alone and do not represent the opinions, forecasts or predictions of the company or its management. American Campus Communities, Inc. does not by its reference above or distribution imply its endorsement of or concurrence with such information, conclusions or recommendations. Additional Information Corporate Headquarters: American Campus Communities, Inc. 12700 Hill Country Blvd., Suite T-200 Austin, Texas 78738 Tel: (512) 732-1000; Fax: (512) 732-2450 www.americancampus.com Investor Relations: Ryan Dennison VP, Investor Relations (512) 732-1000 rdennison@americancampus.com AMERICAN CAMPUS COMMUNITIES 23
FORWARD-LOOKING STATEMENTS In addition to historical information, this supplemental package contains forward-looking statements under the federal securities law. These statements are based on current expectations, estimates and projections about the industry and markets in which American Campus operates, management's beliefs, and assumptions made by management. Forward-looking statements are not guarantees of future performance and involve certain risks and uncertainties, which are difficult to predict. AMERICAN CAMPUS COMMUNITIES