Attached files
| file | filename |
|---|---|
| 8-K - 8-K - STORE CAPITAL Corp | a15-9308_28k.htm |
| EX-99.2 - EX-99.2 - STORE CAPITAL Corp | a15-9308_2ex99d2.htm |
Exhibit 99.1
|
|
Morgan Stanley 2nd Annual Net Lease Summit April 17, 2015 The LEADER in Middle Market Real Estate Capital Solutions S T O R E capital |
|
|
This presentation may include forward-looking statements and include comments with respect to our objectives and strategies, and the results of our operations and our business. Forward-looking statements can be identified by the fact that they do not relate strictly to historical or current facts. They often include words such as “expects,” “assumes,” “anticipates,” “intends,” “plans,” “believes,” “seeks,” “estimates” or words of similar meaning, or future or conditional words such as “assuming,” “will,” “would,” “possible,” “proposed,” “projected,” “positioned,” “vision,” “opportunity,” “should,” “could,” “indicative,” “target” or “may.” FORWARD-LOOKING STATEMENTS INVOLVE NUMEROUS RISKS AND UNCERTAINTIES, AND YOU SHOULD NOT RELY ON THEM AS PREDICTIONS OF FUTURE EVENTS. FORWARD-LOOKING STATEMENTS DEPEND ON ASSUMPTIONS, DATA OR METHODS THAT MAY BE INCORRECT OR IMPRECISE, AND WE MAY NOT BE ABLE TO REALIZE THEM. WE DO NOT GUARANTEE THAT THE TRANSACTIONS AND EVENTS DESCRIBED WILL HAPPEN AS DESCRIBED (OR THAT THEY WILL HAPPEN AT ALL). THE FOLLOWING FACTORS, AMONG OTHERS, COULD CAUSE ACTUAL RESULTS AND FUTURE EVENTS TO DIFFER MATERIALLY FROM THOSE SET FORTH OR CONTEMPLATED IN THE FORWARD-LOOKING STATEMENTS: general business and economic conditions; continued volatility and uncertainty in the credit markets and broader financial markets, including potential fluctuations in the consumer price index, or CPI; other risks inherent in the real estate business, including tenant defaults, potential liability relating to environmental matters, illiquidity of real estate investments, and potential damages from natural disasters; availability of suitable properties to acquire and our ability to acquire and lease those properties on favorable terms; ability to renew leases, lease vacant space or re-lease space as existing leases expire or are terminated; the degree and nature of our competition; our failure to generate sufficient cash flows to service our outstanding indebtedness; access to debt and equity capital markets; fluctuating interest rates; availability of qualified personnel and our ability to retain our key management personnel; changes in, or the failure or inability to comply with, government regulation, including Maryland laws; failure to maintain our status as a REIT; and changes in the U.S. tax law and other U.S. laws, whether or not specific to REITs. This presentation contains references to our copyrights, trademarks and service marks and to those belonging to other entities. Solely for convenience, copyrights, trademarks, trade names and service marks referred to in this presentation may appear without the © or ® or TM or SM symbols, but such references are not intended to indicate, in any way, that we will not assert, to the fullest extent under applicable law, our rights or the rights of the applicable licensor to these copyrights, trademarks, trade names and service marks. We do not intend our use or display of other companies’ trade names, copyrights, trademarks or service marks to imply a relationship with, or endorsement or sponsorship of us by, any other companies. Disclaimer S T O R E capital |
|
|
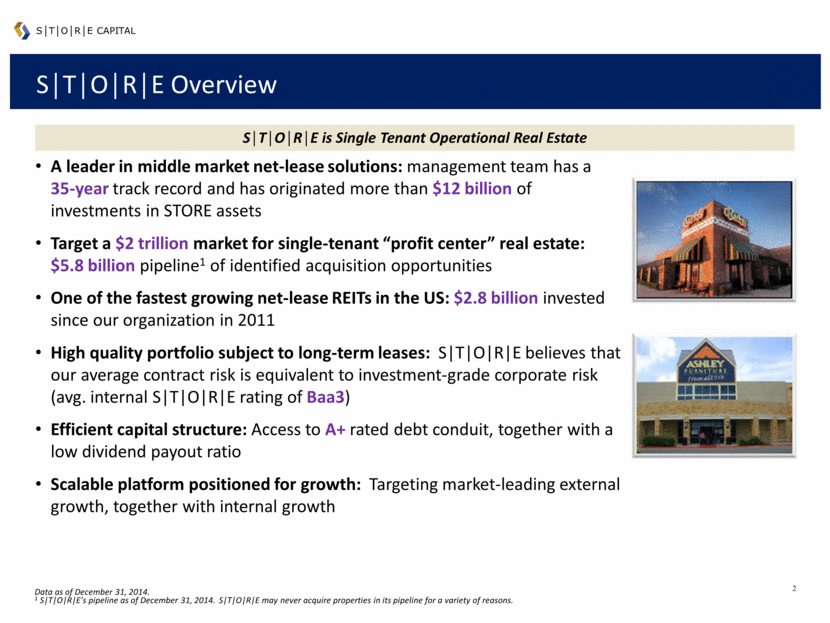
S T O R E Overview A leader in middle market net-lease solutions: management team has a 35-year track record and has originated more than $12 billion of investments in STORE assets Target a $2 trillion market for single-tenant “profit center” real estate: $5.8 billion pipeline1 of identified acquisition opportunities One of the fastest growing net-lease REITs in the US: $2.8 billion invested since our organization in 2011 High quality portfolio subject to long-term leases: S T O R E believes that our average contract risk is equivalent to investment-grade corporate risk (avg. internal S T O R E rating of Baa3) Efficient capital structure: Access to A+ rated debt conduit, together with a low dividend payout ratio Scalable platform positioned for growth: Targeting market-leading external growth, together with internal growth S T O R E is Single Tenant Operational Real Estate S T O R E capital Data as of December 31, 2014. 1 S T O R E’s pipeline as of December 31, 2014. S T O R E may never acquire properties in its pipeline for a variety of reasons. |
|
|
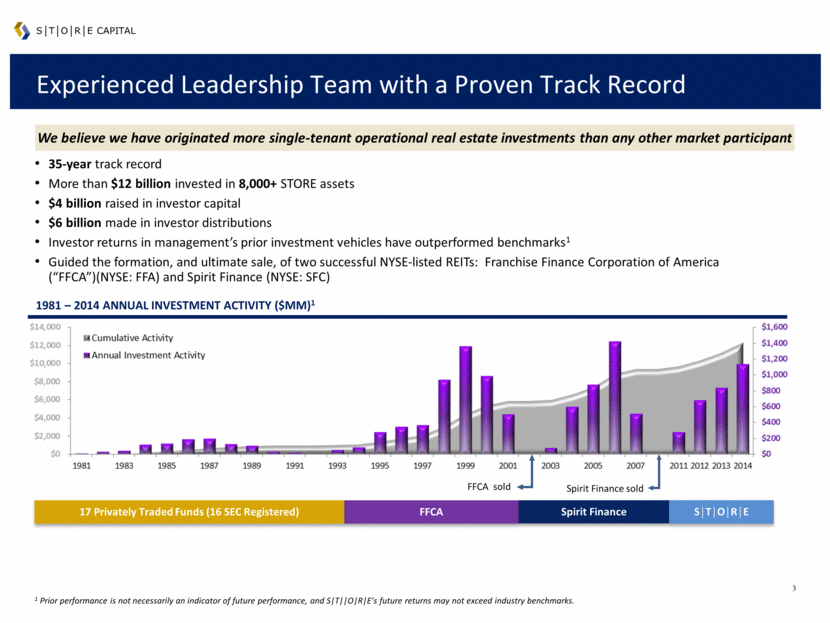
Experienced Leadership Team with a Proven Track Record 35-year track record More than $12 billion invested in 8,000+ STORE assets $4 billion raised in investor capital $6 billion made in investor distributions Investor returns in management’s prior investment vehicles have outperformed benchmarks1 Guided the formation, and ultimate sale, of two successful NYSE-listed REITs: Franchise Finance Corporation of America (“FFCA”)(NYSE: FFA) and Spirit Finance (NYSE: SFC) 1981 – 2014 annual investment activity ($MM)1 S T O R E capital We believe we have originated more single-tenant operational real estate investments than any other market participant FFCA Spirit Finance 17 Privately Traded Funds (16 SEC Registered) S T O R E Spirit Finance sold FFCA sold 1 Prior performance is not necessarily an indicator of future performance, and S T O R E’s future returns may not exceed industry benchmarks. |
|
|
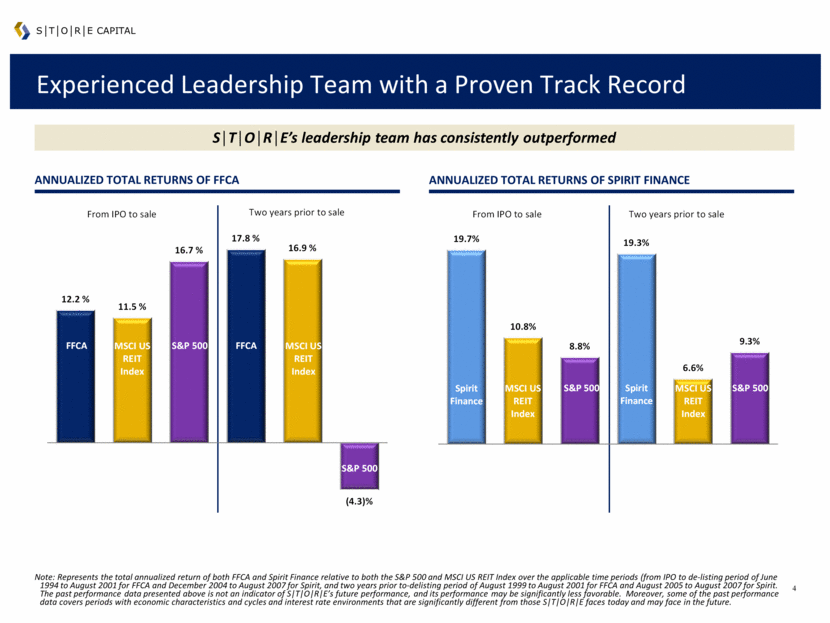
Experienced Leadership Team with a Proven Track Record ANNUALIZED TOTAL RETURNS OF SPIRIT FINANCE S T O R E’s leadership team has consistently outperformed ANNUALIZED TOTAL RETURNS OF FFCA S T O R E capital Note: Represents the total annualized return of both FFCA and Spirit Finance relative to both the S&P 500 and MSCI US REIT Index over the applicable time periods (from IPO to de-listing period of June 1994 to August 2001 for FFCA and December 2004 to August 2007 for Spirit, and two years prior to-delisting period of August 1999 to August 2001 for FFCA and August 2005 to August 2007 for Spirit. The past performance data presented above is not an indicator of S T O R E’s future performance, and its performance may be significantly less favorable. Moreover, some of the past performance data covers periods with economic characteristics and cycles and interest rate environments that are significantly different from those S T O R E faces today and may face in the future. 19.7% 10.8% 8.8% 19.3% 6.6% 9.3% Spirit MSCI US REIT Index S&P 500 Spirit MSCI US REIT Index S&P 500 Spirit Finance MSCI US REIT Index Spirit Finance S&P 500 MSCI US REIT Index S&P 500 Two years prior to sale From IPO to sale 12.2 % 11.5 % 16.7 % 17.8 % 16.9 % (4.3)% FFCA MSCI US REIT Index FFCA S&P 500 MSCI US REIT Index S&P 500 Two years prior to sale From IPO to sale |
|
|
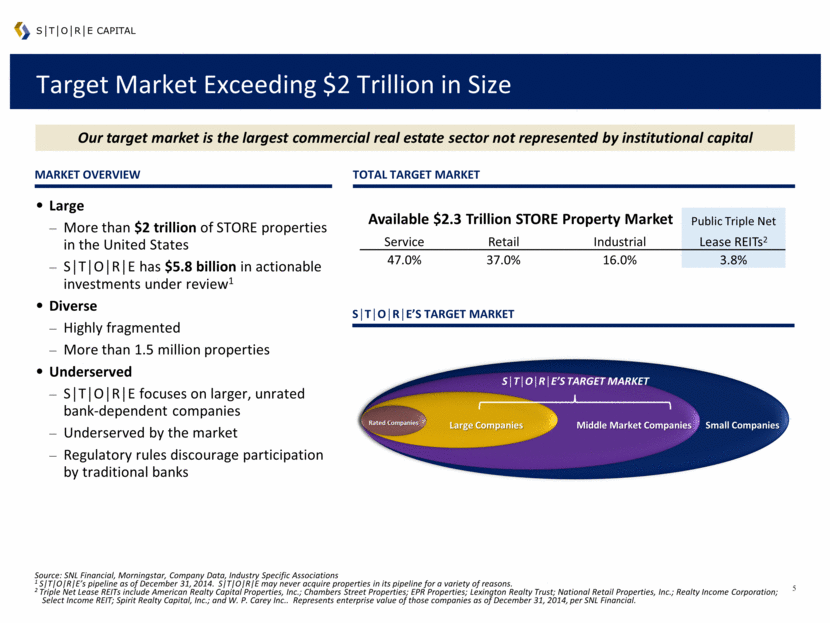
Target Market Exceeding $2 Trillion in Size Large More than $2 trillion of STORE properties in the United States S T O R E has $5.8 billion in actionable investments under review1 Diverse Highly fragmented More than 1.5 million properties Underserved S T O R E focuses on larger, unrated bank-dependent companies Underserved by the market Regulatory rules discourage participation by traditional banks Our target market is the largest commercial real estate sector not represented by institutional capital Source: SNL Financial, Morningstar, Company Data, Industry Specific Associations 1 S T O R E’s pipeline as of December 31, 2014. S T O R E may never acquire properties in its pipeline for a variety of reasons. 2 Triple Net Lease REITs include American Realty Capital Properties, Inc.; Chambers Street Properties; EPR Properties; Lexington Realty Trust; National Retail Properties, Inc.; Realty Income Corporation; Select Income REIT; Spirit Realty Capital, Inc.; and W. P. Carey Inc.. Represents enterprise value of those companies as of December 31, 2014, per SNL Financial. S T O RE capital Total Target Market Market Overview S T O R E’s Target Market Small Companies Middle Market Companies Large Companies Rated Companies S T O R E’s Target market Available $2.3 Trillion STORE Property Market Public Triple Net Service Retail Industrial Lease REITs2 47.0% 37.0% 16.0% 3.8% |
|
|
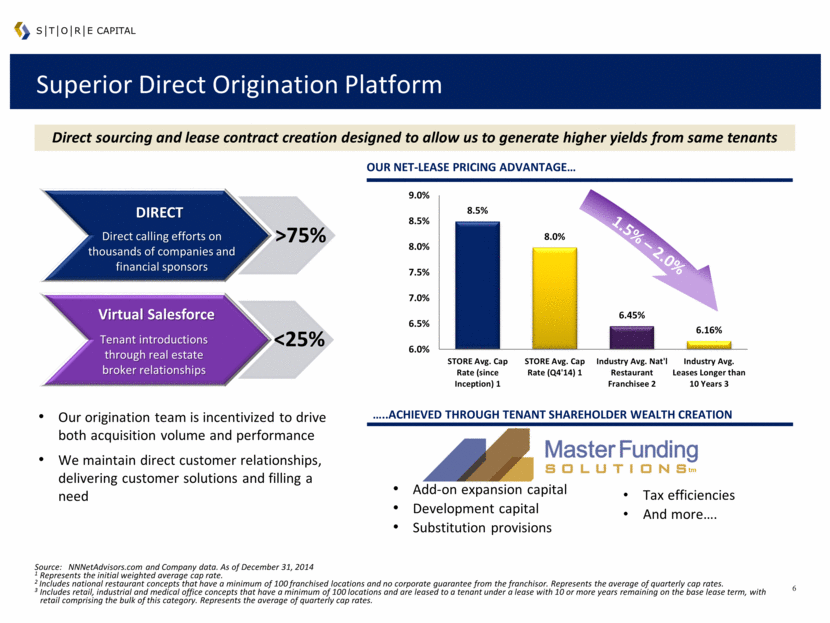
..Achieved through tenant shareholder wealth creation Add-on expansion capital Development capital Substitution provisions Tax efficiencies And more . tm Superior Direct Origination Platform Our origination team is incentivized to drive both acquisition volume and performance We maintain direct customer relationships, delivering customer solutions and filling a need Direct sourcing and lease contract creation designed to allow us to generate higher yields from same tenants Source: NNNetAdvisors.com and Company data. As of December 31, 2014 1 Represents the initial weighted average cap rate. 2 Includes national restaurant concepts that have a minimum of 100 franchised locations and no corporate guarantee from the franchisor. Represents the average of quarterly cap rates. 3 Includes retail, industrial and medical office concepts that have a minimum of 100 locations and are leased to a tenant under a lease with 10 or more years remaining on the base lease term, with retail comprising the bulk of this category. Represents the average of quarterly cap rates. S T O R E capital Direct calling efforts on thousands of companies and financial sponsors DIRECT Tenant introductions through real estate broker relationships Virtual Salesforce >75% <25% 1.5% – 2.0% OUR NET-LEASE PRICING ADVANTAGE 8.5% 8.0% 6.45% 6.16% 6.0% 6.5% 7.0% 7.5% 8.0% 8.5% 9.0% STORE Avg. Cap Rate (since Inception) 1 STORE Avg. Cap Rate (Q4'14) 1 Industry Avg. Nat'l Restaurant Franchisee 2 Industry Avg. Leases Longer than 10 Years 3 |
|
|
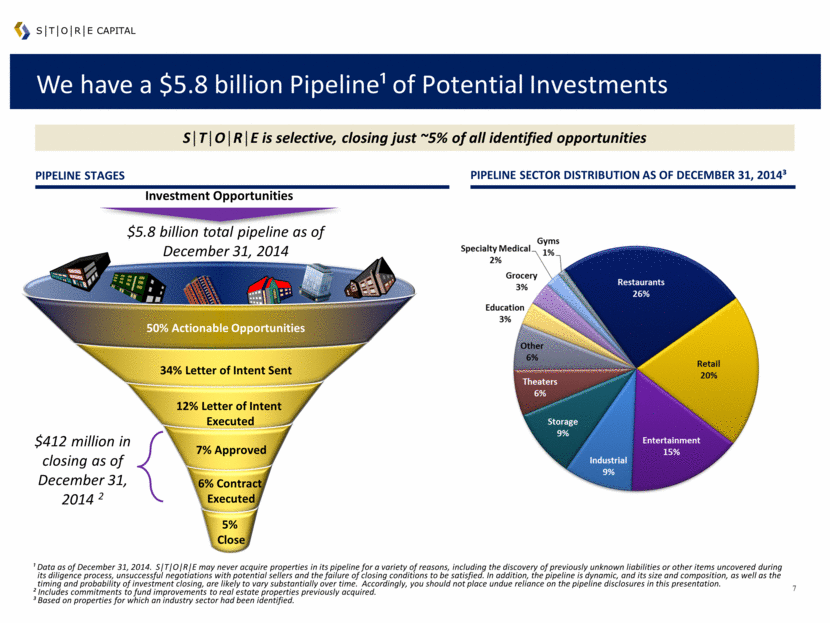
We have a $5.8 billion Pipeline¹ of Potential Investments ¹ Data as of December 31, 2014. S T O R E may never acquire properties in its pipeline for a variety of reasons, including the discovery of previously unknown liabilities or other items uncovered during its diligence process, unsuccessful negotiations with potential sellers and the failure of closing conditions to be satisfied. In addition, the pipeline is dynamic, and its size and composition, as well as the timing and probability of investment closing, are likely to vary substantially over time. Accordingly, you should not place undue reliance on the pipeline disclosures in this presentation. ² Includes commitments to fund improvements to real estate properties previously acquired. ³ Based on properties for which an industry sector had been identified. PIPeline Stages S T O R E capital S T O R E is selective, closing just ~5% of all identified opportunities Pipeline Sector Distribution as of December 31, 2014³ Investment Opportunities 34% Letter of Intent Sent 12% Letter of Intent Executed 7% Approved 6% Contract Executed 5% Close 50% Actionable Opportunities $5.8 billion total pipeline as of December 31, 2014 $412 million in closing as of December 31, 2014 2 |
|
|
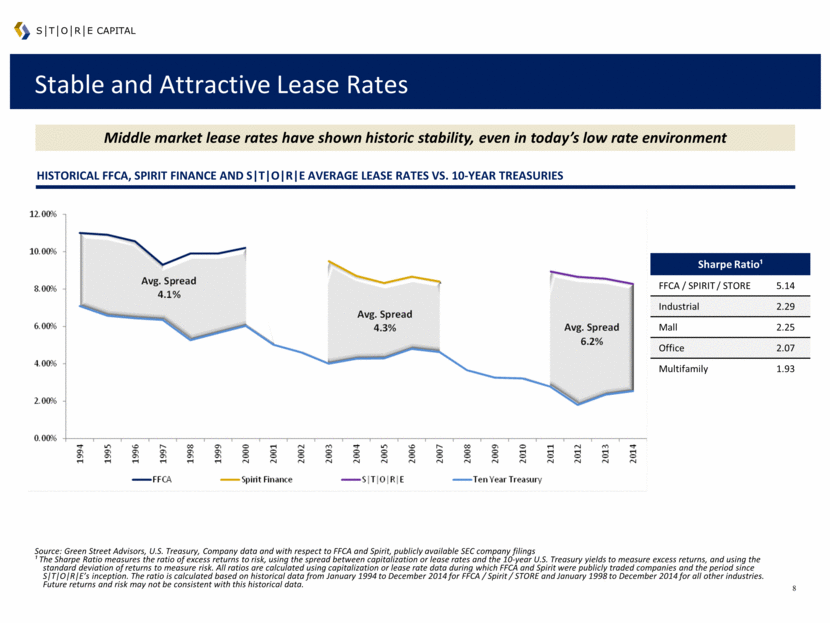
Stable and Attractive Lease Rates Middle market lease rates have shown historic stability, even in today’s low rate environment Historical FFCA, Spirit FINANCE and S T O R E average Lease Rates vs. 10-Year Treasuries Source: Green Street Advisors, U.S. Treasury, Company data and with respect to FFCA and Spirit, publicly available SEC company filings ¹ The Sharpe Ratio measures the ratio of excess returns to risk, using the spread between capitalization or lease rates and the 10-year U.S. Treasury yields to measure excess returns, and using the standard deviation of returns to measure risk. All ratios are calculated using capitalization or lease rate data during which FFCA and Spirit were publicly traded companies and the period since S T O R E’s inception. The ratio is calculated based on historical data from January 1994 to December 2014 for FFCA / Spirit / STORE and January 1998 to December 2014 for all other industries. Future returns and risk may not be consistent with this historical data. S T O R E capital Sharpe Ratio¹ FFCA / SPIRIT / STORE 5.14 Industrial 2.29 Mall 2.25 Office 2.07 Multifamily 1.93 |
|
|
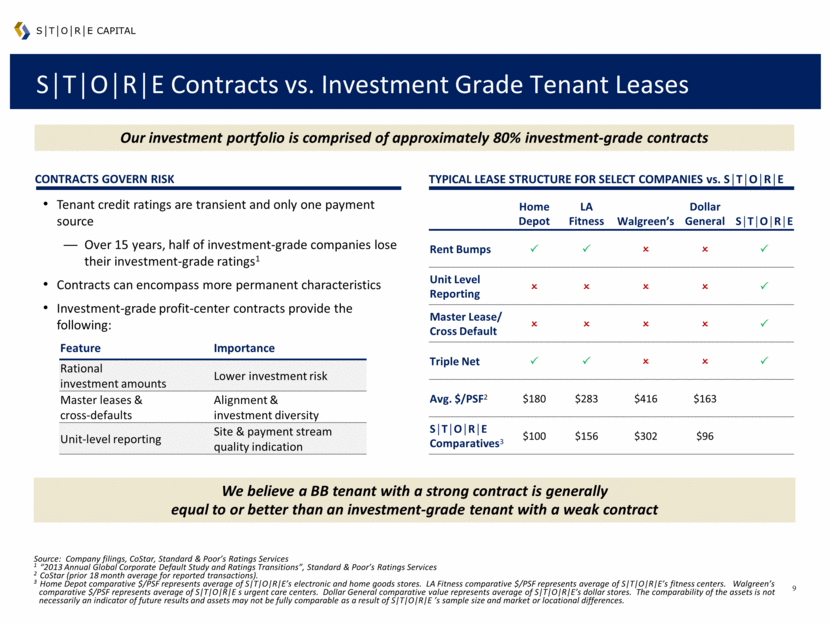
S T O R E Contracts vs. Investment Grade Tenant Leases S T O R E CAPITAL TYPICAL LEASE STRUCTURE FOR SELECT COMPANIES vs. S T O R E Tenant credit ratings are transient and only one payment source Over 15 years, half of investment-grade companies lose their investment-grade ratings1 Contracts can encompass more permanent characteristics Investment-grade profit-center contracts provide the following: Contracts govern risk Source: Company filings, CoStar, Standard & Poor’s Ratings Services 1 “2013 Annual Global Corporate Default Study and Ratings Transitions”, Standard & Poor’s Ratings Services 2 CoStar (prior 18 month average for reported transactions). 3 Home Depot comparative $/PSF represents average of S T O R E’s electronic and home goods stores. LA Fitness comparative $/PSF represents average of S T O R E’s fitness centers. Walgreen’s comparative $/PSF represents average of S T O R E s urgent care centers. Dollar General comparative value represents average of S T O R E’s dollar stores. The comparability of the assets is not necessarily an indicator of future results and assets may not be fully comparable as a result of S T O R E ’s sample size and market or locational differences. Our investment portfolio is comprised of approximately 80% investment-grade contracts We believe a BB tenant with a strong contract is generally equal to or better than an investment-grade tenant with a weak contract Feature Importance Rational investment amounts Lower investment risk Master leases & cross-defaults Alignment & investment diversity Unit-level reporting Site & payment stream quality indication Home Depot LA Fitness Walgreen’s Dollar General S T O R E Rent Bumps Unit Level Reporting Master Lease/ Cross Default Triple Net Avg. $/PSF2 $180 $283 $416 $163 S T O R E Comparatives3 $100 $156 $302 $96 |
|
|
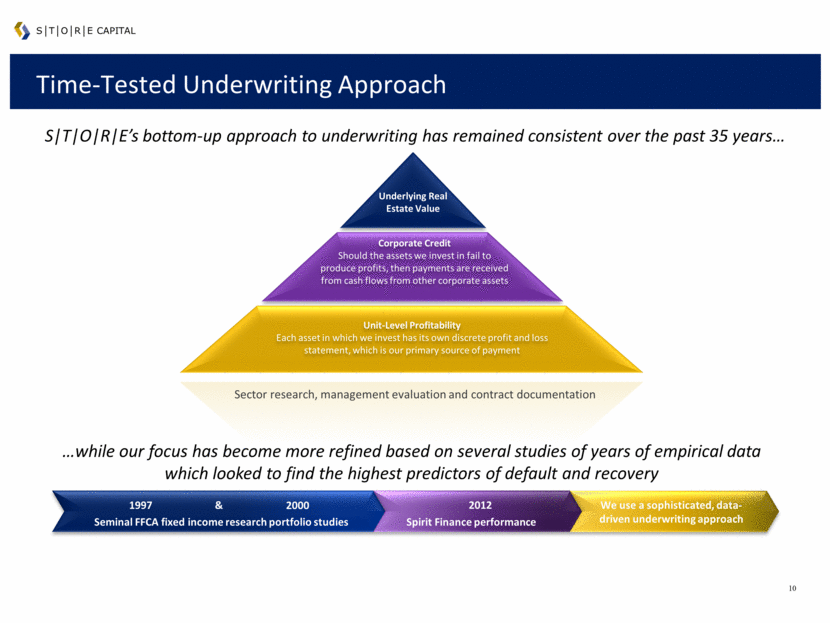
Time-Tested Underwriting Approach S T O R E’s bottom-up approach to underwriting has remained consistent over the past 35 years Unit-Level Profitability Each asset in which we invest has its own discrete profit and loss statement, which is our primary source of payment Corporate Credit Should the assets we invest in fail to produce profits, then payments are received from cash flows from other corporate assets Underlying Real Estate Value S T O R E capital while our focus has become more refined based on several studies of years of empirical data which looked to find the highest predictors of default and recovery Property Sale or Re-let 2000 2012 We use a sophisticated, data-driven underwriting approach Seminal FFCA fixed income research portfolio studies 1997 & Spirit Finance performance Sector research, management evaluation and contract documentation |
|
|
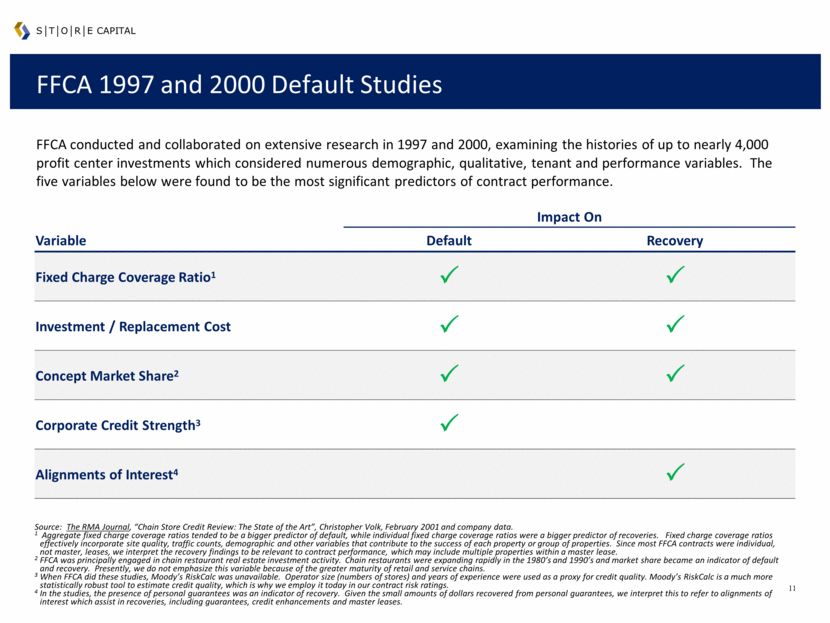
FFCA 1997 and 2000 Default Studies S T O R E CAPITAL FFCA conducted and collaborated on extensive research in 1997 and 2000, examining the histories of up to nearly 4,000 profit center investments which considered numerous demographic, qualitative, tenant and performance variables. The five variables below were found to be the most significant predictors of contract performance. Source: The RMA Journal, “Chain Store Credit Review: The State of the Art”, Christopher Volk, February 2001 and company data. 1 Aggregate fixed charge coverage ratios tended to be a bigger predictor of default, while individual fixed charge coverage ratios were a bigger predictor of recoveries. Fixed charge coverage ratios effectively incorporate site quality, traffic counts, demographic and other variables that contribute to the success of each property or group of properties. Since most FFCA contracts were individual, not master, leases, we interpret the recovery findings to be relevant to contract performance, which may include multiple properties within a master lease. 2 FFCA was principally engaged in chain restaurant real estate investment activity. Chain restaurants were expanding rapidly in the 1980’s and 1990’s and market share became an indicator of default and recovery. Presently, we do not emphasize this variable because of the greater maturity of retail and service chains. 3 When FFCA did these studies, Moody’s RiskCalc was unavailable. Operator size (numbers of stores) and years of experience were used as a proxy for credit quality. Moody’s RiskCalc is a much more statistically robust tool to estimate credit quality, which is why we employ it today in our contract risk ratings. 4 In the studies, the presence of personal guarantees was an indicator of recovery. Given the small amounts of dollars recovered from personal guarantees, we interpret this to refer to alignments of interest which assist in recoveries, including guarantees, credit enhancements and master leases. Impact On Variable Default Recovery Fixed Charge Coverage Ratio1 Investment / Replacement Cost Concept Market Share2 Corporate Credit Strength3 Alignments of Interest4 |
|
|
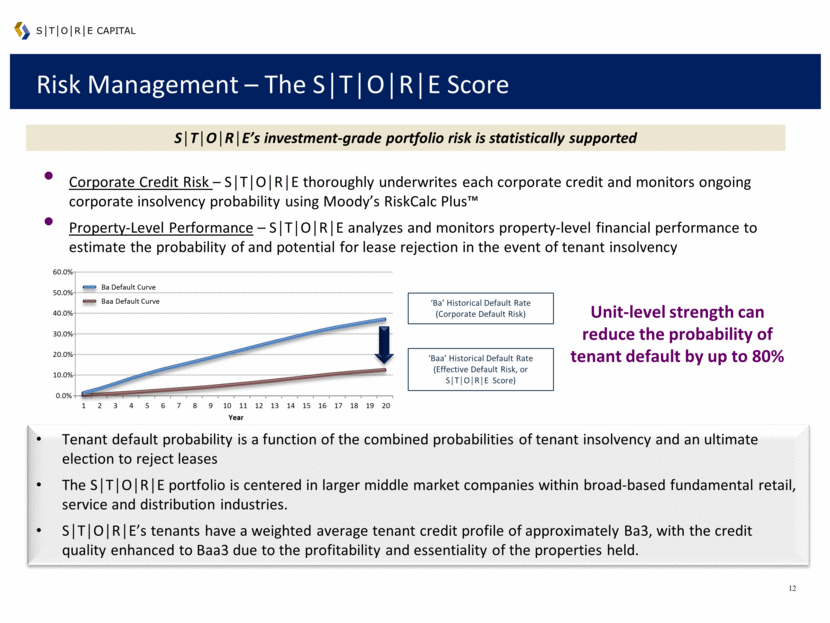
Risk Management – The S T O R E Score S T O R E capital Corporate Credit Risk – S T O R E thoroughly underwrites each corporate credit and monitors ongoing corporate insolvency probability using Moody’s RiskCalc Plus™ Property-Level Performance – S T O R E analyzes and monitors property-level financial performance to estimate the probability of and potential for lease rejection in the event of tenant insolvency ‘Ba’ Historical Default Rate (Corporate Default Risk) ‘Baa’ Historical Default Rate (Effective Default Risk, or S T O R E Score) Assumptions: (1) Based on Moody's "Corporate Default and Recovery Rates, 1920-2010: Average Cumulative Issuer-Weighted Global Default Rates, 1970-2010 (Exhibit 34)" (2) Average cumulative default rate multiplied by the 25% probability of termination in the event of a default. Unit-level strength can reduce the probability of tenant default by up to 80% 0.0% 10.0% 20.0% 30.0% 40.0% 50.0% 60.0% 1 2 3 4 5 6 7 8 9 10 11 12 13 14 15 16 17 18 19 20 Year Ba Default Curve Baa Default Curve Tenant default probability is a function of the combined probabilities of tenant insolvency and an ultimate election to reject leases The S T O R E portfolio is centered in larger middle market companies within broad-based fundamental retail, service and distribution industries. S T O R E’s tenants have a weighted average tenant credit profile of approximately Ba3, with the credit quality enhanced to Baa3 due to the profitability and essentiality of the properties held. S T O R E’s investment-grade portfolio risk is statistically supported |
|
|
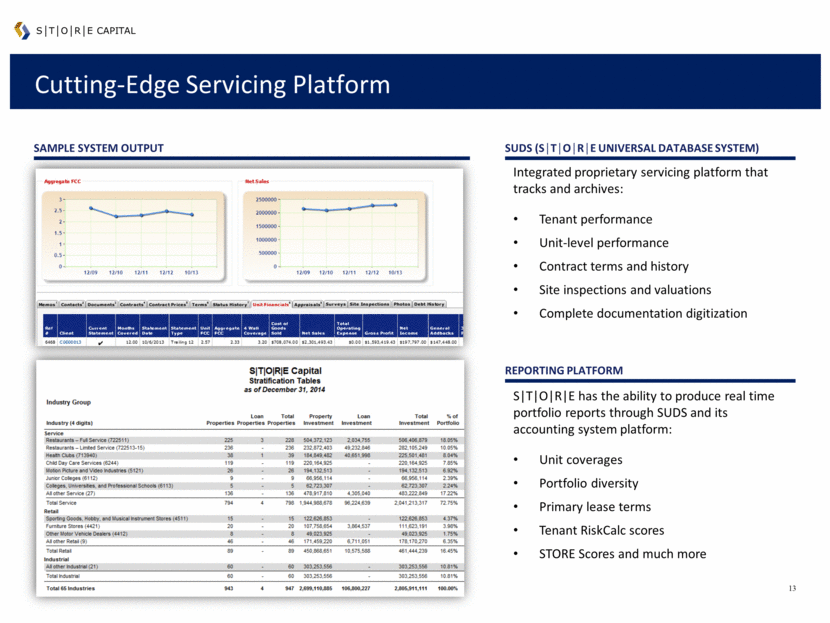
Cutting-Edge Servicing Platform SUDS (S T O R E UNIVERSAL DATABASE SYSTEM) Integrated proprietary servicing platform that tracks and archives: Tenant performance Unit-level performance Contract terms and history Site inspections and valuations Complete documentation digitization Reporting platform S T O R E has the ability to produce real time portfolio reports through SUDS and its accounting system platform: Unit coverages Portfolio diversity Primary lease terms Tenant RiskCalc scores STORE Scores and much more S T O R E capital SAMPLE SYSTEM OUTPUT |
|
|
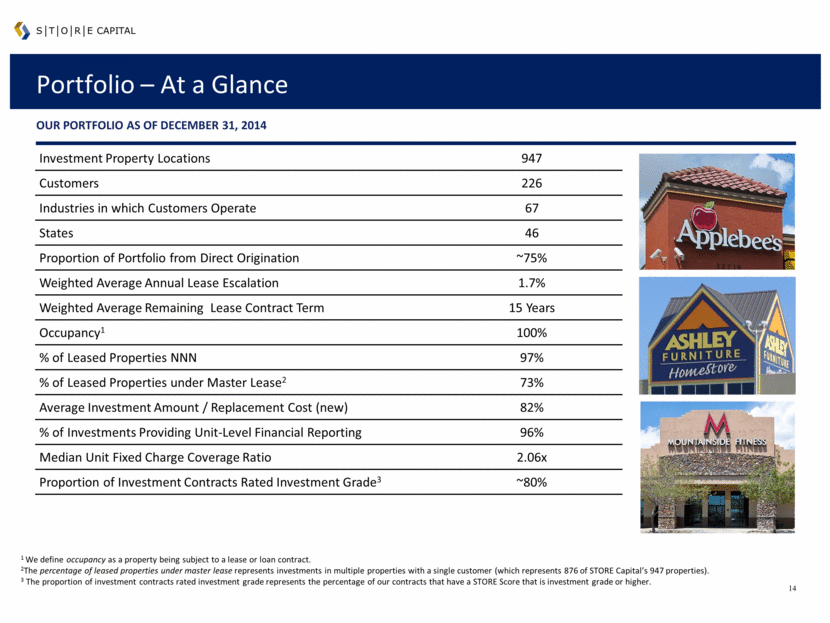
Portfolio – At a Glance OUR PORTFOLIO as of DECEMBER 31, 2014 Investment Property Locations 947 Customers 226 Industries in which Customers Operate 67 States 46 Proportion of Portfolio from Direct Origination ~75% Weighted Average Annual Lease Escalation 1.7% Weighted Average Remaining Lease Contract Term 15 Years Occupancy1 100% % of Leased Properties NNN 97% % of Leased Properties under Master Lease2 73% Average Investment Amount / Replacement Cost (new) 82% % of Investments Providing Unit-Level Financial Reporting 96% Median Unit Fixed Charge Coverage Ratio 2.06x Proportion of Investment Contracts Rated Investment Grade3 ~80% 1 We define occupancy as a property being subject to a lease or loan contract. 2The percentage of leased properties under master lease represents investments in multiple properties with a single customer (which represents 876 of STORE Capital’s 947 properties). 3 The proportion of investment contracts rated investment grade represents the percentage of our contracts that have a STORE Score that is investment grade or higher. S T O R E capital |
|
|
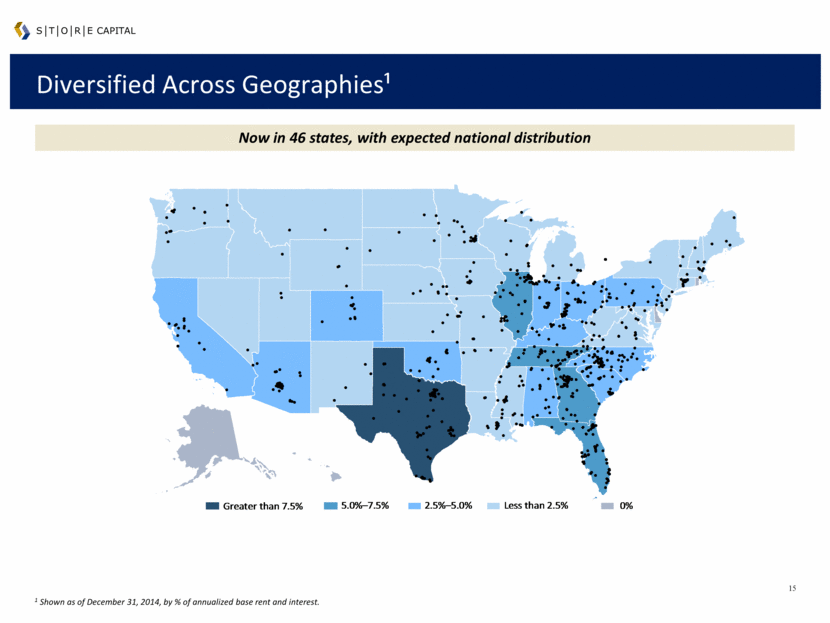
Diversified Across Geographies¹ Now in 46 states, with expected national distribution S T O R E capital 1 Shown as of December 31, 2014, by % of annualized base rent and interest. G r e at e r t h a n 7.5% 5.0% – 7.5% 2.5% – 5.0% L e ss t h a n 2.5% 0% — — — — — — — — — — — — — — — — — — — — — — — — — — — — — — — — — — — — — — — — — — — — — — — — — — — — — — — — — — — — — — — — — — — — — — — — — — — — — — — — — — — — — — — — — — — — — — — — — — — — — — — — — — — — — — — — — — — — — — — — — — — — — — — — — — — — — — — — — — — — — — — — — — — — — — — — — — — — — — — — — — — — — — — — — — — — — — — — — — — — — — — — — — — — — — — — — — — — — — — — — — — — — — — — — — — — — — — — — — — — — — — — — — — — — — — — — — — — — — — — — — — — — — — — — — — — — — — — — — — — — — — — — — — — — — — — — — — — — — — — — — — — — — — — — — — — — — — — — — — — — — — — — — — — — — — — — — — — — — — — — — — — — — — — — — — — — — — — — — — — — — — — — — — — — — — — — — — — — — — — — — — — — — — — — — — — — — — — — — — — — — — — — — — — — — — — — — — — — — — — — — — — — — — — — — — — — — — — — — — — — — — — — — — — — — — — — — — — — — — — — — — — — — — — — — — — — — — — — — — — — — — — — — — — — — — — — — — — — — — — — — — — — — — — — — — — — — — — — — — — — — — — — — — — — — — — — — — — — — — — — — — — — — — — — — — — — — — — — — — — — — — — — — — — — — — — — — — — — — — — — — — — — — — — — — — — — — — — — — — — — — — — — — — — — — — — — — — — — — — — — — — — — — — — — — — — — — — — — — — — — — — — — — — — — — — — — — — — — — — — — — — — — — — — — — — — — — — — — — — — — — — — — — — — — — — — — — — — — — — — — — — — — — — — — — — — — — — — — — — — — — — — — — — — — — — — — — — — — — — — — — — — — — — — — — — — — — — — — — — — — — — — — — — — — — — — — — — — — — — — — — — — — — — — — — — — — — — — — — — — — — — — — — — — — — — — — — — — — — — — — — — — — — — — — — — — — — — — — — — — — — — — — — — — — — — — — — — — — — — — — — — — — — — — — — |
|
|
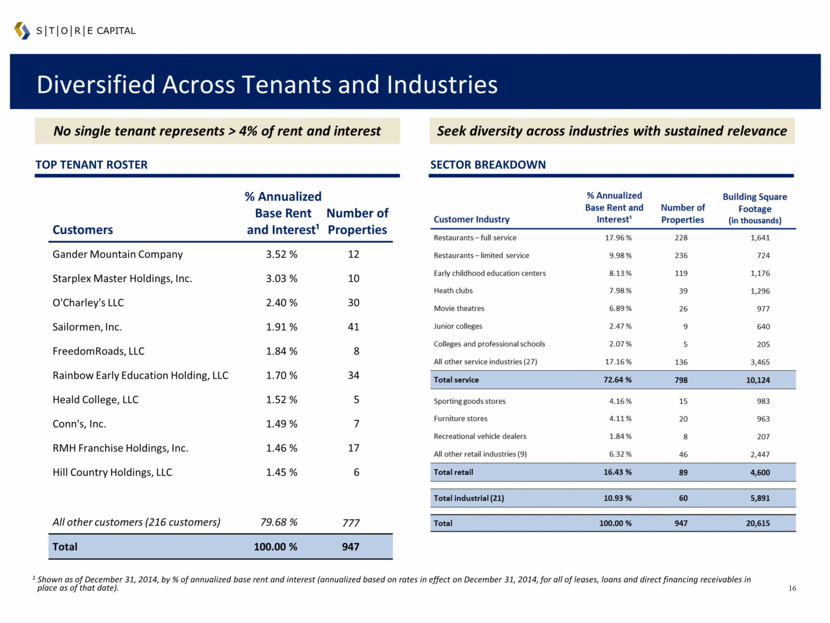
Diversified Across Tenants and Industries No single tenant represents > 4% of rent and interest TOP TENANT ROSTER Sector breakdown Seek diversity across industries with sustained relevance S T O R E capital Customers % Annualized Base Rent and Interest¹ Number of Properties Gander Mountain Company 3.52 % 12 Starplex Master Holdings, Inc. 3.03 % 10 O'Charley's LLC 2.40 % 30 Sailormen, Inc. 1.91 % 41 FreedomRoads, LLC 1.84 % 8 Rainbow Early Education Holding, LLC 1.70 % 34 Heald College, LLC 1.52 % 5 Conn's, Inc. 1.49 % 7 RMH Franchise Holdings, Inc. 1.46 % 17 Hill Country Holdings, LLC 1.45 % 6 All other customers (216 customers) 79.68 % 777 Total 100.00 % 947 1 Shown as of December 31, 2014, by % of annualized base rent and interest (annualized based on rates in effect on December 31, 2014, for all of leases, loans and direct financing receivables in place as of that date). |
|
|
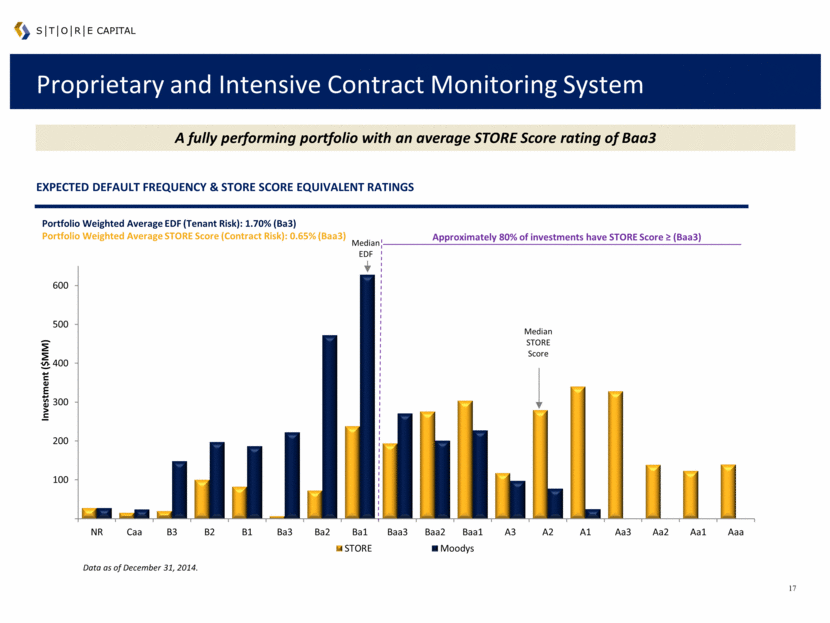
Proprietary and Intensive Contract Monitoring System A fully performing portfolio with an average STORE Score rating of Baa3 S T O RE capital Data as of December 31, 2014. Expected default frequency & STORE score equivalent Ratings 100 200 300 400 500 600 NR Caa B3 B2 B1 Ba3 Ba2 Ba1 Baa3 Baa2 Baa1 A3 A2 A1 Aa3 Aa2 Aa1 Aaa Investment ($MM) STORE Moodys Portfolio Weighted Average EDF (Tenant Risk): 1.70% (Ba3) Portfolio Weighted Average STORE Score (Contract Risk ): 0.65% (Baa3) Approximately 80% of investments have STORE Score ? (Baa3) Median STORE Score Median EDF |
|
|
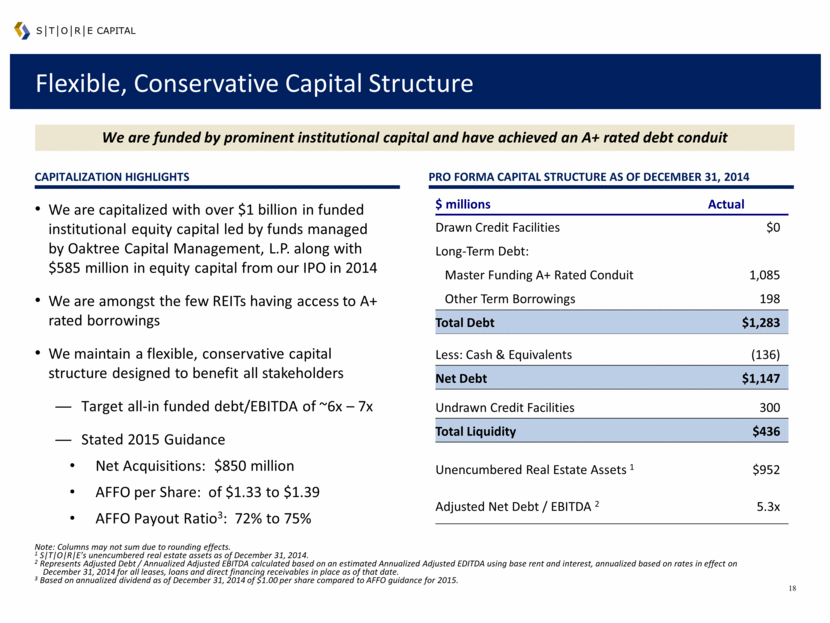
Flexible, Conservative Capital Structure CAPITALIZATION HIGHLIGHTS PRO FORMA CAPITAL STRUCTURE as of DEcember 31, 2014 S T O R E capital We are funded by prominent institutional capital and have achieved an A+ rated debt conduit We are capitalized with over $1 billion in funded institutional equity capital led by funds managed by Oaktree Capital Management, L.P. along with $585 million in equity capital from our IPO in 2014 We are amongst the few REITs having access to A+ rated borrowings We maintain a flexible, conservative capital structure designed to benefit all stakeholders Target all-in funded debt/EBITDA of ~6x – 7x Stated 2015 Guidance Net Acquisitions: $850 million AFFO per Share: of $1.33 to $1.39 AFFO Payout Ratio3: 72% to 75% Note: Columns may not sum due to rounding effects. 1 S T O R E’s unencumbered real estate assets as of December 31, 2014. 2 Represents Adjusted Debt / Annualized Adjusted EBITDA calculated based on an estimated Annualized Adjusted EDITDA using base rent and interest, annualized based on rates in effect on December 31, 2014 for all leases, loans and direct financing receivables in place as of that date. 3 Based on annualized dividend as of December 31, 2014 of $1.00 per share compared to AFFO guidance for 2015. $ millions Actual Drawn Credit Facilities $0 Long-Term Debt: Master Funding A+ Rated Conduit 1,085 Other Term Borrowings 198 Total Debt $1,283 Less: Cash & Equivalents (136) Net Debt $1,147 Undrawn Credit Facilities 300 Total Liquidity $436 Unencumbered Real Estate Assets 1 $952 Adjusted Net Debt / EBITDA 2 5.3x |
|
|
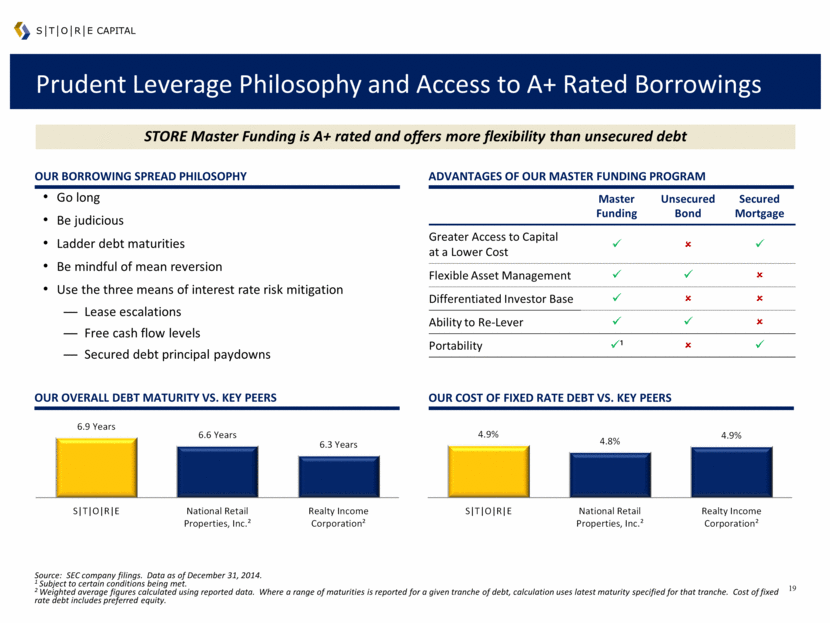
Master Funding Unsecured Bond Secured Mortgage Greater Access to Capital at a Lower Cost ü û ü Flexible Asset Management ü ü û Differentiated Investor Base ü û û Ability to Re-Lever ü ü û Portability ü¹ û ü Prudent Leverage Philosophy and Access to A+ Rated Borrowings Source: SEC company filings. Data as of December 31, 2014. 1 Subject to certain conditions being met. 2 Weighted average figures calculated using reported data. Where a range of maturities is reported for a given tranche of debt, calculation uses latest maturity specified for that tranche. Cost of fixed rate debt includes preferred equity. Go long Be judicious Ladder debt maturities Be mindful of mean reversion Use the three means of interest rate risk mitigation Lease escalations Free cash flow levels Secured debt principal paydowns STORE Master Funding is A+ rated and offers more flexibility than unsecured debt Our Cost of Fixed rate Debt vs. KEY Peers Our Borrowing Spread Philosophy Advantages of Our Master Funding Program S T O R E capital Our Overall Debt MATURITY vs. KEY Peers 6.9 Years 6.6 Years 6.3 Years S T O R E National Retail Properties, Inc.² Realty Income Corporation² 4.9% 4.8% 4.9% S T O R E National Retail Properties, Inc.² Realty Income Corporation² |
|
|
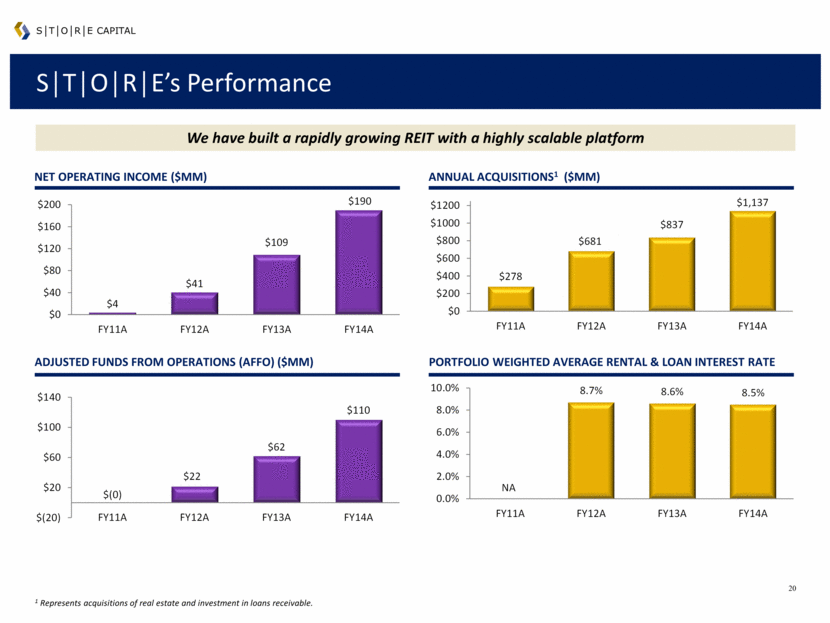
S T O R E’s Performance ADJUSTED Funds From Operations (AFFO) ($MM) Portfolio weighted average Rental & Loan Interest rate Net Operating Income ($MM) ANNUAL ACQUISITIONS1 ($MM) We have built a rapidly growing REIT with a highly scalable platform S T O R E capital 1 Represents acquisitions of real estate and investment in loans receivable. $4 $41 $109 $190 $0 $40 $80 $120 $160 $200 FY11A FY12A FY13A FY14A $(0) $22 $62 $110 $(20) $20 $60 $100 $140 FY11A FY12A FY13A FY14A 8.7% 8.6% 8.5% 0.0% 2.0% 4.0% 6.0% 8.0% 10.0% FY11A FY12A FY13A FY14A NA $278 $681 $837 $1,137 $0 $200 $400 $600 $800 $1000 $1200 FY11A FY12A FY13A FY14A |
|
|
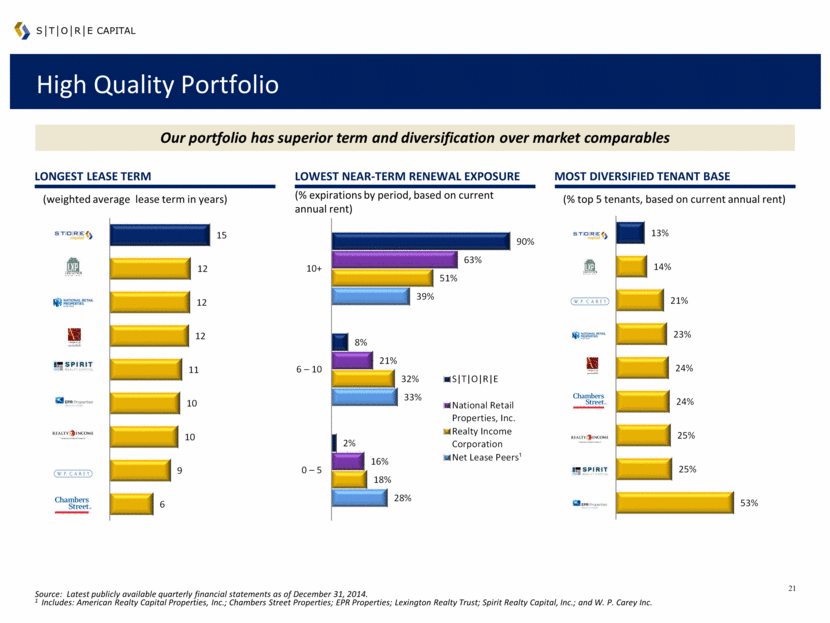
High Quality Portfolio Most Diversified Tenant Base Source: Latest publicly available quarterly financial statements as of December 31, 2014. 1 Includes: American Realty Capital Properties, Inc.; Chambers Street Properties; EPR Properties; Lexington Realty Trust; Spirit Realty Capital, Inc.; and W. P. Carey Inc. Our portfolio has superior term and diversification over market comparables S T O R E capital (weighted average lease term in years) Longest Lease Term Lowest Near-Term Renewal Exposure (% top 5 tenants, based on current annual rent) (% expirations by period, based on current annual rent) 6 9 10 10 11 12 12 12 15 CSG WPC O EPR SRC ARCP NNN LXP STORE 53% 25% 25% 24% 24% 23% 21% 14% 13% EPR SRC O CSG ARCP NNN WPC LXP STORE 28% 33% 39% 18% 32% 51% 16% 21% 63% 2% 8% 90% 0 – 5 6 – 10 10+ S T O R E National Retail Properties, Inc. Realty Income Corporation Net Lease Peers¹ |
|
|
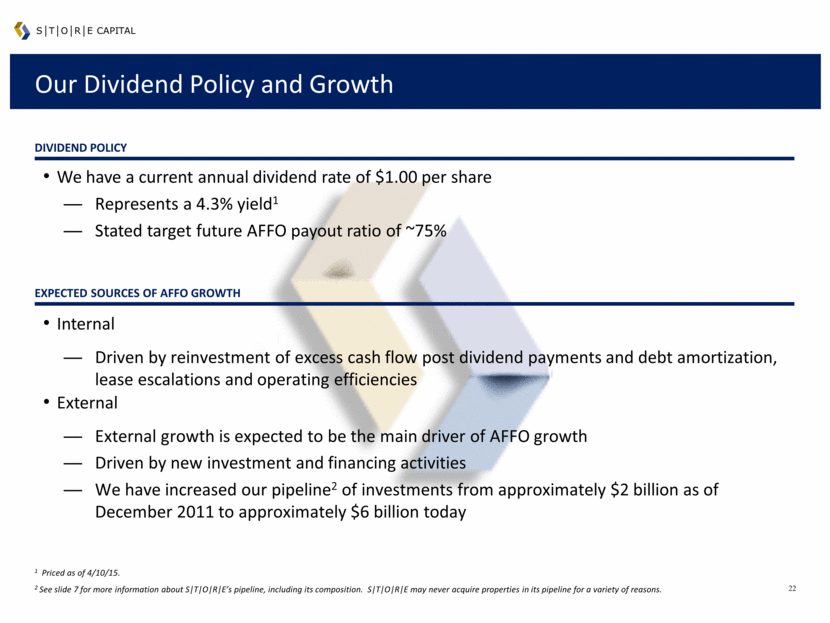
Our Dividend Policy and Growth Dividend policy S T O R E capital We have a current annual dividend rate of $1.00 per share Represents a 4.3% yield1 Stated target future AFFO payout ratio of ~75% Expected sources of AFFO Growth Internal Driven by reinvestment of excess cash flow post dividend payments and debt amortization, lease escalations and operating efficiencies External External growth is expected to be the main driver of AFFO growth Driven by new investment and financing activities We have increased our pipeline2 of investments from approximately $2 billion as of December 2011 to approximately $6 billion today 1 Priced as of 4/10/15. 2 See slide 7 for more information about S T O R E’s pipeline, including its composition. S T O R E may never acquire properties in its pipeline for a variety of reasons. |
|
|
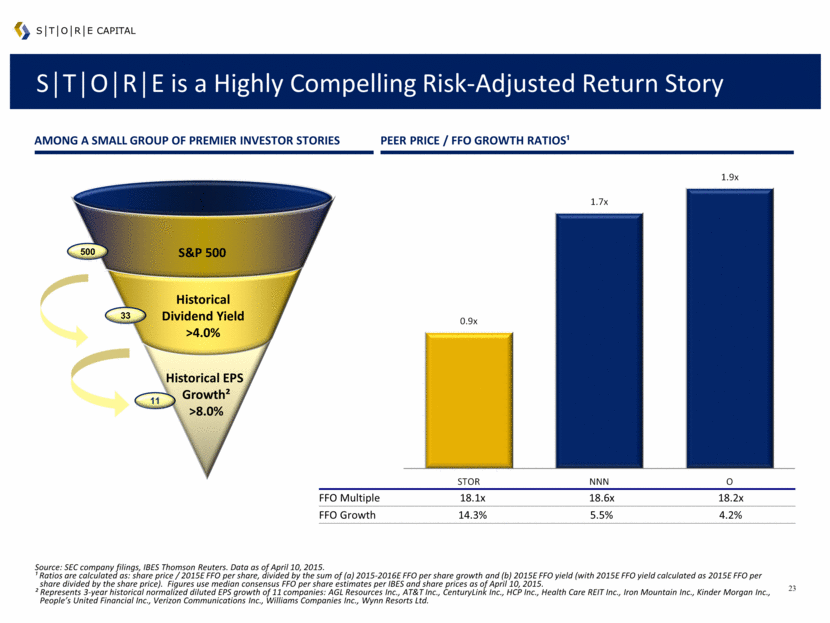
FFO Multiple 18.1x 18.6x 18.2x FFO Growth 14.3% 5.5% 4.2% Historical EPS Growth² >8.0% 11 33 Historical Dividend Yield >4.0% S T O R E is a Highly Compelling Risk-Adjusted Return Story S T O R E capital Source: SEC company filings, IBES Thomson Reuters. Data as of April 10, 2015. ¹ Ratios are calculated as: share price / 2015E FFO per share, divided by the sum of (a) 2015-2016E FFO per share growth and (b) 2015E FFO yield (with 2015E FFO yield calculated as 2015E FFO per share divided by the share price). Figures use median consensus FFO per share estimates per IBES and share prices as of April 10, 2015. ² Represents 3-year historical normalized diluted EPS growth of 11 companies: AGL Resources Inc., AT&T Inc., CenturyLink Inc., HCP Inc., Health Care REIT Inc., Iron Mountain Inc., Kinder Morgan Inc., People’s United Financial Inc., Verizon Communications Inc., Williams Companies Inc., Wynn Resorts Ltd. S&P 500 500 Among a Small Group of PREMIER Investor Stories PEER PRICE / FFO Growth RatioS¹ 0.9x 1.7x 1.9x STOR NNN O |
|
|
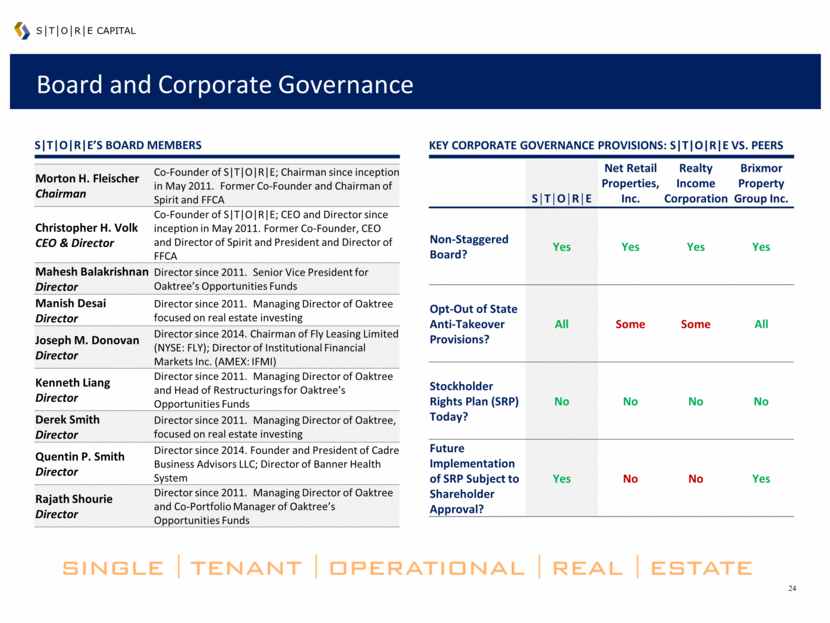
Board and Corporate Governance S T O R E capital Key corporate governance provisions: S T O R E vs. peers S T O R E’s board members Morton H. Fleischer Chairman Co-Founder of S T O R E; Chairman since inception in May 2011. Former Co-Founder and Chairman of Spirit and FFCA Christopher H. Volk CEO & Director Co-Founder of S T O R E; CEO and Director since inception in May 2011. Former Co-Founder, CEO and Director of Spirit and President and Director of FFCA Mahesh Balakrishnan Director Director since 2011. Senior Vice President for Oaktree’s Opportunities Funds Manish Desai Director Director since 2011. Managing Director of Oaktree focused on real estate investing Joseph M. Donovan Director Director since 2014. Chairman of Fly Leasing Limited (NYSE: FLY); Director of Institutional Financial Markets Inc. (AMEX: IFMI) Kenneth Liang Director Director since 2011. Managing Director of Oaktree and Head of Restructurings for Oaktree’s Opportunities Funds Derek Smith Director Director since 2011. Managing Director of Oaktree, focused on real estate investing Quentin P. Smith Director Director since 2014. Founder and President of Cadre Business Advisors LLC; Director of Banner Health System Rajath Shourie Director Director since 2011. Managing Director of Oaktree and Co-Portfolio Manager of Oaktree’s Opportunities Funds S T O R E Net Retail Properties, Inc. Realty Income Corporation Brixmor Property Group Inc. Non-Staggered Board? Yes Yes Yes Yes Opt-Out of State Anti-Takeover Provisions? All Some Some All Stockholder Rights Plan (SRP) Today? No No No No Future Implementation of SRP Subject to Shareholder Approval? Yes No No Yes |
|
|
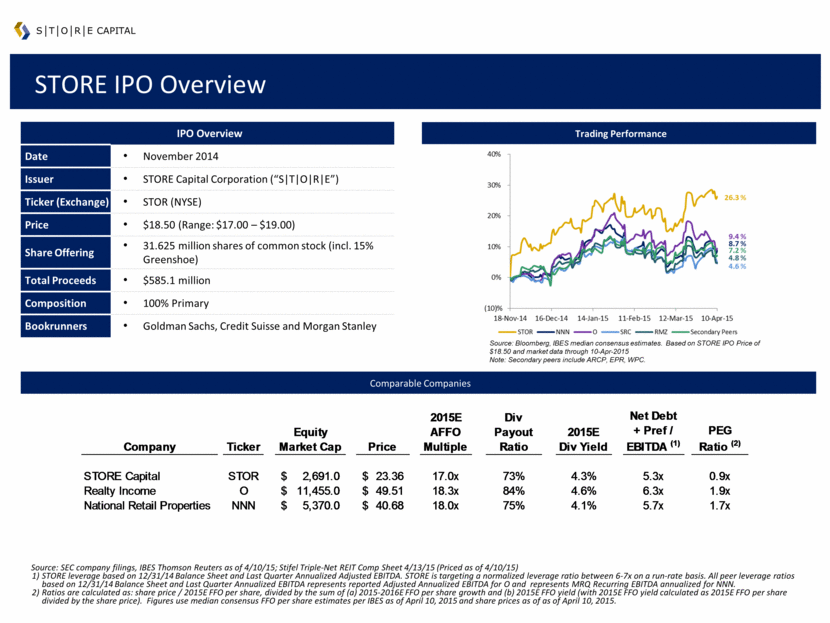
IPO Overview Date November 2014 Issuer STORE Capital Corporation (“S T O R E”) Ticker (Exchange) STOR (NYSE) Price $18.50 (Range: $17.00 – $19.00) Share Offering 31.625 million shares of common stock (incl. 15% Greenshoe) Total Proceeds $585.1 million Composition 100% Primary Bookrunners Goldman Sachs, Credit Suisse and Morgan Stanley STORE IPO Overview S T O R E capital Trading Performance Comparable Companies Source: Bloomberg, IBES median consensus estimates. Based on STORE IPO Price of $18.50 and market data through 10-Apr-2015 Note: Secondary peers include ARCP, EPR, WPC. Source: SEC company filings, IBES Thomson Reuters as of 4/10/15; Stifel Triple-Net REIT Comp Sheet 4/13/15 (Priced as of 4/10/15) STORE leverage based on 12/31/14 Balance Sheet and Last Quarter Annualized Adjusted EBITDA. STORE is targeting a normalized leverage ratio between 6-7x on a run-rate basis. All peer leverage ratios based on 12/31/14 Balance Sheet and Last Quarter Annualized EBITDA represents reported Adjusted Annualized EBITDA for O and represents MRQ Recurring EBITDA annualized for NNN. Ratios are calculated as: share price / 2015E FFO per share, divided by the sum of (a) 2015-2016E FFO per share growth and (b) 2015E FFO yield (with 2015E FFO yield calculated as 2015E FFO per share divided by the share price). Figures use median consensus FFO per share estimates per IBES as of April 10, 2015 and share prices as of as of April 10, 2015. Company Ticker Equity Market Cap Price 2015E AFFO Multiple Div Payout Ratio 2015E Div Yield Net Debt + Pref / EBITDA (1) PEG Ratio (2) STORE Capital STOR 2,691.0 $ 23.36 $ 17.0x 73% 4.3% 5.3x 0.9x Realty Income O 11,455.0 $ 49.51 $ 18.3x 84% 4.6% 6.3x 1.9x National Retail Properties NNN 5,370.0 $ 40.68 $ 18.0x 75% 4.1% 5.7x 1.7x |
|
|
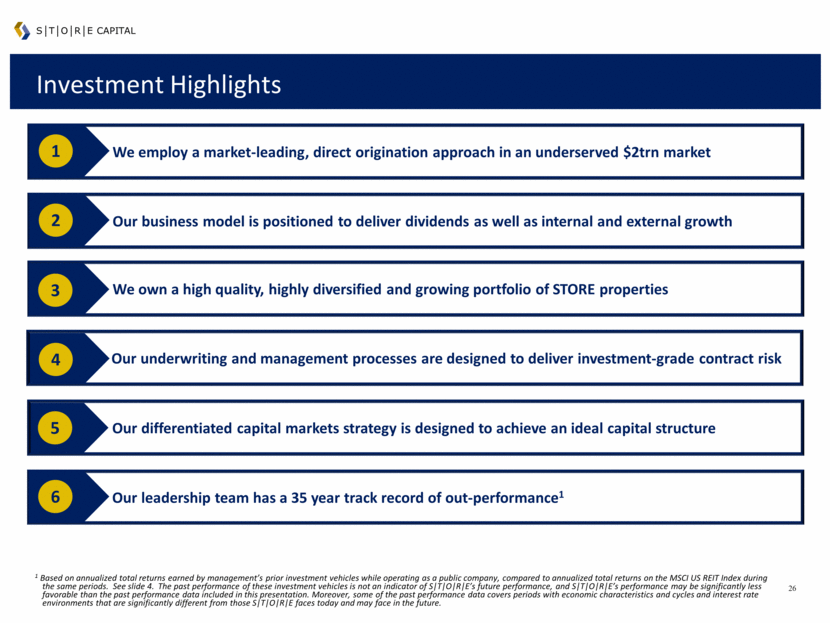
Investment Highlights Our business model is positioned to deliver dividends as well as internal and external growth 2 We employ a market-leading, direct origination approach in an underserved $2trn market 1 S T O R E capital Our leadership team has a 35 year track record of out-performance1 6 4 Our underwriting and management processes are designed to deliver investment-grade contract risk 5 Our differentiated capital markets strategy is designed to achieve an ideal capital structure We own a high quality, highly diversified and growing portfolio of STORE properties 3 1 Based on annualized total returns earned by management’s prior investment vehicles while operating as a public company, compared to annualized total returns on the MSCI US REIT Index during the same periods. See slide 4. The past performance of these investment vehicles is not an indicator of S T O R E’s future performance, and S T O R E’s performance may be significantly less favorable than the past performance data included in this presentation. Moreover, some of the past performance data covers periods with economic characteristics and cycles and interest rate environments that are significantly different from those S T O R E faces today and may face in the future. |

